
94% of researchers rate our articles as excellent or good
Learn more about the work of our research integrity team to safeguard the quality of each article we publish.
Find out more
ORIGINAL RESEARCH article
Front. Mar. Sci., 07 April 2022
Sec. Marine Megafauna
Volume 9 - 2022 | https://doi.org/10.3389/fmars.2022.849813
This article is part of the Research TopicThe Dolphins of Sarasota Bay: Lessons from 50 years of Research and ConservationView all 15 articles
 Reny B. Tyson Moore1*
 Kim W. Urian2
 Jason B. Allen1
 Carolyn Cush1
 Jason R. Parham3
 Drew Blount3
 Jason Holmberg3Jamie W. Thompson4
 Randall S. Wells1
Photographic-identification (photo-ID) of bottlenose dolphins using individually distinctive features on the dorsal fin is a well-established and useful tool for tracking individuals; however, this method can be labor-intensive, especially when dealing with large catalogs and/or infrequently surveyed populations. Computer vision algorithms have been developed that can find a fin in an image, characterize the features of the fin, and compare the fin to a catalog of known individuals to generate a ranking of potential matches based on dorsal fin similarity. We examined if and how researchers use computer vision systems in their photo-ID process and developed an experiment to evaluate the performance of the most commonly used, recently developed, systems to date using a long-term photo-ID database of known individuals curated by the Chicago Zoological Society’s Sarasota Dolphin Research Program. Survey results obtained for the “Rise of the machines – Application of automated systems for matching dolphin dorsal fins: current status and future directions” workshop held at the 2019 World Marine Mammal Conference indicated that most researchers still rely on manual methods for comparing unknown dorsal fin images to reference catalogs of known individuals. Experimental evaluation of the finFindR R application, as well as the CurvRank, CurvRank v2, and finFindR implementations in Flukebook suggest that high match rates can be achieved with these systems, with the highest match rates found when only good to excellent quality images of fins with average to high distinctiveness are included in the matching process: for the finFindR R application and the CurvRank and CurvRank v2 algorithms within Flukebook more than 98.92% of correct matches were in the top 50-ranked positions, and more than 91.94% of correct matches were returned in the first ranked position. Our results offer the first comprehensive examination into the performance and accuracy of computer vision algorithms designed to assist with the photo-ID process of bottlenose dolphins and can be used to build trust by researchers hesitant to use these systems. Based on our findings and discussions from the “Rise of the Machines” workshop we provide recommendations for best practices for using computer vision systems for dorsal fin photo-ID.
Photographic identification (photo-ID) methods, which rely on obtaining photographs of an animal’s long-lasting, unique natural markings (e.g., scars, fur, hair, or pigmentation patterns), are a well-established and important tool used for successfully identifying individuals and tracking them over time (e.g., Lockyer and Morris, 1990; Wells and Scott, 1990). Photo-ID methods are non-invasive, dependable, and easy to use (Mann, 2000; Auger-Méthé et al., 2011; Franklin et al., 2020), making them a powerful tool for examining species at both the individual (e.g., Wells, 2003; O’Brien et al., 2009; Wells, 2014; Brill, 2021) and population levels (e.g., Wells and Scott, 1990; Wilson et al., 1999; Aschettino et al., 2012; Urian et al., 2014; Calambokidis et al., 2017; Mullin et al., 2018; Stack et al., 2020; Bonneville et al., 2021). For these reasons, photo-ID methods have been used to better understand species or population abundance and trends (e.g., Wilson et al., 1999; Rosel et al., 2011; Urian et al., 2014; Calambokidis et al., 2017; McDonald et al., 2017; Tyson et al., 2011), density (e.g., McDonald et al., 2017; Glennie et al., 2021), stock and population structure (e.g., Würsig and Würsig, 1977; Wells and Scott, 1990; Whitehead et al., 1997; Urian et al., 1999; Aschettino et al., 2012; Mullin et al., 2018), horizontal movements (e.g., Caldwell, 1955; Irvine et al., 1981; Stevick et al., 2001), habitat use (e.g., Bonneville et al., 2021), foraging and social behaviors (e.g., Wells et al., 1980; Wells et al., 1987; Mann, 2000; Ottensmeyer and Whitehead, 2003; Wells, 2003; Rayment and Webster, 2009; Bonneville et al., 2021), health (e.g., Lockyer and Morris, 1990; Bonneville et al., 2021), reproduction (e.g., Wells, 2003), survival (e.g., Slooten et al., 1992; McDonald et al., 2017), and more.
Photo-ID has been an important component of research on the biology and behavior of individual bottlenose dolphins (Tursiops truncatus) for decades (Würsig and Würsig, 1977; Wells et al., 1987; Wells, 2018). Historically, photo-ID for marine mammals has relied on visually matching images of individuals to a catalog of known individuals (e.g., Auger-Méthé et al., 2011). For bottlenose dolphins, individuals are identified by the presence of unique nicks, notches, scars, or pigmentation patterns along the dorsal fin and by fin shape (Lockyer and Morris, 1990; Würsig and Würsig, 1977). The pairwise comparisons of images of unknown to known animals, however, can be labor-intensive especially when dealing with large catalogs and/or infrequently surveyed populations. For example, it takes experienced staff at the Chicago Zoological Society’s Sarasota Dolphin Research Program (SDRP) up to four and a half hours to compare a single cropped image of an unknown dolphin to their catalog of more than 5,500 known individual bottlenose dolphins, and then up to another four and a half hours for a second staff member to double check the catalog if a match was not found during the initial comparison. While this time varies by user group, region, and catalog, this effort represents a significant component of the photo-ID process that has the potential to be streamlined through computer vision processes.
Early computer vision applications to assist in dorsal fin matching included the development of programs such as Darwin (Wilkin et al., 1998) and Finscan (Hillman et al., 2002), which rely on characterizing features such as unique nicks, notches, and scars along the trailing edge of a dorsal fin. While these programs automatically rank fins based on similar identifying features, they require significant time to prepare and import images. Notably, these programs require the user to manually trace the dorsal fin features for matching before fins can be compared. While a fin only needs to be traced once, this adds significant time to the process, particularly with a large catalog. In addition, these algorithms and others have been limited by the lack of available features on an animal’s dorsal fin such as patterns or colorations, and have had to rely solely on the unique nicks, notches, and scars of a trailing fin edge, the size and angles of which often vary depending on the viewing angle, fin side (left or right) and/or fin distance (and thus pixels) in an image.
Recently, several approaches to automated tracing and comparisons of dorsal fin images via computer vision processes have been developed that rely on computer vision techniques such as Convolutional Neural Networks and machine learning. For example, CurvRank, developed by Weideman et al. (2017), is an automated image recognition algorithm that uses curvature measures extracted along the trailing edge of a dorsal fin from an image to characterize the fin’s nicks and notches. This representation of a fin is based on integral curvature that is robust to changes in viewpoints and poses, and captures the pattern of nicks and notches in a local neighborhood at multiple scales. The result is a ranked list of the most similar fins for each query against a reference catalog of known individuals. Preliminary tests using good and excellent quality images of fins with high or average distinctiveness produced the correct identification for bottlenose dolphins in the top ten positions of the ranked list 97% of the time when using a local naive Bayes nearest neighbor algorithm (McCann and Lowe, 2012) with curvature descriptors (Weideman et al., 2017). Correct identifications were the first ranked match 95% of the time (Allen et al., 2017; Weidemen et al., 2017). These results suggest greater accuracy and reliability in this system than had previously been achieved with earlier algorithms. Updates to the algorithm (CurvRank v2) were made by Weideman (2019) and Weidemen et al. (2020) that further improved the algorithm’s performance and speed, including tracing of both the leading and trailing fin edge, and the support of a new method (semi-supervised Fully Convolutional Neural Network) for automatically extracting the contour, which refines the original contour into a more descriptive and detailed version. Fin tracing for these algorithms are fully automated (i.e., they do not require manual tracing of fins in an image), thereby representing the possibility of large time savings in the fin matching process.
CurvRank and CurvRank v2 have been integrated into Flukebook (www.Flukebook.org; Blount et al., 2020; Blount et al., 2022a), a freely available cloud-based photo-ID tool for marine animal research within Wildbook (Berger-Wolf et al., 2017; Blount et al., 2018; Blount et al., 2019; Blount et al., 2022a). Flukebook, originally developed to perform photo-ID of cetacean flukes with computer vision techniques, has proven to be a successful photo-ID matching platform with over 2 million contributed photos, and over a quarter million encounters of over 50,000 unique whales and dolphins. This includes more than 9,500 identified animals, 80,000 encounters and 36 contributors in their system for bottlenose dolphins. Registered users can access this site, upload images, and use these algorithms to compare images both within and between selected photo-ID catalogs. Users can then access ranked-similarity results for these algorithms independently or examine merged results from multiple algorithms available in Flukebook [e.g., Hotspotter, an algorithm for recognition of patterned species (Crall et al., 2013); Dynamic Time Warping, a notch-tip detection, contour extraction, and matching algorithm (Jablons, 2016)].
finFindR is another tool for dorsal fin image recognition and cataloging that uses a deep convolutional network to characterize features along the edge of a dorsal fin from an image (Thompson et al., 2021). The result is a neural network that learns what features, in general, constitute a unique individual and what types of differences in an input image preclude the possibility of belonging to a single individual without the need for retraining. Similar to CurvRank and CurvRank v2, fin tracing is fully automated, but can be refined by a user manually specifying better start and stop points along a dorsal fin. The finFindR tool is available as an open-source R application (R Core Team, 2020) with an HTML-based user interface (Thompson et al., 2021), and has also been integrated into Flukebook to be used in conjunction with CurvRank, CurvRank v2, and other matching algorithms (Blount et al., 2020).
While these algorithms appear to be promising in helping to improve the workflow for researchers using photo-ID methods with bottlenose dolphins, their performance has only been tested in a few studies. To our knowledge, the only validation tests for comparing bottlenose dolphin dorsal fins with CurvRank were performed by Weidemen et al. (2017) as described above; no validation tests have been performed for bottlenose dolphin images with CurvRank v2. Mullin et al. (2018) performed validation tests of an early version of the finFindR R application and calculated an error rate for bottlenose dolphin image comparisons between the Terrebonne – Timbalier Bay and Barataria Bay catalogs from Louisiana, USA. They found that the finFindR R application correctly identified 80% of individuals with an average rank (within the top 50) of 5.13, and predicted an error rate of 0.20 (95% binomial CI = 0.17 - 0.23). These tests included 622 excellent or average quality images containing fins with high or average distinctiveness. Thompson et al. (2021) also performed validation tests when developing and revising the finFindR algorithm using 672 images from the Barataria Bay catalog, and found that the finFindR R application correctly identified 97% of individuals in the top 50 ranked positions. In these tests, 5% of the images were scored as low distinctiveness, but still were included in the tests; images of non-distinct (or clean) fins were not included in the training or test data sets.
Validation results such as those presented above are promising, however, it is still unknown how many photo-ID researchers are familiar with such programs and are using them to aid in their photo-ID process. To assess this, we distributed a survey to photo-ID researchers as part of a workshop called “Rise of the machines – Application of automated systems for matching dolphin dorsal fins: current status and future directions” (hereafter referred to as the Rise of the Machines workshop) we organized at the World Marine Mammal Conference that occurred in Barcelona, Spain in December 2019. In this paper, we present the results of that survey and discuss why (or why not) users are incorporating these systems into their photo-ID workflows. We also present best practices when using fin recognition technology that were discussed by workshop participants.
Another goal of this paper was to experimentally evaluate the performance of some of the most commonly used recently developed fin-matching systems. To do this we performed several fin-matching tests of the CurvRank, CurvRank v2, and finFindR algorithms implemented within Flukebook and the finFindR R application, recently developed computer vision systems survey respondents reported being familiar with, using a long-term photo-ID database of known individuals curated by the SDRP. The SDRP has been conducting routine and systematic photo-ID surveys of the Sarasota Bay resident dolphin population since the 1980s, as part of the world’s longest-running study of a dolphin population. Because of SDRP’s multi-decadal monthly monitoring program, experienced staff can accurately identify both distinct and non-distinct individuals (as well as individuals with changed fins) from images taken in the Sarasota Bay region (Figure 1) based on the high frequency of individual sightings and their knowledge about individual’s relationships with conspecifics (e.g., moms and calves). Because there is high confidence that every image in SDRP’s dataset and catalog represents a known individual and that identifications are correct, this dataset offers a unique opportunity to test the performance and accuracy of fin recognition algorithms and to accurately and reliably determine the success rate of the resulting matches.
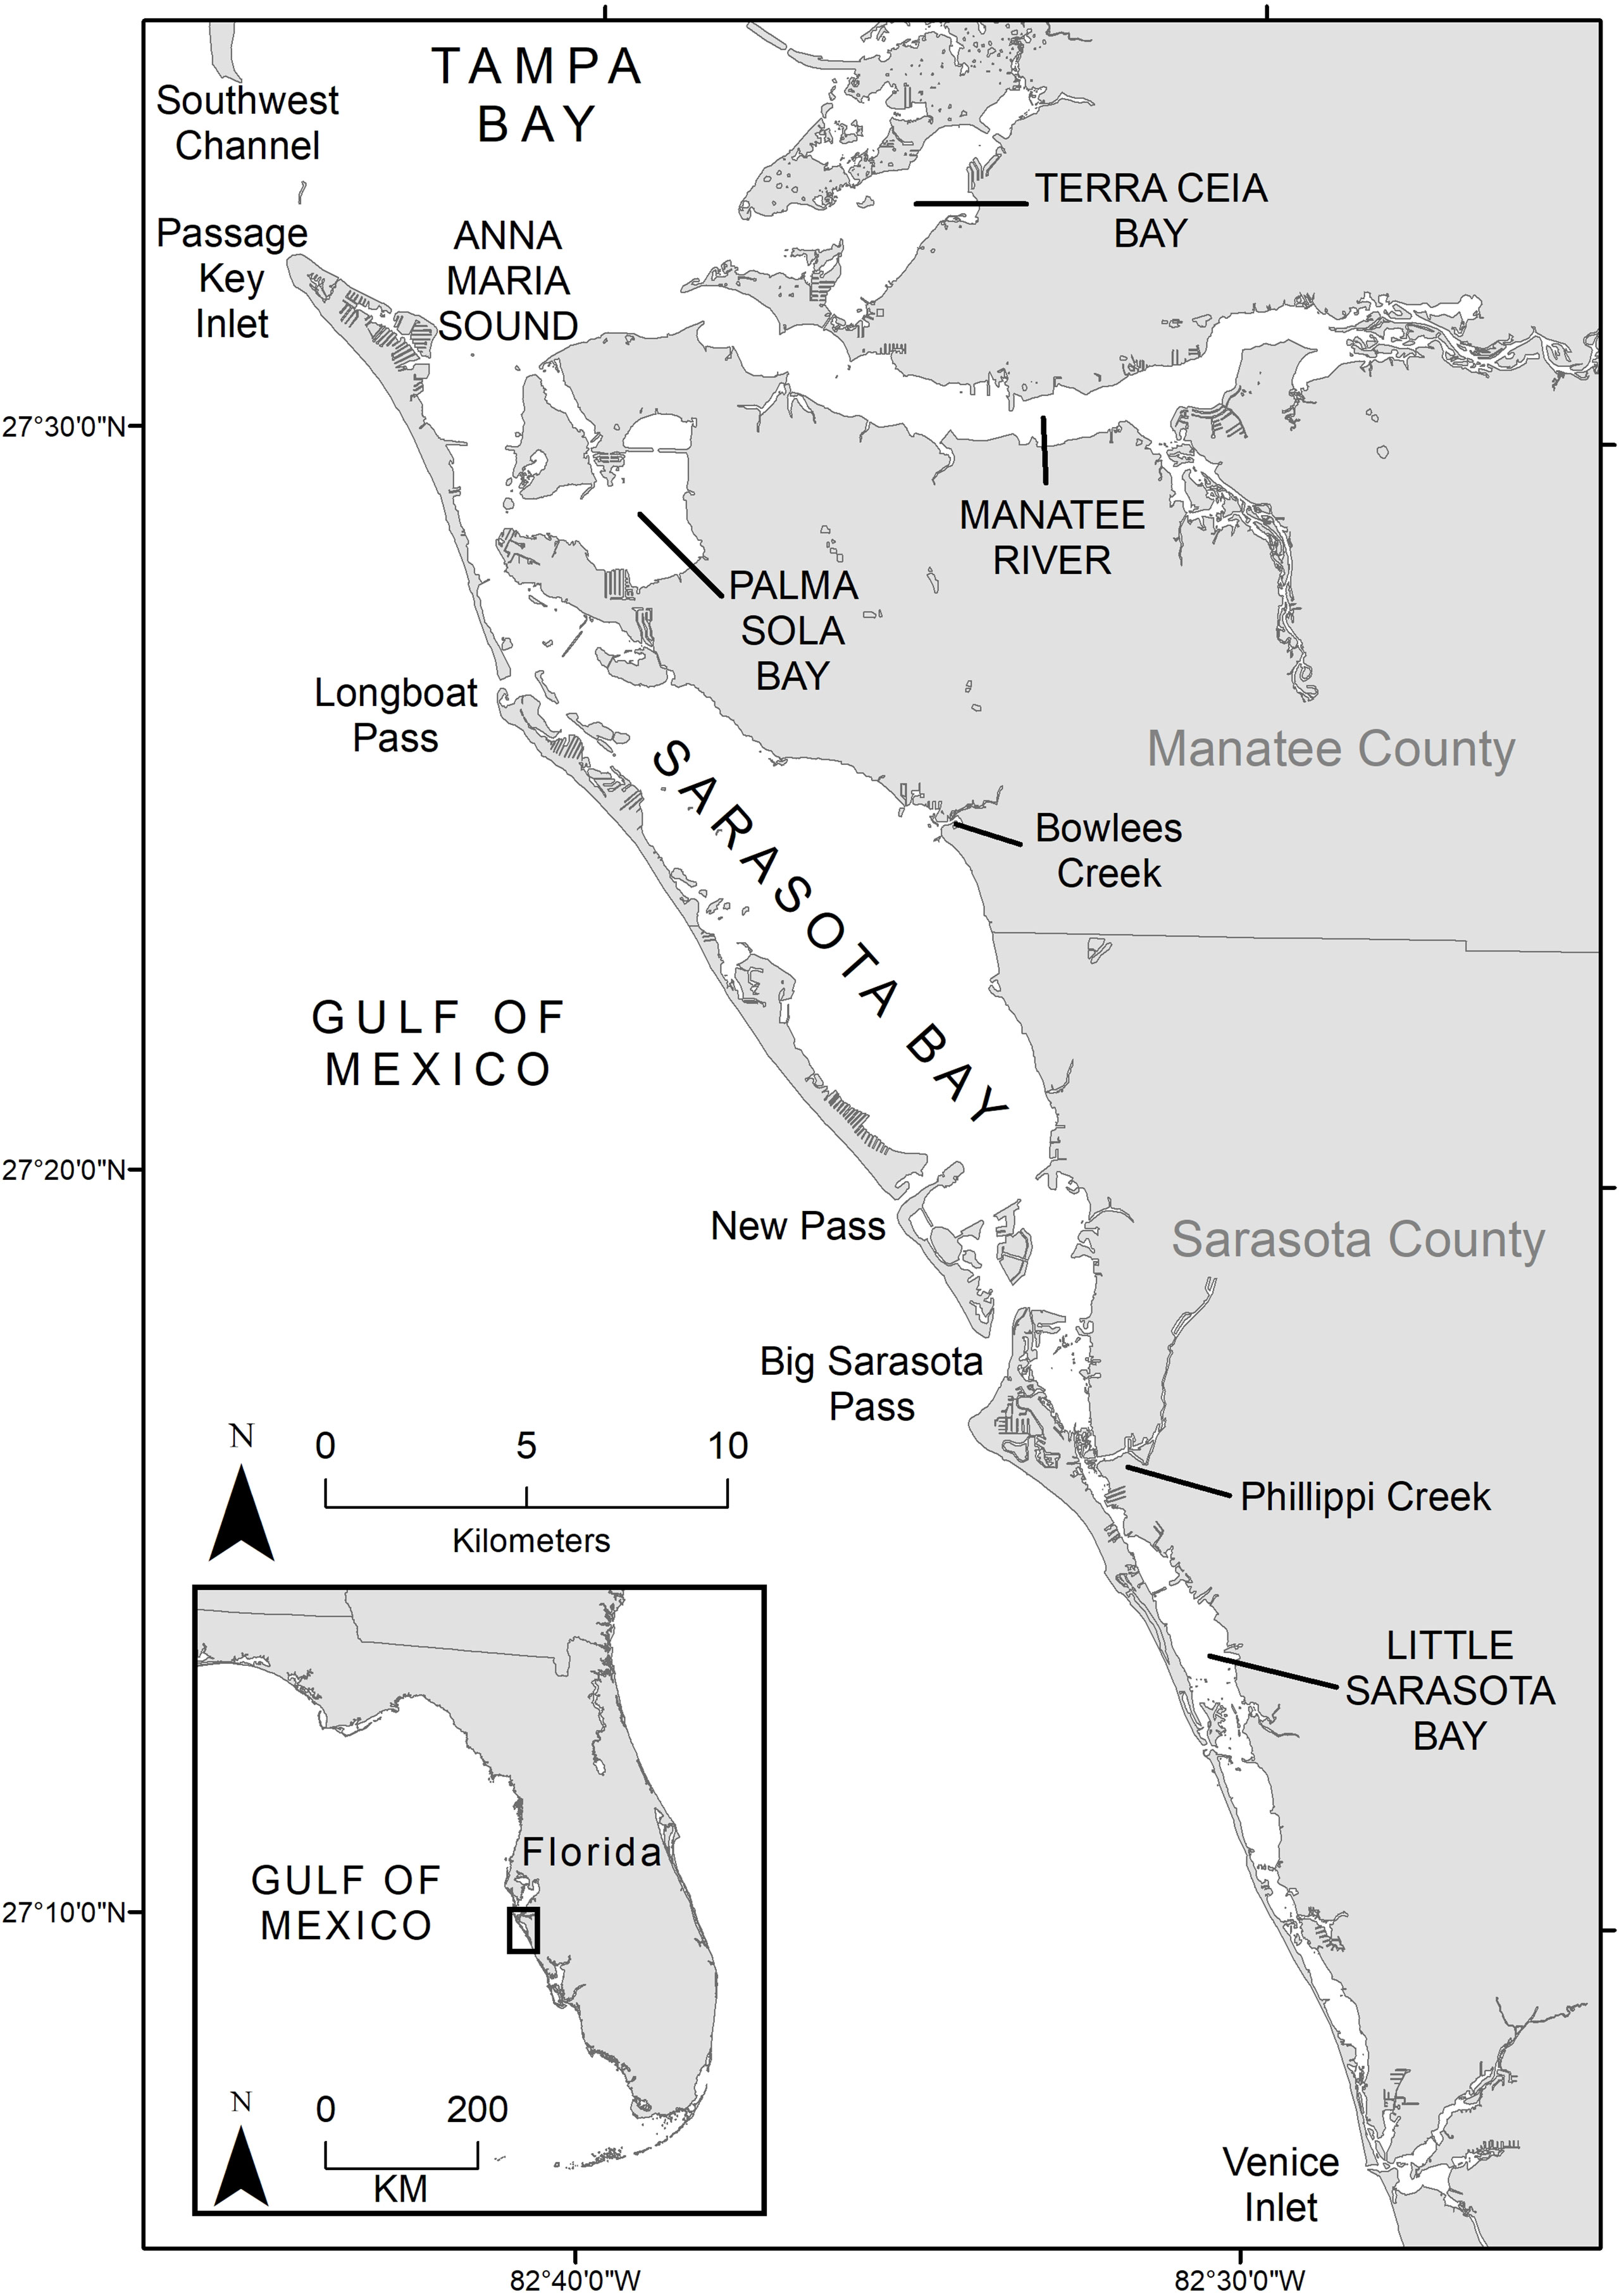
Figure 1 Chicago Zoological Society’s Sarasota Dolphin Research Program’s (SDRP) core study area includes the nearshore and inshore regions in and near Sarasota Bay, Florida.
In 2019, we organized the Rise of the Machines workshop as part of the World Marine Mammal Conference held in Barcelona, Spain, to bring together photo-ID researchers and database and algorithm developers in an attempt to 1) identify strengths and weaknesses of automated fin-matching systems, 2) evaluate their success in matching dorsal fins, and 3) assess their application in photo-ID workflows. The workshop, held 8 December 2019, included presentations of various computer vision and database systems currently available and used for dorsal fin photo-ID (i.e., Finscan (Hillman et al., 2002), Photo-ID ninja (available online at https://photoid.ninja/), a Google Application (Mann, 2018), Happywhale (Cheeseman et al., 2021), finFindR (Thompson et al., 2021), CurvRank (Weideman et al., 2017), Flukebook (Blount et al., 2020; Blount et al., 2022a), FinBase (Adams et al., 2006), and OBIS SeaMap/GoMDIS (Halpin et al., 2009; Cush et al., 2019). It also included discussions between presenters and attendees regarding experimental tests of these systems and best practices for our community to consider when using computer vision systems for dorsal fin photo-ID. The agenda for the workshop and a list of workshop participants (N = 37) is provided in Appendices A and B, respectively.
As part of this workshop, we conducted a survey of photo-ID researchers to gain insights into the photo-ID methods researchers are currently using when comparing dorsal fin images (e.g., manual methods versus computer assisted or computer vision methods). The survey was distributed prior to the workshop (September 2019) via direct email to dorsal fin photo-ID researchers (e.g., photo-ID lab managers or researchers, workshop registrants) and through announcements on relevant social media accounts and listservs (e.g., Marine Mammals Research and Conservation Discussion; MARMAM). The survey was shared and hosted via Google Forms with questions designed to compile information on the different photo-ID methods used, awareness and use of computer vision systems for photo-ID, and the pros and cons associated with the various photo-ID methods. The full survey is provided in Appendix C. Survey responses were compiled within a Google Sheets spreadsheet and evaluated in R (R Core Team, 2020) using the tidyverse (Wickham et al., 2019) package.
Images of common bottlenose dolphins taken in SDRP’s core research area (Figure 1), located off the west coast of Florida, USA, were used in this study to test the performance and accuracy of the CurvRank, CurvRank v2, and finFindR algorithms integrated into Flukebook (Blount et al., 2020) and the finFindR algorithm available through the finFindR R application (R Core Team, 2020; Thompson et al., 2021). All images were taken with a Nikon DSLR camera with a 70 to 300 mm lens. Prior to testing, images were cropped and graded for image quality and fin distinctiveness following Urian et al. (1999) and Urian et al. (2014) as recommended by Rosel et al. (2011) and Urian et al. (2015). Photo-quality was graded by experienced SDRP staff using a weighted grading scheme that considers the focus and clarity of an image (2 = excellent focus, 4 = moderate focus, 9 = poor focus, blurry), the image’s contrast (1 = ideal contrast, 3 = either excessive contrast or minimal contrast), the angle of the fin to the camera (1 = perpendicular to the camera, 2 = slight angle, 8 = oblique angle), the amount of the fin visible in the image (1 = the leading and trailing edge of the fin is fully visible, 8 = the fin is partially obscured), and the proportion of the frame filled by the fin (1 = greater than 5%, subtle features are visible; 5 = less than 1%, fin is very distant). The sum of these characteristics was used to determine overall image quality (6-7: excellent quality = Q1, 8-12: average quality = Q2, and > 12: poor quality = Q3). Fin distinctiveness was graded based on the amount of information contained on the fin, such as from the leading and trailing edge features, as well as pattern, marks, and scars (D1 = very distinctive, features evident in distant or poor quality images; D2 = average amount of information content, 2 features or 1 major feature are visible on the fin; D3 = low distinctiveness, very little information content on the fin; and D4 = not distinctive, no information content on the fin) (Urian et al., 1999; Friday et al., 2000; Urian et al., 2014).
We carried out three separate tests to better understand the performance and accuracy of the algorithms. The first test (hereafter referred to as the comprehensive test) was designed to assess algorithm performance despite image quality or fin distinctiveness (i.e., all levels of image quality and fin distinctiveness were included). Cropped images taken between 01 January 2015 and 31 December 2017 were selected to represent a reference catalog of images to compare against encounter images with the algorithms. This reference catalog of 26,706 images included 15,023 individual identifications (referred to as encounters in Flukebook) of 888 unique individuals, with [mean (median) ± SD] 30.04 (7) ± 47.46 images per individual. A second set of cropped images taken between 01 July 2018 and 31 July 2018 was used to represent a query dataset to compare against the reference catalog of images. This query dataset included 654 images of 195 individuals. Fifty of these images were excluded from testing because they were of individuals that did not have an image in the catalog to be matched against (e.g., young-of-the-year calves, single-sighted transient animals). This left 604 images of 179 unique individuals available in the query dataset for comparison. The distribution of image quality and fin distinctiveness grades for the comprehensive catalog and query datasets are shown in Figures 2A, B.
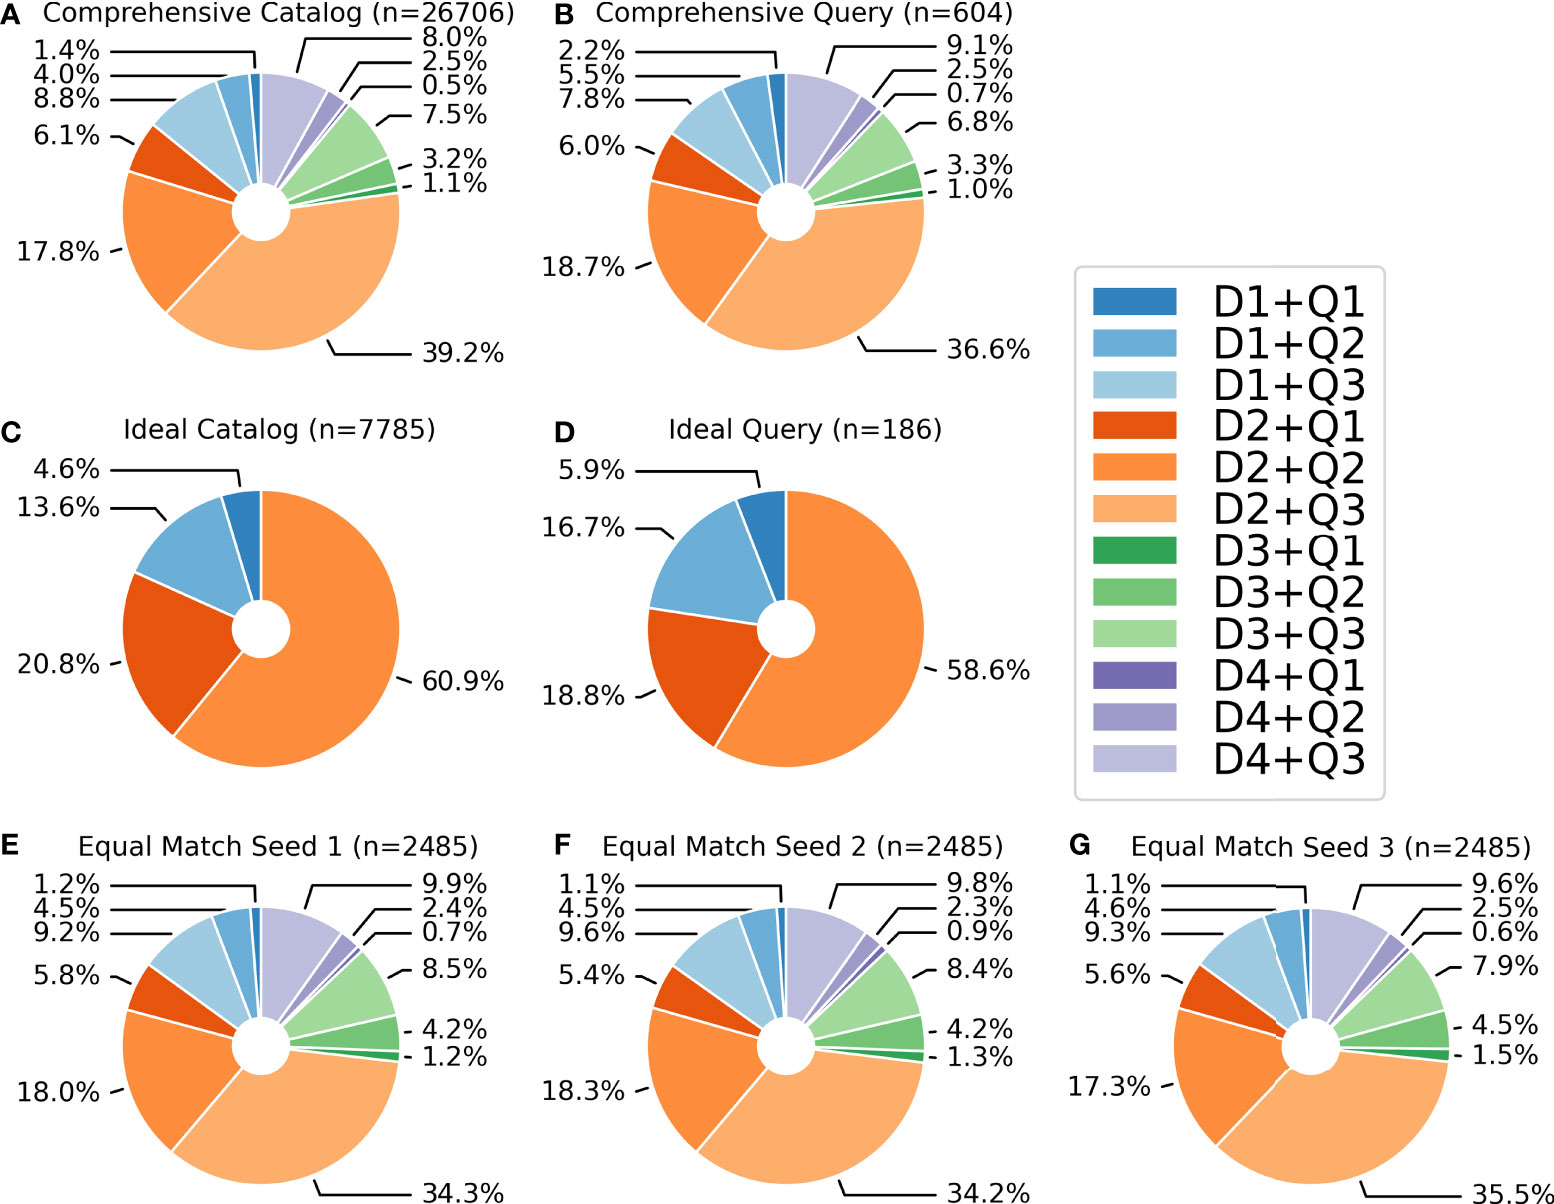
Figure 2 Distribution of image quality and fin distinctiveness grades for: (A) the comprehensive reference catalog, (B) the comprehensive query, (C) the ideal reference catalog, (D) the ideal query, (E) the equal matchability seed 1 dataset, (F) the equal matchability seed 2 dataset; and (G) the equal matchability seed 3 dataset. Note: D1 = very distinctive, features evident in distant or poor quality images; D2 = average amount of information content, 2 features or 1 major feature are visible on the fin; D3 = low distinctiveness, very little information content on the fin; D4 = not distinctive, no information content on the fin; Q1 = excellent image quality; Q2 = average image quality; and Q3 = poor image quality (Urian et al. (1999), Urian et al., 2014).
Given that it is common practice and recommended for photo-ID users to exclude low quality images and images of low distinctiveness or non-distinct individuals (e.g., Rosel et al., 2011; Urian et al., 2015), we performed a second test that included only good or excellent quality images (Q1 and Q2) of fins with high or average levels of distinctiveness (D1 and D2) from both the catalog and the query datasets (hereafter referred to as the ideal test). This comparison included 7,785 images of 575 individuals in the reference catalog and 186 images of 90 individuals in the query dataset (query images were only included if they had at least one image that had an available match in the reference catalog; e.g., no young-of-the-year calves or single-sighted transient animals were included). The ideal reference catalog included 13.54 (4) ± 19.53 images per individual. The distribution of image quality and fin distinctiveness grades in the ideal test for both the reference catalog and query datasets are shown in Figures 2C, D.
Finally, given the extensive dataset, we had the opportunity to examine whether these algorithms were relying heavily on multiple images of the same individual or on the amount of time between sightings (hereafter referred to as the equal matchability test). To achieve this, we combined all images from the full catalog and query into one dataset (27,360 images of 903 individuals) then filtered these data to only include images of individuals that had been sighted at least twice, but no more than 5 times, and for which images were taken from sightings that were more than 2 weeks apart. This filtering guaranteed a more uniform distribution of annotations (or images) and a higher probability that match difficulty was equal because it allowed us to prevent the influence of some individuals being massively over-represented over others, and to assess whether the algorithm failed to find a match because the image was in some way not very matchable. It also limited the possibility that images were taken within minutes, or even seconds apart, which could bias algorithm performance as some images would be significantly easier to match than others. We randomly selected three different seeds (i.e., sets of images) from this filtered dataset that included 2,485 annotations of 614 names for testing and averaged the performance results for each algorithm. All seeds included 4.05 (5) ± 1.25 images per individual. The distribution of image quality and fin distinctiveness grades in the representative seed datasets are shown in Figures 2E–G. Our sampling shows a consistent breakdown of image quality and fin distinctiveness grades in the catalog and query datasets used for all comparison tests.
Images for each test were batch uploaded into Flukebook for matching. Flukebook has the ability to support multiple algorithms, including CurvRank, CurvRank v2, and finFindR (version 0.1.8), in their matching process and can combine the results from multiple algorithms into a single ranked result. Because of this, we examined both the independent performance of these three algorithms as well as their combined performance (e.g., finFindR + CurvRank, finFindR + CurvRank v2, CurvRank + CurvRank v2, and CurvRank + CurvRank v2 + finFindR). Flukebook returns a ranked-similarity list of possible matches for all query images, which the user can compare against the query image to select the correct match (when available).
For these algorithms, the correct identification can be assessed in two ways: 1) which image (or annotation) in the database has the highest similarity score (i.e., one-to-many annotations comparisons) and 2) which identification code for an individual (or name) in the database has the highest similarity score (i.e., one-to-many names comparisons). For databases with a uniform number of annotations per name, name scoring is likely the best metric to use. If there is a major imbalance (some animals seen hundreds of times against many animals only seen once) then the name score aggregation can be biased. In these instances, it can be better to examine the single annotations because they do not limit the ranking results to the individual names. For these reasons, we examined algorithm performance both assuming one-to-many annotation comparisons and one-to-many name comparisons.
Additional tests of the finFindR algorithm were performed using the 0.1.10 release of the open-source finFindR R application (https://github.com/haimeh/finFindR; R Core Team, 2020; Thompson et al., 2021). This release of finFindR in the R application has been updated compared to the release of the finFindR algorithm that was available in Flukebook at the time of this testing (i.e., version 0.1.8). The finFindR R application allows users to view a ranked list of possible matches for the top 50 best scores (i.e., ranks greater than 50 are not returned as results). The default output is a ranked list based on annotations, but the user can select an option to return results based on names by selecting the “1 per ID” option. Results from both options were used to examine algorithm performance both within finFindR and against the algorithms available in Flukebook in the one-to-many annotation comparisons and one-to-many name comparisons tests, respectively. Because the finFindR R application only returned the top 50 ranked comparisons, we similarly only evaluated the top 50 ranked comparisons in Flukebook for the comprehensive and ideal tests. For the equal matchability tests where seeded images were matched against each other (i.e., 2,485 annotations of 614 names were matched against the same 2,485 annotations of 614 names) finFindR returned the query annotation or name in the top 1 ranked position 100% of the time (i.e., the query image always matched against itself) (note, Flukebook has a mechanism in place to prevent these self matches). Therefore, we excluded the first ranked position and considered all other ranks to be representative of their rank minus one (i.e., rank 2 position became rank 1 position, rank 50 position became rank 49 position, and so on). Because of this, we only evaluated the top 49-ranked comparisons for the equal matchability tests.
For all comparison tests, we also examined the breakdown of image quality and fin distinctiveness grades for the percentage of images matched within the top 50-ranked comparisons (or top 49-ranked comparisons for the equal matchability tests) for the four independent algorithms (i.e., finFindR R application, finFindR in Flukebook, CurvRank in Flukebook, and CurvRank v2 in Flukebook). All figures were created in R (R Core Team, 2020) using the tidyverse (Wickham et al., 2019), cowplot (Wilke et al., 2019), and gridExtra (Auguie, 2017) packages.
We compiled 74 responses from photo-ID researchers from our online survey related to photo-ID methods. These responses represented researchers from 22 different countries studying 36 different marine mammal species and 1 shark species (great white shark, Carcharodon carcharias). Reported photo-ID catalog sizes (N = 39) ranged from 10 (Ziphiidae) to 5,800 (Tursiops truncatus) individuals, with the majority of catalogs containing a mean (median) ± SD of 667.54 (180) ± 1245.05 individuals. The majority of respondents reported that they manually crop images (N = 53, 71.62%) and grade images for quality (N = 61, 83.56%) and distinctiveness (N = 63, 85.13%) before comparing images in the matching process. Most respondents reported that they manually match images for photo-ID studies (N = 40, 54.05%), while 8.11% (N = 6) of respondents reported they use user-defined attribute based systems (e.g., FinBase, Adams et al., 2006), 8.11% (N = 6) of respondents reported using computer vision systems (i.e., computer-assisted ranking system that uses a neural network, machine learning, etc.), and 32.43% (N = 24) of respondents reported using a combination of these methods (i.e., manual methods, user-defined attribute based systems, and/or computer vision systems).
When asked to list any computer vision systems for matching dorsal fin images that respondents had heard of, 25 systems were listed by 67 respondents (Figure 3A). Of these, Darwin was most frequently listed (N = 37 mentions out of 177 responses, 20.90%), followed by Finscan (N = 27 mentions, 15.25%), finFindR (N = 26 mentions, 14.69%), and Flukebook (N = 20 mentions, 11.30%) (Figure 3A). Four respondents said they were not familiar with any systems (Figure 3A). Survey respondents that reported using computer vision systems in their photo-ID process were most likely to use the finFindR R application (Thompson et al., 2021; N = 15), followed by Flukebook (Blount et al., 2020; Blount et al., 2022a; N = 5), Darwin (Wilkin et al., 1998; N = 4), and Finscan (Hillman et al., 2002; N = 2). FinBase (Adams et al., 2006), ACDSee (© ACD Systems International Inc., 2018), a Google Application (Mann, 2018), Identifin Software (Andreotti et al., 2018), and Photo-ID Ninja (available online at https://photoid.ninja/) were also each listed once by users (Figure 3B).
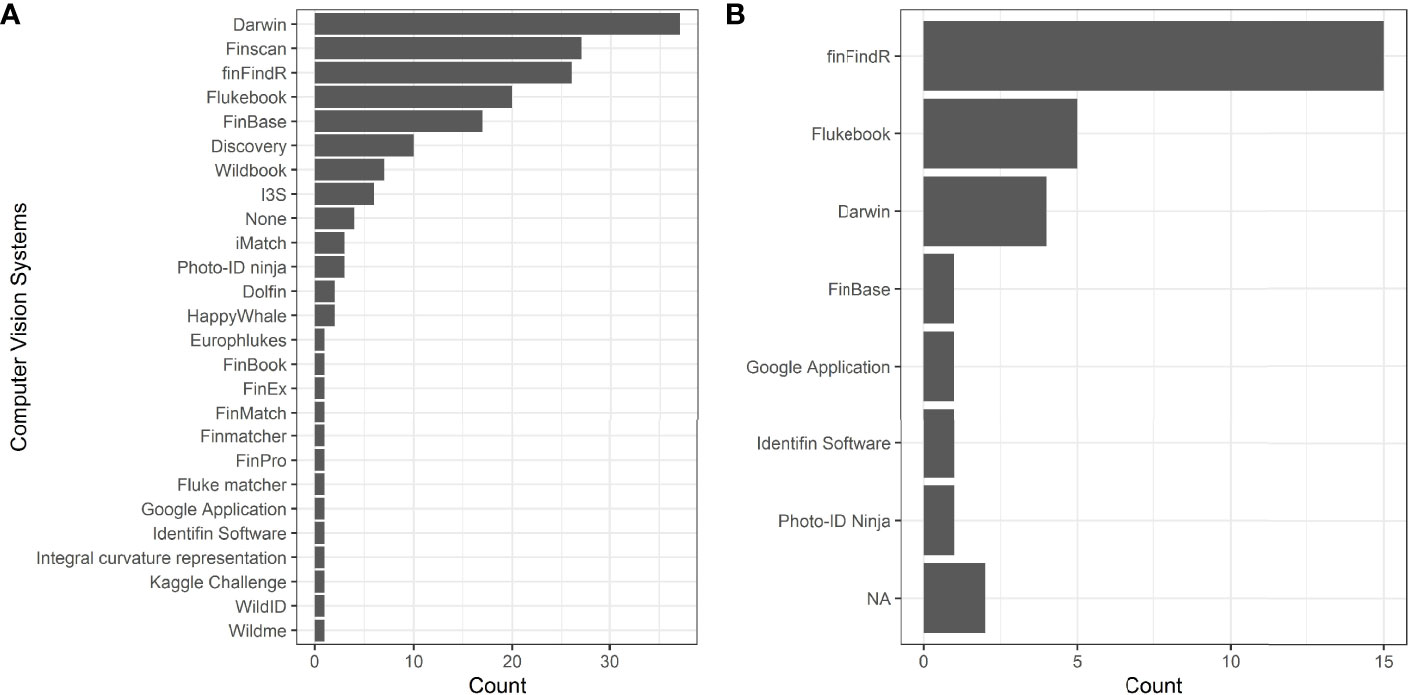
Figure 3 Computer Vision systems for matching dorsal fin images that survey respondents had heard of (A) and used (B).
We also requested information on the time it took a photo-ID researcher to search for a potential match of an individual in their existing catalog and we received estimates of time spent from 73 researchers. Numerous researchers reported that they maintain catalogs representing multiple species (e.g., one researcher reported that they curate photo-ID catalogs for 13 different species). For relevance to this study, we limited our analysis here to responses related to catalogs solely focused on Tursiops spp. (N = 37), which ranged in size from 25 to 3709 individuals (Figure 4). Twenty researchers (54.05%) conducted their matching manually, while 17 respondents (45.95%) used a combination of manual methods, user-defined attribute based systems, and/or computer vision programs (only two of the 17 researchers reported using computer vision matching programs (i.e., computer-assisted ranking systems that use a neural network, machine learning, etc.) exclusively). Both approaches (i.e., manual matching versus using a combination of manual and computer assisted matching systems) yielded a range in catalog search times from 5 to 300 minutes to confirm a match (Figure 4). The mean (median) ± SD time spent searching a catalog was reported to be 76 (30) ± 96 minutes using manual methods and 81 (45) ± 80 minutes using a combination of manual methods, user-based attributes and/or computer vision programs; these durations were significantly similar (Welch Two Sample t-test: t = 0.17, df = 35.00, p = 0.86). Catalog size was not a strong predictor of time spent matching for either approach (manual searching only: 0.01 minutes X catalog size + 67.90 minutes, R2 = -0.05, p = 0.71; combination of manual methods, user-based attributes and/or computer vision programs: 0.03 minutes X catalog size + 44.80 minutes, R2 = 0.24, p = 0.03).
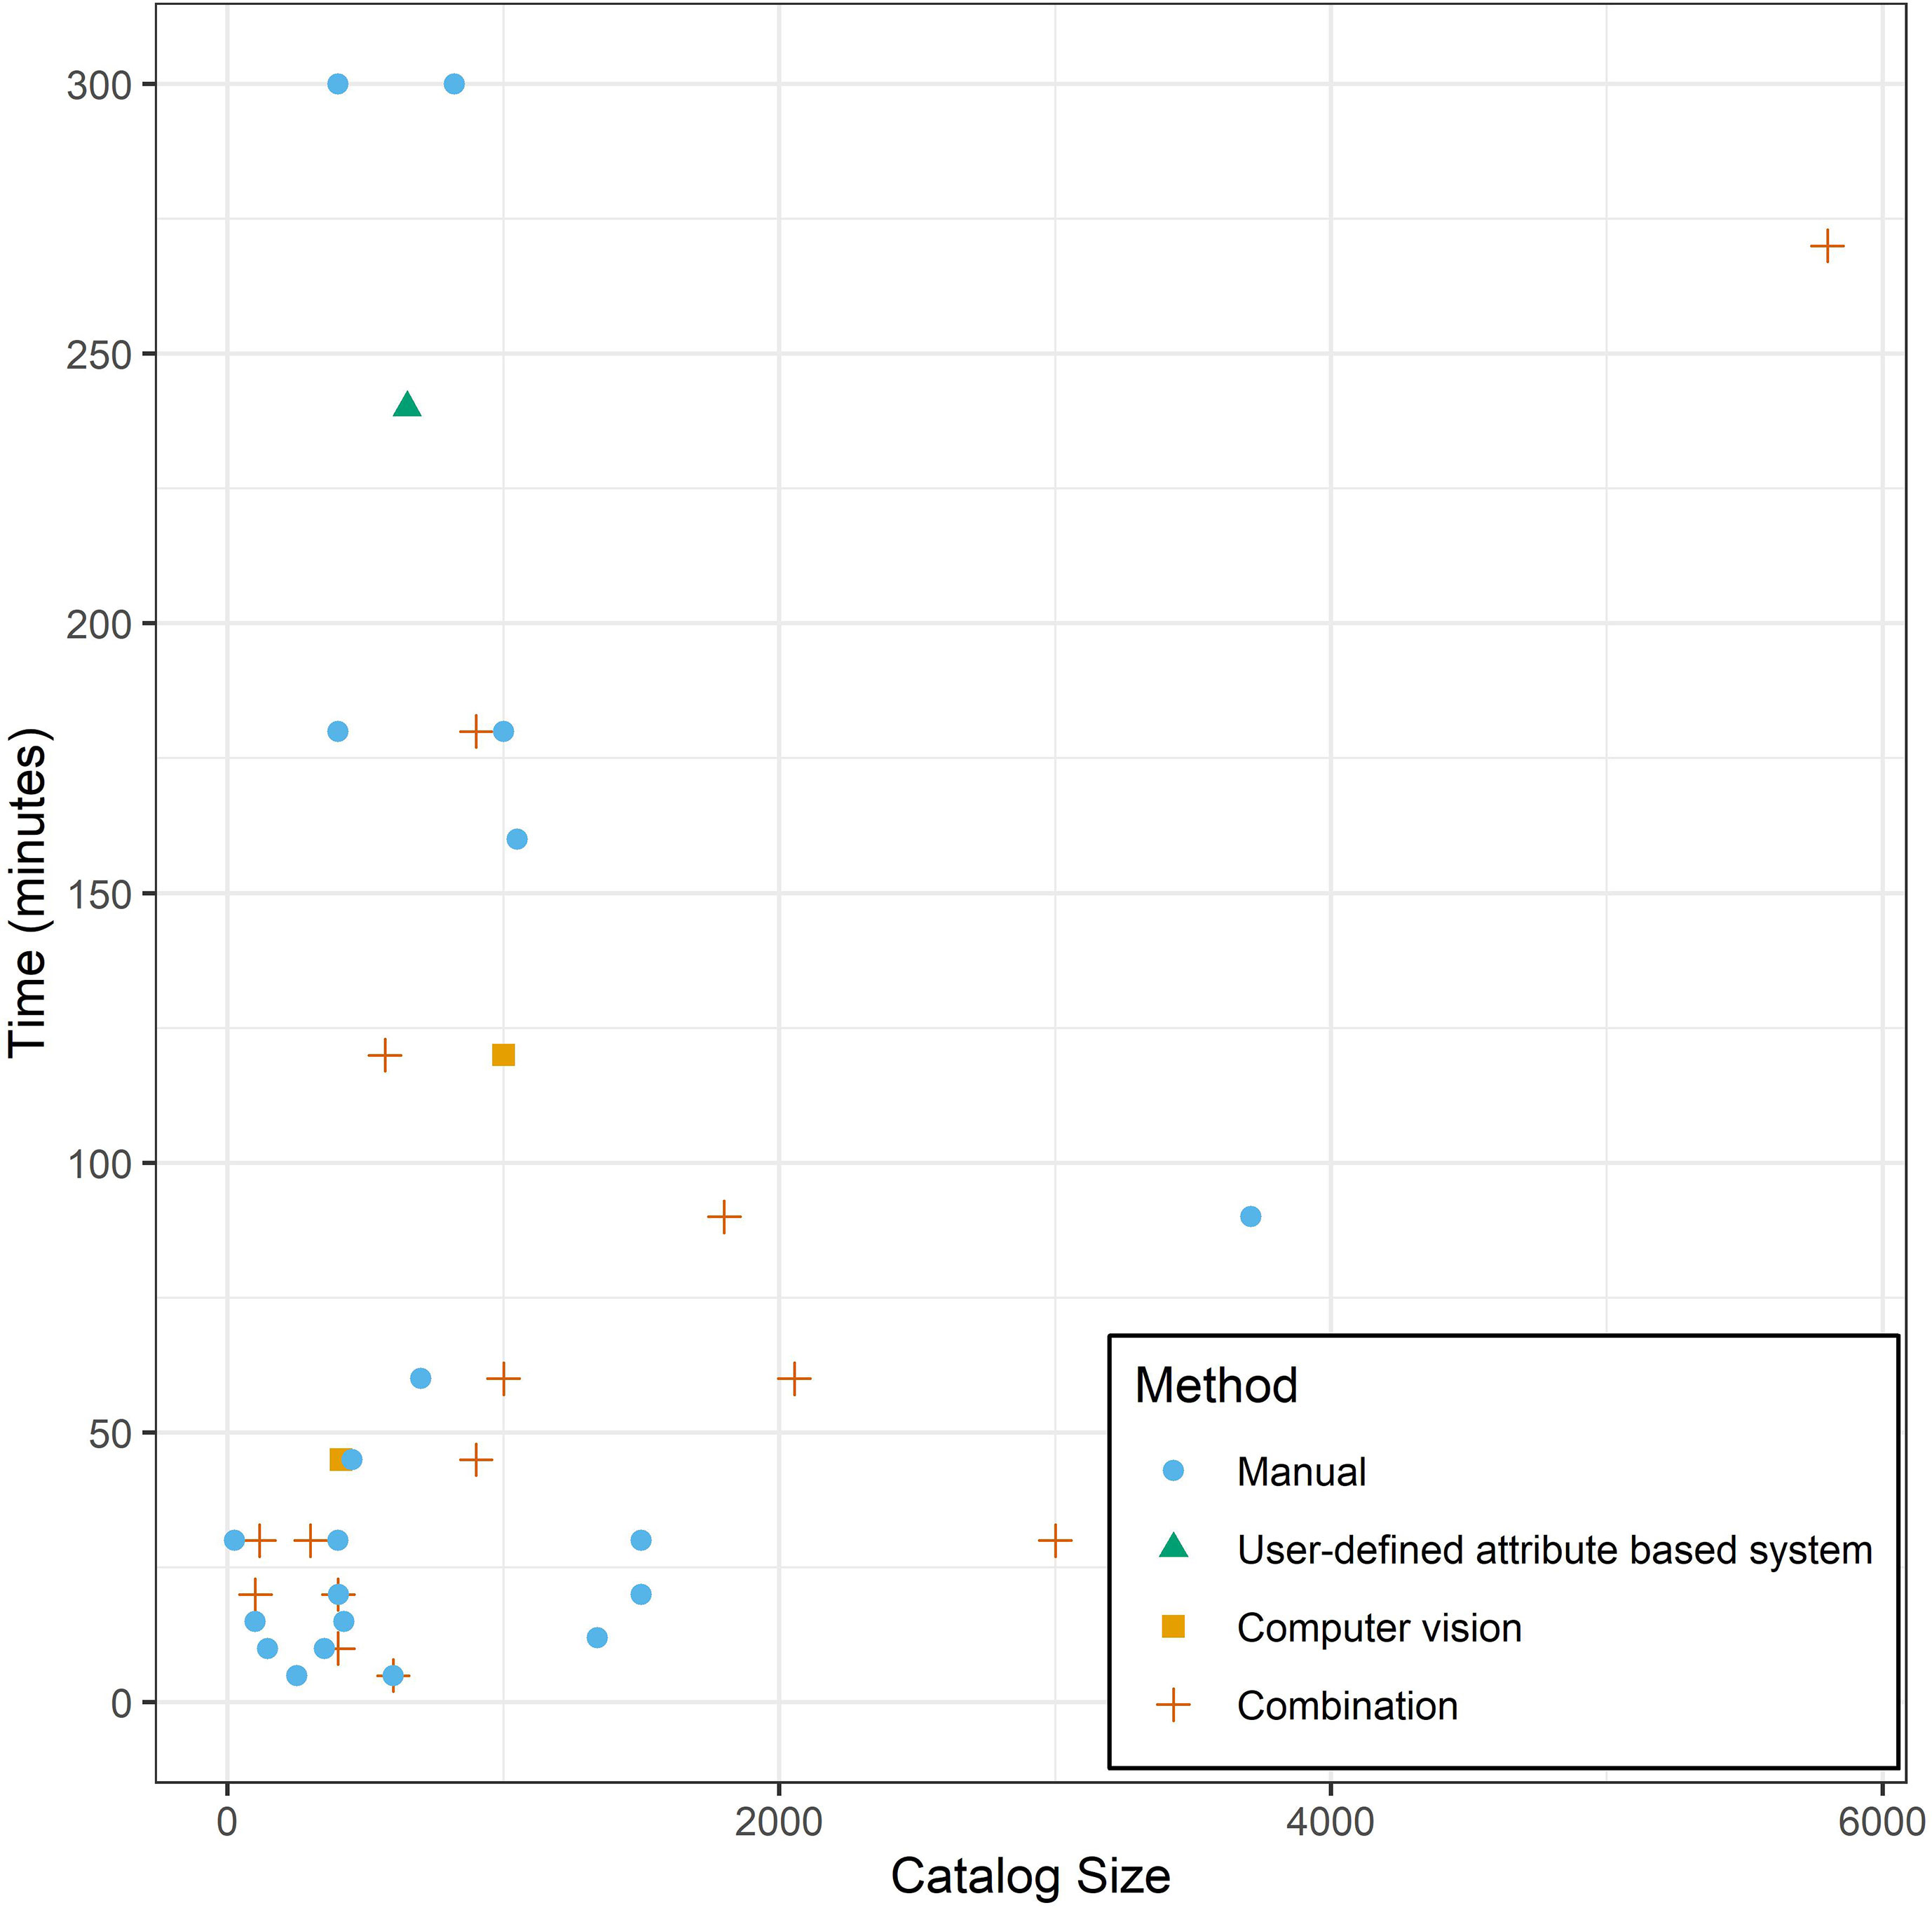
Figure 4 The amount of time survey respondents estimated on average that it takes them/their lab to confirm that an animal is not in their catalog and that it should be considered a new individual (i.e., how long does it take to do a full catalog search) versus the number of distinct individuals in their catalog (i.e., catalog size). Data is restricted to responses related to Tursiops spp. catalogs. The method used to match individuals in the respondents photo-ID process are distinguished by point shape and color. Note: Combination refers to respondents using a combination of manual methods, user-defined attribute based systems, and/or computer vision programs.
Survey respondents were asked if they did not use a computer vision system for matching dorsal fin images to select a reason why from a list of possible responses (Appendix C). Twenty respondents (N = 57 responses, 35.09%) selected “My catalog is small, so manual comparisons are just as (or almost) as fast as those achieved with computer vision”, 16 respondents (28.07%) selected “I am familiar with computer vision systems, but have not tried to use them yet”, 16 respondents (28.07%) selected “I don’t trust that a computer vision system performs as well as a human”, 11 respondents (11.30%) selected “I am not familiar with computer vision systems for matching dorsal fin images”, and 23 (40.35%) respondents replied with “Other” reasons (note respondents could select more than one response). These other reasons included mentions of cost-effectiveness and cost limitations, ease of use of systems, trust that non-stable marks (e.g., pigmentation marks, nicks, notches) may be missed, and time commitment to learning and using a system.
For the comprehensive dataset tests, images of all levels of quality and distinctiveness were successfully matched within the top 50 ranked positions (Figures 5A, B); however, match success varied by algorithm and test performed (Table 1 and Figure 5). Out of the comprehensive query dataset (N = 604), 26 images were not traced by the algorithms in Flukebook. Of these images, one was graded D4/Q2, six were graded D1/Q3, 18 were graded D2/Q3, and one was graded D4/Q3. One of the D1/Q3 images was also not traced by the finFindR R application. Upon inspection, this image was of a dorsal fin that had been severely mutilated by a boat injury and did not have an intact leading edge or trailing edge to trace.
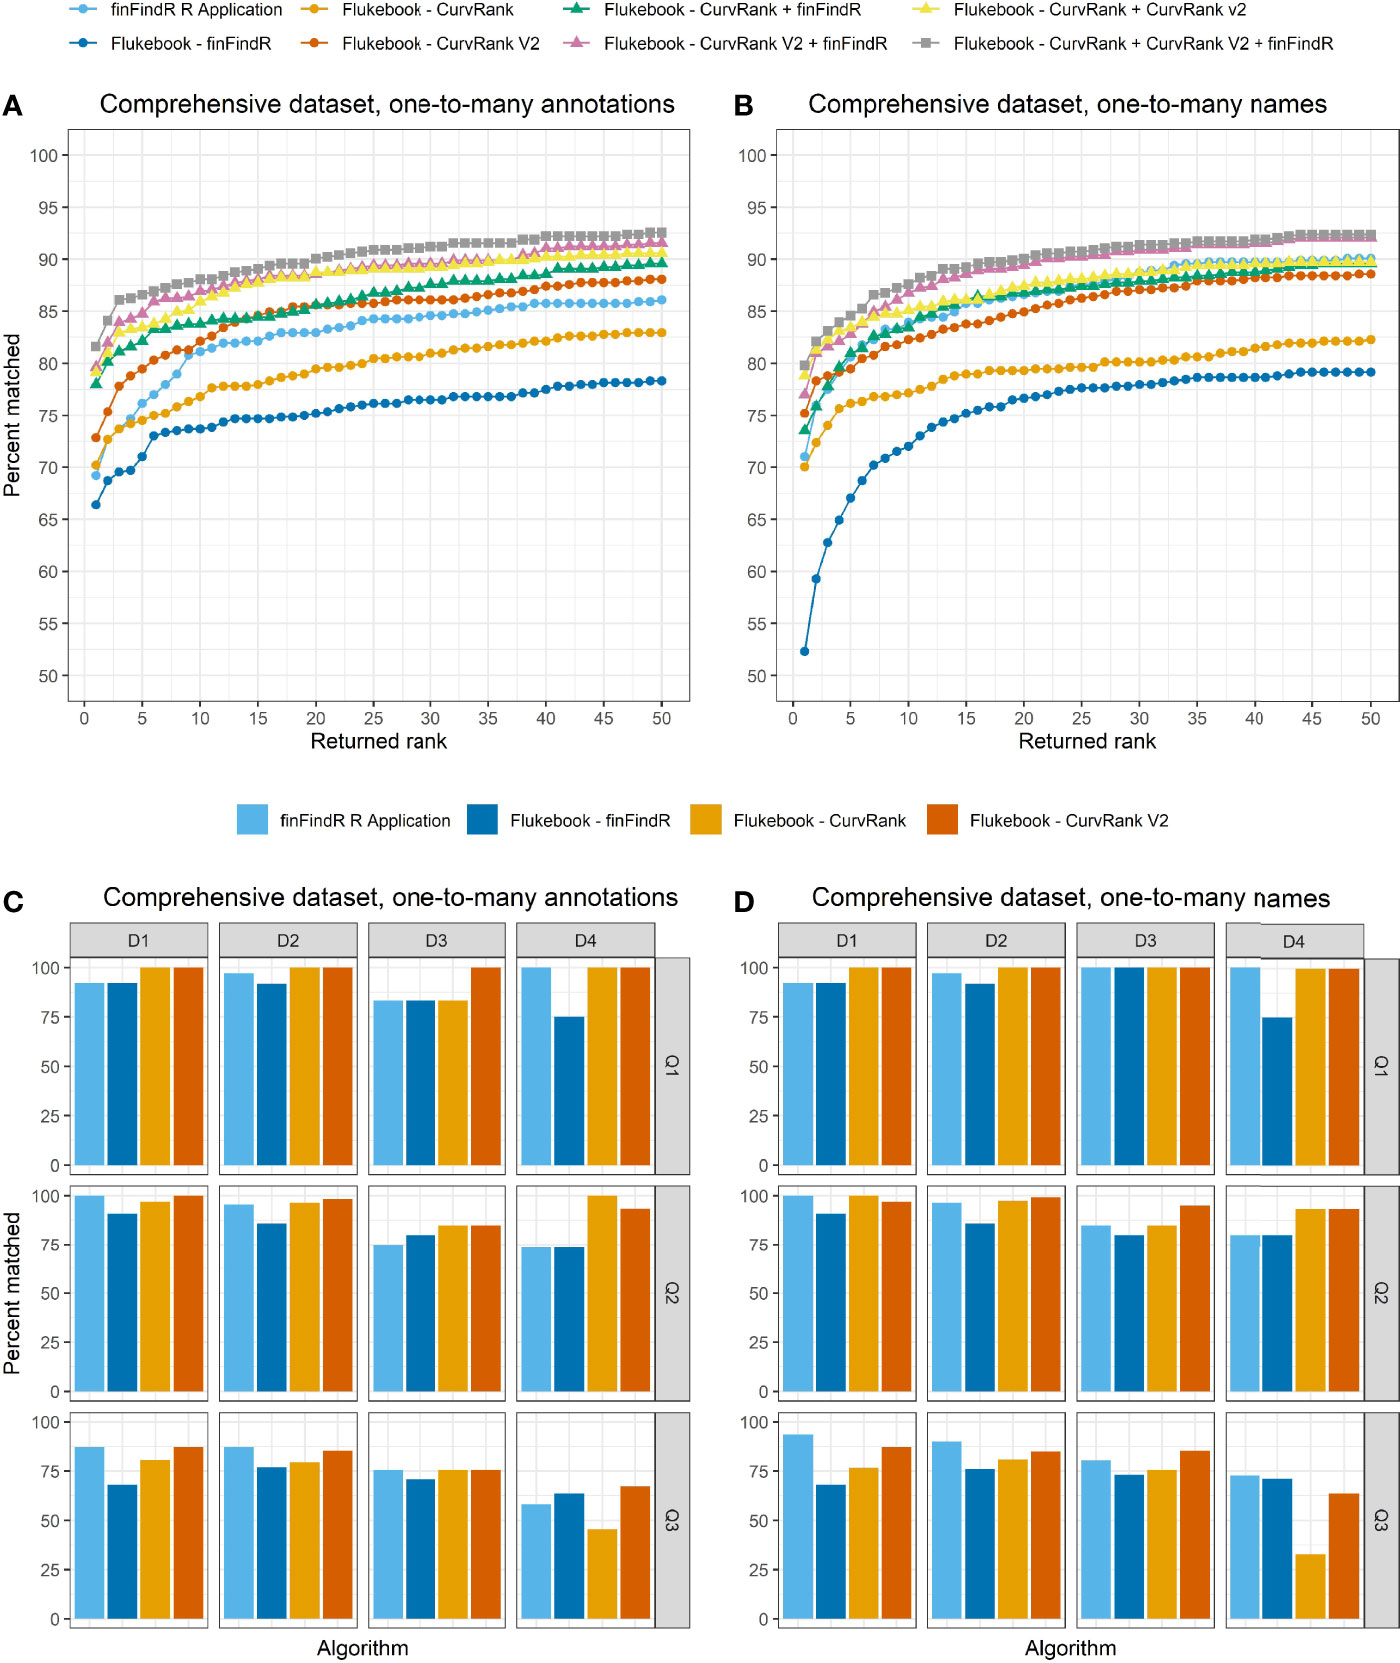
Figure 5 The percentage of images correctly matched by each algorithm and combination of algorithms (Flukebook algorithms only) and their cumulative rank position for the comprehensive tests in the (A) one-to-many annotations comparisons and (B) the one-to-many names comparisons; as well as the percentage of images of varying image quality and fin distinctiveness correctly matched by the independent algorithms for the comprehensive tests in the (C) one-to-many annotations comparisons and (D) the one-to-many names comparisons. For reference, Q1 = excellent quality image, Q2 = average quality image, Q3 = poor quality image, D1 = very distinctive fin, D2 = average amount of distinctive features on fin, D3 = low distinctiveness, and D4 = not distinct fin (Urian et al., 1999; Urian et al., 2014).
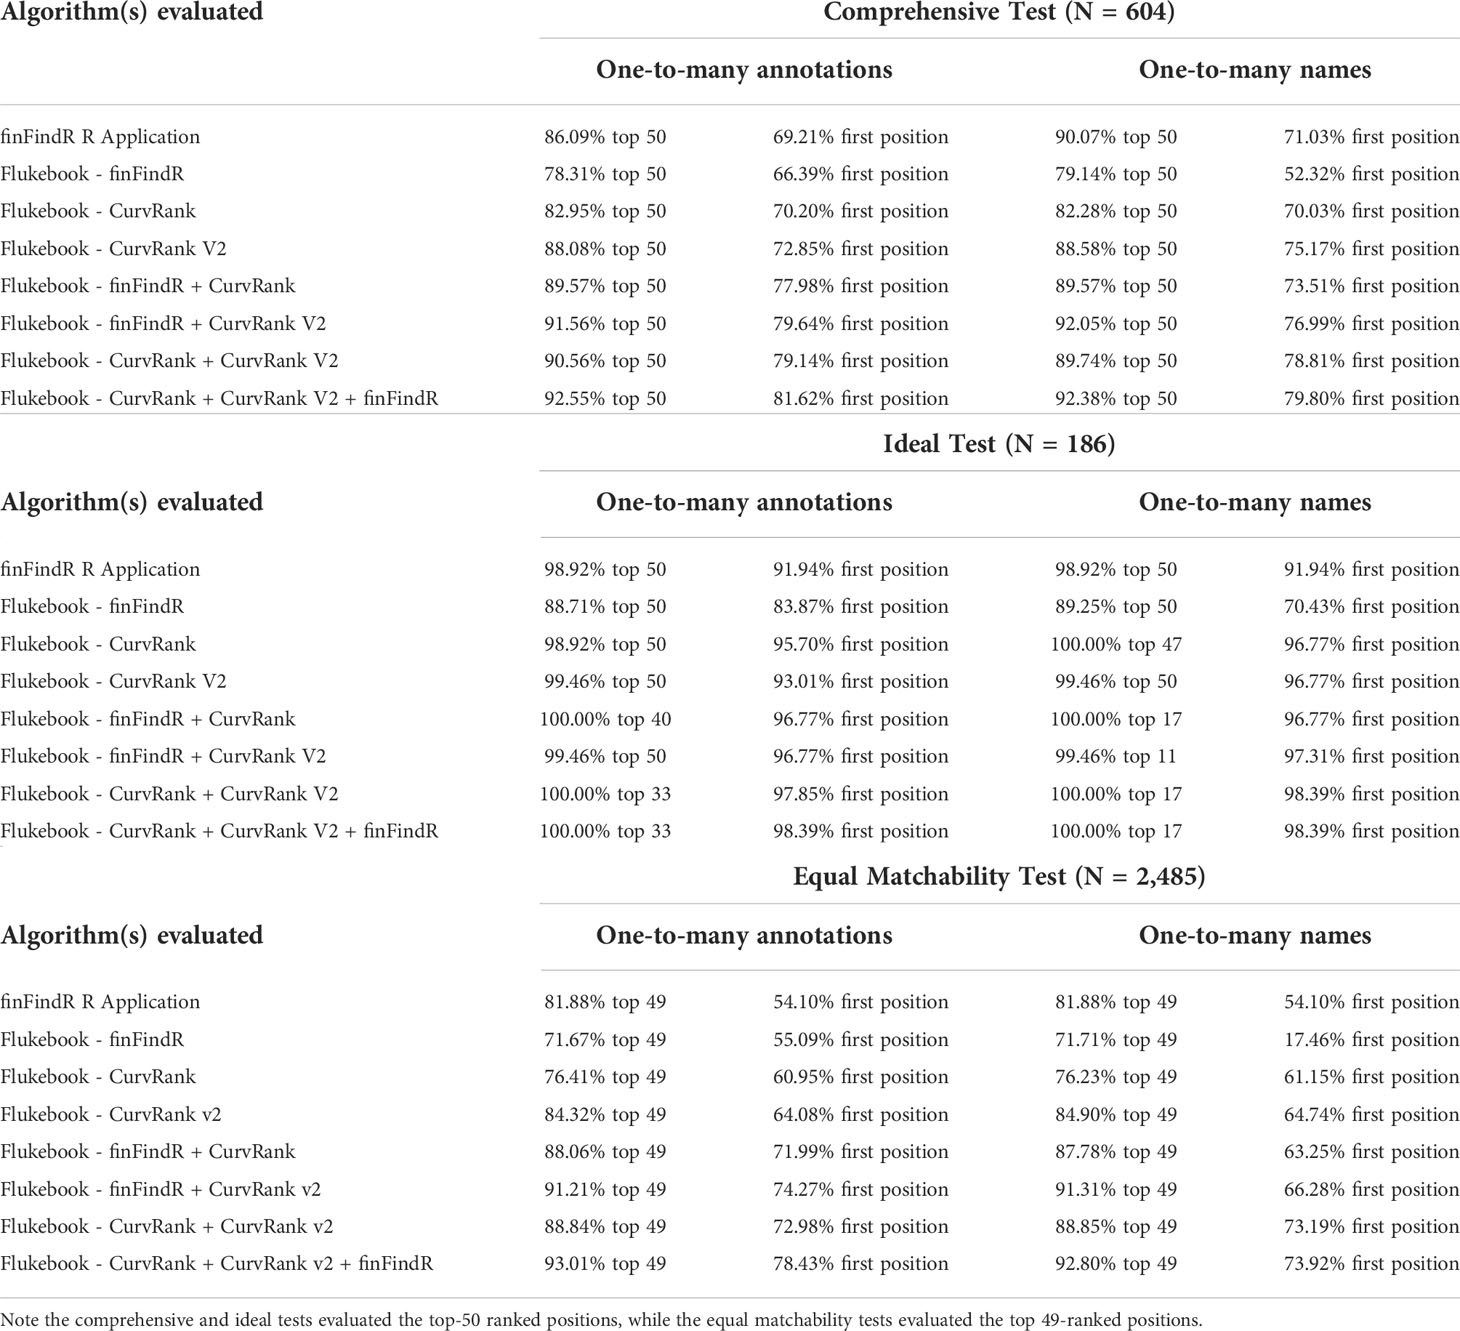
Table 1 The percentage of correct matches within the top-X ranked positions and the first position for each dataset comparison test (i.e., comprehensive, ideal, and equal matchability tests for the one-to-many annotations and one-to-many names comparisons) and each algorithm evaluated (the finFindR R application, and the CurvRank, CurvRank v2, and finFindR algorithms and their combinations integrated into Flukebook).
CurvRank v2 within Flukebook returned the most correct matches within the top 50-ranked positions compared to the other algorithms (N = 532, 88.08%) in the one-to-many annotations comparisons for the comprehensive test, while the finFindR algorithm within Flukebook returned the fewest number of correct matches within the top 50-ranked positions (N = 473, 78.31%) (Table 1 and Figure 5A). The combined results from the finFindR, CurvRank and CurvRank v2 algorithms within Flukebook returned the most correct matches within the top 50-ranked positions with 559 images (92.55%) correctly matched (Table 1 and Figure 5A). All algorithms had more than 66.39% (N = 401) of images correctly matched and returned in the first-ranked position (Table 1), with CurvRank v2 having the most images out of the independent algorithms tested ranked in the first position (N = 440, 72.85%) (Table 1 and Figure 5A) and the lowest mean ranked position (2.88; Table 2). The combined results from the finFindR, CurvRank and CurvRank v2 algorithms within Flukebook returned the highest number of correct matches in the first-ranked position (N = 493, 81.62%; Table 1 and Figure 5A) and the lowest overall mean ranked position (2.36; Table 2).
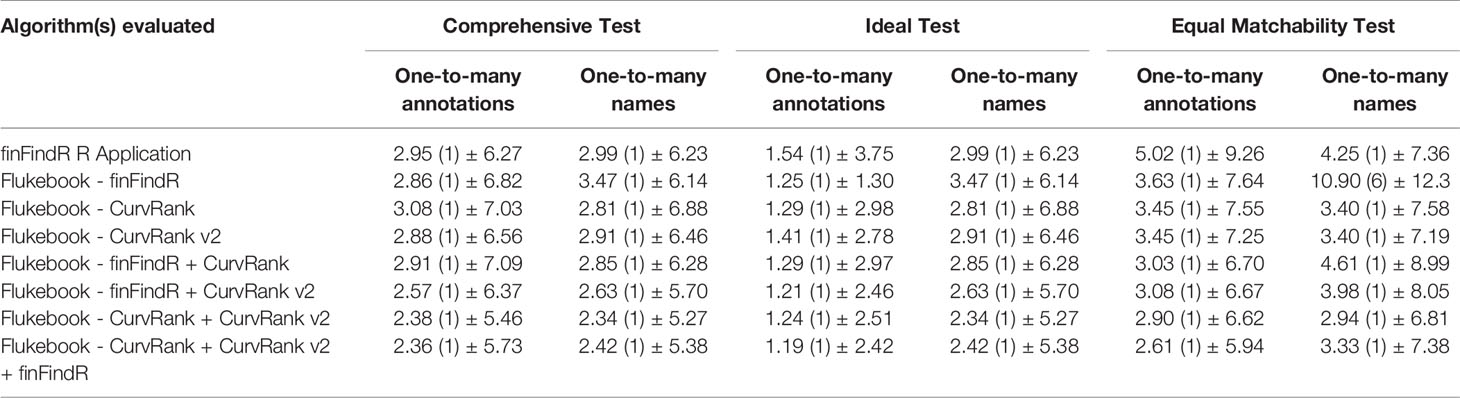
Table 2 The mean (median) ± SD ranked position for each dataset comparison test (i.e., comprehensive, ideal, and equal matchability tests for the one-to-many annotations and one-to-many names comparisons) and each algorithm evaluated (the finFindR R application, and the CurvRank, CurvRank v2, and finFindR algorithms and their combinations integrated into Flukebook).
Images with all levels of image quality and fin distinctiveness grades were correctly matched, but these results also varied by the algorithm (Figure 5C). The CurvRank v2 algorithm within Flukebook correctly matched 100% of all Q1 images (N = 59) regardless of fin distinctiveness. All algorithms returned the fewest number of correct images matched for poor quality images (Q3) of non-distinct (D4) animals (Figure 5C).
The finFindR R application returned the highest number of correct matches of the independent algorithms in the top 50-ranked positions in the one-to-many names comparisons for the comprehensive test with 90.07% (N = 544) of images correctly matched (Table 1 and Figure 5B). The combined results from the finFindR, CurvRank and CurvRank v2 algorithms within Flukebook returned the most correct matches with 92.38% (N = 558) of images being correctly matched within the top 50-ranked positions (Table 1 and Figure 5B). All algorithms resulted in the comprehensive dataset having more than 52.31% (N = 316) of images correctly matched in the first position, with all but the finFindR algorithm in Flukebook having more than 70.03% (N = 423) images correctly matched in the first position (Table 1 and Figure 5B). CurvRank v2 had the most images correctly matched in the first ranked position (N = 454, 75.17%) out of the independent algorithms tested (Table 1); however, CurvRank had the lowest mean overall rank (2.81, Table 2). The combined results from the finFindR, CurvRank and CurvRank v2 algorithms within Flukebook returned the highest number of correct matches in the first ranked position (79.80%, N = 482) (Table 1 and Figure 5B), while the combined results from the CurvRank and CurvRank v2 algorithms within Flukebook returned the lowest overall mean rank (2.34, Table 2).
Similar to the one-to-many annotations tests, images with all levels of image quality and fin distinctiveness grades were correctly matched in the one-to-many names comparisons, with these results varying by the algorithm tested (Figure 5D). The CurvRank and CurvRank v2 algorithms within Flukebook correctly matched 100% of all Q1 images (N = 59) regardless of fin distinctiveness, and all four algorithms correctly matched more than 91.67% of all Q1 images for fins with D1, D2, and D3 grades. Algorithms returned the fewest number of correct images matched for poor quality images (Q3) of non-distinct (D4) animals (Figure 5D).
The ideal dataset only included good or excellent quality images (Q1 and Q2) of fins with high or average levels of distinctiveness (D1 and D2) from both the reference catalog and the query datasets. All images from the ideal query dataset (N = 186 images) were successfully traced by the finFindR R application and the algorithms implemented in Flukebook (Figures 6A, B).
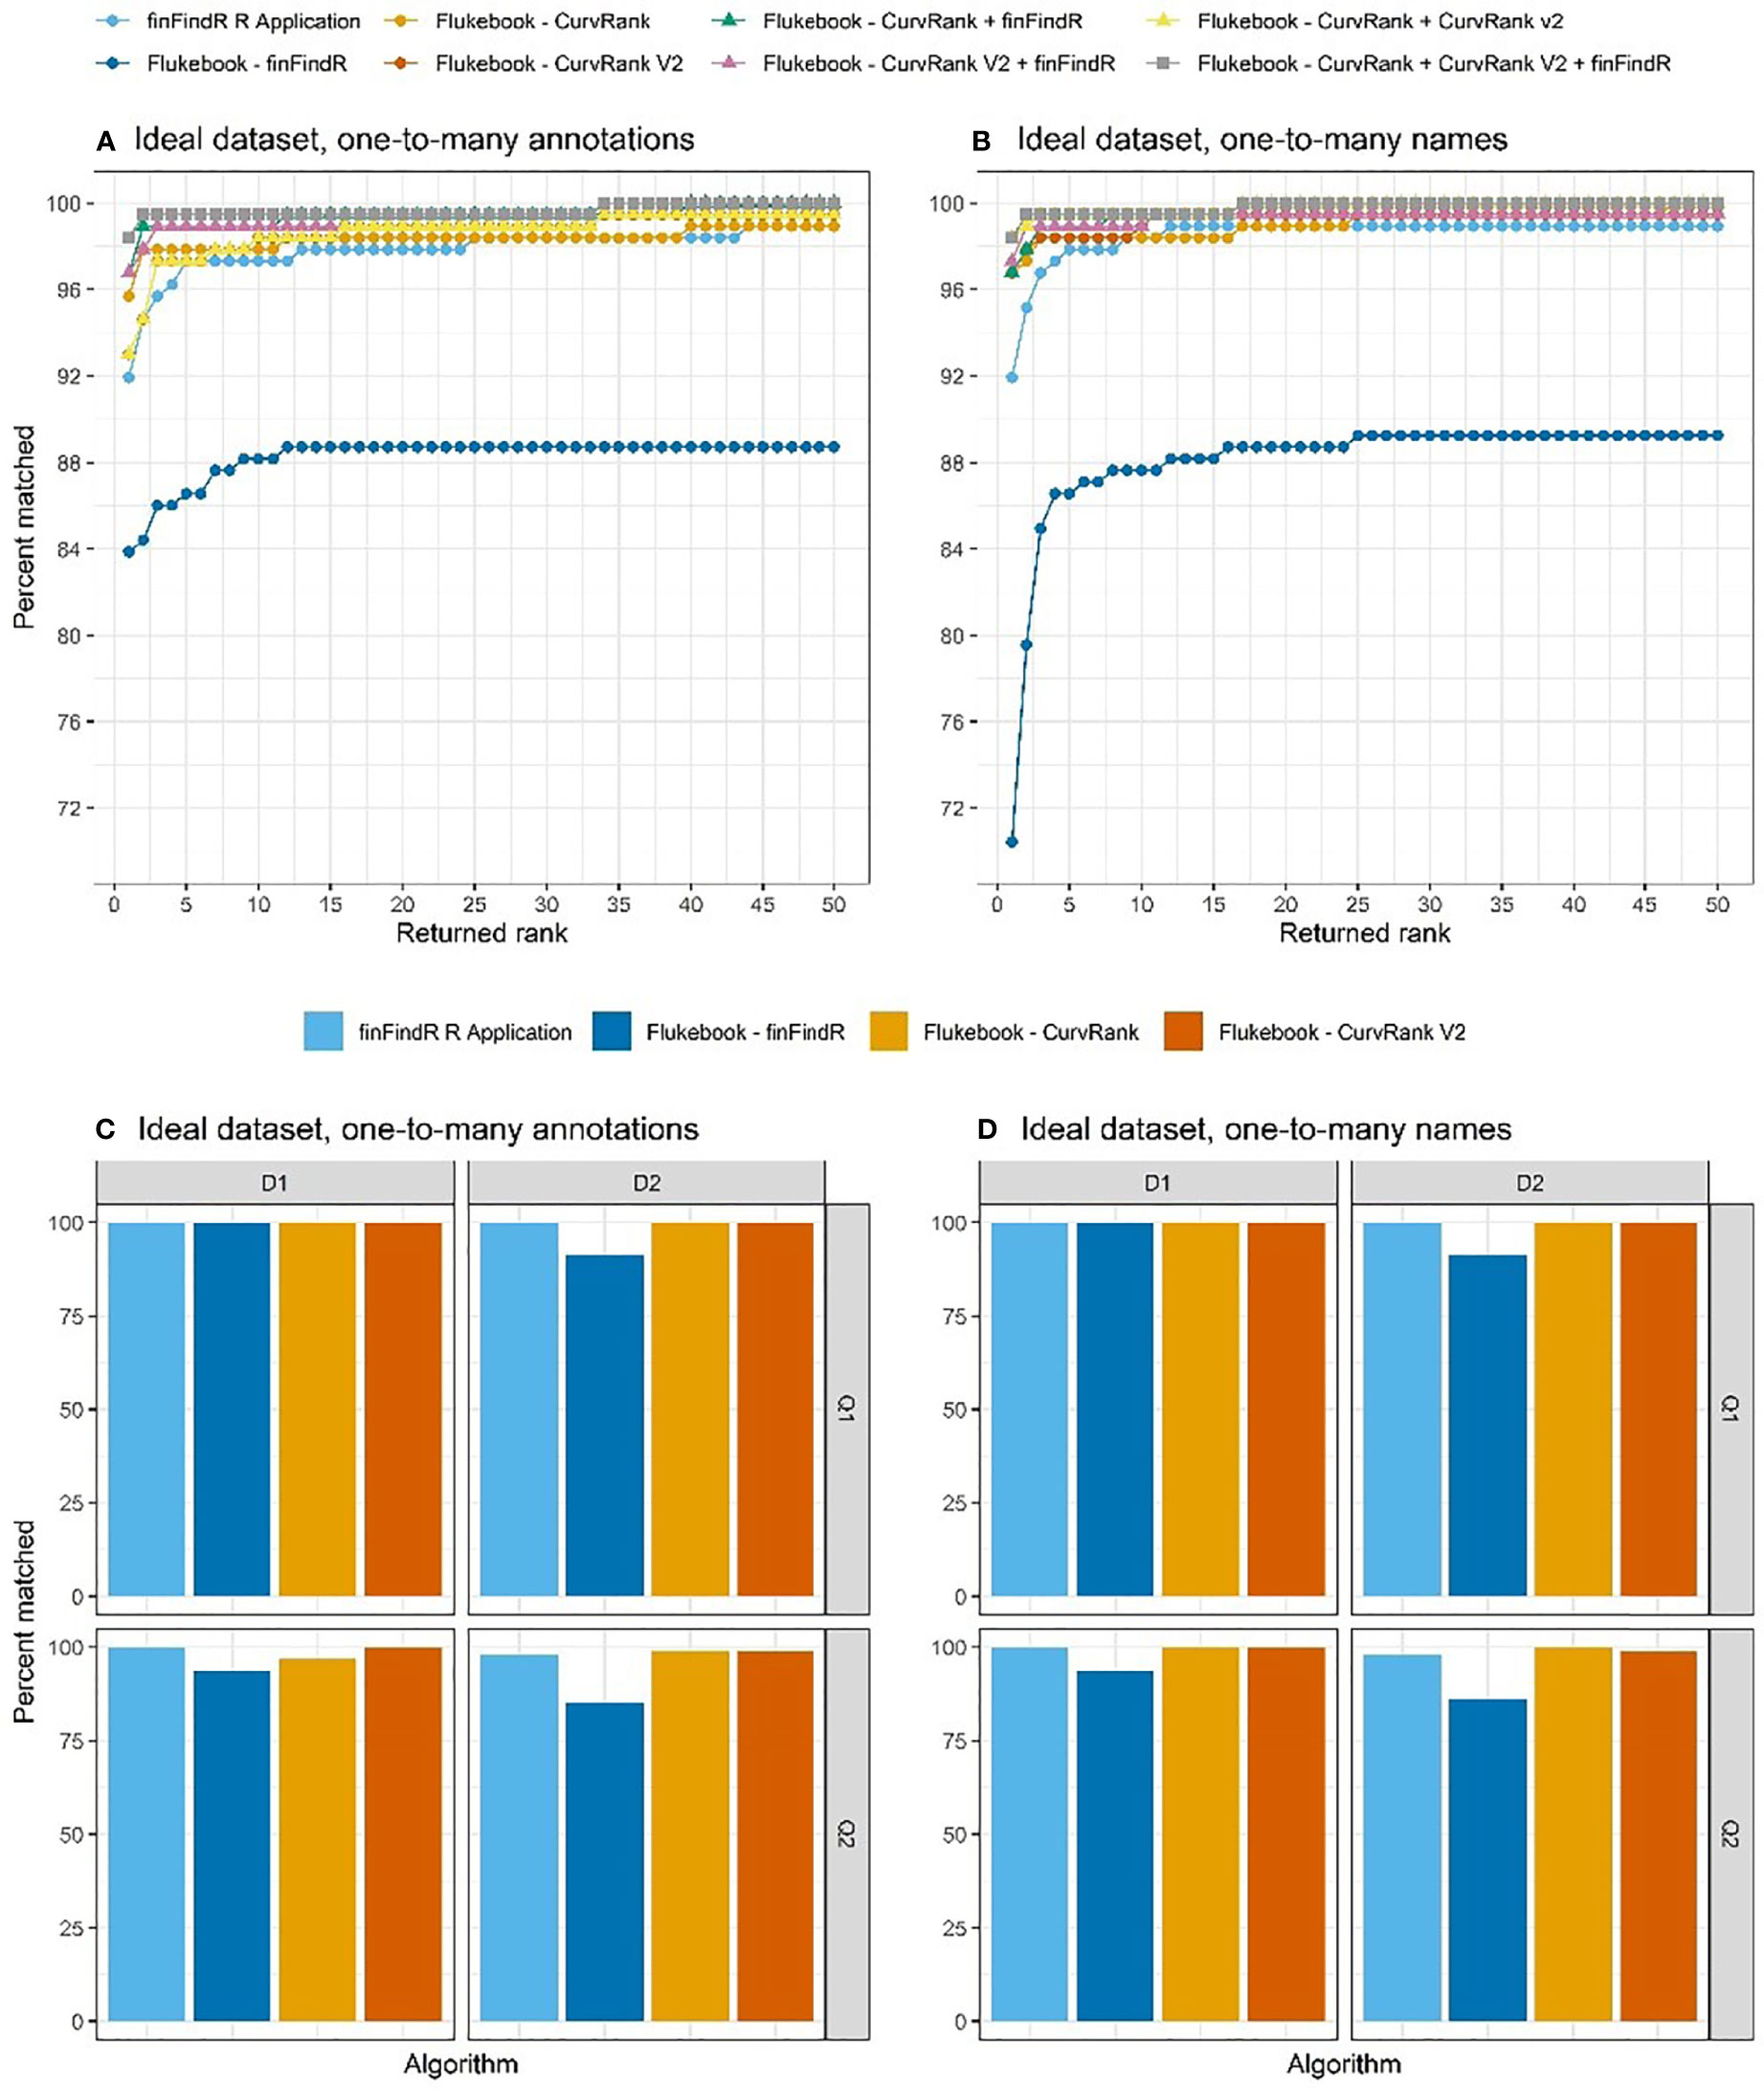
Figure 6 The percentage of images correctly matched by each algorithm and combination of algorithms (Flukebook algorithms only) and their cumulative rank position for the ideal tests in the (A) one-to-many annotations comparisons and (B) the one-to-many names comparisons; as well as the percentage of images of varying image quality and fin distinctiveness correctly matched by the independent algorithms for the ideal tests in the (C) one-to-many annotations comparisons and (D) the one-to-many names comparisons. For reference, Q1 = excellent quality image, Q2 = average quality image, Q3 = poor quality image, D1 = very distinctive fin, D2 = average amount of distinctive features on fin, D3 = low distinctiveness, and D4 = not distinct fin (Urian et al., 1999; Urian et al., 2014).
The finFindR R application as well as CurvRank and CurvRank v2 within Flukebook correctly matched over 98.92% (N = 184) of images within the top-50 ranked positions (Table 1 and Figure 6A), while finFindR within Flukebook correctly matched 88.71% (N = 165) images within the top 50-ranked positions (Table 1 and Figure 6A). The finFindR algorithm within Flukebook had the lowest mean rank (1.25) of the four independent algorithms; however all four algorithms had a mean rank less than 1.60 (Table 2). The combined results from the finFindR, CurvRank and CurvRank v2 algorithms within Flukebook returned the most correct matches: finFindR + CurvRank correctly matched 100% of the images (N = 186) in the top 40-ranked positions, finFindR + CurvRank v2 correctly matched 99.46% of the images (N = 185) in the top 50-ranked positions, and CurvRank + CurvRank v2 as well as CurvRank + CurvRank v2 + finFindR correctly matched 100% of the images in the top 33-ranked positions (N = 186; Table 1 and Figure 6A). The finFindR R application, CurvRank and CurvRank v2 had over 91.24% (N = 171) of images returned in the first-ranked position (Table 1 and Figure 6A). The combined results from CurvRank + CurvRank v2 + finFindR within Flukebook had the lowest overall mean rank (1.19, Table 2).
All four independent algorithms correctly matched 100% of D1/Q1 images in the one-to-many annotations tests (N = 13; Figure 6C). The finFindR R application and CurvRank and CurvRank v2 algorithms within Flukebook also correctly matched 100% of D2/Q1 images (N = 32); while the finFindR R application and CurvRank v2 algorithm within Flukebook correctly matched 100% of D1/Q2 images (N = 33). Match success decreased with D2/Q2 images (N = 114) for all algorithms, but was greater than 98.17% (N = 112) for all algorithms but the finFindR algorithm within Flukebook, which had 85.53% (N = 98) match success of D2/Q2 images (Figure 6C).
Match success was over 98.92% (N = 184) in the top 50-ranked positions for the finFindR R application, and the CurvRank and CurvRank v2 algorithms within Flukebook in the one-to-many names comparisons of the idea test data (Table 1 and Figure 6B). The combined results from the finFindR, CurvRank and CurvRank v2 algorithms within Flukebook returned the most correct matches: finFindR + CurvRank v2 correctly matched 99.46% of the images (N = 185) in the top 11-ranked positions, while finFindR + CurvRank, CurvRank + CurvRank v2 as well as CurvRank + CurvRank v2 + finFindR correctly matched 100% of the images in the top 17-ranked positions (Table 1 and Figure 6B). The finFindR R application returned 91.94% (N = 171) images in the first ranked position, finFindR within Flukebook returned 70.43% (N = 131) images in the first ranked position, and CurvRank and CurvRank v2 returned 96.77% (N = 180) of images in the first ranked position (Table 1 and Figure 6B). CurvRank v2 within Flukebook had the lowest overall mean ranked position (2.91, Table 1) for the independent algorithms, while the combination of CurvRank and CurvRank v2 within Flukebook had the lowest overall ranked position (2.34, Table 2).
All four independent algorithms correctly matched 100% of D1/Q1 images in the one-to-many names tests (N = 13), and all but the finFindR algorithm within Flukebook correctly matched 100% of D1/Q2 images (N = 33) and 100% of D2/Q1 images (N = 32; Figure 6D). The finFindR algorithm within Flukebook correctly matched 93.55% (N = 31) and 91.43% (N = 29) of D1/Q2 and D2/Q1 images respectively. Similar to other tests, match success decreased with D2/Q2 images (N = 114) for all algorithms. Despite this, match success was greater than 98.17% (N = 112) for all independent algorithms except for the finFindR algorithm within Flukebook, which had 86.24% (N = 98) match success of D2/Q2 images (Figure 6D).
The equal matchability dataset included three seeds of images that were filtered to only include individuals that had been sighted at least twice, but no more than 5 times, and to have images from sightings that were taken more than 2 weeks apart. The results from each seed were averaged together to produce an overall match rate (Figures 7A, B). One D4/Q3 image of a D4/Q3 individual was not traced by all three seeds in the finFindR R application, while a second image of a D1/Q3 image was not traced by seeds 1 and 3 in this application. All filtered images were traced successfully by the algorithms in Flukebook.
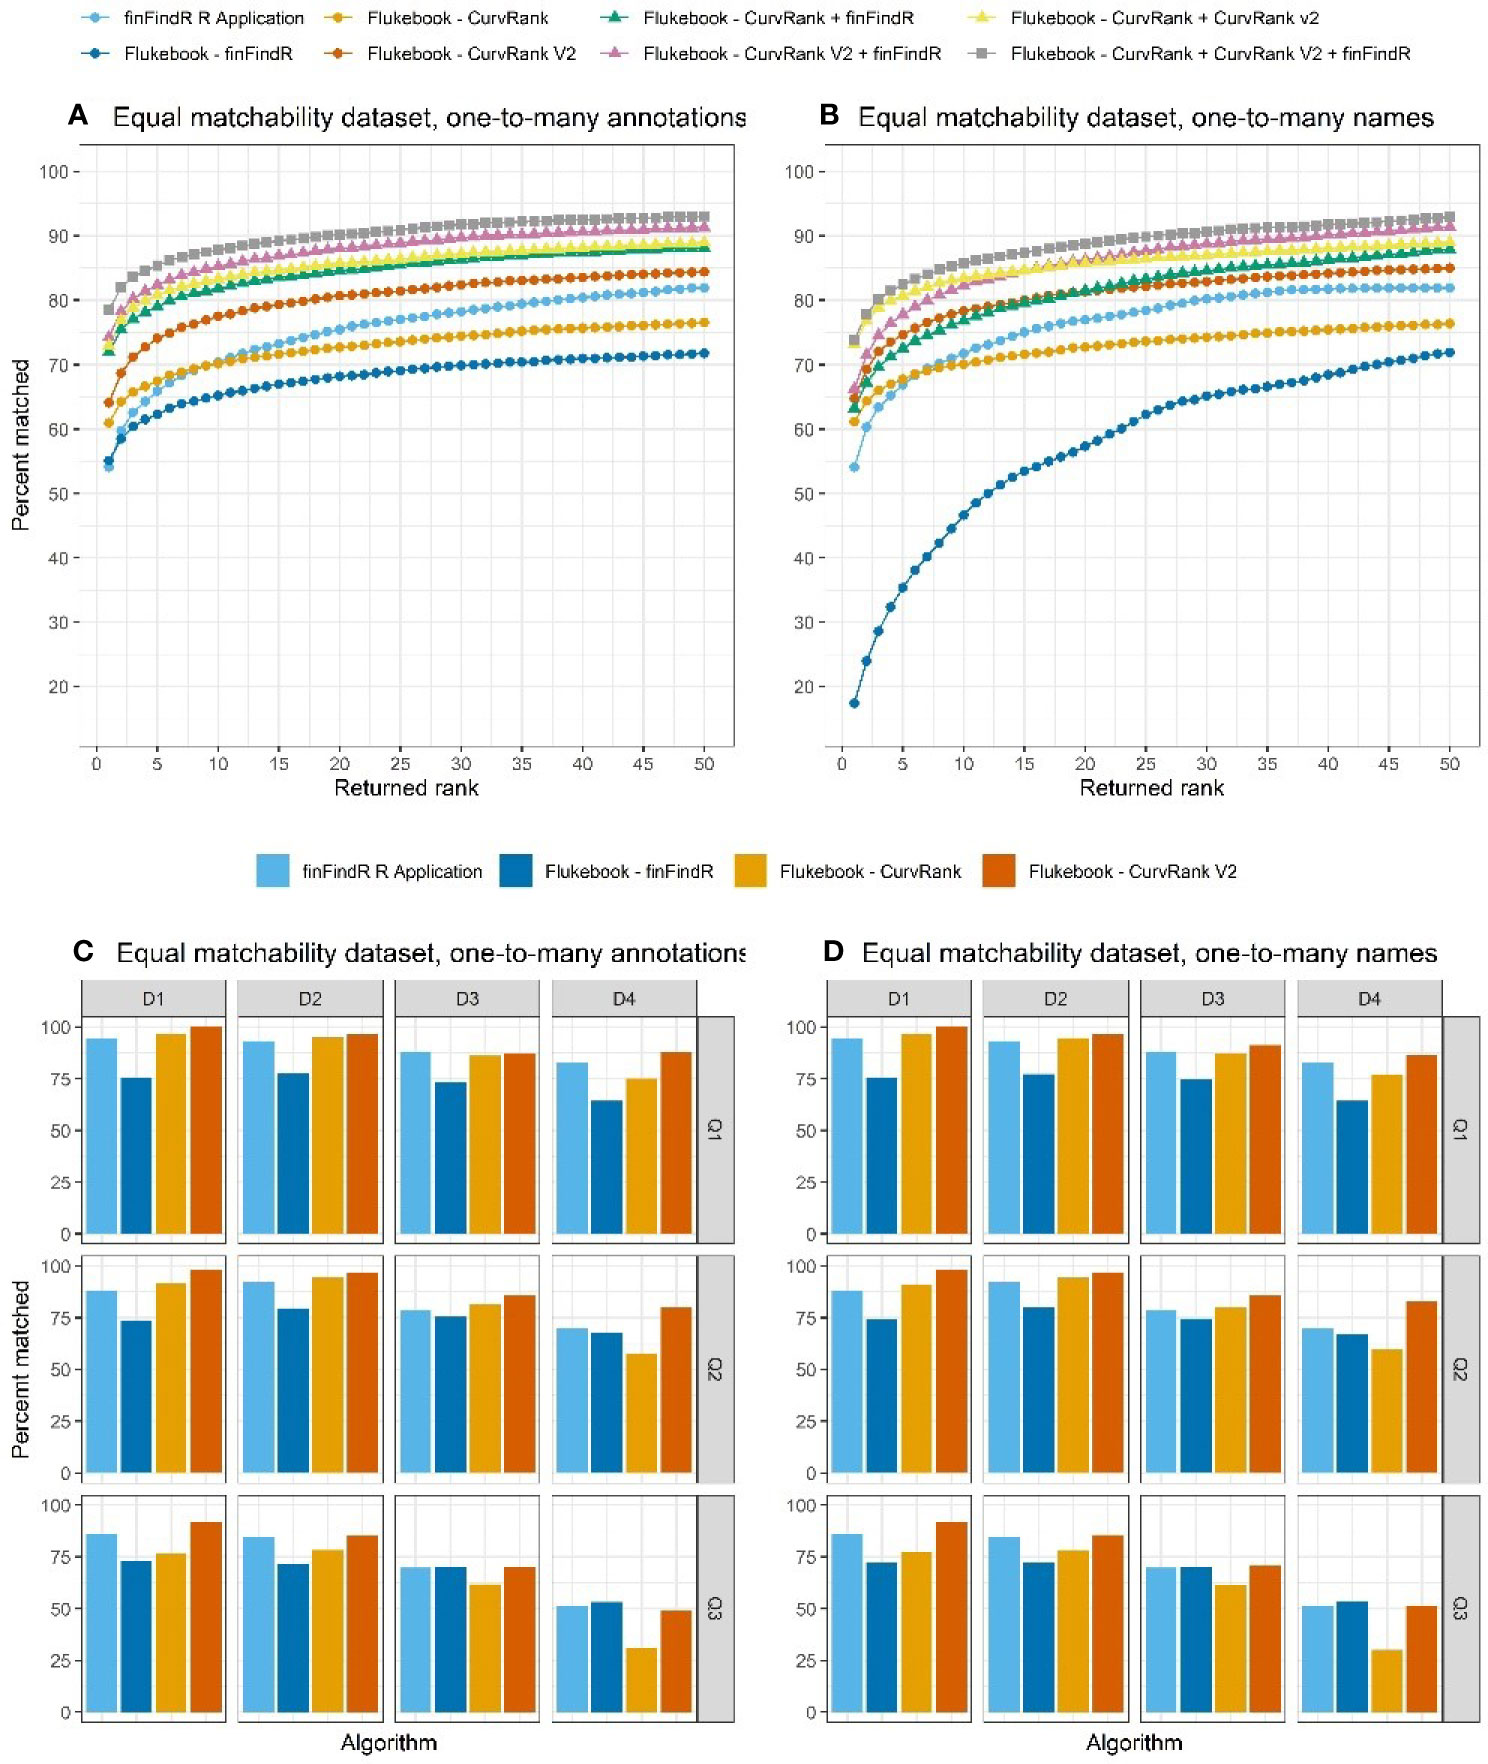
Figure 7 The percentage of images correctly matched by each algorithm and combination of algorithms (Flukebook algorithms only) and their cumulative rank position for the equal matchability tests in the (A) one-to-many annotations comparisons and (B) the one-to-many names comparisons; as well as the percentage of images of varying image quality and fin distinctiveness correctly matched by the independent algorithms for the equal matchability tests in the (C) one-to-many annotations comparisons and (D) the one-to-many names comparisons. For reference, Q1 = excellent quality image, Q2 = average quality image, Q3 = poor quality image, D1 = very distinctive fin, D2 = average amount of distinctive features on fin, D3 = low distinctiveness, and D4 = not distinct fin (Urian et al., 1999; Urian et al., 2014).
The finFindR R application, and finFindR, CurvRank, and CurvRank v2 in Flukebook correctly matched an average of 81.88% (N = 2034.67), 71.67% (N = 1781), 76.41% (N = 1898.67), and 84.32% (N = 2095.33) of images, respectively, within the top 49-ranked positions (Table 1 and Figure 7A); and 54.10% (N = 1344.33), 55.09% (N = 1369), 60.95% (N = 1514.67), and 64.08% (N = 1592.33) of images, respectively, as the first-ranked position for the one-to-many annotations tests (Table 1 and Figure 7A). The finFindR implementation used by Flukebook had the lowest mean rank for the independent algorithms (3.45, Table 2), while the finFindR R application had the highest (5.02, Table 2). The combined results from the finFindR, CurvRank and CurvRank v2 algorithms within Flukebook increased match success within the top 49-ranked results, with 93.01% (N = 2311.33) match success for the finFindR + CurvRank + CurvRank v2 combined results (Table 1 and Figure 7A). Match success for the first ranked position also increased to 78.43% (N = 1949) for the CurvRank + CurvRank v2 + finFindR algorithms (Table 1 and Figure 7A). The lowest overall ranked position (2.61) was a result of a combination of the CurvRank + CurvRank v2 + finFindR algorithms within Flukebook (Table 2).
Match success varied across all image quality and fin distinctiveness grades for all algorithms examined with the one-to-many annotations tests, with match success being higher for all algorithms when better quality images of more distinct fins were evaluated (Figure 7C).
The finFindR R application, and finFindR, CurvRank, and CurvRank v2 in Flukebook correctly matched 81.88% (N = 2034.67), 71.71% (N = 1782), 76.23% (N = 1894.33), and 84.90% (N = 2109.67) of images, respectively, within the top 49-ranked positions (Table 1 and Figure 7A); and 54.10% (N = 1344.33), 17.46% (N = 434), 61.15% (N = 1519.67), and 64.74% (N = 1608.67) of images, respectively, within the first-ranked position for the one-to-many names tests (Table 1 and Figure 7B). Match success increased with the combined algorithms to 92.80% (N = 2306.00) within the top 49-ranked results (Figure 7B) and 73.92% (N = 1837) as the first ranked result for the finFindR + CurvRank + CurvRank v2 algorithms (Table 1 and Figure 7B). The CurvRank and CurvRank v2 algorithms had the lowest mean ranked positions for the independent algorithms (both 3.40), while their combined results produced the lowest overall ranked positions (2.94) (Table 2).
Match success again varied across all image quality and fin distinctiveness grades for all algorithms examined, with match success being higher for all algorithms when better quality images of more distinct fins were evaluated (Figure 7D).
The use of computer vision for examining wildlife data has rapidly expanded in recent years (Weinstein, 2018). For researchers studying marine mammals, these advances have the potential to decrease the amount of time spent manually comparing images of individuals to one another while simultaneously maintaining a high level of accuracy and precision in match success during the photo-ID process. While our workshop survey results suggest that computer vision fin matching systems are not yet widely used or accepted in the photo-ID community for marine mammals, the results of our image comparison tests suggest that these systems can perform very well, particularly when only good to excellent quality images of fins with average to high distinctiveness were included in the matching process. For example, match success was over 98.92% in the top 50-ranked positions for the finFindR R application, and the CurvRank and CurvRank v2 algorithms within Flukebook in both the one-to-many annotations comparisons and the one-to-many names comparisons of Q1, Q2 and D1, D2 images (Table 1 and Figures 6A, B). In addition to this high performance, the mean returned rank of the correct image was less than 2 for the one-to-many-annotations test and less than 4 for the one-to-many-names test (Table 2) suggesting that researchers may only need to look at a small number of putative matches before finding the correct match if it exists in the reference catalog. These results could represent substantial time savings for researchers who may otherwise be manually comparing a single image to up to thousands of putative image matches, while simultaneously maintaining trust that the returned results have a high probability of being accurate.
The primary reason that photo-ID researchers reported not using computer vision systems in their photo-ID process in our survey related to the small size of their catalogs and the effort they believed that it would take to use a computer vision system compared to the effort that it would take to perform these tasks manually. Indeed, survey results did not suggest that the use of computer assisted methods (e.g., user-defined attribute based systems and/or computer vision programs) significantly decreased time to match regardless of catalog size (Figure 4); however, we believe that there are many factors not addressed in the survey (e.g., the computer assisted method used, the experience of the researchers performing the photo-ID, the distinctiveness and behavior of dolphins in the study population, the number of catalog checks performed) that limit the meaning and interpretation of the survey results. Researchers dealing with small catalogs are often very familiar with their study site and many of the individuals in it, and therefore can often readily identify individuals manually, sometimes even in the field. Despite this, computer vision systems could quickly return putative matches in the lab as misidentifications in the field, even by experienced researchers, could occur, and they could aid in the identifications of any new, transient, immigrant, or other lesser-known dolphins.
While there is some effort involved with using computer vision systems such as those tested in this paper, including uploading query and catalog images and their associated metadata, these systems no longer require manual tracing of dorsal fins from images, as was required when using programs such as Darwin (Wilkin et al., 1998) and Finscan (Hillman et al., 2002), and instead these systems automate this step. Given this automation, and our finding that the correct image was typically in the top 10 ranked-results for all tests and computer vision systems (Table 2), we suggest that there could be substantial time savings even for the smallest catalogs. For example, if a catalog includes 100 individuals, on average a researcher would have to search through 50 individuals to find the correct match (assuming they are not using a user-defined attribute system to assist with matching). While the temporal effort required to upload images and metadata will vary based on catalog size and computer vision platform used (e.g., finFindR R application versus Flukebook), the upload process can occur in a matter of minutes and only needs to be completed once (or occasionally when substantial updates to the catalog or algorithm are made).
Another reason that survey respondents reported for not using computer vision systems in their photo-ID process was because they do not trust that these systems perform as well as a human. While our results did not compare computer vision system performance against manual matching by humans, match success was very high, particularly when only good to excellent quality images of fins with average to high distinctiveness were included in the matching process (Figure 6). Validation tests for images of humpback whale flukes taken along the U.S. west coast found that CurvRank and Hotspotter (Crall et al., 2013) within Flukebook verified at least 21 matches in the top two results that were missed in a manual comparison of images (Calambokidis et al., 2017). This suggests that these systems can perform as well if not better than humans. Further, manual comparison of 2,777 cropped images to their catalog of 4,041 photos of 3,235 individuals required over 2,500 volunteer and 900 staff hours (Calambokidis et al., 2017), which is a substantial investment in time and labor costs. Auger-Méthé et al. (2011) suggested that a comparison of a single image of a narwhal to a catalog of a few hundred narwhals could easily require an hour of effort. These findings along with ours provide support that these systems have the potential to both save substantial time and effort in the matching process, while assisting with high levels of match success.
Our results varied depending on the experimental test and computer vision system examined; however, all tests returned over 71.67% of correct matches within the top 50-ranked results (Table 1 and Figures 5–7) and the mean returned rank was less than the 5th-ranked position for all but two comparisons; Table 2). These results are similar to the results from other validation tests (e.g., Weideman et al., 2017; Mullin et al., 2018; Thompson et al., 2021), providing more evidence that these computer vision systems can be a reliable tool to assist in the photo-ID matching process. The finFindR implementation in Flukebook had the lowest match success out of all of the independent algorithms tested, particularly when compared to the finFindR R application. This is related to updates that have been made to the finFindR algorithm since its implementation in Flukebook, such as the inclusion of leading edge tracing (implemented in the algorithm, but not available yet in the user-interface), improving automatic annotating, and making the application faster. As updates continue to be implemented in these systems it is likely that match success will increase. For example, Thompson et al. (2021) reported higher match success rates with the finFindR R application than Mullin et al. (2018) reported, but their results were based on a newer finFindR R release. In this study, we used the 0.1.10 release of the finFindR R application, while the finFindR algorithm in Flukebook was based off of the 0.1.8 release. Similar improvements can be expected with other algorithms. For example, CurvRank v2 performed better than CurvRank in both the one-to-many annotations comparisons and the one-to-many names comparisons for both the comprehensive and equal matchability tests. As these systems continue to improve, we should continue to perform validation tests such as these to re-assess match rates.
Flukebook is an open-source multispecies platform that implements a variety of matching algorithms suited for use with various matching problems (e.g., pattern and color recognition, fluke and dorsal fin feature extraction). Within its structure, users are able to obtain a single score and ranking based on results from >1 algorithm (i.e., a meta-rank) increasing its overall match success. Given each algorithm’s approaches with machine learning to individual identification differ, some algorithms may succeed where others may fail. Thus, their combined application is a useful feature with ensemble machine learning techniques (Blount et al., 2019). Indeed, the best overall results were achieved in Flukebook when the results of the independent algorithms were combined (Tables 1, 2 and Figures 5–7). For example, with the ideal tests, the combined results from the CurvRank, CurvRank v2 and finFindR algorithms returned 100% of the correct matches in the top 33-ranked positions and top 17-ranked positions for the one-to-many annotations tests and one-to-many names comparisons, respectively. This feature of combining results from multiple algorithms within Flukebook greatly increases the likelihood that users would find the correct match searching a fairly small number of images should the match exist in the catalog. It also means that improvements made to one algorithm working with one species may be implemented with another species if thought fruitful. For example, Flukebook initially added sperm whale fluke matching by re-using machine learning models trained on humpback flukes as an interim step before developing the current species-specific models (Blount et al., 2022b). Thus, the success rates of the fin matching algorithms in Flukebook are likely to increase as more species and more examples of each species are added to the program.
The ideal tests returned the highest match success and lowest mean returned ranks of all independent algorithms tested (Tables 1, 2 and Figure 6). This result was anticipated as many studies have suggested that only good to excellent quality images of fins with average to high distinctiveness be included in the matching process to increase match success (e.g., Kelly, 2001; Beekmans et al., 2005; Rosel et al., 2011; Urian et al., 2015). By excluding poor quality images and images of low to non-distinctive individuals, researchers reduce the likelihood of introducing bias into their study by missing matches or making incorrect matches of individuals (Friday et al., 2000; Stevick et al., 2001; Franklin et al., 2020). Our results suggest that following this practice greatly increases the likelihood of match success within a small number of ranked-results should a match be present in the catalog (Tables 1, 2 and Figures 5–7). Indeed for the comprehensive and equal matchability tests most of the failures were of poor quality images and of low to non-distinct animals (Figures 5, 7). Interestingly, the finFindR R application and CurvRank and CurvRank v2 in Flukebook correctly matched many of the D3 and D4 images that were of average to excellent quality in the comprehensive and equal matchability tests (Figures 5, 7). This suggests that the quality of the image is a stronger predictor of match failure than the distinctiveness of the fin, and that in many cases these algorithms are able to detect subtle differences in fin shapes and markings that may be less visible to the human eye and still return the correct match. Beekmans et al. (2005) found a similar result when examining computer-assisted methods for matching sperm whale fluke images (i.e., the Highlight method, Whitehead, 1990 and the Europhlukes method based on Huele et al., 2000), where photographic quality had a profound effect on match performance. Despite these findings, we recommend that users exclude images of low-to-non distinctive fins in their computer vision catalog searches because, at this time, a human still has to manually confirm that a match is correct.
It should be mentioned that the characterization of image quality and fin distinctiveness is a highly subjective process (Urian et al., 2015). Because of this, most photo-ID research groups have developed and or rely on some sort of grading process to determine image quality and fin distinctiveness, and therefore which images should be included in a catalog or analysis (e.g., Slooten et al., 1992; Urian et al., 1999; Wilson et al., 1999; Friday et al., 2000; Ottensmeyer and Whitehead, 2003; Urian et al., 2014; Urian et al., 2015). This grading process, however, can vary by photo-ID research groups, and even within individuals of the same research group following the same criteria (Urian et al., 2015). This subjectivity can introduce misidentifications and biases in analyses that rely on these data, such as mark-recapture studies, which are commonly used to estimate small delphinid abundances (Urian et al., 2015). Discussions at the Rise of the Machines workshop focused on the potential for computer vision systems to include a quality predictor and potentially distinctiveness rating of images in an attempt to reduce the subjectivity of human researchers. Computers are capable of detecting image features that are not detectable to a human eye (e.g., colors, pixels), suggesting that they may be able to produce a more standardized means of determining if an image is matchable. We concur with Urian et al. (2015) and recommend that researchers explicitly describe both the protocols they use to determine whether images of individuals are included or matched against a reference catalog, and the types of images used in a particular analysis. For example, some analyses such as those conducted in mark-recapture studies for population estimation require cataloging and or tracking of individuals deemed unmarked (i.e., D3 and D4).
In this study, we acknowledge there may be subjectivity in our photo-ID grading process and errors in our identifications. We attempted to reduce subjectivity in our grading by following the method originally developed by Urian et al. (1999) and later refined by Urian et al. (2014) that relies on a tiered grading scheme for image quality and fin distinctiveness as described in the methods section. Furthermore, all grades and putative matches were confirmed by two independent, experienced researchers (i.e., researchers with > 2 years photo-ID experience), and any disagreements or difficult matches were additionally verified by a researcher with >15 years photo-ID experience. We also relied on a large data set (> 26,000 images) in the analyses presented. Regarding identifications, we had the unique capacity of having high confidence in our matches of low-to-non distinctive fins given the images used came from the long-term database of known Sarasota Bay resident dolphins (Wells et al., 1987; Wells, 2014). After beginning with tagging in 1970 (Irvine and Wells, 1972), the SDRP began using photo-ID methods in Sarasota Bay, Florida in the 1970s based on the finding that many individuals had lasting natural markings that could be tracked through time (Wells et al., 1980; Irvine et al., 1981; Wells and Scott, 1990; Wells, 2009; Wells, 2014). Since that time the SDRP has used photo-ID data to document the residency patterns of more than approximately 500 dolphins in the Sarasota Bay region (Figure 1) and our database has grown to include more than 40,000 encounters of dolphin groups and over 120,000 sightings of individual dolphins. During 1980-1992, the SDRP performed systematic seasonal photo-ID surveys through the Sarasota study area (Wells, 2009). Since 1992, SDRP has been performing monthly photo-ID population monitoring surveys, whereby the entire study area is surveyed. This high frequency of photo-ID surveys within a resident community means that there are generally short time periods between individual sightings and, thus, higher probabilities of correct identifications (e.g., short-term markings such as rake marks and new nicks and notches are more easily monitored). Furthermore, the frequency of these surveys allow SDRP researchers to assess and monitor individual’s relationships with conspecifics, including the introduction of births into the population, which allows us to confirm identifications even for animals with low to non-distinct fins, such as calves. Additionally, most of the resident dolphins are individually distinctive, from natural markings, tag scars, or from freeze-brands applied during health assessment studies (Wells, 2009; Wells, 2018). While misidentification errors may be present in our study, we believe they are limited for these reasons.
We designed our tests to examine the influence that the catalog composition had on the performance of the algorithms tested. The one-to-many annotation comparisons presumably should perform better in instances when there is an imbalance in the number of images per individual that are present in the reference catalog as was the case in our comprehensive and ideal tests, while the one-to-many names comparisons should perform better in situations when there is a uniform number of annotations per name in the reference catalog, such as was the makeup of our equal matchability tests. In the one-to-many names comparisons, the individuals in the reference catalog database are assumed to be assigned an image name and identification, and the computer vision system focuses on the identification. The query images are compared to the reference catalog and are assigned matches. For all the references in the catalog and each unique identification, the match returned is the single best match that was assigned that identification in the database. This helps allow the user to avoid over-representing individuals with more images of them in the database. Interestingly, in our tests the one-to-many names comparisons returned a higher number of correct matches in the top 50-returned results than the one-to-many annotations comparisons for all independent algorithms and all tests, except for the CurvRank comparisons in the comprehensive tests and the CurvRank comparisons in the equal matchability tests (Table 1). We believe that the common failure mode for the one-to-many annotation matches is that a single image of the wrong individual has a higher match score than any image of the correct individual. Name scores are made by aggregating all the annotation scores for each name. Generally, this aggregation process will favor individuals with many slightly similar annotations over those with one very-similar annotation. This tends to outweigh the previously mentioned failure mode of annotation scores and reduce those errors. In short, aggregating the information from multiple images per individual reduces noise in the matching based on idiosyncratic images. These results suggest that researchers should choose to have their results returned as one-to-many name comparisons regardless of their catalog composition at this time.
A common practice is for photo-ID catalogs to include just one or two of the best images of an individual in their reference or ‘type specimen’ catalog (e.g., the best left and right image). As computer vision systems continue to advance there may be a need for more images of individuals to be available in a reference catalog for the computer vision system to learn from. Discussions from our workshop suggested that computer vision systems generally perform better when there are more images available because they are able to learn from more angles and representations of each individual fin, much as human performance seems to improve with experience viewing individuals from a variety of angles. This has been documented in CurvRank for example, which performs better when more encounters, and hence more images, are added to the reference database (Weideman et al., 2017). This is because it is more likely that a given query image aligns with a catalog image when more viewpoints are represented. Additional images also provide insurance against situations where parts of the fin may be obscured (Weideman et al., 2017). These findings suggest that the way photo-ID researchers set up their reference catalogs may need to be reassessed. For example, photo-ID researchers may need to consider including all (or a certain unknown number) of good to excellent quality images of an individual fin in a reference database instead of a single best left or right image if they are using computer vision systems to assist in their matching process. The decision regarding choosing database images to maximize information content for identification should be addressed in future studies as suggested by Weideman et al. (2017). Future validation tests should also be performed to examine how algorithm performance varies with catalog composition, such as in situations when only one or two images of an individual are available in a reference catalog.
One caveat of our study is that we set up our experiments knowing that every image in a query had a matching image in the associated catalog. In the real world this is not always true, as images of new animals may be routinely acquired in the field. Historically, in these situations a researcher would compare the image of the unknown individual to the images of all of the known individuals in a catalog to determine if the animal is indeed new and should be added to the catalog. Often this process (i.e., a full catalog check) would be completed by two individuals to decrease the likelihood of missing the match. The time it takes to do a full catalog check varies by variables such as catalog size, researcher experience, and fin distinctiveness, but typically can be expected to take several staff hours to complete. Depending on a user’s needs in a study, they could instead accept an appropriate error rate and assume that the image is not in the full catalog if it is not matched within the top-X ranked results (e.g., Mullin et al., 2018). While our results provide match success and associated error rates for our validation tests, we recommend that internal validation tests within a researcher’s own catalogs be performed to ensure that an appropriate error rate is assumed for whatever computer vision system they use if they choose to use an error rate in this way. This is particularly important as there may be variables inherent within individual catalogs that may affect match success. If an error rate is not accepted, we recommend that a full catalog check still be completed to determine whether or not an individual should be added to a reference catalog. We do note however, that computer vision systems should not be treated as a second observer as these systems do not match fins. Instead, these systems sort and rank images of fins for faster matching by a human.
While our results are promising, there are several additional components of the photo-ID process that need to be examined in future studies. For example, the natural markings found along animals’ dorsal fins or other distinguishing features can change over time (e.g., Carlson et al., 1990; Blackmer et al., 2000). These changes can be minor, such as a new nick, or major, such as a mutilation due to an entanglement or boat strike. It is possible that images within our test catalogs and queries included images of individuals with changed fins, which could have affected our match rates. Future efforts should examine algorithm performance with varying degrees of fin changes given the acquisition of marks in marine mammals is a common occurrence through time (Dufault and Whitehead, 1995; Gowans and Whitehead, 2001; Wells, 2003; Auger- Méthé and Whitehead, 2007; Baird et al., 2008; Aschettino et al., 2012; Urian et al., 2015, Wells, 2018). Algorithm development should also focus on approaches to deal with changed fins. A well-developed neural network may be more robust against changes than the human eye that tends to focus on single attributes.
Another factor that should be considered in future studies is the necessity of cropping images prior to using them in the photo-ID matching process. In our survey, 71.62% of respondents (N = 53) reported that they manually crop their images before their matching process. This is another step in the photo-ID process that could be streamlined through computer vision systems. Given cropping is so prevalent in the photo-ID process (Urian et al., 2015), our study only assessed match success of algorithms tested using cropped images of dorsal fins (i.e., the original image was cropped so that at least 20% of the image pixels included the dorsal fin). Future tests should look at the performance of computer vision systems on both uncropped single-fin and multiple-fin images, as well as the possibility of adding automated cropping into the computer vision system itself. If the computer vision system can achieve high match success without the user having to manually crop images beforehand additional time savings could be achieved. Indeed the finFindR R application and Flukebook have cropping or fin ‘isolating’ capabilities built into their structure. In finFindR, the program implements a novel neural network architecture based on the “resnet” architecture (He et al., 2015) to autonomously identify fins in unedited images (Thompson et al., 2021). In Flukebook, fins are detected using a cascade of deep convolutional neural networks, which involves 1) whole-scene classifications looking for specific species or animals in an image, 2) object annotation bounding box locations, and 3) viewpoint, quality, and final species classifications for the candidate bounding boxes (Parham et al., 2018; Blount et al., 2019). Future tests should be performed to examine how match success may vary with these systems if uncropped images of individuals made up the reference catalog and/or query.
Thirty six different species were reported to be the species of focus for photo-ID research by our workshop survey respondents. The performance of these computer vision systems should be examined for other species for which dorsal fin photo-ID is used. While the finFindR R application has been used with other species such as short-finned pilot whales (Globicephala macrorhynchus) (Brill, 2021), spinner dolphins (Stenella longirostris longirostris) (Stack et al., 2020), and Indo-Pacific bottlenose dolphins (Tursiops aduncus) (Bonneville et al., 2021), and computer vision support is configured for 22 species in Flukebook, to our knowledge, all of the validation tests with dorsal fin images on the computer vision systems evaluated in this study have been performed using images of bottlenose dolphins. Mark acquisition rates and mark prevalence on dorsal fins vary by species. For these reasons, an algorithm that works well with one species may not work well with another species. For example, New Zealand common dolphins (Delphinus spp.) have a dorsal fin nick-and notch rate of just 46.5% (Hupman, 2016), which means that a large proportion of the population is not identifiable by nicks and notches alone. This species however does have a high rate of pigmentation patterns present on their dorsal fins (95%; Pawley et al., 2018), which could be used for identification through computer vision systems (Gilman et al., 2016). For these reasons and others mentioned above, we recommend that internal validation tests be performed for any study that uses computer vision systems to assist in their photo-ID process.
The computer vision systems examined in this study appear to have overcome many of the challenges that were present with the early computer vision systems developed to assist the photo-ID process (e.g., Finscan, Darwin), such as angle viewpoint and manual tracing of features. The program and/or algorithm a user chooses to use will depend on both on research needs and, as mentioned above, algorithm performance pertinent to one’s particular study species or population. For instance, Flukebook and the finFindR R application differ in several ways. While both are open-source systems that can be used to assist with photo-ID, Flukebook is hosted in the cloud and is designed to be a platform for curating and analyzing both photo-ID images and their metadata (Berger-Wolf et al., 2017; Blount et al., 2019). With this format, it is possible for registered users to compare images from selected photo-ID catalogs (with appropriate permissions) and connect with other researchers and citizen scientists when a possible match is found. Users can also obtain a meta-score and ranking based on results from >1 algorithm as described above, which may be useful for species such as New Zealand common dolphins who could benefit from both nick-and-notch and pigmentation pattern comparison. In addition, Flukebook allows users to examine temporal and spatial sighting histories of individuals and perform common analyses on their data such as determining coefficients of variation between individuals and deriving estimates of abundance through mark-recapture methods. Users must however include all of their data and metadata on the Flukebook website and update this information online whenever changes to their database are made. The finFindR R application, on the other hand, is a desktop application with an HTML-based user interface (Thompson et al., 2021). Images and metadata are locally-based, so users can only compare images from catalogs they upload into the program. This option may be preferred for research groups who already have well-established photo-ID processes and databases, prefer to keep their data locally sourced, and/or prefer to conduct independent analyses of their data. It also may be beneficial for research groups that deal with frequent changes to their reference catalogs and/or databases as new reference catalogs and queries can easily be uploaded for image comparisons. There are a growing number of computer vision systems available and being developed for photo-ID image comparison (e.g., Figure 3), thus users will need to determine what is most appropriate for their specific study species and research needs.
An added benefit of these systems is that they have the potential to ease cross-catalog comparisons in situations where adjacent or regional field sites are established but run by different labs/researchers. For example, both the Mid-Atlantic Bottlenose Dolphin Catalog (MABDC; Halpin et al., 2009; Urian, 2016) and the Gulf of Mexico Dolphin Identification System (GoMDIS; Halpin et al., 2009; Cush et al., 2019) curators use finFindR to assist with comparisons between bottlenose dolphin photo-ID catalogs that are contributed by different researchers and research programs. For instance, the GoMDIS curator recently used the finfindR R application to compare images between a catalog of dolphins from the mid Florida Keys and one from Biscayne Bay, Florida, USA. Seventeen of 18 matches were found in the first-ranked position (the 18th match was found in the 49th ranked position; image quality and contrast likely contributed to the low ranking of this image). All matches were confirmed by contributors for verification. Rise of the Machines workshop participants expressed a desire to have computer vision programs such as those examined in this study incorporated within existing data portals, such as OBIS-SEAMAP (Halpin et al., 2009), as they would allow for all image contributors to have access to the computer vision ranked comparisons, and would strengthen filtering of characteristics such as fin distinctiveness and image location, which would ideally allow for faster identifications. Efforts such as this, which are already present in Flukebook, could assist with determining individual animal movements over a broader scale and aid management decisions and conservation efforts.
The results from our study offer the first comprehensive examination into the performance and accuracy of computer vision algorithms designed to assist with the photo-ID process of bottlenose dolphins and can be used to gain trust by photo-ID researchers hesitant to use these systems. As photo-ID catalog sizes and regional studies increase, the use of computer assisted matching techniques becomes increasingly important (Beekmans et al., 2005). The introduction of digital photography into the photo-ID process in the early 2000s changed the behavior of photo-ID researchers allowing them to take many more images of individuals in the field than when they were employing slide film (Urian et al., 2015). This in turn, resulted in researchers having to spend more time processing and comparing images of unknown individuals to known individuals, with many labs experiencing processing backlogs, and increased the probability of misidentification errors (Bogucki et al., 2018; Franklin et al., 2020; Hillman et al., 2003). Computer vision systems, such as those examined here, have the potential to greatly reduce the time spent processing these data while maintaining high rates of match success, and therefore, should be considered as a tool to be used by dorsal fin photo-ID researchers to assist in their photo-ID process.
The data supporting the conclusions of this article (i.e., spreadsheets and R code) will be made available by the authors to qualified researchers upon request, without undue reservation. There are privacy and conservation concerns regarding sharing the raw image data; however, consideration will be made if proper data sharing agreements are signed. Requests to access the datasets should be directed to Reny Tyson Moore,cmVueXR5c29ubW9vcmVAZ21haWwuY29t.
The animal study was reviewed and approved by Mote Marine Laboratory Institutional Animal Care and Use Committee. The image data were collected under NMFS Scientific Research Permits No. 15543 and 20455.
RTM and RW conceptualized the study, while RTM, RW, and JH secured and managed funding for the work. RTM and KU organized the Rise of the Machines workshop, distributed the survey, and analysed survey results. RTM, KU, JA, CC, and RW drafted and reviewed workshop survey questions. JP, DB, JH, and JT developed and refined computer vision algorithms and hosting platforms for the purposes of this paper. RTM and JP conducted the experimental tests and summarized the results. RT drafted the manuscript and all authors provided feedback and edits on experimental tests and manuscript drafts. All authors have read and approved the final manuscript.
Portions of this work were supported under the Bureau of Ocean Energy Management contract M17AC00013, NOAA, the Batchelor Foundation, the Chicago Zoological Society, Dolphin Biology Research Institute, the Charles and Margery Barancik Foundation and Harbor Branch Oceanographic Institution/FAU.
JT is employed by Valdez AI Consulting.
The remaining authors declare that the research was conducted in the absence of any commercial or financial relationships that could be construed as a potential conflict of interest.
All claims expressed in this article are solely those of the authors and do not necessarily represent those of their affiliated organizations, or those of the publisher, the editors and the reviewers. Any product that may be evaluated in this article, or claim that may be made by its manufacturer, is not guaranteed or endorsed by the publisher.
We thank the Chicago Zoological Society’s Sarasota Dolphin Research Program (SDRP) staff members, interns, and volunteers who made this work possible by providing support and assistance in collecting and processing images both in the field and laboratory. We also thank the “Rise of the Machine” workshop presenters and attendees as well as all survey participants for providing insights into the current photo-ID process in our community. We specifically thank Danielle Waples and Kristi Fazioli for logistical support during the Rise of the Machines Workshop and Krystan Wilkinson for creating the figure of our study area.
The Supplementary Material for this article can be found online at: https://www.frontiersin.org/articles/10.3389/fmars.2022.849813/full#supplementary-material
ACDSee Photo Studio Professional (2018) © ACD Systems International Inc. Available at: https://acdid.acdsee.com/support/photo-studio-professional-2018.
Adams J. D., Speakman T., Zolman E., Schwacke L. H. (2006). Automating Image Matching, Cataloging, and Analysis for Photo-Identification Research. Aquat. Mammals 32 (3), 374. doi: 10.1578/AM.32.3.2006.374
Allen J. B., Weideman H. J., Tyson Moore R. B., Holmberg J., Stewart C. V., Urian K., et al. (2017). Advances in Automated Dorsal Fin Matching – Experimental Evaluation of a New Algorithm, in 22nd Biennial Conference on the Biology of Marine Mammals, Halifax, Nova Scotia, Canada.
Andreotti S., Holtzhausen P., Rutzen M., Meÿer M., van der Walt S., Herbst B., et al. (2018). Semi-Automated Software for Dorsal Fin Photographic Identification of Marine Species: Application to Carcharodon Carcharias. Marine Biodiversity 48 (3), 1655–1660. doi: 10.1007/s12526-017-0634-2
Aschettino J. M., Baird R. W., McSweeney D. J., Webster D. L., Schorr G. S., Huggins J. L., et al. (2012). Population Structure of Melon-Headed Whales (Peponocephala Electra) in the Hawaiian Archipelago: Evidence of Multiple Populations Based on Photo Identification. Marine Mammal Sci. 28 (4), 666–689. doi: 10.1111/j.1748-7692.2011.00517.x
Auger-Méthé M., Marcoux M., Whitehead H. (2011). Computer-Assisted Photo-Identification of Narwhals. Arctic 64 (3), 342–352.
Auger-Méthé M., Whitehead H. (2007). The Use of Natural Markings in Studies of Long-Finned Pilot Whales (Globicephala Melas). Marine Mammal Sci. 23 (1), 77–93. doi: 10.1111/j.1748-7692.2006.00090.x
Auguie B. (2017). “Gridextra: Miscellaneous Functions for “Grid” Graphics,” in R Package Version 2.3. Available at: https://CRAN.R-project.org/package=gridExtra.
Baird R. W., Webster D. L., Mahaffy S. D., McSweeney D. J., Schorr G. S., Ligon A. D. (2008). Site Fidelity and Association Patterns in a Deep-Water Dolphin: Rough-Toothed Dolphins (Steno Bredanensis) in the Hawaiian Archipelago. Marine Mammal Sci. 24 (3), 535–553. doi: 10.1111/j.1748-7692.2008.00201.x
Beekmans B. W., Whitehead H., Huele R., Steiner L., Steenbeek A. G. (2005). Comparison of Two Computer-Assisted Photo-Identification Methods Applied to Sperm Whales (Physeter Macrocephalus). Aquat. Mammals 31 (2), 243. doi: 10.1578/AM.31.2.2005.243
Berger-Wolf T. Y., Rubenstein D. I., Stewart C. V., Holmberg J. A., Parham J., Menon S., et al. (2017). Wildbook: Crowdsourcing, Computer Vision, and Data Science for Conservation, arXiv preprint arXiv:1710.08880.
Blackmer A. L., Anderson S. K., Weinrich M. T. (2000). Temporal Variability in Features Used to Photo-Identify Humpback Whales (Megaptera novaeangliae). Marine Mammal Sci. 16 (2), 338–354. doi: 10.1111/j.1748-7692.2000.tb00929.x
Blount D., Gero S., Van Oast J., Parham J., Kingen C., Scheiner B., et al. (2022a). Flukebook: An Open Source AI Platform for Cetacean Photo Identification (Portland, OR, USA: Mammalian Biology, Special Issue on Individual Identification and Photographic Techniques in Mammalian Ecological and Behavioural Research).
Blount D., Holmberg J., Minton G. (2018). Flukebook – A Tool for Cetacean Photo Identification, Data Archiving and Automated Fluke Matching (Portland, OR, USA:International Whaling Commission report SC/67B/PH/03).
Blount D., Holmberg J., Minton G. (2019). Flukebook – Recent Advances for Cetacean Photo Identification and Data Archiving Including Automated Fluke Matching (International Whaling Commission report SC/68A/SH/07).
Blount D., Holmberg J., Parham J., Levenson J. J., Gero S. (2022b). Comparison of Three Individual Identification Algorithms for Sperm Whales (Physeter Microcephalus) After Automated Detection bioRxiv, 2021.12.22.473895. doi: 10.1101/2021.12.22.473895
Blount D., Minton G., Khan C., Levenson J., Dulau V., Gero S., et al. (2020). Flukebook – Continuing Growth and Technical Advancement for Cetacean Photo Identification and Data Archiving, Including Automated Fin, Fluke, and Body Matching (International Whaling Commission report SC/68B/PH/06).
Bogucki R., Cygan M., Khan C. B., Klimek M., Milczek J. K., Mucha M. (2018). Applying Deep Learning to Right Whale Photo Identification. Conserv. Biol. 33 (3), 676–684. doi: 10.1111/cobi.13226
Bonneville C. D., Derville S., Luksenburg J. A., Oremus M., Garrigue C. (2021). Social Structure, Habitat Use and Injuries of Indo-Pacific Bottlenose Dolphins (Tursiops Aduncus) Reveal Isolated, Coastal, and Threatened Communities in the South Pacific. Front. Marine Sci. 8, 52. doi: 10.3389/fmars.2021.606975
Brill D. (2021). Examining the Feasibility of Using Photo-Identification Studies to Assist in Investigations of Short-Finned Pilot Whale (Globicephala Macrorhynchus) Strandings Along the US Southeast Coast (Durham, NC USA:Masters of Environmental Management, Nicholas School of the Environment, Duke University).
Calambokidis J., Barlow J., Flynn K., Dobson E., Steiger G. H. (2017). Update on Abundance, Trends, and Migrations of Humpback Whales Along the US West Coast (International Whaling Commission report SC/A17/NP/13).
Caldwell D. K. (1955). Evidence of Home Range of an Atlantic Bottlenose Dolphin. J. Mammalogy 36 (2), 304–305. doi: 10.2307/1375913
Carlson C. A., Mayo C. A., Whitehead W. (1990). Changes in the Ventral Fluke Pattern of the Humpback Whale (Megaptera Novaeangliae) and Its Effects on Matchings; Evaluation of Its Significance to Photo-Identification Research. Rep. Int. Whale Commun. Special Issue 12), 105–111.
Cheeseman T., Southerland K., Park J., Olio M., Flynn K., Calambokidis J., et al. (2021). Advanced Image Recognition: A Fully Automated, High-Accuracy Photo-Identification Matching System for Humpback Whales. Mamm. Biol., 1–15. doi: 10.1007/S42991-021-00180-9
Crall J. P., Stewart C. V., Berger-Wolf T. Y., Rubenstein D. I., Sundaresan S. R. (2013). “Hotspotter—Patterned Species Instance Recognition,” in 2013 IEEE Workshop on Applications of Computer Vision (WACV). Clearwater Beach, FL, USA:IEEE, pp. 230–237.
Cush C. C., McBride-Kerbert S., Wells R. S., Adams J., Fuijioka E., Urian K., et al. (2019). “Gulf of Mexico Dolphin Identification System (GoMDIS)- A Collaborative Program to Better Define Bottlenose Dolphin (Tursiops Truncatus) Movements,” in World Marine Mammal Conference. 9–12(Barcelona, Spain).
Dufault S., Whitehead H. (1995). An Assessment of Changes With Time in the Marking Patterns Used for Photoidentification of Individual Sperm Whales, Physeter Macrocephalus. Marine Mammal Sci. 11 (3), 335–343. doi: 10.1111/j.1748-7692.1995.tb00289.x
Franklin T., Franklin W., Brooks L., Harrison P., Burns D., Holmberg J., et al. (2020). Photo-Identification of Individual Southern Hemisphere Humpback Whales (Megaptera Novaeangliae) Using All Available Natural Marks: Managing the Potential for Misidentification. J. Cetacean Res. Manage 21 (1), 71–83. doi: 10.47536/jcrm.v21i1.186
Friday N., Smith T. D., Stevick P. T., Allen J. (2000). Measurement of Photographic Quality and Individual Distinctiveness for the Photographic Identification of Humpback Whales, Megaptera Novaeangliae. Marine Mammal Sci. 16 (2), 355–374. doi: 10.1111/j.1748-7692.2000.tb00930.x
Gilman A., Hupman K., Stockin K. A., Pawley M. D. (2016). “Computer-Assisted Recognition of Dolphin Individuals Using Dorsal Fin Pigmentations,” in 2016 International Conference on Image and Vision Computing New Zealand (IVCNZ) Palmerston North, New Zealand: IEEE, pp. 1–6.
Glennie R., Thomas L., Speakman T., Garrison ,. L., Takeshita R., Schwacke L. (2021). Estimating Spatially-Varying Density and Time-Varying Demographics With Open Population Spatial Capture-Recapture: A Photo-ID Case Study on Bottlenose Dolphins in Barataria Bay, Louisiana, USA, arXiv preprint arXiv: 2106.09579. doi: 10.48550/arXiv.2106.09579
Gowans S., Whitehead H. (2001). Photographic Identification of Northern Bottlenose Whales (Hyperoodon Ampullatus): Sources of Heterogeneity From Natural Marks. Marine Mammal Sci. 17 (1), 76–93. doi: 10.1111/j.1748-7692.2001.tb00981.x
Halpin P. N., Read A. J., Fujioka E., Best B. D., Donnelly B., Hazen L. J., et al. (2009). OBIS-SEAMAP: The World Data Center for Marine Mammal, Sea Bird, and Sea Turtle Distributions. Oceanography 22 (2), 104–115. doi: 10.5670/oceanog.2009.42
He K., Zhang X., Ren S., Sun J. (2015). Deep Residual Learning for Image Recognition, in Proceedings of the IEEE Conference on Computer Vision and Pattern Recognition. ArXiv Preprint 770–778.
Hillman G. R., Kehtarnavaz N., Wursig B., Araabi B., Gailey G., Weller D., et al. (2002). ““Finscan”, a Computer System for Photographic Identification of Marine Animals,” in Proceedings of the Second Joint 24th Annual Conference and the Annual Fall Meeting of the Biomedical Engineering Society. Engineering in Medicine and Biology Houston, TX, USA: IEEE, Vol. 2, 1065–1066 .
Hillman G., Würsig B., Gailey G., Kehtarnavaz N., Drobyshevsky A., Araabi B. (2003). Computer-Assisted Photo-Identification of Individual Marine Vertebrates: A Multi-Species System. Aquat. Mamm. 29, 117–123. doi: 10.1578/016754203101023960
Huele R., De Haes H. U., Ciano J. N., Gordon J. (2000). Finding Similar Trailing Edges in Large Collections of Photographs of Sperm Whales. J. Cetacean Res. Manage. 2 (3), 173–176.
Hupman K. (2016). Photo-Identification and its Application to Gregarious Dolphins: Common Dolphins (Delphinus Sp.) in the Hauraki Gulf, New Zealand. PhD Thesis (Auckland, New Zealand: Massey University).
Irvine A. B., Scott M. D., Wells R. S., Kaufmann J. H. (1981). Movements and Activities of the Atlantic Bottlenose Dolphin, Tursiops Truncatus, Near Sarasota, Florida. Fishery Bull. 79 (4), 671–688.
Irvine B., Wells R. S. (1972). Results of Attempts to Tag Atlantic Bottlenosed Dolphins (Tursiops Truncatus). Cetology 13, 1–5.
Jablons Z. (2016). Identifying Humpback Whale Flukes by Sequence Matching of Trailing Edge Curvature (Troy, New York: Department of Computer Science, Rensselaer Polytechnic Institute).
Kelly M. J. (2001). Computer-Aided Photograph Matching in Studies Using Individual Identification: An Example From Serengeti Cheetahs. J. Mammalogy 82 (2), 440–449. doi: 10.1644/1545-1542(2001)082<0440:CAPMIS>2.0.CO;2
Lockyer C. H., Morris R. J. (1990). Some Observations on Wound Healing and Persistence of Scars in Tursiops Truncatus. Rep. Int. Whaling Commission 12, 113–118.
Mann J. (2000). “Unraveling the Dynamics of Social Life: Long-Term Studies and Observational Methods,” in Cetacean Societies: Field Studies of Dolphins and Whales. Eds. Mann J., Connor R. C., Tyack P. L., Whitehead H. (Chicago: University of Chicago Press), 45–64.
Mann J. (2018). Use of Machine-Learning in Individual Identification and Tracking of Wildlife (San Francisco: Google Next). Available at: https://www.youtube.com/watch?v=O7iT1INWrqoandfeature=youtu.beandt=2m13s.
McCann S., Lowe D. G. (2012). “Local Naive Bayes Nearest Neighbor for Image Classification,” in 2012 IEEE Conference on Computer Vision and Pattern Recognition. Providence, RI, USA:IEEE. pp. 3650–3656.
McDonald T. L., Hornsby F. E., Speakman T. R., Zolman E. S., Mullin K. D., Sinclair C., et al. (2017). Survival, Density, and Abundance of Common Bottlenose Dolphins in Barataria Bay (USA) Following the Deepwater Horizon Oil Spill. Endangered Species Res. 33, 193–209. doi: 10.3354/esr00806
Mullin K. D., Barry K., McDonald T., Morey J., Quigley B., Ronje E., et al. (2018). Assessment of the Overlap of Terrebonne-Timbalier Bay and Barataria Bay Common Bottlenose Dolphins (Tursiops Truncatus) Stocks Based on Photo-Identification of Individual Dolphins. NOAA Technical Memorandum NMFS-SEFSC-729 29. doi: 10.25923/8g4y-dg29
O’Brien J., Berrow S., Ryan C., McGrath D., O’Connor I., Giovanna P., et al. (2009). A Note on Long-Distance Matches of Bottlenose Dolphins (Tursiops Truncatus) Around the Irish Coast Using Photo-Identification. J. Cetacean Res. Manage. 11 (1), 71–76.
Ottensmeyer C. A., Whitehead H. (2003). Behavioural Evidence for Social Units in Long-Finned Pilot Whales. Can. J. Zool. 81, 1327–1338. doi: 10.1139/z03-127
Parham J., Stewart C., Crall J., Rubenstein D., Holmberg J., Berger-Wolf T. (2018). “An Animal Detection Pipeline for Identification,” in 2018 IEEE Winter Conference on Applications of Computer Vision (WACV). Lake Tahoe, NV, USA: IEEE. pp. 1075–1083.
Pawley M. D. M., Hupman K. E., Stockin K. A., Gilman (2018). Examining the Viability of Dorsal Fin Pigmentation for Individual Identification of Poorly-Marked Delphinids. Sci. Rep. 8, 12593. doi: 10.1038/s41598-018-30842-7
Photo ID Ninja - Dolphin Recognition Web Application. Available at: http://photoid.ninja/.
Rayment W., Webster T. (2009). Observations of Hector’s Dolphins (Cephalorhynchus Hectori) Associating With Inshore Fishing Trawlers at Banks Peninsula, New Zealand. New Z. J. Marine Freshwater Res. 43 (4), 911–916. doi: 10.1080/00288330909510049
R Core Team (2020) R: A Language and Environment for Statistical Computing. R Foundation for Statistical Computing. Available at: https://www.R-project.org.
Rosel P. E., Mullin K. D., Garrison L., Schwacke L., Adams J., Balmer B., et al. (2011). Photo-Identification Capture-Mark-Recapture Techniques for Estimating Abundance of Bay, Sound and Estuary Populations of Bottlenose Dolphins Along the US East Coast and Gulf of Mexico: A Workshop Report. NOAA Technical Memorandum NMFS-SEFSC 621, 30.
Slooten E., Dawson S. M., Lad F. (1992). Survival Rates of Photographically Identified Hector Dolphins From 1984 to 1988. Marine Mammal Sci. 8, 327–343. doi: 10.1111/j.1748-7692.1992.tb00049.x
Stack S. H., Olson G. L., Neamtu V., Machernis A. F., Baird R. W., Currie J. J. (2020). Identifying Spinner Dolphin Stenella Longirostris Longirostris Movement and Behavioral Patterns to Inform Conservation Strategies in Maui Nui, Hawai’i. Marine Ecol. Prog. Ser. 644, 187–197. doi: 10.3354/meps13347
Stevick P. T., Palsbøll P. J., Smith T. D., Bravington M. V., Hammond P. S. (2001). Errors in Identification Using Natural Markings: Rates, Sources, and Effects on Capture Recapture Estimates of Abundance. Can. J. Fisheries Aquat. Sci. 58 (9), 1861–1870. doi: 10.1007/s13592-022-00919-4
Thompson J. W., Zero V. H., Schwacke L. H., Speakman T. R., Quigley B. M., Morey J. S., et al. (2021). Finfindr: Automated Recognition and Identification of Marine Mammal Dorsal Fins Using Residual Convolutional Neural Networks. Marine Mammal Sci 38 (1), 139–50. doi: 10.1111/mms.12849
Tyson R. B., Nowacek S. M., Nowacek D. P. (2011). Community Structure and Abundance of Bottlenose Dolphins Tursiops Truncatus in Coastal Waters of the Northeast Gulf of Mexico. Marine Ecol. Prog. Ser. 438, 253–265. Urian, K. 2016. MABDC bottlenose dolphin sightings. Data available for download from OBIS-SEAMAP (http://seamap.env.duke.edu/dataset/663). doi: 10.3354/meps09292
Urian K., Gorgone A., Read A., Balmer B., Wells R. S., Berggren P., et al. (2015). Recommendations for Photo-Identification Methods Used in Capture-Recapture Models With Cetaceans. Marine Mammal Sci. 31 (1), 298–321. doi: 10.1111/mms.12141
Urian K. W., Hohn A. A., Hansen L. J. (1999). Status of the Photo-Identification Catalog of Coastal Bottlenose Dolphins of the Western North Atlantic: Report of a Workshop of Catalog Contributors. U.S. Department of Commerce, NOAA Technical Memorandum NMFS-SEFSC-425 22 pp.
Urian K. W., Waples D. M., Tyson R. B., Hodge L. E., Read A. J. (2014). Abundance of Bottlenose Dolphins (Tursiops Truncatus) in Estuarine and Near-Shore Waters of North Carolina, USA. J. North Carolina Acad. Sci. 129 (4), 165–171. doi: 10.7572/2167-5880-129.4.165
Urian K. (2016). MABDC Bottlenose Dolphin Sightings. Data downloaded from OBIS-SEAMA (http://seamap.env.duke.edu/dataset/).
Weideman H. J. (2019). Contour-Based Instance Recognition of Animals (Troy, New York: Department of Computer Science, Rensselaer Polytechnic Institute).
Weideman H. J., Jablons Z. M., Holmberg J., Flynn K., Calambokidis J., Tyson R. B., et al. (2017). “Integral Curvature Representation and Matching Algorithms for Identification of Dolphins and Whales,” in Proceedings of the IEEE International Conference on Computer Vision Workshops. 2831–2839.
Weideman H., Stewart C., Parham J., Holmberg J., Flynn K., Calambokidis J., et al. (2020). “Extracting Identifying Contours for African Elephants and Humpback Whales Using a Learned Appearance Model,” in Proceedings of the IEEE/CVF Winter Conference on Applications of Computer Vision. 1276–1285.
Weinstein B. G. (2018). A Computer Vision for Animal Ecology. J. Anim. Ecol. 87 (3), 533–545. doi: 10.1111/1365-2656.12780
Wells R. S. (2003). “Dolphin Social Complexity: Lessons From Long-Term Study and Life History,” in Animal Social Complexity: Intelligence, Culture, and Individualized Societies. Eds. de Waal F. B. M., Tyack P. L. (Cambridge: Harvard University Press), p. 32–56.
Wells R. S. (2009). Learning From Nature: Bottlenose Dolphin Care and Husbandry. Zoo Biol. 28, 1–17. doi: 10.1002/zoo.20252
Wells R. S. (2014). “Social Structure and Life History of Common Bottlenose Dolphins Near Sarasota Bay, Florida: Insights From Four Decades and Five Generations,” in Primates and Cetaceans: Field Research and Conservation of Complex Mammalian Societies, Primatology Monographs. Eds. Yamagiwa J., Karczmarski L. (Tokyo, Japan: Springer), Pp. 149–172. doi: 10.1007/978-4-431-54523-1_8
Wells R. S. (2018). “Identification Methods,” in Encyclopedia of Marine Mammals, 3rd Ed. Eds. Würsig B., Thewissen J. G. M., Kovacs K. (San Diego, CA: Acad. Press/Elsevier), p. 503–509.
Wells R. S., Irvine A. B., Scott M. D. (1980). “The Social Ecology of Inshore Odontocetes,” in Cetacean Behavior: Mechanisms and Functions, vol. 463 . Ed. Herman L. M. (New York: J.Wiley and Sons), p. 263–317.
Wells R. S., Scott M. D. (1990). Estimating Bottlenose Dolphin Population Parameters From Individual Identification and Capture-Release Techniques. Rep. Int. Whaling Commission 12, 407–415.
Wells R. S., Scott M. D., Irvine A. B. (1987). “The Social Structure of Free-Ranging Bottlenose Dolphins,” in Current mammalogy (Boston, MA: Springer), 247–305.
Whitehead H. (1990). Computer Assisted Individual Identification of Sperm Whale Flukes. Rep. Int. Whaling Commission 12, 71–77.
Whitehead H., Christal J., Dufault S. (1997). Past and Distant Whaling and the Rapid Decline of Sperm Whales Off the Galapagos Islands. Conserv. Biol. 11 (6), 1387–1396. doi: 10.1046/j.1523-1739.1997.96246.x
Wickham H., Averick M., Bryan J., Chang W., McGowan L. D. A., François R., et al. (2019). Welcome to the Tidyverse. J. Open Source Software 4 (43), 1686. doi: 10.21105/joss.01686
Wilke C. O., Wickham H., Wilke M. C. O. (2019)Package ‘Cowplot’. Streamlined Plot Theme and Plot Annotations for ‘Ggplot2. R Package Version 1.0.0. Available at: https://CRAN.R-project.org/package=cowplot.
Wilkin D. J., Debure K. R., Roberts Z. W. (1998). “Query by Sketch in DARWIN: Digital Analysis to Recognize Whale Images on a Network,” in Storage and Retrieval for Image and Video Databases VII, vol. Vol. 3656. (San Jose, CA, USA:International Society for Optics and Photonics), 41–48. doi: 10.1117/12.333870
Wilson B., Hammond P. S., Thompson P. M. (1999). Estimating Size and Assessing Trends in a Coastal Bottlenose Dolphin Population. Ecol. Appl. 9, 288–300. doi: 10.1890/1051-0761(1999)009[0288:ESAATI]2.0.CO;2
Keywords: photographic-identification, photo-id, computer vision, finFindR, CurvRank, Flukebook, bottlenose dolphin, Tursiops truncatus
Citation: Tyson Moore RB, Urian KW, Allen JB, Cush C, Parham JR, Blount D, Holmberg J, Thompson JW and Wells RS (2022) Rise of the Machines: Best Practices and Experimental Evaluation of Computer-Assisted Dorsal Fin Image Matching Systems for Bottlenose Dolphins. Front. Mar. Sci. 9:849813. doi: 10.3389/fmars.2022.849813
Received: 06 January 2022; Accepted: 11 March 2022;
Published: 07 April 2022.
Edited by:
Lars Bejder, University of Hawaii at Manoa, United StatesReviewed by:
Krista Elena Nicholson, Murdoch University, AustraliaCopyright © 2022 Tyson Moore, Urian, Allen, Cush, Parham, Blount, Holmberg, Thompson and Wells. This is an open-access article distributed under the terms of the Creative Commons Attribution License (CC BY). The use, distribution or reproduction in other forums is permitted, provided the original author(s) and the copyright owner(s) are credited and that the original publication in this journal is cited, in accordance with accepted academic practice. No use, distribution or reproduction is permitted which does not comply with these terms.
*Correspondence: Reny B. Tyson Moore, cmVueXR5c29ubW9vcmVAZ21haWwuY29t
Disclaimer: All claims expressed in this article are solely those of the authors and do not necessarily represent those of their affiliated organizations, or those of the publisher, the editors and the reviewers. Any product that may be evaluated in this article or claim that may be made by its manufacturer is not guaranteed or endorsed by the publisher.
Research integrity at Frontiers
Learn more about the work of our research integrity team to safeguard the quality of each article we publish.