 Aislinn Fox
 Brett D. Walker
94% of researchers rate our articles as excellent or good
Learn more about the work of our research integrity team to safeguard the quality of each article we publish.
Find out more
ORIGINAL RESEARCH article
Front. Mar. Sci., 23 May 2022
Sec. Marine Biogeochemistry
Volume 9 - 2022 | https://doi.org/10.3389/fmars.2022.846025
This article is part of the Research TopicNatural and Artificial Radionuclides as Tracers of Ocean ProcessesView all 12 articles
The Canadian Arctic is warming three times faster than the rest of the planet. The impact of climate change on the Arctic carbon cycle, and in particular for Baffin Bay, remains poorly constrained. Sinking particulate organic matter (POMsink) is a key component of the biological carbon pump and provides a direct linkage between surface productivity and the preservation of carbon in marine sediments. While POMsink provides a rapid POM shunt to the deep ocean (days) the majority of marine POM is suspended (POMsusp) persists for years in the water column. Stable carbon (δ13C), nitrogen (δ15N) and radiocarbon (Δ14C) measurements are powerful tools for evaluating sources and cycling of POM. In this study, we measure depth-integrated (0-400m) POMsusp stable carbon (δ13C), nitrogen (δ15N) and radiocarbon (Δ14C) values at 11 stations in Baffin Bay. We use POM C:Na ratios to evaluate its diagenetic state. POMsusp δ13C and δ15N values ranged from −21.6‰ to −29.5‰, and +3.84‰ to +7.21‰, respectively. POMsusp Δ14C values ranged from −41.8‰ to +76.8‰. Together, our results suggest Baffin Bay POMsusp has multiple carbon and nitrogen sources. POMsusp δ13C and Δ14C are strongly correlated to surface salinity, indicating surface water has a strong influence on POMsusp isotopic composition and 14C-age. POMsusp from coastal Greenland stations have similar Δ14C values to surface dissolved inorganic carbon (DIC) and POM concentrations, consistent with primary production as the predominant POMsusp source in Eastern Baffin Bay. Positive POMsusp Δ14C values in central Baffin Bay suggest an accumulation of atmospheric “bomb” 14C in the sub-polar gyre. POMsusp exiting Davis Strait via the Baffin Island Current was determined to have a significant degraded, resuspended sediment component. Finally, POMsusp δ15N values highlight two distinct N sources in Baffin Bay: Pacific and Arctic nutrients at Northern gateway stations vs. the influx of Atlantic nutrients via Davis Strait along coastal Greenland. Overall, these first Baffin Bay POMsusp Δ14C values provide useful baseline data for rapidly changing Arctic ecosystem.
Particulate organic matter (POM) is one of the most important and biologically active reservoirs of carbon and nitrogen in the oceans. Whereas the POM pool (30 ± 5 GtC, ~2.3 GtN) is smaller than that of dissolved organic matter (~662 GtC, 32-77GtN) and dissolved inorganic carbon (DIC; 38,000 GtC), marine POM cycles rapidly (Hansell et al., 2009; Sarmiento, 2013; Walker et al., 2016; Beaupré, 2019). POM is operationally defined as all organic matter retained by a 0.1µm filter. However, studies typically employ 2.0µm quartz or 0.7µm glass fiber filters as they can be combusted prior to collection. POM therefore includes all living marine organisms larger than a bacterial cell, but approximately 90% of POM is non-living detritus (Cauwet, 1981; Volkman and Tanoue, 2002). POM is produced by primary producers via photosynthetic carbon fixation in the euphotic zone. The re-packaging of phytoplankton through zooplankton heterotrophy results in rapid export of sinking POM (POMsink) to the seafloor. Commonly known as the “biological carbon pump” (BCP), POMsink is exported to the sediments at rates of 2.8-5.7 GtC yr-1 (Buesseler et al., 2020). However, only a small portion of POMsink reaches the sediment as most is remineralized to CO2 or transformed to dissolved organic matter (DOM) via heterotrophic microbes prior to burial (Smith et al., 1992; Denman et al., 2007). Approximately ~90% of recently deposited POM in sediments is remineralized at the sediment/water interface. Nevertheless, POM burial at rates of 0.2 to 0.4 GtC yr-1 allows for the long-term sequestration of atmospheric CO2 (Passow and Carlson, 2012; Middelburg, 2019). The efficiency of the BCP varies with the availability of light, nutrients, sea surface temperature (SST), resident phytoplankton and zooplankton communities and polar sea-ice conditions (Honjo et al., 2010). Most BCP studies have focused on POMsink as the main carbon burial vector. However, recent work suggests small phytoplankton cells found in the suspended POM pool (POMsusp) are important contributors to the BCP (Richardson and Jackson, 2007; Close et al., 2013).
Stable carbon (δ13C) and nitrogen (δ15N) isotope measurements are useful tools for understanding organic matter sources and cycling. Whereas historical POM cycling studies relied on time-intensive and laborious deployment of sediment traps and mooring time-series, isotopic measurements provide detailed evidence for physical/biological processes and controlling POM cycling rates without the inherent need for long-term deployments and repeat study. It should be noted that long-term deployments provide information about temporal evolution, while CTD cast sampling reflects a short temporal window “snap shot” of POM cycling. POM δ13C and δ15N inform us of organic matter sources (e.g., terrestrial vs. marine) as well as biological processes (autotrophy vs. heterotrophy), with isotopic ratios being controlled by mass-dependent fractionation via carbon and nitrogen fixation pathways, trophic level enrichment, and nutrient sources (Descolas-Gros and Fontugne, 1990; Rau et al., 1992; Williams et al., 1992; Sigman and Casciotti, 2001; Fawcett et al., 2011). Marine phytoplankton δ13C and δ15N show a wide range of values (from −35‰ to −15‰ and −1‰ to +10‰, respectively). POM δ13C values in temperate waters typically range between −18‰ and −22‰, but more negative values are observed in polar regions as a result of temperature-dependent fractionation (Rau et al., 1982; Goericke and Fry, 1994).
In Baffin Bay, possible POMsusp δ13C sources include: i) slow-growing marine phytoplankton in colder, fresher waters (−27 to −30‰; Brown et al., 2014), ii) fast-growing phytoplankton in warmer, fresher waters affected by glacial meltwater (−21.8 to −24‰; Limoges et al., 2020) iii) canonical marine plankton values for this region (−24 to −26‰; Goericke and Fry, 1994), iv) sea-ice algae (−20 to −17‰; Tamelander et al., 2006; Roy et al., 2015; De La Vega et al., 2019), v) glacial run-off POM (−28.5‰; Holding et al., 2017) and vi) terrestrial plants (mosses, lichen, grasses; −28 to −20‰; Lee et al., 2009). POMsusp δ15N values are typically associated with nutrient sources (nitrate) fueling primary production, or the predominant mode of autotrophic or heterotrophic metabolism. For example, nitrate δ15N (δ15NO3) in the surface ocean has a large range (+2 to +20‰; Rafter et al., 2019), and is largely determined by nutrient availability and biological processes fractionating the surface nitrate pool (e.g., assimilation vs. denitrification and remineralization). Probable δ15NO3 signatures that can be incorporated into surface POM δ15N in Baffin Bay include nitrate from: the Atlantic Ocean (+4 to +6‰; Sherwood et al., 2021), the Pacific Ocean via the CAA (+7 to +8‰; Brown et al., 2015; Granger et al., 2018), and the Arctic Ocean (+5 to +7‰; Fripiat et al., 2018; Rafter et al., 2019).
Radiocarbon (Δ14C) measurements serve as both a carbon source indicator (e.g. fossil vs. modern vs. atmospheric “bomb” carbon) and as a geochronometer (via radioactive decay). In addition to naturally produced 14C in the atmopshere, above-ground thermonuclear weapons testing in 1960s resulted in an atmospheric “bomb peak” that has allowed Δ14C to be used as a modern tracer of atmospheric carbon on short timescales. Previous studies have used POM Δ14C and stable isotope measurements of POM to evaluate POM cycling rates, and relative contributions of allochthonous vs. autochthonous detrital materials in a variety of systems. A study of size-fractionated POMsusp Δ14C from the California Current upwelling system showed that while most POMsusp is comprised of recently fixed photosynthetic material, the presence of negative POMsusp Δ14C values suggested contributions of pre-aged, re-suspended sediments to POMsusp in coastal systems (Walker et al., 2014). Hwang and co-workers (2010) used POMsink Δ14C and %Al values to estimate the global contribution of pre-aged, continental margin material to open ocean POM.
POM is also a complex geochemical mixture. Compound class separations of total lipid extracts (TLE), acid soluble (AS) and acid-insoluble (AI) fractions suggest POM comprises materials with heterogeneous 14C-ages and chemical composition. Here TLE- and AI-POM are “pre-aged” and molecularly uncharacterized material, whereas AS-POM appears to be rich in biomolecules and has a Δ14C signature similar to surface DIC throughout the water column (Hwang and Druffel, 2003; Hwang and Druffel, 2006; Roland et al., 2008). Previous work has also demonstrated a clear compositional and 14C-age difference between large vs. small POM size fractions. Whereas POMsink and large POM size-fractions (dominated by large autotrophs) are biochemically “fresh” and have younger 14C-ages, most evidence suggests POMsusp, and small POM size-fractions (dominated by re-suspended sediments and microbial cells) are “degraded” and have older 14C-ages (Walker et al., 2014; Benner and Amon, 2015; Walker et al., 2016). Whereas POMsusp can appear 14C-modern and chemically “fresh” if derived from recent plankton blooms (e.g., Walker et al., 2014), coastal POMsusp is also considered a source of 14C-depleted OM to the open ocean (Bauer and Druffel, 1998; Hwang et al., 2006; Roland et al., 2008).
Declining sea-ice cover and a prolonged “open water” season may cause considerable increases in primary production across the Arctic, with consequences for POM cycling (Arrigo and Dijken, 2015). Previous POM studies in Baffin Bay have focused on deployment of sediment traps to estimate export production and POM flux in the high-productivity North Water Polynya. These studies suggest high rates of POM export in Norther Baffin bay (5.9 g C m−2 yr−1) and seasonal variance in POM export. Most POM export occurs in the Spring and some retention of POM in the upper water column (100m) has been observed in late summer (Caron et al., 2004; Lalande et al., 2009). However, these flux estimates do not provide us with an understanding of the biological lability or geochemical impact of POM exported to deep Baffin Bay. There is a paucity of Arctic POM isotopic data and, to the best of our knowledge, no POM Δ14C data exist for Baffin Bay. Here we use the first POMsusp Δ14C values with contemporaneous C:Na, δ13C and δ15N values to evaluate POM sources and cycling in Baffin Bay.
Here we briefly describe the surface currents present in Baffin Bay and origin of surface waters sampled during the study (Figure 1). Baffin Bay is a large marginal sea lying between Kalaaliit Nunaat (Greenland) and Qikiqtaaluk (Baffin Island), connected by straits to the Arctic Ocean and the Atlantic Ocean. Baffin Bay is characterized by dynamic surface currents environment, with a stark contrast in oceanographic conditions (e.g., SST, salinity, fluorescence, and nutrients) in Western vs. Eastern Baffin Bay (Figures 2A, B; S1–4). The Baffin Island Current (BIC) flows southward along the Baffin Island shelf and slope before exiting Davis Strait into the Labrador Sea. The BIC is composed of cool, fresh Arctic Water (AW) from recent sea-ice melt from the Arctic Ocean and Canadian Arctic Archipelago (CAA) which enters Baffin Bay via several northern gateways (NG) – Nares Strait, Jones Strait, and Lancaster Sound. In Eastern Baffin Bay, relatively warm and salty waters enter from the North Atlantic, forming the West Greenland Current (WGC), and flow north along the Greenland shelf. The WGC is a continuation of the East Greenland Current (EGC), composed of Arctic waters flowing southwards along the eastern coast of Greenland, with contributions from the warm and saline Irminger Current in the North Atlantic (Hamilton and Wu, 2013). As the WGC progresses northward, it becomes fresher and cooler, due to mixing with glacial meltwater and mixing with central Baffin Bay water (Münchow et al., 2015). The WGC terminates near Smith Sound (75°N-77°N), before joining Arctic Water outflows from the CAA to form the BIC (Melling et al., 2001; Tang et al., 2004). Together, the northwards-flowing WGC and southwards-flowing BIC form a cyclonic circulation pattern and sub-polar gyre in Baffin Bay. The eastern side of Baffin Bay also receives more meteoric freshwater input from melting of the Greenland ice sheet (Hamilton and Wu, 2013). This difference in East vs. West surface water properties results in differences in phytoplankton communities, sea ice conditions and rates of primary production in the region. For example, the timing and intensity of phytoplankton blooms is different on the Eastern vs. Western side of Baffin Bay and can clearly be seen in fluorescence values of the deep chlorophyll-a maximum (DCM; Figure 2C). The depth of the DCM in our sample stations ranged from 13 to 44 metres, with an average of depth of 32 ± 10 metres (n=11; Figure S3). Annual POM flux is generally higher on the eastern side of northern Baffin Bay relative to the western side (Lalande et al., 2009). It is important to note that Baffin Bay is a marginal sea ice zone. The region experiences full sea-ice coverage from December to April. Due to the relatively warm West Greenland Current, ice cover decreases earlier along the Greenland coast than on the western side of Baffin Bay (Tang et al., 2004). By late summer, Baffin Bay is typically clear of extensive sea-ice, although icebergs are common, especially in proximity to fjords.

Figure 1 Area Map of Canadian Arctic. White arrows indicate simplified surface currents and directions. The Western Greenland Current (WGC) and Baffin Island Currents (BIC) are specifically indicated. Locations of Baffin Bay gateways – Davis Strait (DS), Lancaster Sound (LS), Jones Sound (JS), and Nares Strait (NS) – are indicated with black arrows. Small black dots in Baffin Bay represent POM sampling locations from the 2019 research cruise.
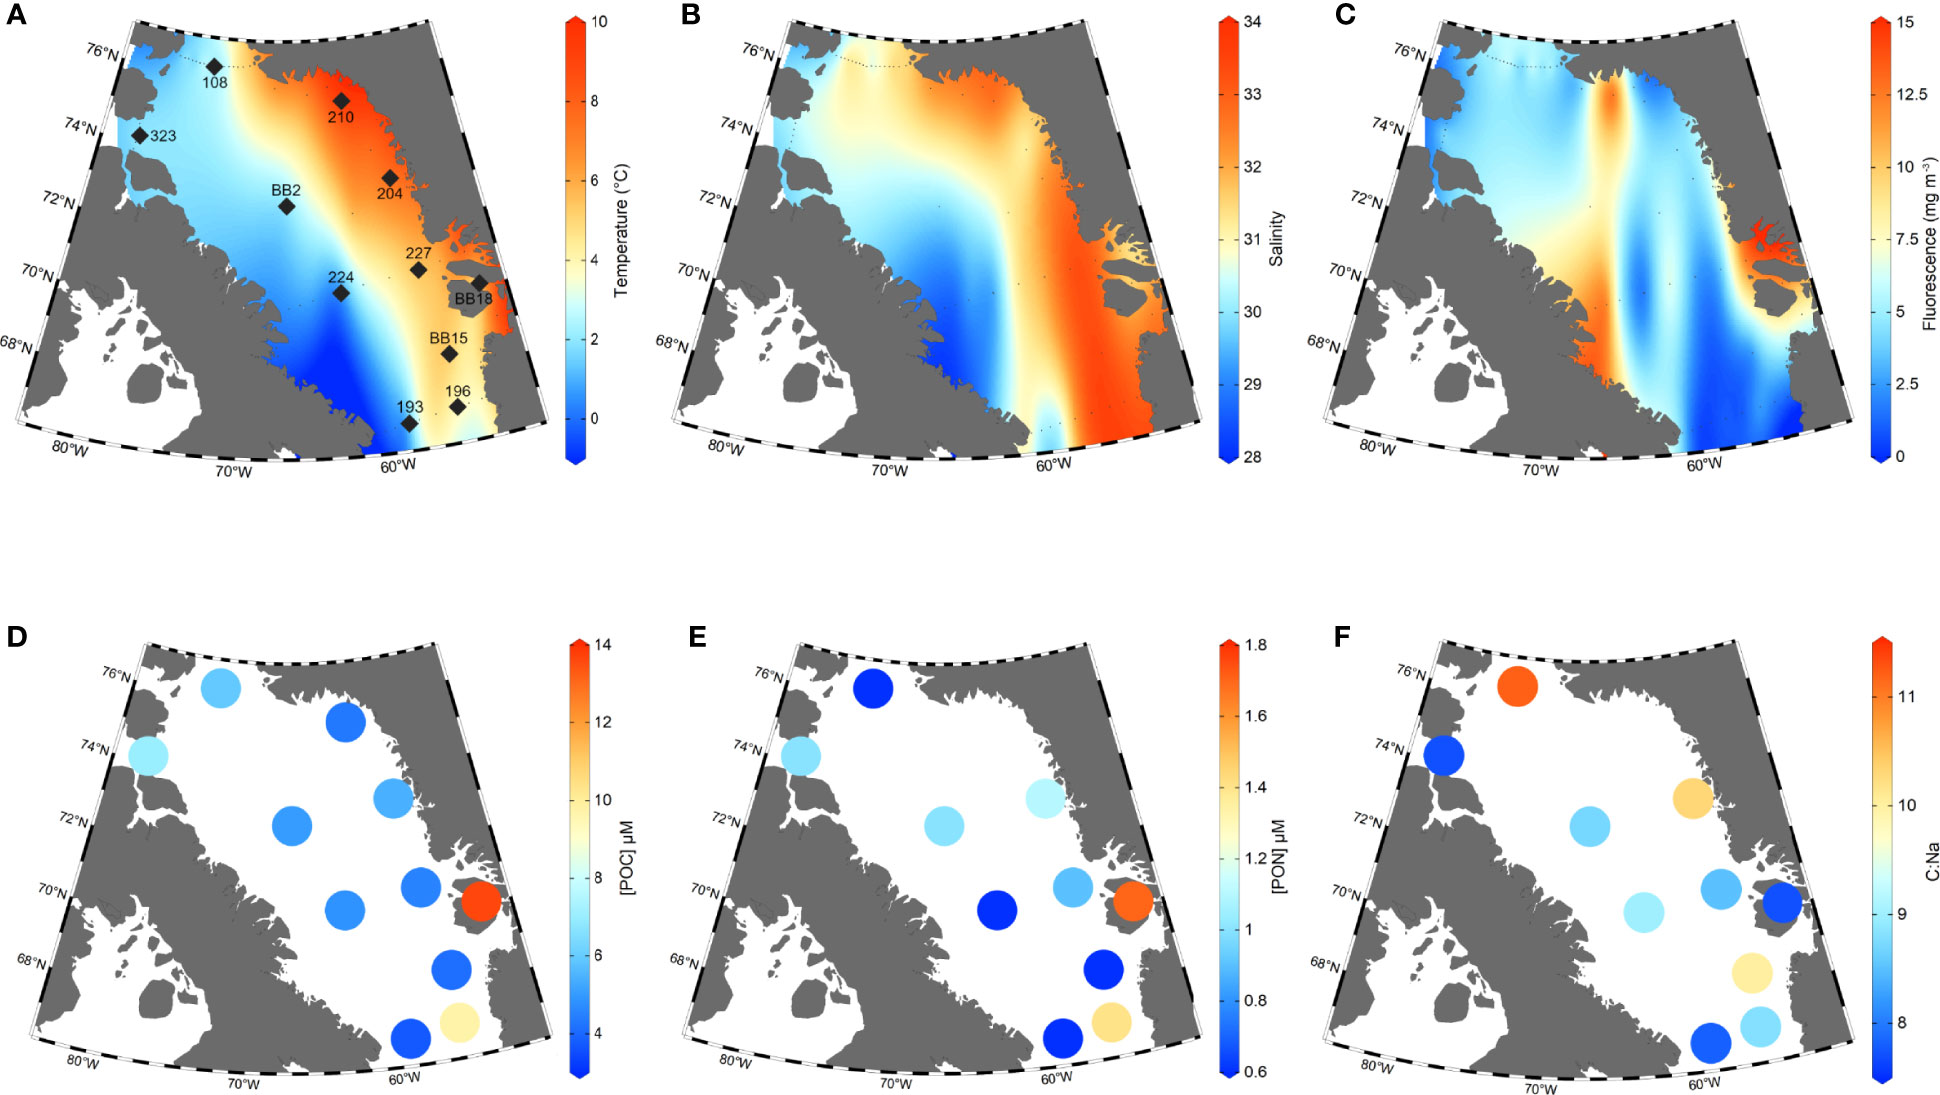
Figure 2 Station map together with sea surface temperature, salinity, fluorescence, [POC], [PON], and C:N. Plots (A–C): Data from all stations visited in the 2019 research cruise were used to create the interpolated surface distributions of sea surface temperature (A; SST), salinity (B) and fluorescence at the deep chlorophyll maximum (C). Here, SSTs are CTD temperatures from 2-3 metres depth (°C), sea surface salinities are CTD data from 2-3 metres depth and reported in Practical Salinity Units (PSU), and fluorescence values are for the deep chlorophyll-a maximum depth (30-40m). Stations from which POM samples were collected are indicated by large black diamonds on Plot (A) All other cruise stations in which CTD data was collected (such as temperature, salinity, and fluorescence) are indicated by small black dots. Plots (D–F) show [POC], [PON] concentrations in µmol L-1 and C:Na ratios from each station.
POMsusp samples were collected from 11 stations in July 2019 aboard the CCGS Amundsen (Figure 2A). A main goal of this broader study was to sample depth profiles for isotopic characterization of dissolved organic carbon. Due to a restricted water budget, low expected POM concentrations, collected POMsusp samples comprise depth integrated filtrations of seawater from 0 to 400m depth, filtered directly from 12L Niskin bottles. POMsusp was filtered either by gravity and/or by a peristaltic pump using acid cleaned (10% HCl) silicone tubing onto pre-combusted (540°C/2h) 70mm quartz fiber filters (Whatman QMA; 2.0µm) held in a custom stainless-steel manifold. Samples comprise seawater POM from 15 to 20 discrete Niskin bottles, depending on the depth of the station. Between 60 ± 10 mL and 1.50 ± 0.12 L of seawater from each Niskin was passed through the filter. Larger seawater volumes (>1 liter) were sampled at depths of 0m, 20m, 50m, 100m, 200m, 300m, and 400m. Between 4.9 ± 0.2 L and 12.2 ± 0.3 L were passed through filters in total, with most stations having ~7.1 liters in total. After sample collection, POMsusp QMA filters were placed in pre-combusted (540°C/2h) aluminum foil envelopes, frozen immediately and stored at -20°C until sample processing at the University of Ottawa. Measurements of SST, salinity, and fluorescence were taken via the CTD rosette instrument package equipped with 24, 12L Niskin bottles including a Seabird SBE911plus CTD profiler and ECO-Fl Chlorophyll-a fluorometer for 53 stations in Baffin Bay (Figures 2A–C).
In the lab, filters were oven dried overnight (50°C/8h) and vapor-phase acidified at ambient pressure in a clean glass desiccator bell with 5 mL of 12N HCl for 4 hours to remove particulate inorganic carbon (PIC). To avoid the use of hydrocarbon-containing grease, the desiccator bell was sealed with ~1mL 85% phosphoric acid placed on its stoneground glass joint. POM filters were subsampled by cutting approximately one-third of the filter. A time of 4 hours was used instead of common 12h or “overnight” acidification methods based on lab tests showing complete removal of 10 mg of NaHCO3 on filters under similar conditions in less than 2 hours (S. Beaupré and B. Walker, unpublished data). Our filters contain far less than 10 mg of total mass, and substantially less inorganic carbon. After acidification, sample filters were again oven dried (50°C overnight) to remove HCl and H2O vapor and stored in a low humidity, desiccator cabinet until further processing for isotopic analysis.
All filters were sub-sampled prior to elemental and isotopic analysis. For POMsusp Δ14C analysis we evenly cut 1/3 of the 70mm filter for all stations except for station BB2 where 1/4 filter was used due to repeated analysis attempts. Filter subsamples were rolled and placed into pre-combusted (540°C/2h) 9mm quartz tubes with ~100mg CuO wire, evacuated to 10-7 torr on a vacuum line and flame sealed. Sealed 9mm tubes with filters were then combusted at 850°C for 3h and the resultant CO2 cryogenically purified and manometrically quantified on a vacuum line system at the University of Ottawa. A small split of isotopically equilibrated CO2 gas was subsampled on the vacuum line and sealed in 3mm Pyrex tubes for δ13C measurement via Gas Bench isotope ratio mass spectrometry (GB-IRMS). The primary fraction of CO2 gas graphitized using the sealed tube zinc method for both large (>100µgC) and ultra-small (<100µgC) samples (Xu et al., 2007; Walker and Xu, 2019). After graphitization samples were pressed into aluminum cathodes at the University of Ottawa and analyzed for Δ14C via accelerator mass spectrometry (AMS) at the W.M. Keck-Carbon Cycle AMS facility at the University of California, Irvine. Small 3mm Pyrex tube gas splits were also measured for δ13C via GB-IRMS at UC Irvine. Station 210 was not determined due to repeated failures to graphitize for Δ14C leaving no material for further analysis. These failed attempts are difficult to explain as the sample combustion did not yield high quantities of non-condensable gas but could perhaps be due to high concentrations of sulfur in the POM sample inhibiting the graphitization reaction. POM Δ14C data are reported following the conventions put forth by Stuiver and Polach (1977). POM GB-IRMS δ13C results are reported in standard per mille (‰) notation and relative to Vienna Pee Dee Belemnite (V-PDB) and have measurement errors of ±0.1-0.2‰. Due to the presence of extraneous carbon on QMA filters, both Δ14C and δ13C data were subsequently blank corrected and errors propagated (see section 2.4).
Finally, between 1/4 to 1/6 of the remaining filter material was subsampled for elemental analysis (EA) IRMS at the stable isotope facility at University of California, Santa Cruz. EA-IRMS was used for the determination of POMsusp carbon and nitrogen (POCsusp, PONsusp) concentrations, atomic C:N ratio (C:Na), δ13C and δ15N values. POM C:Na was calculated by dividing the wt. %C by wt. %N of combusted material and multiplying by the ratio of molar masses of nitrogen (14.00 g mol-1) to carbon (12.01 g mol-1). Replicate analysis of POMsusp δ13C via EA-IRMS at UC Santa Cruz resulted in similar data, with most sample δ13C values falling within 0.5‰ of those measured by GB-IRMS. The average measured δ13C offset between UCI and UC Santa Cruz were 0.05 ± 0.82‰ (n=10). Since POM δ13C values between labs were statistically indistinguishable, we only use those generated by GB-IRMS at UCI herein. EA-IRMS δ15N values (±0.2-0.4‰; Table 1) are referenced relative to air and reported in standard per mille (‰) notation. EA-IRMS isotopic values were corrected using internal acetanilide and Princeton University gelatin working standards.
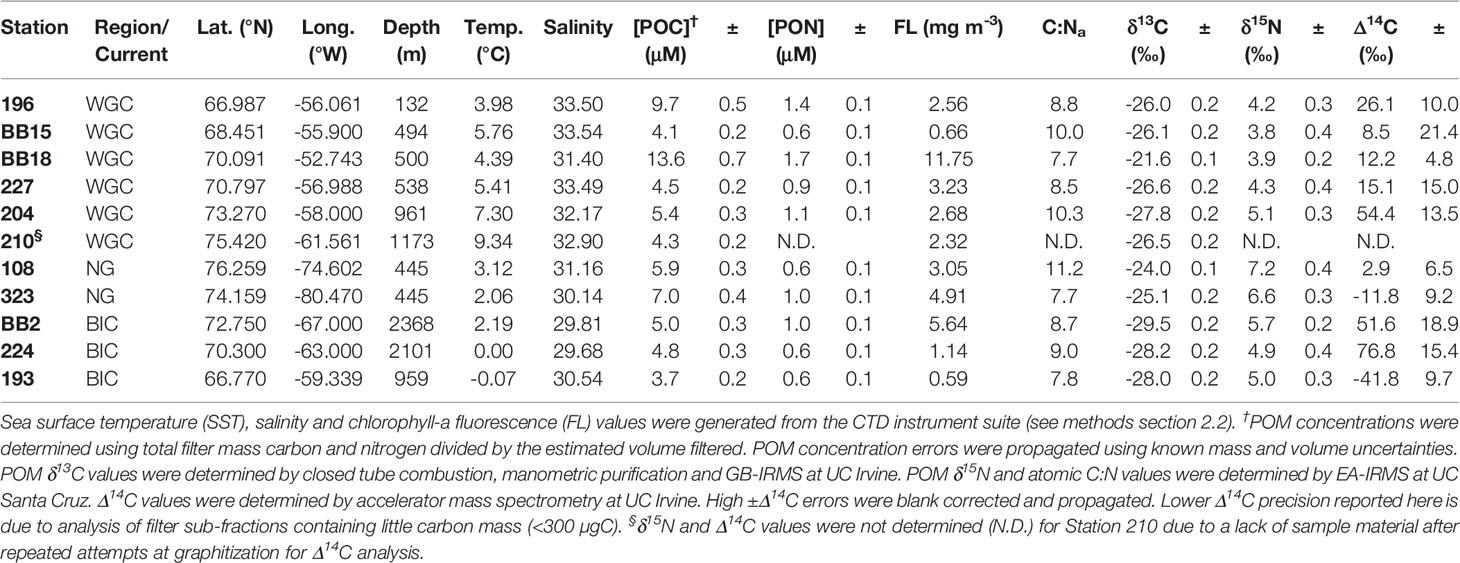
Table 1 Summary of measured Baffin Bay hydrographic and POM data.
Finally, POM carbon and nitrogen (POC, PON; µmol L-1) concentrations were determined by EA-IRMS or manometric vacuum line purification (for POC) steps mentioned above and using known filtered seawater volumes. The mass POC or PON measured was multiplied by the corresponding filter sub-fraction used to estimate the total mass of carbon or nitrogen on each 70mm filter. POM concentration errors were propagated using known errors in %C, %N via EA-IRMS analysis and assuming a 10% error in total volume filtered.
All POM filters contain extraneous carbon contributions associated with filter handling, sampling, and processing. To quantify a procedural blank for POM filters, we ran a blank pre-combusted 70mm QMA filter through our processing methods (including long term storage after baking). Combustion of this procedural blank yielded 61.2 ± 2 μgC. Since only 1/3 filter was subsampled for Δ14C analysis, an extraneous POC blank of 20.4 ± 2 µgC was assigned to all stations except for Station BB2 (1/4 filter, 15.3 µgC). This blank corresponds to approximately 10 to 16% of the total filter carbon. Blanks of this size are not unheard of due to the increased handling of POM samples (McNichol and Aluwihare, 2007). Since no nitrogen was detected on blank filters, measured POM δ15N values were not blank corrected.
Measured POMsusp Δ14C and δ13C values were blank corrected via isotopic mass balance (Equations 1 and 2). In all isotopic mass balances, errors were propagated following established methods (Taylor, 1997).
1. (1)[POM]meas× Δ14Cmeas= [POM]sample × Δ14Csample+ [POM]blank× Δ14Cblank
2.
The filter procedural blank (61.2 ± 2 μgC) had a measured Δ14C value of −801.7 ± 3.5‰. While no procedural blank was established for δ13C, we assumed that the only reasonable source of dead C to the filters could possibly be residual hydrocarbon lubricant present on the Al foil during manufacturing (e.g., combusted to CO2 that was subsequently absorbed by the QMA filter in its sealed Al foil envelope). Thus, we used Δ14C and δ13C blank values of −801.7 ± 3.5‰ and −28.0 ± 1.0‰, respectively in our isotopic mass balances (Cherrier et al., 2014; Walker et al., 2017). Since many of our measured POM δ13C values were isotopically light (−25 to −29‰), this blank correction resulted in only small corrections to our measured POM δ13C values (<0.3‰).
A summary of all POM concentrations, C:Na ratios and deep chlorophyll-a maximum (DCM) fluorescence values are provided in Table 1. For simplicity, we hereafter refer to POMsusp as ‘POM’, unless making a distinction between POMsink and POMsusp. We observe large ranges in POC and PON concentrations across Baffin Bay (Figures 2D, E). POC concentrations ranged from 4.1 ± 0.2 μM C L-1 at station BB15 to 13.6 ± 0.7 μM C L-1 at BB18, with an average value of 6.2 ± 3.0 μM C L-1 (n=11). PON concentrations averaged 1.0 ± 0.4 µM N L-1 (n=11) and had a smaller range – from 0.6 ± 0.1 μM N L-1 at stations BB15, 108, 224 and 193 to 1.7 ± 0.1 μM N L-1 at stations BB18. Excluding station BB18, which had the highest POC and PON concentrations, Eastern Baffin Bay had generally higher POC and PON values (5.6 ± 2.3 μM C L-1 and 1.0 ± 0.3 μM N L-1, n=5) than Western Baffin Bay (4.5 ± 0.7 μM C L-1 and 0.7 ± 0.2 μM N L-1, n=3), however these differences are not significant to the 95% confidence interval (2σ). Northern station (108, 323) POC concentrations (6.5 ± 0.8 μM C L-1, n=2) were significantly higher than Western Baffin Bay.
POM C:Na ratios ranged from 7.7 to 11.2, with an average value of 9.0 ± 1.2 (n=10) (Figure 2F). We observed qualitatively higher C:Na ratios in Northern (9.5 ± 2.3, n=2) and Eastern (9.1 ± 1.1, n=5) Baffin Bay vs. Western Baffin Bay (8.5 ± 0.6, n=3). However, unlike regional POC concentrations, there was no statistically significant difference between POM C:Na when averaging Baffin Bay regions. Smith Sound (108) had the highest C:Na value (11.2). Stations with the lowest C:Na ratios (BB18, 323 and 193) had values approximating Redfield (7.7-7.8).
The DCM, as determined by a water column fluorescence maximum, was present at depths of 20-40m throughout Baffin Bay at the time of sampling. The distribution of DCM fluorescence values reveals clear differences in phytoplankton abundance across Baffin Bay. In general, Western Baffin Bay has higher fluorescence values than Eastern Baffin Bay and some elevated fluorescence values can be seen at the Northern Gateways (Figure 2C). We observe the highest fluorescence values (10-15 mg m-3) at coastal Greenland stations adjacent to glacial fjords (Figure 2C). At sampled POM stations, fluorescence values at the DCM ranged from 0.59 mg m-3 (193) to 11.75 mg m-3 (BB18) with an average of 3.8 ± 3.2 mg m-3 (n=11; Table 1). Fluorescence was high at Northern gateway stations (108, 323; 3.05 and 4.91 mg m-3, respectively) and along Baffin Island at 70°N, with fluorescence decreasing into the centre of Baffin Bay from 5.64 mg m-3 at station BB2 to 1.14 at station 224. While fluorescence had a high range in Baffin Bay, averages of our individual stations by region (East, West and Northern) did not suggest significant regional differences – at least for the POM stations we sampled.
POM δ13C and δ15N values comprise a total range of 7.8‰ and 3.4‰, respectively (Table 1). POM δ13C ranged from −21.6‰ at station BB18 to −29.5‰ at BB2, with an average value of −26.3 ± 2.1‰ (n = 11). Negative POM δ13C values were observed in Central-West Baffin Bay (−29.6 ± 0.8‰, n = 3). Excluding the significantly less negative POM δ13C value from BB18, higher POM δ13C values (−26.2 ± 0.3‰, n = 3) were present in Southeastern Baffin Bay (196, BB15, 227). POM δ15N ranged from +3.8‰ at BB15 to +7.2‰ at 108, with an average value of +5.1 ± 1.1‰ (n = 10). The highest POM δ15N values were observed in the Northern gateways (108 and 323; δ15N = +6.9 ± 0.3‰, n = 2). The elevation of these Northern POM δ15N values was statistically significant (at ±2σ) from Eastern (+4.3 ± 0.5‰, n =5) and Western Baffin Bay (+5.2 ± 0.4‰, n = 3) regions. The lowest values were observed in the Southeastern region of Baffin Bay (196, BB15, BB18, 227, δ15N = +4.1 ± 0.2‰, n = 4).
Blank-corrected POM Δ14C values span a ~119‰ range, with an average POM Δ14C value of +19.4 ± 34.6‰ (n = 10; Table 1). While 224 had the highest POM Δ14C value (+76.8 ± 15.4‰), BB2 and 204 also had very positive POM Δ14C values (+51.6 ± 18.9‰ and +54.4 ± 13.5‰, respectively). Stations 193 and 323 were the only stations with negative POM Δ14C values (−41.8 ± 9.7‰ and −11.8 ± 9.2‰, respectively). The remaining stations (196, BB15, BB18, 227, 108; n = 5) fall in a relatively narrow Δ14C range between +2.9 ± 6.5‰ (108) and +26.1 ± 10.0‰ (196).
POC and PON concentrations were high throughout Baffin Bay (Table 1), consistent with previous studies showing high POM concentrations and rates of primary production in Baffin Bay (Lalande et al., 2009; Ardyna et al., 2011). POC and PON concentrations were not significantly correlated to SST or salinity (R2 <0.0003), suggesting a biological control on the elemental composition of Baffin Bay POM. This is different from many studies showing water mass advection and upwelling as strong predictors of POM stoichiometry (e.g., Hill and Wheeler, 2002; Walker and McCarthy, 2012). Along the WGC extension, POC and PON increase from station BB15 (4.1 μM C L-1; 0.6 μM N L-1) to stations 227 and 204 (4.5 and 5.4 μM C L-1; 0.9 and 1.1 μM N L-1), respectively (Figures 2D, E). Low [POM] along the Davis Strait and Southwest Greenland shelf could be the result of nutrient limitation, as phytoplankton blooms in regions occur earlier in the year due to ice break-up (Tang et al., 2004). It is also conceivable that aged N. Atlantic waters flowing into Baffin Bay in Eastern Davis Strait are iron-limited relative to Northern Stations with high glacial influx. Increased [POC] and [PON] along the WGC extension may result from elevated micronutrient delivery from the Greenland ice sheet. For example, we observe the highest fluorescence (11.75 mg m-3) and POM concentrations (13.6 µM C L-1, 1.7 µM N L-1) at Station BB18 in the Vaigat Fjord. These high values are indicative of a local phytoplankton bloom at the time of sampling, stimulated by summer glacial discharge (Arrigo, et al., 2017). Northern gateway stations (108, 323) show further increases in POC concentration (5.9-7.0 μM C L-1) and fluorescence values (Figures 2C, D; Table 1).
POM concentrations decrease south of central Baffin Bay within the BIC – from BB2 (5.0 μM C L-1; 1.0 μM N L-1) to 224 (4.8 μM C L-1; 0.6 μM N L-1) and 193 (3.7 μM C L-1; 0.6 μM N L-1), respectively (Figure 2D). This decrease in [POM] is also reflected in decreasing DCM fluorescence values (Table 1). Whereas Stations 224 and BB2 (Western Baffin Bay) had nearly identical POM concentrations, these stations had quite different DCM fluorescence values – suggesting differences in autotrophic POM abundance at the time of sampling. Higher BB2 fluorescence values may indicate higher primary production fueled by Pacific nutrients from Lancaster Sound (Lehmann et al., 2019). Station 224 is located “downstream” in the BIC extension, possibly indicating lower POM concentrations resulting from POMsusp degradation within the BIC.
POM C:Na ratios are valuable indicators of POM diagenetic state (e.g., Cowie and Hedges, 1994) and provide useful information regarding autochthonous vs. allochthonous POM contributions and POM chemical “freshness”. The stoichiometric model of Redfield describes the elemental composition of marine organic matter and can be used generally to link the production of new POM to nutrients. The ratio of carbon to nitrogen in POM produced by marine phytoplankton generally follows the Redfield ratio of 106:16:1 (C:N:P; Redfield, 1958), or ~7.7 as C:Na. Deviation from standard Redfield stoichiometry can be used as an indicator of nutrient limitation, or the relative diagenetic state (i.e., chemical “freshness”) of POM. The relationship between organic matter C:Na ratio and degradation state have described previously for dissolved organic matter (DOM), suspended vs. sinking POM, and marine sediments (Cowie and Hedges, 1994; Loh and Bauer, 2000; Hopkinson and Vallino, 2005; Walker and McCarthy, 2012; Walker et al., 2014; Walker et al., 2016). Here, POM with low C:Na ratios (especially those approximating Redfield) represents recently produced and chemically “fresh” material. In contrast, POM with high C:Na, typically represents older, “degraded” POM contributions either from allochthonous sources or in situ degradation of fresh material (e.g., heterotrophic re-working of a senescent phytoplankton bloom). In this way, C:Na ratios are a useful tool for evaluating the relative diagenetic state of marine POM.
In Baffin Bay, all POM C:Na (7.7 to 11.2) had canonical “marine” values, equal to or higher than regular Redfield ratios (Figure 2F). The mean value of C:Na in this study (9.0 ± 1.2) closely resembles POM C:Na (8.9) previously reported for the Eastern Greenland shelf, in which high C:Na was attributed to nitrate limitation, and the dominance of carbon-rich diatoms (Daly, et al., 1999). Our POM C:Na values together with observed seawater salinities, precludes significant terrestrial (C:Na ~40) POM contributions. High POM C:Na values (10.0-11.2) at stations 108, 204, and BB15 potentially indicate higher contributions of degraded POM. Previously work has shown POM C:Na ratios in the North Water polynya (i.e., near Station 108) found C:Na increases in early spring and summer with concomitant increases in irradiance and decreases in nitrate (Mei, et al., 2005). Prolonged periods of high irradiance can lead to elevated POM C:Na under nitrogen limitation, as phytoplankton synthesize N-poor photoprotective pigments (Levasseur and Therriault, 1987; Dubinsky and Berman-Frank, 2001). We observed Redfield POM C:Na values (7.7) at three stations BB18, 323, and 193. These stations comprise a wide spatial range and are found in distinct marine ecosystems in Baffin Bay. As previously mentioned, station BB18 is in the glacial meltwater-dominated Vaigat Fjord, whereas stations 323 is in one of Baffin Bay’s Northern gateways. Surprisingly, Station 193, the southernmost extent of the BIC, had very low [POM] concentrations. Thus, while low C:Na values are often associated with abundant “fresh” POM produced under nutrient-replete conditions, this is not always the case. One explanation of these data could be a non-traditional allochthonous POMsusp source. For example, POMsink contributions at Station 193 could explain low C:Na and low POC concentrations. Alternatively, re-suspension and lateral advection of recently exported (“fresh”) POM from sediments could also explain this low C:Na ratio. Such re-suspended sedimentary organic carbon (SOC) contributions to POMsusp have been observed previously in the coastal ocean (e.g., Walker et al., 2014).
Our measured POM δ13C values (−21.6‰ to −29.5‰) are consistent with previous work from Baffin Bay showing the prevalence of both fast-growing plankton in glacial meltwater, in addition slow-growing phytoplankton from high latitudes with negative δ13C values (Goericke and Fry, 1994). Similarly, the large range in POM δ15N values (~3.4‰) can likely be attributed to disparate nitrate sources in Baffin Bay (Lehmann et al., 2019). For example, the advection of surface water masses (e.g. Atlantic, Arctic, Pacific/CAA) in Baffin Bay deliver allochthonous nutrients and POMsusp to the region. While annual freshwater contributions to Baffin Bay are estimated to be 100 km3 y-1 (Shiklomanov et al., 2021), the salinity at our stations was never below 29.6, and outside of station BB18, was always associated with the BIC (e.g., dominated by Arctic outflow water; Azetsu-Scott et al., 2012). This, combined with low POM C:Na found at all stations, precludes significant contributions of terrestrial POM affecting our δ13C values.
We observe several trends in POM δ13C and δ15N values in relation to surface water salinity (Figures 3A, B). Our WGC stations 196, BB15, 227, 204, and 210 have similar salinity (>32.17), δ13C and δ15N values (Figures 3A, B). WGC POM δ13C values are generally consistent with canonical POM δ13C values for high-latitude phytoplankton (δ13C = −24 to −26‰; De La Vega et al., 2019). For example, excluding the most negative WGC POM δ13C value (204; −27.8‰), the average WGC POM δ13C value is −26.3 ± 0.3‰ (n = 4). These stations similarly cluster together in δ13C-δ15N space, with an average δ15N = 4.1 ± 0.3‰ (n = 3; Figure 3B). Thus, we conclude that for most WGC stations, POM δ13C and δ15N values can be attributed to the prevalence of high-latitude phytoplankton utilizing the inflow of WGC and Irminger Current water as their main δ15NO3 source (+4-6‰; Sherwood et al., 2021). Station 204 has negative POM δ13C (−27.8‰) and positive δ 13N(+5.1‰) values, but falls on a continuum between Atlantic WGC water to Central Baffin Bay isotopic endmembers (Figure 3B). We believe these isotopic trends between the WGC and Central Baffin Bay are due to both mixing and recycling of PON and/or contributing the δ15N enrichment of POM.
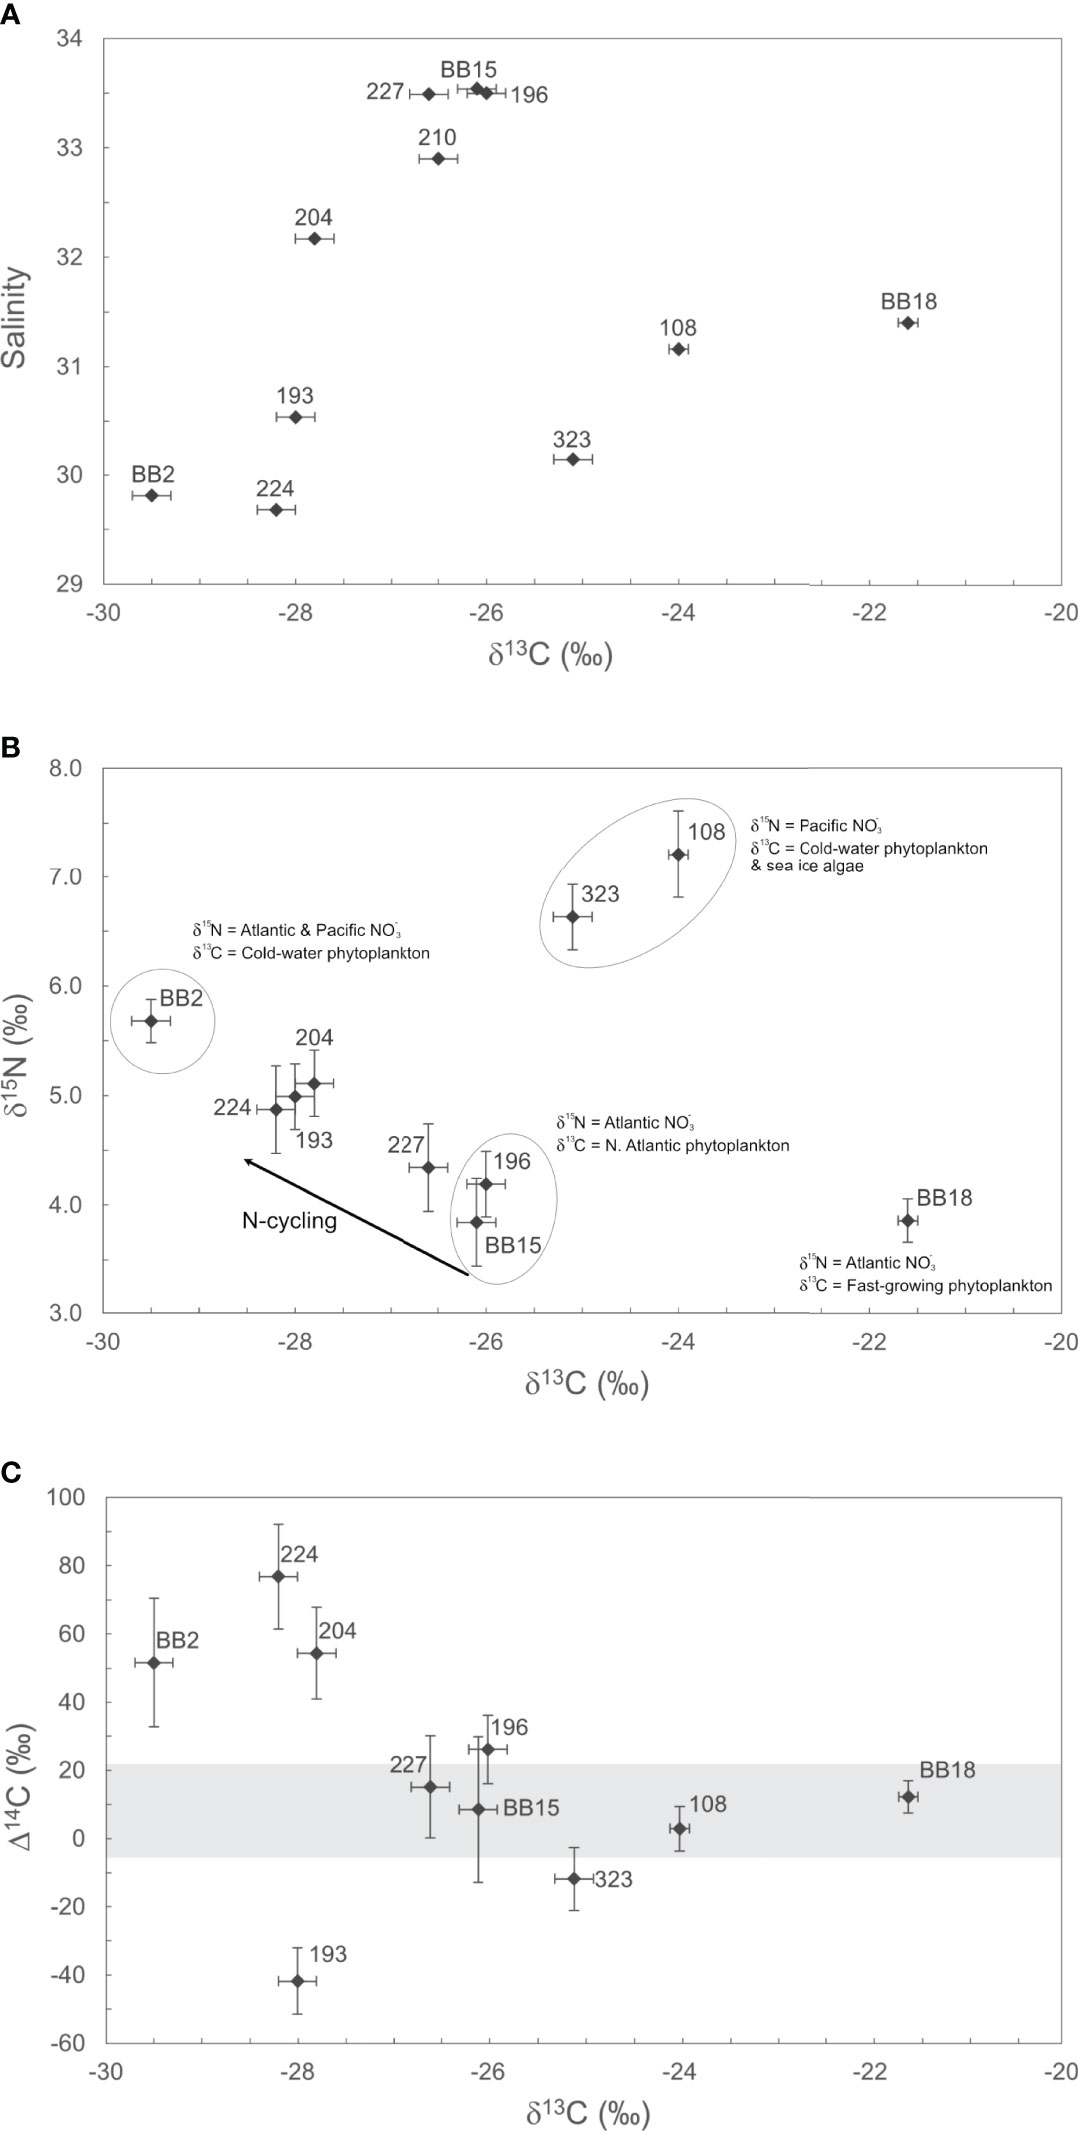
Figure 3 Isotopic (δ13C, δ15N, Δ14C) composition of POM in Baffin Bay. (A) The relationship between POM δ13C values (‰) and Salinity (PSU) is shown. Salinity is used here to highlight differences in POM sources via water mass origin. (B) The stable isotopic (δ13C, δ15N) composition of POM is shown, with observed isotopic endmembers. (C) the distribution of POM Δ14C and δ13C values is shown. The horizontal grey bar represents the full range in measured DIC Δ14C values for Baffin Bay (Zeidan et al., 2022). For all plots, isotope valued errors ( ± 1σ) are listed in Table 1.
BIC Stations (BB2, 224, and 193) have low SST (0-2°C) and salinity (S<30.54), negative POM δ13C (−28.6 ± 0.81‰, n = 3) and intermediate δ15N (+5.2 ± 0.4‰, n = 3) values (Table 1; Figures 3A, B). Negative BIC POM δ13C values are consistent with slow-growing, cold-water phytoplankton as a major POM source. Station BB2 has the highest δ15N (+5.7‰) outside of the Northern gateway stations and is influenced by the Northern BIC. Similarly, high POM δ15N values for Stations 224 and 193 in the BIC are likely influenced by the Pacific δ15NO3 propagating south from Lancaster Sound. This interpretation would be consistent with recent work showing the Pacific δ15NO3 signature is not only entrained into the BIC, but subsequently carried into the Labrador Current (Sherwood et al., 2021).
POM at the Northern gateways (323, 108) had the highest δ15N values of +6.6‰ and +7.2‰ and, excluding station BB18, the highest δ13C values of –25.1‰ and –24.0‰ (Figures 3A, B). Both stations likely contain moderate contributions of sea-ice algae POM. Station 323 in Lancaster Sound is a gateway for entering Pacific water that is a precursor to the BIC (S = 30.14; Münchow et al., 2015). Station 323 had more positive δ13C (–25.1‰) than other BIC stations (BB2, 224, 193; −28.6 ± 0.81‰) that can likely be attributed to seasonal variability and/or local sea-ice algae POM contributions. These results are consistent with previous Station 323 POM δ13C values of –24.2‰ reported in October 2011 that were also attributed to sea-ice algae (Roy, et al., 2015). Station 108 in the Smith Sound (S = 31.16) comprises several water mass contributions, including the WGC, Arctic water from Nares Strait and glacial meltwater from coastal Greenland. Previous POM δ13C values from the North Water polynya (near Station 108) were −22.3‰ and −27.6‰ for samples collected in April 1998 and October 2011, respectively (Hobson et al., 2002; Roy et al., 2015). Thus, Northern Baffin Bay POM likely contains more sea-ice algae POM in spring following ice break-up, and fewer contributions of positive δ13C sea-ice algae in the fall (−20 to −18‰; Hobson et al., 2002; De La Vega et al., 2019). The high POM δ15N values we observe from 323 and 108 are clearly influenced by the influx of high δ15N Pacific nutrients () entering Baffin Bay via the CAA as has been previously observed for Lancaster Sound (e.g. Lehmann et al., 2019). Together our POM δ13C and δ15N values from station 323 and 108 suggest Pacific nutrients, a polar marine plankton and sea-ice algae as the dominant POM carbon and nitrogen sources in Northern Baffin Bay.
Station BB18 is a clear outlier in the sample set and had the highest δ13C value (−21.6‰) and one of the lowest δ15N values (+3.9‰; Figures 3A, B). Station BB18 is located within the Vaigat fjord and had the lowest salinity of all coastal Greenland stations (S=31.40) and highest POM concentrations. The stable isotopic signature of BB18 POM can be attributed to high phytoplankton growth in the stratified fjord waters at the time of sampling (Figure S1–4). BB18 POM δ15N is similar to Atlantic δ15NO3, indicating an influx of Atlantic nitrate and high glacial meltwater delivery of iron can fuel high rates of primary production, as has been observed previously (Bhatia, et al., 2013; Meire, et al., 2017).
To further elucidate POM sources and cycling in Baffin Bay, here we discuss POM radiocarbon (Δ14C) values. Due to the short residence time of sinking and suspended POM in the water column (days to years), POM Δ14C values are largely determined by carbon sources as opposed to ages via radioactive decay. Possible POM Δ14C sources in Baffin Bay are: i) modern surface and pre-aged, upwelled DIC used in primary production, ii) modern or pre-aged allochthonous POM contributions advected from other regions, iii) modern or “bomb” terrestrial POM, iv) pre-aged glacial meltwater, v) re-mobilization of ancient permafrost and vi) pre-aged re-suspended SOC. Marine POM with Δ14C values similar to that of surface DIC Δ14C indicates a prevalence of in situ primary production as a major POM source (e.g., POM with a higher proportion of phytoplankton-derived, autochthonous POM) and POM Δ14C values that fall outside the range of DIC Δ14C could indicate allochthonous POM contributions with pre-aged (negative Δ14C) or “bomb” (positive Δ14C) signatures.
The ~119‰ range in POM Δ14C values we observe throughout Baffin Bay is both striking and somewhat unexpected given the overall “freshness” of POM samples (i.e., generally low C:Na ratios, high POM concentrations) and their stable isotopic composition largely indicating planktonic carbon and local nutrient sources (Figures 2, 3). This range in surface POM Δ14C values is also especially high for a single oceanographic region. For example, the range in POM Δ14C values we observe exceeds the range previously reported from an intense California upwelling system (~101‰; Walker et al., 2014). Whereas most POM Δ14C samples fall within the range of measured surface DIC Δ14C values, four of our POM Δ14C values fall outside this range – indicating allochthonous POM contributions (Figure 3C).
Three stations (BB2, 224, 204) had higher Δ14C values (> ± 2σ) than surface DIC Δ14C (Figure 3C). Stations BB2 and 224 are in the central gyre, with Δ14C of +51.6±18.9‰ and +76.8±15.4‰, respectively. Station 204, near coastal Greenland, had Δ14C of +54.5±13.5‰. Measured surface DIC Δ14C values for BB2, 224, and 204, are +5.6‰, +14.1‰, and +14.2‰, respectively (errors ±1.5‰; Zeidan et al., 2022). This large disparity between DIC Δ14C and POC Δ14C indicates the clear presence of allochthonous POM with an atmospheric “bomb” Δ14C signature within central Baffin Bay. These positive POM Δ14C values likely arise from POM contributions that were synthesized during periods of high atmospheric 14C. This would require POM in central Baffin Bay to be decades old. Atmospheric Δ14CO2 was last at +80‰ approximately 16 years before our sampling (e.g., between 2001-2003; Levin et al., 2010) and marine DIC reached this value in the 1970’s (Druffel, 1996). Thus, our results suggest that a portion of the POMsusp pool may be retained in the central gyre of Baffin Bay and possibly recycled in the surface for several decades. Additional sources of bomb Δ14C could be advected POM from the North Atlantic (+100 to +140‰ in 1992; Druffel et al., 1992), or via the CAA (Beaufort Sea DIC Δ14C = +82‰ in 2012; Druffel et al., 2017). However, neither our Northern nor Southern gateway stations (323, 108, 193, 196) contained highly positive POM or DIC Δ14C values. In addition, POM δ13C values from these three stations (−28.5 ± 0.9‰) are consistent with slow-growing, cold-water phytoplankton from higher latitudes (Holding et al., 2017). Thus, it is more likely that these cold-water phytoplankton, along with some pre-existing bomb 14C persisting in the central gyre, are responsible for our observed POM Δ14C and δ13C values in central Baffin Bay. Lastly, station 204 on the north-central Greenland shelf, more closely resembles BIC stations isotopically (Δ14C, δ13C, δ15N), suggesting a similar POM source to central Baffin Bay at the time of sampling. Surface admixture of WGC waters with surface water from the gyre as evidenced from its lower salinity value (32.17) relative to other WGC stations (>32.9) is a distinct probability.
We observe a highly negative POM Δ14C value at station 193 (−41.8±9.7‰). This POM Δ14C value is significantly different from surface in situ DIC Δ14C (+15.6‰; Zeidan et al., 2022). As mentioned above, this sample had the low POM concentrations and C:Na. We believe contributions of resuspended SOC to Station 193 POM the be the most reasonable explanation of these data. SOC contributions to POM are now widely recognized as a common pathway through which 14C-depleted carbon can be transported laterally from the coastal ocean and incorporated into the POM pool (Rau et al., 1986; Druffel et al., 1992; Druffel et al., 1996; Druffel et al., 1998; Hwang et al., 2005; Hwang et al., 2010; Walker et al., 2014). SOC δ13C values for the Arctic average −22‰ to −26‰, with end-member values being −27 to −28‰ (Drenzek et al., 2007; Magen et al., 2010; Roy et al., 2015). Thus, the Station 193 δ13C value of −28.0‰ is plausible. Additionally, C:N (wt/wt) ratios of sediments from the Bering and south Chukchi seas showed open shelf sediments generally had C:N less than 7 (Naidu, et al., 1993). The C:N ratio for station 193 when calculated by weight is 6.7. From these multiple lines of evidence, we hypothesize POM at station 193 contains resuspended SOC contributions, albeit perhaps recently exported, “fresh” SOC with a low C:Na. Future work on the shelf/slope of Davis Strait could target re-suspended sediment POM contributions through the use of %Al or sedimentary biomarker measurements.
While the deviation of POM Δ14C from in situ DIC Δ14C values reveal an interesting diversity of Baffin Bay POM sources and cycling, most of our POM Δ14C fall within the range of measured surface DIC Δ14C (Figure 3C). All these samples are from WGC (196, BB15, 227, BB18), or the Northern gateway (108, 323) stations. Here, POM Δ14C values are statistically indistinguishable from in situ DIC Δ14C ( ± 2σ). The similarity of POM and DIC Δ14C values at these locations has important implications for carbon cycling within Baffin Bay. For example, these data suggest that most of the de novo POM synthesis in Baffin Bay occurs along coastal Greenland fueled by Atlantic macronutrients (nitrate) and glacial micronutrients (iron). This primary production largely governs export production within Baffin Bay. With future climate change scenarios indicating warming of Baffin Bay and enhanced Greenland ice sheet melting, favoring large centric diatoms, and extended ice-free conditions (Krawczyk et al., 2021), it stands to reason that these regions of Baffin Bay will continue to support most POM export and burial in Baffin Bay.
As a detrital organic matter reservoir, POMsusp represents a complex geochemical mixture of non-living materials. The chemical composition of POM does not always match that of resident plankton communities and can be strongly influenced by pre-aged, allochthonous POM contributions. The bulk elemental and isotopic composition of POM presented in this study provides us with a new understanding of the sources, diagenetic state, and the geochemical impact of POM in Baffin Bay. These first POM Δ14C data, together with δ13C and δ15N suggest a diversity of POM carbon and nitrogen sources in Baffin Bay. Overall, POM isotopic δ13C, δ15N, and Δ14C signatures are controlled by surface water mass circulation, local algal communities and nutrient sources, and to a lesser extent, contributions from allochthonous POM sources. Primary production fueled by Atlantic nitrate is a major source of new POM in Eastern Baffin Bay. In particular, the coastal fjords along Greenland are unique, high-productivity environments decoupled from the broader surface circulation-driven POM trends. The Northern gateways, through which Arctic and Pacific waters flow into Baffin Bay, also show considerable POM contributions from in situ production from both high latitude phytoplankton and sea-ice algae utilizing Pacific nitrate. Stations in central Baffin Bay are strongly influenced by the cold and fresh BIC, with POM contributions mainly from slow-growing cold water phytoplankton again fueled by Pacific nitrate entering Baffin Bay via the CAA.
Measured POM Δ14C values add to this emerging picture of POM cycling in several ways. First, POM Δ14C within the WGC and Northern gateways matches that of in situ DIC Δ14C, suggesting that primary production results in 14C-modern POM in these regions. In this way, these regions serve as the primary drivers POM export and carbon cycling in Baffin Bay. Second, POM with highly positive Δ14C values is found in the central gyre – indicating the presence of bomb 14C. POM synthesized in the western Canadian Arctic (i.e., Beaufort Sea) and advected through the CAA represents a possible source of positive POM Δ14C to Baffin Bay. Other possibilities could include recycling of bomb 14C within the central Baffin Bay POMsusp reservoir or influx of terrestrial POM. However, stable isotopic (δ13C, δ15N) signatures and C:Na ratios do not support the latter. The former scenario would necessitate the decadal persistence of a recalcitrant POMsusp fraction in the gyre. None of these scenarios have simple explanations and further work is required to confirm the persistence of bomb 14C in central Baffin Bay. Finally, POM exiting Baffin Bay via the western Davis Strait has highly negative Δ14C values. Together with [POC], [PON] and C:Na data, we believe resuspended sediments were a major contributor to this POM sample. Such contributions are supported by previous geochemical and global 14C studies of the POM pool. The export of POM with negative Δ14C values has important implications for the geochemical impact of the BIC on the Labrador Sea. If entrained in North Atlantic Deep Water during its formation, this could represent a previously unrecognized source of 14C-depleted POM to the deep ocean.
POM isotopic (Δ14C, δ13C, δ15N) data remain sparse for this region, yet provide invaluable baseline data for evaluating carbon and nitrogen cycling in a rapidly changing Arctic region. Future work focused on increasing the spatial resolution of POM Δ14C observations, together with compound-class or compound specific isotopic analysis, would improve our understanding of the cycling of fresh vs. recalcitrant POM components in Baffin Bay. These measurements have proven useful in parsing out individual allochthonous POM components, such as contributions from resuspended sediment (e.g., Roland et al., 2008).
The original contributions presented in the study are included in the article/Supplementary Material. Further inquiries can be directed to the corresponding author.
BW conceived the hypothesis and the objectives of this investigation. BW collected the POM samples at sea. AF processed the samples in the lab for isotopic analysis with BW. AF wrote the manuscript with input from BW. All authors contributed to the article and approved the submitted version.
Funding for this project was provided by the Natural Sciences and Engineering Research Council (NSERC) of Canada through a Discovery Grant, Accelerator and Launch Supplements (RGPIN-2020-06501, RGPAS-2020-00071, DGECR-2020-00256; to BW). A portion of this work was supported through the Canada Research Chairs program (to BW).
The authors declare that the research was conducted in the absence of any commercial or financial relationships that could be construed as a potential conflict of interest.
All claims expressed in this article are solely those of the authors and do not necessarily represent those of their affiliated organizations, or those of the publisher, the editors and the reviewers. Any product that may be evaluated in this article, or claim that may be made by its manufacturer, is not guaranteed or endorsed by the publisher.
We would like to thank Chief Scientist Alexandre Forest, Anissa Merzouk and the staff of Amundsen Science and the crew of the CCGS Amundsen for the opportunity to participate in the 2019 research cruise and for providing CTD data. We thank Drs. Cara Manning and Brent Else for their help in coordinating the sampling and logistics of the Biogeochemistry groups aboard the CCGS Amundsen. We thank Drs. Xiaomei Xu and John Southon of the UC Irvine Keck Carbon Cycle AMS lab for their expertise and help with 14C analysis of our graphite targets and GB-IRMS δ13C measurements. We thank Colin Carney at UC Santa Cruz for additional POM stable isotope (δ13C, δ15N) measurements.
The Supplementary Material for this article can be found online at: https://www.frontiersin.org/articles/10.3389/fmars.2022.846025/full#supplementary-material
Ardyna M., Gosselin M., Michel C., Poulin M., Tremblay J.-E. (2011). Environmental Forcing of Phytoplankton Community Structure and Function in the Canadian High Arctic: Contrasting Oligotrophic and Eutrophic Regions. Mar. Ecol. Prog. Ser. 442, 37–57. doi: 10.3354/meps09378
Arrigo K., Dijken G. (2015). Continued Increases in Arctic Ocean Primary Production. Prog. Oceanogr. 136, 60–70. doi: 10.1016/j.pocean.2015.05.002
Arrigo K., Dijken G., Castelao R., Luo H., Rennermalm Å, Tedesco M., et al. (2017). Melting Glaciers Stimulate Large Summer Phytoplankton Blooms in Southwest Greenland Waters. Geophys. Res. Lett. 44 (12), 6278–6285. doi: 10.1002/2017GL073583
Azetsu-Scott K., Petrie B., Yeats P., Lee C. (2012). Composition and Fluxes of Freshwater Through Davis Strait Using Multiple Chemical Tracers. Geophys. Res. Ocean. 117, C12011. doi: 10.1029/2012JC008172
Bauer K., Druffel E. (1998). Ocean Margins as a Significant Source of Organic Matter to the Deep Open Ocean. Nature 392, 482–485. doi: 10.1038/33122
Beaupré S. (2019). “Radiocarbon-Based Insights Into the Biogeochemical Cycles of Marine Dissolved and Particulate Organic Carbon,” in Encyclopedia of Ocean Sciences. Eds. Cochran K., Bokuniewicz H., Yager P. (London: Academic Press), 245–252. doi: 10.1016/B978-0-12-409548-9.09522-1
Benner R., Amon R. M. W. (2015). The Size-Reactivity Continuum of Major Bioelements in the Ocean. Ann. Rev. Mar. Sci. 7, 185–205.
Bhatia M., Das S., Xu L., Charette M., Wadham J., Kujawinski E. (2013). Organic Carbon Export From the Greenland Ice Sheet. Geochim. Cosmochim. Acta 109, 329–344. doi: 10.1016/j.gca.2013.02.006
Bhatia M., Kujawinski E., Das S., Breier C., Henderson P., Charette M. (2013). Greenland Meltwater as a Significant and Potentially Bioavailable Source of Iron to the Ocean. Nat. Geosci. 6, 274–278. doi: 10.1038/ngeo1746
Brown Z., Casciotti K., Pickart R., Swift J., Arrigo K. (2015). Aspects of the Marine Nitrogen Cycle of the Chukchi Sea Shelf and Canada Basin. Deep. Sea. Res. Part II Top. Stud. Oceanogr. 118, Part A, 73–87. doi: 10.1016/j.dsr2.2015.02.009
Brown K., McLaughlin F., Tortell P., Varela D., Yamamoto-Kawai M., Hunt B., et al. (2014). Determination of Particulate Organic Carbon Sources to the Surface Mixed Layer of the Canada Basin, Arctic Ocean. J. Geophys. Res. Ocean. 119 (2), 1084–1102. doi: 10.1002/2013JC009197
Buesseler K., Boyd P., Black E., Siegel D. (2020). Metrics That Matter for Assessing the Ocean Biological Carbon Pump. Proc. Natl. Acad. Sci. U. S. A. 117 (18), 9679–9687. doi: 10.1073/pnas.1918114117
Caron G., Michel C., Gosselin M. (2004). Seasonal Contributions of Phytoplankton and Fecal Pellets to the Organic Carbon Sinking Flux in the North Water (Northern Baffin Bay). Mar. Ecol. Prog. Ser. 283, 1–13. doi: 10.3354/meps283001
Cauwet G. (1981). Chapter 4 Non-Living Particulate Matter. Elsevier. Oceanogr. Ser. 31, 71–89. doi: 10.1016/S0422-9894(08)70326-X
Cherrier J., Sarkodee-Adoo J., Guilderson T., Chanton J. (2014). Fossil Carbon in Particulate Organic Matter in the Gulf of Mexico Following the Deepwater Horizon Event. Environ. Sci. Technol. Lett. 1 (1), 108–112. doi: 10.1021/ez400149c
Close H., Shah S., Ingalls A., Diefendorf A., Brodie E., Hansman R., et al. (2013). Export of Submicron Particulate Organic Matter to Mesopelagic Depth in an Oligotrophic Gyre. Proc. Natl. Acad. Sci. U. S. A. 110 (31), 12565–12570. doi: 10.1073/pnas.1217514110
Cowie G., Hedges J. (1994). Biochemical Indicators of Diagenetic Alteration in Natural Organic Matter Mixtures. Nature 369, 304–307. doi: 10.1038/369304a0
Daly K., Wallace D., Smith W., Skoog A., Lara R., Gosselin M., et al. (1999). Non-Redfield Carbon and Nitrogen Cycling in the Arctic’ Effects of Ecosystem Structure and Dynamics. J. Geophys. Res. 104, 3185–3199. doi: 10.1029/1998JC900071
De La Vega C., Jeffreys R., Tuerena R., Ganeshram R., Mahaffey C. (2019). Temporal and Spatial Trends in Marine Carbon Isotopes in the Arctic Ocean and Implications for Food Web Studies. Glob. Change Biol. 25, 4116–4130. doi: 10.1111/gcb.14832
Denman K., Brasseur G., Chidthaisong A., Ciais P., Cox P., Dickinson R., et al. (2007). “Couplings Between Changes in the Climate System and Biogeochemistry,” in Climate Change 2007: The Physical Science Basis. Contribution of Working Group I to the Fourth Assessment Report of the Intergovernmental Panel on Climate Change. Eds. Solomon S., Qin D., Manning M., Chen Z., Marquis M., Averyt K., Miller H. (Cambridge, UKNew York, USA: Cambridge University Press), 499–587.
Descolas-Gros C., Fontugne M. (1990). Stable Carbon Isotope Fractionation by Marine Phytoplankton During Photosynthesis. Plant Cell Environ. 13, 207–218. doi: 10.1111/j.1365-3040.1990.tb01305.x
Drenzek N., Montlucon D., Yunker M., Macdonald R., Eglinton T. (2007). Constraints on the Origin of Sedimentary Organic Carbon in the Beaufort Sea From Coupled Molecular 13C and 14C Measurements. Mar. Chem. 103, 146–162. doi: 10.1016/j.marchem.2006.06.017
Druffel E. (1996). Post-Bomb Radiocarbon Records of Surface Corals from the Tropical Atlantic Ocean. Radiocarbon 38 (3), 563–572. doi: 10.1017/S0033822200030095
Druffel E., Bauer J., Williams P., Griffin S., Wolgast D. (1996). Seasonal Variability of Particulate Organic Radiocarbon in the Northeast Pacific Ocean. J. Geophys. Res. Ocean. 101 (C9), 20543–20552. doi: 10.1029/96JC01850
Druffel E., Griffin S., Bauer J., Wolgast D., Wang X.-C. (1998). Distribution of Particulate Organic Carbon and Radiocarbon in the Water Column From the Upper Slope to the Abyssal NE Pacific Ocean. Deep. Sea. Res. Part II Top. Stud. Oceanogr. 45 (4-5), 667–, 687. doi: 10.1016/S0967-0645(98)00002-2
Druffel E., Griffin S., Glynn C., Benner R., Walker B. (2017). Radiocarbon in Dissolved Organic and Inorganic Carbon of the Arctic Ocean. Geophys. Res. Lett. 44 (5), 2369–2376. doi: 10.1002/2016GL072138
Druffel E., Williams P., Bauer J., Ertel J. (1992). Cycling of Dissolved and Particulate Organic Matter in the Open Ocean. J. Geophys. Res. Ocean. 97 (C10), 15639–15659. doi: 10.1029/92JC01511
Dubinsky Z., Berman-Frank I (2001). Ncoupling Primary Production From Population Growth in Photosynthesizing Organisms in Aquatic Ecosystems. Aquat. Sci. 63 (4), 17. doi: 10.1007/PL00001343
Fawcett S., Lomas M., Casey J., Ward B., Sigman D. (2011). Assimilation of Upwelled Nitrate by Small Eukaryotes in the Sargasso Sea. Nat. Geosci. 4, 717–722. doi: 10.1038/ngeo1265
Fripiat F., Declerq M., Sapart C., Anderson L., Bruechert V., Deman F., et al. (2018). Influence of the Bordering Shelves on Nutrient Distribution in the Arctic Halocline Inferred From Water Column Nitrate Isotopes. Limno. Oceanogr. 63 (5), 2154–2170. doi: 10.1002/lno.10930
Goericke R., Fry B. (1994). Variations of Marine Plankton δ13c With Latitude, Temperature, and Dissolved CO2 in the World Ocean. Glob. Biogeochem. Cycle. 8, 85–90. doi: 10.1029/93GB03272
Granger J., Sigman D. M., Gagnon J., Tremblay J., Mucci E. (2018). On the Properties of the Arctic Halocline and Deep Water Masses of the Canada Basin From Nitrate Isotope Ratios. J. Geophys. Res. Oceans 123(8), 5443–58. doi: 10.1029/2018JC014110
Hansell D. A., Carlson C. A., Repeta D. J., Schlitzer (2009). Dissolved Organic Matter In The Ocean: A Controversy Stimulates New Insights. Oceanography 22(4), 202–11. doi: 10.5670/Oceanog.2009.109
Hamilton J., Wu Y. (2013). Synopsis and Trends in the Physical Environment of Baffin. Can. Tech. Rep. Hydrogr. Ocean. Sci. 282, 39
Hill J., Wheeler P. (2002). Organic Carbon and Nitrogen in the Northern California Current System: Comparison of Offshore, River Plume, and Coastally Upwelled Waters. Prog. Oceanogr. 53 (2-4), 369–387. doi: 10.1016/S0079-6611(02)00037-X
Hobson K., Fisk A., Karnovsky N., Holst M., Gagnon J., Fortier M. (2002). A Stable Isotope (δ13c, δ15n) Model for the North Water Food Web: Implications for Evaluating Trophodynamics and the Flow of Energy and Contaminants. Deep. Sea. Res. Part II Top. Stud. Oceanogr. 42, 5131–5150. doi: 10.1016/S0967-0645(02)00182-0
Holding J., Carlos D., Delgado-Huertas A., Soetaert K., Vonk K., Agusti S., et al. (2017). Autochthonous and Allochthonous Contributions of Organic Carbon to Microbial Food Webs in Svalbard Fjords. Limnol. Oceanogr. 62 (3), 1307–1323. doi: 10.1002/lno.10526
Honjo S., Krishfield R., Eglinton T., Manganini S., Kemp J., Doherty K., et al. (2010). Biological Pump Processes in the Cryopelagic and Hemipelagic Arctic Ocean: Canada Basin and Chukchi Rise. Prog. Oceanogr. 85 (3-4), 137–170. doi: 10.1016/j.pocean.2010.02.009
Hopkinson C., Vallino J. (2005). Efficient Export of Carbon to the Deep Ocean Through Dissolved Organic Matter. Nature 433, 142–145. doi: 10.1038/nature03191
Hwang J., Druffel E. (2003). Lipid-Like Material as the Source of the Uncharacterized Organic Carbon in the Ocean? Science 299 (5608), 881–884. doi: 10.1126/science.1078508
Hwang J., Druffel E., Eglinton T. (2010). Widespread Influence of Resuspended Sediments on Oceanic Particulate Organic Carbon: Insights From Radiocarbon and Aluminum Contents in Sinking Particles. Glob. Biogeochem. Cycle. 24, GB4016. doi: 10.1029/2010GB003802
Hwang J., Druffel E., Komada T. (2005). Transport of Organic Carbon From the California Coast to the Slope Region: A Study of Δ14C and δ13c Signatures of Organic Compound Classes. Global Biogeochem. Cycles. 19 (2), GB2018. doi: 10.1029/2004GB002422
Hwang J., Druffel E. R. M. (2006). Carbon Isotope Ratios of Organic Compound Fractions in Oceanic Suspended Particles. Geophys. Res. Lett. 33, L23610. doi: 10.1029/2006GL027928
Hwang J., Druffel E. R. M., Bauer J. (2006). Incorporation of Aged Dissolved Organic Carbon (DOC) By Oceanic Particulate Organic Carbon (POC): An Experimental Approach Using Natural Carbon Isotopes? Marine Chemistry 98, 315–322.
Krawczyk D., Kryk A., Juggins S., Burmeister A., Pearce C., Seidenkrantz M.-S., et al. (2021). Spatio-Temporal Changes in Ocean Conditions and Primary Production in Baffin Bay and the Labrador Sea. Palaeogeogr. Palaeoclimatol. Palaeoecol. 563, 110175. doi: 10.1016/j.palaeo.2020.110175
Lalande C., Forest A., Barber D., Gratton Y., Fortier L. (2009). Variability in the Annual Cycle of Vertical Particulate Organic Carbon Export on Arctic Shelves: Contrasting the Laptev Sea, Northern Baffin Bay and the Beaufort Sea. Cont. Shelf. Res. 29 (17), 2157–2165. doi: 10.1016/j.csr.2009.08.009
Lee Y., Lim H., Yoon H. (2009). Carbon and Nitrogen Isotope Composition of Vegetation on King George Island, Maritime Antarctic. Polar. Biol. 32, 1607–1615. doi: 10.1007/s00300-009-0659-5
Lehmann N., Kienast M., Granger J., Bourbonnais A., Altabet M., Tremblay J.-E. (2019). Remote Western Arctic Nutrients Fuel Remineralization in Deep Baffin Bay. Glob. Biogeochem. Cycle., 33 (6) 649–667. doi: 10.1029/2018GB006134
Levasseur M. E., Therriault J. C. (1987). Phytoplankton Biomass and Nutrient Dynamics in a Tidally Induced Upwelling: The Role of NO3:Si(OH)4 Ratio. Mar. Ecol. Prog. Ser., 39, 87–97. doi: 10.3354/meps039087
Levin I., Naegler T., Kromer B., Diehl M., Francey R., Gomez-Pelaez A., et al. (2010). Observations and Modelling of the Global Distribution and Long-Term Trend of Atmospheric 14CO2. Tellus. B Chem. Phys. Meteorol. 62 (1), 26–46. doi: 10.1111/j.1600-0889.2009.00446.x
Limoges A., Weckström K., Ribeiro S., Georgiadis E., Hansen K., Martinez P., et al. (2020). Learning From the Past: Impact of the Arctic Oscillation on Sea Ice and Marine Productivity Off Northwest Greenland Over the Last 9,000 Years. Glob. Chang. Biol. 26 (12), 6767–6786. doi: 10.1111/gcb.15334
Loh A. N., Bauer J. (2000). Distribution, Partitioning and Fluxes of Dissolved and Particulate Organic C, N and P in the Eastern North Pacific and Southern Oceans. Deep. Sea. Res. Part I Oceanogr. Res. Pap. 47 (12), 2287–2316. doi: 10.1016/S0967-0637(00)00027-3
Magen C., Chaillou G., Crowe S., Mucci A., Sundby B., Gao A., et al. (2010). Origin and Fate of Particulate Organic Matter in the Southern Beaufort Sea – Amundsen Gulf Region, Canadian Arctic. Estuar. Coast. Shelf. Sci. 86 (1), 31–41. doi: 10.1016/j.ecss.2009.09.009
McNichol A., Aluwihare L. (2007). The Power of Radiocarbon in Biogeochemical Studies of the MarineCarbon Cycle: Insights From Studies of Dissolved and Particulate Organic Carbon (DOC and POC). Chem. Rev. 107 (2), 443–466. doi: 10.1021/cr050374g
Mei Z.-P., Legendre L., Tremblay J.-É., Miller L., Gratton Y., Lovejoy C., et al. (2005). Carbon to Nitrogen (C:N) Stoichiometry of the Spring–Summer Phytoplankton Bloom in the North Water Polynya (NOW). Deep. Sea. Res. Part I Oceanogr. Res. Pap. 52 (12), 2301–2314. doi: 10.1016/j.dsr.2005.07.001
Meire L., Mortensen J., Meire P., Juul-Pedersen T., Sejr M., Rysgaard S., et al. (2017). Marine-Terminating Glaciers Sustain High Productivity in Greenland Fjords. Glob. Chang. Biol. 23 (12), 5344–5357. doi: 10.1111/gcb.13801
Melling G., Gratton Y., Ingram G. (2001). Ocean Circulation Within the North Water Polynya of Baffin Bay. Atmosphere-Ocean 39, 301–325. doi: 10.1080/07055900.2001.9649683
Middelburg J. (2019). “Carbon Processing at the Seafloor,” in Marine Carbon Biogeochemistry (Cham: Springer). doi: 10.1007/978-3-030-10822-9_4
Münchow A., Falker K., Melling H. (2015). Baffin Island and West Greenland Current Systems in Northern Baffin Bay. Prog. Oceanogr. 132, 305–317. doi: 10.1016/j.pocean.2014.04.001
Naidu A., Scalan R., Feder H., Goering J., Hameedi M., Parker P., et al. (1993). Stable Organic Carbon Isotopes in Sediments of the North Bering-South Chukchi Seas, Alaskan-Soviet Arctic Shelf. Cont. Shelf. Res. 13 (5-6), 669–691. doi: 10.1016/0278-4343(93)90099-J
Passow U., Carlson C. (2012). The Biological Pump in a High CO2 World. Mar. Ecol. Prog. Ser. 470, 249–271. doi: 10.3354/meps09985
Rafter P., Bagnell A., Marconi D., DeVries T. (2019). Global Trends in Marine Nitrate N Isotopes From Observations and a Neural Network-Based Climatology. Biogeosciences 16, 2617–2633. doi: 10.5194/bg-16-2617-2019
Rau G., Karl D., Carney R. (1986). Does Inorganic Carbon Assimilation Cause 14C Depletion in Deep-Sea Organisms? Deep. Sea. Res. Part I Oceanogr. Res. Pap. 33(3), 349–357. doi: 10.1016/0198-0149(86)90096-8
Rau G., Sweeney R., Kaplan I. (1982). Plankton 13C:12C Ratio Changes With Latitude: Differences Between Northern and Southern Oceans☆. Deep. Sea. Res. Part I Oceanogr. Res. Pap., 29 (8), 1035–1039. doi: 10.1016/0198-0149(82)90026-7
Rau G., Takahashi T., Des Marais D., Repeta D., Martin J. (1992). The Relationship Between δ13c of Organic Matter and [CO2 (Aq)] in Ocean Surface Water: Data From a JGOFS Site in the Northeast Atlantic Ocean and a Model. Geochim. Cosmochim. Acta 56, 1413–1419. doi: 10.1016/0016-7037(92)90073-R
Redfield A. (1958). The Biological Control of Chemical Factors in the Environment. Am. Sci. 46 (3), 230A–221.
Richardson T., Jackson G. (2007). Small Phytoplankton and Carbon Export From the Surface Ocean. Science 315 (5813), 838–840. doi: 10.1126/science.1133471
Roland L., McCarthy M., Guilderson T. (2008). Sources of Molecularly Uncharacterized Organic Carbon in Sinking Particles From Three Ocean Basins: A Coupled Δ14C and δ13c Approach. Mar. Chem. 111 (3-4), 199–213. doi: 10.1016/j.marchem.2008.05.010
Roy V., Iken K., Gosselin M., Tremblay J.-E., Belanger S., Archambault P. (2015). Benthic Faunal Assimilation Pathways and Depth-Related Changes in Food-Web Structure Across the Canadian Arctic. Deep. Sea. Res. Part I Oceanogr. Res. Pap. 102, 55–71. doi: 10.1016/j.dsr.2015.04.009
Sarmiento J. (2013). Ocean Biogeochemical Dynamics (Princeton: Princeton University Press). doi: 10.1515/9781400849079
Sherwood O., Davin S., Lehmann N., Buchwald C., Edinger E., Lehmann M., et al. (2021). Stable Isotope Ratios in Seawater Nitrate Reflect the Influence of Pacific Water Along the Northwest Atlantic Margin. Biogeosciences 18 (15), 4491–4510. doi: 10.5194/bg-18-4491-2021
Shiklomanov A., Déry S., Tretiakov M., Yang D., Magritsky D., Georgiadi A., et al. (2021). “River Freshwater Flux to the Arctic,” in Arctic Hydrology, Permafrost and Ecosystems. Eds. Yang D., Kane D. L. (Cham: Springer), 703–738. doi: 10.1007/978-3-030-50930-9_24
Sigman D., Casciotti K. (2001). “Nitrogen Isotopes in the Ocean,” in Encyclopedia of Ocean Sciences. Ed. Steele J. (Oxford: Academic Press), 1884–1894. doi: 10.1006/rwos.2001.0172
Smith D., Simon M., Alldredge A., Azam F. (1992). Intense Hydrolytic Enzyme Activity on Marine Aggregates and Implications for Rapid Particle Dissolution. Nature 359, 139–142. doi: 10.1038/359139a0
Stuiver M., Polach H. A. (1977). Discussion; Reporting of C-14 Data. Radiocarbon 19, 355–363. doi: 10.1017/S0033822200003672
Tamelander T., Renaud P., Hop H., Carroll M., Ambrose W., Hobson K. (2006). Trophic Relationships and Pelagic–Benthic Coupling During Summer in the Barents Sea Marginal Ice Zone, Revealed by Stable Carbon and Nitrogen Isotope Measurements. Mar. Ecol. Prog. Ser. 310, 33–46. doi: 10.3354/meps310033
Tang C., Ross C., Yao T., Petrie B., DeTracey B., Dunlap E. (2004). The Circulation, Water Masses and Sea-Ice of Baffin Bay. Prog. Oceanogr. 63 (4), 183–228. doi: 10.1016/j.pocean.2004.09.005
Taylor J. (1997). An Introduction to Error Analysis: The Study of Uncertainties in Physical Measurements (2nd Edition Ed.) (Saussalito, CA: University Science Books).
Volkman J., Tanoue E. (2002). Chemical and Biological Studies of Particulate Organic Matter in the Ocean. J. Oceanogr. 58, 265–279. doi: 10.1023/A:1015809708632
Walker B., Beaupre S., Guilderson T., McCarthy M., Druffel E. (2016). Pacific Carbon Cycling Constrained by Organic Matter Size, Age and Composition Relationships. Nat. Geosci. 9, 888–891. doi: 10.1038/ngeo2830
Walker B., Druffel E., Kolasinki J., Roberts B., Xu X., Rosenheim B. (2017). Stable and Radiocarbon Isotopic Composition of Dissolved Organic Matter in the Gulf of Mexico. Geophys. Res. Lett. 44, 8424–8434. doi: 10.1002/2017GL074155
Walker B., Guilderson T., Okimura K., Peacock M., McCarthy M. (2014). Radiocarbon Signatures and Size–Age–Composition Relationships of Major Organic Matter Pools Within a Unique California Upwelling System. Geochim. Cosmochim. Acta 126, 1–17. doi: 10.1016/j.gca.2013.10.039
Walker B., McCarthy M. (2012). Elemental and Isotopic Characterization of Dissolved and Particulate Organic Matter in a Unique California Upwelling System: Importance of Size and Composition in the Export of Labile Material. Limnol. Oceanogr. 57 (6), 1757–1774. doi: 10.4319/lo.2012.57.6.1757
Walker B., Xu X. (2019). An Improved Method for the Sealed-Tube Zinc Graphitization of Microgram Carbon Samples and 14C AMS Measurement. Nucl. Instrum. Methods Phys. Res. B 438, 58–65. doi: 10.1016/j.nimb.2018.08.004
Williams P., Robertson K., Soutar A., Griffin S., Druffel E. (1992). Isotopic Signatures (14C, 13C, 15N) as Tracers of Sources and Cycling of Soluble and Particulate Organic Matter in the Santa Monica Basin, California. Prog. Oceanog. 30, 253–290. doi: 10.1016/0079-6611(92)90015-R
Xu X., Trumbore S., Zheng S., Southon J., McDuffee K., Luttgen M., et al. (2007). Modifying a Sealed Tube Zinc Reduction Method for Preparation of AMS Graphite Targets: Reducing Background and Attaining High Precision. Nucl. Instrum. Methods Phys. Res. B 259 (1), 320–329. doi: 10.1016/j.nimb.2007.01.175
Keywords: particulate organic matter, radiocarbon, 13C, 15N, 14C, Baffin Bay, Arctic, C:N
Citation: Fox A and Walker BD (2022) Sources and Cycling of Particulate Organic Matter in Baffin Bay: A Multi-Isotope δ13C, δ15N, and Δ14C Approach. Front. Mar. Sci. 9:846025. doi: 10.3389/fmars.2022.846025
Received: 30 December 2021; Accepted: 01 April 2022;
Published: 23 May 2022.
Edited by:
Jixin Qiao, Technical University of Denmark, DenmarkCopyright © 2022 Fox and Walker. This is an open-access article distributed under the terms of the Creative Commons Attribution License (CC BY). The use, distribution or reproduction in other forums is permitted, provided the original author(s) and the copyright owner(s) are credited and that the original publication in this journal is cited, in accordance with accepted academic practice. No use, distribution or reproduction is permitted which does not comply with these terms.
*Correspondence: Brett D. Walker, YnJldHQud2Fsa2VyQHVvdHRhd2EuY2E=
Disclaimer: All claims expressed in this article are solely those of the authors and do not necessarily represent those of their affiliated organizations, or those of the publisher, the editors and the reviewers. Any product that may be evaluated in this article or claim that may be made by its manufacturer is not guaranteed or endorsed by the publisher.
Research integrity at Frontiers
Learn more about the work of our research integrity team to safeguard the quality of each article we publish.