- 1Institute of Marine Environment and Ecology, National Taiwan Ocean University, Keelung, Taiwan
- 2Center of Excellence for the Oceans, National Taiwan Ocean University, Keelung, Taiwan
- 3Institute of Earth Sciences, College of Ocean Science and Resource, National Taiwan Ocean University, Keelung, Taiwan
Methane (CH4) is an important greenhouse gas, and its concentrations in aquatic areas are heavily influenced by anthropogenic activities, especially human-induced eutrophication, polluted river discharge and wastewater treatment plant (WWTP) effluents. Although coastal areas and estuaries contribute large amounts of global oceanic CH4 emissions, the relative contributions of different sources have not been well determined. The Tamsui River located in northern Taiwan is an urban river flowing through populated cities and thus likely carries large amounts of contaminants, such as nutrients and organic matter to the estuary. In this study, we characterized the spatial distribution and seasonal variations in CH4 in the Tamsui River estuary adjacent marine areas. The sea-to-air CH4 fluxes were also estimated to quantify the strength of the study area as an atmospheric CH4 source. Our results showed that CH4 concentrations in coastal sea areas were influenced by WWTP effluents, sediment and freshwater inputs. Thus, river discharge and nutrient levels as well as strong vertical mixing and disturbances might increase CH4 concentrations and emissions. The seasonal surface CH4 concentrations and sea-to-air CH4 fluxes were 13.7 ± 18.7 nM and 41.7 ± 68.0 μmol m-2 d-1 in autumn; 29.3 ± 19.8 nM and 61.3 ± 44.6 μmol m-2 d-1 in spring; 21.8 ± 13.9 nM and 37.0 ± 26.2 μmol m-2 d-1 in summer; and 27.0 ± 21.4 nM and 85.9 ± 75.4 μmol m-2 d-1 in winter.
Introduction
Methane (CH4), the second most important greenhouse gas after carbon dioxide (CO2), has global warming potential over a 20-year time frame (GWP20) that is 86 times as high as that of CO2 (IPCC, 2013). It accounts for 16–25% of atmospheric warming to date (Etminan et al., 2016). The global atmospheric CH4 concentration has increased significantly from a preindustrial value of 722 ± 25 ppb in 1750 to 1803 ± 2 ppb in 2011, and the most plausible cause of the increase in CH4 concentration is human activities (IPCC, 2013). Kirschke et al. (2013) estimated that the global surface-to-air CH4 emissions from 2000 to 2009 were 678 Tg CH4 yr−1, with a large range of 542-852 Tg CH4 yr−1. Jackson et al. (2020) also reported that the average global CH4 emissions for 2017 were 596 Tg CH4 yr−1, with a range of 572–614 Tg CH4 yr−1. The open ocean is a modest source of CH4 to the atmosphere at a rate of less than 2 Tg CH4 yr−1 (Rhee et al., 2009). A large fraction of marine-originated CH4 in the atmosphere is produced in oxygenated surface waters that are oversaturated with CH4 in relation to atmospheric equilibrium (Karl et al., 2008; Repeta et al., 2016), an unexplained phenomenon referred to as the marine methane paradox (Reeburgh, 2007; Repeta et al., 2016). Previous research has revealed that most CH4 found in the euphotic zone was released during zooplankton grazing (de Angelis and Lee, 1994) or in anoxic microenvironments within zooplankton fecal pellets (Tilbrook and Karl, 1994). Recent research has determined that the formation of CH4 in oxic environments can occur via methylphosphonate cycling (Karl et al., 2008) and by dimethylsulfide (DMS) cycling (Damm et al., 2010; Florez-Leiva et al., 2013; Zindler et al., 2013). Moreover, Bogard et al. (2014) suggested a possible link between CH4 concentration and phytoplankton standing stock (i.e., chlorophyll a), which implies that factors influencing phytoplankton standing stock, such as grazing, nutrient availability and the physical structure of the water column, have a strong bearing on pelagic CH4 dynamics.
Coastal regions are more intense sources of CH4 to the atmosphere, which contribute approximately 75% of global oceanic CH4 emissions (Bange et al., 1994). Continental shelves emit approximately 13 Tg CH4 yr−1 (Bange et al., 1994), whereas estuaries emit between 1 and 7 Tg CH4 yr−1 (Bange et al., 1994; Upstill-Goddard et al., 2000). The high CH4 concentrations in the surface waters of continental shelves are due to direct CH4 inputs from estuaries and sediments where methanogenesis is sustained by abundant organic matter sedimentation (Bange et al., 1994; Rehder et al., 1998; Upstill-Goddard et al., 2000; Middelburg et al., 2002; Borges et al., 2018). In addition, the impacts of human activities on coastal CH4 emissions, such as dam construction (Chen et al., 2008), eutrophication (Beaulieu et al., 2019), wastewater discharge into coastal areas (Du et al., 2018), changes in hydrology (Pekel et al., 2016) and climate feedbacks, such as microbial responses to warming (Yvon-Durocher et al., 2014), are not well understood and have been poorly quantified. Beaulieu et al. (2019) and Nijman et al. (2021) also reported that future CH4 emissions from lakes and impoundments worldwide may increase due to increases in nutrients and water temperature. Borges et al. (2018) also found that productivity and temperature are drivers to seasonal and spatial variations of dissolved methane in the Southern Bight of the North Sea. In addition, Myllykangas et al. (2019) addressed that eutrophication and climate change may accelerate CH4 emissions from estuaries, causing positive feedbacks with global warming.
The scope of this study is to investigate seasonal distributions of methane in a populous urban coastal sea area. Estuaries transfer terrestrial matter and human impacts (nutrients, organic matter etc.) from land to ocean. The Tamsui River is a populous urban river, and the highest regional population density in its catchment reaches 38,607 people per km2 (Yonghe district). Recent research (Borges et al., 2016; Gelesh et al., 2016; Borges et al., 2018; Humborg et al., 2019) has found massive CH4 emissions in estuaries and coastal water during summertime, which might be due to temperature controlling methanogenesis in organic matter rich sediments. Since the seawater temperature was higher in tropical/subtropical areas than in temperate regions, the CH4 concentrations in the water might also be higher, especially under future climate change. Seasonal data collection is needed for a comprehensive view of the situation. This research aims to understand the seasonal variations in CH4 concentrations as well as their interaction with other environmental factors that may be influenced by human activities in a populous urban coastal area.
Materials and Methods
Study Area
The Tamsui River is located in northern Taiwan (Figure 1) and has a total length of 159 km. The catchment area of the Tamsui River is 2,726 km2, and it covers the whole metropolitan area of Taipei, the capital city of Taiwan. The drainage basin includes several regions along the main tributaries where large amounts of nutrients, resulting from industrial and agricultural activities, enter the river (Wen et al., 2008). The Tamsui River delivers materials, including suspended particles, nutrients, organic matter, and pollutants, from land into its estuary and adjacent marine areas. There were 7.13 million people living in the catchment, and approximately 60% of the population utilized the sanitary sewers in 2019 (Tseng et al., 2021). The largest wastewater treatment plant (WWTP) in Taiwan is located near the Tamsui River estuary (Figure 1), and its ocean outfall pipe extends from the shore and enters the ocean. The outlet of the ocean outfall pipe of the WWTP was located near sampling station 11 (Figure 1) and its diffuser tubes are 3 km from shore at water depths between 30 m and 40 m.
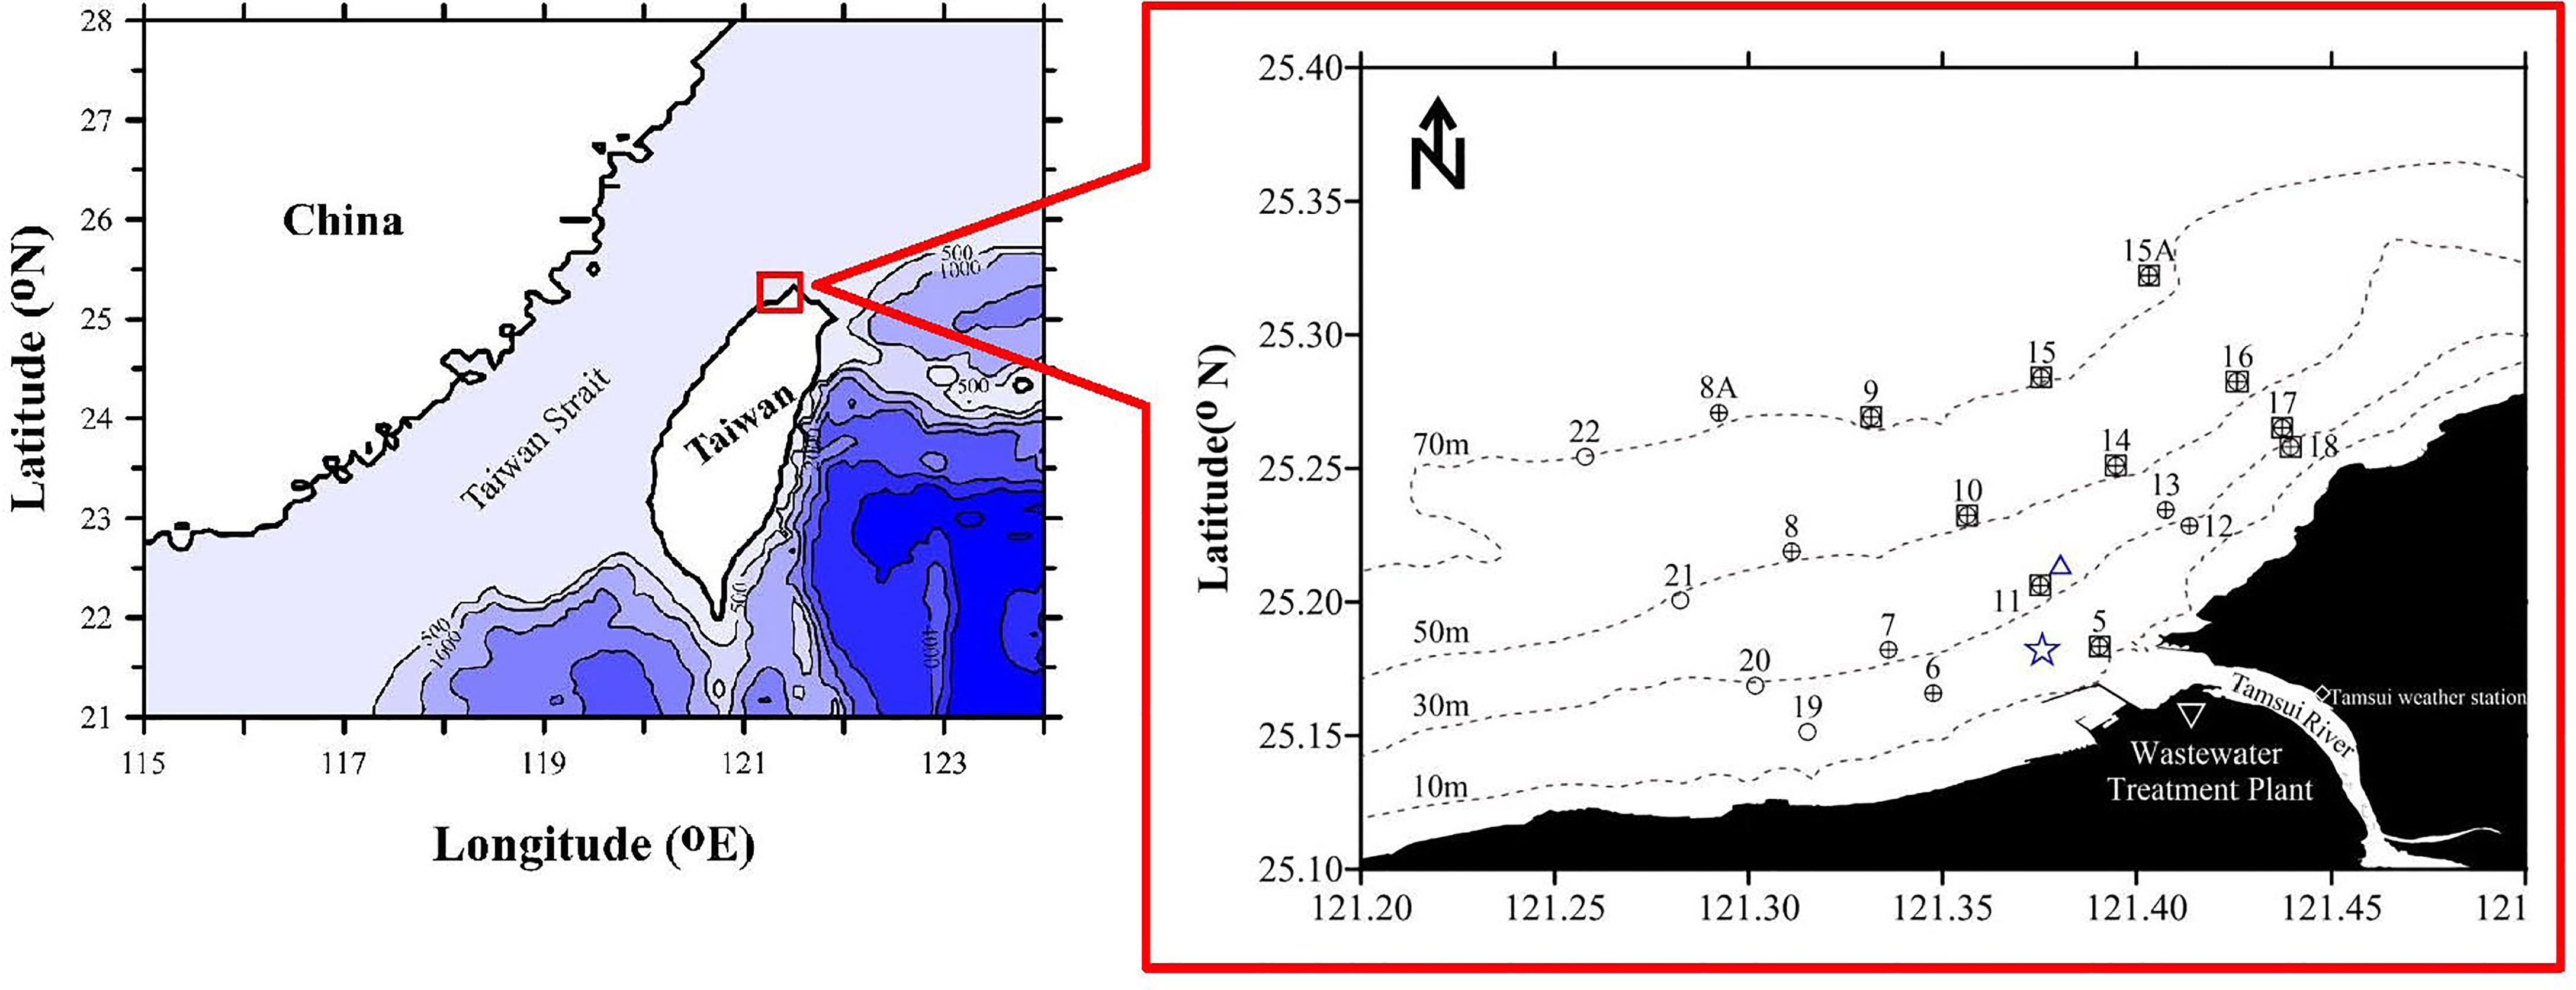
Figure 1 Study area and station locations. +: OR2-2390 (November 2019); ○: NOR2-0004 (May 2020) and NOR2-0009 (August 2020); □: NOR2-0027 (January 2021). Δ: ocean outfall pipe of wastewater treatment plant. ☆: Wind station.
The regional climate is subtropical, with temperatures varying between 10 and 35 °C and annual precipitation ranging between 1500 and 2500 mm (Wen et al., 2008). The dry season ranges from November to April, and the wet season ranges from May to October. According to the historical data from the Tamsui weather station (Figure 1) over the past 25 years (1995-2020), the average rainfall is 776 ± 269 mm during the dry season, while it is 1322 ± 440 mm during the wet season (Central Weather Bureau: https://www.cwb.gov.tw/eng/).
Cruise Information and Sampling Instruments
Seasonal samples were taken in the Tamsui River estuary adjacent sea area (Figure 1) during four cruises onboard R/V Ocean Researcher 2 and R/V New Ocean Researcher 2: OR2-2390 (November 2019), NOR2-0004 (May 2020), NOR2-0009 (August 2020), and NOR2-0027 (January 2021). Discrete water samples were taken at various depths at 16 sampling stations in autumn (November 2019) and 20 sampling stations in spring (May 2020) and summer (August 2020). Due to the adverse weather conditions in winter (January 2021), discrete water samples were taken at various depths at 6 sampling stations, and surface water samples were taken at 10 sampling stations. The vertical profiles of seawater temperature and salinity were measured with a conductivity–temperature–depth instrument (CTD; SBE 9/11, Seabird Scientific, USA). Seawater samples from various depths were collected using a carousel water sampler (SBE32, Seabird Scientific, USA) that was fitted with 20 L Teflon-coated Go-Flo bottles (General Oceanic, USA) mounted on a CTD assembly.
Chemical Analysis
Water samples for nutrient analysis were placed in 100 mL polypropylene bottles and immediately frozen with liquid nitrogen. The methods employed for nitrate (NO3-) and phosphate PO43− analysis are described in detail elsewhere (Gong et al., 1996; Gong et al., 2000), and the precision was ±0.3 and ±0.01 μmol L-1, respectively. Dissolved oxygen (DO) was measured by spectrophotometry (Pai et al., 1993) with a precision of approximately ± 0.32% at the 190 μmol L-1 level. Water samples for chlorophyll a (Chl a) analysis were immediately filtered through GF/F filter paper (Whatman, 47 mm) and stored at -20°C. A Turner Designs model 10-AU-005 fluorometer (Turner Inc., USA) was utilized to measure the Chl a concentration following extraction by 90% acetone (Strickland and Parsons, 1972; Gong et al., 1993; Gong et al., 1995).
Water samples for CH4 concentration were collected in 120 mL dark borosilicate serum bottles. The bottles were rinsed three times with the sampled water. After a 2-fold bottle volume was allowed to overflow the bottle, 0.2 mL saturated HgCl2 was added. It was then sealed with a butyl stopper and crimped with an aluminum cap. The samples were stored in a dark box and kept at 4°C. All the water samples were transferred to a laboratory and analyzed within three months of collection. Measurements were made with the headspace technique (Weiss, 1981) and a gas chromatograph (GC; Agilent 7890) with a flame ionization detector (FID). The GC-FID had a 1.8 m long stainless steel column with a diameter of 3.2 mm, which was filled with a 60/80 mesh molecular sieve 5A. The FID was calibrated with pure N2 (Yeong Her, Taiwan) and three commercial gas mixtures with CH4 mixing ratios of 1.16 ppmv (MESA Specialty Gas, USA), 3.02 ppmv (Yeong Her, Taiwan) and 9.60 ppmv (Yeong Her, Taiwan).
CH4 Saturation Ratio and Fluxes
The saturation (R, %) and sea-to-air flux (F, μmol·m−2·d−1) of CH4 were calculated using the following formulas:
Cobs represents the observed concentration of gas dissolved in water, and Ceq is the expected equilibrium water concentration. The expected equilibrium water concentration was calculated using the solubility equation of (Wiesenburg and Norman, 1979), together with the in situ temperature, salinity and molar fraction of CH4 in the air. The atmospheric CH4 concentrations were taken from the NOAA/ESRL in situ program (http://www.esrl.noaa.gov/gmd). The monthly average atmospheric CH4 concentrations at Mauna Loa (Hawaii, United States station) in November, 2019, May 2020, August 2020 and December 2020 were 1900, 1901, 1878 and 1912 ppb, respectively. (The data for Jan. 2021 have not yet come out; therefore, December 2020 monthly average atmospheric CH4 concentrations were used).
Fluxes (μmol·m−2·d−1) of CH4 across the air-water interface were determined by Cobs−Ceq and the gas exchange coefficient k. The value of k is a specific function of the properties of the gas, the temperature (°C) and turbulence and is frequently parameterized as a function of the wind speed. In this study, wind speed at a height of approximately 15 m above the sea surface from a meteorological platform (121.3758°E 25.1817°N; Figure 1) was used. Daily wind speed data were provided by the Harbor and Marine Technology Center (https://www.ihmt.gov.tw/). We calculated k by using the equation established by Wanninkhof (2014). A positive flux indicates gas transfer from the water to the atmosphere.
Results
Marine hydrographic and chemical data as well as Chl a and CH4 were measured during four seasonal cruises in the Tamsui River estuary adjacent marine area. Detailed information on the seasonal cruises and the average hydrographic data, nutrient concentrations, and Chl a and CH4 concentrations are listed in Table 1. Figure 2 presents cross-sectional studies of the Tamsui River estuary adjacent marine area in autumn, spring and summer.
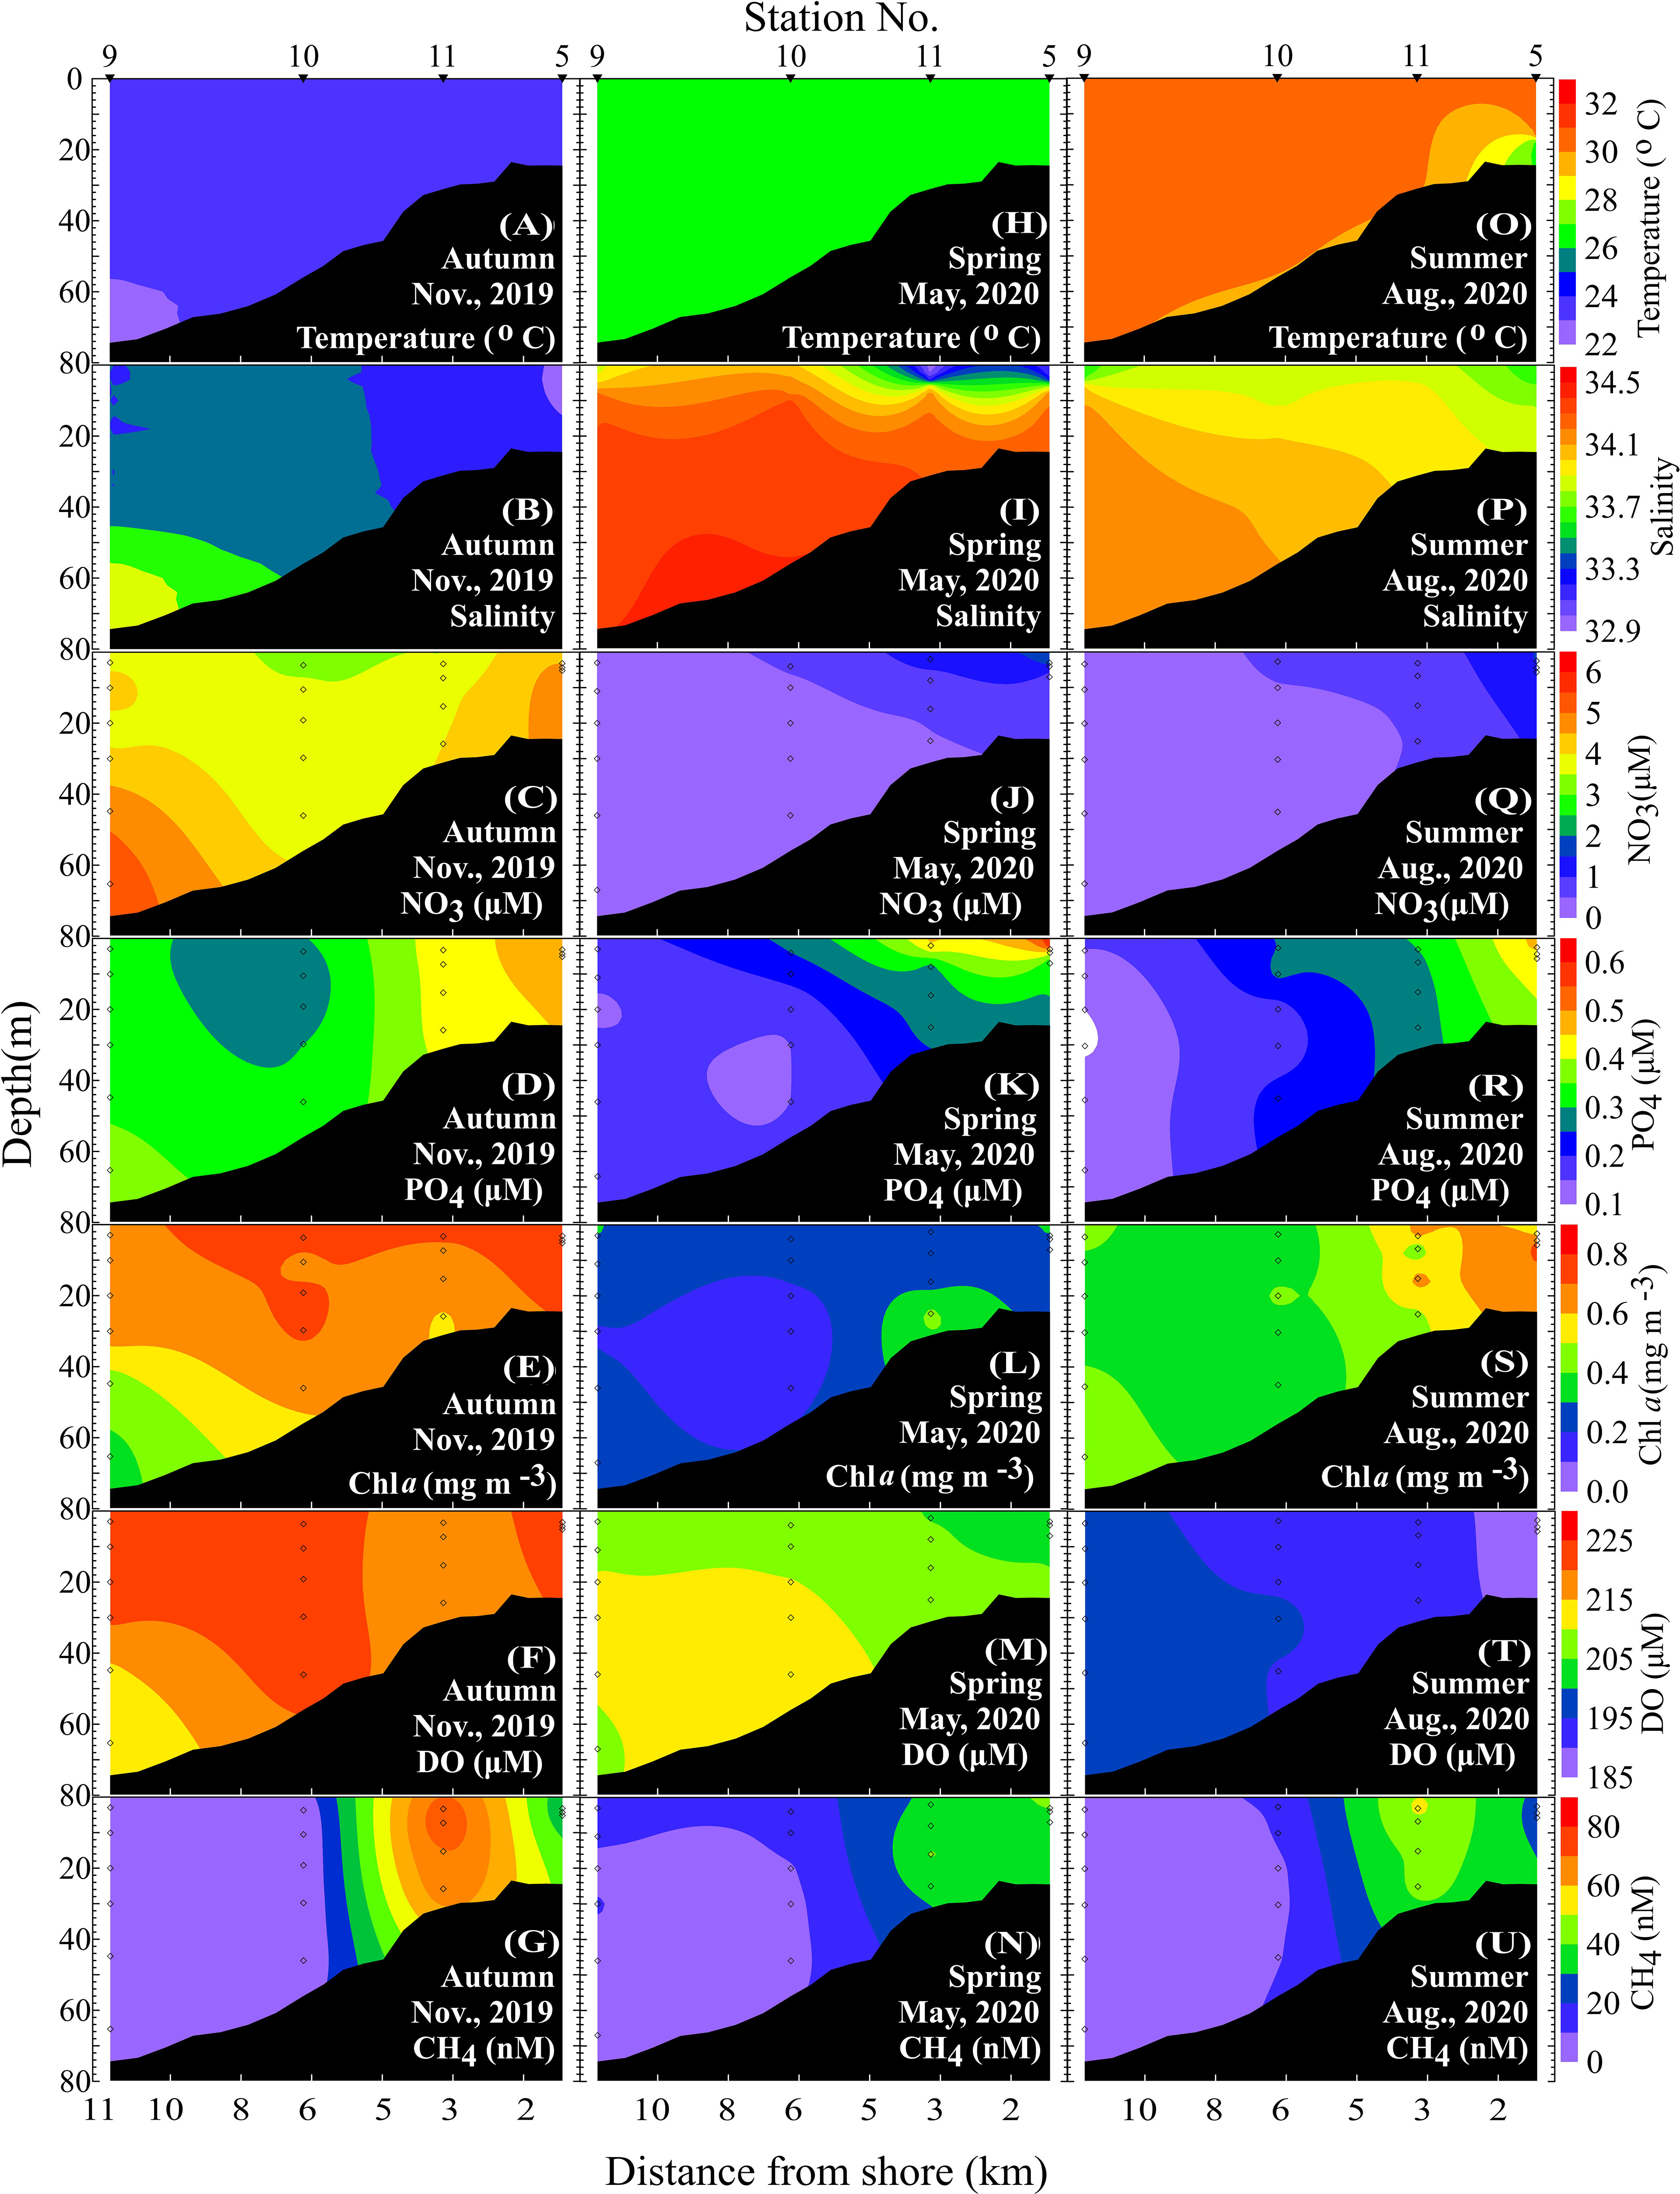
Figure 2 Cross-section of temperature, salinity, NO3, PO4, Chl a, DO and CH4 (A–G) in autumn, (H–N) in spring, and (O–U) in summer.
Marine Environmental Conditions and Methane Concentrations in the Dry Season (Autumn and Winter)
In autumn, the seawater temperature and salinity ranged from 18.9 to 24.0°C and 33.45 to 34.30 (Table 1), respectively. The seawater temperature gradually decreased with depth (Figure 2A), and the lowest salinity values were observed near shore (Figure 2B). The and concentrations ranged from 0.26 to 0.78 μM and 2.9 to 9.4 μM (Table 1), respectively. The nutrient concentrations increased with depth and from offshore to inshore (Figures 2C, D). Chl a concentrations ranged between 0.15 and 1.50 mg m-3 (Table 1) and gradient descent from the surface water (Figure 2E). DO concentrations ranged between 186.7 and 228.9 μM (Table 1) and had the same pattern as the Chl a distributions (Figure 2F). CH4 concentrations ranged from 1.4 to 78.0 nM (Table 1), and high CH4 concentrations were observed near station 11, where the outlet of the ocean outfall pipe which discharged the WWTP effluents was located (Figure 2G). The average surface seawater CH4 concentration was 13.7 ± 18.7 nM. Long-term wind speed data from the meteorological platform were used, and the average wind speed in November between 2005 and 2019 was 7.9 ± 0.8 m/s. The sea-to-air CH4 flux was 46.3 ± 75.4 μmol m-2 d-1 (Table 2).

Table 2 The seasonal average surface hydrographic data, CH4 concentrations, air CH4 concentrations, wind speed and sea-to-air CH4 fluxes.
In winter, only surface water was taken between stations 5 and 9 so there was no cross-sectional figure due to the adverse weather conditions caused by the prevailing northeast monsoon. According to the data from 10 sampling stations, the seawater temperature and salinity ranged from 18.4 to 19.4°C and 33.06 to 34.35 (Table 1), respectively. Although nutrient concentrations were comparably high, with and concentrations ranging from 0.44 to 0.85 μM and 6.0 to 8.5 μM, the Chl a concentrations were low, ranging between 0 and 0.30 mg m-3 (Table 1). DO concentrations were comparably high and ranged between 227.7 and 252.4 μM (Table 1), which might be caused by low temperature and high wind ventilation. Wind speed data between 2005 and 2019 from the meteorological platform were used, and the average wind speed in January was 8.0 ± 0.8 m/s. CH4 concentrations ranged from 5.4 to 69.6 nM, and the average surface CH4 concentration was 27.0 ± 21.4 nM. With a comparably high wind speed, the sea-to-air CH4 flux was as high as 90.4 ± 79.3 μmol m-2 d-1 (Table 2).
Marine Environmental Conditions and Methane Concentrations in the Wet Season (Spring and Summer)
In spring, the seawater temperature and salinity ranged from 26.0 to 27.2°C and 31.68 to 34.46 (Table 1), respectively. The seawater temperature was homogeneous throughout the water column (Figure 2H). The and concentrations ranged from 0.12 to 0.87 μM and 0 to 3.7 μM (Table 1), respectively. Low salinity and high nutrient concentrations were observed in the surface water and near the shore (Figures 2I–K) due to heavy precipitation on the sampling date. Chl a concentrations ranged between 0 and 0.77 mg m-3 (Table 1) and had higher concentrations nearshore (Figure 2L). DO concentrations ranged between 193.1 and 216.0 μM (Table 1) and had a similar pattern as the Chl a distributions (Figure 2M). CH4 concentrations ranged from 4.3 to 77.4 nM (Table 1), and high CH4 concentrations were observed near the shore (Figure 2N). The average surface seawater CH4 concentration was comparably high at 29.3 ± 19.8 nM. The average wind speed in May 2005 and 2019 from the meteorological platform was 5.0 ± 0.6 m/s. The sea-to-air CH4 flux was 47.2 ± 34.3 μmol m-2 d-1 (Table 2).
In summer, the seawater temperature and salinity ranged from 27.0 to 30.8°C and 33.62 to 34.20 (Table 1), respectively. The seawater temperature gradually decreased with depth (Figure 2O), and low salinity values were observed near shore (Figure 2P). The and concentrations ranged from 0.09 to 0.49 μM and 0 to 4.7 μM (Table 1), respectively. Chl a and DO concentrations ranged from 0.15 to 1.60 mg m-3 and 185.0 to 209.4 μM (Table 1), respectively. High nutrient and Chl a concentrations appeared nearshore (Figures 2Q-S) with low salinity (Figure 2P), which indicated freshwater input from the shore. CH4 concentrations ranged from 5.0 to 58.5 nM (Table 1), and high CH4 concentrations were observed near the outlet of the ocean outfall pipe (Figure 2U). The average surface seawater CH4 concentration was 21.8 ± 13.9 nM. The average wind speed in August between 2005 and 2019 from the meteorological platform was 5.0 ± 0.7 m/s. The sea-to-air CH4 flux was 37.0 ± 26.2 μmol m-2 d-1 (Table 2).
Discussion
One of the effective options for mitigating rapid climate change is to reduce CH4 emissions due to its shorter lifetime than CO2 (Shindell et al., 2012), which leads to an urgent need to understand the natural or anthropogenic factors influencing CH4 concentrations and emissions. The aim of this research is to understand the seasonal variations and possible sources of CH4 concentrations as well as their interaction with other environmental factors in a populous urban coastal sea area.
Inputs from WWTP Effluents
Wastewater is a major anthropogenic source of CH4 and one of the fastest growing sources of CH4 emissions (Kirschke et al., 2013). According to the IPCC (2013), the wastewater CH4 emissions from 2000 to 2009 represented 22.7% of all anthropogenic CH4 emissions. Du et al. (2018) reported that CH4 emissions from wastewater in China increased from 1349.01 Gg in 2000 to 3430.03 Gg in 2014, and the highest proportion of emissions was from WWTPs. Cotovicz et al. (2016) found that high CH4 concentrations could be sustained by allochthonous sources, such as sewage networks and polluted rivers, especially under high accumulated precipitation conditions. Yu et al. (2017) also pointed out that high CH4 concentrations are frequently found in the water of urban drainage systems, composed of sewer systems, and WWTPs. According to Figure 2, CH4 concentrations were high from the bottom to the surface water near station 11, where the outlet of the ocean outfall pipe of the WWTP was located. In addition, most of the water samples near the ocean outfall pipe of the WWTP did not follow the Redfield ratio (Figure 3) and were high in surface CH4 concentrations (Figure 4). Moreover, the highest CH4 concentrations in the water column were found near the ocean outfall pipe of the WWTP (Figures 2G, N, U). The inputs from WWTP effluents contributed to the increase in the CH4 concentrations in the study area. The average seasonal surface CH4 concentrations were 13.7 ± 18.7, 29.3 ± 19.8, 21.8 ± 13.9 and 27.0 ± 21.4 nM in autumn, spring, summer and winter, respectively. If water samples near the ocean outfall pipe of the WWTP were excluded, the average seasonal surface CH4 concentrations then became 9.6 ± 8.9, 21.5 ± 13.2, 18.0 ± 8.2 and 15.4 ± 9.1 nM in autumn, spring, summer and winter, respectively. This finding shows that approximately 17-43% of the surface CH4 concentrations in the study area were influenced by the WWTP effluents. The average annual sea-to-air CH4 flux was 56.5 ± 22.3 μmol m-2 d-1 and reached 35.2 ± 8.4 μmol m-2 d-1 when excluding the water samples near the ocean outfall pipe of the WWTP. This result indicated that WWTP effluents influenced approximately one-third of the CH4 emissions in the study area.
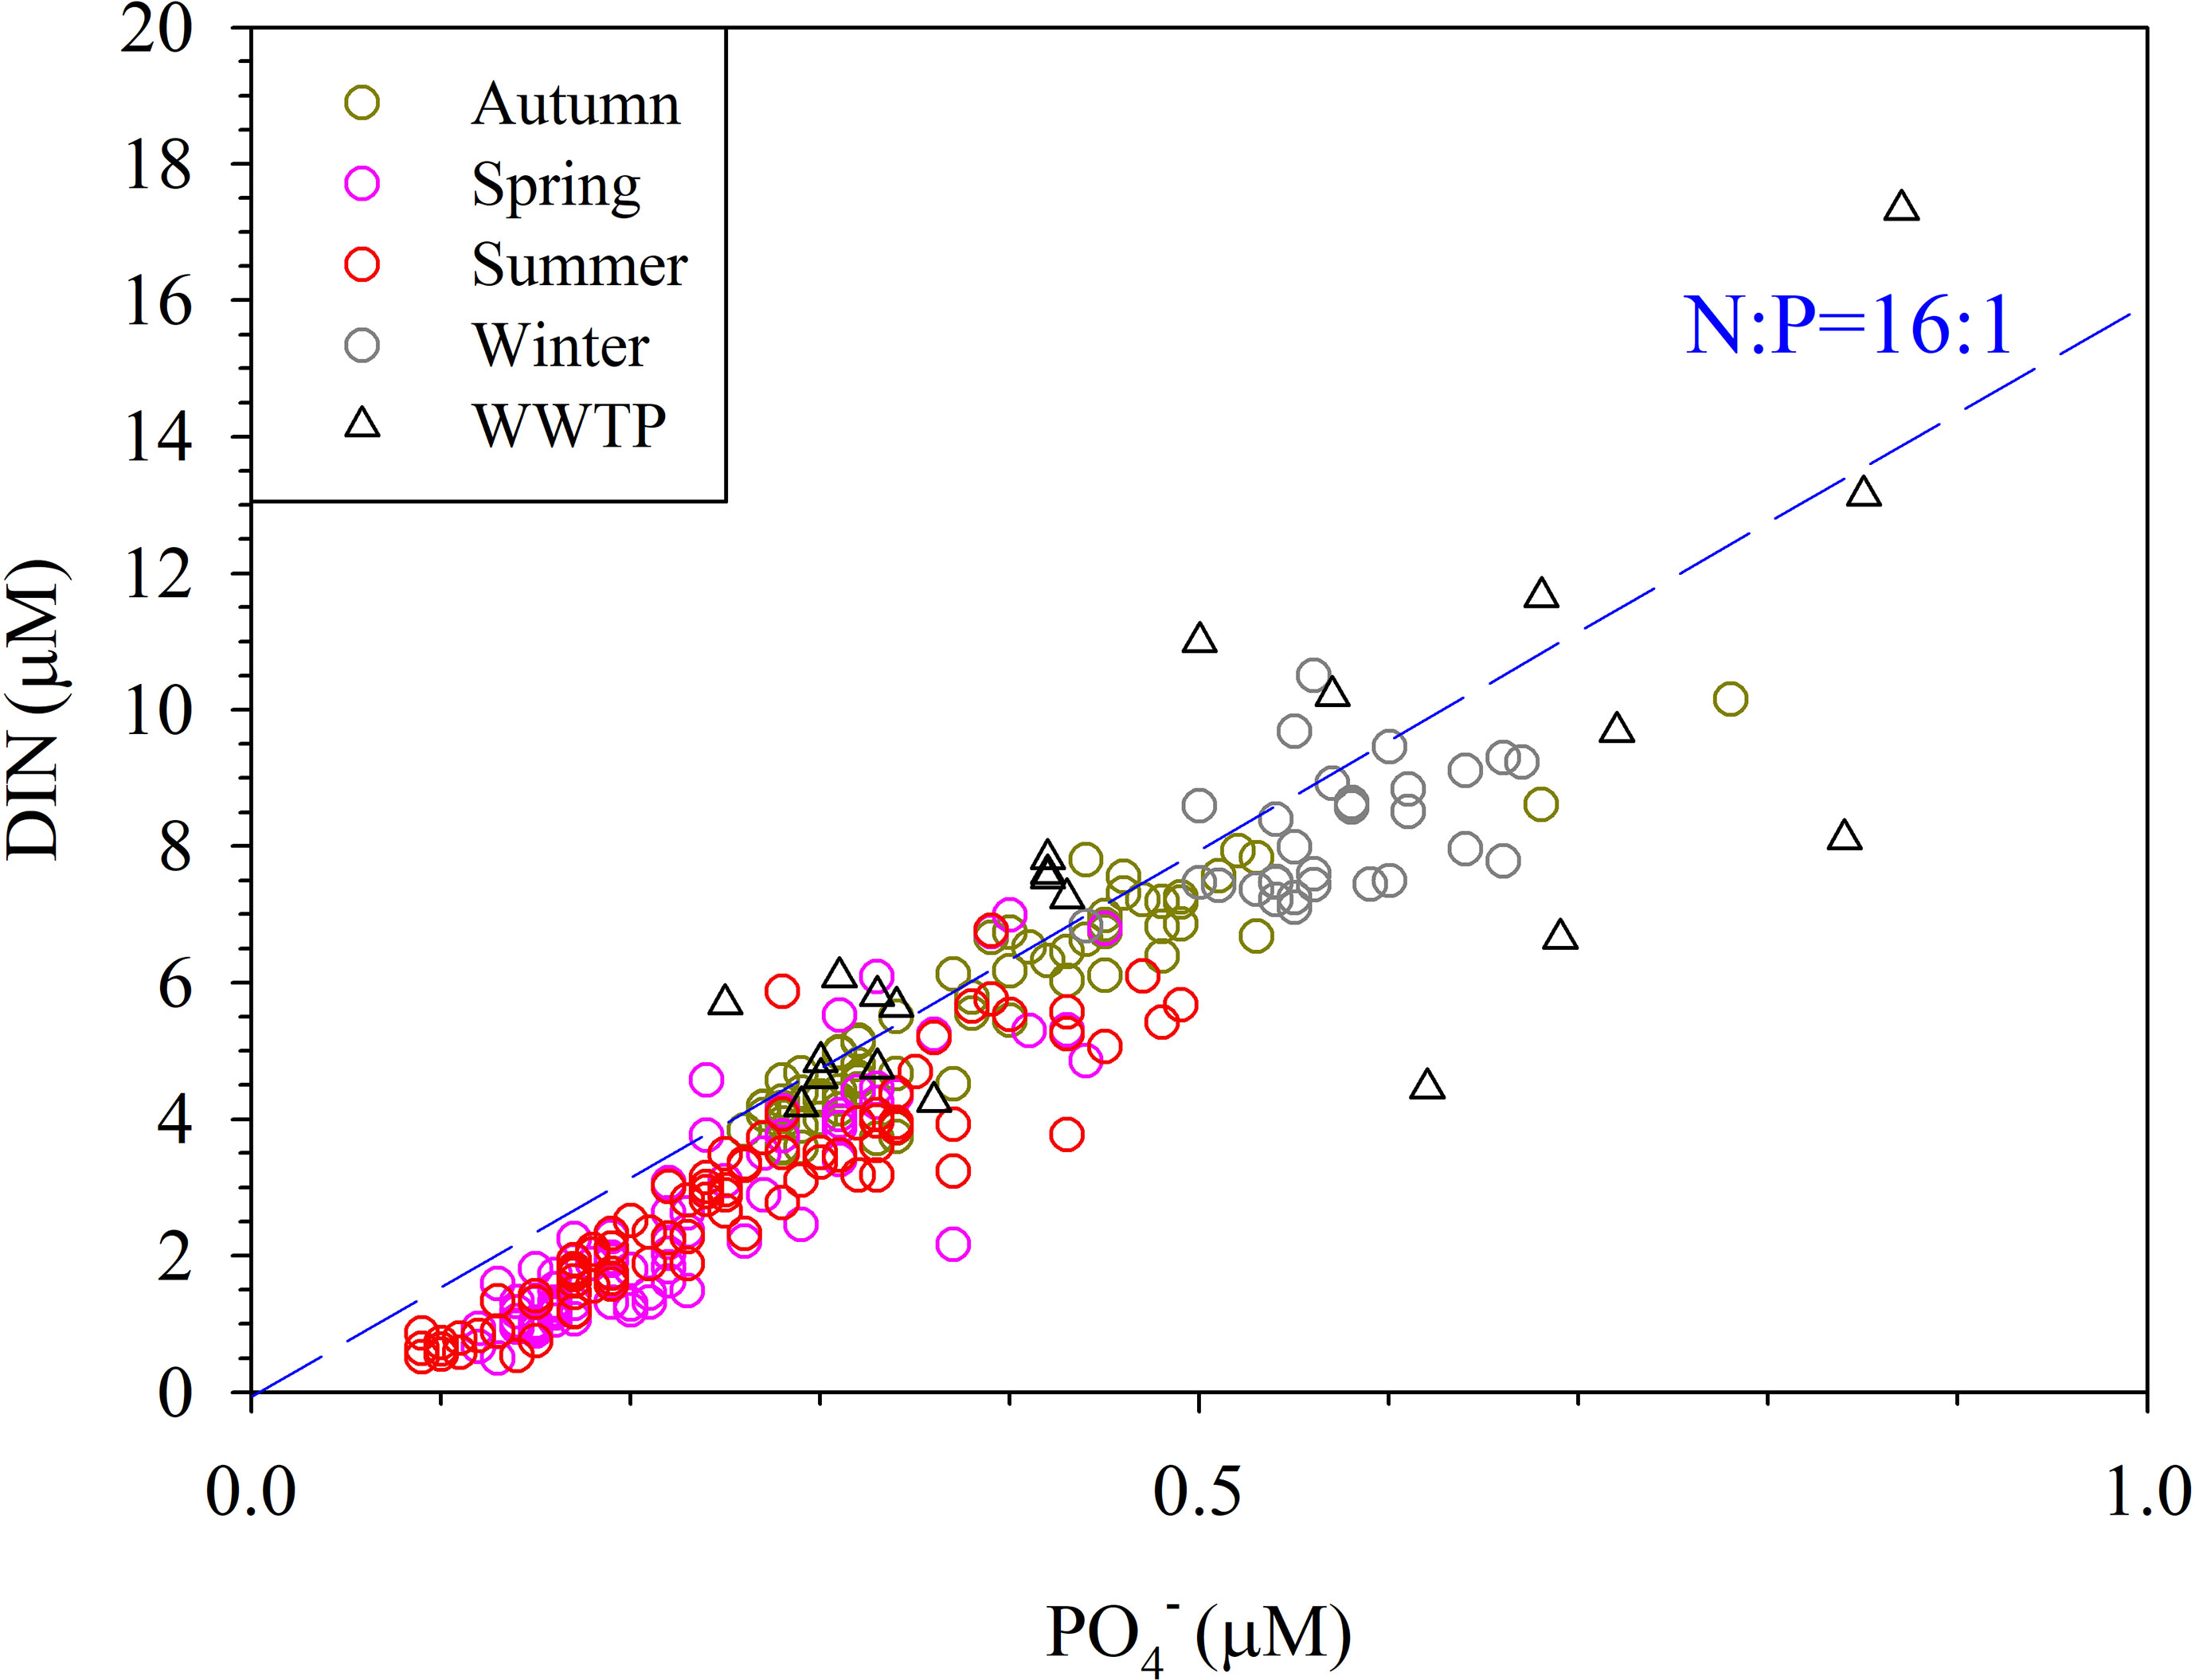
Figure 3 The DIN concentration (μM) versus PO4 concentration (μM), obtained at 66 stations during four cruises from November 2019 to January 2021. Δ presents the data influenced by ocean outfall pipe of wastewater treatment plant.
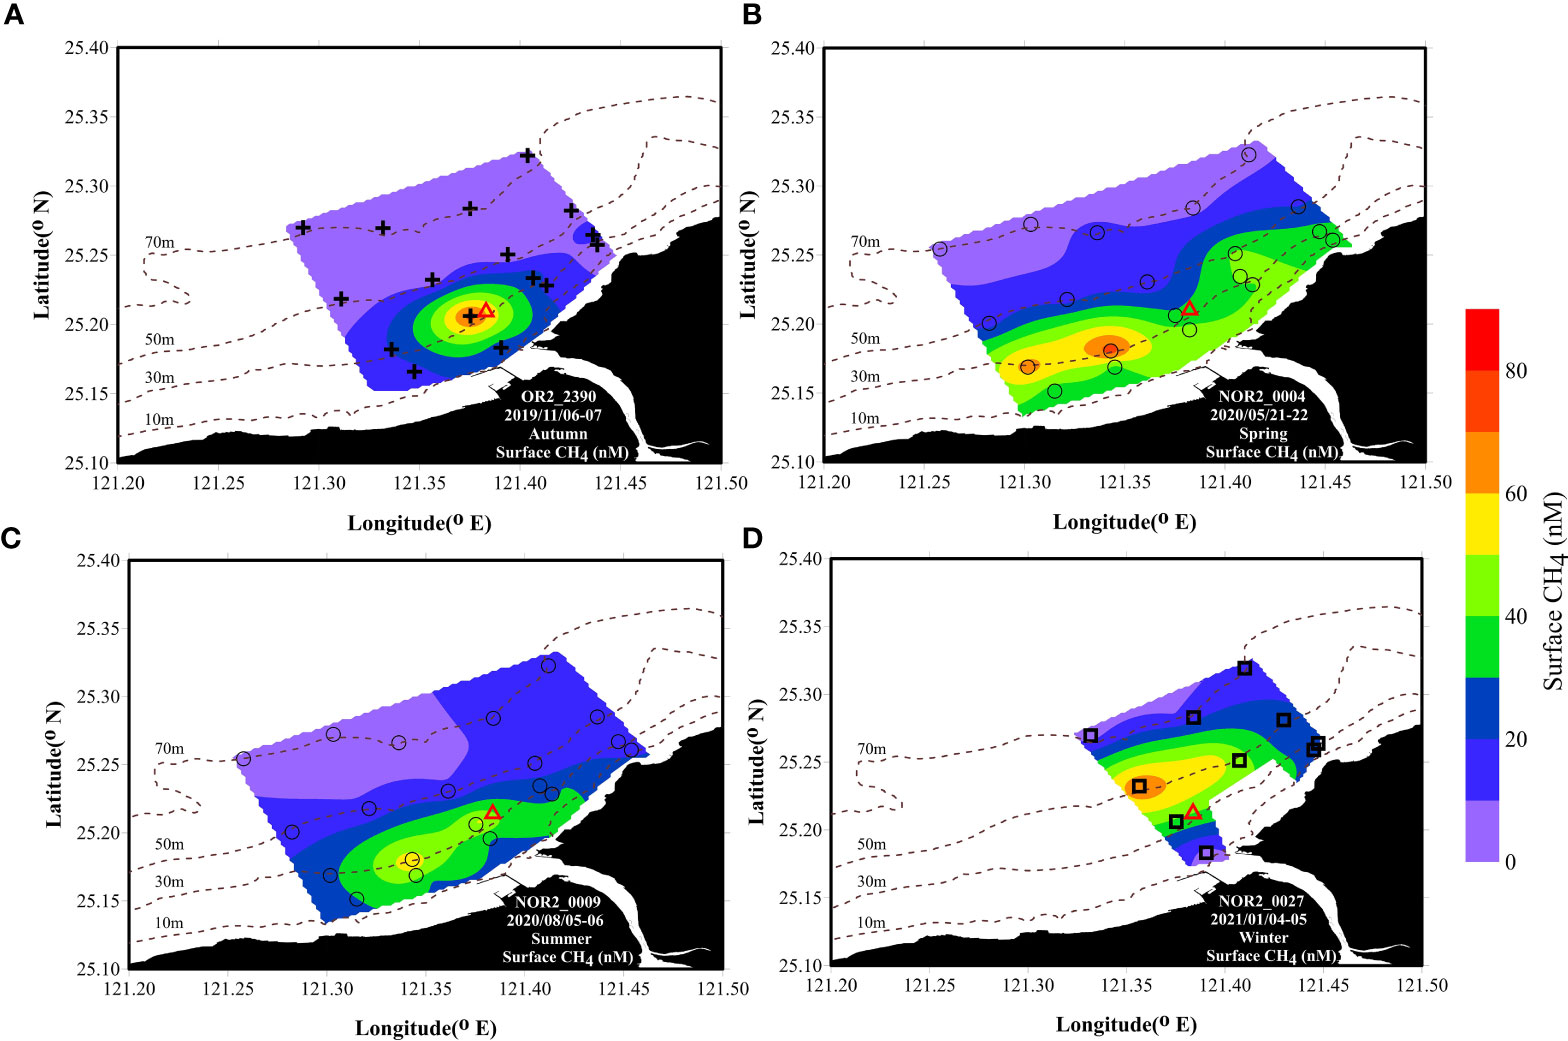
Figure 4 CH4 (nM) distributions of the surface water in the Tamsui River estuary and its adjacent marine area in (A) autumn, (B) spring (C) summer and (D) winter. Δ: ocean outfall pipe of ocean outfall pipe of wastewater treatment plant.
Inputs From Freshwater
In addition to the inputs from WWTP effluents, freshwater also contributed to the CH4 concentrations in the Tamsui River estuary adjacent marine area. The Tamsui River is a small mountain river with an average flow rate of approximately 210 m3/s. Although the Tamsui River transferred a comparably small amount of water mass to its adjacent marine areas, it brought high concentrations of CH4 and nutrients. Figure 2 shows high concentrations of CH4 and nutrients with slightly low salinity nearshore. Dissolved inorganic nitrogen (DIN) concentrations represented the nitrogen level in the water and were well correlated with CH4 concentrations (Figure 5A). CH4 and concentrations also showed a positive correlation (Figure 5B). According to Nijman et al. (2021), nutrients increased methane-oxidizing bacterial (MOB) abundance and methane oxidation potential, while warming only increased MOB abundance without altering methane oxidation potential. Thus, the differences of seawater temperature might result in different linear regressions between wet and dry seasons (Figures 5A, B).
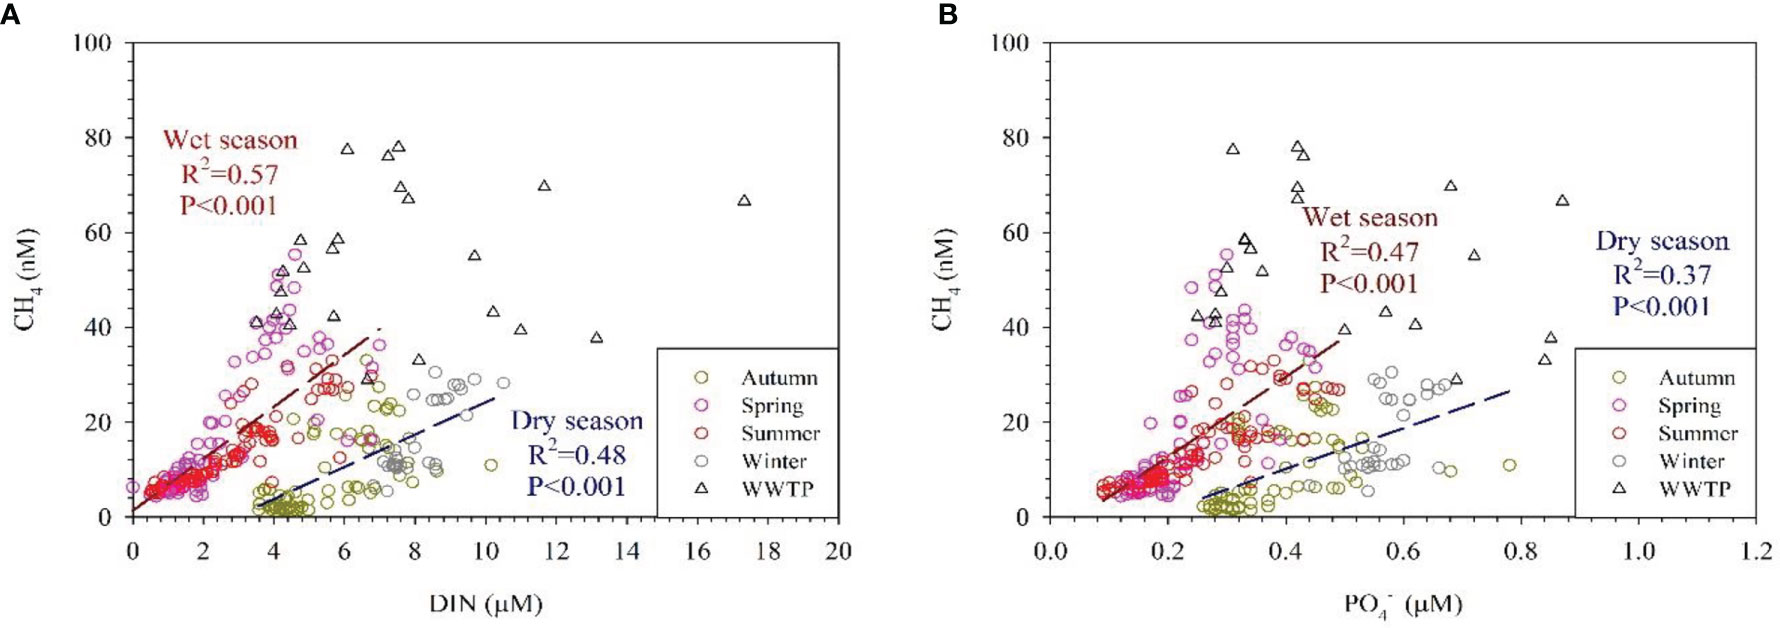
Figure 5 CH4 concentration (nM) versus (A) DIN (μM) (B) PO4 (μM) in the dry season and in the wet season, obtained at 66 stations during four cruises from November 2019 to January 2021. Δ presents the data influenced by ocean outfall pipe of wastewater treatment plant, which has been excluded in the correlation.
CH4 Emissions From Sediment
Seasonal variations of CH4 concentration in the Tamsui River ranged between 362 and 2961nM (unpublished data). Rivers brought high concentrations of CH4 and organic matter to coastal water (Chen et al., 2008; Zhang et al., 2008; Tseng et al., 2017; Sun et al., 2018). Coastal sediment which is rich in organic matter has been proposed to be the origin of CH4 (Borges and Abril, 2011; Tseng et al., 2017). In addition, high CH4 concentrations are frequently attributed to sedimentary methanogenesis in coastal environments (Bange, 2006; Zhou et al., 2009), especially in shallower waters. Borges et al. (2018) also found a seasonal peak of CH4 in the nearshore and shallow seep areas in the Belgian coastal zone during summer, which was related to sediment organic matter content. Figure 6 shows that CH4 concentrations in the bottom water gradually decreased with the bottom depth. This result might be related to low abundance of methanotrophs in shallow coastal zones so more CH4 seeps escaping from the sediment and higher CH4 concentrations in the bottom water (Broman et al., 2020). According to our results, the CH4 concentration in the bottom water did not influenced by the sediment input when the depth deeper than 90m. This might be due to CH4 oxidized in the sediment before it released to the bottom water. According to the Sewerage Systems Office of the Public Works Department of the Taipei City Government, the ocean outfall pipe of a WWTP extends from shore, and its diffuser tubes are at water depths between 30 m and 40 m. Samples in the bottom water near the diffuser tubes were high in CH4 concentrations (Figure 6).
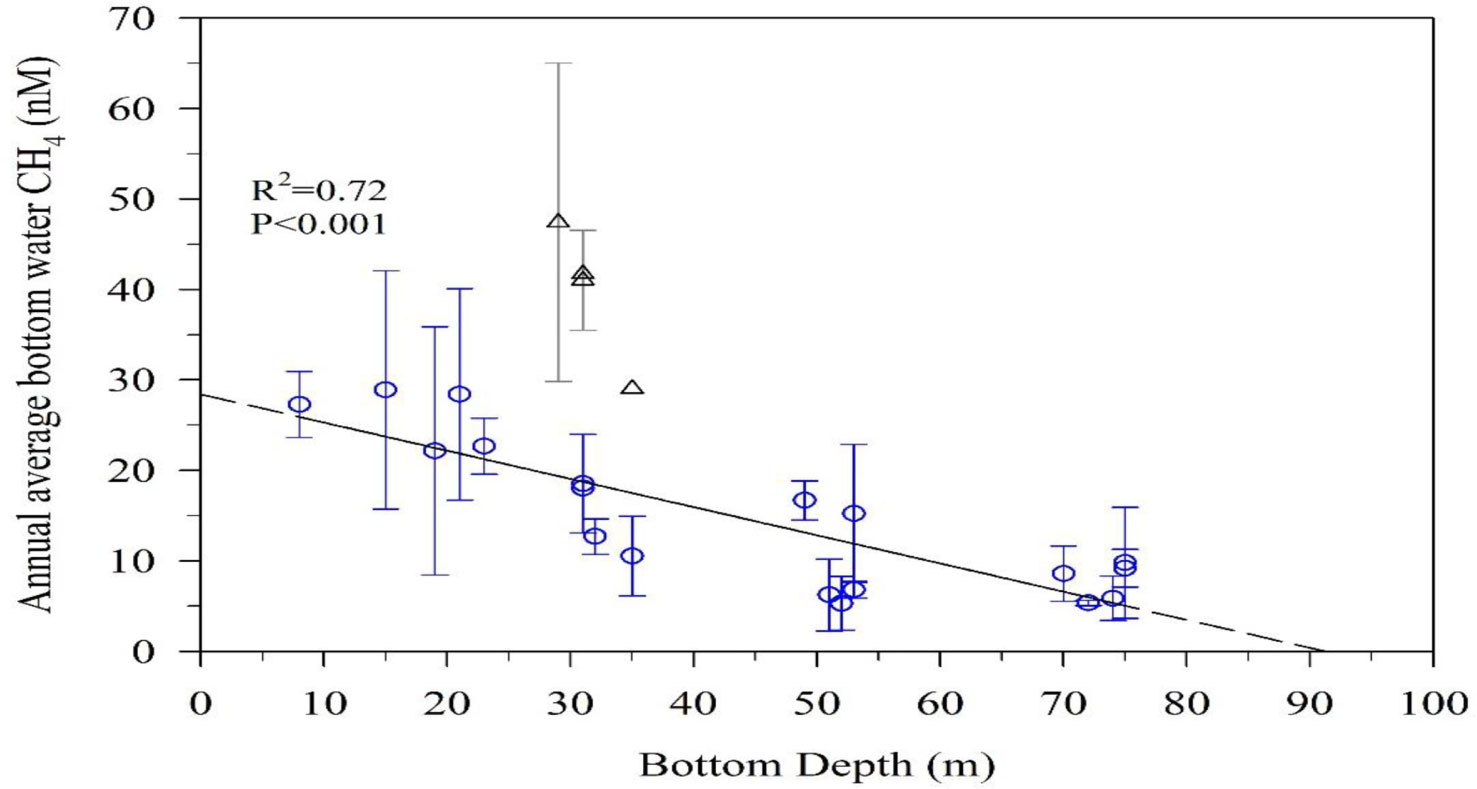
Figure 6 The annual average bottom water CH4 concentrations (nM) versus bottom depths (m), obtained at 62 stations during four cruises from November 2019 to January 2021. Δ presents the data influenced by ocean outfall pipe of wastewater treatment plant, which has been excluded in the correlation.
Seasonal Variations in CH4 and Sea-to-Air CH4 Fluxes
Except for four individual observations in autumn, the surface water was supersaturated in CH4 with respect to the atmosphere at most stations in the Tamsui River estuary adjacent marine area during the four cruises, which indicated that the study area was a net source of atmospheric CH4. The average surface seawater CH4 concentration varied between 13.7 and 29.3 nM (Table 2). The average surface seawater CH4 concentrations were higher in spring, summer and winter (29.3, 21.8 and 27.0 nM) and lower in autumn (13.7 nM). In spring and summer (wet seasons), river discharge was more due to high precipitation and brought high concentrations of nutrients and CH4 from land to sea. In addition, relatively strong vertical mixing and disturbances might bring high CH4 concentrations from the bottom to the surface water in winter.
Figure 7 shows the average 15-year (2005-2019) monthly wind speed from the meteorological platform. In autumn, low river discharge and the wind speed was just picking up after October so the vertical mixing was relatively weak comparing with that in winter, which resulted in the lowest average surface seawater CH4 concentrations. The wind speeds were higher in autumn and winter than in spring and summer (Table 2). The sea-to-air CH4 flux variability was within the range of -3.0–308.9 μmol m-2 d-1. The average sea-to-air CH4 flux was the highest in winter (90.4 μmol m-2 d-1), followed by spring and autumn (47.2 and 46.3 μmol m-2 d-1) and was lowest in summer (37.0 μmol m-2 d-1).
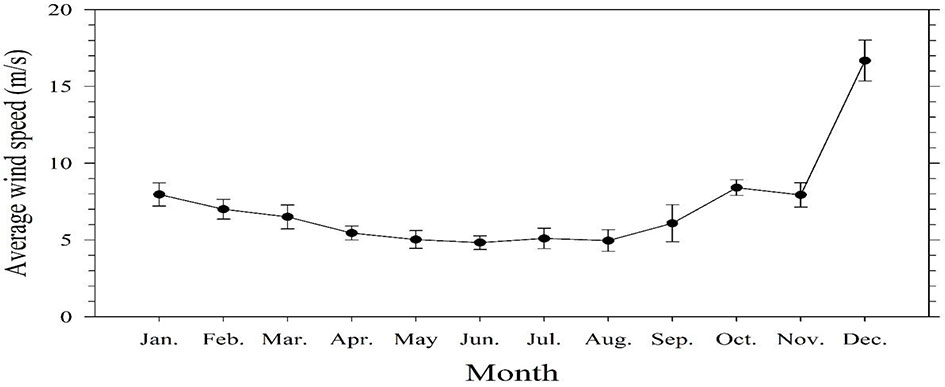
Figure 7 The average 15-year (2005-2019) monthly wind speed at a height of approximately 15 m above the sea surface from the meteorological platform.
When compared globally, the Scheldt estuary in the North Sea has the highest surface CH4 concentrations in its adjacent marine area, followed by the Tamsui River, Changjiang, and Pearl River (Table 3). In regard to the sea-to-air CH4 fluxes, the adjacent marine areas of Scheldt and Tamsui River are the highest. Extremely high CH4 was observed near the Scheldt estuary adjacent marine area due to gassy sediments (Borges et al., 2016), and its emission may be increased when the ocean warms (Borges et al., 2018). Furthermore, inputs from WWTP effluents increased CH4 concentrations in the Tamsui River estuary adjacent marine area, and this situation may be worsened when the population grows.
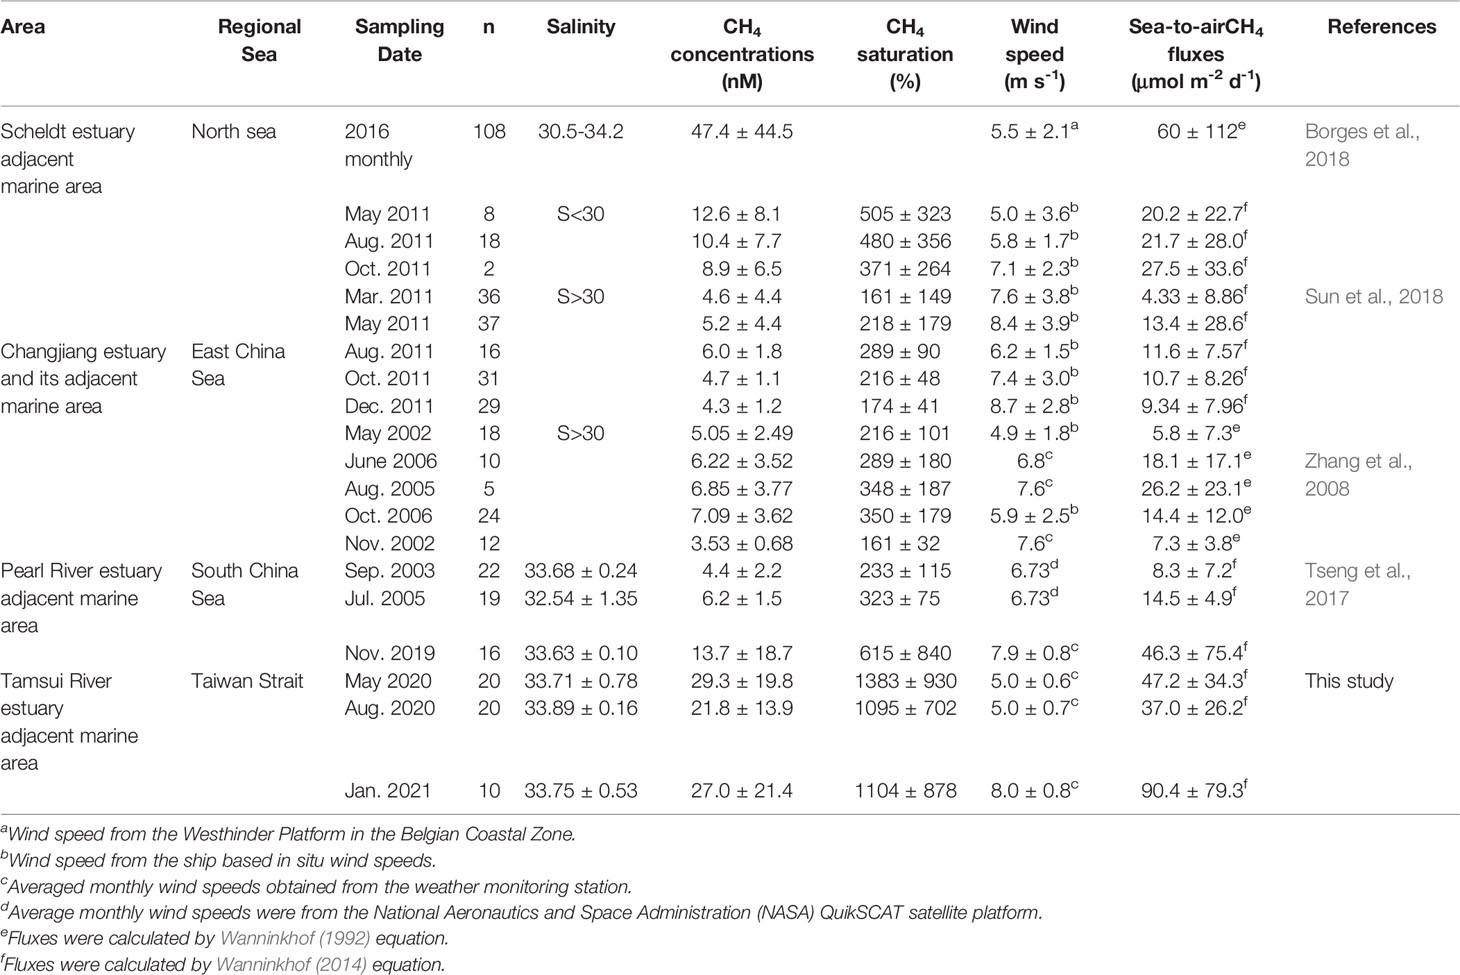
Table 3 Compilation of surface CH4 concentrations, saturations and fluxes from the several estuaries and their adjacent marine areas.
Conclusions
In this study, we characterized the spatial distribution and seasonal variations in CH4 in the Tamsui River estuary adjacent marine area as well as estimated sea-to-air CH4 fluxes to quantify the strength of the study area as an atmospheric CH4 source. The Tamsui River estuary adjacent marine area were active sites for CH4 emissions. Our research results showed that CH4 concentrations in coastal areas were influenced by WWTP effluents, sediment and freshwater inputs. In addition, CH4 concentrations increased with the nutrient levels. Moreover, strong vertical mixing and disturbances might also increase CH4 emissions, especially in coastal areas.
Climate change may increase precipitation in tropical/subtropical areas and transfer more nutrients and organic matter from land to ocean. Extreme weather events, such as typhoons and cyclones, can increase CH4 emissions in coastal areas due to sediment disturbance. Anthropogenic conditions, such as high coastal populations, sewage, and WWTP effluents, also influence coastal CH4 emissions. Escalating a feedback loop continues to circle between greenhouse gas emissions and climate change might increase extreme weather events. Nevertheless, preventing unthinkable events from happening takes tremendous time and effort. Accelerating the process from the root through scientific findings that identifying possible CH4 sources is the pivotal information required to mitigate the crisis in time.
Data Availability Statement
The original contributions presented in the study are included in the article/supplementary material, further inquiries can be directed to the corresponding authors.
Author Contributions
H-CT and G-CG co-developed the idea of the study. H-CT leaded the research cruises and did the sampling. C-CL, H-JP, and YTYH did the sampling and data analysis. H-CT wrote the first draft of the article and all authors contributed equally to the interpretation of the results and in writing the final manuscript.
Funding
This research was supported by Ministry of Science and Technology of the ROC, Taiwan (MOST 108-2611-M-019-021-MY3).
Conflict of Interest
The authors declare that the research was conducted in the absence of any commercial or financial relationships that could be construed as a potential conflict of interest.
Publisher’s Note
All claims expressed in this article are solely those of the authors and do not necessarily represent those of their affiliated organizations, or those of the publisher, the editors and the reviewers. Any product that may be evaluated in this article, or claim that may be made by its manufacturer, is not guaranteed or endorsed by the publisher.
Acknowledgments
The authors wish to thank the Ministry of Science and Technology of the ROC, Taiwan for supporting this research, and the captain and crews of Ocean Researcher 2 and New Ocean Researcher 2 for their assistance.
References
Bange H. W. (2006). Nitrous Oxide and Methane in European Coastal Waters. Estuarine Coastal Shelf Sci. 70, 361–374. doi: 10.1016/j.ecss.2006.05.042
Bange H. W., Bartell U. H., Rapsomanikisa S., Andreae M. O. (1994). Methane in the Baltic and North Seas and a Reassessment of the Marine Emissions of Methane. Glob. Biogeochem. Cycles 8, 465–480. doi: 10.1029/94GB02181
Beaulieu J. J., DelSontro T., Downing J. A. (2019). Eutrophication Will Increase Methane Emissions From Lakes and Impoundments During the 21st Century. Nat. Commun. 10, 1375. doi: 10.1038/s41467-019-09100-5
Bogard M. J., del Giorgio P. A., Boutet L., Chaves M. C. G., Prairie Y. T., Merante A., et al. (2014). Oxic Water Column Methanogenesis as a Major Component of Aquatic CH4 Fluxes. Nat. Commun. 5, 5350. doi: 10.1038/ncomms6350
Borges A. V., Abril G. (2011). “5.04 - Carbon Dioxide and Methane Dynamics in Estuaries,” in Treatise on Estuarine and Coastal Science. Eds. Wolanski E., McLusky D. (Waltham: Academic Press), p. 119–161.
Borges A. V., Champenois W., Gypens N., Delille B., Harlay J. (2016). Massive Marine Methane Emissions From Near-Shore Shallow Coastal Areas. Sci. Rep. 6, 27908. doi: 10.1038/srep27908
Borges A. V., Speeckaert G., Champenois W., Scranton M. I., Gypens N. (2018). Productivity and Temperature as Drivers of Seasonal and Spatial Variations of Dissolved Methane in the Southern Bight of the North Sea. Ecosystems 21, 583–599. doi: 10.1007/s10021-017-0171-7
Broman E., Sun X., Stranne C., Salgado M. G., Bonaglia S., Geibel M., et al. (2020). Low Abundance of Methanotrophs in Sediments of Shallow Boreal Coastal Zones With High Water Methane Concentrations. Front. Microbiol. 11, 1536. doi: 10.3389/fmicb.2020.01536
Chen C.-T. A., Wang S.-L., Lu X.-X., Zhang S.-R., Lui H.-K., Tseng H.-C., et al. (2008). Hydrogeochemistry and Greenhouse Gases of the Pearl River, its Estuary and Beyond. Quat. Int. 186, 79–90. doi: 10.1016/j.quaint.2007.08.024
Cotovicz L. C., Knoppers B. A., Brandini N., Poirier D., Costa Santos S. J., Abril G. (2016). Spatio-Temporal Variability of Methane (CH4) Concentrations and Diffusive Fluxes From a Tropical Coastal Embayment Surrounded by a Large Urban Area (Guanabara Bay, Rio De Janeiro, Brazil). Limnol. Oceanogr. 61, S238–S252. doi: 10.1002/lno.10298
Damm E., Helmke E., Thoms S., Schauer U., N¨othig E., Bakker K., et al. (2010). Methane Production in Aerobic Oligotrophic Surface Water in the Central Arctic Ocean. Biogeosciences 7, 1099–1108. doi: 10.5194/bg-7-1099-2010
de Angelis M. A., Lee C. (1994). Methane Production During Zooplankton Grazing on Marine Phytoplankton. Limnol. Oceanogr. 39 (6), 1298–1308. doi: 10.4319/lo.1994.39.6.1298
Du M., Zhu Q., Wang X., Li P., Yang B., Chen H., et al. (2018). Estimates and Predictions of Methane Emissions From Wastewater in China From 2000 to 2020. Earth’s Future 6, 252–263. doi: 10.1002/2017EF000673
Etminan M., Myhre G., Highwood E. J., Shine K. P. (2016). Radiative Forcing of Carbon Dioxide, Methane, and Nitrous Oxide: A Significant Revision of the Methane Radiative Forcing. Geophys. Res. Lett. 43. doi: 10.1002/2016GL071930
Florez-Leiva L., Damm E., Farías L. (2013). Methane Production Induced by Dimethylsulfide in Surface Water of an Upwelling Ecosystem. Prog. Oceanogr. 112-113, 38–48. doi: 10.1016/j.pocean.2013.03.005
Gelesh L., Marshall K., Boicourt W., Lapham L. (2016). Methane Concentrations Increase in Bottom Waters During Summertime Anoxia in the Highly Eutrophic Estuary, Chesapeake Bay, U.S.A. Limnol. Oceanogr. 61, S253–S266. doi: 10.1002/lno.10272
Gong G. C., Chen L. Y. L., Liu K. K. (1996). Chemical Hydrography and Chlorophyll a Distribution in the East China Sea in Summer: Implications in Nutrient Dynamics. Cont. Shelf Res. 16, 1561–1590. doi: 10.1016/0278-4343(96)00005-2
Gong G.-C., Shiah F.-K., Liu K.-K., Wen Y.-H., Liang M.-H. (2000). Spatial and Temporal Variation of Chlorophyll a, Primary Productivity and Chemical Hydrography in the Southern East China Sea. Cont Shelf Res. 20, 411–436. doi: 10.1016/S0278-4343(99)00079-5
Gong G.-C., Yang W.-R., Chang J. (1995). In Vivo Fluorescence-Derived Chlorophyll a Concentrations in the Southern East China Sea. Acta. Oceanogr. Taiwanica 34, 73–85.
Gong G.-C., Yang W.-R., Wen Y.-H. (1993). Correlation of Chlorophyll a Concentration and Sea Tech Fluorometer Fluorescence in Seawater. Acta. Oceanogr. Taiwanica 31, 117–126.
Humborg C., Geibel M. C., Sun X., McCrackin M., Mörth C.-M., Stranne C., et al. (2019). High Emissions of Carbon Dioxide and Methane From the Coastal Baltic Sea at the End of a Summer Heat Wave. Front. Marine Sci. 6. doi: 10.3389/fmars.2019.00493
IPCC (2013). Climate Change 2013: The Physical Science Basis. Contribution of Working Group I to the Fifth Assessment Report of the Intergovernmental Panel on Climate Change, in: Stocker T.F., Qin D., Plattner G.-K., Tignor M., Allen S.K., Boschung J., Nauels A., et al. (Ed.), C.2; C.6; C.8, pp. 159–254; pp. 473–552; pp. 677–731, Cambridge, United Kingdom and New York, NY, USA.
Jackson R. B., Saunois M., Bousquet P., Canadell J. G., Poulter B., Stavert A. R., et al. (2020). Increasing Anthropogenic Methane Emissions Arise Equally From Agricultural and Fossil Fuel Sources. Environ. Res. Lett. 15, 071002. doi: 10.1088/1748-9326/ab9ed2
Karl D. M., Beversdorf L., Björkman K. M., Church M. J., Martinez A., Delong E. F. (2008). Aerobic Production of Methane in the Sea. Nat. Geosci. 1, 473–478. doi: 10.1038/ngeo234
Kirschke S., Bousquet P., Ciais P., Saunois M., Canadell J. G., Dlugokencky E. J., et al. (2013). Three Decades of Global Methane Sources and Sinks. Nat. Geosci. 6, 813–823. doi: 10.1038/ngeo1955
Middelburg J. J., Nieuwenhuize J., Iversen N., Høgh N., Dewilde H., Helder W., et al. (2002). Methane Distribution in European Tidal Estuaries. Biogeochemistry 59, 95–119. doi: 10.1023/A:1015515130419
Myllykangas J.-P., Hietanen S., Jilbert T. (2019). Legacy Effects of Eutrophication on Modern Methane Dynamics in a Boreal Estuary. Estuaries Coasts 43, 189–206. doi: 10.1007/s12237-019-00677-0
Nijman T. P. A., Davidson T. A., Weideveld S. T. J., Audet J., Esposito C., Levi E. E., et al. (2021). Warming and Eutrophication Interactively Drive Changes in the Methane-Oxidizing Community of Shallow Lakes. ISME Commun. 1, 32. doi: 10.1038/s43705-021-00026-y
Pai S.-C., Gong G.-C., Liu K.-K. (1993). Determination of Dissolved Oxygen in Seawater by Direct Spectrophotometry of Total Iodine. Marine Chem. 41, 343–351. doi: 10.1016/0304-4203(93)90266-Q
Pekel J. F., Cottam A., Gorelick N., Belward A. S. (2016). High-Resolution Mapping of Global Surface Water and its Long-Term Changes. Nature 540, 418–422. doi: 10.1038/nature20584
Rehder G., Keir R. S., Suess E., Pohlmann T. (1998). The Multiple Sources and Patterns of Methane in North Sea Waters. Aquat. Geochem. 4, 403–427. doi: 10.1023/A:1009644600833
Repeta D. J., Ferrón S., Sosa O. A., Johnson C. G., Repeta L. D., Acker M., et al. (2016). Marine Methane Paradox Explained by Bacterial Degradation of Dissolved Organic Matter. Nat. Geosci. 9, 884–887. doi: 10.1038/ngeo2837
Rhee T. S., Kettle A. J., Andreae M. O. (2009). Methane and Nitrous Oxide Emissions From the Ocean: A Reassessment Using Basin-Wide Observations in the Atlantic. J. Geophys Res. 114, D12304. doi: 10.1029/2008JD011662
Shindell D., Kuylenstierna J. C., Vignati E., van Dingenen R., Amann M., Klimont Z., et al. (2012). Simultaneously Mitigating Near-Term Climate Change and Improving Human Health and Food Security. Science 335, 183–189. doi: 10.1126/science.1210026
Strickland J. D. H., Parsons T. R. (1972). A Practical Handbook of Seawater Analysis (Ottawa, Canada: Fisheries Research Board of Canada), p. 310.
Sun M. S., Zhang G. L., Ma X., Cao X. P., Mao X. Y., Li J., et al. (2018). Dissolved Methane in the East China Sea: Distribution, Seasonal Variation and Emission. Marine Chem. 202, 12–26. doi: 10.1016/j.marchem.2018.03.001
Tilbrook B. D., Karl D. M. (1994). Dissolved Methane Distributions, Sources, and Sinks in the Western Bransfield Strait, Antarctica. J. Geophys. Res. 99, 16383–16393. doi: 10.1029/94JC01043
Tseng H.-C., Chen C.-T. A., Borges A. V., DelValls T. A., Chang Y.-C. (2017). Methane in the South China Sea and the Western Philippine Sea. Cont. Shelf Res. 135, 23–34. doi: 10.1016/j.csr.2017.01.005
Tseng H.-C., Newton A., Gong G.-C., Lin C.-C. (2021). Social–Environmental Analysis of Estuary Water Quality in a Populous Urban Area. Elem: Sci. Anth. 9, 1. doi: 10.1525/elementa.2020.00085
Upstill-Goddard R. C., Barnes J., Frost T., Punshon S., Owens N. J. P. (2000). Methane in the Southern North Sea: Low-Salinity Inputs, Estuarine Removal, and Atmospheric Flux. Glob. Biogeochem. Cycles 14, 1205–1217. doi: 10.1029/1999GB001236
Wanninkhof R. (1992). Relationship Between Wind Speed and Gas Exchange Over the Ocean. J. Geophys. Res. 97, 7373–7382. doi: 10.1029/92JC00188
Wanninkhof R. (2014). Relationship Between Wind Speed and Gas Exchange Over the Ocean Revisited. Limnol. Oceanogr: Methods 12, 351–362. doi: 10.4319/lom.2014.12.351
Weiss R. F. (1981). Determinations of Carbon Dioxide and Methane by Dual Catalyst Flame Ionization Chromatography and Nitrous Oxide by Electron Capture Chromatography. J. Chromatogr. Sci. 19, 611–616. doi: 10.1093/chromsci/19.12.611
Wen L.-S., Jiann K.-T., Liu K.-K. (2008). Seasonal Variation and Flux of Dissolved Nutrients in the Danshuei Estuary, Taiwan: A Hypoxic Subtropical Mountain River. Estuarine Coastal Shelf Sci. 78, 694–704. doi: 10.1016/j.ecss.2008.02.011
Wiesenburg D. A., Norman L. G. J. (1979). Equilibrium Solubilities of Methane,Carbon Monoxide, and Hydrogen in Water and Sea Water. J. Chem. Eng. Dafa 24, 356–360. doi: 10.1021/je60083a006
Yu Z., Wang D., Li Y., Deng H., Hu B., Ye M., et al. (2017). Carbon Dioxide and Methane Dynamics in a Human-Dominated Lowland Coastal River Network (Shanghai, China). J. Geophys. Res.: Biogeosci. 122, 1738–1758. doi: 10.1002/2017JG003798
Yvon-Durocher G., Allen A. P., Bastviken D., Conrad R., Gudasz C., St-Pierre A., et al. (2014). Methane Fluxes Show Consistent Temperature Dependence Across Microbial to Ecosystem Scales. Nature 507, 488–491. doi: 10.1038/nature13164
Zhang G., Zhang J., Liu S., Ren J., Xu J., Zhang F. (2008). Methane in the Changjiang (Yangtze River) Estuary and its Adjacent Marine Area: Riverine Input, Sediment Release and Atmospheric Fluxes. Biogeochemistry 91, 71–84. doi: 10.1007/s10533-008-9259-7
Zhou H., Yin X., Yang Q., Wang H., Wu Z., Bao S. (2009). Distribution, Source and Flux of Methane in the Western Pearl River Estuary and Northern South China Sea. Marine Chem. 117, 21–31. doi: 10.1016/j.marchem.2009.07.011
Keywords: methane, WWTP effluents, nutrients, Tamsui River, greenhouse gases
Citation: Tseng H-C, Lin C-C, Pan H-J, Han YTY and Gong G-C (2022) Seasonal Distributions of Methane in a Populous Urban Coastal Sea Area. Front. Mar. Sci. 9:843549. doi: 10.3389/fmars.2022.843549
Received: 26 December 2021; Accepted: 02 March 2022;
Published: 07 April 2022.
Edited by:
William Savidge, Odum School of Ecology, University of Georgia, United StatesReviewed by:
Stefano Bonaglia, University of Gothenburg, SwedenMasahiro Suzumura, National Institute of Advanced Industrial Science and Technology (AIST), Japan
Copyright © 2022 Tseng, Lin, Pan, Han and Gong. This is an open-access article distributed under the terms of the Creative Commons Attribution License (CC BY). The use, distribution or reproduction in other forums is permitted, provided the original author(s) and the copyright owner(s) are credited and that the original publication in this journal is cited, in accordance with accepted academic practice. No use, distribution or reproduction is permitted which does not comply with these terms.
*Correspondence: Hsiao-Chun Tseng, aC5jLmplYW4udHNlbmdAZ21haWwuY29t; Gwo-Ching Gong, Z2Nnb25nQG1haWwubnRvdS5lZHUudHc=
 Hsiao-Chun Tseng
 Chia-Chia Lin1
 Hui-Juan Pan
 Gwo-Ching Gong