 Gloria Silvana Durán Gómez
 Takeyoshi Nagai
95% of researchers rate our articles as excellent or good
Learn more about the work of our research integrity team to safeguard the quality of each article we publish.
Find out more
ORIGINAL RESEARCH article
Front. Mar. Sci. , 02 May 2022
Sec. Coastal Ocean Processes
Volume 9 - 2022 | https://doi.org/10.3389/fmars.2022.842155
This article is part of the Research Topic Oceanographic Processes Linking Nearshore, Continental Shelf, and Shelf Break View all 34 articles
Although the Kuroshio Current has been well-known for being nutrient poor in its upper layers, it sustains a great biodiversity within its region, including the Kuroshio Extension. Previous studies reported that the Kuroshio carries a large amount of nutrients in its dark subsurface layers, yet, the mechanisms of how these nutrients are brought to sunlit layers remain unclear. In a previous observational study, it is shown that when the Kuroshio flows near the shelf break, very strong turbulence with dissipation rates of O (10 -7 W kg -1), caused by trapped near-inertial internal waves, leads to the generation of large diffusive nitrate fluxes of 1-10 mmol N m -2 day -1. Nevertheless, since these results were obtained from just one transect survey, questions remain, such as how long the enhanced turbulent diffusive nitrate flux extends downstream, and how the Kuroshio path modulations affect this nutrient injection. In this study, observed features were reproduced by using a high-resolution nested simulation coupled with a N2PZD2 ecosystem model. The results show that when the model Kuroshio flows closely to the coast, it hits a small bump in the upstream region of the Hyuganada Sea producing negative potential vorticity. At the same time, trapped near-inertial internal waves in a streak of lowered lowest internal wave frequencies are reproduced near the area with low PV values, generating strong vertical mixing similar to the observations. Since more nitrate is brought upward on the continental shelf when the Kuroshio approaches to the coast, the enhanced vertical mixing effectively diffuses up the nitrate from subsurface to surface layers at a rate of ~O(1 mmol N m -2 day -1) toward 50-100 km downstream along the Kuroshio. Further analyses on how the distance between the model Kuroshio and the southeastern coast of Kyushu affects the nutrient supply, suggest that when the Kuroshio flows closer to the coast, the internal wave kinetic energy, the nitrate concentration, its vertical gradients and vertical diffusive flux increase.
The Kuroshio is a strong western boundary current of the North Pacific. It has been considered nutrient poor in its surface layers, that contradicts the implications that the Kuroshio regions accommodate a large variety of marine organisms, possessing the highest biodiversity of the world ocean (Saito, 2019). Several recent studies have reported that the Kuroshio carries a large amount of nutrients in its deep layers that are transported downstream (Guo et al., 2012), similar to the Gulf Stream in the North Atlantic (Pelegrí and Csanady, 1991; Palter et al., 2011). The amounts of nutrients carried laterally along these nutrient streams are found to be increased by current mergers, e.g., between the Gulf Stream and other current branches (Palter and Lozier, 2008), and between the Kuroshio and its recirculation gyre (Guo et al., 2013). In addition to these along stream variations, several studies have pointed out that nutrient concentrations on the density surfaces are elevated along the Gulf Stream (Pelegrí et al., 1996; Palter and Lozier, 2008; Whitt, 2019) and the Kuroshio (Komatsu and Hiroe, 2019; Nagai et al., 2019), in comparison to those on the shore and offshore side of the streams. The mechanism of how these elevated nutrient concentrations are formed has been under debate. Pelegrí et al. (1996) speculated diapycnal mixing, caused by the geostrophic vertical shear, as a mechanism to bring up nutrients to shallow layers and form the elevated nutrient concentrations on the density surfaces, which then increases the nutrient lateral transport near the surface to the downstream. On the contrary, Palter and Lozier (2008) analyzed the historical hydrographic dataset and concluded that the elevated concentrations are advected laterally, maintaining the characteristics of the tropical origin, and that the advected transport is much greater than that caused by the diapycnal mixing processes (Whitt, 2019).
However, a recent numerical study showed that when the upstream Gulf Stream near the Bahamas Banks interacts with a topography on its anticyclonic side, it generates negative potential vorticity and associated forward energy cascade (Gula et al., 2016). Likewise, it has been reported that when the Kuroshio encounters topographic features, such as islands, seamounts and ridges, it can induce strong turbulence and elevated vertical mixing (Hasegawa et al., 2004; Chang et al., 2016; Nagai et al., 2017; Tsutsumi et al., 2017; Hasegawa, 2019; Nagai et al., 2021a; Tanaka et al., 2019). The enhanced mixing can modify the water masses in the surroundings, and diffuse tracers vertically including nutrients. Nagai et al. (2021b) reported that the elevated turbulence in the Kuroshio flowing over the Izu Ridge induces a large nutrient diffusive flux, accompanied by the subsurface increase in chlorophyll-a concentrations. Since the Kuroshio encounters topographic features in many other regions, the topography-induced diapycnal mixing within the Kuroshio could be the cause to supply a large amount of nutrients to the euphotic zone. If this is the case, the Kuroshio nutrient stream enriches not only its downstream region, but also the southern coast of Japan, sustaining the biological productivity over the continental shelf. Nevertheless, whether and how the subsurface nutrients can be injected in the regions of the continental shelf remain unclear. A previous observational study by Nagai et al. (2019) showed that in the Hyuganada Sea, southeast of Kyushu, turbulence caused by trapped near-inertial internal waves in the Kuroshio can diffuse up subsurface nutrients to sunlit surface layers. Since this previous study was conducted for only one transect survey, questions remain as to how long this enhanced turbulent diffusive nitrate flux extends downstream along the Kuroshio. Although several studies have pointed out that the Kuroshio variabilities, such as modulations of its path and strength, can affect the biological productivity and fish catches (Oey et al., 2018; Durán Gómez et al., 2020; Lizarbe Barreto et al., 2021), how these modulations may influence on the nutrient supply along the southern coast of Japan is still unknown.
In this study, we seek to complement by setting two working hypotheses: 1) a large amount of subsurface nitrate from the Kuroshio nutrient stream is brought upward when the Kuroshio approaches to the coast, leading to an increase in nitrate concentrations and its vertical gradient on the continental shelf; 2) anticyclonic vorticity and geostrophic vertical shear in the Kuroshio can cause the trapping of near-inertial internal waves, that induce strong turbulence and vertical mixing, thus, increasing the nitrate vertical diffusive flux. These inherent characteristics of the Kuroshio, the subsurface nutrient stream and the elevated mixing, may work together, leading to an efficient agent to supply nutrients, which could temporarily be modulated depending on how close the Kuroshio flows to the shelf break. To this end, a high-resolution nested numerical simulation, coupled with a N2PZD2 ecosystem model, is used to reproduce the Kuroshio, near-inertial internal waves and enhanced nitrate diffusive flux over the continental shelf. The objectives of this study are to elucidate how far the elevated nutrient supply persists downstream along the Kuroshio, and to understand how the elevated nutrient flux is related to the model Kuroshio path transitions in the region off east of Kyushu. Section 2 shows the methodology to reproduce the observations with a numerical model, and the equations for the parameters to examine the hypotheses. Section 3 presents the comparisons made between the numerical simulations and the observations taken onboard in November 2018 (Nagai et al., 2019), the analyses for the continuance of the elevated nitrate diffusive flux to the downstream, and the nutrient flux modulations due to the Kuroshio path variabilities. Discussions follow in Section 4, and lastly, conclusions are given in Section 5.
In this study, the Regional Oceanic Modeling System (ROMS) is used. The ROMS is an ocean circulation model developed for global and regional simulations, that solves incompressible hydrostatic primitive equations under the Boussinesq approximation with a so called s-coordinate vertical grid and a horizontal curvilinear grid (Shchepetkin and McWilliams, 2005). 4-level nested grids are used for the simulation, with a finest grid of ~500 m resolution, that is nested in the ~1.5 km resolution grid off Kyushu and Shikoku. The selected area for the finest grid is located within the ranges 30.9-32.6°N and 130.9-132.4°E.
A nitrogen based N2PZD2 ecosystem model, including nitrate, ammonium, phytoplankton, zooplankton, large and small detritus (Gruber et al., 2006; Nagai and Clayton, 2017), is coupled with a physical model to reproduce nitrate distributions and its diffusive flux. The nested ecosystem simulation was started from model October year 8 with interpolated initial conditions taken from the coarse resolution (10-15 km) model outputs in the North Pacific. The COADS monthly climatology wind, heat and freshwater fluxes are forced at the surface (da Silva et al., 1994), and lateral boundary conditions for the coarse North Pacific model are given from Levitus climatology (Levitus, 1982). Bottom drag was modeled with the quadratic bottom friction with a drag coefficient of 0.004. The model vertical diffusivity Kv was parameterized with the K-Profile Parameterization (KPP) (Large et al., 1994), and the lateral Laplacian viscosity was parameterized using the Smagorinsky scheme in the finest grid (Smagorinsky, 1993). The bottom depths for these grids are generated using JODC 500-m mesh topography data (J-EGG500). Due to the lack of field observations in the study area, except for our high-resolution data obtained in November 2018, the validation of the ROMS results was made through comparisons with the available reanalysis data from COPERNICUS Marine Service (MERCATOR GLORYS12V1, http://www.mercator-ocean.fr). More details have been added in the Supplementary Material.
For the vertical section obtained onboard in November 2018, two-dimensional PV2D is computed neglecting gradients normal to the observation line as follows,
where f is Coriolis parameter, Vg geostrophic velocity normal to the observation line, xa the coordinate along the observation line, b = –gρ/ρo is buoyancy with ρ density, ρo reference density, and g gravitational acceleration.
On the other hand, three-dimensional PV is computed using the horizontal flow in the simulation according to the following form, neglecting the small vertical velocity,
where u and v are zonal and meridional velocities, and x and y, respective coordinates with z vertical coordinate.
Assuming that density perturbations caused by the near-inertial waves are small, the non-geostrophic shears ( and ) are obtained by subtracting the geostrophic shear (–by/f and bx/f) from the total shear (uz and vz),
Since the Kuroshio is a strong current, it can induce Doppler-shift to the model variables recorded on the Eulerian frame. With this strong current, the finest grid domain is too small to employ the Lagrangian temporal filter by using numerous passive particles to extract internal wave energy flux, avoiding the Doppler shift (e.g., Nagai et al., 2015). Instead, the non-geostrophic shear is used to extract the internal wave velocities and the kinetic energy without the Doppler smearing effects. First, the surface mixed layer, which is defined as the layer with a density difference within 0.001 kg m-3 from the surface, is excluded for the analysis. Second, the non-geostrophic shear (3) is demeaned and detrended vertically to reduce the influences from the subinertial submesoscale shear. Finally, the modified non-geostrophic shear is integrated vertically to obtain the internal wave velocity (uIW, vIW). The estimated internal wave velocity exhibits baroclinic wave structures with vertical phase transitions consistent with the internal waves. Then, the obtained horizontal velocity of internal waves is used to compute the internal wave kinetic energy, .
The lowest internal wave frequency ωmin is computed using the vertical component of the relative vorticity ζ=vx−uy, Coriolis parameter f, the geostrophic vertical shear (, ), and the buoyancy frequency square N2 = db/dz as follows,
The geostrophic shear is obtained from model density horizontal gradient using the thermal-wind relation, f∂ug/∂z = -∂b/∂y, f∂vg/∂z = ∂b/∂x.
To investigate how the approaching model Kuroshio path influences on the environment of the continental shelf, several variables are averaged over the shelf, such as nitrate concentration, nitrate vertical gradient, nitrate vertical diffusive flux, and IWKE. The continental shelf is defined as the area with model depths shallower than 200 m. The 200 m criterion is used since internal waves are allowed in the stratified layers, and appear only below the mixed layer depth (50-100 m), leaving a layer of 150 m depth for their propagation at most.
The nitrate diffusive flux F (mmol m-2s-1) is obtained using F = KvdNut/dz, where Nut is the nitrate concentration (mmol m-3), z vertical coordinate, dNut/dz vertical nitrate gradient, and Kv KPP vertical diffusivity (m2s-1). These nitrate related parameters are interpolated at 100 m depth, just above the nutrient stream core (σθ = 26-26.5 kg m-3, Guo et al., 2012) where the water of high nitrate concentrations starts climbing up the slope when the Kuroshio flows closer to the coast (Supplementary Animation Anime S1).
Then, the nitrate parameters and IWKE are averaged zonally to construct the quantities over the continental shelf as a function of latitude and time. Along the latitudinal direction, a 2.5 km running average is performed for these zonally averaged parameters.
To investigate the influences of the Kuroshio path modulations on the IWKE, nitrate concentration, nitrate vertical gradient, and nitrate diffusive flux, the minimum distance between the Kuroshio and the coast as a function of latitude and time are computed. First, the model Kuroshio axis is defined by the contour of the sea surface height (SSH) at 0.2 m. The SSH = 0.2 m is selected because the fastest part of the Kuroshio is found to be aligned parallel to this contour on average, although it is sometimes misaligned due to effects of land and islands on the sea surface height gradients of the Kuroshio. Second, the coastline is determined excluding small bays with convoluted shoreline. Finally, the minimum distance to the Kuroshio is obtained at each point along the defined coastline.
To determine the frequency of the fluctuating internal wave velocity shear in the simulation, avoiding the Doppler effect, Lagrangian particles passive to three-dimensional flow are released in the finest grid model domain during December. The passive 3000 particles are released three times every 5 days from December 1st between 15 and 200 m depth, within the ranges of 131.1-131.45°E and 30.9-31.18°N in the upstream region. The vertical shear of zonal and meridional velocities is interpolated along the trajectories of each particle and written as hourly averages in the output file. The released particle trajectories are shown as an Animation In Supplementary Animation Anime S2.
Sea surface temperature (SST) and sea surface height (SSH) satellite observations from Himawari-8 and AVISO (Archiving, Validation, and Interpretation of Satellite Oceanographic data), respectively, are obtained on November 25th, 2018, same period when observations were taken onboard by Nagai et al. (2019), to be compared with the model results (Figure 1). Besides, the simulation results on November 11th and December 20th are compared to contrast the different Kuroshio path states (Figures 1B, C). From these comparisons, it is found that the model results in December are more consistent with the satellite observations during the November 2018 cruise, since the model Kuroshio (defined at SSH = 0.2 m contour) flows northeastward off Kyushu, reaches the latitude 31.45°N, and sets a warm temperature boundary up to 24°C in front of the coast, similar to the observations. Slightly colder SST on the model December 20th (Figure 1C) than the satellite SST on November 25th (Figure 1A) is attributed to a more active wintertime cooling in late December. Simultaneously, December model nitrate distributions present a tongue of high concentration near the bottom that runs along the shoaled isopycnal toward the coast (Figure 2A). Although the detailed nitrate distribution is not perfectly reproduced by the model, the relation between the nitrate concentrations and the water density is consistent with the observations. For example, nitrate concentrations of and ~14 – 16μ M can be found along isopycnals σθ = 25.5 and 26 kg m-3, respectively, for both in the observations and the model. The difference of nitrate distributions between the observations in November and the model December arises from the slightly different density distributions. Since the hydrographic vertical structures are rapidly changing, as shown in the supplementary animations (Supplementary Animation Anime S1), and observations took 8 hours to complete, the differences can be caused not only by spatial distribution mismatches but also by the temporal aliasing in the observations. The detailed comparisons of the ROMS results with the reanalysis given in the Supplementary Material (Supplementary Figures S1–S8) suggest that the hydrographic vertical structures are fairly well reproduced by ROMS as long as the Kuroshio flows similarly with respect to the coast.
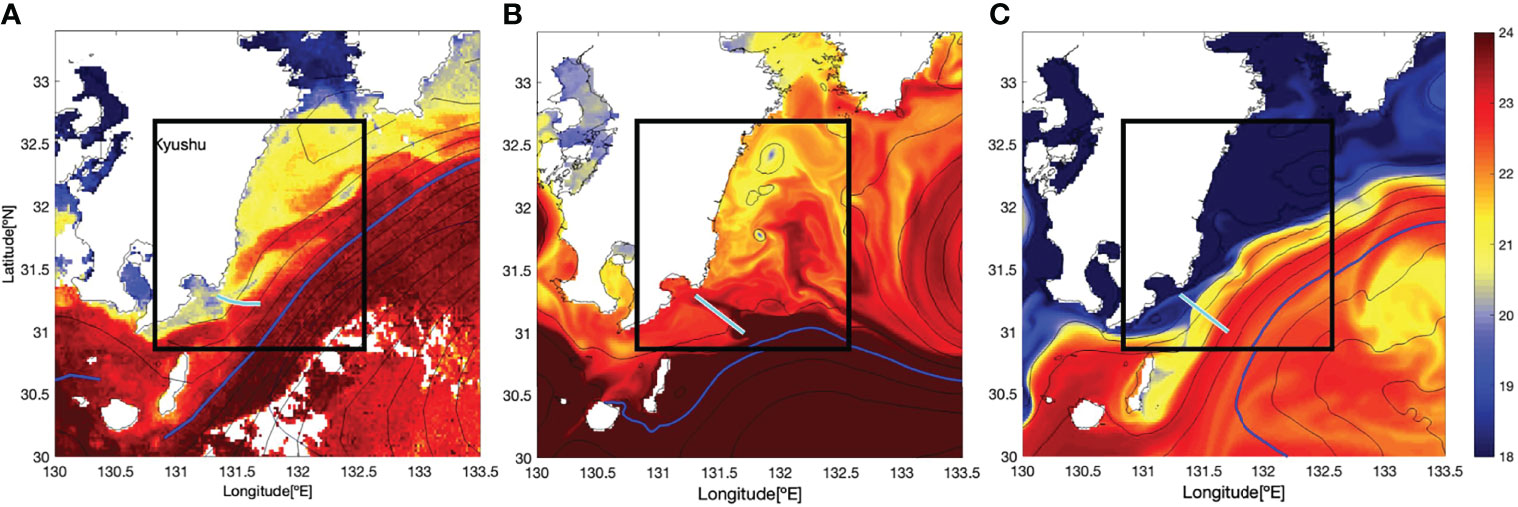
Figure 1 Sea Surface Temperature °C for (A) satellite observation by Himawari-8 on Nov25th, 2018, and for the ROMS simulation on (B) November 11th and (C) December 20th. Thin black contours represent Sea Surface Height (SSH), and the Kuroshio axis is represented as the blue contour at SSH = 1.1 m for (A) the observation (COPERNICUS Marine Service) and at SSH = 0.2 m for (B, C) the simulations. Cyan lines represent where the vertical sections are computed, and black squares enclose the finest grid region of ROMS.
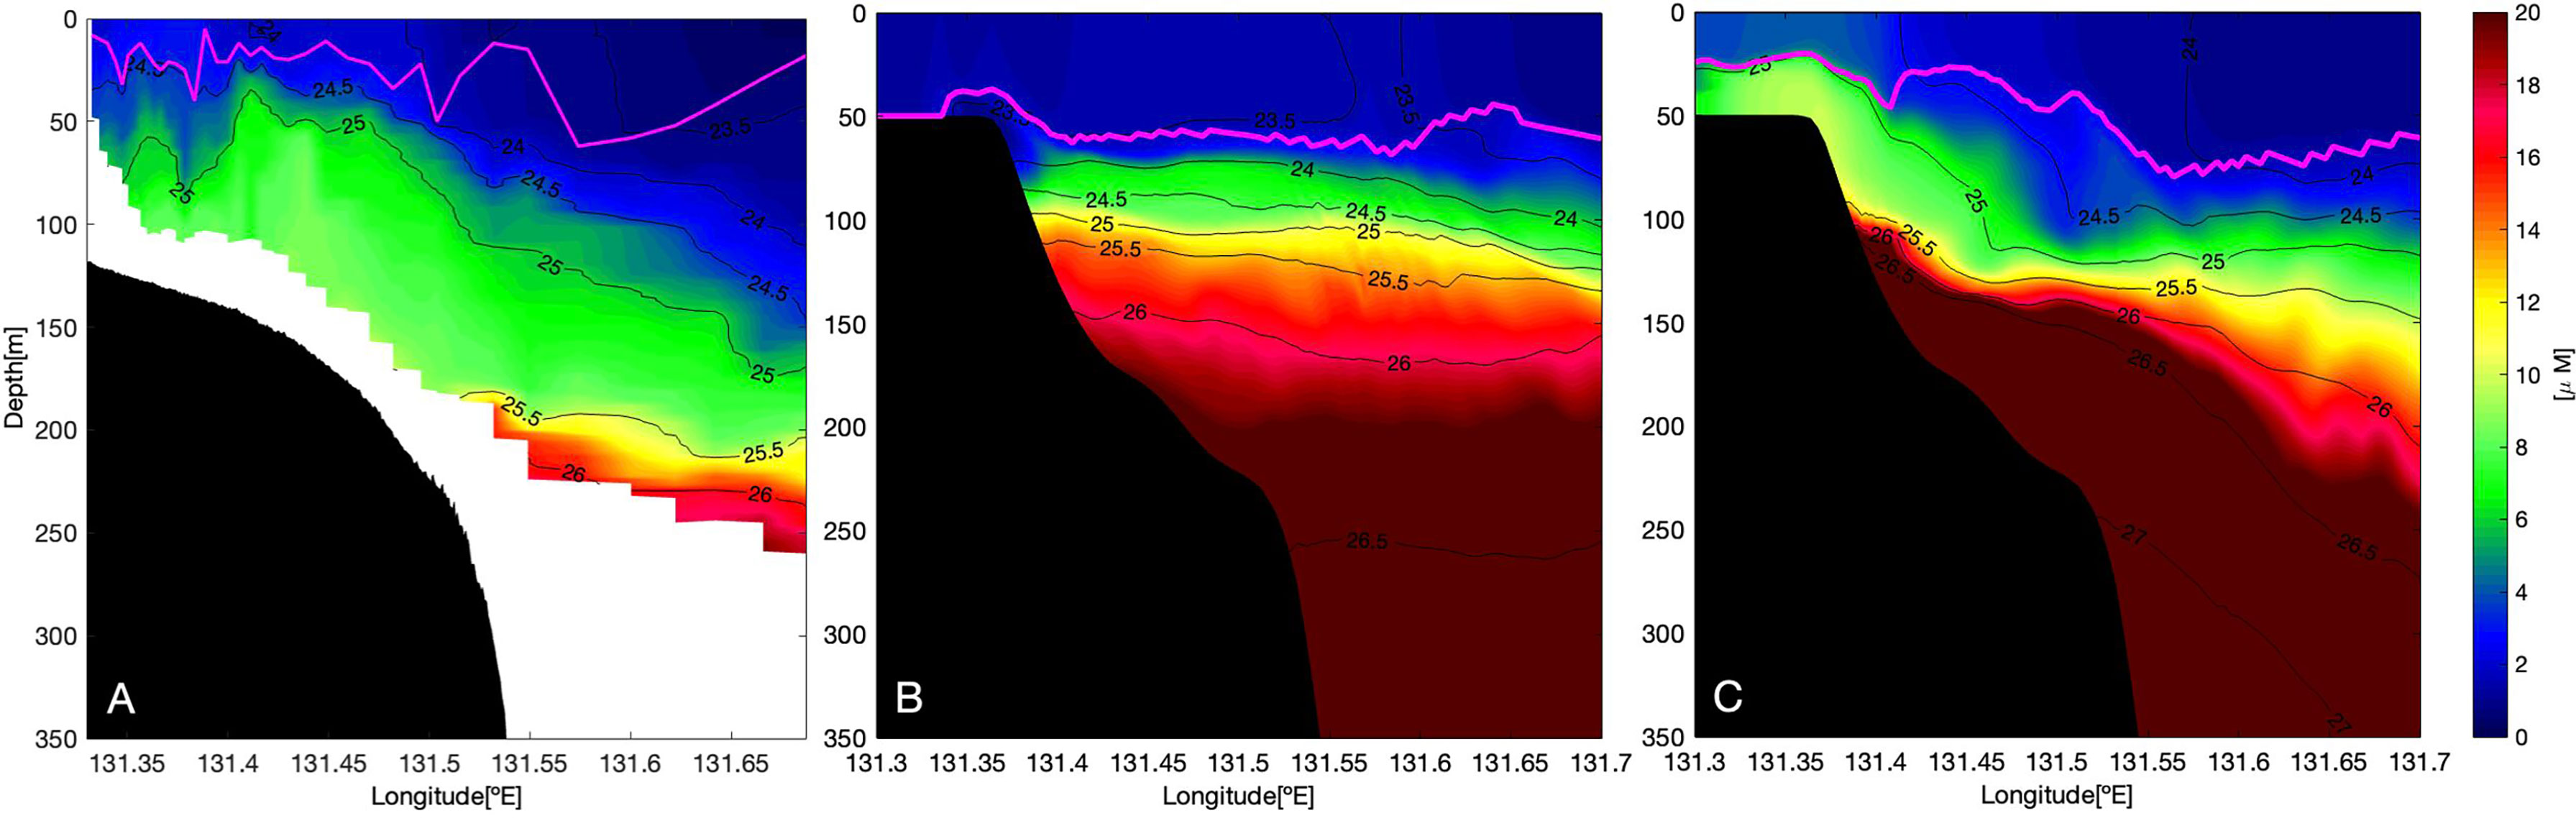
Figure 2 Vertical sections, computed along the cyan line in Figure 1, of nitrate concentration (μM) for (A) in-situ data taken onboard in November 2018 (Nagai et al., 2019), for ROMS numerical simulation on (B) November 11th and (C) December 20th at hour 18:00. The black contours represent isopycnals, and the magenta line represents the mixed layer depth (MLD) where density difference is 0.125 kg m-3 from the surface. Black shapes near the bottom represent (A) acoustically detected bottom depth and (B, C) model topography.
On the contrary, the model Kuroshio in November flows away from the coast, being observed at the southern edge of the finest model domain (inside the black square in Figure 1) at the position of 31.1°N, 131.8°E. The vertical section of the model density shows that less dense water (σθ < 24 kg m-3) is located at the surface layers, above 50 m depth, except near longitude 131.6°E, in which relatively dense water appears (Figure 2). Further, isopycnals are nearly flat below 50 m depth with the contours of σθ = 26 kg m-3 and σθ = 26.5 kg m-3 located at depths of 150 m and 270 m, respectively, suggesting that there is no frontal structure and nitrate rich water is kept in darker and deeper layers.
Note that the model bottom topography (black shape in Figure 2B) is shallower near the coast than the acoustically detected ones in the observations that is around 150 m depth (black shape in Figure 2), that likely blocks the model onshore flow. However, as shown in the Supplementary Material (Supplementary Figures S9, S10), the model topography near the coast is generally deeper by 10-50 m and smoother than the topographic source data (J-EGG500). This suggests that the contrast in the topography between the model and the acoustically detected one is due to high resolution lateral in-situ depth changes that are not resolved in J-EGG500 and does not represent the average difference between the model and the real topography, i.e., the model has much deeper and milder bottom slope compared to the real topography, which would allow more onshore flows rather than blocking them.
The mixed layer depth (MLD) across the Kuroshio during November 2018 observations, defined at the depth where the density differs 0.125 kg m-3 from the surface, is as shallow as ~30 m on the onshore side, and it deepens slightly offshore between longitudes 131.58-131.61 °E with a convex downward structure down to ~60 m (Figure 2). Similarly, the model MLD in December remains shallower on the onshore side (~50 m) than that on the offshore side from longitude 131.55°E, where the MLD deepens to ~100 m depth, with a convex downward structure centered at 131.6°E (Figure 2). Although the spatial patterns of the MLD in the observation and the model are consistent, the model MLD during December is roughly 50 m deeper than that in the observation. Yet, as it was explained previously, the December model nitrate concentration presents more similar distributions to the in-situ data with a high concentration tongue running over the slope, probably caused by the tilted pycnocline of the Kuroshio approaching to the coast for both observations and December model results. Below the model MLD, the nitrate concentrations are brought upward onshore side, resulting in higher concentrations between 50 and 100 m depth over the continental shelf.
To compare the model Kuroshio with the observations quantitatively, the mean distance between the Kuroshio axis and the coastline within the latitude range of 31.0-31.45°N is computed. This range is selected since the model Kuroshio in December (SSH = 0.2 m) flows away from the coast at latitude 31.45°N, as it is observed in the finest grid of the ROMS (inside the black square in Figure 1C). The computed mean distance to the Kuroshio is 92 km from the coastline. On the other hand, the distance obtained for the observations considers the Kuroshio axis as the contour at SSH = 1.1 m, since the SSH contour from satellite sea surface height AVISO data at this value is located within the highest SSH gradient band along the Kuroshio (Supplementary Figure S11). The calculated distance with respect to the coastline within the same latitude range is 93 km. The similarity in these distances and the SSH spatial patterns, between the observations in November and the model December, allows us to consider that the model December results are closer to the observed ones for further analyses.
However, even though both the observation and the model results present similar spatial distribution patterns for chlorophyll-a (Figure 3), with higher concentrations on the shore side in upper 50 m depth, the model chlorophyll-a overestimates the in-situ data by threefold.
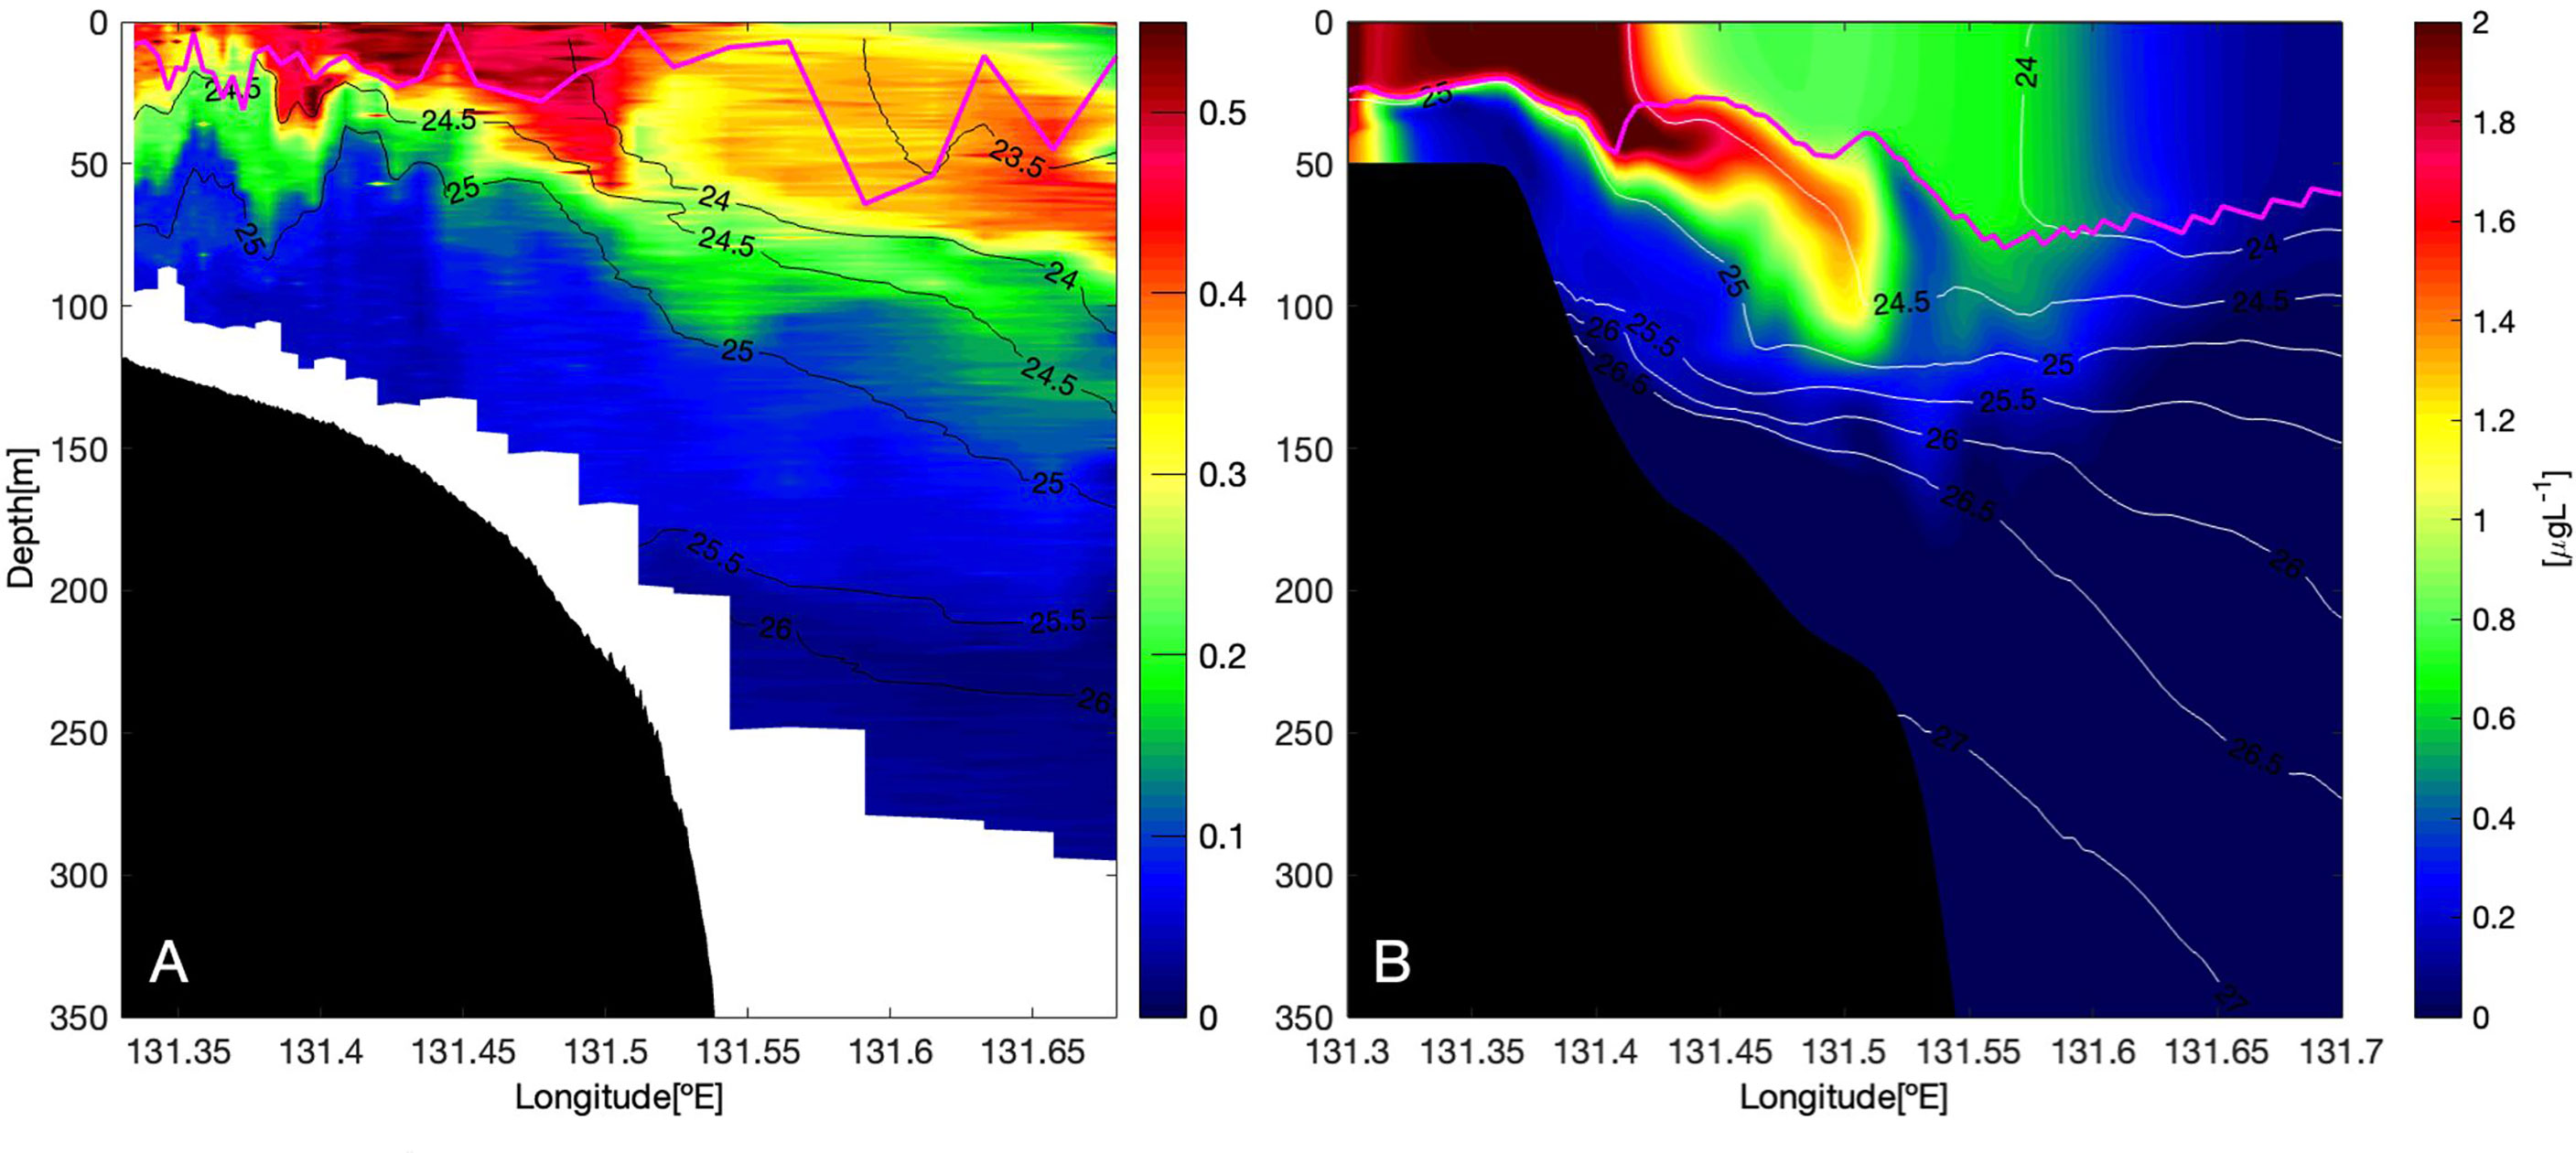
Figure 3 Vertical sections, computed along the cyan line in Figure 1, of chlorophyll-a concentration (μg L-1) for (A) in-situ data taken onboard in November 2018 (Nagai et al., 2019), and for (B) ROMS numerical simulation on December 20th at hour 18:00. The black and white contours in A and B, respectively, represent isopycnals and the magenta line represents the MLD.
To compare the model velocities with the observations, velocities are decomposed into along and across front components with respect to the mean Kuroshio Current direction for both the observations and the model (Figure 4). A core of large positive along-frontal velocities are directed northeastward above 120 m depth in the observation (Figure 4A), while the fast current of ~1 ms-1 in the model reaches down to 250 m depth on the offshore side from the longitude 131.63°E, associated with a deeper baroclinic isopycnal structure (Figure 4B). Additionally, the observations suggest the presence of a counter current near the sloping bottom of the continental shelf, with negative values of the along-front current velocity within the depth ranges of 50-125 m and 175-250 m. Although this counter current is also seen in the model but with a deeper extent, the model across-front current presents larger spatial structures than the observations with offshore-ward and onshore-ward currents separated around 131.6°E. Both the model and the observations show banded structures of alternating positive and negative signs, that are suggestive of internal waves (Figures 4C, D). Thus, the model velocity fields are in fairly good agreement with the observations.
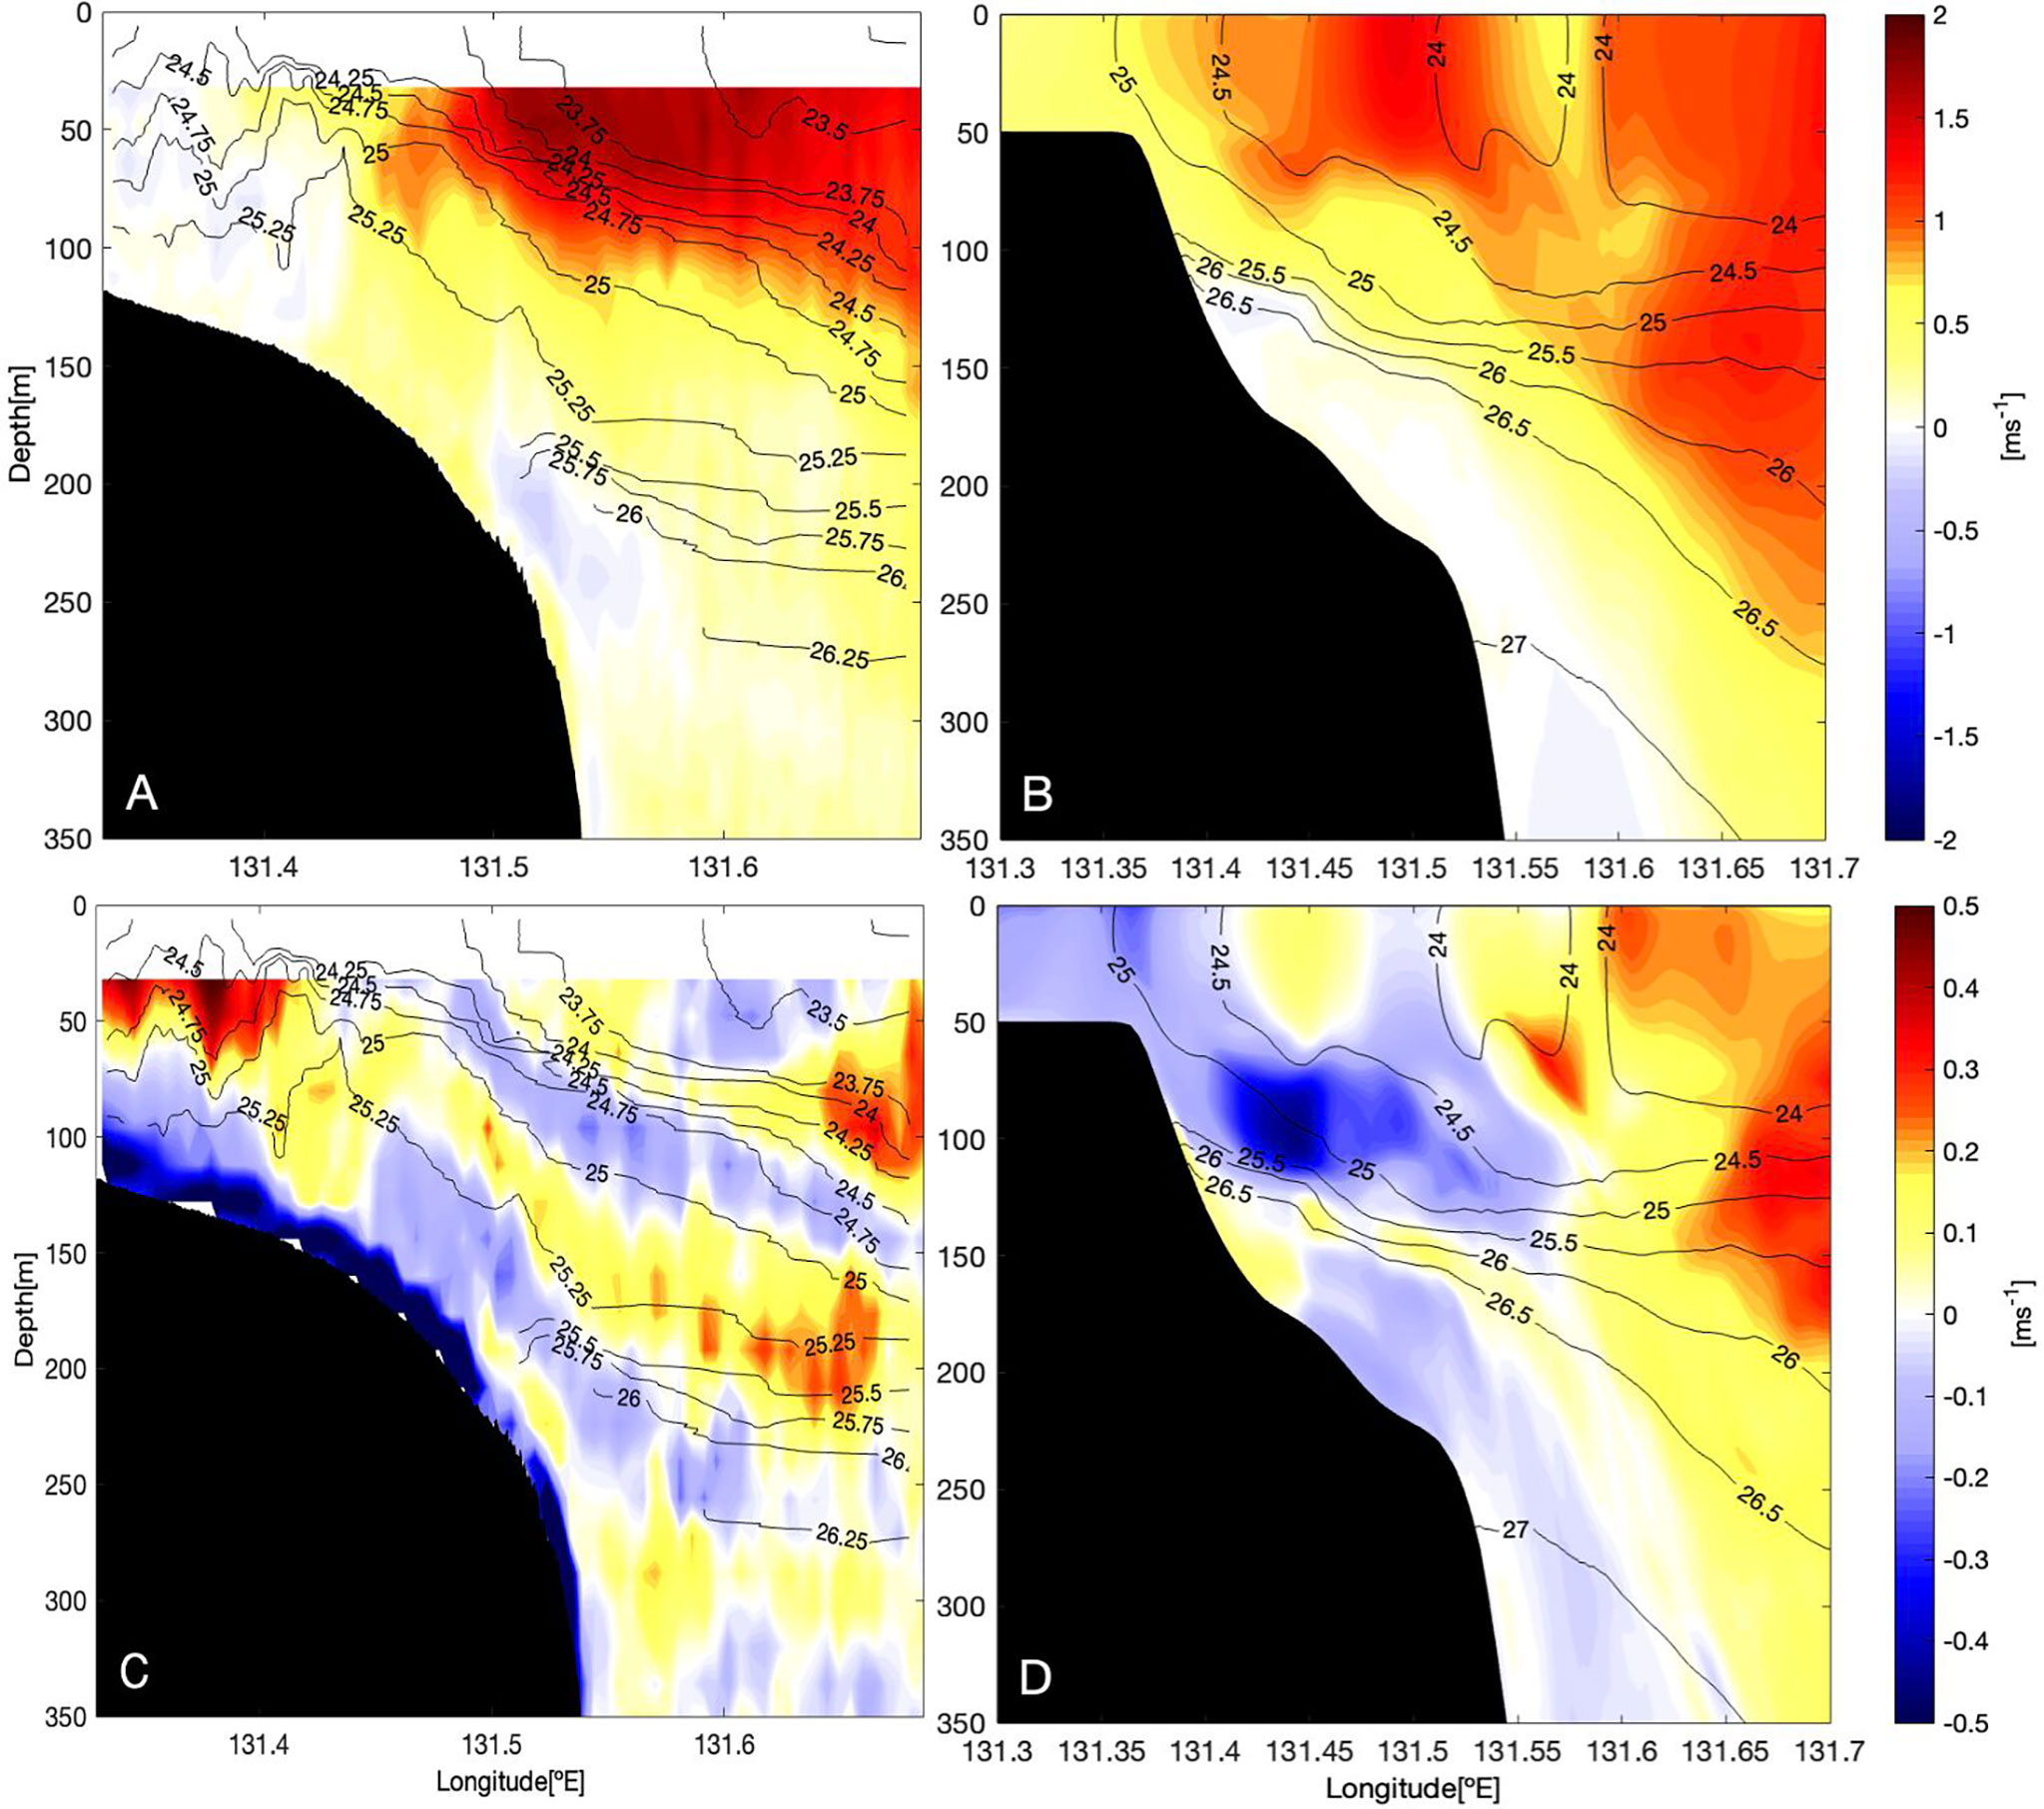
Figure 4 Vertical sections of (A, B) along and (C, D) across-frontal velocities (ms-1). (A, C) are from in-situ observations taken onboard in November 2018 (Nagai et al., 2019); (B, D) are from ROMS numerical simulation on December 20th at hour 08:00. Positive velocity indicates the flow toward the Kuroshio downstream in (A, B) and toward offshore in (C, D). The black contours represent isopycnals. Note there are marked differences in the density structures at 50-100 m between isopycnals σθ = 24.5 and 25 kg m-3 after 10 hours that are shown in Figure 3, illustrating how rapidly the hydrographic structures change over time.
From the observation data, two-dimensional potential vorticity (PV2D) is computed using (1), with measured density and the velocity across the Kuroshio (Figure 5A). Note, however, that as the geostrophic flow with the level of no motion at 300 m depth at most is not reliable, the ADCP lateral velocity gradient is used for the geostrophic lateral velocity shear, instead. Negative values of PV2D appear on the core of the along-frontal flow in the upper 75 m depth at longitude 131.55°E. These negative PV2D values coincide with intense turbulent kinetic energy (TKE) dissipation rates (Figure 5B), suggesting that submesoscale inertial and symmetric instability could be the cause of the strong turbulence over the shelf. It should be noted that these negative values are also found in some other regions, such as around 50 m depth at longitude 131.4°E; however, since these locations are in well-stratified layers without large TKE dissipation rates, it is suspected that the missing nonmeasurable along-frontal gradients produce these erroneous negative values. Those neglected gradients in the two-dimensional assumption are probably caused by internal waves.
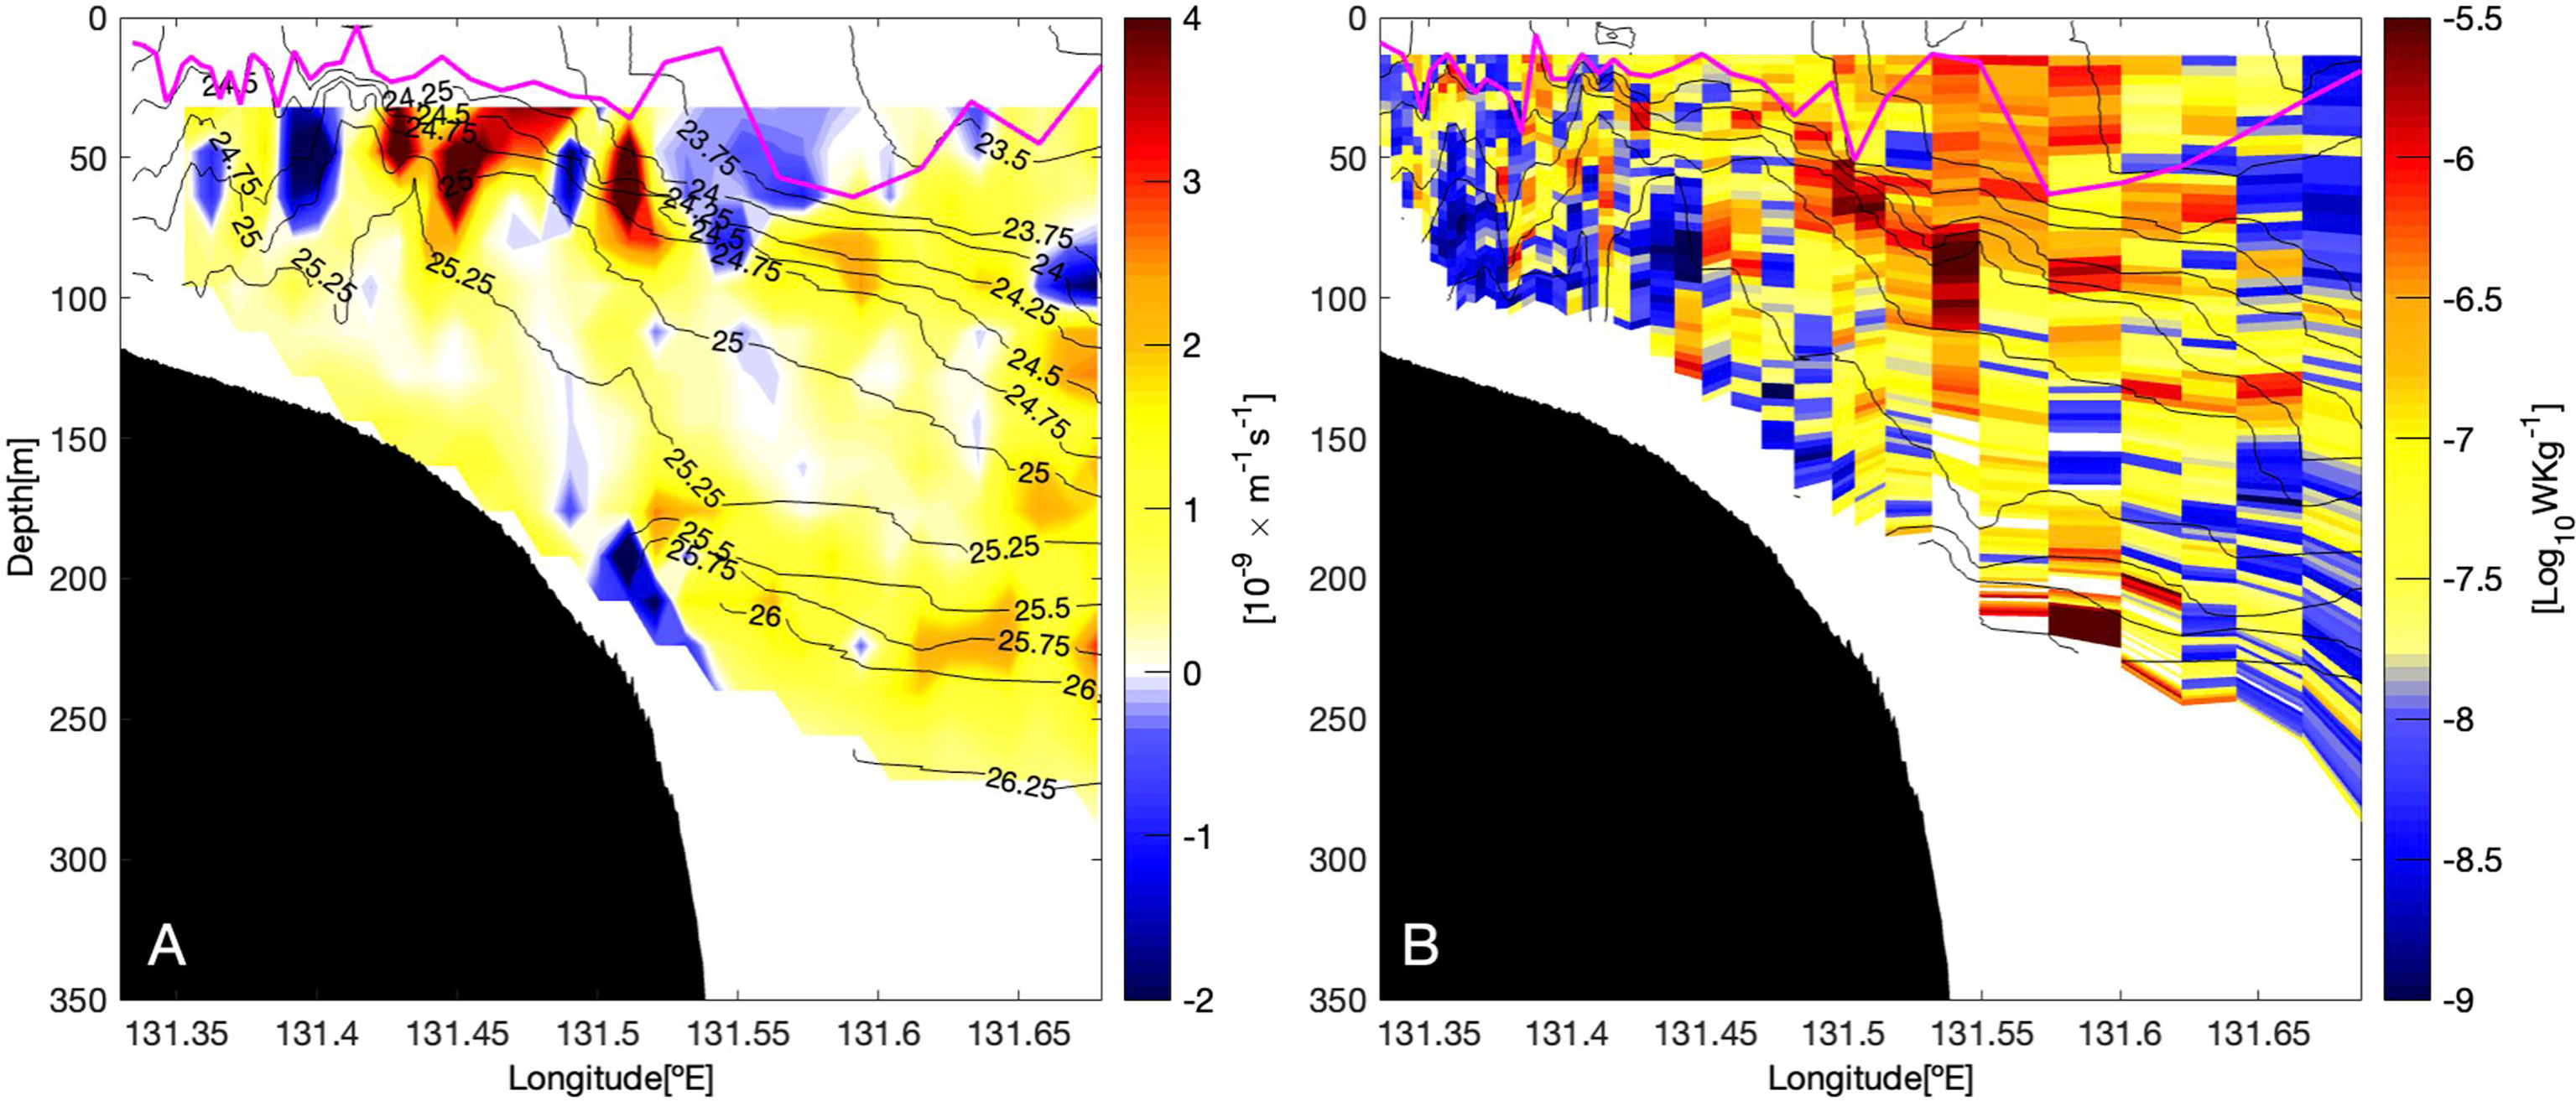
Figure 5 Observations taken onboard in November 2018 (Nagai et al., 2019) for (A) two-dimensional potential vorticity (1) and (B) turbulent kinetic energy (TKE) dissipation rate (WKg-1). The black contours represent isopycnals and the magenta line represents the MLD.
On the other hand, three-dimensional PV is computed using (2) in the numerical model. The plane view of the model PV, interpolated at 100 m depth, shows its highest values of 4 × 10⁻⁹m-1s-1 along the cyclonic side of the model Kuroshio axis (the blue contour at SSH = 0.2 m), which extends closely to the coast. More importantly, the northeastward flowing model Kuroshio generates negative PV at the shallow bump in the upstream region, located within the range of 30.9-31.4°N, 131.1-131.5°E, forming a streak of low PV in the southwestern region of the domain (Figure 6A). The vertical section of the model PV presents large positive values along the pycnocline, while the negative PV values are above the pycnocline at 131.55°E, similar to the observation (Figures 6B, 5A). Furthermore, banded shear with positive and negative signs along the tilted isopycnals of the Kuroshio front are reproduced by the model, presenting larger amplitudes over the continental shelf (Figure 6C). The shear banding nearly along density surfaces is suggestive of propagating near-inertial internal waves, which can be trapped within the Kuroshio by its large anticyclonic vorticity and geostrophic vertical shear (Whitt and Thomas, 2013). In addition, the negative PV, accompanied by sharp lateral density gradient, can induce submesoscale instability, such as inertial and symmetric instability, followed by secondary Kelvin-Helmholtz (K-H) instability and strong turbulence (Molemaker et al., 2015; Gula et al., 2016; Nagai et al., 2021a), although these instabilities are not fully resolved in the present simulation of 500-m resolution.
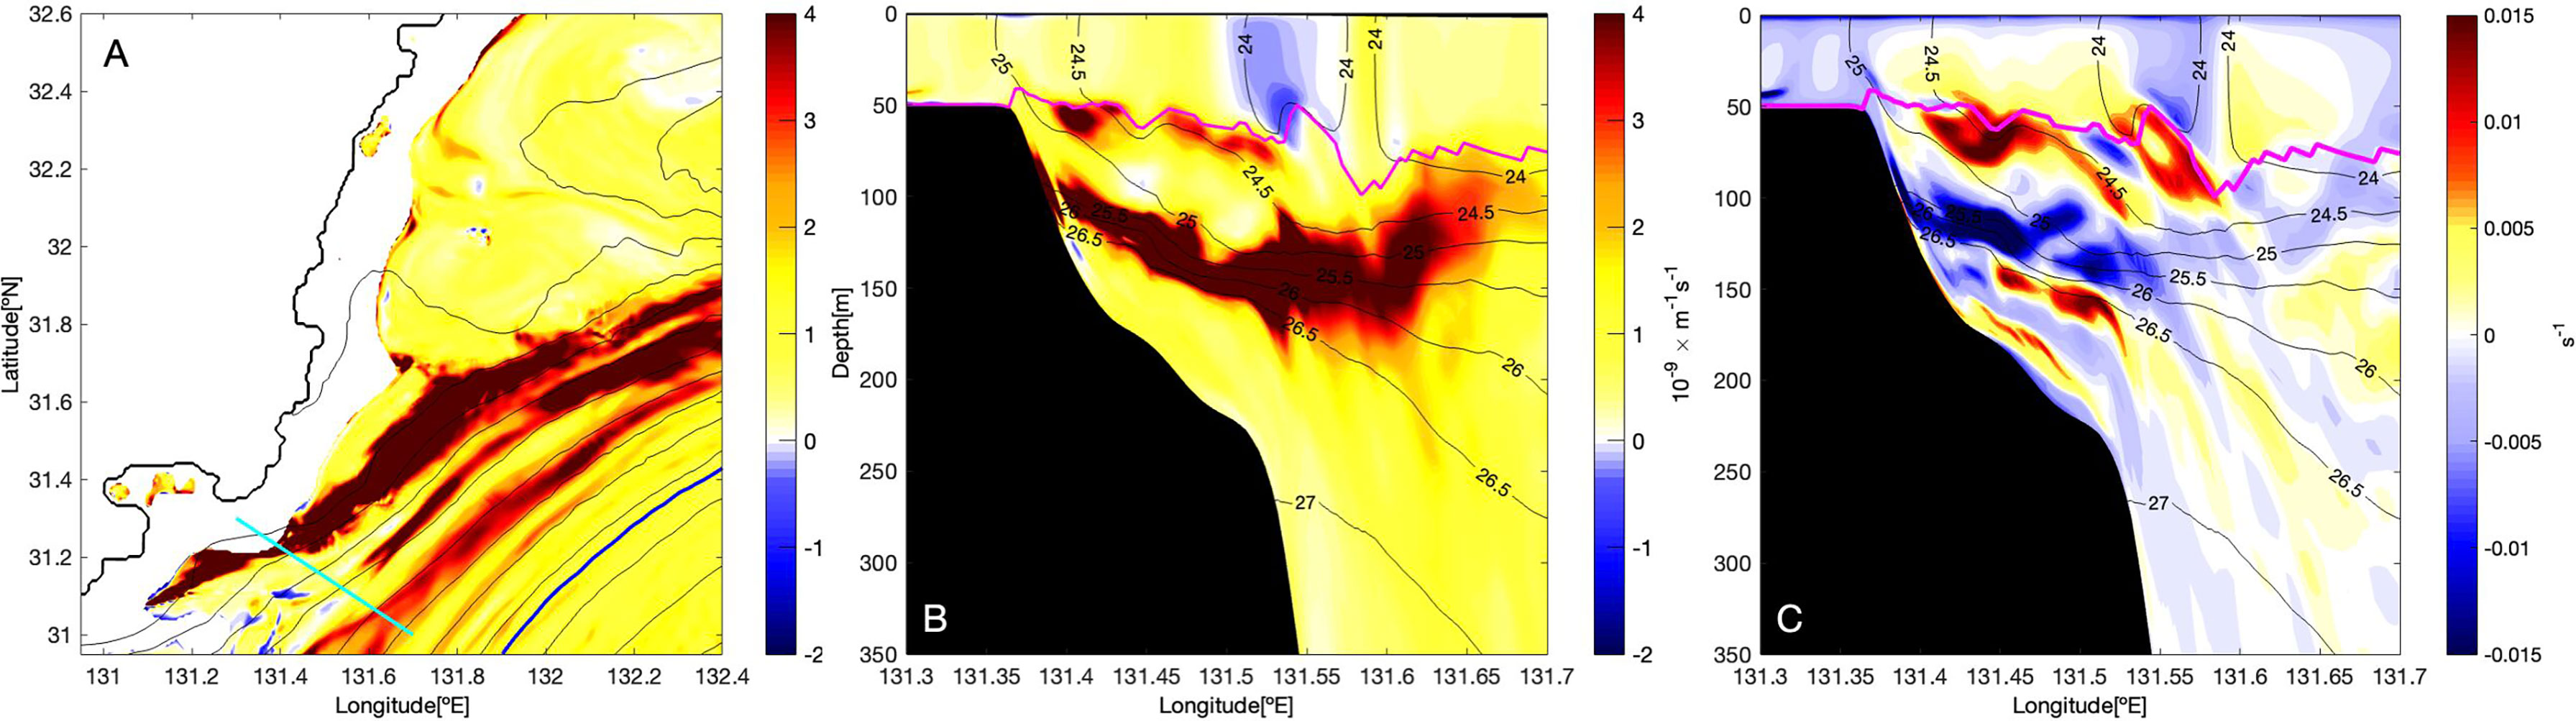
Figure 6 Potential vorticity and vertical shear from the simulation on December 20th at hour 08:00 for (A) plane view of potential vorticity (2) interpolated at 100 m depth, vertical sections computed along the cyan line in (A) for (B) potential vorticity (m-1s-1) and (C) zonal shear (s-1). Blue contour in (A) represents the model Kuroshio axis at SSH = 0.2 m, and magenta line in (B, C) is the MLD.
Aside from the similarity of the nitrate tongue in the model December result and in the observations, which extends from dark subsurface layers toward upper layers in the onshore region (Figures 2A, C), elevated subsurface nitrate diffusive flux also appears within the density range of σθ = 24.5-26 kg m-3, that is consistent with the observations (Figure 7). Since the core of the model Kuroshio nutrient stream is found at σθ= 26-26.5 kg m-3 (Supplementary Animation Anime S1), as it has been found by Guo et al. (2012), the elevated diffusive flux could inject nitrate from the upper part of the nutrient stream to shallower layers. However, the isopycnal σθ = 26 kg m-3 is found at approximately 50 m deeper in the observation than the simulation because of a much thicker pycnostad of σθ=25-25.5 kg m-3 in the observations, probably caused by tidal mixing and/or the mixing induced by the Kuroshio intrusion in the upstream region. Consequently, the isopycnal σθ = 26.5 kg m-3 cannot be seen in the observations (Figure 7A), since its depth is too close to the bottom or exceeds the tow-yo instrument reachable depth. Although the depths of denser water than σθ = 25.5 kg m-3 in the model are approximately 50 m shallower than the observations, the large nitrate diffusive flux of 1-10 mmol m-2day-1 is found within the density range of 24.5-26 kg m-3, similar to the observation, demonstrating that the model does capture the elevated diffusive nitrate flux from the upper core of the Kuroshio nutrient stream.
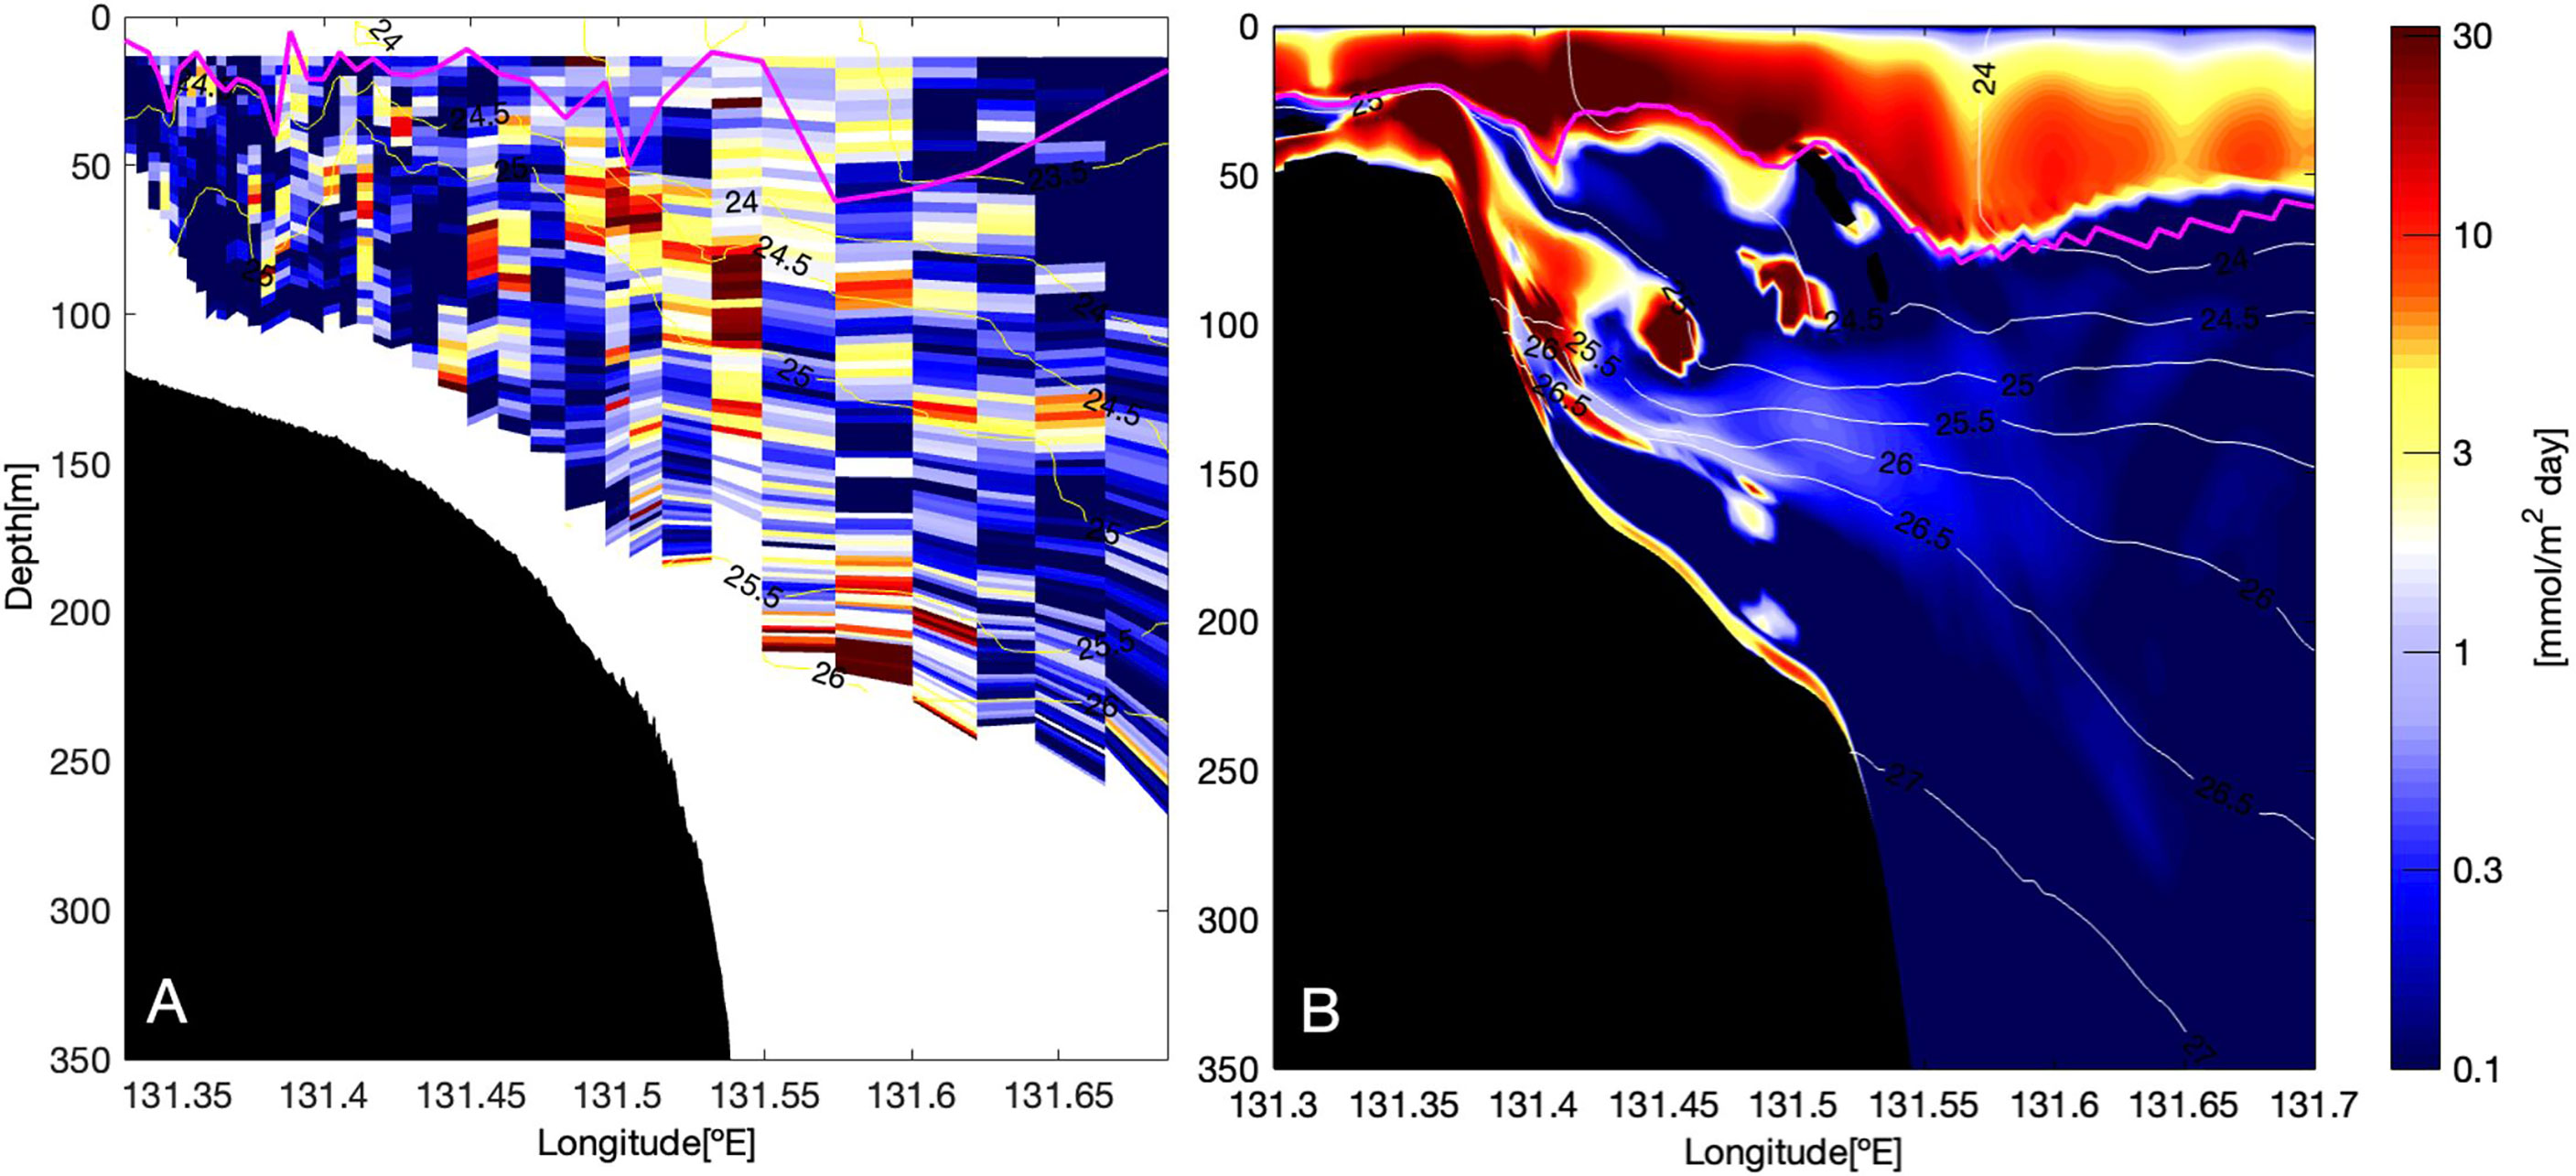
Figure 7 Vertical sections of nitrate diffusive flux (mmol m-2day-1) for (A) in-situ data in November 2018 (Nagai et al., 2019) and for (B) numerical simulation on December 20th at hour 18:00. Magenta line represents the MLD.
The generation of negative PV on the slope of the shallow bump in the upstream region, revealed by the observation and the model (Figures 5A, 6A), implies that the observed intense turbulence can be attributed to secondary K-H instability associated with inertial and symmetric instability. Nonetheless, Nagai et al. (2019) interpreted that the strong turbulence and associated elevated nitrate diffusive flux are caused by trapped near-inertial internal waves within the Kuroshio. To elucidate whether trapped near-inertial waves influence on the nitrate flux, the model internal wave kinetic energy (IWKE) is investigated. In the region of the latitudes 31-31.5°N, the computed IWKE shows two bands of high values that form a V-shaped distribution (Figure 8A). One of these branches runs offshore region, while the other one spreads closer to the coast. The latter one coincides with a narrow band of lowered lowest internal wave frequency ωmin (4), suggesting that these internal waves are near their minimum frequencies and they may have gotten trapped in the region with lowered ωmin (Figure 8B). It should be noted that the high IWKE coastal branch goes through the region where the vertical sections have been shown previously in Figures 2–4 and 6, 7.
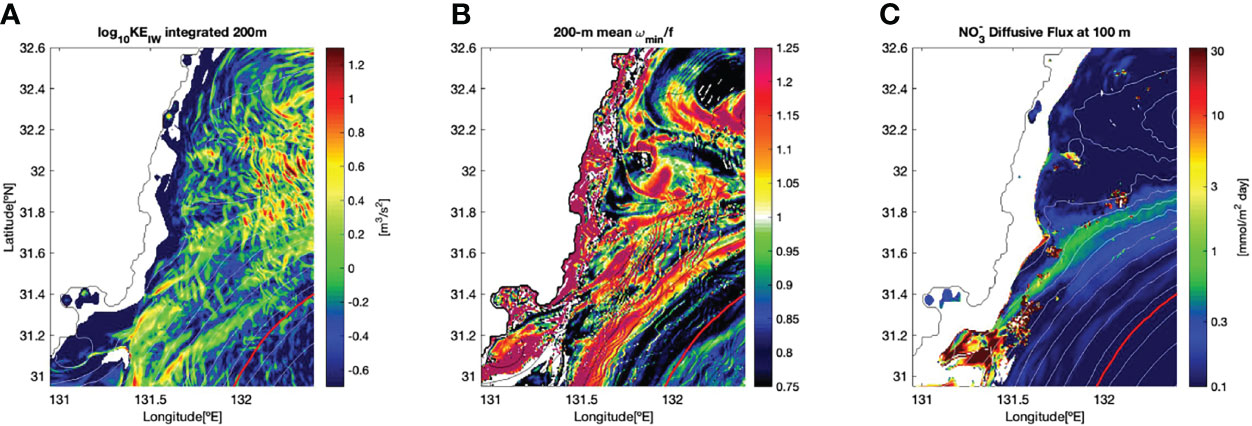
Figure 8 Plane views on December 20th at hour 18:00 of (A) internal wave kinetic energy integrated over 200 m depth (m3s-2), (B) the minimum internal wave frequency divided by Coriolis parameter ωmin/f averaged within upper 200 m, and (C) nitrate diffusive flux (mmol m-2day-1) interpolated at 100 m depth. Red line represents the Kuroshio axis at SSH = 0.2 m.
Regions of high IWKE with relatively high ωmin, especially in the offshore region, are found probably because internal waves could have broadband frequencies, but they are still near the local ωmin, which varies spatially because of the geostrophic shear. For instance, high IWKE regions with ωmin/f ~ 1, surrounded by ωmin/f > 1.1, can still be attributed to trapped internal waves with super-inertial frequencies, yet these frequencies are still near the lowest local internal wave frequency (Whitt et al., 2018). These trapped near-lowest-frequency internal waves, in a region with lowered ωmin, could induce strong turbulence caused by their large amplitude vertical shear with high vertical wavenumbers. Lastly, the model diffusive flux clearly shows large values of O(1 mmol m-2day-1) that persist downstream over ~100 km along the Kuroshio (Figure 8C). This band of elevated nitrate diffusive flux is found near and within the region of high IWKE band and lowered ωmin, that is close to the coast. Likewise, there is an even larger nitrate diffusive flux O(10 mmol m-2day-1), which can be clearly seen in the upstream region where the Kuroshio flows over the shallow bump, that coincides with the locations of negative and near zero PV values (Figure 6A). From the December model results, it has been shown that the approaching Kuroshio to the coast leads to generations of low and negative PV and to the near-lowest-frequency internal wave trapping, which in turn elevate the nitrate diffusive flux. This simulated nitrate diffusive flux of 1-10 mmol m-2day-1 over the tilted thermocline of the Kuroshio, within 50-120 m depth, is qualitatively and quantitatively consistent with the observations, whereas the elevated flux above the model mixed layer depth is inconsistent with the observations (Figures 7A, B).
Although observations made by Nagai et al. (2019) revealed that the elevated nitrate diffusive flux occurs when the Kuroshio flows close to the coast, as the observations were conducted just once, it remains unclear how the elevated mixing and the nitrate flux are modulated by the Kuroshio path variations. To analyze these temporal variations, the averaged IWKE and nitrate flux over the continental shelf are computed as a function of latitude and time (Figures 9, 10). The integrated IWKE over 200 m depth on the continental shelf presents high values in the upstream latitudes from the end of October to the beginning of November. Then, low IWKE values appear in all through November, that are followed by an increase from the beginning of December. After the IWKE decreases from early-middle December, an increase is clearly seen toward the downstream, reaching up to 31.8°N, to the end of December. In parallel, the averaged nitrate flux at 100 m depth presents an increasing trend from the end of November through December (Figure 10C). The averaged concentration shows a first moderate increase in the second half of November, up to ~O(1μM), but it does not extend further north. In contrast, from the beginning of December high concentrations of ~O(10 μM) extend along the coast getting as far as latitude 32°N. Right before the start of this increase, the vertical gradient of nitrate concentration is intensified, which is accompanied by an increase of nitrate diffusive flux that reaches values of O(10 mmol m-2day-1).
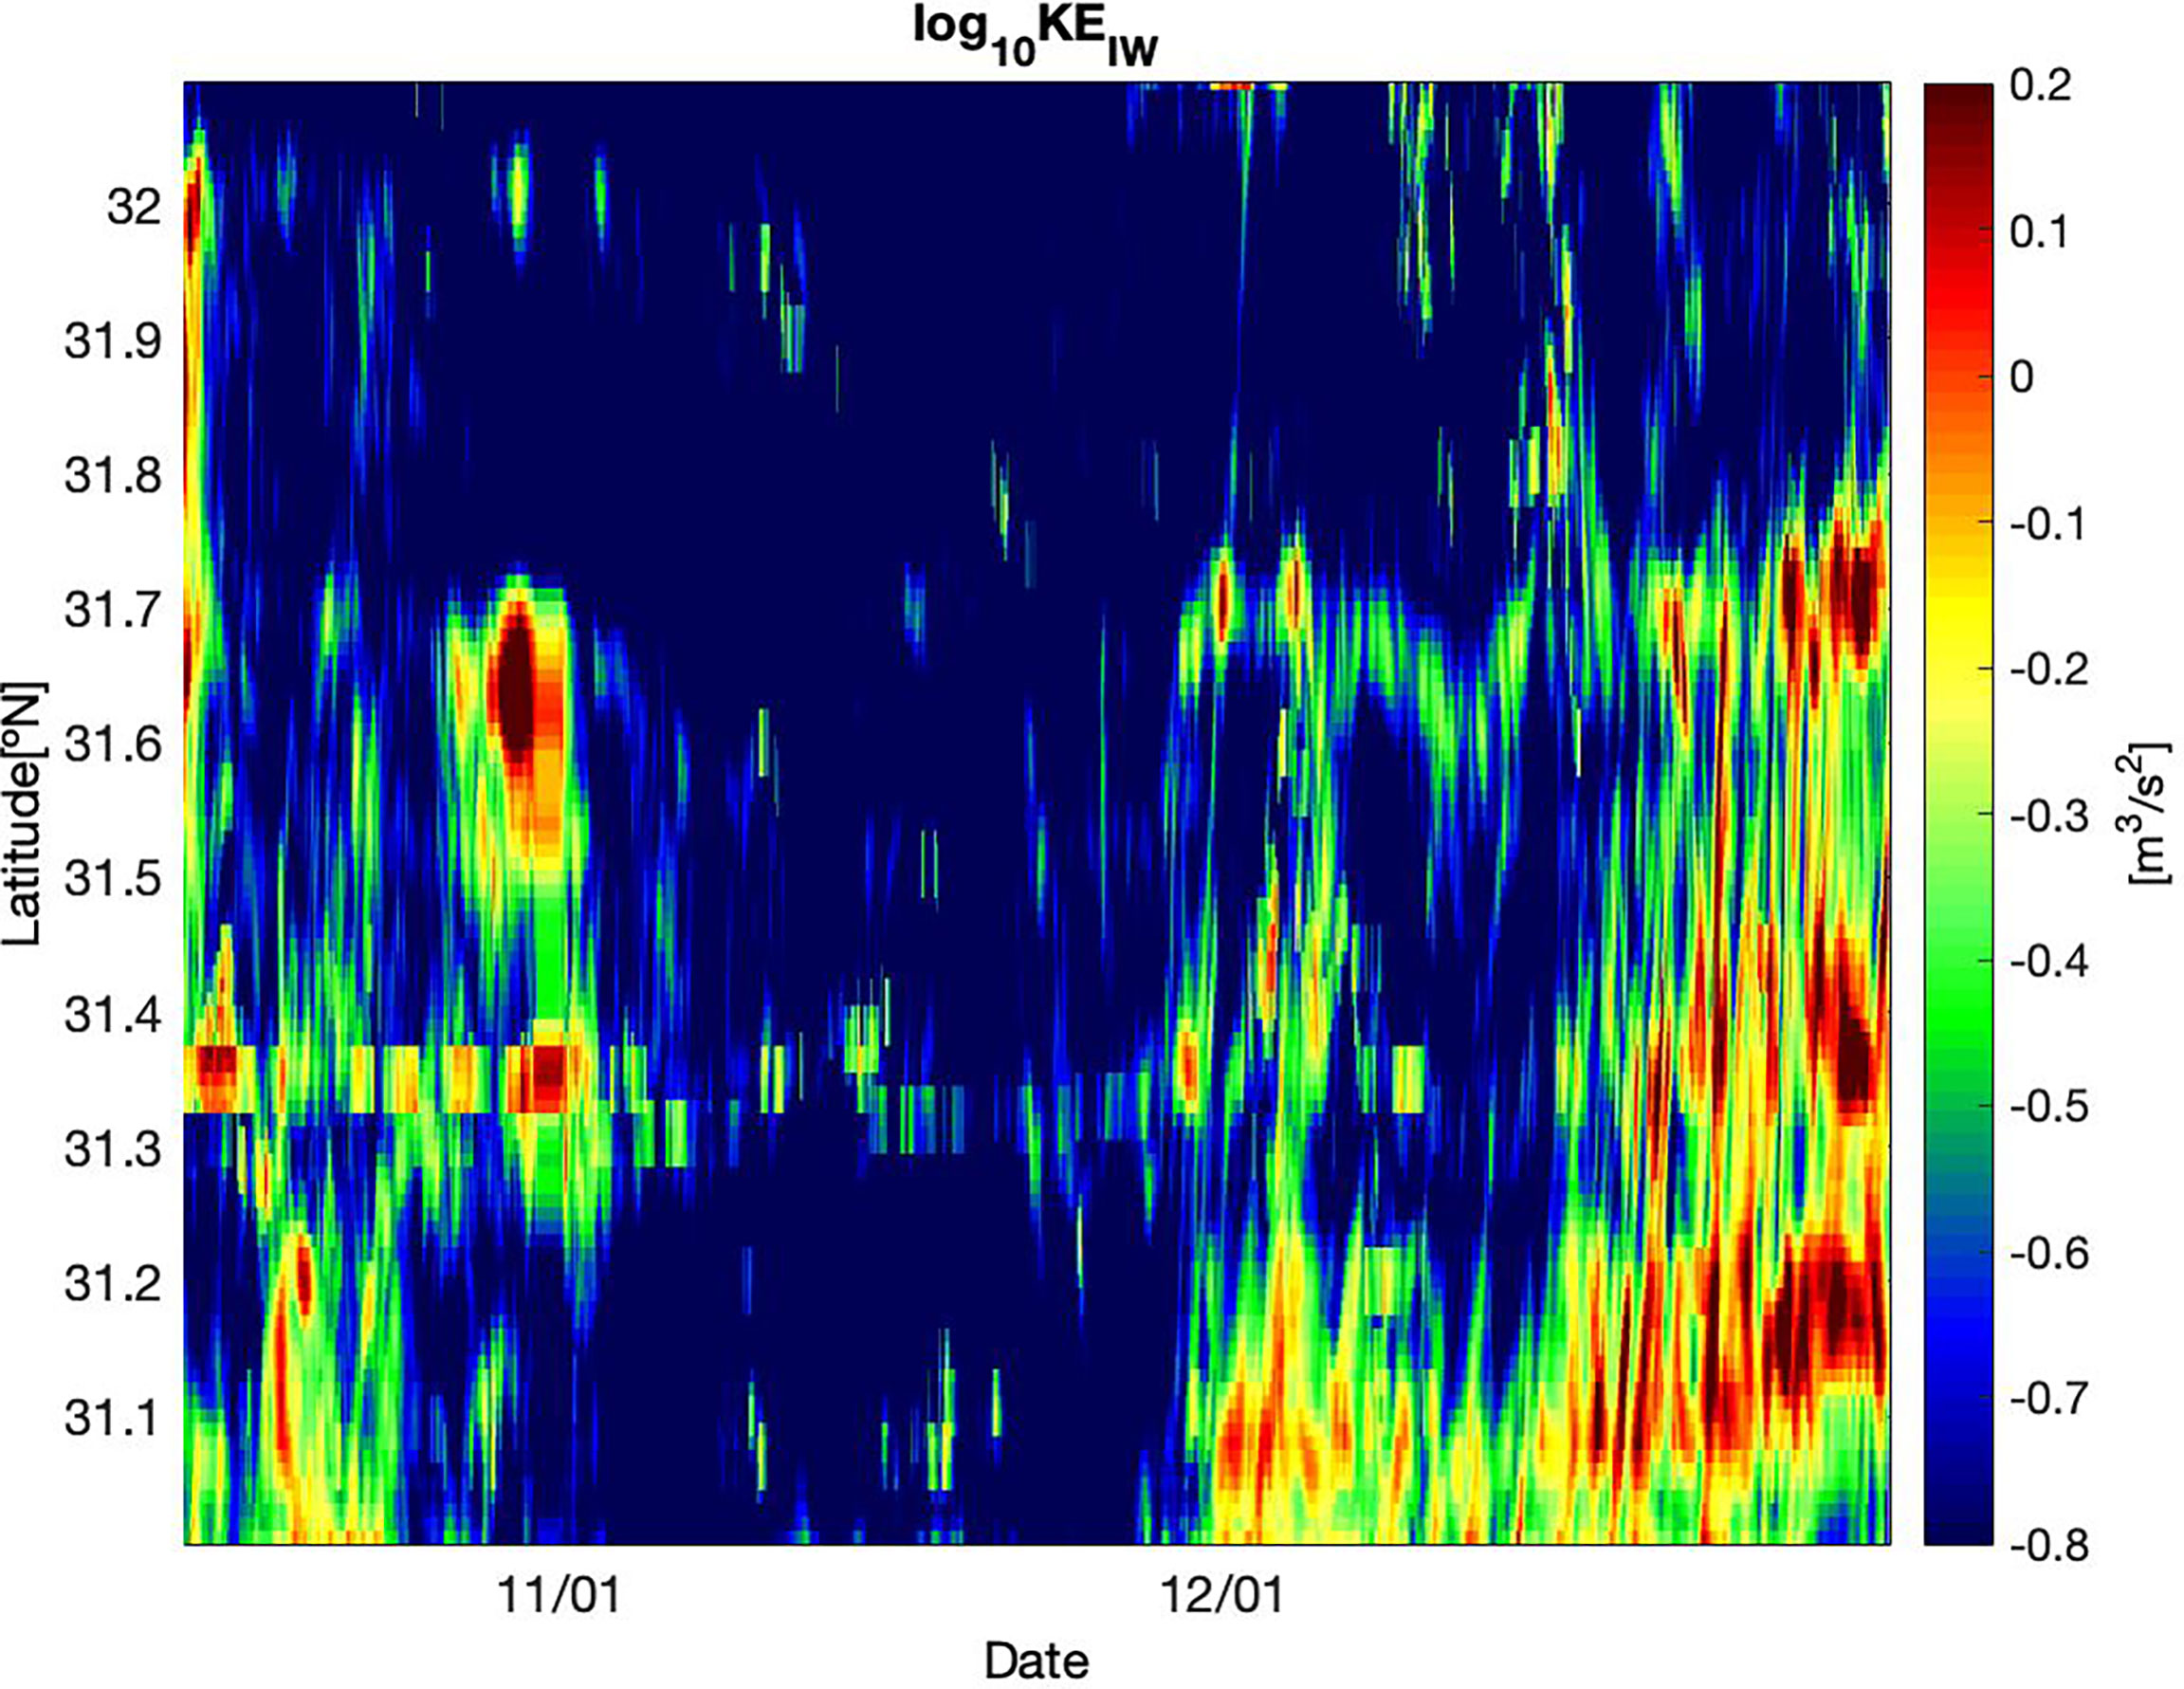
Figure 9 Hovmoeller plot of internal wave kinetic energy integrated over 200 m depth (m3s-2) and averaged zonally over the continental shelf, where depth is less than 200 m depth, as a function of latitude and time.
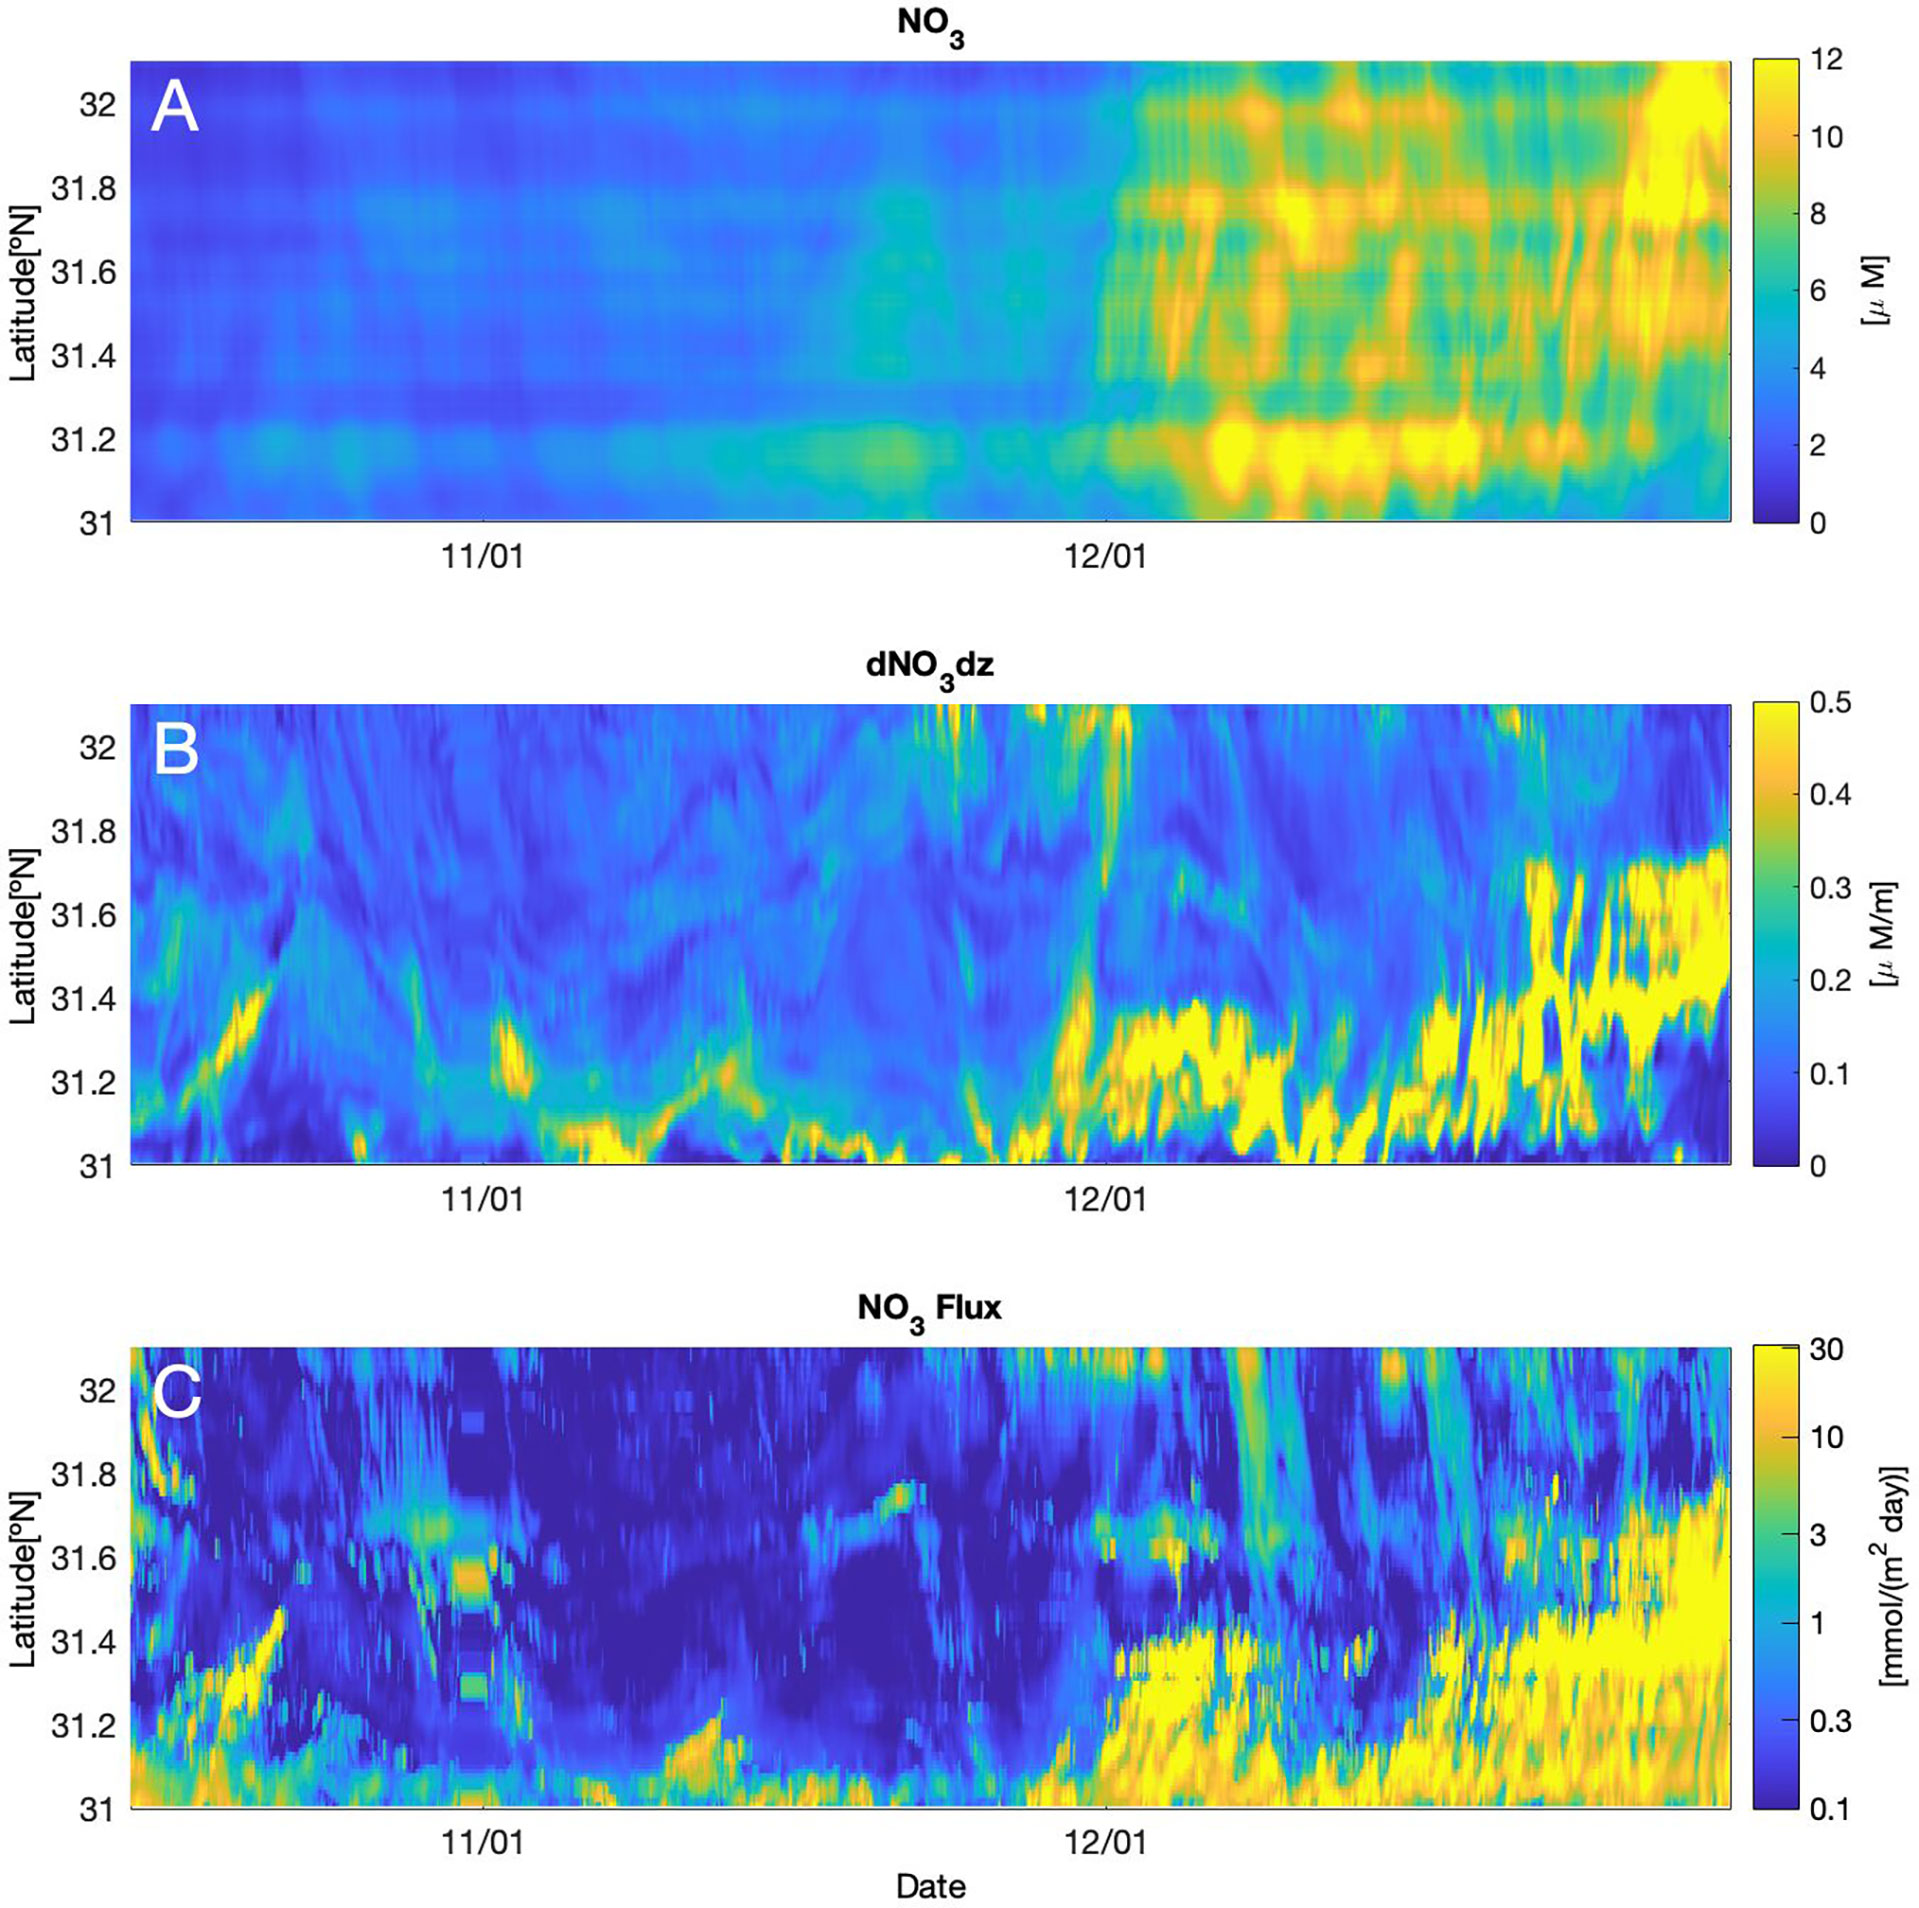
Figure 10 Hovmoeller plot of (A) nitrate concentration (μM), (B) nitrate vertical gradient (μMm-1) and (C) nitrate diffusive flux (mmol m-2day-1) interpolated at 100 m depth and averaged zonally over the continental shelf, where depth is less than 200 m depth, as a function of latitude and time.
The minimum distance between the coast and the model Kuroshio (SSH = 0.2 m) is found to be shortened more frequently in December (Figure 11). While the in-situ observations are conducted during November when the Kuroshio flows relatively close to the coast, the model Kuroshio in November presents an opposite figure by flowing away from the coast. Even though the model distance is very small (~30 km) at the beginning of November, it is limited only for the lower latitude range, presenting larger distances of 140 km in the downstream latitudes. The minimum distance shows gradual decreases from the middle to the end of November. It is in this period when the averaged nitrate concentration over the continental shelf shows a moderate increase (Figure 10A). After this gradual decrease in the minimum distance, it drops abruptly from the upstream to the downstream in the beginning of December, presenting values less than 60 km at latitude 31.4°N and less than 120 km at latitude 32°N. In response to this decrease of the minimum distance in a wider latitude range caused by the approaching Kuroshio to the coast, the nitrate concentration and its diffusive flux increase in the beginning of December in comparison to those in November (Figures 10A, C). In the mid-December, the minimum distance increases again and it is accompanied by a decrease of the nitrate vertical gradient and the nitrate diffusive flux (Figures 10B, C). Yet, in the end of December, the model Kuroshio approaches to the coast once more, reducing the minimum distance that is again accompanied by increases of all these nitrate related variables (Figures 10, 11).
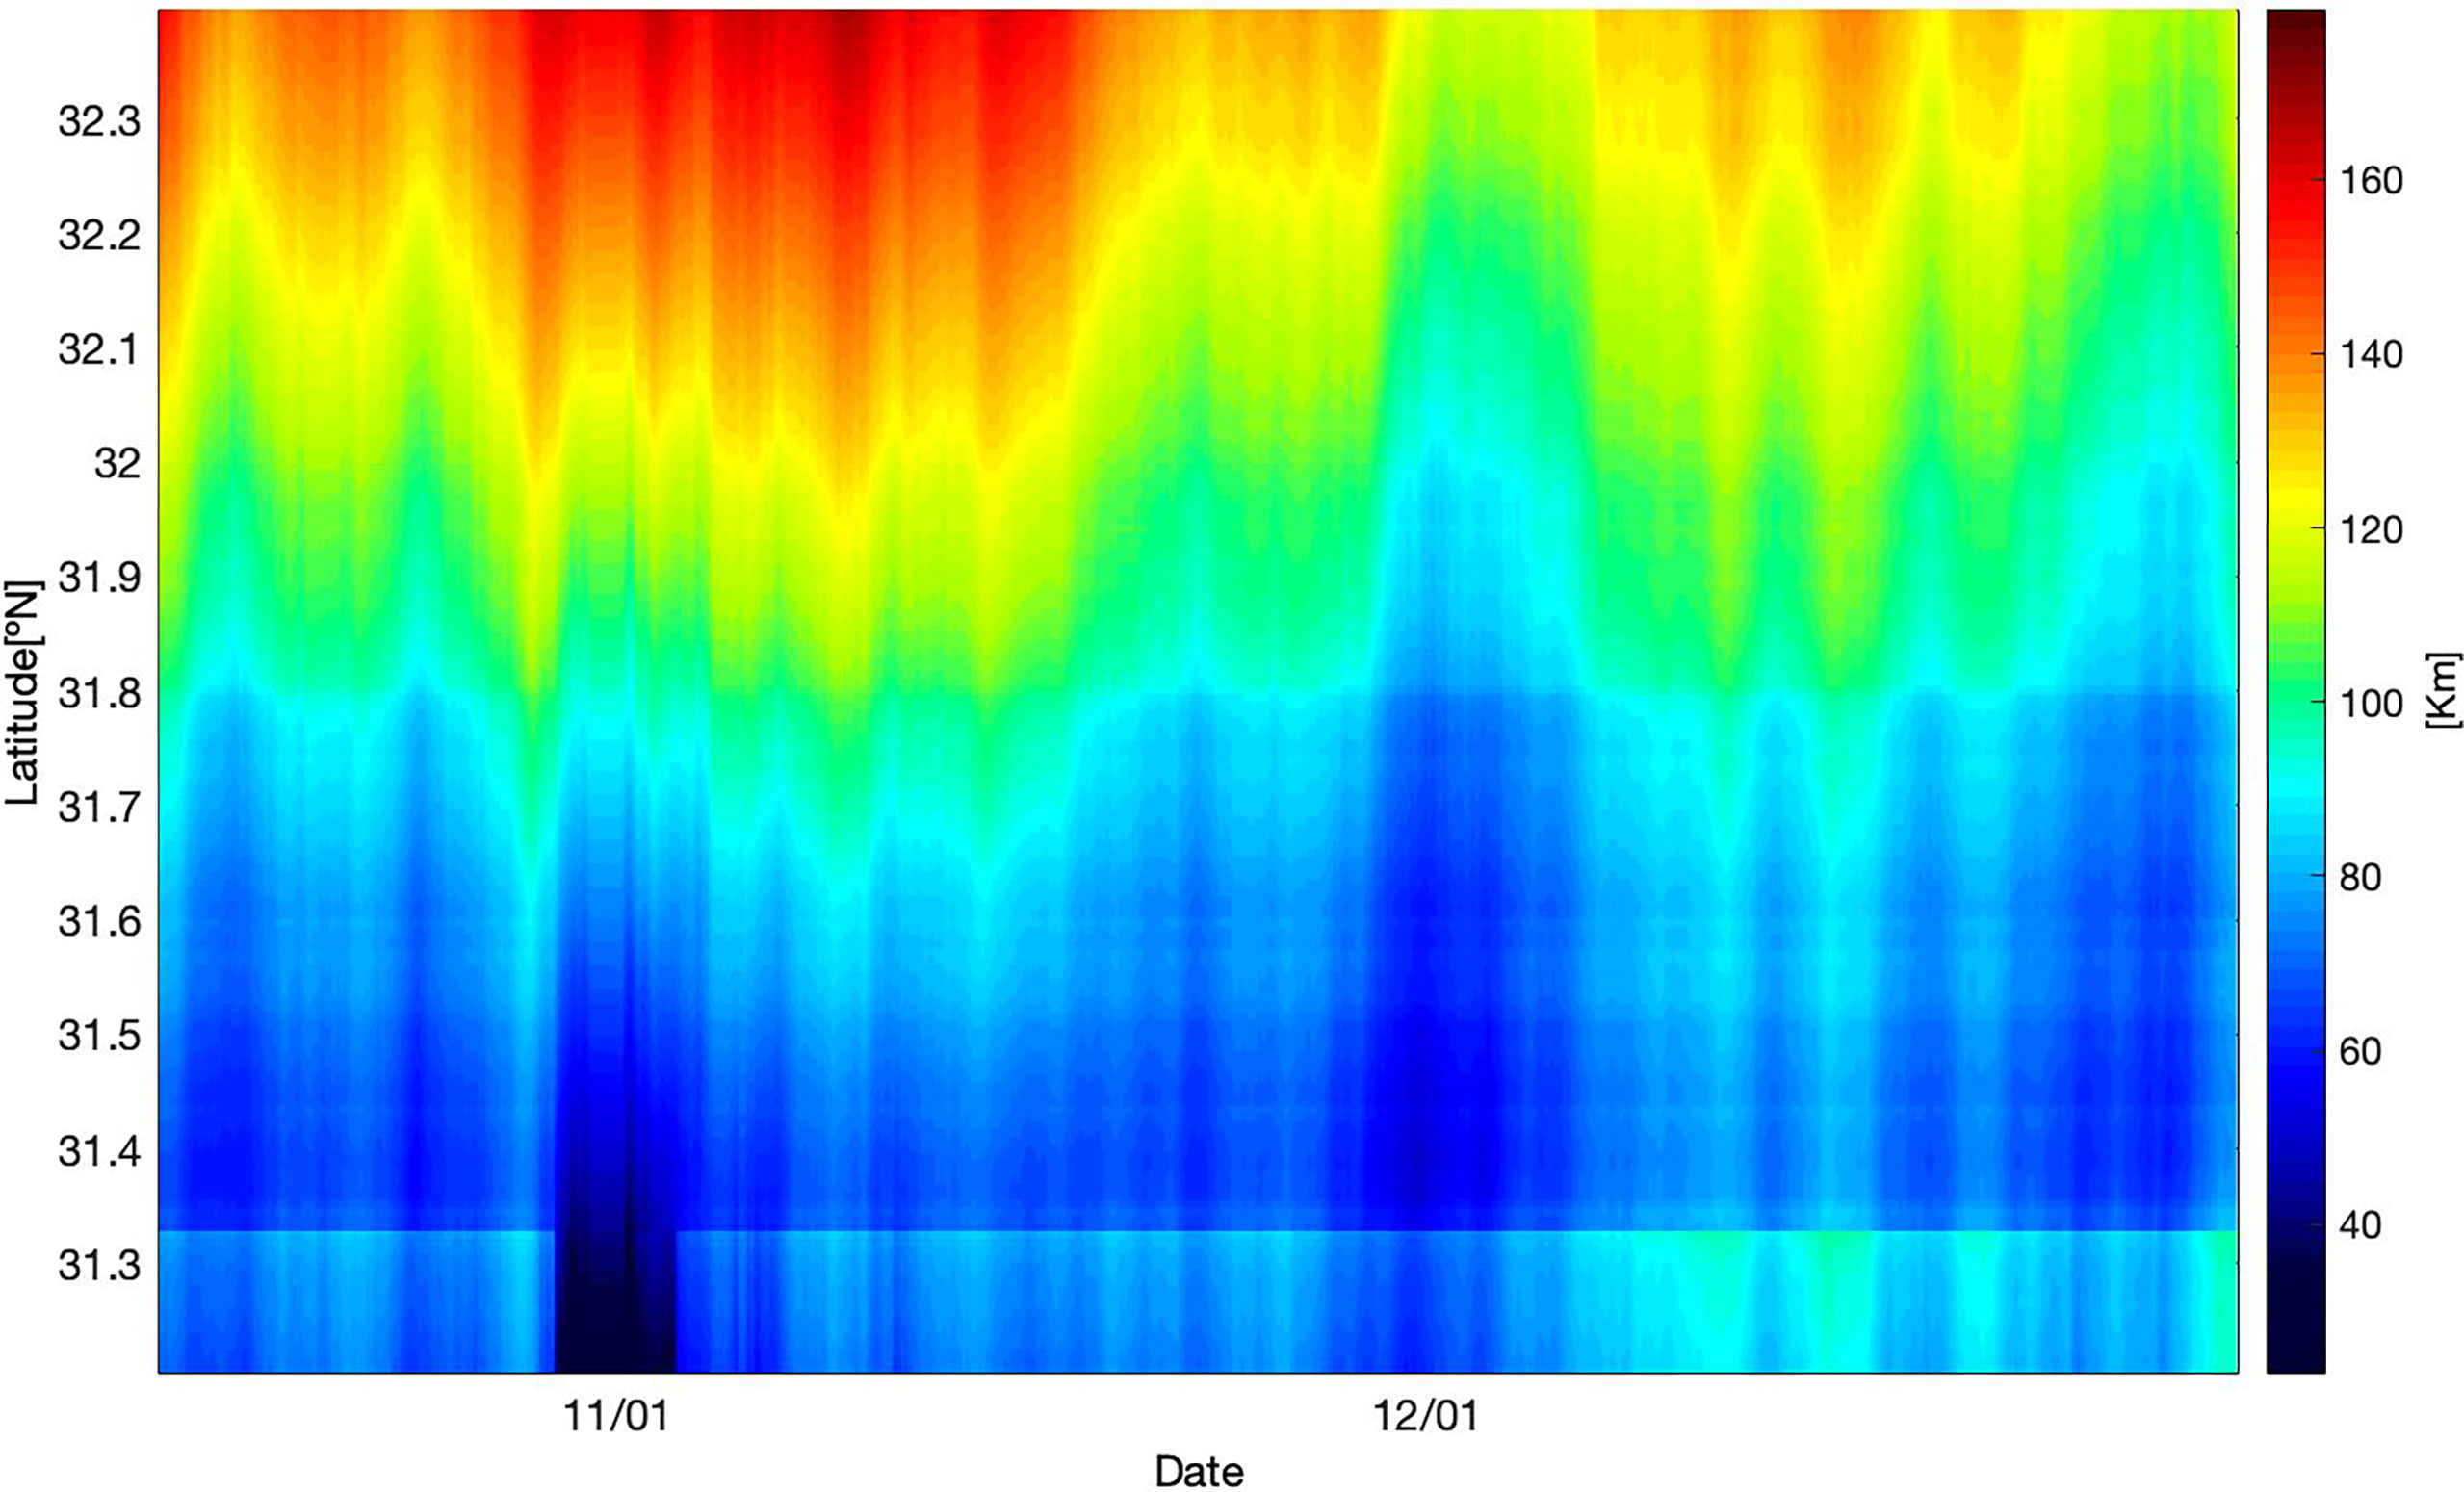
Figure 11 Hovmoeller plot of the minimum distance between the eastern coast of Kyushu and the model Kuroshio axis, defined as the contour of SSH = 0.2 m, as a function of latitude and time.
Interestingly, the IWKE is also inversely proportional to the minimum distance, presenting larger values when shorter distances appear at the end of October, at the beginning of December, and from the middle to the end of December (Figure 9). These results suggest that enhanced diffusive nitrate flux is caused by the approaching Kuroshio to the coast, which leads to an increase in the nitrate concentration, its vertical gradient, and in the IWKE followed by elevated vertical mixing. It is noteworthy that the increase in nitrate concentration cannot be simply attributed to a seasonal mixed layer deepening since the model monthly mean MLDs for both months remain shallower than 100 m depth (Figure 12). As in Figures 2C and 3B, the December MLD is shallower near the coast with a band of relatively deeper MLD on the northwestern side of the model Kuroshio axis (magenta line in Figure 12B). The latter deep MLD band corresponds to the convex downward MLD found in the vertical section of the model December (Figure 3B).
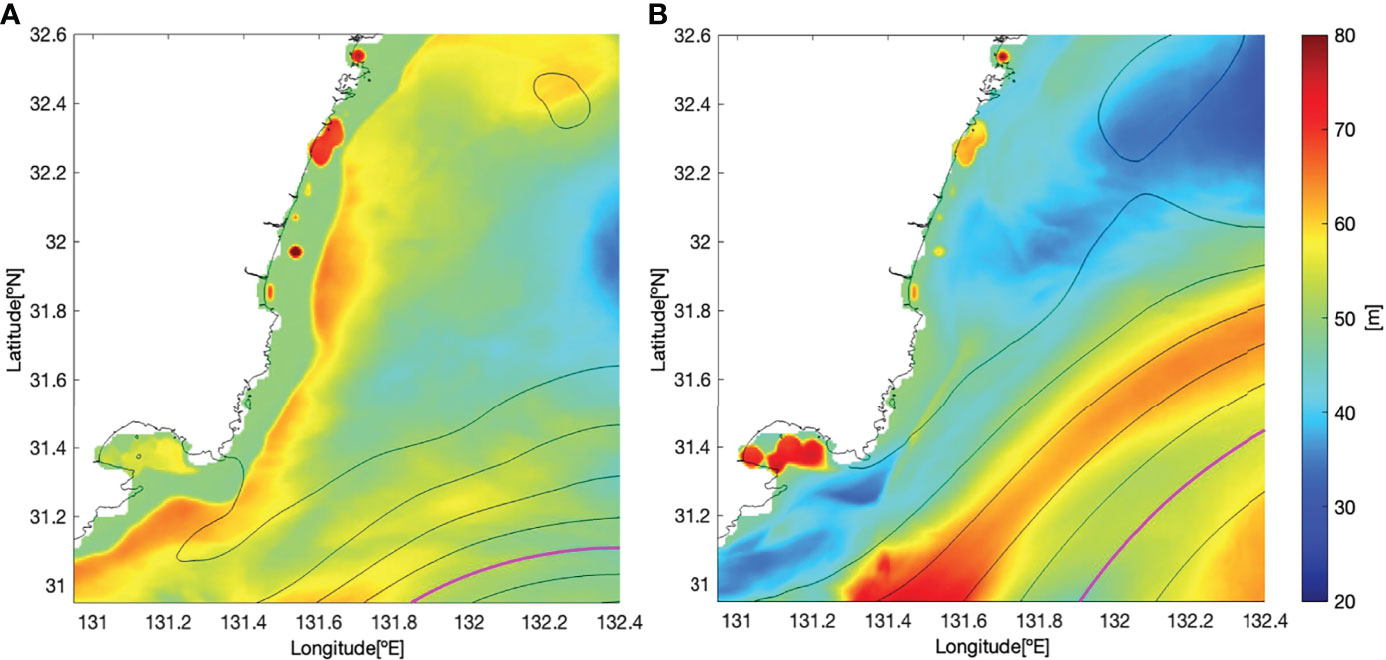
Figure 12 Monthly averaged model mixed layer depth (m), where the density difference is 0.125 kg m-3 from the surface, for (A) November and (B) December. Black contours represent monthly mean SSH and magenta line represents the monthly mean model Kuroshio axis at SSH = 0.2 m.
A number of previous studies have shown that when the Kuroshio bumps into topographic features, strong turbulence and vertical mixing are induced (Nagai et al., 2017; Tsutsumi et al., 2017; Hasegawa, 2019; Nagai et al., 2019; Nagai et al., 2021a). Besides, a recent high-resolution numerical study conducted by Gula et al. (2016) demonstrated that when the Gulf Stream interacts with a topography, it generates negative PV that leads to inertial instability. The results in the present study show that when the model Kuroshio approaches to the coast, in the Hyuganada Sea, it leads to a large nitrate diffusive flux of 1-10 mmol m-2day-1 by flowing over a bump located in the upstream region of the model domain. The most intense nitrate diffusive flux of O(10 mmol m-2day-1) occurs in the vicinity of negative PV water generated on the northwestern slope of the bump. The large flux of O(1 mmol m-2day-1) continues further downstream over 100 km along the Kuroshio in a narrow band of lowered ωmin with high IWKE. Although the resolution of the numerical model in the present study is not fine enough to fully resolve submesoscale instabilities, negative PV would correspond to a small Richardson number. This can be illustrated with the two-dimensional PV after rewriting it with the geostrophic shear as it has been shown in (1). When PV2D is negative, the following condition needs to be satisfied for the geostrophic Richardson number (Thomas et al., 2013; Tandon and Nagai, 2019),
Considering that the vertical component of relative vorticity can only be smaller or equivalent to f in magnitude, the negative PV2D corresponds to a small geostrophic Richardson number Rig< O(1). Accordingly, the negative PV generated in the simulation leads to a large eddy diffusivity by using the interior KPP scheme (Large et al., 1994), which depends on the gradient Richardson number. Although the amplitude of the enhanced diffusivity may not be accurate, it can mimic the enhanced vertical tracer mixing caused by the generation of negative PV.
The disturbances in the geostrophic flows, including internal lee waves and turbulence produced by these currents themselves, e.g., by flowing over a bump, can result in inertial oscillation (Nikurashin and Ferrari, 2011; Wenegrat et al., 2020). Then, the near-inertial internal waves can propagate in the stratified layers above and below. It should be noted that the positive but low PV values, generated over the slope of the bump, can allow internal waves and lower their minimum frequency, ωmin, that may trap the near-inertial internal waves. This can be shown by rewriting the ωmin with the geostrophic Richardson number,
Because of low PV corresponds to a small geostrophic Richardson number (5), the magnitude of the second term of (6) becomes larger with a smaller Rig, which in turn reduces the ωmin. Moreover, lateral shear caused by the flow separation behind the bump can induce relative vorticity with both signs, being the negative relative vorticity on the northwestern slope of the bump able to lower the ωmin as well. Correspondingly, the low PV generation caused by the geostrophic current, the Kuroshio flowing over topographic features, leads to an intense vertical diffusive flux of nitrate not only through the submesoscale instability, but also by confining generated/propagating near-inertial internal waves. These tightly connected mixing mechanisms, associated with low PV, could make the lee sides of topographic obstacles to geostrophic currents as very efficient nutrient injection hotspots.
As it is shown in Figure 8B, relatively large internal wave kinetic energy (IWKE), located in a confined thin layer of the lowered ωmin near the coast, would suggest the presence of trapped near-inertial waves within a region of strong geostrophic lateral and vertical shear (Kunze, 1985; Whitt and Thomas, 2013), which may enhance local mixing (Kunze et al., 1995; Li et al., 2019). The vertical section of the model vertical shear shows large amplitude banded shear structures roughly along the isopycnals in the tilted Kuroshio thermocline, when the model Kuroshio approaches the coast (Figure 6C), supporting the above explanations that the banded shear in the model is caused by near-inertial internal waves (Rainville and Pinkel, 2004; Nagai et al., 2017). To determine the frequencies of these waves in a strong current avoiding the Doppler-shift, passive 3000 Lagrangian particles were released three times into the model Kuroshio every 5 days from December 1st (Supplementary Animation Anime S2). The peaks in the obtained mean Lagrangian frequency spectra of zonal and meridional shear appear near near–inertial frequency, f/2π, suggesting that vertical shear in the model is mostly associated with near-inertial internal waves (Figure 13). However, the peaks appear in a little wide wavenumber range, suggesting that the modulations of the lowest internal wave frequency ωmin are caused by the geostrophic shear. When there is strong anticyclonic background vorticity and/or vertical geostrophic shear, the ωmin can be modified, decreasing the lower-frequency bound for internal waves (Mooers, 1975; Kunze, 1985; Li et al., 2019). Due to this modification, waves with a frequency of ωmin can propagate freely in regions where the ωmin has been lowered further. At the same time, they can not propagate into other regions where the local ωmin is higher than the wave frequencies. Thus, when they are bounded by a higher ωmin wall, these near-inertial internal waves get trapped. The trapped waves could work as mixers, by inducing turbulence (Kunze et al., 1995), resulting in elevated nitrate diffusive flux from subsurface layers to shallow layers along the Kuroshio and increasing the biological production (Nagai et al., 2017; Kobari et al., 2020).
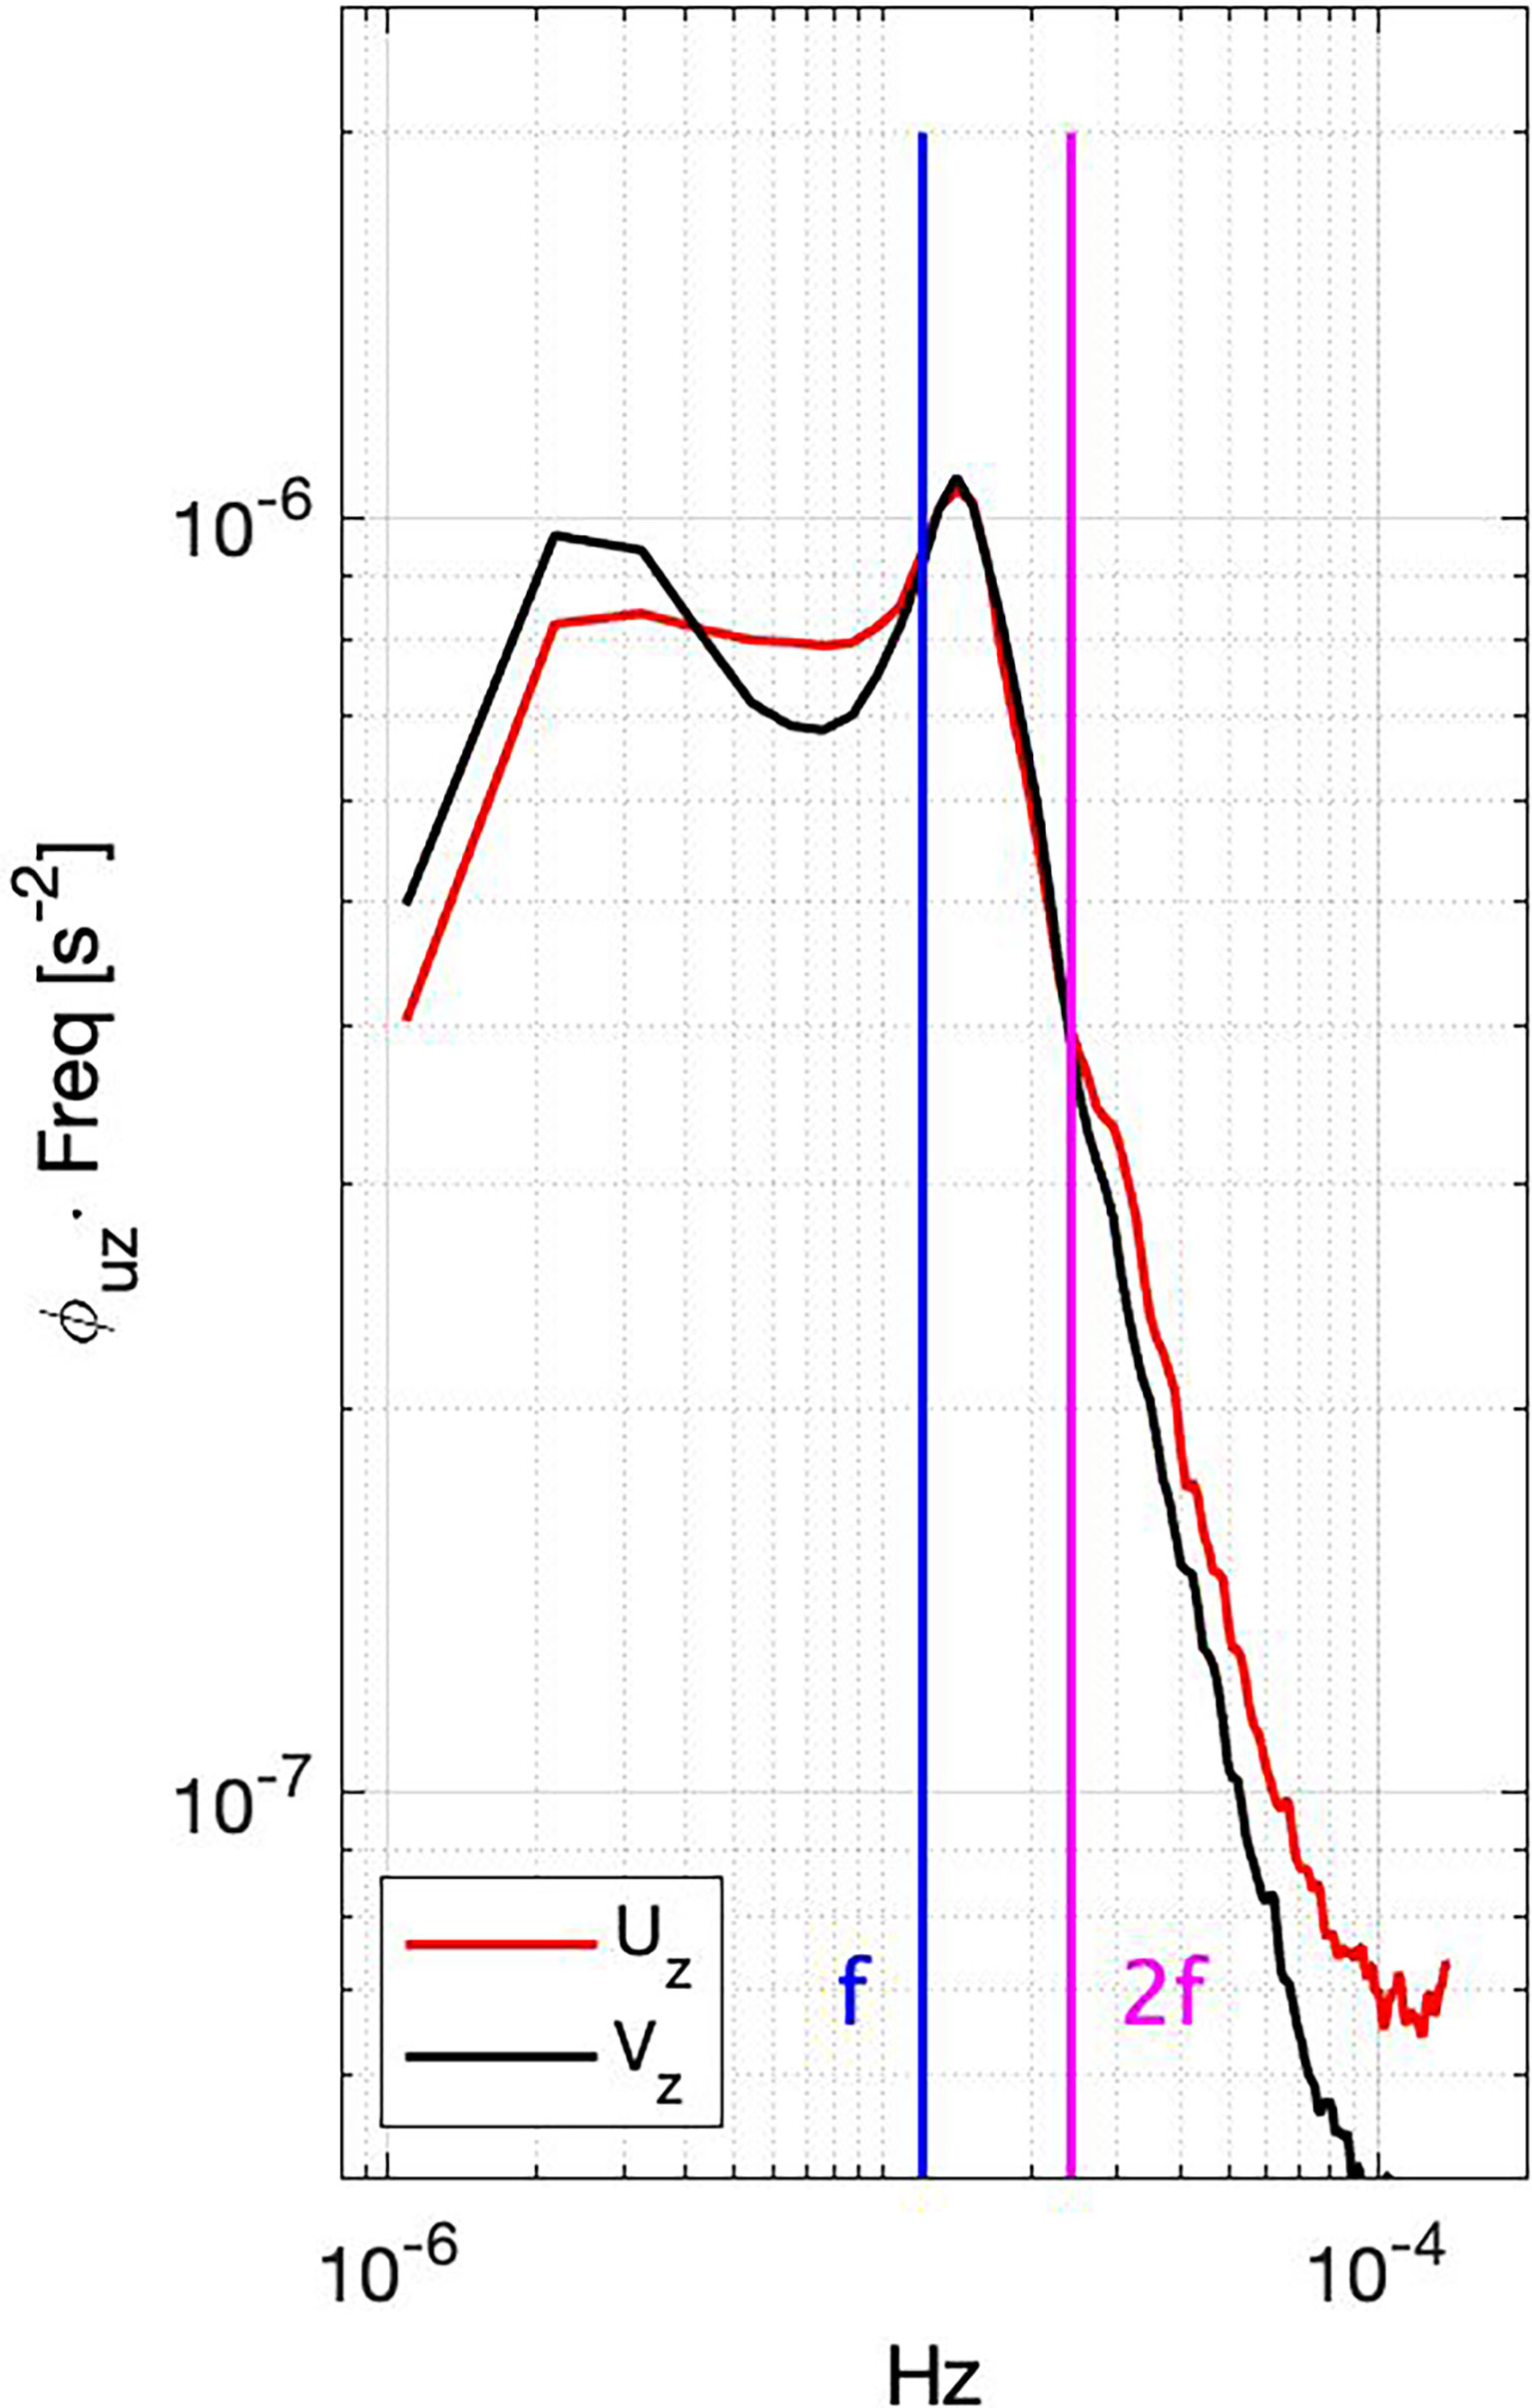
Figure 13 Mean Lagrangian shear spectra for (black) meridional and (red) zonal velocity shear. The vertical lines (blue and magenta) indicate the range between f and 2f, where f is Coriolis frequency. Note that spectra is in variance preserved form (s-2). The 1835 particles out of 9000, with mean speeds more than 0.45 m s-1 and last more than 58 hours in the nested model domain, are chosen to compute the mean spectra.
As shown in the temporal variations over the continental shelf (Figures 9, 10), when the model Kuroshio approaches to the coast in December, the IWKE, the nitrate concentration, and its vertical gradient show increasing trends, accompanied by the intensification of the nitrate diffusive flux to 1-10 mmol m-2day-1. Supplementary Animation Anime S1 illustrates that the Kuroshio approach to the coast during the model December is indeed accompanied by approach of the subsurface nutrient stream core. Therefore, the approaching Kuroshio and its subsurface nutrient stream to the coast provide a very efficient nutrient supply route to the continental shelf, associated with the combination of the onshore nutrient advection, enhanced vertical gradient of nutrient concentrations, and elevated vertical mixing caused by the submesoscale instability and trapped near-inertial internal waves, which are associated with low PV.
On the other hand, it was shown that the model chlorophyll-a was overestimated compared to the observations by threefold on the shore side (Figure 3). This overestimation could be due to the use of a single phytoplankton functional group in the model. As it is explained by Gruber et al. (2006), one of the deficiencies of the modeled chlorophyll-a is its overestimation in the eutrophic nearshore regions. And, since the Kuroshio regions are often dominated by small size plankton communities (Clayton et al., 2014; Endo and Suzuki, 2019), the model carbon to chlorophyll-a ratio is most likely underestimated in the offshore region. Moreover, as nitrate and chlorophyll-a are not conservative parameters, the fast biogeochemical response can easily induce these differences in the chlorophyll-a concentrations. For example, the ecosystem model in the present study may not be able to reproduce the rapid zooplankton grazing on phytoplankton in the oligotrophic environment (Kobari et al., 2020), that can induce the chlorophyll-a overestimation on the shore side. In addition, the model isopycnal of σθ = 25 kg m-3 outcrops on the shore side, accompanied by water of relatively high nitrate concentration (, Figure 2C), whereas in the observation it lies below 50 m depth, keeping the nitrate concentrations near the surface relatively low (Figure 2A). The model MLD on December 20th is roughly 50 m deeper than that of the observations during November 2018. This deeper MLD, caused by more active entrainment and deepening of the MLD during model December than that of the observation in November 2018, could explain the reason of denser water outcropping in the model as well as the large model diffusive nitrate flux within the mixed layer, which is not seen in the observations (Figure 7). Thus, the more active MLD entrainment of denser and nutrient rich water to the surface layers in the model December could also be one of the reasons for the overestimated model chlorophyll-a concentrations.
Although this study is focused on how the submesoscale instability and trapped near-inertial waves influence on the vertical mixing, it should be noted that other processes can also occur simultaneously and have some effects on the mixing. Previous studies reported that the formation and propagation of a small cyclonic eddy in the southern region of Kyushu induce a small meander of the Kuroshio, that may trigger the Kuroshio Large Meander (KLM). It is speculated that the cyclonic eddy advects the subsurface nitrate-rich-water downstream to the trough of the meander, leading to an increase in surface phytoplankton (Lizarbe Barreto et al., 2021), while the southwestward returning flow along the coast can produce strong turbulence above the topographic features. If the cyclonic eddy is present between the Kuroshio and the coast, the nutrient diffusive flux could be even larger since shoaled nutrients at the center of the cyclonic eddy are more susceptible to the surface mixing processes. In this manner, when the cyclonic eddy is present, our results that show the enhanced nutrient flux with a shorter minimum distance between the Kuroshio and the coast would not be applicable. Moreover, Li et al. (2018) showed that the large amplitude nonlinear internal waves generated from the Luzon Strait in South China Sea induce diffusive nitrate flux of 0.635-2.54 mmol m-2day-1, which is in similar order of magnitude of the flux found in this study. Recent studies have also pointed out that the turbulent mixing in the Kuroshio over the topographic features is more consistent with the shear instability caused by large amplitude high vertical modes nonlinear internal waves of wavelengths ~100 m in proximity to the seamounts (Tsutsumi et al., 2017; Takahashi et al., 2022). These large amplitude nonlinear internal waves can neither be fully resolved nor well parameterized in the present numerical model, suggesting that the model diffusive flux could be most likely underestimated. Our analyses in the present study are limited only to the simulation period, in which the Kuroshio flows close to or away from the coast without a propagating cyclonic eddy. Further, the model resolution and the KPP parameterization do not allow highly nonlinear internal wave induced mixing processes. In this regard, to clarify the robustness of the results in the present study, analyses of the influences of the Kuroshio on the continental shelf with the presence of the small cyclonic meander and the effects of highly nonlinear internal wave phenomena should be addressed by using models with higher resolutions and proper internal wave mixing parameterizations as future investigations.
In this study, a numerical simulation was conducted to reproduce previously observed nitrate supply processes through vertical mixing, which are considered to be caused by trapped near-inertial internal waves within the Kuroshio in the Hyuganada Sea, southeast of Kyushu. Our focus is to elucidate how far the elevated nutrient supply persists downstream along the Kuroshio, and to understand how the elevated nutrient flux is related to the model Kuroshio path transitions.
Based on the simulation results, it is found that when the model Kuroshio approaches to the coast of Kyushu, it encounters a shallow bump at the southwestern region of the Hyuganada Sea, generating low and negative PV values over the slope. The negative PV, which corresponds to a low Richardson number, leads to an intense model diffusive nitrate flux. On top of that, the topography-induced disturbances seem to produce near-inertial waves, which get trapped in a streak of lowered lowest internal wave frequency ωmin due to the strong anticyclonic vorticity field and the large vertical shear created in the lee side of the bump. These trapped near-inertial internal waves enhance the eddy diffusivity within this streak of lowered ωmin. Simultaneously, during this approach, the Kuroshio brings a large amount of nitrate in its subsurface layer, increasing the nitrate vertical gradients, thus, leading to a higher potential for the diffusive flux. Ultimately, the enhanced diffusivity, caused by the negative PV and the trapped near-inertial internal waves, elevates the nitrate diffusive flux from subsurface to shallow layers, providing a very efficient route to supply subsurface nutrients from the upper core of the Kuroshio nutrient stream over the continental shelf. While the intense nitrate diffusive flux of O(10 mmol m-2 day-1) is limited only near the region of negative PV in the upstream region of the model domain, the large diffusive flux of O(1 mmol m-2 day-1) extends downstream over ~ 100 km along the Kuroshio.
Although the Kuroshio Current has been well-known for being nutrient poor, the high nutrient concentration located in its subsurface layers can be the reason for its major biodiversity. By elevating the nutrient diffusive flux associated with submesoscale instabilities and the trapping of generated/propagating near-inertial internal waves in the vicinity of the topographic features, bringing up these subsurface nutrients to surface layers is considered to be a very important mechanism which consists of co-working multiscale mixing processes. Along its path, the Kuroshio is known to flow through a great deal of topographic features, such as I-Lan Ridge east of Taiwan, seamounts in the Tokara Strait, and the islands in the Izu-Ridge, where several recent studies have reported elevated nutrient supply. This study showed that the Kuroshio approaching to the southern coast of Japan, in the Hyuganada Sea, can also enhance the nutrient supply, promoting primary production, hence, increasing the biological production along the coast (Supplementary Animation Anime S3).
The observation data in the manuscript is available at https://doi.pangaea.de/10.1594/PANGAEA.902182. The ROMS code is available from https://www.myroms.org/. The original contributions presented in the study are included in the article/Supplementary Material. Further inquiries can be directed to the corresponding author.
GSDG analyzed model results, created the figures, and edited the manuscript. TN run the numerical models, and edited the manuscript. All authors contributed to the article and approved the submitted version.
SKED (JPMXD0511102330), OMIX (KAKENHI16H01590 and 18H04914) and KAKENHI (19H01965 and 20K20634).
The authors declare that the research was conducted in the absence of any commercial or financial relationships that could be construed as a potential conflict of interest.
All claims expressed in this article are solely those of the authors and do not necessarily represent those of their affiliated organizations, or those of the publisher, the editors and the reviewers. Any product that may be evaluated in this article, or claim that may be made by its manufacturer, is not guaranteed or endorsed by the publisher.
GSDG thanks MEXT and JASSO for their financial support for studying in Japan. GSDG and TN thank Prof. Nakamura, Prof. Nishina, Prof. Kobari from Kagoshima University, Capt. Uchiyama and crew members of R.T.V. Kagoshima-Maru for the observations and ship operations, and Prof. Yoshie from Ehime University for the nutrient analysis. GSDG and TN thank Perro Guardián del cielo.
The Supplementary Material for this article can be found online at: https://www.frontiersin.org/articles/10.3389/fmars.2022.842155/full#supplementary-material
Chang M.-H., Jheng S.-Y., Lien R.-C. (2016). Trains of Large Kelvin-Helmholtz Billows Observed in the Kuroshio Above a Seamount. Geophys. Res. Lett. 43, 8654–8661. doi: 10.1002/2016GL069462
Clayton S., Nagai T., Follows M. J. (2014). Fine Scale Phytoplankton Community Structure Across the Kuroshio Front. J. Plankton. Res. 36, 1017–1030. doi: 10.1093/plankt/fbu020
da Silva A., Young A. C., Levitus S. (1994). “Atlas of Surface Marine Data 1994,” in Algorithms and Procedures Tech. Rep. 6 (Florida, USA: Department of Commerce, NOAA, NESDIS).
Durán Gómez G. S., Nagai T., Yokawa K. (2020). Mesoscale Warm-Core Eddies Drive Interannual Modulations of Swordfish Catch in the Kuroshio Extension System. Front. Mar. Sci 7, 680. doi: 10.3389/fmars.2020.00680
Endo H., Suzuki K. (2019). “Spatial Variations in Community Structure of Haptophytes Across the Kuroshio Front in the Tokara Strait,” in Kuroshio Current: Physical, Biogeochemical, and Ecosystem Dynamics. Eds. Nagai T., Saito H., Suzuki K., Takahashi M. (Washington, D.C., USA:AGU-Wiley).
Gruber N., Frenzel H., Doney S. C., Marchesiello P., McWilliams J. C., Moisan J. R., et al. (2006). Eddy-Resolving Simulation of Plankton Ecosystem Dynamics in the California Current System. Deep. Sea. Res. Part I: Oceanog. Res. Pap. 53, 1483–1516. doi: 10.1016/j.dsr.2006.06.005
Gula J., Molemaker M. J., McWilliams J. C. (2016). Topographic Generation of Submesoscale Centrifugal Instability and Energy Dissipation. Nat. Commun. 7, 1–7. doi: 10.1038/ncomms12811
Guo X., Zhu X.-H., Long Y., Huang D. (2013). Spatial Variations in the Kuroshio Nutrient Transport From the East China Sea to South of Japan. Biogeosciences 10, 6403–6417. doi: 10.5194/bg-10-6403-2013
Guo X., Zhu X.-H., Wu Q.-S., Huang D. (2012). The Kuroshio Nutrient Stream and its Temporal Variation in the East China Sea. J. Geophys. Res.: Ocean. 117, C01026. doi: 10.1029/2011JC007292
Hasegawa D. (2019). “Island Mass Effect. Kuroshio Current: Physical, Biogeochemical, and Ecosystem Dynamics,” in Kuroshio Current: Physical, Biogeochemical, and Ecosystem Dynamics. Eds. Nagai T., Saito H., Suzuki K., Takahashi M., Washington, D.C., USA: AGU-Wiley. 163–174.
Hasegawa D., Yamazaki H., Lueck R., Seuront L. (2004). How Islands Stir and Fertilize the Upper Ocean. Geophys. Res. Lett. 31, 16303. doi: 10.1029/2004GL020143
Kobari T., Honma T., Hasegawa D., Yoshie N., Tsutsumi E., Matsuno T., et al. (2020). Phytoplankton Growth and Consumption by Microzooplankton Stimulated by Turbulent Nitrate Flux Suggest Rapid Trophic Transfer in the Oligotrophic Kuroshio. Biogeosciences 17, 2441–2452. doi: 10.5194/bg-17-2441-2020
Komatsu K., Hiroe Y. (2019). “Structure and Impact of the Kuroshio Nutrient Stream,” in Kuroshio Current: Physical, Biogeochemical, and Ecosystem Dynamics. Eds. Nagai T., Saito H., Suzuki K., Takahashi M. (Washington, D.C., USA: AGU-Wiley). doi: 10.1002/9781119428428.ch5
Kunze E. (1985). Near-Inertial Wave Propagation in Geostrophic Shear. J. Phys. Oceanog. 15, 544–565. doi: 10.1175/1520-0485(1985)015<0544:NIWPIG>2.0.CO;2
Kunze E., Schmitt R. W., Toole J. M. (1995). The Energy Balance in a Warm-Core Ring’s Near-Inertial Critical Layer. J. Phys. Oceanog. 25, 942–957. doi: 10.1175/1520-0485(1995)025<0942:TEBIAW>2.0.CO;2
Large W. G., McWilliams J. C., Doney S. C. (1994). Oceanic Vertical Mixing: A Review and a Model With a Nonlocal Boundary Layer Parameterization. Rev. Geophys. 32, 363–403. doi: 10.1029/94RG01872
Levitus S. (1982). Climatological Atlas of the World Ocean Vol. 13 (Florida, USA:Algorithms and procedures NOAA/ERL GFDL Professional Paper). NTIS PB83-184093.
Li D., Chou W.-C., Shih Y.-Y., Chen G.-Y., Chang Y., Chow C. H., et al. (2018). Elevated Particulate Organic Carbon Export Flux Induced by Internal Waves in the Oligotrophic Northern South China Sea. Sci. Rep. 8, 2045–2322. doi: 10.1038/s41598-018-20184-9
Li Q., Mao X., Huthnance J., Cai S., Kelly S. (2019). On Internal Waves Propagating Across a Geostrophic Front. J. Phys. Oceanog. 49, 1229–1248. doi: 10.1175/JPO-D-18-0056.1
Lizarbe Barreto D. A., Chevarria Saravia R., Nagai T., Hirata T. (2021). Phytoplankton Increase Along the Kuroshio Due to the Large Meander. Front. Mar. Sci. 8. doi: 10.3389/fmars.2021.677632
Molemaker M. J., McWilliams J. C., Dewar W. K. (2015). Submesoscale Instability and Generation of Mesoscale Anticyclones Near a Separation of the California Undercurrent. J. Phys. Oceanog. 45, 613–629. doi: 10.1175/JPO-D-13-0225.1
Mooers C. N. (1975). Several Effects of a Baroclinic Current on the Cross-Stream Propagation of Inertial-Internal Waves. Geophys. Astroph. Fluid. Dynam. 6, 245–275. doi: 10.1080/03091927509365797
Nagai T., Clayton S. (2017). Nutrient Interleaving Below the Mixed Layer of the Kuroshio Extension Front. Ocean. Dynam. 67, 1027–1046. doi: 10.1007/s10236-017-1070-3
Nagai T., Durán Gómez G. S., Otero D. A., Mori Y., Yoshie N., Ohgi K., et al. (2019). How the Kuroshio Current Delivers Nutrients to Sunlit Layers on the Continental Shelves With Aid of Near-Inertial Waves and Turbulence. Geophys. Res. Lett. 46, 6726–6735. doi: 10.1029/2019GL082680
Nagai T., Hasegawa D., Tanaka T., Nakamura H., Tsutsumi E., Inoue R., et al. (2017). First Evidence of Coherent Bands of Strong Turbulent Layers Associated With High-Wavenumber Internal-Wave Shear in the Upstream Kuroshio. Sci. Rep. 7, 1–14. doi: 10.1038/s41598-017-15167-1
Nagai T., Hasegawa D., Tsutsumi E., Nakamura H., Nishina A., Senjyu T., et al. (2021). The Kuroshio Flowing Over Seamounts and Associated Submesoscale Flows Drive 100-km-Wide 100-1000-Fold Enhancement of Turbulence, Commun. Earth Environ. 2, 170. doi: 10.1038/s43247-021-00230-7
Nagai T., Rosales Quintana G. M., Durán Gómez G. S., Hashihama F., Komatsu K. (2021b). Elevated Turbulent and Double-Diffusive Nutrient Flux in the Kuroshio Over the Izu Ridge and in the Kuroshio Extension. J Oceanog, 77(1), 55–74. doi: 10.1007/s10872-020-00582-2
Nagai T., Tandon A., Kunze E., Mahadevan A. (2015). Spontaneous Generation of Near-Inertial Waves by the Kuroshio Front. J. Phys. Oceanog. 45, 2381–2406. doi: 10.1175/JPO-D-14-0086.1
Nikurashin M., Ferrari R. (2011). Global Energy Conversion Rate From Geostrophic Flows Into Internal Lee Waves in the Deep Ocean. Geophys. Res. Lett. 38, L08610. doi: 10.1029/2011GL046576
Oey L.-Y., Wang J., Lee M.-A. (2018). Fish Catch is Related to the Fluctuations of a Western Boundary Current. J. Phys. Oceanog. 48, 705–721. doi: 10.1175/JPO-D-17-0041.1
Palter J. B., Lozier M. S. (2008). On the Source of Gulf Stream Nutrients. J Geophys Res. 113, C06018. doi: 10.1029/2007JC004611
Palter J. B., Lozier M. S., Sarmiento J. L., Williams R. G. (2011). The Supply of Excess Phosphate Across the Gulf Stream and the Maintenance of Subtropical Nitrogen Fixation. Glob. Biogeochem. Cycles 25, GB4007. doi: 10.1029/2010GB003955
Pelegrí J. L., Csanady G. T. (1991). Nutrient Transport and Mixing in the Gulf Stream. J. Geophys. Res. 96, 2577–2583. doi: 10.1029/90JC02535
Pelegrí J., Csanady G., Martins A. (1996). The North Atlantic Nutrient Stream. J. Oceanog. 52, 275–299. doi: 10.1007/BF02235924
Rainville L., Pinkel R. (2004). Observations of Energetic High-Wavenumber Internal Waves in the Kuroshio. J. Phys. Oceanog. 34, 1495–1505. doi: 10.1175/1520-0485(2004)034<1495:OOEHIW>2.0.CO;2
Saito H. (2019). “The Kuroshio: Its Recognition, Scientific Activities and Emerging Issues,” in Kuroshio Current: Physical, Biogeochemical, and Ecosystem Dynamics. Eds. Nagai T., Saito H., Suzuki K., Takahashi M. (Washington, D.C., USA: AGU-Wiley).
Shchepetkin A. F., McWilliams J. C. (2005). The Regional Oceanic Modeling System (ROMS): A Split-Explicit, Free-Surface, Topography-Following-Coordinate Oceanic Model. Ocean. Model. 9, 347–404. doi: 10.1016/j.ocemod.2004.08.002
Smagorinsky J. (1993). “Some Historical Remarks on the Use of non-Linear Viscosities,” in Large Eddy Simulation of Complex Engineering and Geophysical Flows (Cambridge, UK: Cambridge University Press).
Takahashi A., Lien R.-C., Kunze E., Nakamura H., Inoue R., Tsutsumi E. (2022). “Energetic turbulence and nonlinear internal waves in Tokara Strait,” in Presented at 2022 Ocean Sci. Meet., Virtual, Feb. 24 - March 4, Abstract, in Session PS11-01-03 Hawaii, USA.
Tanaka T., Hasegawa D., Yasuda I., Tsuji H., Fujio S., Goto Y., et al. (2019). Enhanced Vertical Turbulent Nitrate Flux in the Kuroshio Across the Izu Ridge. J. Oceanog. 75, 195–203. doi: 10.1007/s10872-018-0500-2
Tandon A., Nagai T. (2019). “Mixing Associated With Submesoscale Processes,” in Encyclopedia of Ocean Sciences, 3rd ed. Eds. Cochran H. K., Bokuniewicz H. J., Yger P. L. (Cambridge, Massachusetts, USA:Elsevier).
Thomas L. N., Taylor J. R., Ferrari R., Joyce T. M. (2013). Symmetric Instability in the Gulf Stream. Deep-Sea. Res. II 91, 96–110. doi: 10.1016/j.dsr2.2013.02.025
Tsutsumi E., Matsuno T., Lien R.-C., Nakamura H., Senjyu T., Guo X. (2017). Turbulent Mixing Within the Kuroshio in the Tokara Strait. J. Geophys. Res.: Ocean. 122, 7082–7094. doi: 10.1002/2017JC013049
Wenegrat J. O., Thomas L. N., Sundermeyer M. A., Taylor J. R., D’Asaro E. A., Klymak J. M., et al. (2020). Enhanced Mixing Across the Gyre Boundary at the Gulf Stream Front. Proc. Natl. Acad. Sci. 117, 17607–17614. doi: 10.1073/pnas.2005558117
Whitt D. B. (2019). “On the Role of the Gulf Stream in the Changing Atlantic Nutrient Circulation During the 21st Century,” in Kuroshio Current: Physical, Biogeochemical, and Ecosystem Dynamics. Eds. Nagai T., Saito H., Suzuki K., Takahashi M. (Washington, D.C., USA: AGU-Wiley).
Whitt D. B., Thomas L. N. (2013). Near-Inertial Waves in Strongly Baroclinic Currents. J. Phys. Oceanog. 43, 706–725. doi: 10.1175/JPO-D-12-0132.1
Keywords: Kuroshio, Hyuganada Sea, ROMS, continental shelf, turbulence, nutrient supply
Citation: Durán Gómez GS and Nagai T (2022) Elevated Nutrient Supply Caused by the Approaching Kuroshio to the Southern Coast of Japan. Front. Mar. Sci. 9:842155. doi: 10.3389/fmars.2022.842155
Received: 23 December 2021; Accepted: 28 March 2022;
Published: 02 May 2022.
Edited by:
Chin-Chang Hung, National Sun Yat-sen University, TaiwanReviewed by:
Terry Whitledge, Retired, Fairbanks, United StatesCopyright © 2022 Durán Gómez and Nagai. This is an open-access article distributed under the terms of the Creative Commons Attribution License (CC BY). The use, distribution or reproduction in other forums is permitted, provided the original author(s) and the copyright owner(s) are credited and that the original publication in this journal is cited, in accordance with accepted academic practice. No use, distribution or reproduction is permitted which does not comply with these terms.
*Correspondence: Gloria Silvana Durán Gómez, c2lsdmFuYWRnMjBAaG90bWFpbC5jb20=
Disclaimer: All claims expressed in this article are solely those of the authors and do not necessarily represent those of their affiliated organizations, or those of the publisher, the editors and the reviewers. Any product that may be evaluated in this article or claim that may be made by its manufacturer is not guaranteed or endorsed by the publisher.
Research integrity at Frontiers
Learn more about the work of our research integrity team to safeguard the quality of each article we publish.