 Emma L. Ausen
 Marianne Marcoux1,2
 David G. Barber
94% of researchers rate our articles as excellent or good
Learn more about the work of our research integrity team to safeguard the quality of each article we publish.
Find out more
ORIGINAL RESEARCH article
Front. Mar. Sci., 03 August 2022
Sec. Marine Megafauna
Volume 9 - 2022 | https://doi.org/10.3389/fmars.2022.837425
As interest in tourism and conservation grows worldwide, whale-watching has become a popular means of educating the public about wildlife conservation. The short-term impact of ecotourism industries on observed species has been widely studied with findings that indicate responses are most often behavior alterations or avoidance. Close vessel interactions with beluga whales (Delphinapterus leucas) are a major draw for whale-watching ecotourism in Churchill, Manitoba, Canada. As the Churchill River estuary and surrounding waters are assessed for a Marine Protected Area, information on the response of belugas to vessels are needed to inform management. To assess this, an oblique time-lapse camera system with a 5-minute photo interval was set up overlooking a section of the Churchill River estuary that is shared by belugas and tourist vessels. Measurements calculated from photos were used to compare the distance between belugas and kayaks, paddleboards, motorboats, and Zodiac whale-watching vessels. These distances were compared to an expected distribution generated from locations of belugas in photos without the presence of vessels. We found evidence that belugas are attracted to kayaks, avoid paddleboards, and are neutral regarding motorboats and Zodiacs. This is the first study to quantify the behavioral response of cetaceans to tourist vessels using a camera system and a distance-based analysis. Results could inform the development of a site-specific management system that accounts for beluga-vessel relationships.
Whale-watching is known for increasing tourist investment in conservation, providing research opportunities, and creating economic possibilities (Gleason and Parsons, 2019). Intensity of tourism, vessel type (Pirotta et al., 2015), vessel maneuvering (Filby et al., 2014; Argüelles et al., 2016; Arias et al., 2018), management regulations (Tosi and Ferreira, 2009) and vessel compliance to regulations has been shown to affect cetacean response to whale-watching (Corkeron, 1995; Stamation et al., 2010; Hoarau et al., 2020). Tourism should therefore be closely monitored as energetic costs associated with whale behavioral reactions can affect the fitness of individuals and thus survival of a population (Bejder et al., 2006b; Lusseau et al., 2006; Williams et al., 2006; Lusseau and Bejder, 2007; Christiansen et al., 2013a; Christiansen et al., 2013b; Christiansen et al., 2014; Currie et al., 2021).
Studies on ecotourism worldwide have found that cetaceans respond to tourist vessels through behavior changes. Behavioral response is often recorded as changes in the time spent traveling, foraging, or resting in the presence of tourism vessels (Coscarella et al., 2003; Constantine et al., 2004; Williams et al., 2006; Stockin et al., 2008; Arcangeli and Crosti, 2009; Lusseau et al., 2009; Visser et al., 2011; Dans et al., 2012; Steckenreuter et al., 2012; Avila et al., 2015). Changes to respiration rate (Christiansen et al., 2014; Schuler et al., 2019), surfacing behaviors (Coscarella et al., 2003; Hastie et al., 2003; Lemon et al., 2006; Noren et al., 2009; Stamation et al., 2010), group size or dispersion (Bejder et al., 1999; Bejder et al., 2006a; Tosi and Ferreira, 2009; Steckenreuter et al., 2012) and increased erratic movements (Lusseau, 2006; Stensland and Berggren, 2007; Avila et al., 2015) have also been observed as a response to vessel presence. While the majority of whale-watching vessel interaction studies indicate impacts to cetaceans, responses vary by species, population (Senigaglia et al., 2016), age class composition (Magalhães et al., 2002; Stamation et al., 2010; Steckenreuter et al., 2012), sex (Williams et al., 2002; Lusseau, 2003b) and activity (Sousa-Lima and Clark, 2008; Arcangeli and Crosti, 2009; Williams et al., 2011; Dans et al., 2012; Vermeulen et al., 2012; Lundquist et al., 2013b; Argüelles et al., 2016).
Cetacean response to tourism vessels at close range is complicated as both attraction and avoidance behaviors have been recorded. Avoidance includes both vertical distancing by diving (Lusseau, 2003b; Stamation et al., 2010), and horizontal distancing by moving away from vessels (Steckenreuter et al., 2012). Horizontal avoidance of vessels by cetaceans includes more changes in travel direction (Lemon et al., 2006; Richter et al., 2006; Amrein et al., 2020), increased swimming speed (Magalhães et al., 2002; Scheidat et al., 2004; Avila et al., 2015) and combinations of these behaviors (Kruse, 1991; Williams et al., 2002; Bejder et al., 2006a; Williams et al., 2009; Stamation et al., 2010; Schuler et al., 2019; Currie et al., 2021; Santos-Carvallo et al., 2021). Attraction, interaction, positive reactions, and approach are terms that have been used to describe similar behaviors of cetaceans approaching vessels, traveling with vessels, and swimming around or underneath tourism vessels (Constantine, 2001; Gregory and Rowden, 2001; Arcangeli and Crosti, 2009; Stamation et al., 2010; Malcolm and Penner, 2011; Steckenreuter et al., 2012; Filby et al., 2014; Hoarau et al., 2020). For instance, dwarf minke whales (Balaenoptera acutorostrata) in Australia were observed more than expected within 60 m of swim-with-whale tourism boats indicating attraction (Mangott et al., 2011). Neutral (also called independent) reactions, described as no change in cetacean behavior in the presence of tourism vessels have been recorded along with attraction and avoidance (Constantine, 2001; Gregory and Rowden, 2001; Arcangeli and Crosti, 2009; Filby et al., 2014). Attraction behaviors and neutral responses to tourist vessels have been grouped together for humpback whales (Megaptera novaeangliae) to better understand avoidance rates in Reunion Island, and Vava’u, Kingdom of Tonga, finding avoidance 27.4% and 33.5% of the time, respectively (Fiori et al., 2019; Hoarau et al., 2020).
Churchill, Manitoba, Canada, is known for the unique whale-watching interactions with the Western Hudson Bay (WHB) population of beluga whales (Delphinapterus leucas) that occupy the Churchill River estuary from June to September every year. The WHB beluga population is classified as not at risk by the Committee on the Status of Endangered Wildlife in Canada and its size is estimated at 54,500 belugas (Matthews et al., 2017; COSEWIC, 2020). The return of beluga whales to the estuary each summer has been hypothesized to be related to matrilineally learned philopatry, or biological advantages associated with greater prey availability, optimal habitat for molting and predator protection (Sergeant and Brodie, 1969; Sergeant, 1973; Finley, 1982; St. Aubin et al., 1990; Smith, 2007; O’Corry-Crowe et al., 2020). In the Churchill River estuary, belugas interact closely with kayaks and Zodiac whale-watching tour boats in a way that is a major draw for ecotourism to the region (Malcolm and Penner, 2011). While Malcolm and Penner (2011) were able to record beluga behaviors near snorkeling activities, a passenger motorboat, and kayaks, the distributional response of belugas to whale-watching vessels has not been quantified. Additionally, responses to paddleboards were not recorded by Malcolm and Penner (2011) as this ecotourism activity started in 2015 after completion of their study. Quantifying beluga whale response would provide needed information for tourism management that would ideally meet the needs of tour operators and mitigate against harmful disturbance to the whales. Tourism vessels are currently limited to a 50 m approach distance for belugas in the Seal and Churchill River estuaries (Regulations Amending the Marine Mammal Regulations. SOR/2018-126, 2018).
In this paper, we used time-lapse photography to locate belugas in a section of the estuary and calculate the distances between belugas and tourist vessels. Through comparison of beluga-vessel relationships to beluga location without vessel presence we determined whether belugas were closer to, farther from, or the same distance to vessels than would be expected. In other words, we can use the distance between belugas and vessels to determine if belugas are attracted to, avoid, or are neutral to different types of tourist vessels in the Churchill River estuary. Because of the experiences of the Churchill community and tour operators as well as relevant literature, we expected to find that belugas are attracted to tourist vessels in the Churchill River estuary (Malcolm and Penner, 2011; The Churchill Beluga Whale Tour Operators Association et al., 2015; Manitoba western Hudson Bay ad hoc beluga habitat sustainability plan committee, 2016).
This study took place in the Churchill River estuary, a subarctic estuary connected to Hudson Bay (Figure 1), from 13–28 August 2020. During August, the difference between high and low tide was 4 m. Daily boating activity on the Churchill River estuary includes whale-watching, research, subsistence fishing, and local recreation. The vessel type and quantity on the estuary vary daily depending on tourist demand and weather. Larger groups of kayaks and paddleboards, as well as accompanying Zodiacs (inflatable, single motor, boats capable of carrying multiple passengers) are present in the estuary at low tide when waters are calm. During falling, rising, and high tide, motorboats (solid hull motorized boats capable of carrying multiple passengers) and Zodiacs are the most frequent vessels. The year of this study was different from a typical year in that there were fewer international tourists due to travel restrictions from the COVID 19 pandemic.
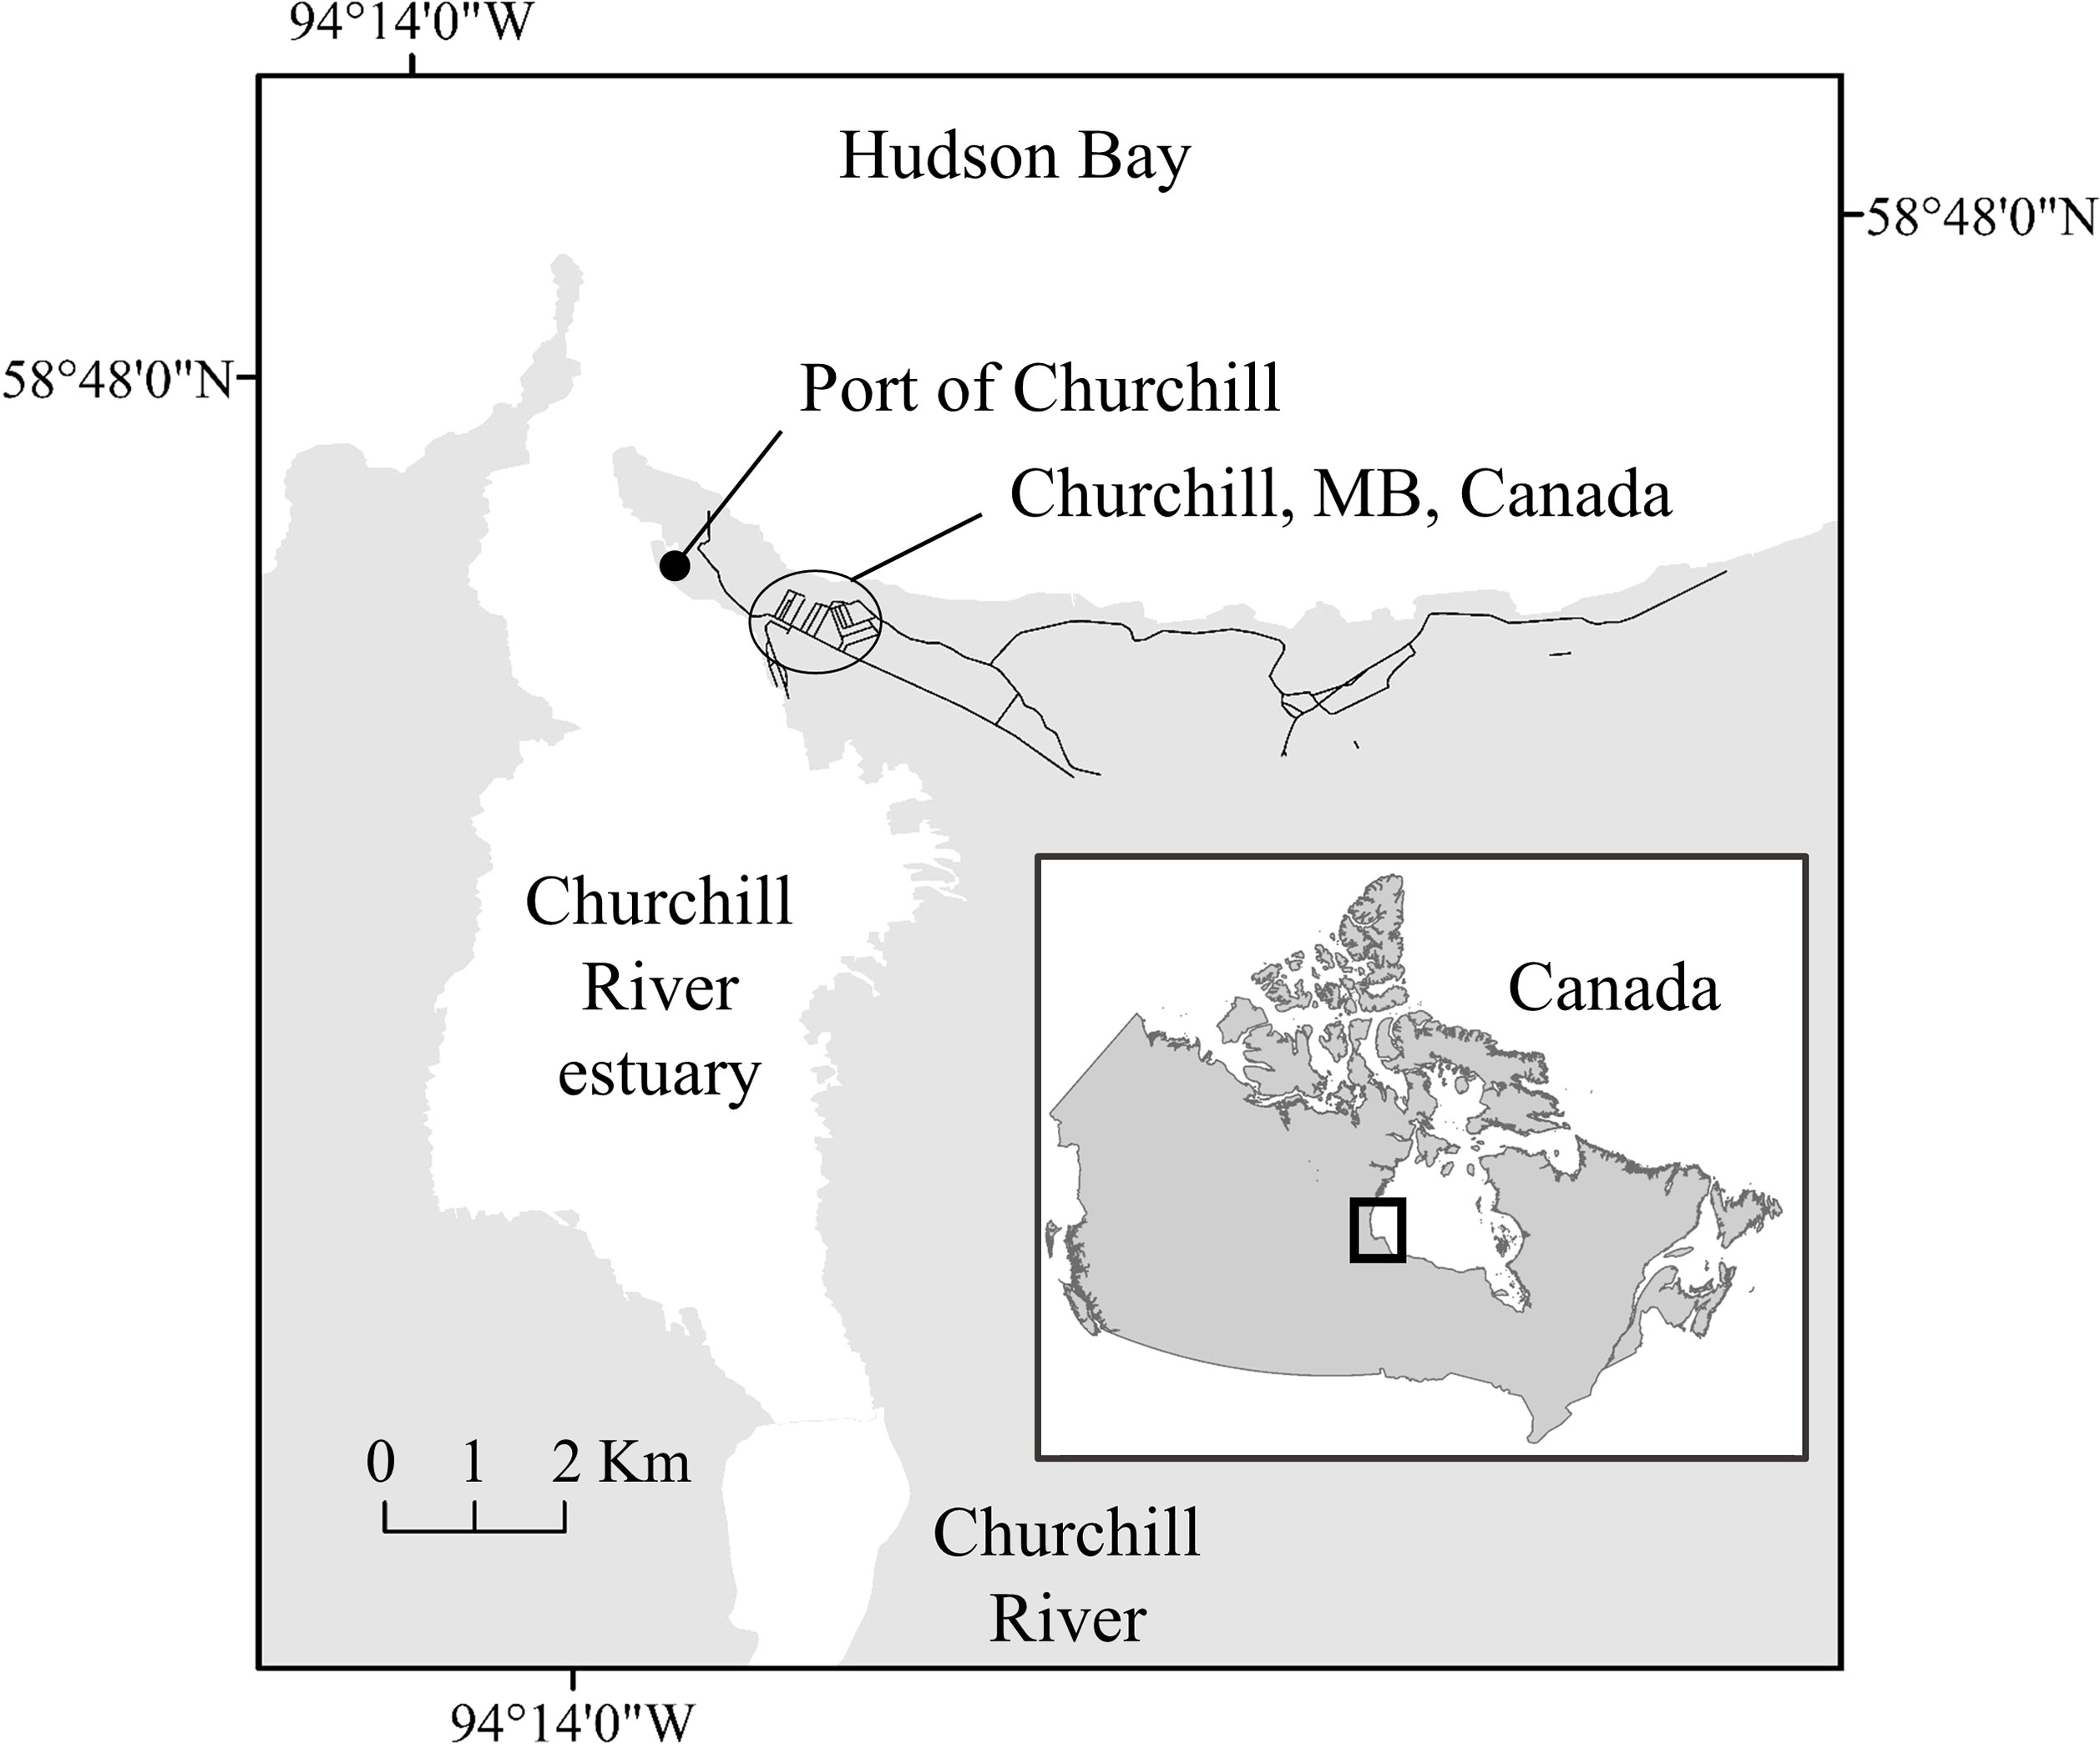
Figure 1 Map of the Churchill River estuary with the Port of Churchill located in Hudson Ba, Manitoba, Canada.
A Harbotronics Cyclapse Pro-Glacier time-lapse camera system, with a Harbotronics Digisnap Pro time-lapse controller, and a Pentax K1 Mark II camera with Pentax HD PENTAX-D FA 28-105mm f/3.5-5.6 ED DC WR Lens was installed on the 2nd floor of the Port of Churchill Gallery (Figure 2). The camera faced west, and the lens was set to a focal length of 58 mm to capture the horizon and most of the estuary. To optimize photo quality in an outdoor setting with varying light, the ISO speed was set to 800, exposure to 1/1600 seconds, and f-stop to 11. Photos were taken every 5 minutes from 6:30 am to 8:30 pm every day.
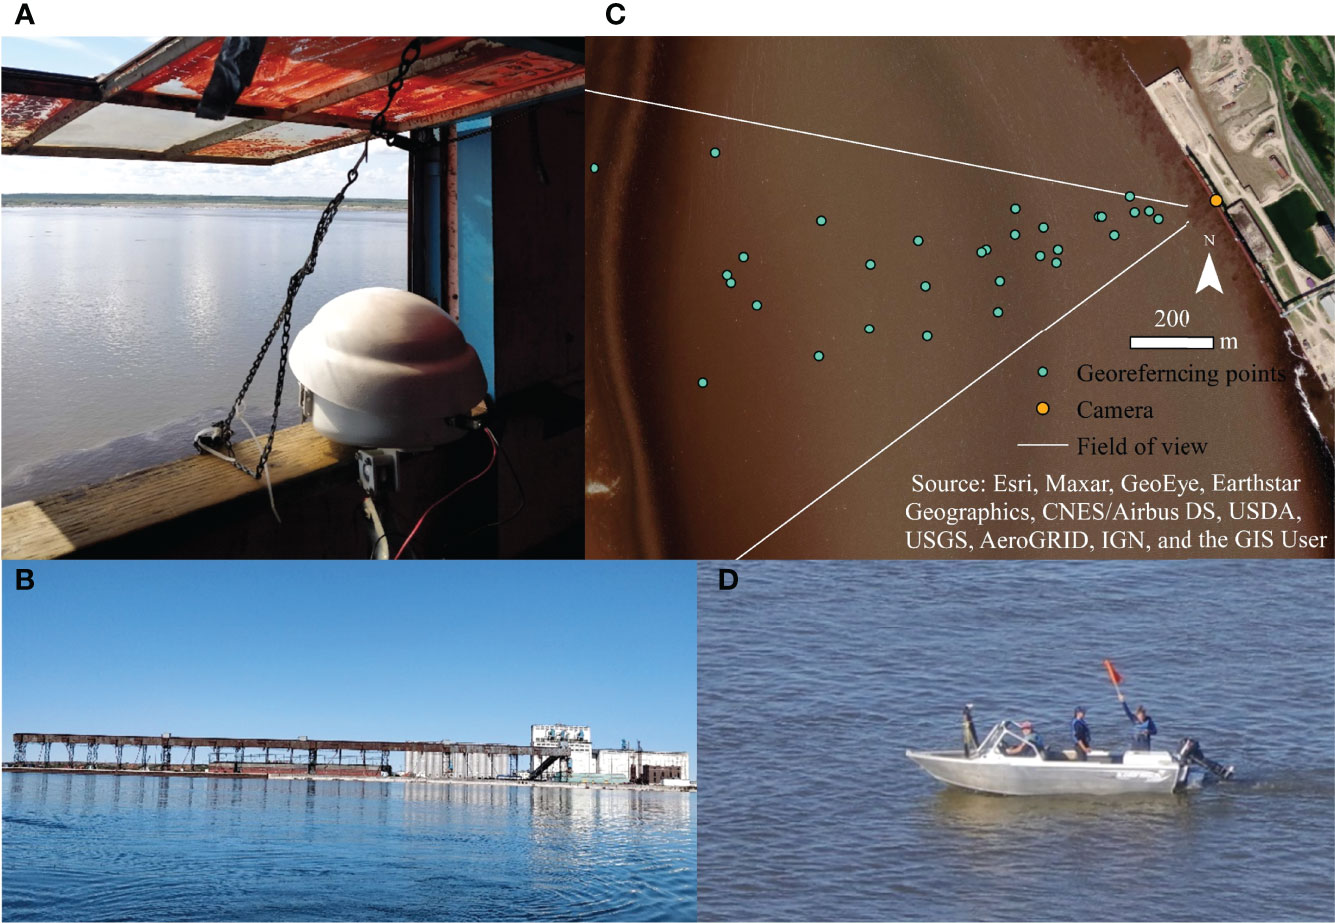
Figure 2 (A) Digisnap Pro Cyclapse system. The camera is under the white dome necessary to protect the camera from rain. (B) The Port of Churchill gallery (two-story structure) where the camera is located, as viewed from the estuary. (C) Location of georeferencing points on the estuary (white lines represent the field of view of the camera). (D) Image of a georeferencing point being recorded.
To calibrate and test distance measurements from photos, 30 georeferencing points were taken during 17–23 August 2020 (Figure 2). A Garmin GPSMAP 64s was used to locate these georeferencing points, which has a 5-15 m error depending on satellite orientation1. Georeferencing points were taken following Pavia et al. (2015) by maneuvering a boat into view of the camera, with one individual in the boat holding up an orange flag and taking a simultaneous GPS point with the time-lapse camera photo (Paiva et al., 2015). Images were corrected for pincushion lens distortion using the Pentax filter in Photoshop 21.2.0.
Photogrammetry of oblique imagery is characterized by the change of scale associated with increasing distance from the measurement device. To reference oblique imagery, surface elevation, the location of the camera, and the camera specifications are needed (Höhle, 2008). Height of the camera and of the port above the water’s surface were measured using a weighted rope. Tide level measurements were obtained from the Canadian Hydrographic Service gauge (station 5010)2 measured every 3 minutes. Tide level measurements were used to adjust for the height of the camera above the water’s surface. The angle of the camera relative to vertical was approximately 79 degrees when measured during set up and removal using the Clinometer smartphone app from PixelProse SARL.
The area captured by a photo is determined by the distance of the object from the camera and lens angle of the camera, which is also called field of view (FOV). The focal length (f), the horizontal sensor length (sh) and vertical sensor lengths (sv) are camera specifications that are used to determine both horizontal field of view (θHFOV) and vertical field of view (θVFOV) using equation (1) and (2) (Havens and Sharp, 2015). The Pentax K1 Mark 2 camera has a horizontal sensor length of 35.9 mm and a vertical sensor length of 24 mm.
Measurements were obtained through calculations based on the pixel dimensions of the photos. Each 17.9 MB image contained 7360 by 4912 pixels (Figure 3). Horizontal pixels are considered as x pixels and vertical as y for the following calculations. The origin of the image at 1,1 is located at the top left corner. The center of the image, known as the principal point (P) is assumed to approximately represent x = 3680 and y = 2546. The limits of the horizontal field of view of the camera are at x = 1 and x = 7360. The real-world area of each pixel increases from y = 4912 at the bottom of the photo to y = 1 at the top, so the area between 1 and 7360 x pixels increases with distance from camera. A pixel location (x,y) on the photo will be represented by the point E, and E’ in the real-world (Figure 4). An x pixel has an angle from the camera (O) subtended by the arc of the center line of the camera to any given pixel location (Figure 4). This angle (θx) can be determined if the distance between E at a given y pixel value and the vertical center line (x = 3680) is known in pixels. To achieve a representation of that distance, the horizontal field of view (θHFOV) and ½ of the image width in x pixels were used in conjunction with trigonometric laws in the following formula (equation 3):
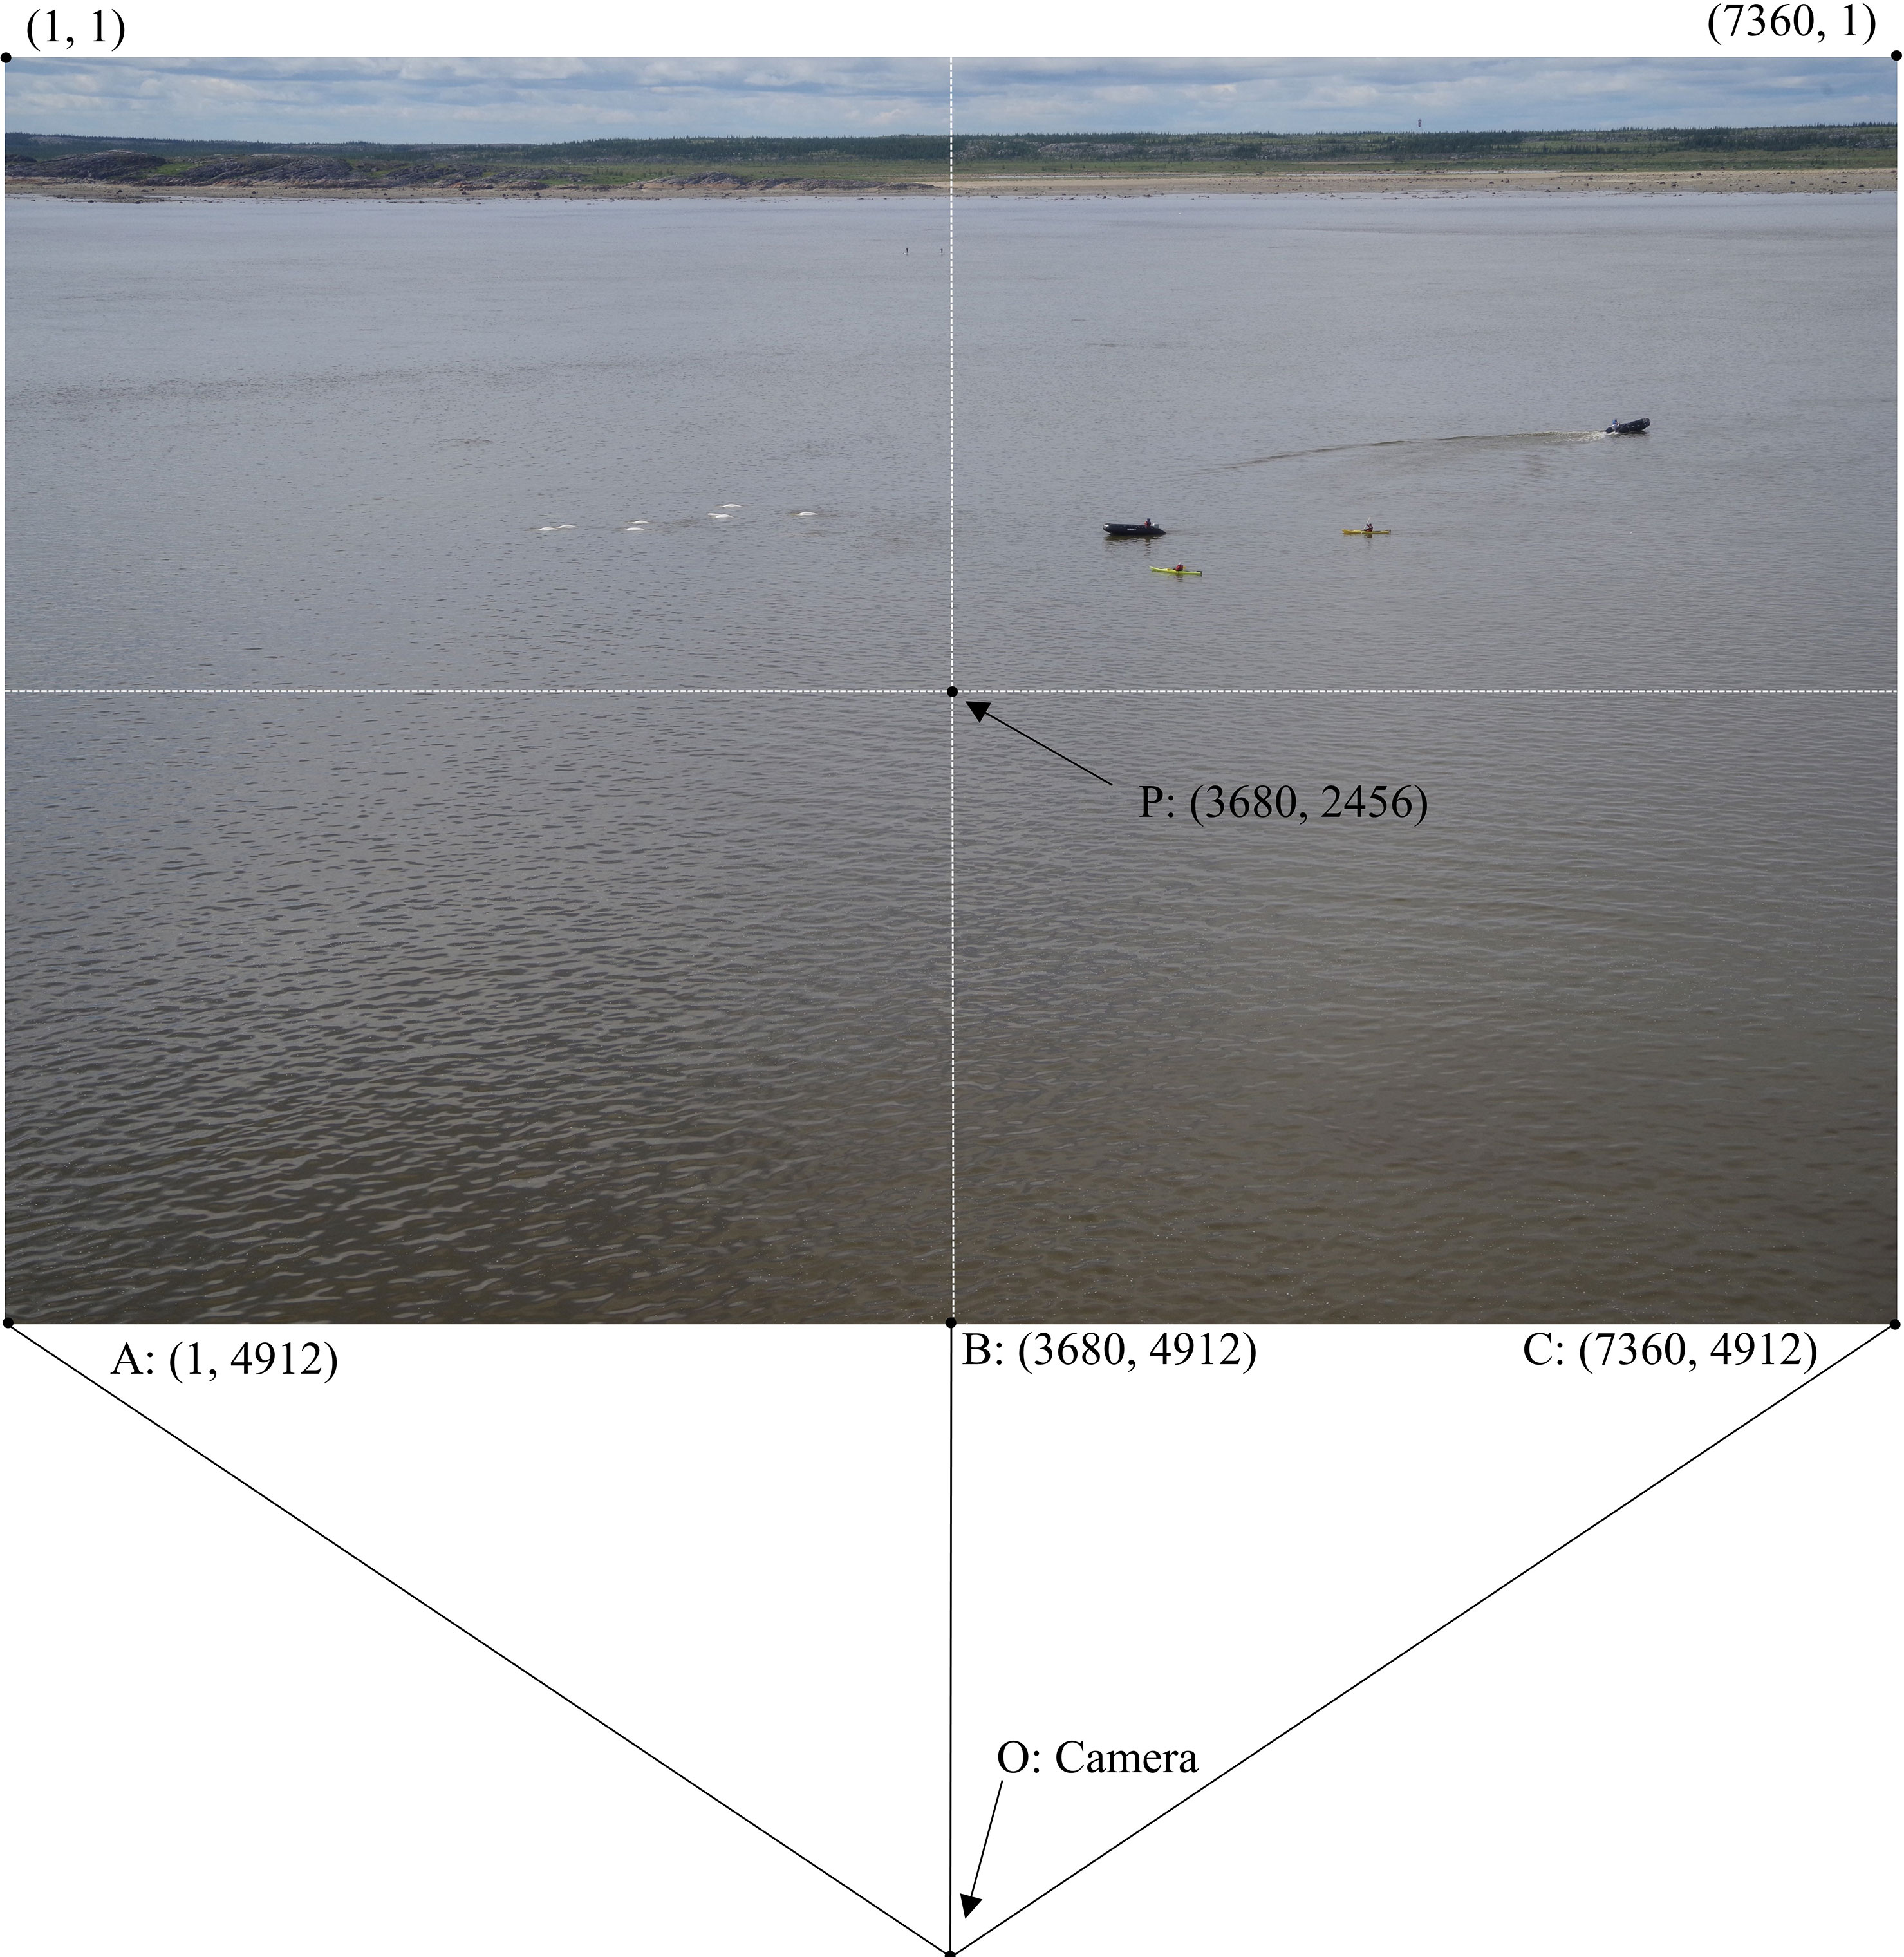
Figure 3 Image dimensions in x, y pixels. Points A–C, and P are labeled for understanding of translation between real world and image calculation. O is the camera location.
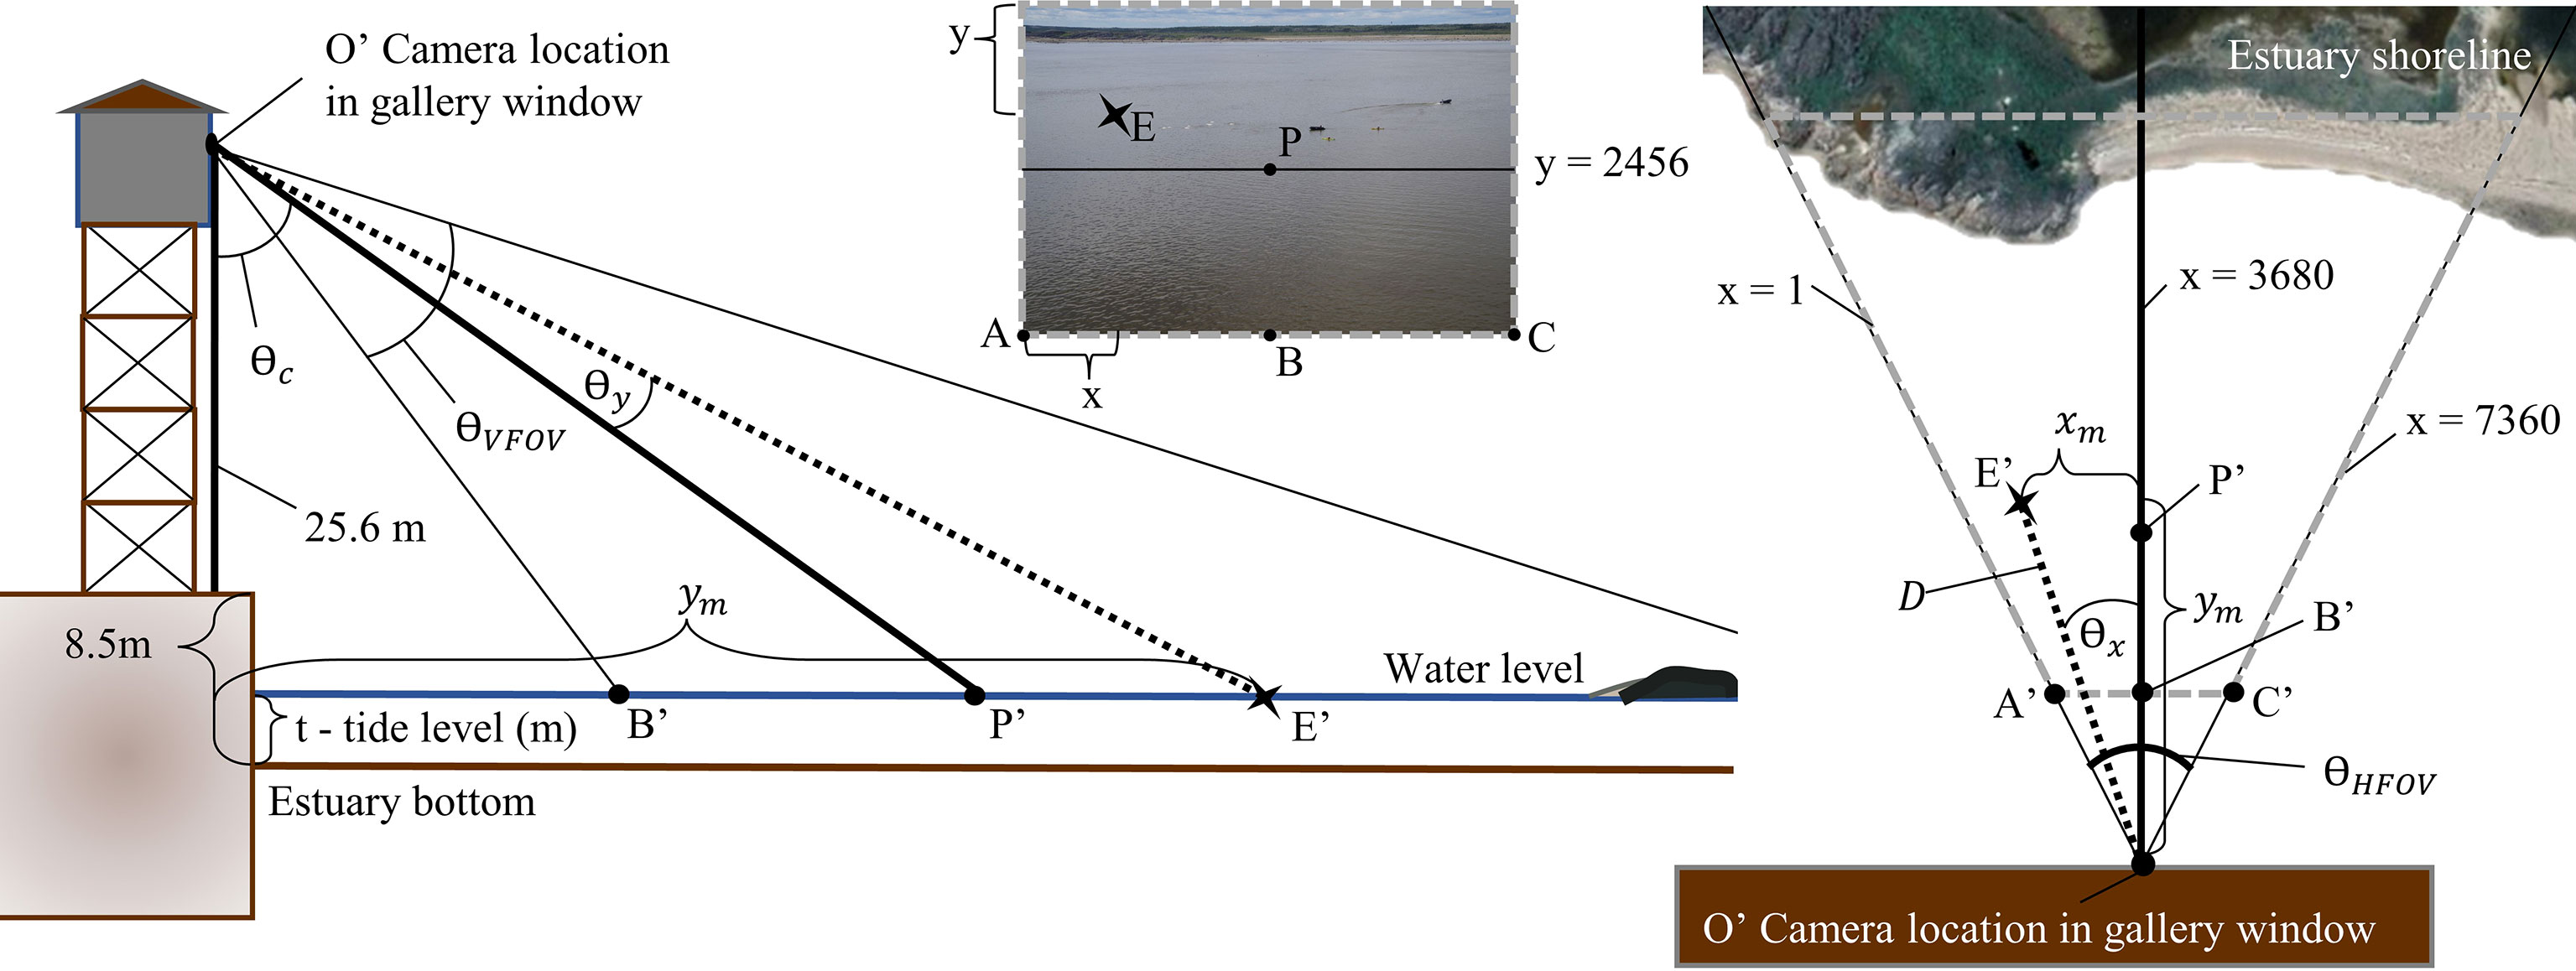
Figure 4 Side view (left) and bird’s eye view (right) of camera set up in the Port of Churchill gallery. Location of multiple points on an oblique photo (A–C, P) are represented in this diagram (A’, B’, C’, P’) to translate between the image and real-world calculations. The star (points E and E’) shows how a location in the real-world would be found on a photo with pixel coordinates at (x,y).
When the length of is known, θx for any x pixel value can be calculated (equation 4). This angle (θx) remains the same for a given x-value and is not impacted by different y or increasing distance of real-world locations from the camera (equation 4).
The vertical dimension of the image in y pixels can be understood in the same way using vertical field of view (qVFOV) (Figure 4). The distance from the camera to the principal point (equation 5) is used to determine the angle from the camera subtended by pixel y at E and (equation 6).
These calculations allow for the angle from camera between the principal point (P) of the image to both the x pixel (θx) and y pixel (θy), to be determined (Figure 4).
The height of the camera above water level (h) is the sum of the height of the camera in the gallery above the port floor (25.62 m) and the distance from the port floor to the bottom of the estuary (8.51 m) subtracting the estuary water level (equation 7). Using the above angles (θx, θy), the height of the camera above estuary water level (equation 7), and the angle of the camera from nadir (θc), distances to and between pixels can be calculated (Figure 4). The right angle subtended by the intersection of the vertical line at x = 3680 pixels and any horizontal line at a y pixel value allows for distance calculations between the camera and real-world locations using the Pythagorean theorem. Distance in meters between the y pixel of the real-world object at x = 3680 (ym) is calculated using equation 8. The distance in meters from x = 3680 to the real world value of x uses ym and θx in equation 9, and the distance from the real world object at a pixel (x,y) to the camera (D) location represented at the same elevation as the tide level is then calculated using equation 10. The law of cosines can then be used to determine the real-world distance between two pixels (equation 11).
The exact camera angle at the time georeferencing points were taken was not known due to shifts in the camera position resulting from system errors. The vertical angle of the camera (θc) was determined by splitting the georeferencing points into training and testing groups. Evaluation of the accuracy in determining pixel distances from the camera and visual inspection of images resulted in a cut-off line at y = 700 pixels, above which belugas can be identified and calculations of distances are accurate. Of the 30 georeferencing points, 17 were located over 700 y pixels and these were split into 10 training and 7 testing. GPS locations were entered into ArcGIS and the NEAR tool calculated each distance to the camera location and to other GPS points. The camera angle was determined to be 79.41 degrees using the 10 training georeferencing points by comparing between calculations using equation 10 and GPS distances to the camera. The mean difference in distance to camera between the 7 testing GPS and calculated georeferencing points was 6.6 meters (between 1.7 and 10.0 m). Calculation accuracy was verified by comparing the distances between the GPS locations for the 7 testing georeferencing points and the calculated distance using equation 11 (Figure 5). For the 20 distances root mean square error was 4.2 meters. This error can likely be attributed to GPS error, and boat movement with tide as the photo and georeferencing point were taken.
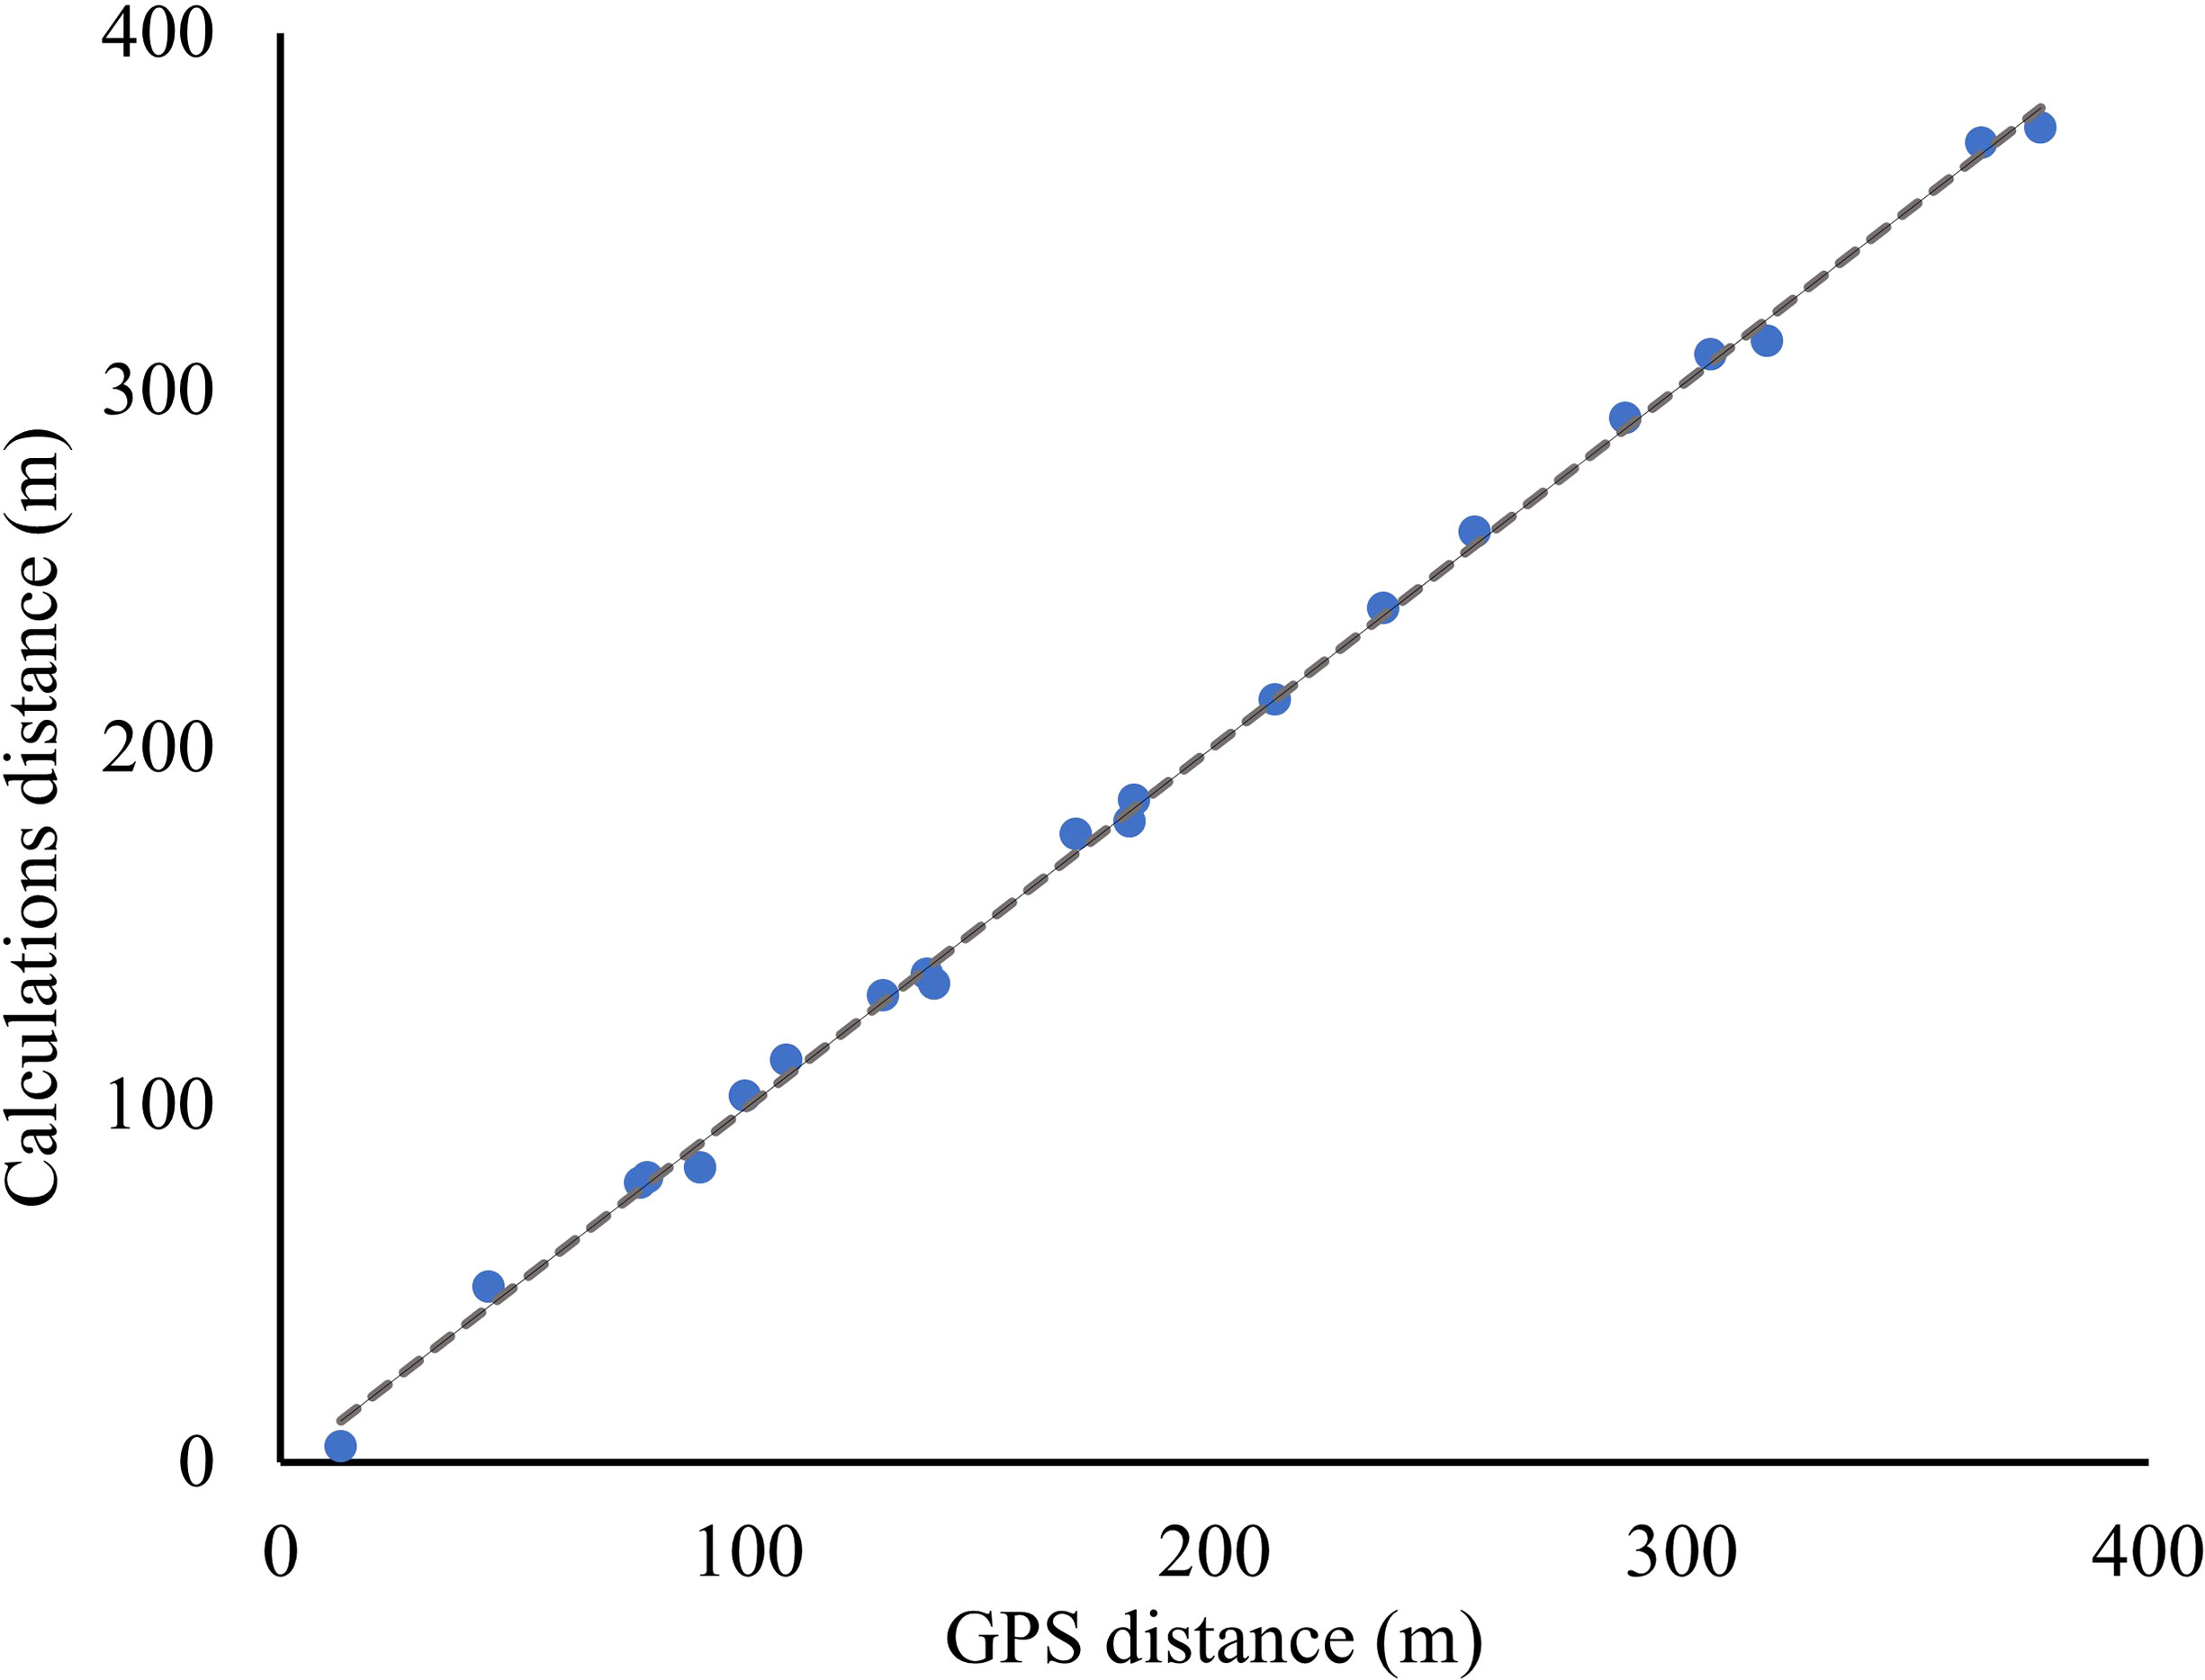
Figure 5 The distances between georeferencing points (m) as determined by inputting GPS locations into ArcMap (x) and by calculating using equations described in this paper (y).
Belugas and tourist vessels were identified in photos by searching in five horizontal bands of 1,000 y pixels to ensure no objects were missed. For each beluga and vessel, the center location was recorded in x and y pixels. Tide for each photo was assigned to the nearest three-minute Canadian Hydrographic Service tide gauge measurements. Photos were also categorized by tide category, which was determined through equal division in time between minimum and maximum tide as recorded by the Canadian Hydrographic Service gauge. This resulted in tide categories for High, Falling, Low, and Rising tide of approximately 3 hours each. If belugas were in a group, defined as swimming in the same direction within approximately two body lengths of each other, one beluga was selected for each group to avoid pseudoreplication (Hurlbert, 1984). All other belugas were considered individual beluga. Each tourist vessel was identified as a kayak, paddleboard, motorboat, or Zodiac. Unique cases such as canoes were also identified, but not included for consideration in this study as there were few occurrences (n = 3). See Supplementary Materials for additional information and photos describing how camera errors and edge impacts were addressed.
The relationship between belugas and vessels was investigated through measurements of the distance between them. These relationships may be influenced by tide level or vessel type (kayak, paddleboard, motorboat, Zodiac), so differences were assessed using a Kruskal-Wallis chi-squared test to determine if beluga-vessel distances differed by vessel type, or vessel type at different tides. A Monte Carlo analysis was performed to generate an expected distribution of distances that would occur if vessels had no effect on beluga distribution. This analysis allowed for a large random sample to be created and for analysis to be iterated multiple times to ensure accuracy. By comparing observed distances to the expected distances between belugas and vessels, each observed distance relationship was classified as closer to, farther from, or neither (i.e., independent or neutral) of vessels.
In photos of both vessels and belugas, the distances between their locations were measured as the observed sample. Each beluga in a photo was treated as an independent individual as the 5-minute photo interval did not allow for tracking of individual beluga movements through time. In the 5-minute interval, there was a large change in photo composition, and we assume that different belugas were seen in consecutive photos. Beluga locations in photos without vessels were compiled and categorized by tide category to determine the expected locations for comparison with locations with vessels. This was done for two reasons. First, belugas select habitat within the Churchill River estuary based on tide, prey movement and other related environmental variables (Hansen, 1988; Caron and Smith, 1990; Chernetsky et al., 2011). By randomly sampling belugas in photographs, the expected distribution represents locations that belugas occupy without vessels present, which allows for more meaningful comparison. Second, there is a detection function associated with correctly identifying belugas in the oblique photographs (Rowcliffe et al., 2011). Belugas further from the camera are less likely to be correctly identified and recorded than those closer to the camera. Randomly sampling belugas for comparison minimizes detection bias.
To test for tide category and vessel type differences in the distance between vessels and belugas, a Kruskal-Wallis chi-squared test was used. For each photo, 100 expected locations were chosen with replacement. Monte Carlo simulations were used to find the expected distribution of distances between belugas and vessels that, due to high numbers of generated points, is close to what should be expected without vessels. The distances between each expected location and all vessel locations were compared to observed distances between belugas and all vessel locations captured in a photo (Figure 6). These distances were differentiated by vessel type: kayak, paddleboard, motorboat, or Zodiac. The null hypothesis that observed distances between belugas and vessels were greater than or less than expected distances between belugas and vessels was tested. We chose to categorize beluga behavior as attraction if belugas were found closer to vessels than expected avoidance if beluga are found further from vessels than expected, and neutral if belugas were not closer to or farther from vessels than expected.
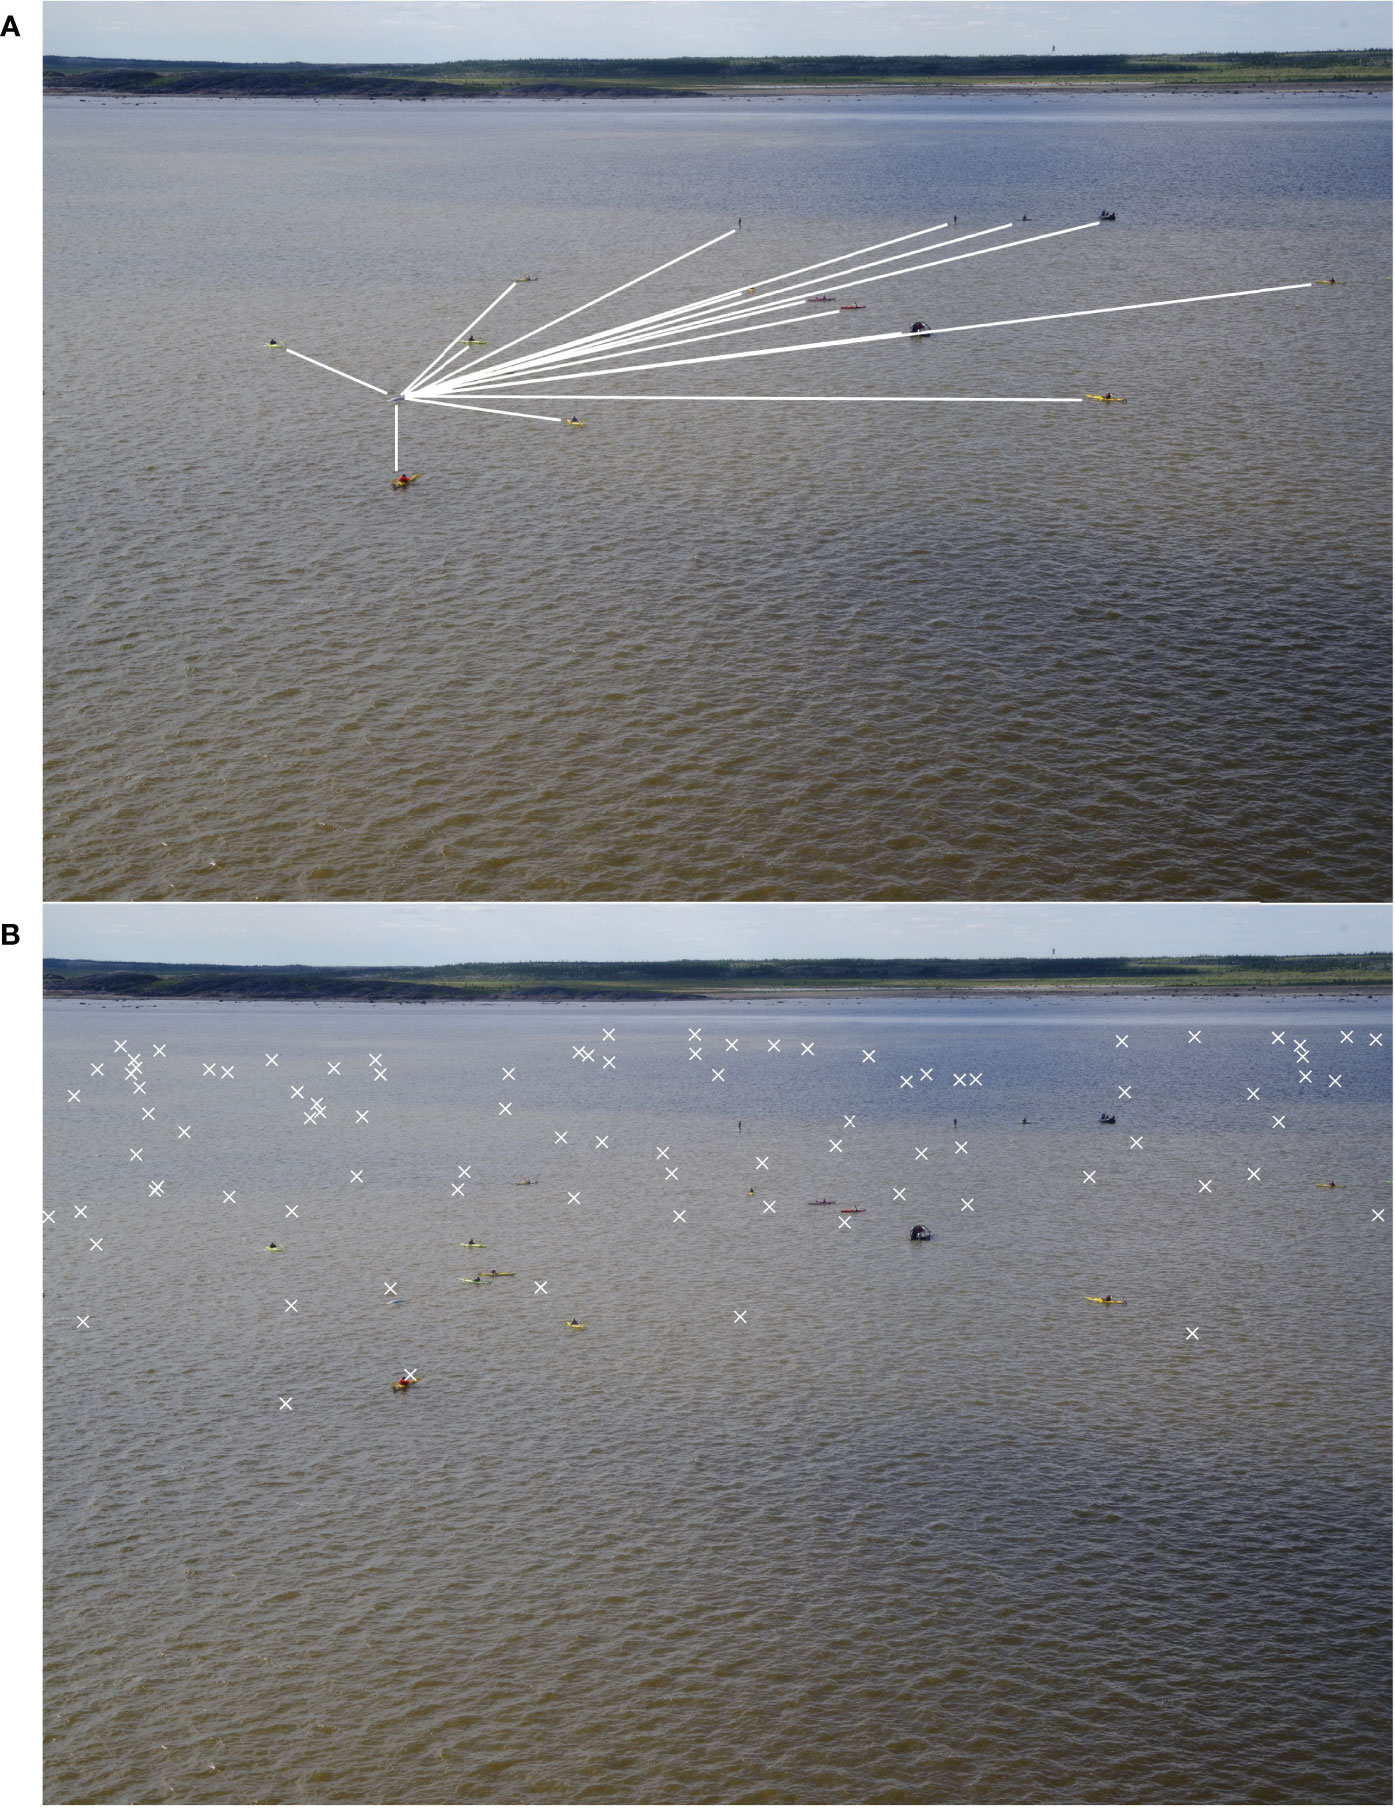
Figure 6 (A) Distances for Monte Carlo analysis collected between belugas and all vessels in a photo (white lines). (B) An example of 100 expected locations (white x), of which the distance between each point and all vessels is used to determine the expected distribution.
Analysis was completed in R (version 4.1.1) using the tidyr and ggplot2 packages (Wickham, 2016; Wickham, 2021; R Core Team, 2021). The code used for this analysis is available upon request. One-sided non-parametric Wilcoxon Rank sum tests were used to test if observed distances where greater, or less than expected distances, with a significant p-value of 0.05. This test was selected as distances were not normally distributed. A neutral response occurred if one sided tests showed observed and expected values were not significantly different. This analysis was iterated 100 times, each time determining if belugas show attraction, avoidance, or are neutral to kayaks, paddleboards, motorboats, and Zodiacs. Results from this analysis were verified by testing for edge effects. Details on edge effect testing are covered in the supplementary materials. The raw data supporting the conclusions of this article will be made available upon request.
Between 13 and 28 August 2020, 2,303 georeferenced photos were taken of the Churchill River estuary. Of these photos, 164 contained vessels and belugas, 910 contained only belugas, and 98 contained only vessels (Figure 7). Belugas were photographed at all tides, with a total of 2,261 belugas recorded. After removing photos with canoes and miscellaneous vessels, there was a total of 162 photos that captured belugas at the same time as kayaks, paddleboards, motorboats, and/or Zodiacs. These photos contained a total of 329 belugas, 29 groups of belugas, 320 kayaks, 392 paddleboards, 43 motorboats, and 119 Zodiacs. Belugas were found to be distributed between 3.6 and 744.6 m from all vessels, with a median observed distance of 227.8 m and a mean of 268.3 m (n = 2,005, sd = 164.5) (Figure 8). Kruskal-Wallis tests of observed distances between vessels and belugas showed significant differences by vessel type (p-value = <0.01, chi-squared = 35.26, df = 3) (Figure 9). When testing distances for the effect of the different tide cycles by each vessel type separately, only paddleboards significantly differed between rising (n = 12) and low (n = 920) tide.
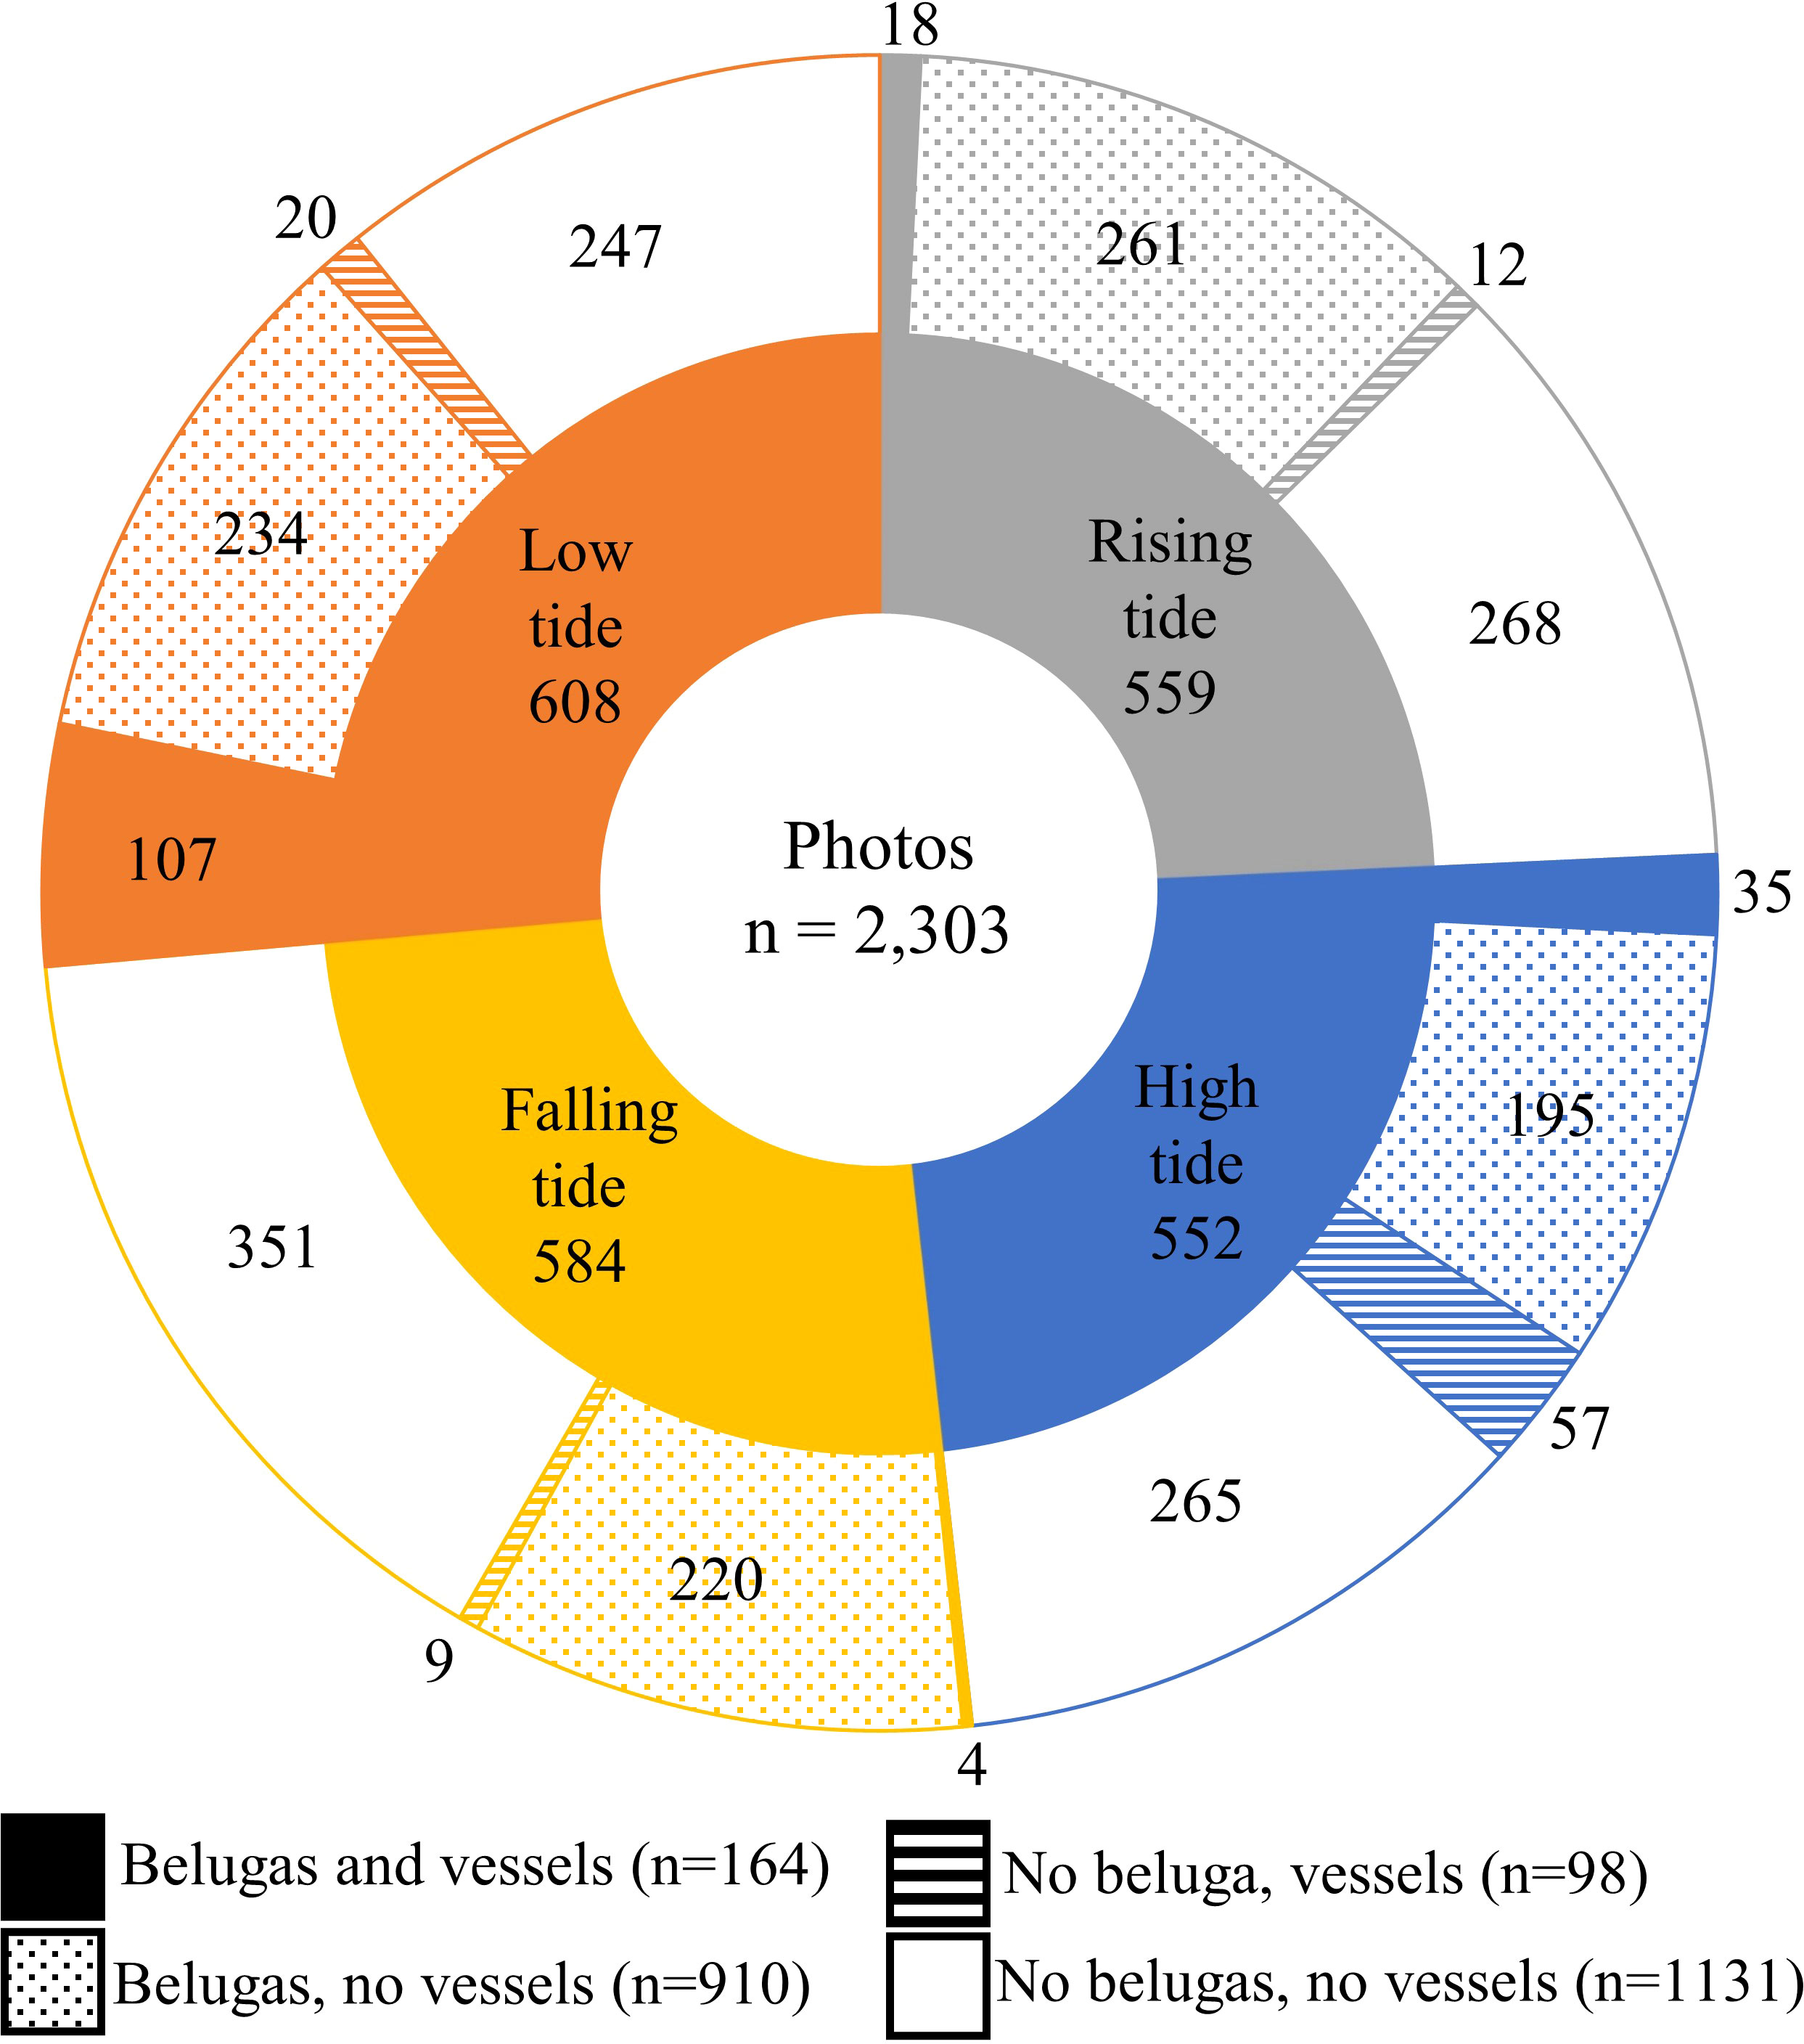
Figure 7 Proportion of photos with beluga, boats, and both within each tide catergory.
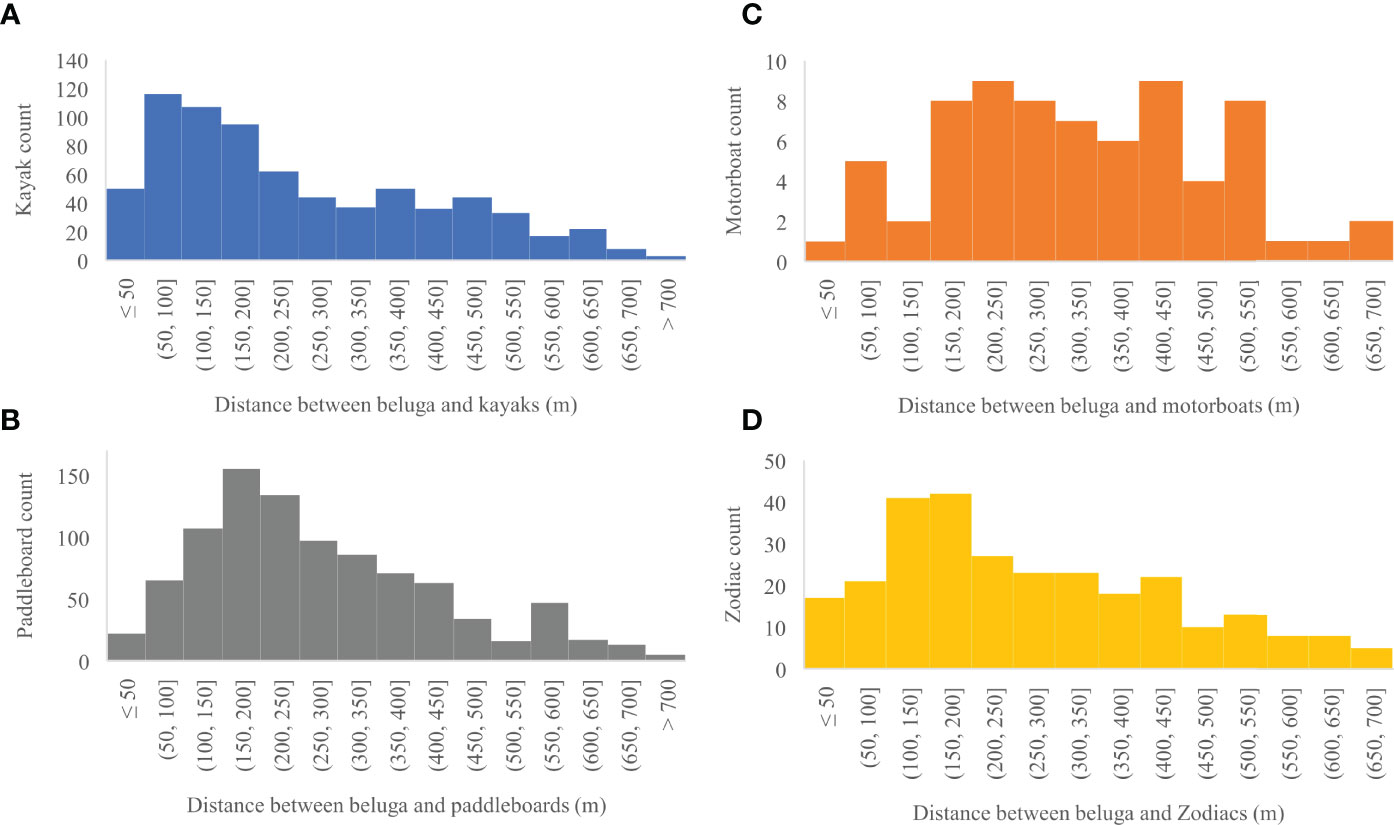
Figure 8 (A) Distribution of distances in meters between belugas and all kayaks (n = 724), (B) paddleboards (n = 932), (C) motorboats (n = 71), and (D) Zodiacs (n = 278) captured in a photo.
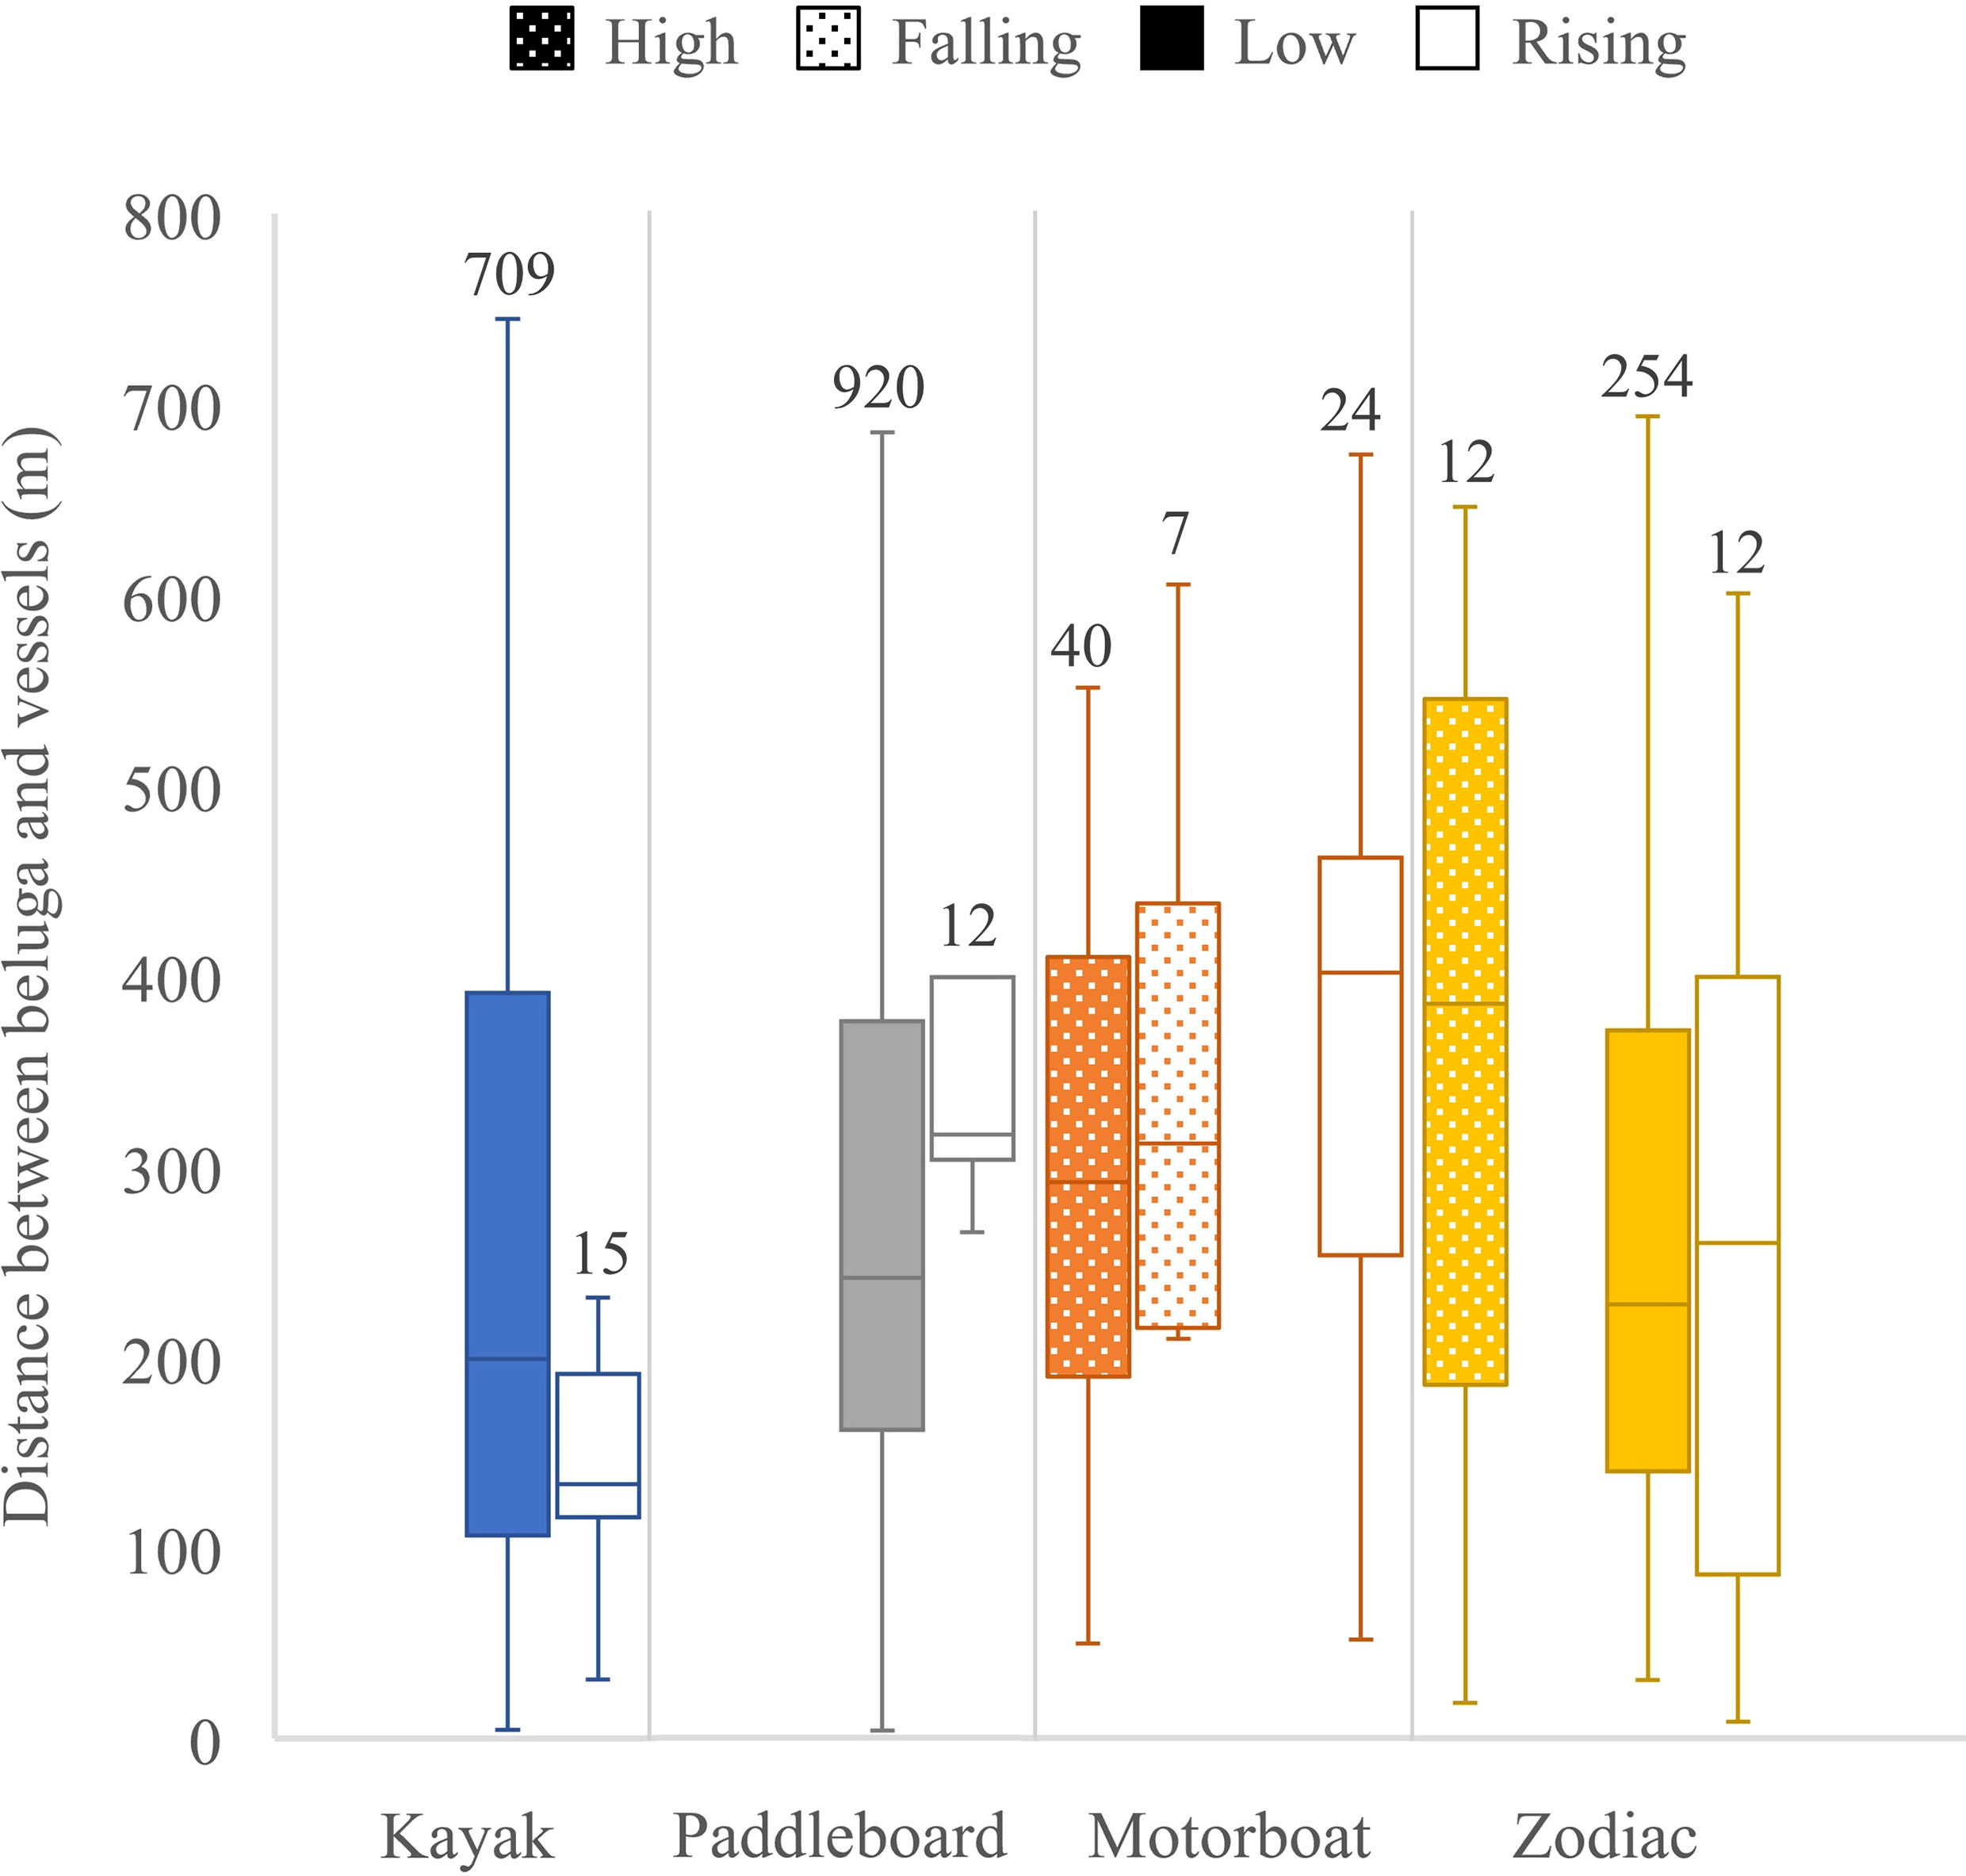
Figure 9 Distance between belugas and vessels by vessel type and tide. Quartiles calculated using inclusive median shown at edges of the box, center line of the box and ends of the tails. Sample sizes are given on top of each box.
Kayaks occurred during low tide and at the beginning of rising tides. Kayaks were present in the estuary in general but occurred in larger numbers as a part of tourist groups that also included paddleboards and Zodiacs. The largest number of kayaks was 15 in one photo. The closest beluga to a kayak was 4.5 m. There were 32,000 expected distances between belugas and kayaks in each of the 100 iterations. In 94 out of 100 iterations the distance between belugas and kayaks was significantly less than the expected distances generated in a Monte Carlo Simulation indicating that belugas were attracted to kayaks (Table 1).
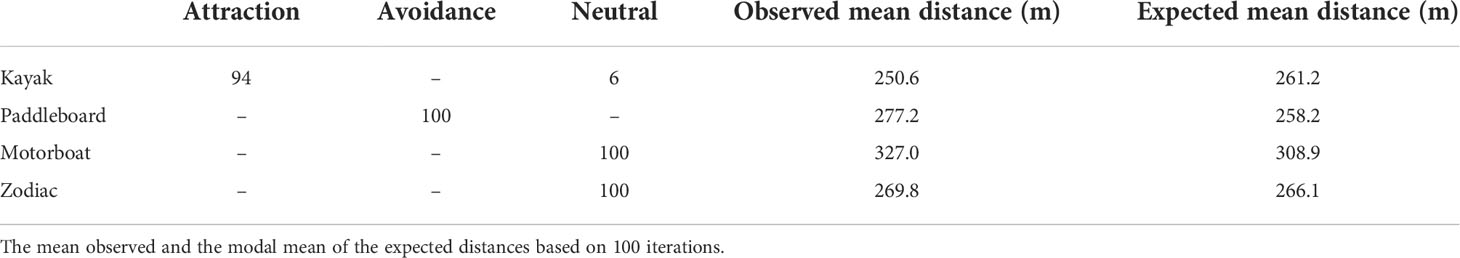
Table 1 Attraction, avoidance and neutral results from one-sided Wilcoxon Rank sum tests out of 100 iterations for beluga distance relationships to kayaks, paddleboards, motorboats, and Zodiacs.
Paddleboards occupied the estuary during low and rising tides, only as part of larger tourist groups, with a maximum number of 11 in one photo. Paddleboards were generally distributed near the center of the estuary between 500 and 800 meters from the camera. The closest beluga to a paddleboard was 3.6 m, which was the closest distance between a beluga and any vessel. There were 39,200 expected distances between belugas and paddleboards in each of the 100 iterations. In all 100 iterations of the Monte Carlo analysis the distance between observed belugas and paddleboards was significantly greater than expected indicating belugas avoided paddleboards (Table 1).
Motorboats occurred during all tide categories, except low tide. No more than one motorboat was present in a photo. The closest beluga to a motorboat was 49.6 m. There were 4,300 expected distances between belugas and motorboats in each of the 100 iterations. The distance between belugas and motorboats was the same as the expected distances generated in all Monte Carlo simulation iterations, indicating that belugas were neither attracted to nor avoiding motorboats and were therefore neutral (Table 1).
Zodiacs occurred in the estuary at all tide categories, except falling tides. At low and rising tide, Zodiacs were used by tour leaders for supervision of kayaks and paddleboards. Of the 83 photos with Zodiacs and belugas, only 9 included Zodiacs as the sole vessel. The closest beluga to a Zodiac was 8.5 m. There were 11,900 expected distances between belugas and Zodiacs in each of the 100 iterations. The distance between belugas and Zodiacs was the same as the expected distances generated in 100 out of 100 Monte Carlo iterations indicating that belugas were neither attracted to nor avoiding Zodiacs and were therefore neutral (Table 1).
This study found belugas in the Churchill River estuary were attracted to kayaks, avoided paddleboards, and were neutral in their response to motorboats and Zodiacs. To our knowledge, this is the first study to quantify an attraction to kayaks by cetaceans using the measured distances between them. While Malcolm and Penner (2011) described interactive behavior of belugas to kayaks, that study was not quantitative. Unlike offshore waters near other Arctic communities within Hudson Bay, there are only few reports of belugas being hunted within the Churchill River estuary. Beluga hunting, which is a traditional right for Inuit and Cree Peoples, has been observed to result in avoidance by beluga of motorboats historically within Churchill and in other communities around Hudson Bay (Idle, 1989; Caron and Smith, 1990; Tyrrell, 2007; Malcolm and Penner, 2011).
Our results support findings by Malcolm and Penner (2011), which suggest that belugas are attracted to kayaks. However, our findings that belugas are neutral in their behavior regarding motorboats and Zodiacs contradict their results. Malcolm and Penner (2011) used vessel-based observers to classify beluga behavior within distance categories from a passenger motorboat (0 to greater than 150 m by 25 m increments), kayaks (within 100 m), and snorkeling activities (within 100 m). They investigated the proportion of time groups of belugas spent in the different behavioral categories at different distances from vessels to assess the potential vessel impact. They found that the most common behavior type of belugas within 25 m of the passenger motorboat was “interaction” and concluded that regardless of vessel type belugas show attraction to tourist vessels.
Several factors may contribute to the different results of these two studies. Our camera system was able to monitor a larger area of the estuary, allowing for all distances between belugas and vessels to be recorded up to 744.6 m. The methods of Malcolm and Penner (2011) may have observed behaviors of closer belugas interacting with vessels more than belugas at farther distances that may have been avoiding vessels. Additionally, by using locations of belugas in photos without boats, our study design allowed us to control for environmental variability such as prey availability and influence of tide.
The response of Churchill River estuary belugas to whale watching vessels is distinct. Belugas in the St. Lawrence River estuary, for example, have been observed to avoid motorboats by increasing swimming speed, bunching into groups, changing travel direction, and increasing diving intervals (Blane and Jaakson, 1994; Lesage et al., 1999). Vessel avoidance displayed by these belugas could be a result of higher traffic from ferries and shipping vessels that occurs there. The St. Lawrence River population status is Endangered (COSEWIC, 2014) and high shipping traffic in this region may be a contributing factor in their status. Quantity, speed, approach distance, and regulation of tourist vessels have been shown to impact the behavioral response of belugas (Blane and Jaakson, 1994; Krasnova et al., 2020). Current management of beluga ecotourism does not allow approaches to be closer than 400 m for belugas in the St. Lawrence estuary, or closer than 50 m distance for belugas in the Seal and Churchill River estuaries (Regulations Amending the Marine Mammal Regulations. SOR/2018-126, 2018).
Some studies have reported behavior changes in response to kayaks, including horizontal avoidance (Jelinski et al., 2002; Lusseau, 2003a; Lusseau, 2006; Timmel et al., 2008; Noren et al., 2009; Fandel et al., 2015; Sullivan and Torres, 2018), while other studies have found no changes in observed cetacean behaviors (Steckenreuter et al., 2012; Heenehan et al., 2017). Multiple factors could differentiate the attraction behavior found in our study to response of other cetaceans to kayaks. Kayaks produce minimal noise and may surprise cetaceans by getting close before they are detected resulting in avoidance behaviors in whales (Gregory and Rowden, 2001; Sullivan and Torres, 2018). Williams et al. (2011) found that southern resident killer whales (Orcinus orca) reduced feeding and increased traveling behaviors when kayaks were present. Of the cetacean populations studied with respect to response to kayaks, difference in behavioral responses could be related to population health, population size, or the degree of sociality of the species. While the Western Hudson Bay beluga population is classified as not at risk by the Committee on the Status of Endangered Wildlife in Canada (COSEWIC) the southern resident killer whale population is classified as endangered (COSEWIC, 2008; COSEWIC, 2020).
Behavioral responses by whales to vessels can change over time. After a decade, Burrunan dolphins (Tursiops australis) increased both avoidance (10.8% to 56.5%) and approach (3.3% to 10%) behaviors to vessels (Filby et al., 2014). Reduced behavioral response over time is generally classified as habituation, but in extreme circumstances could also be caused by reduced ability to respond due to decreased fitness (Lusseau and Bejder, 2007). For instance, if tourism activities overlap with essential feeding grounds for cetaceans, the cost of avoidance or fleeing the area over consistent occurrences could be too high for whales to continue exhibiting the same behaviors (Bejder et al., 2006a; Lusseau and Bejder, 2007). Fewer observations of belugas fleeing or diving to avoid tourist vessels over a 16 year period may be evidence of habituation to vessel presence in the White Sea, Russia (Krasnova et al., 2020). Whale-watching with kayaks, motorboats, and Zodiacs has been ongoing in the Churchill River estuary for decades (Malcolm and Penner, 2011), however paddleboards were added as a personal watercraft whale-watching option in 20153. Beluga avoidance to paddleboards in the estuary may be because there has not been time for habituation to occur.
To our knowledge, this is the first paper to record interactions between paddleboards and belugas. When observing dolphin reactions to recreational activities including paddleboards, Fandel et al. (2015) recorded neutral responses 61.93% of the time. Even though the closest distance between a beluga and a paddleboard in our study was 4.6 m, the overall response of belugas to paddleboards was avoidance. Paddleboards are less mobile than kayaks and more difficult to maneuver, which limits their ability to approach belugas. It is possible the differences between the physical and acoustic characteristics of kayaks and paddleboards contributed to the difference in beluga response. Paddleboards used in the Churchill River estuary were grey, while kayaks used for tourism in the Churchill estuary were lighter colors of bright yellow or green. While kayakers remain seated, paddleboarders are standing resulting in a higher profile which might affect the way belugas perceive the paddleboard. Paddleboards are not able to move as quickly as kayaks and may make less splashing noises as they have one paddle opposed to two. It is not clear how well belugas can see outside of the water, but the visual cues including color and vessel profile, may result in a similarity between paddleboards and killer whales. These factors in addition to movement patterns of personal watercraft could contribute to beluga response in the Churchill River estuary.
One alternative explanation for avoidance to paddleboards found in the Churchill River estuary may be related to the large number of paddleboards found in close proximity to each other. Greater intensity of behavioral responses with increasing numbers of vessels has been observed in humpback whales (Schuler et al., 2019; Amrein et al., 2020), killer whales (Williams et al., 2009), Risso’s dolphins (Grampus griseus) (Visser et al., 2011), Hawaian spinner dolphins (Stenella longirostris) (Timmel et al., 2008), dusky dolphins (Lagenorhynchus obscurus) (Lundquist et al., 2013a) and bottlenose dolphins (Tursiops spp.) (Constantine et al., 2004; Stensland and Berggren, 2007; Steckenreuter et al., 2012; Pirotta et al., 2015). Paddleboards in the Churchill River estuary are often in clumped groups likely due to their limited mobility. Kayaks are also found in larger groups; however, kayaks are not avoided by belugas. Large numbers of vessels occur because personal watercraft tour operators take advantage of the 3-hour low tide period when currents are calmer in the Churchill River estuary. As large groups of vessels are often present in the Churchill River estuary during low tides, variation in beluga response with increasing numbers of vessels should be further investigated. The year this study was conducted was a light tourism year due to COVID 19 restrictions, therefore it is expected that vessel numbers will be higher in the future and results may differ.
It has been hypothesized that cetaceans avoid motorized boats due to their noise production, which can mask calls and interfere with communication or feeding (Lesage et al., 1999; Scarpaci et al., 2000; Erbe, 2002; Nowacek et al., 2007; Holt et al., 2009; Pirotta et al., 2015). The neutral response of belugas to motorboats and Zodiacs observed in this study, however, appears contrary to this hypothesis. The closest beluga to a motorboat was 49.6 m, and the closest beluga to a Zodiac was 8.5 m. Only 3 belugas were within 25 m of a Zodiac and 17 were within 50 m. Of the 43 motorboats in photos with belugas, 8 were of our science vessel taking georeferencing points, 2 were of the same smaller motorboat that appears to be operated by Churchill residents, and 33 were the Polar Bears International (PBI) vessel, recording beluga whale video footage for beluga research4. When the PBI vessel was in the estuary the operator would drive the motorboat to one end of the estuary then turn off the engine and float to the other end with the tide. It is possible that the neutral response of belugas to motorboats is related to lack of noise from motorboats with the engine off, which is common in the estuary. This may also be a contributing factor to the response to Zodiacs, as most Zodiacs were in the estuary to supervise kayaks and paddleboards and would spend most of the time with their engine off.
Of 2,005 vessel-beluga distances recorded 90 (4.5%) were located within the 50 m approach distance to belugas allowed by Marine Mammal Regulations in the Churchill River estuary (Regulations Amending the Marine Mammal Regulations. SOR/2018-126, 2018). There is evidence that increased proximity of vessels to whales may result in increased negative behavioral reactions (Steckenreuter et al., 2012; Schaffar et al., 2013; Currie et al., 2021). With decreasing distance to vessels, southern resident killer whales showed increases in respiration interval and path deviation as well as exhibiting more surface behaviors (Noren et al., 2009; Williams et al., 2009). Within 100 m of vessels, humpback whales were more likely to exhibit avoidance behaviors (Stamation et al., 2010). In the White Sea, less behavioral changes were noted when vessels were further away from belugas (Krasnova et al., 2020). The Churchill River estuary is a popular ecotourism and research destination, with projected increases in visitors over time for the unique opportunities (Malcolm and Penner, 2011). With this in mind, impacts of proximity and quantity of vessels in the estuary are important factors to consider with respect to beluga response as well as population health.
Results from this paper show responses of belugas differ by vessel type in the Churchill River estuary. This is different from conclusions drawn by Malcolm and Penner (2011) who found that belugas are ‘interactive’ with tourist vessels regardless of type, based on findings that beluga observed in close proximity to vessels (<25 m to motorboats, within 100 m for kayaks and snorkeling vessels) displayed behaviors such as moving towards the vessels, swimming alongside vessels, investigating vessels or blowing bubbles. Responses to different vessel types have been varied in gray whales (Eschrichtius robustus) in Oregon, relative to feeding behavior with distance from kayaks and distance from motorboats (Sullivan and Torres, 2018). Southern resident killer whales also differed in responses to whale-watching depending on vessel type and approach distances (Noren et al., 2009; Williams et al., 2009). Bottlenose dolphins (Tursiops truncates) in West Wales exhibited attraction, avoidance, and neutral behavior in different proportions depending on vessel type (kayak, speeding boat, fishing boat, sailing boat) (Gregory and Rowden, 2001).
Determining the population level impact of whale watching is complicated because the relationship between short-term behavioral responses and fitness is unknown (New et al., 2015). We documented attraction and avoidance by belugas with respect to kayaks and paddleboards. Avoidance could cause stress (Orams, 2004; New et al., 2015), and may be similar to predator avoidance (Frid and Dill, 2002; Williams et al., 2002; Lusseau, 2003b). Higher respiration rate in addition to other behaviors that accompany avoidance could negatively impact whale energy reserves (Christiansen et al., 2014). By avoiding paddleboards, belugas may also lose opportunities to access habitat benefits hypothesized for estuary occupation, including access to prey. Reduced feeding is often recorded as a cetacean response to vessels (Williams et al., 2006; Stockin et al., 2008; Arcangeli and Crosti, 2009; Lusseau et al., 2009; Williams et al., 2011; Dans et al., 2012; Steckenreuter et al., 2012; Christiansen et al., 2013b; Pirotta et al., 2015), which can reduce energy intake, especially if vessels are occupying areas that are necessary for feeding (Senigaglia et al., 2016).
Using a time-lapse camera system, we were able to photograph 2,261 belugas in 16 days on the Churchill River estuary. The use of georeferencing points and trigonometric equations allowed us to determine the distance between belugas and vessels. We found that belugas were located closer to kayaks (attraction), further from paddleboards (avoidance), and no closer or further from motorboats and Zodiacs (neutral) than would be expected. Considering these results in beluga response to vessels, and numerous observations of belugas approaching vessels to interact by Malcolm and Penner (2011), distance-based restrictions for whale-watching management in the Churchill estuary may not be the most appropriate management approach. Instead, we suggest that zones with different levels of protection be defined during the establishment of a National Marine Conservation Area (Villa et al., 2002; Ashe et al., 2010; Gray et al., 2010; Manitoba western Hudson Bay ad hoc beluga habitat sustainability plan committee, 2016; Giakoumi et al., 2018; Ménard et al., 2022). These zones would limit vessel traffic (number or time present) in areas of critical beluga habitat. Studies will be required to define critical beluga habitat as this was not considered in our study. The economic and ecological benefits of enhanced beluga-human interaction should also be considered.
Issues of whale conservation and management require clear defensible scientific data upon which policies and procedures can be developed. Climate variability and change and other pressures on Arctic flora and fauna can also affect relationships measured here. We suggest additional monitoring of whale-vessel interactions to support species management in this unique sub-Arctic estuary. The beluga tourism industry in Churchill, Manitoba has many stakeholders. As such, it is important to consider the impact of this industry on the health of the beluga population, the local economy, and the tourists themselves. The ecotourism and whale-watching industry is an important source of jobs and income in Churchill, Manitoba. The estimated economic impact of beluga tourism was $1,344,052 CAD for Northern Manitoba in 2014, with 60 direct full and part time jobs for residents (The Churchill Beluga Whale Tour Operators Association et al., 2015). Ecotourism can be a tool to educate participants about whale conservation (García-Cegarra and Pacheco, 2017; Cárdenas et al., 2021), and the uniqueness of this sub-Arctic environment could increase awareness on how climate change affects iconic species. Tourism vessel impacts on belugas in the Churchill River estuary will be an important factor for decisions with respect to the establishment of a National Marine Conservation Area. We also recommend monitoring the relationships found in this study to ascertain their stability with changes in numbers and types of vessels through time.
The raw data supporting the conclusions of this article will be made available by the authors, without undue reservation.
Ethical review and approval was not required for the animal study because data on whales was collected using photography from shore only, which has no disturbance effects on the whales and no impacts on whale habitat.
EA, MM, and DB contributed to the conceptualization and design of the study. EA collected data, reviewed photos, and developed the equations for distance measurements. EA and WC explored oblique photo measurements, and calibrated distance measurement equations. EA wrote the first draft of the manuscript. MM and DB supervised the project. All authors contributed to manuscript revision and reviewed and approved the submitted version. DB and MM acquired funding for the project.
This work was supported by and NSERC discovery and Canada research chair grants to DB as well as funding from the Department of Fisheries and Oceans.
Logistical support was provided by the Churchill Northern Studies Centre (CNSC). Thanks also to the Port of Churchill and the town of Churchill for support throughout this work. Thanks to Dr. David Walker for advice and recommendations for detection functions. Thanks to Dr. Alex Crawford for assistance with R code. This is a contribution to the Arctic Science Partnership and ArcticNet, a Network of Centres of Excellence Canada. Additionally, we dedicate this article to DB who passed before publication of this article. DB had a meaningful impact on this research and on his co-authors through his ideas and mentorship and is greatly missed.
The authors declare that the research was conducted in the absence of any commercial or financial relationships that could be construed as a potential conflict of interest.
All claims expressed in this article are solely those of the authors and do not necessarily represent those of their affiliated organizations, or those of the publisher, the editors and the reviewers. Any product that may be evaluated in this article, or claim that may be made by its manufacturer, is not guaranteed or endorsed by the publisher.
The Supplementary Material for this article can be found online at: https://www.frontiersin.org/articles/10.3389/fmars.2022.837425/full#supplementary-material
Amrein A. M., Guzman H. M., Surrey K. C., Polidoro B., Gerber L. R. (2020). Impacts of whale watching on the behavior of humpback whales (Megaptera novaeangliae) in the coast of Panama. Front. Mar. Sci. 7. doi: 10.3389/fmars.2020.601277
Arcangeli A., Crosti R. (2009). The short-term impact of dolphin-watching on the behavior of bottlenose dolphins (Tursiops truncatus) in western Australia. J. Mar. Anim. Their. Ecol. 2, 3–9.
Argüelles M. B., Coscarella M., Fazio A., Bertellotti M. (2016). Impact of whale-watching on the short-term behavior of southern right whales (Eubalaena australis) in Patagonia, Argentina. Tour. Manage. Perspect. 18, 118–124. doi: 10.1016/j.tmp.2016.02.002
Arias M., Coscarella M. A., Romero M. A., Svendsen G. M., Reinaldo M. O., Curcio N. S., et al. (2018). Impact of whale-watching on southern right whale (Eubalaena australis) in Patagonia: Assessing the effects from its beginnings in the context of population growth. Tour. Manage. Perspect. 27, 1–9. doi: 10.1016/j.tmp.2018.03.005
Ashe E., Noren D. P., Williams R. (2010). Animal behaviour and marine protected areas: Incorporating behavioural data into the selection of marine protected areas for an endangered killer whale population. Anim. Conserv. 13, 196–203. doi: 10.1111/j.1469-1795.2009.00321.x
Avila I. C., Correa L. M., Parsons E. C. M. (2015). Whale-watching activity in bahía málaga, on the pacific coast of Colombia, and its effect on humpback whale (Megaptera novaeangliae) behavior. Tour. Mar. Environ. 11, 19–32. doi: 10.3727/154427315X14398263718394
Bejder L., Dawson S. M., Harraway J. A. (1999). Responses by hector’s dolphins to boats and swimmers in porpoise bay, new Zealand. Mar. Mammal. Sci. 15, 738–750. doi: 10.1111/j.1748-7692.1999.tb00840.x
Bejder L., Samuels A., Whitehead H., Gales N. (2006a). Interpreting short-term behavioural responses to disturbance within a longitudinal perspective. Anim. Behav. 72, 1149–1158. doi: 10.1016/j.anbehav.2006.04.003
Bejder L., Samuels A., Whitehead H., Gales N., Mann J., Connor R., et al. (2006b). Decline in relative abundance of bottlenose dolphins exposed to long-term disturbance. Conserv. Biol. 20, 1791–1798. doi: 10.1111/j.1523-1739.2006.00540.x
Blane J. M., Jaakson R. (1994). The impact of ecotourism boats on the St Lawrence beluga whales. Environ. Conserv. 21, 267–269. doi: 10.1017/S0376892900033282
Cárdenas S., Gabela-Flores M. V., Amrein A., Surrey K., Gerber L. R., Guzmán H. M. (2021). Tourist knowledge, pro-conservation intentions, and tourist concern for the impacts of whale-watching in las perlas archipelago, Panama. Front. Mar. Sci. 8. doi: 10.3389/fmars.2021.627348
Caron L. M. J., Smith T. G. (1990). “Philopatry and site tenacity of belugas, delphinapterus leucas, hunted by the Inuit at the nastapoka estuary, eastern Hudson bay,” in Advances in research on the beluga whale, delphinapterus leucas. Eds. Smith T. G., Aubin D.J.St., Geraci J. R. (Can. Bull. Aquat. Sci), 69–79.
Chernetsky A. D., Krasnova V. V., Bel’kovich V. M. (2011). Studies of the structure of the solovetsky reproductive gathering of beluga whales (Delphinapterus leucas) in the white Sea using the photo identification method. Oceanology 51, 275–280. doi: 10.1134/S0001437011020044
Christiansen F., Rasmussen M. H., Lusseau D. (2013a). Inferring activity budgets in wild animals to estimate the consequences of disturbances. Behav. Ecol. 24, 1415–1425. doi: 10.1093/beheco/art086
Christiansen F., Rasmussen M., Lusseau D. (2013b). Whale watching disrupts feeding activities of minke whales on a feeding ground. Mar. Ecol. Prog. Ser. 478, 239–251. doi: 10.3354/meps10163
Christiansen F., Rasmussen M. H., Lusseau D. (2014). Inferring energy expenditure from respiration rates in minke whales to measure the effects of whale watching boat interactions. J. Exp. Mar. Bio. Ecol. 459, 96–104. doi: 10.1016/j.jembe.2014.05.014
Constantine R. (2001). Increased avoidance of swimmers by wild bottlenose dolphins (Tursiops truncatus) due to long-term exposure to swim-with-dolphin tourism. Mar. Mammal. Sci. 17, 689–702. doi: 10.1111/j.1748-7692.2001.tb01293.x
Constantine R., Brunton D. H., Dennis T. (2004). Dolphin-watching tour boats change bottlenose dolphin (Tursiops truncatus) behaviour. Biol. Conserv. 117, 299–307. doi: 10.1016/j.biocon.2003.12.009
Corkeron P. J. (1995). Humpback whales (Megaptera novaeangliae) in hervey bay, Queensland: behaviour and responses to whale-watching vessels. Can. J. Zool. 73, 1290–1299. doi: 10.1139/z95-153
Coscarella M. A., Dans S. L., Crespo E. A., Pedraza S. N. (2003). Potential impact of dolphin watching unregulated activities in Patagonia. J. Cetacean. Res. Manage. 5, 77–84.
COSEWIC (2008) COSEWIC Assessment and Update Status Report on the Killer Whale (Orcinus orca): Southern resident population, Northern resident population, West Coast transient population, Offshore population, Northwest Atlantic/Eastern Arctic population in Canada. Committee on the Status of Endangered Wildlife in Canada. Available at: www.sararegistry.gc.ca/status/status_e.cfm.
COSEWIC (2014). OSEWIC Assessment and update status report on the beluga whale Delphinapterus leucas, St. Lawrence Estuary population, in Canada. Ottawa: Committee on the Status of Endangered Wildlife in Canada (Ottawa). Available at: www.registrelepsararegistry.gc.ca/default_e.cfm.
COSEWIC (2020). COSEWIC Assessment and Status Report on the Beluga Whale (Delphinapterus leucas), Eastern High Arctic - Baffin Bay population, Cumberland Sound population, Ungava Bay population, Western Hudson Bay population, Eastern Hudson Bay population and James Bay population in Canada. Ottawa: Committee on the Status of Endangered Wildlife in Canada (Ottawa). Available at: https://www.canada.ca/en/environment-climate-change/services/species-risk-public-registry.html.
Currie J. C., McCordic J. A., Olson G. L., Machernis A. F., Stack S. H. (2021). The impact of vessels on humpback whale behavior: The benefit of added whale watching guidelines. Front. Mar. Sci. 8. doi: 10.3389/fmars.2021.601433
Dans S. L., Degrati M., Pedraza S. N., Crespo E. A. (2012). Effects of tour boats on dolphin activity examined with sensitivity analysis of Markov chains. Conserv. Biol. 26, 708–716. doi: 10.1111/j.1523-1739.2012.01844.x
Erbe C. (2002). Underwater noise of whale-watching boats and potential effects on killer whales (Orcinus orca), based on an acoustic impact model. Mar. Mammal. Sci. 18, 394–418. doi: 10.1111/j.1748-7692.2002.tb01045.x
Fandel A. D., Bearzi M., Cook T. C. (2015). Effects of ocean recreational users on coastal bottlenose dolphins (Tursiops truncatus) in the Santa Monica bay, California. Bull. South. Calif. Acad. Sci. 114, 63–75. doi: 10.3160/0038-3872-114.2.63
Filby N. E., Stockin K. A., Scarpaci C. (2014). Long-term responses of burrunan dolphins (Tursiops australis) to swim-with dolphin tourism in port phillip bay, Victoria, Australia: A population at risk. Glob. Ecol. Conserv. 2, 62–71. doi: 10.1016/j.gecco.2014.08.006
Fiori L., Martinez E., Orams M. B., Bollard B. (2019). Effects of whale-based tourism in vava’u, kingdom of Tonga: Behavioural responses of humpback whales to vessel and swimming tourism activities. PLoS One 14, 1–21. doi: 10.1371/journal.pone.0219364
Frid A., Dill L. (2002). Human-caused disturbance stimuli as a form of predation risk. Ecol. Soc 6. doi: 10.5751/ES-00404-060111
García-Cegarra A. M., Pacheco A. S. (2017). Whale-watching trips in Peru lead to increases in tourist knowledge, pro-conservation intentions and tourist concern for the impacts of whale-watching on humpback whales. Aquat. Conserv. Mar. Freshw. Ecosyst. 27, 1011–1020. doi: 10.1002/aqc.2754
Giakoumi S., McGowan J., Mills M., Beger M., Bustamante R. H., Charles A., et al. (2018). Revisiting “success” and “failure” of marine protected areas: A conservation scientist perspective. Front. Mar. Sci. 5. doi: 10.3389/fmars.2018.00223
Gleason C., Parsons E. C. M. (2019). Recent advances in whale-watching research: 2018-2019. Tour. Mar. Environ. 14, 199–210. doi: 10.3727/154427319X15645796379985
Gray D. L., Canessa R., Rollins R., Keller C. P., Dearden P. (2010). Incorporating recreational users into marine protected area planning: A study of recreational boating in British Columbia, Canada. Environ. Manage. 46, 167–180. doi: 10.1007/s00267-010-9479-1
Gregory P., Rowden A. (2001). Behaviour patterns of bottlenose dolphins (Tursiops truncatus) relative to tidal state, time-of-day, and boat traffic in Cardigan bay, West Wales. Aquat. Mamm. 27, 105–113.
Hansen S. E. (1988). White whale (Delphinapterus leucas) distribution and abundance in relation to water temperature, salinity, and turbidity in the Churchill river estuary. [master’s thesis] (Sudsbury (ON: Laurentian University).
Havens K. J., Sharp E. J. (2015). “Thermal imagers and system considerations,” in Thermal imaging techniques to survey and monitor animals in the wild: a methodology (Academic press), 101–117. doi: 10.4135/9781412939591.n1073
Hastie G. D., Wilson B., Tufft L. H., Thompson P. M. (2003). Bottlenose dolphins increase breathing synchrony in response to boat traffic. Mar. Mammal. Sci. 19, 74–084. doi: 10.1111/j.1748-7692.2003.tb01093.x
Heenehan H. L., Van Parijs S. M., Bejder L., Tyne J. A., Johnston D. W. (2017). Differential effects of human activity on Hawaiian spinner dolphins in their resting bays. Glob. Ecol. Conserv. 10, 60–69. doi: 10.1016/j.gecco.2017.02.003
Hoarau L., Dalleau M., Delaspre S., Barra T., Landes A.-E. (2020). Assessing and mitigating humpback whale (Megaptera novaeangliae) disturbance of whale-watching activities in reunion island. Tour. Mar. Environ. 15, 173–189. doi: 154427320X15943326793398
Höhle J. (2008). Photogrammetric measurements in oblique aerial images. Photogramm. Fernerkundung. Geoinf. 1, 7–14.
Holt M. M., Noren D. P., Veirs V., Emmons C. K., Veirs S. (2009). Speaking up: Killer whales (Orcinus orca) increase their call amplitude in response to vessel noise. J. Acoust. Soc Am. 125, EL27. doi: 10.1121/1.3040028
Hurlbert S. H. (1984). Pseudoreplication and the design of ecological field experiments. Ecol. Monogr. 54, 187–211. doi: 10.2307/1942661
Idle P. D. (1989). Temporal aspects of beluga, delphinapterus leucas, behaviour in the Churchill river estuary. [master’s thesis] (Sudsbury (ON: Laurentian University).
Jelinski D. E., Krueger C. C., Duffus D. A. (2002). Geostatistical analyses of interactions between killer whales (Orcinus orca) and recreational whale-watching boats. Appl. Geogr. 22, 393–411. doi: 10.1016/S0143-6228(02)00051-6
Krasnova V. V., Prasolova E. A., Belikov R. A., Chernetsky A. D., Panova E. M. (2020). Influence of boat tourism on the behaviour of solovetskiy beluga whales (Delphinapterus leucas) in Onega bay, the white Sea. Aquat. Conserv. Mar. Freshw. Ecosyst. 1–12. 1922-1933 doi: 10.1002/aqc.3369
Kruse S. (1991). “The interactions between killer whales and boats in Johnstone strait, B.C,” in Dolphin societies: Discoveries and puzzles. Eds. Pryor K., Norris K. S. (Berkeley: University of California Press), 148–160.
Lemon M., Lynch T. P., Cato D. H., Harcourt R. G. (2006). Response of travelling bottlenose dolphins (Tursiops aduncus) to experimental approaches by a powerboat in Jervis bay, new south Wales, Australia. Biol. Conserv. 127, 363–372. doi: 10.1016/j.biocon.2005.08.016
Lesage V., Barrette C., Kingsley M. C. S., Sjare B. (1999). The effect of vessel noise on the vocal behavior of belugas in the st. Lawrence river estuary, Canada. Mar. Mammal. Sci. 15, 65–84. doi: 10.1111/j.1748-7692.1999.tb00782.x
Lundquist D., Gemmell N. J., Würsig B., Markowitz T. (2013a). Dusky dolphin movement patterns: Short-term effects of tourism. New Zeal. J. Mar. Freshw. Res. 47, 430–449. doi: 10.1080/00288330.2013.778301
Lundquist D., Sironi M., Würsig B., Rowntree V., Martino J., Lundquist L. (2013b). Response of southern right whales to simulated swim-with-whale tourism at península valdés, Argentina. Mar. Mammal. Sci. 29, E24–E45. doi: 10.1111/j.1748-7692.2012.00583.x
Lusseau D. (2003a). Effects of tour boats on the behavior of bottlenose dolphins: Using Markov chains to model anthropogenic impacts. Conserv. Biol. 17, 1785–1793. doi: 10.1111/j.1523-1739.2003.00054.x
Lusseau D. (2003b). Male And female bottlenose dolphins tursiops spp. have different strategies to avoid interactions with tour boats in doubtful sound, new Zealand. Mar. Ecol. Prog. Ser. 257, 267–274. doi: 10.3354/meps257267
Lusseau D. (2006). The short-term behavioral reactions of bottlenose dolphins to interactions with boats in doubtful sound, new Zealand. Mar. Mammal. Sci. 22, 802–818. doi: 10.1111/j.1748-7692.2006.00052.x
Lusseau D., Bain D. E., Williams R., Smith J. C. (2009). Vessel traffic disrupts the foraging behavior of southern resident killer whales orcinus orca. Endanger. Species. Res. 6, 211–221. doi: 10.3354/esr00154
Lusseau D., Bejder L. (2007). The long-term consequences of short-term responses to disturbance experiences from whalewatching impact assessment. Int. J. Comp. Psychol. 20, 228–236.
Lusseau D., Lusseau S. M., Bejder L., Williams R. (2006). An individual-based model to infer the impact of whalewatching on cetacean population dynamics. 58th Int. Whal. Commun., 1–19.
Magalhães S., Prieto R., Silva M. A., Gonçalves J., Afonso-Dias M., Santos S. (2002). Short-term reactions of sperm whales (Physeter macrocephalus) to whale-watching vessels in the Azores. Aquat. Mamm. 28, 267–274.
Malcolm C. D., Penner H. C. (2011). “Behavior of belugas in the presence of whale-watching vessels in Churchill, Manitoba and recommendations for local beluga-watching activities,” in Polar tourism: human, environmental and governance dimensions. Eds. Maher P. T., Stewart E. J., Lück M. (New York: Cognizant Communication Corporation), 54–79.
Mangott A. H., Birtles R. A., Marsh H. (2011). Attraction of dwarf minke whales balaenoptera acutorostrata to vessels and swimmers in the great barrier reef world heritage area - the management challenges of an inquisitive whale. J. Ecotourism. 10, 64–76. doi: 10.1080/14724041003690468
Manitoba western Hudson Bay ad hoc beluga habitat sustainability plan committee (2016). Manitoba’s beluga habitat sustainability plan. Manitoba Conserv. water Steward., 30. Available at: https://gov.mb.ca/conservation/wildlife/pdf/belugastrategy.pdf
Matthews C. J. D., Watt C. A., Asselin N. C., Dunn J. B., Young B. G., Montsion L. M., et al. (2017). Estimated abundance of the Western Hudson bay beluga stock from the 2015 visual and photographic aerial survey. Fish. Ocean. Canada. Can. Sci. Advis. Secr. Res. Doc. 061, 20.
Ménard N., Turgeon S., Conversano M., Martins C. C. A. (2022). Sharing the waters: Application of a marine spatial planning approach to conserve and restore the acoustic habitat of endangered beluga whales (Delphinapterus leucas) in and around the saguenay–st. Lawrence marine park. Mar. pollut. Bull. 175, 113325. doi: 10.1016/j.marpolbul.2022.113325
New L. F., Hall A. J., Harcourt R., Kaufman G., Parsons E. C. M., Pearson H. C., et al. (2015). The modelling and assessment of whale-watching impacts. Ocean. Coast. Manage. 115, 10–16. doi: 10.1016/j.ocecoaman.2015.04.006
Noren D. P., Johnson A. H., Rehder D., Larson A. (2009). Close approaches by vessels elicit surface active behaviors by southern resident killer whales. Endanger. Species. Res. 8, 179–192. doi: 10.3354/esr00205
Nowacek D. P., Thorne L. H., Johnston D. W., Tyack P. L. (2007). Responses of cetaceans to anthropogenic noise. Mamm. Rev. 37, 81–115. doi: 10.1111/j.1365-2907.2007.00104.x
O’Corry-Crowe G., Suydam R., Quakenbush L., Smith T. G., Lydersen C., Kovacs K. M., et al. (2020). Group structure and kinship in beluga whale societies. Sci. Rep. 10, 1–21. doi: 10.1038/s41598-020-67314-w
Orams M. (2004). Why dolphins may get ulcers: Considering the impacts of cetacean-based tourism in new Zealand. Tour. Mar. Environ. 1, 1–12. doi: 10.3727/154427304774865878
Paiva E. G., Salgado-Kent C., Gagnon M. M., Parnum I., McCauley R. (2015). An assessment of the effectiveness of high definition cameras as remote monitoring tools for dolphin ecology studies. PloS One 10, 1–21. doi: 10.1371/journal.pone.0126165
Pirotta E., Merchant N. D., Thompson P. M., Barton T. R., Lusseau D. (2015). Quantifying the effect of boat disturbance on bottlenose dolphin foraging activity. Biol. Conserv. 181, 82–89. doi: 10.1016/j.biocon.2014.11.003
R Core Team (2021) R: A language and environment for statistical computing. Available at: https://www.r-project.org/.
Richter C., Dawson S., Slooten E. (2006). Impacts of commercial whale watching on male sperm whales at kaikoura, new Zealand. Mar. Mammal. Sci. 22, 46–63. doi: 10.1111/j.1748-7692.2006.00005.x
Rowcliffe J. M., Carbone C., Jansen P. A., Kays R., Kranstauber B. (2011). Quantifying the sensitivity of camera traps: An adapted distance sampling approach. Methods Ecol. Evol. 2, 464–476. doi: 10.1111/j.2041-210X.2011.00094.x
Santos-Carvallo M., Barilari F., Pérez-Alvarez M. J., Gutiérrez L., Pavez G., Araya H., et al. (2021). Impacts of whale-watching on the short-term behavior of fin whales (Balaenoptera physalus) in a marine protected area in the southeastern pacific. Front. Mar. Sci. 8. doi: 10.3389/fmars.2021.623954
Scarpaci C., Bigger S., Corkeron P., Nugegoda D. (2000). Bottlenose dolphins (Tursiops truncatus) increase whistling in the presence of “swim-with dolphin” tour operators. J. Cetacean. Res. Manage. 2, 183–185.
Schaffar A., Madon B., Garrigue C., Constantine R. (2013). Behavioural effects of whale-watching activities on an endangered population of humpback whales wintering in new Caledonia. Endanger. Species. Res. 19, 245–254. doi: 10.3354/esr00466
Scheidat M., Castro C., González J., Williams R. (2004). Behavioural responses of humpback whales (Megaptera novaeangliae) to whalewatching boats near isla de la plata, machalilla national park, Ecuador. J. Cetacean. Res. Manage. 6, 1–6.
Schuler A. R., Piwetz S., Di Clemente J., Steckler D., Mueter F., Pearson H. C. (2019). Humpback whale movements and behavior in response to whale-watching vessels in Juneau, AK. Front. Mar. Sci. 6. doi: 10.3389/fmars.2019.00710
Senigaglia V., Christiansen F., Bejder L., Gendron D., Lundquist D., Noren D. P., et al. (2016). Meta-analyses of whale-watching impact studies: Comparisons of cetacean responses to disturbance. Mar. Ecol. Prog. Ser. 542, 251–263. doi: 10.3354/meps11497
Sergeant D. E. (1973). Biology of white whales (Delphinapterus leucas) in Western Hudson bay. J. Fish. Res. Board. Canada. 30, 1065–1090. doi: 10.1139/f73-178
Sergeant D. E., Brodie P. F. (1969). Body size in white whales, delphinapterus leucas. J. Fish. Res. Board. Canada. 26, 2561–2580. doi: 10.1139/f69-251
Smith A. J. (2007). Beluga whale (Delphinapterus leucas) use of the nelson river estuary, Hudson bay. [master’s thesis] (Winnipeg (MB: University of Manitoba).
Sousa-Lima R. S., Clark C. W. (2008). Modeling the effect of boat traffic on the fluctuation of humpback whale singing activity in the abrolhos national marine park, Brazil. Can. Acoust. - Acoust. Can. 36, 174–181.
Stamation K. A., Croft D. B., Shaughnessy P. D., Waples K. A., Briggs S. V. (2010). Behavioral responses of humpback whales (Megaptera novaeangliae) to whale-watching vessels on the southeastern coast of Australia. Mar. Mammal. Sci. 26, 98–122. doi: 10.1111/j.1748-7692.2009.00320.x
St. Aubin D. J., Smith T. G., Geraci J. R. (1990). Seasonal epidermal molt in beluga whales, delphinapterus leucas. Can. J. Zool. 68, 359–367. doi: 10.1139/z90-051
Steckenreuter A., Möller L., Harcourt R. (2012). How does australia’s largest dolphin-watching industry affect the behaviour of a small and resident population of indo-pacific bottlenose dolphins? J. Environ. Manage. 97, 14–21. doi: 10.1016/j.jenvman.2011.11.002
Stensland E., Berggren P. (2007). Behavioural changes in female indo-pacific bottlenose dolphins in response to boat-based tourism. Mar. Ecol. Prog. Ser. 332, 225–234. doi: 10.3354/meps332225
Stockin K. A., Lusseau D., Binedell V., Wiseman N., Orams M. B. (2008). Tourism affects the behavioural budget of the common dolphin delphinus sp. in the hauraki gulf, new Zealand. Mar. Ecol. Prog. Ser. 355, 287–295. doi: 10.3354/meps07386
Sullivan F. A., Torres L. G. (2018). Assessment of vessel disturbance to gray whales to inform sustainable ecotourism. J. Wildl. Manage. 82, 896–905. doi: 10.1002/jwmg.21462
The Churchill Beluga Whale Tour Operators Association, Manitoba, and Town of Churchill (2015). Impacts of proposed federal marine mammal regulations on the world renowned Churchill Manitoba beluga tourism experience and a proposal for cooperative managment of this valued resource. 1–30.
Timmel G., Courbis S., Sargeant-Green H., Markowitz H. (2008). Effects of human traffic on the movement patterns of Hawaiian spinner dolphins (Stenella longirostris) in kealakekua bay, Hawaii. Aquat. Mamm. 34, 402–411. doi: 10.1578/AM.34.4.2008.402
Tosi C. H., Ferreira R. G. (2009). Behavior of estuarine dolphin, sotalia guianensis (Cetacea, delphinidae), in controlled boat traffic situation at southern coast of Rio grande do norte, Brazil. Biodivers. Conserv. 18, 67–78. doi: 10.1007/s10531-008-9435-z
Tyrrell M. (2007). Sentient beings and wildlife resources: Inuit, beluga whales and management regimes in the Canadian arctic. Hum. Ecol. 35, 575–586. doi: 10.1007/s10745-006-9105-2
Vermeulen E., Cammareri A., Holsbeek L. (2012). Alteration of southern right whale (Eubalaena australis) behaviour by human-induced disturbance in bahía San Antonio, Patagonia, Argentina. Aquat. Mamm. 38, 56–64. doi: 10.1578/AM.38.1.2012.56
Villa F., Tunesi L., Agardy T. (2002). Zoning marine protected areas through spatial multiple-criteria analysis: The case of the asinara island national marine reserve of Italy. Conserv. Biol. 16, 515–526. doi: 10.1046/j.1523-1739.2002.00425.x
Visser F., Hartman K. L., Rood E. J. J., Hendriks A. J. E., Zult D. B., Wolff W. J., et al. (2011). Risso’s dolphins alter daily resting pattern in response to whale watching at the Azores. Mar. Mammal. Sci. 27, 366–381. doi: 10.1111/j.1748-7692.2010.00398.x
Wickham H. (2016). ggplot2: Elegant graphics for data analysis (New York). Available at: https://ggplot2.tidyverse.org.
Wickham H. (2021) Tidyr: Tidy messy data. Available at: https://cran.r-project.org/package=tidyr.
Williams R., Ashe E., Sandilands D., Lusseau D. (2011). Stimulus-dependent response to disturbance affecting the activity of killer whales. Sci. Commun. Int. Whal. Commun., 1–27. http://iwcoffice.co.uk/_documents/sci_com/SC63docs/SC-63-WW5.pdf.
Williams R., Bain D. E., Smith J. C., Lusseau D. (2009). Effects of vessel on behaviour patterns of individual southern resident killer whales orcinus orca. Endanger. Species. Res. 6, 199–209. doi: 10.3354/esr00150
Williams R., Lusseau D., Hammond P. S. (2006). Estimating relative energetic costs of human disturbance to killer whales (Orcinus orca). Biol. Conserv. 133, 301–311. doi: 10.1016/j.biocon.2006.06.010
Keywords: photogrammetry, whale-watching, ecotourism, time-lapse camera, beluga whale
Citation: Ausen EL, Marcoux M, Chan WS and Barber DG (2022) Beluga (Delphinapterus leucas) response to personal watercraft and motorized whale watching vessels in the Churchill River estuary. Front. Mar. Sci. 9:837425. doi: 10.3389/fmars.2022.837425
Received: 16 December 2021; Accepted: 01 July 2022;
Published: 03 August 2022.
Edited by:
Lori Quakenbush, Alaska Department of Fish and Game, United StatesReviewed by:
Yujiang Hao, Institute of Hydrobiology (CAS), ChinaCopyright © 2022 Ausen, Marcoux, Chan and Barber. This is an open-access article distributed under the terms of the Creative Commons Attribution License (CC BY). The use, distribution or reproduction in other forums is permitted, provided the original author(s) and the copyright owner(s) are credited and that the original publication in this journal is cited, in accordance with accepted academic practice. No use, distribution or reproduction is permitted which does not comply with these terms.
*Correspondence: Emma L. Ausen, ZW1tYWF1c2VuQGdtYWlsLmNvbQ==
†Deceased
Disclaimer: All claims expressed in this article are solely those of the authors and do not necessarily represent those of their affiliated organizations, or those of the publisher, the editors and the reviewers. Any product that may be evaluated in this article or claim that may be made by its manufacturer is not guaranteed or endorsed by the publisher.
Research integrity at Frontiers
Learn more about the work of our research integrity team to safeguard the quality of each article we publish.