 Eduardo C. Bortolin
 Juliana Távora
 Elisa H. L. Fernandes
- 1Laboratório de Oceanografia Costeira e Estuarina (LOCOSTE), Instituto de Oceanografia, Universidade Federal do Rio Grande (FURG), Rio Grande, Brazil
- 2Faculty of Geo-Information Science and Earth Observation, University of Twente, Enschede, Netherlands
Continental freshwater contributions are the main long-term control on the variability of suspended particulate matter (SPM) concentrations in choked lagoons. The current work aims to assess the seasonal to interdecadal variability in SPM concentrations from Patos Lagoon tributaries, as a case study towards the understanding of tributaries contributions to coastal lagoons. Thus, an interdecadal dataset (1984–2020) was collected in the region of the tributaries of Patos Lagoon (southern Brazil), integrating Landsat series (653 scenes) and in situ measurements. SPM concentrations were estimated from the scenes using a semi-analytical multiwavelength algorithm, applied in the regions of the lower course of the tributaries. Results identified SPM concentrations variability in seasonal scales, enhanced by El Niño Southern Oscillation (ENSO) in interannual time scales, also influencing in interdecadal trends. The seasonal SPM concentration variability reached 50 g.m–3 to each tributary. Higher SPM concentration values occurred from winter to spring, enhanced during El Niño periods and frequently reaching annual means higher than 100 g.m–3. Periods from summer to autumn, however, presented lower SPM concentrations, especially during La Niña periods, when the mean annual SPM concentration remained mostly below 50 g.m–3. Seasonal and interannual (ENSO) forcings combined developed configurations of high input periods (HIP) and low input periods (LIP). During the LIP, the river plumes are limited to their tributary zone of influence and the whole lagoon has reduced SPM concentrations. During the HIP, the river plumes spread over the lagoon sub-environments, and the SPM concentrations of all tributaries reach the estuarine zone and the ocean. Thus, the mentioned natural phenomena influence the river plumes spreading, the SPM concentrations in the lagoon, and the export to the Atlantic Ocean in time scales varying from seasonal to interdecadal.
Introduction
The drainage systems transport sediments to the coastal environments, developing particularly high suspended particulate matter (SPM) concentrations in shallow transitional environments (Miller and McKee, 2004; Lihan et al., 2008), often higher than in the coastal sea (Eisma, 1993). Estuaries and coastal lagoons are key transitional environments for monitoring processes influencing the SPM dynamics, as these water bodies have ecological significance, shelter harbors, and regulate the export to the ocean. The amount of SPM concentrations in the water column affects water quality parameters (Bilotta et al., 2012), and can be associated with pollutants and modify the subaquatic behavior of the light (reflectance and absorption), which can impact aquatic life and water potability (Wilkinson et al., 2017). Understanding the variability of SPM concentrations reaching transitional systems is a complex challenge, because the fluxes respond in different temporal and spatial scales and to multiple natural or anthropogenic forcings.
The SPM loads from tributaries to coastal systems have been studied by different approaches in the last decades. Earlier investigations focused on assessing SPM associated with the variability of chemical elements (Rostad and Leenheer, 1997; Rachold, 1999; Schäfer et al., 2002; Gordeev et al., 2004), dissolved nutrients (Ward and Twilley, 1986), and isotopic composition promoted by the tributary’s influxes (Rachold et al., 1997). Recent studies, however, have longer data sets available and rely on more advanced technology (e.g., more satellite products), allowing the survey of historical changes and long-term analysis of SPM behavior (Choi et al., 2012; Kreiling and Houser, 2016; Park et al., 2018; Ryberg et al., 2018). Despite advances, studies analyzing seasonal to decadal variability on SPM concentrations rarely used datasets longer than 35 years, with few exceptions (Dang et al., 2010). This represents a gap in the literature and also can lead to interpretations based on the trend of a specific decade. Moreover, studies concerning SPM in river plumes focused on tidally influenced environments (Hetland and Hsu, 2013; Horner-Devine et al., 2015; Shanmugam, 2018). This kind of study, however, is uncommon for microtidal environments, sheltered from tidal influence by sandy barriers (Liu et al., 1997).
Coastal lagoons in particular represent a path towards the coast for the concentrations of SPM received from the drainage basin through the tributaries. Choked lagoons are composed of a series of elliptical cells, and these systems are connected to the ocean through a single and narrow channel, which limits tidal currents and water-level fluctuations in the lagoon (Kjerfve, 1994). Patos Lagoon is the largest choked coastal lagoon in the world (Kjerfve, 1986; Figure 1), covering about 10.000 km2, draining almost 200.000 km2, with 6 m average depth, connected to the Atlantic Ocean through a single narrow inlet (< 700 m wide), which was stabilized by jetties built-in 1911 (Toldo et al., 2000). Salinity in Patos Lagoon ranges from 0 to 34, mostly limited to the estuarine zone, which is about 55 km from the mouth (Moller et al., 2001). The concentration of dissolved organic matter (CDOM) in the estuarine zone is inversely correlated with salinity, with mean concentrations ranging from 13.07 to 18.26 mg.m–3 (Rodrigues et al., 2012). Measurements from 1986 to 2008 revealed mean Chlorophyll a concentrations of 7.31 μg L–1 (SD = ± 9.75) in this region (Abreu et al., 2010).
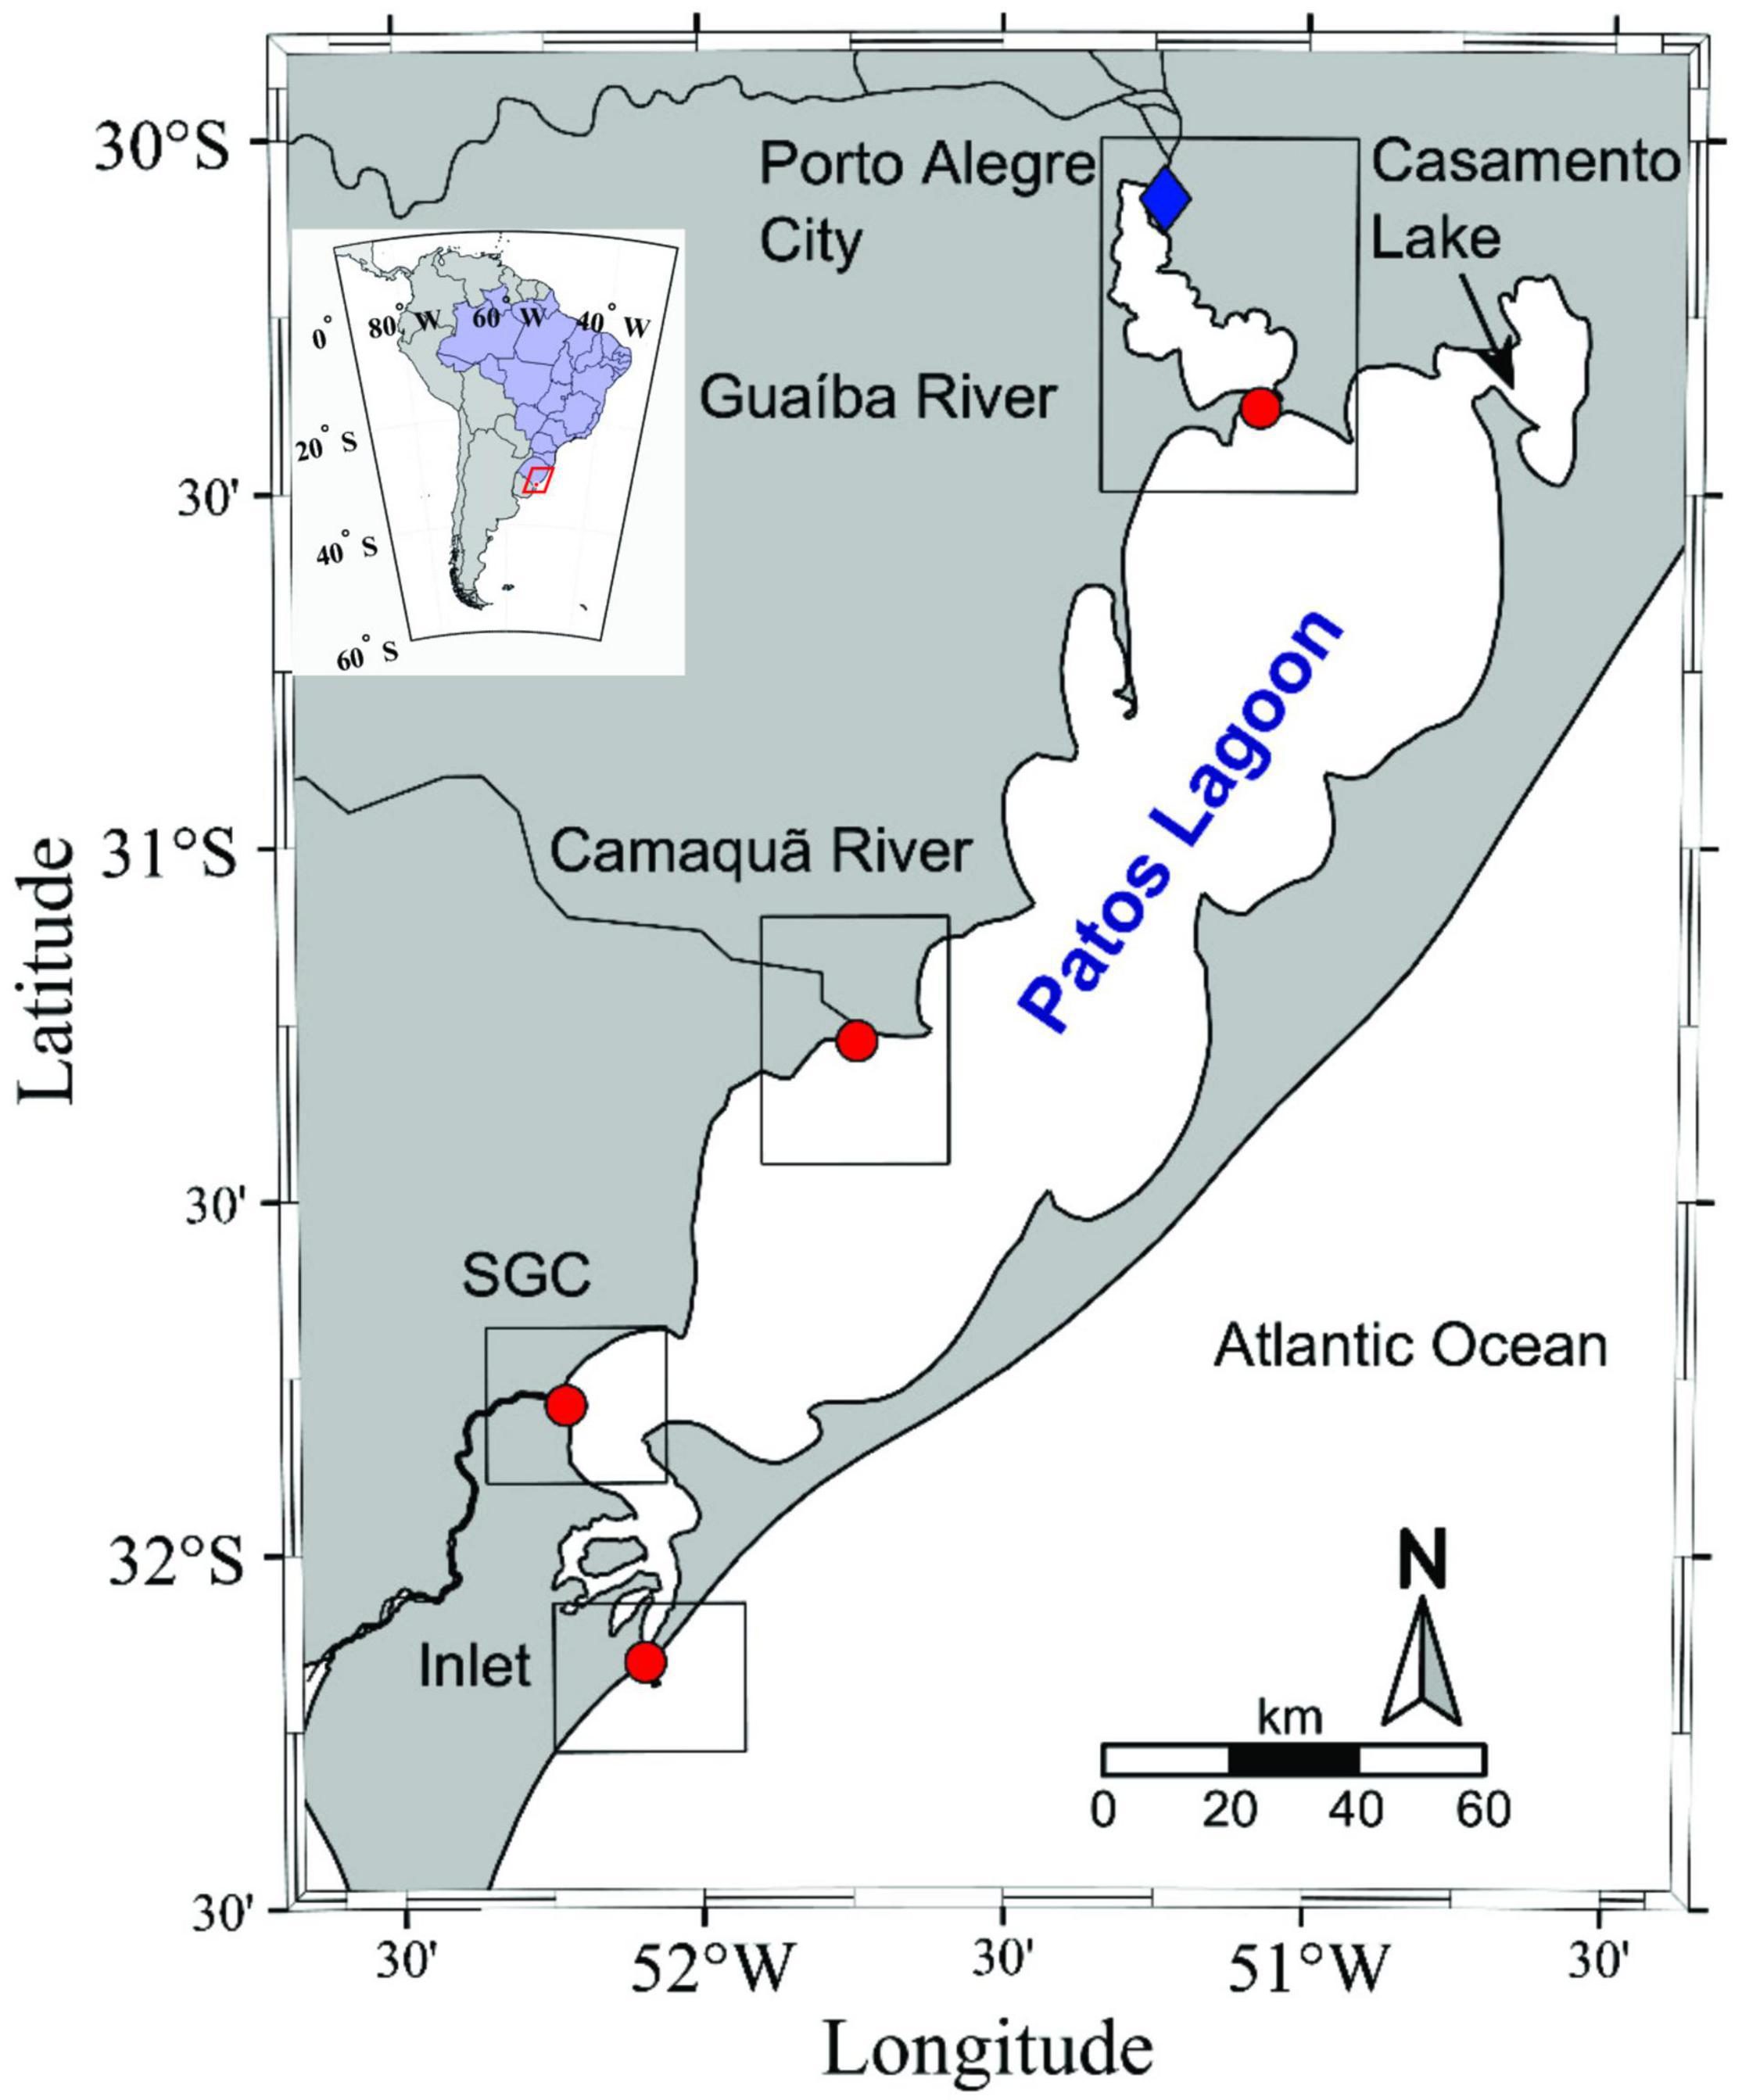
Figure 1. Patos Lagoon detailing the investigated area of each tributary (rectangular boxes). The mouth of the main tributaries is marked by red dots.
This important depositional basin receives SPM from three main tributaries Guaíba and Camaquã rivers, and the São Gonçalo Channel (SGC), which connects Patos and Mirim Lagoons, which together cover 14,000 km2 (Bortolin et al., 2020). Once inside the lagoon, the coarser fractions of suspended sediment tend to deposit in the upper course of the system and the SPM fine fraction is either transported in suspension or deposited in preferential zones, responding to autogenic forcings (Bortolin et al., 2020), such as the variability in freshwater discharges and wind action (Távora et al., 2019; Bitencourt et al., 2020). The fine SPM fraction which reaches Patos Lagoon estuary moves towards the coast through Rio Grande Channel, which has predominant ebb flow (Moller et al., 2001; Fernandes et al., 2002), but is also subject to flocculation processes during flood flows (Ávila et al., 2021).
The system is under a microtidal regime of 30 cm amplitude, and its dynamic is driven by freshwater discharges and winds (Moller et al., 2001). The wind influence becomes more relevant at shorter timescales and during periods of reduced freshwater discharges (<2,000 m3.s–1) (Moller et al., 2001; Távora et al., 2020b). Two predominant wind directions in the region are NE (22.3%) and SW (13.5%) (Tomazelli, 1993). NE winds are predominant along the year (5 m.s–1 mean velocity) driven by the Atlantic Anticyclone, and SW winds occur secondarily in a higher intensity (8 m.s–1) mainly during winter (Stech and Lorenzetti, 1992). The mean annual freshwater discharge in Patos Lagoon is about 2,400 m3.s–1 (Vaz et al., 2006), however, such conditions change according to ENSO events (Fernandes et al., 2002), with lower inflows during La Niña events, contrasting with peaks reaching 12,000 m3.s–1 during El Niño events (Moller et al., 1996). These driving forces behave according to well-studied cycles, whose periods are recognized in seasonal and interannual scales (Vaz et al., 2006; Jung et al., 2020), as well as El Niño-Southern Oscillation (ENSO) (Vaz et al., 2006; Távora et al., 2019, 2020b; Bitencourt et al., 2020).
The freshwater inputs from the tributaries are assumed as the main control in SPM concentrations in Patos Lagoon during long time scales (seasonal and interannual), with high SPM concentrations proportional to peaks in freshwater discharges related to the ENSO cycle (Moller et al., 2001; Távora et al., 2019, 2020b; Bitencourt et al., 2020). A recent study has proposed the prediction of SPM concentrations by the tributaries of Patos Lagoon in short time scales, based on the time series of freshwater discharge from the tributaries and the rating-curves approach (Jung et al., 2020). However, an assessment of measured SPM concentrations from the Patos Lagoon tributaries reaching the interdecadal time scale is still a gap of knowledge in this system and in coastal lagoons in general, especially in South America (Beltrame et al., 2009; Bitencourt et al., 2020; Távora et al., 2020b). Thus, the aim of the current work is to contribute towards the understanding of the long-term variability (covering seasonal, interannual, and interdecadal time scales) of SPM concentrations from tributaries towards coastal lagoons, by using high spatial resolution remote sensing reflectance (Rrs) measurements from Patos Lagoon as a case study.
In this context, remote sensing represents a low-cost and trustworthy tool for monitoring SPM concentrations in large coastal environments (Matthews, 2011; Choi et al., 2012; Távora et al., 2020b), with the advantage of providing long-term data. Despite the methodological benefits, few studies investigated SPM in Patos Lagoon using remote sensing. General characterizations of the suspended sediment dynamics were carried out (e.g., Pagot et al., 2007; Fassoni-Andrade et al., 2015), but these studies investigated a short-term period of about 2 years. Recent studies analyzed the behavior of SPM concentrations inside Patos Lagoon using a Moderate Resolution Imaging Spectroradiometer (MODIS) satellite, which has a high temporal resolution (daily satellite overpass). Although with low spatial resolution, such recent studies investigated shorter periods than the present work, as follows, 8 years (Távora et al., 2019), and 17 years period (Távora et al., 2020b). None of them, however, focused on the Patos Lagoon tributaries, and for that, the high spatial resolution provided by Landsat products is required.
During the last decade, generically applicable algorithms have been developed to model SPM concentrations from Rrs in coastal water bodies (Nechad et al., 2010; Han et al., 2016; Novoa et al., 2017). The performance of those algorithms was compared for Patos Lagoon, presenting different results depending on the region of the lagoon (Távora et al., 2020b). A recent advance was achieved by the multi-wavelength semi-analytical method proposed by Távora et al. (2020a), which estimates SPM concentrations with its uncertainties and has shown satisfactory performance in comparison to the algorithms mentioned above.
The algorithm proposed by Távora et al. (2020a) was applied to the Patos Lagoon tributaries in the current study, using high spatial resolution satellite images (Landsat 5, 7, and 8) from 1984 to 2020 to model long-term SPM concentrations from the tributaries contributing to the lagoon. The present investigation covered the longest timescale analysis of SPM concentrations in the tributaries of Patos Lagoon, and accounts for the higher spatial resolution satellites already used for this purpose in the area, which is ideal for capturing small scale details in specific environments (such as meandering rivers). The combination of in situ and modeled results was a useful strategy to fill gaps in the SPM concentrations from each tributary. Furthermore, it was possible to propose conceptual models about the behavior of long-term SPM concentrations during periods of high and low continental contributions from the tributaries.
Materials and Methods
The flowchart in Figure 2 summarizes the main steps adopted in the present work, from the scenes acquisition to the final image processing stages.
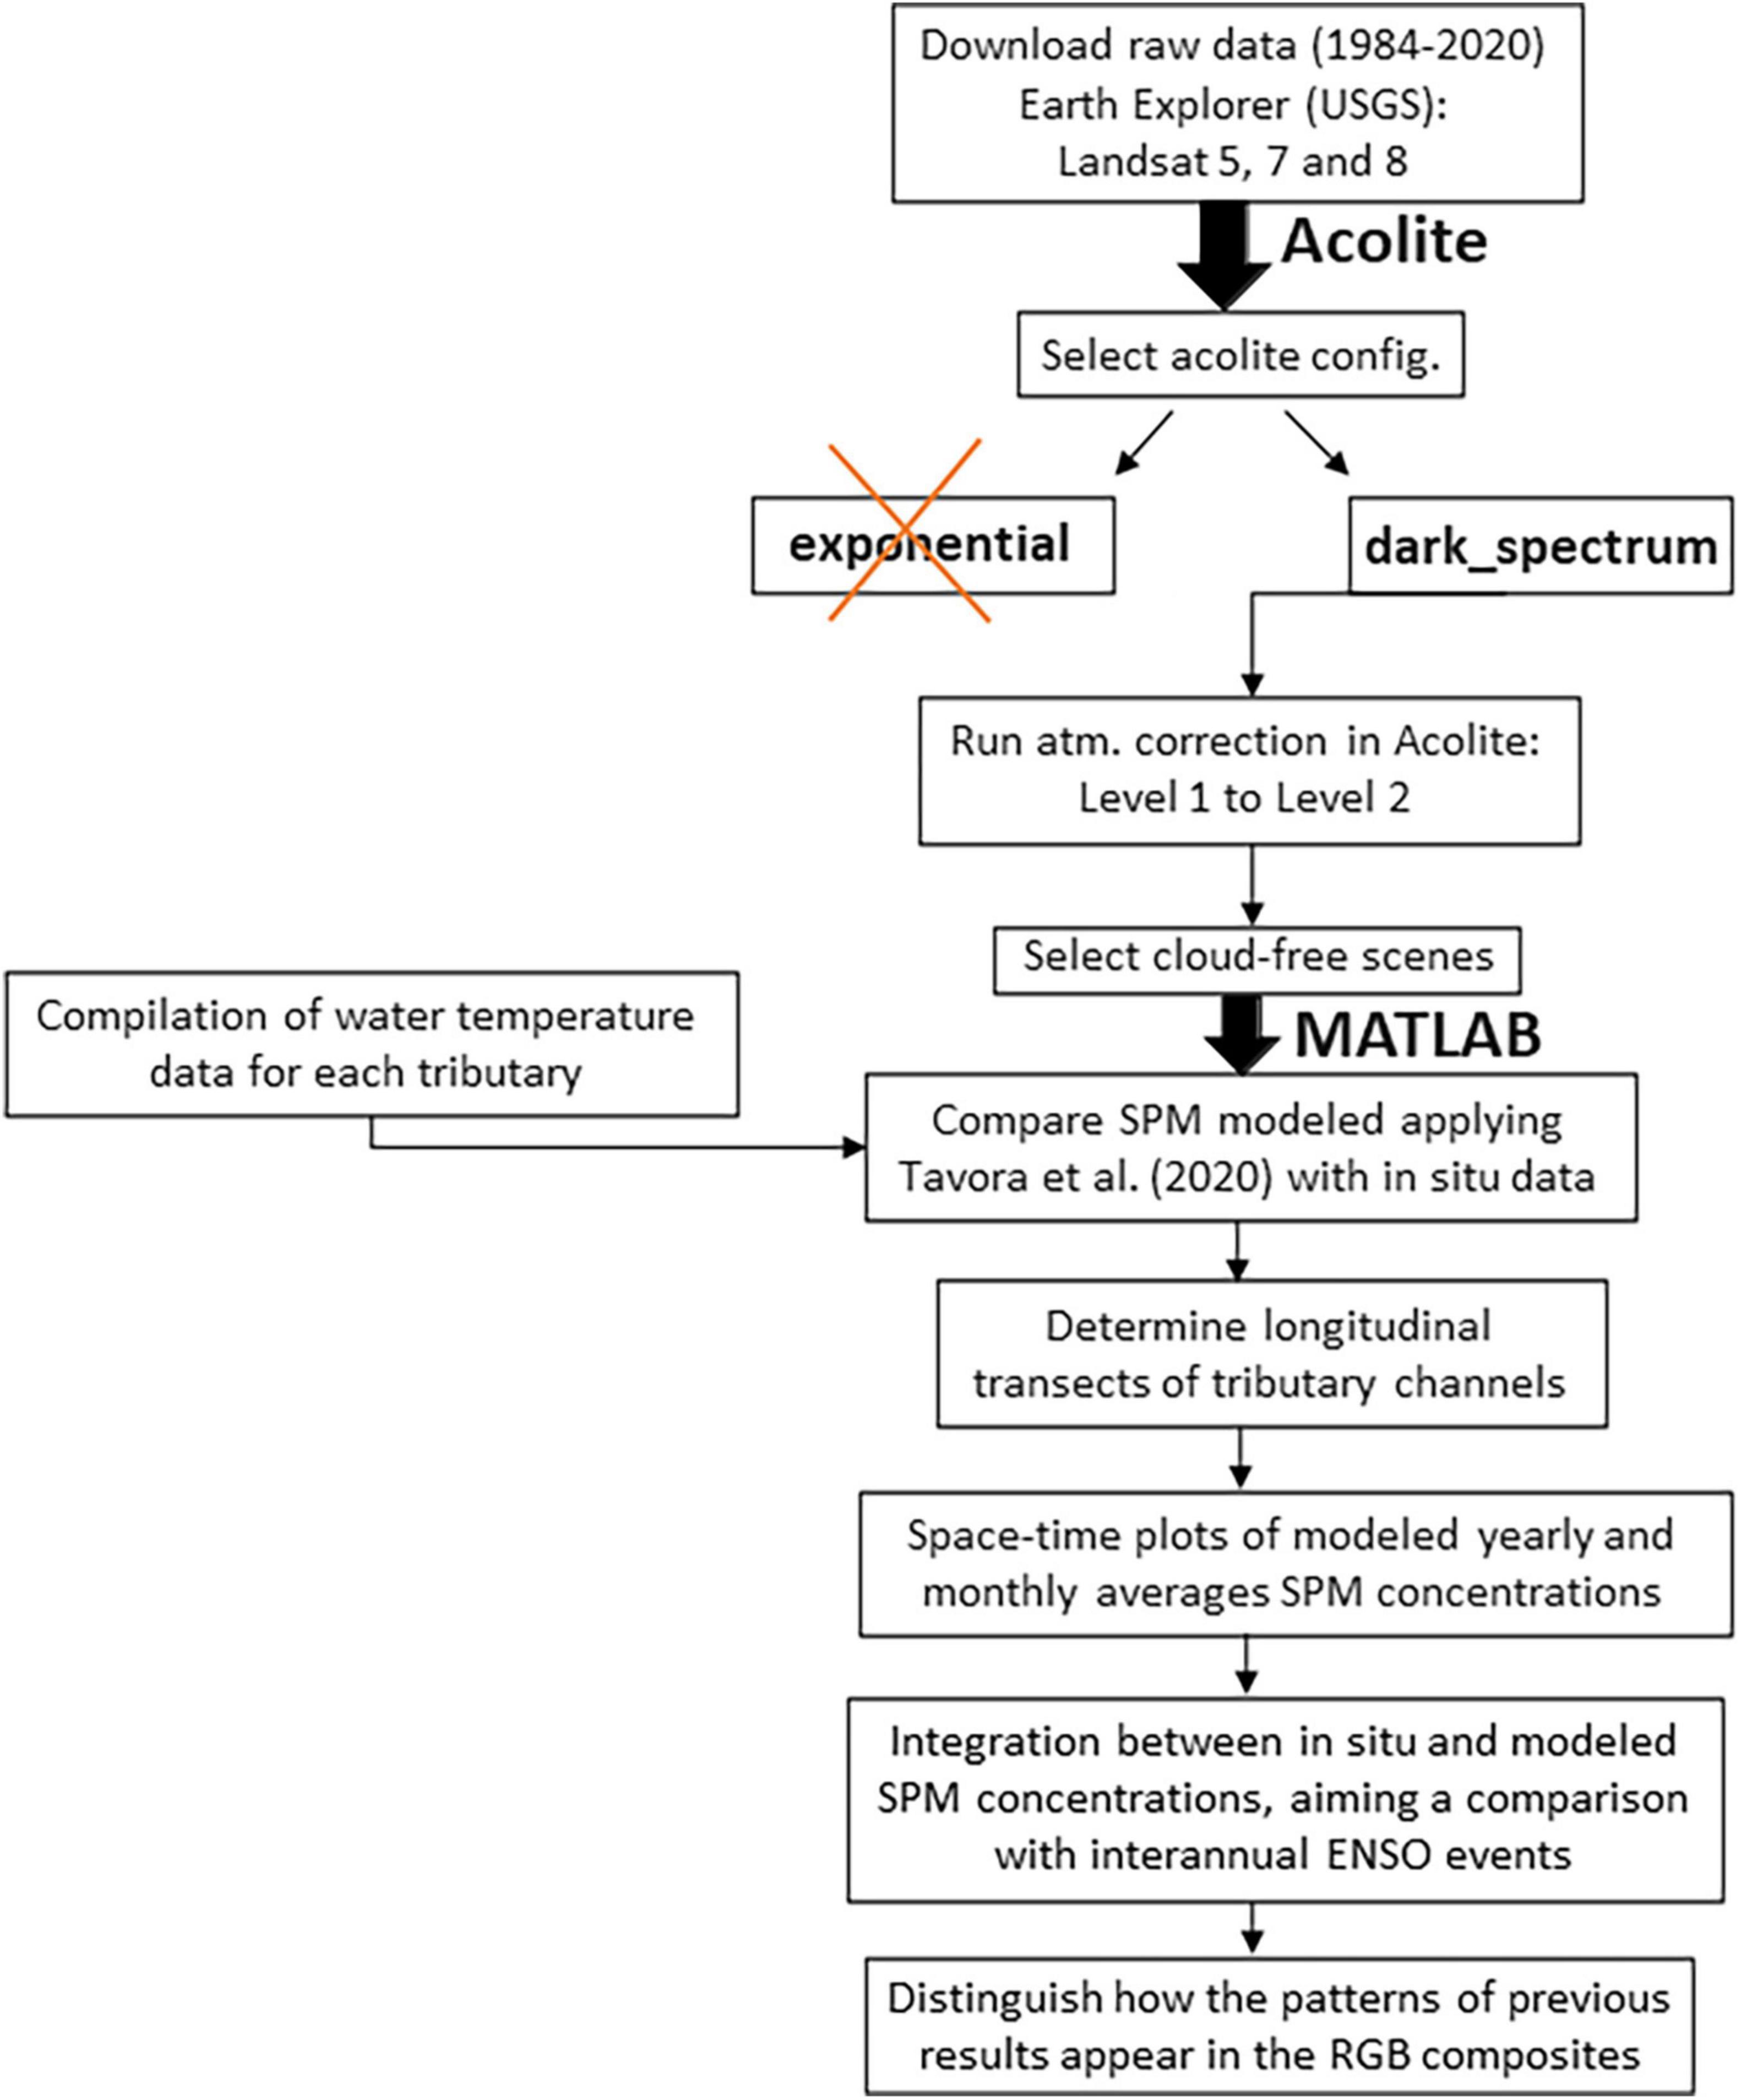
Figure 2. Flowchart representing a schematic processing sequence developed in Acolite and MATLAB. The upper portion of the flowchart represents the atmospheric correction (see section “Atmospheric Correction”) processing developed in the ACOLITE software. The lower portion summarizes the modeling of SPM concentrations (see section “Multi-Proxy Suspended Particulate Matter Estimates”), the integration with in situ data (see section “Multi-Proxy Suspended Particulate Matter Estimates”), and the comparison with environmental forcings [see sections “El Niño-Southern Oscillation Index (MEI v.2) and Discharges From Tributaries” and “Spectral Method (Lomb-Scargle Periodogram)”] developed in MATLAB.
Atmospheric Correction
Satellite scenes from Landsat 5, 7, 8 (hereon L5, L7, L8) were acquired through the Earth Explorer data collection of the United States Geological Survey (USGS)1, encompassing the years 1984 to 2020. The atmospheric correction from Level 1 to Level-2 was processed with the freely available software ACOLITE (version 20210114.0), developed by the Royal Belgian Institute of Natural Sciences (RBINS)2, which also merged the tiles to fit the study area (29.9°32.5° S; 50.5°–52.5° W). The high spatial resolution of the satellites allowed the selection of smaller boxes to investigate each tributary region (Figure 1), as follows: Guaíba (29.9°–30.67° S; 50.87°–51.34° W), Camaquã (30.98°–31.52° S; 51.59°–52.10° W), SGC (31.68°–31.90° S; 52.06°–52.36° W) and inlet (32.07°–32.28° S; 51.93°–52.13° W).
ACOLITE provides two atmospheric correction schemes: dark spectrum fitting (DSF) (Vanhellemont and Ruddick, 2018; Vanhellemont, 2019) and exponential extrapolation (EXP) (Vanhellemont and Ruddick, 2014, 2015, 2016). The manufacturer recommends the use of the DSF, while the EXP can be considered as a complementary tool. Both were tested for the study area to check the best performance. The two models were applied to nine randomly picked satellite scenes, collected in different years, with distinct turbidity and cloud conditions. The DSF performed better, showing less masked data for highly turbid waters and cloudy days.
After performing the atmospheric correction, the scenes were selected to avoid evidence of signal disturbance, such as suspicious noise, remaining clouds, and haze. After this quality control, all scenes from the Red to the Short Wave Infra-red (SWIR) were used, following the methods described in the algorithm proposed by Távora et al. (2020a).
Multi-Proxy Suspended Particulate Matter Estimates
Concentrations of SPM have been measured in Patos Lagoon over the last four decades during surveys and monitoring programs. This dataset, together with the respective methodological description and protocol analysis, was organized in a compendium (Távora et al., 2020c,2021), and used here to select the collection campaigns suitable for comparison with the SPM estimates derived from satellite scenes. This dataset presented concentrations of SPM ranging from 4 up to 700 gm–3, which are compatible with the algorithm developed by Távora et al. (2020a).
The algorithm used for modeling SPM concentrations is a semi-analytical multi-wavelength method, which calculates the SPM concentrations providing the uncertainties derived from measurements, which can be applied to any ocean color sensor (Távora et al., 2020a). The performance of the algorithm applied in this work was previously evaluated to a variety of coastal environments (Távora et al., 2020a), based on 420 in situ measurements. The SPM concentration underestimation was avoided by removing solutions where the saturation reflectance threshold is higher than 50% for each specific band.
This method also considers the water temperature, which was acquired by in situ measurements and made available by the Departamento Municipal de Águas e Esgotos (DMAE)3 from Porto Alegre, the Agência Nacional das Águas (ANA)4 for Camaquã River, the Sistema de Monitoramento da Costa Brasileira (SiMCosta)5 and the Pesquisa Ecológica de Longa Duração no Estuário da Lagoa dos Patos e Costa Marinha Adjacente (PELD-ELPA)6, the last two sources being from the estuarine zone. Additionally, an online historical database7 provided daily water temperature since 2007 for three cities close to the tributaries (Table 1), such a dataset was used to fill gaps when in situ observations were not available. This website gets data from the Operational Sea Surface Temperature and Ice Analysis (OSTIA), which combines satellite data provided by the Group for High-Resolution Sea Surface Temperature (GHRSST), together with in situ measurements to determine the water temperature.
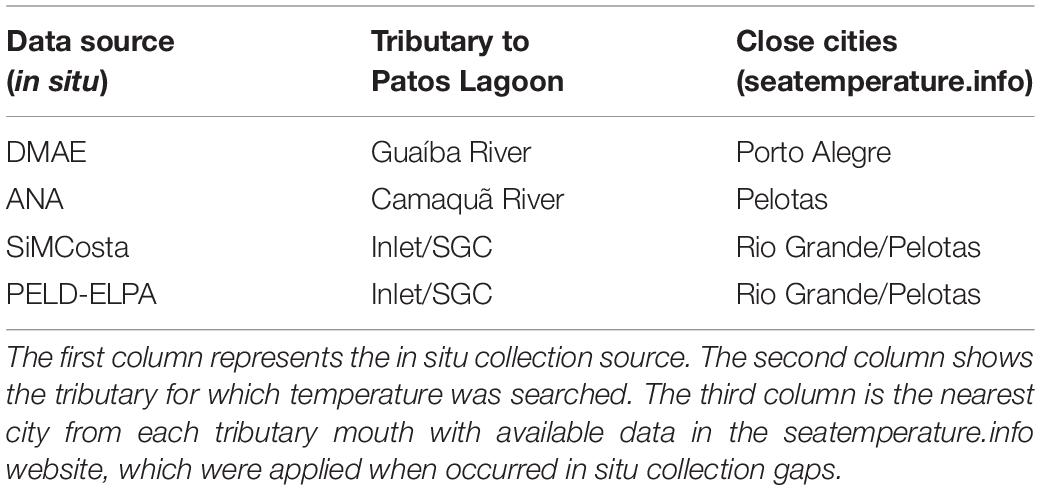
Table 1. Water temperature sources for each region.
The high spatial resolution of the Landsat series allowed SPM concentration estimates even in the narrowest sections of the SGC channels (∼380 m width, or about 12–13 pixels) and Camaquã River (∼150 m width, or 5 pixels). Longitudinal transects were established throughout each tributary channel towards the lagoon (Figure 3). Their lengths varied according to the channel morphology; for example, the Camaquã River presents the shortest transect because of the increasing sinuosity in the upstream channel, which did not allow avoiding the river margins. The transect points were selected to respect what we called “a safe distance” from the margin of the rivers in order to prevent the adjacency effects (Bulgarelli et al., 2017) which compromises the Rrs signal. Land masks were also applied, creating a buffer around the river margins. The mean SPM concentration was modeled to each point of the transect, on 10-x-10 pixel boxes, providing satisfactory accuracy when compared with in situ measurements. Based on these transects, it was possible to assess SPM concentrations variability from each tributary towards the lagoon.
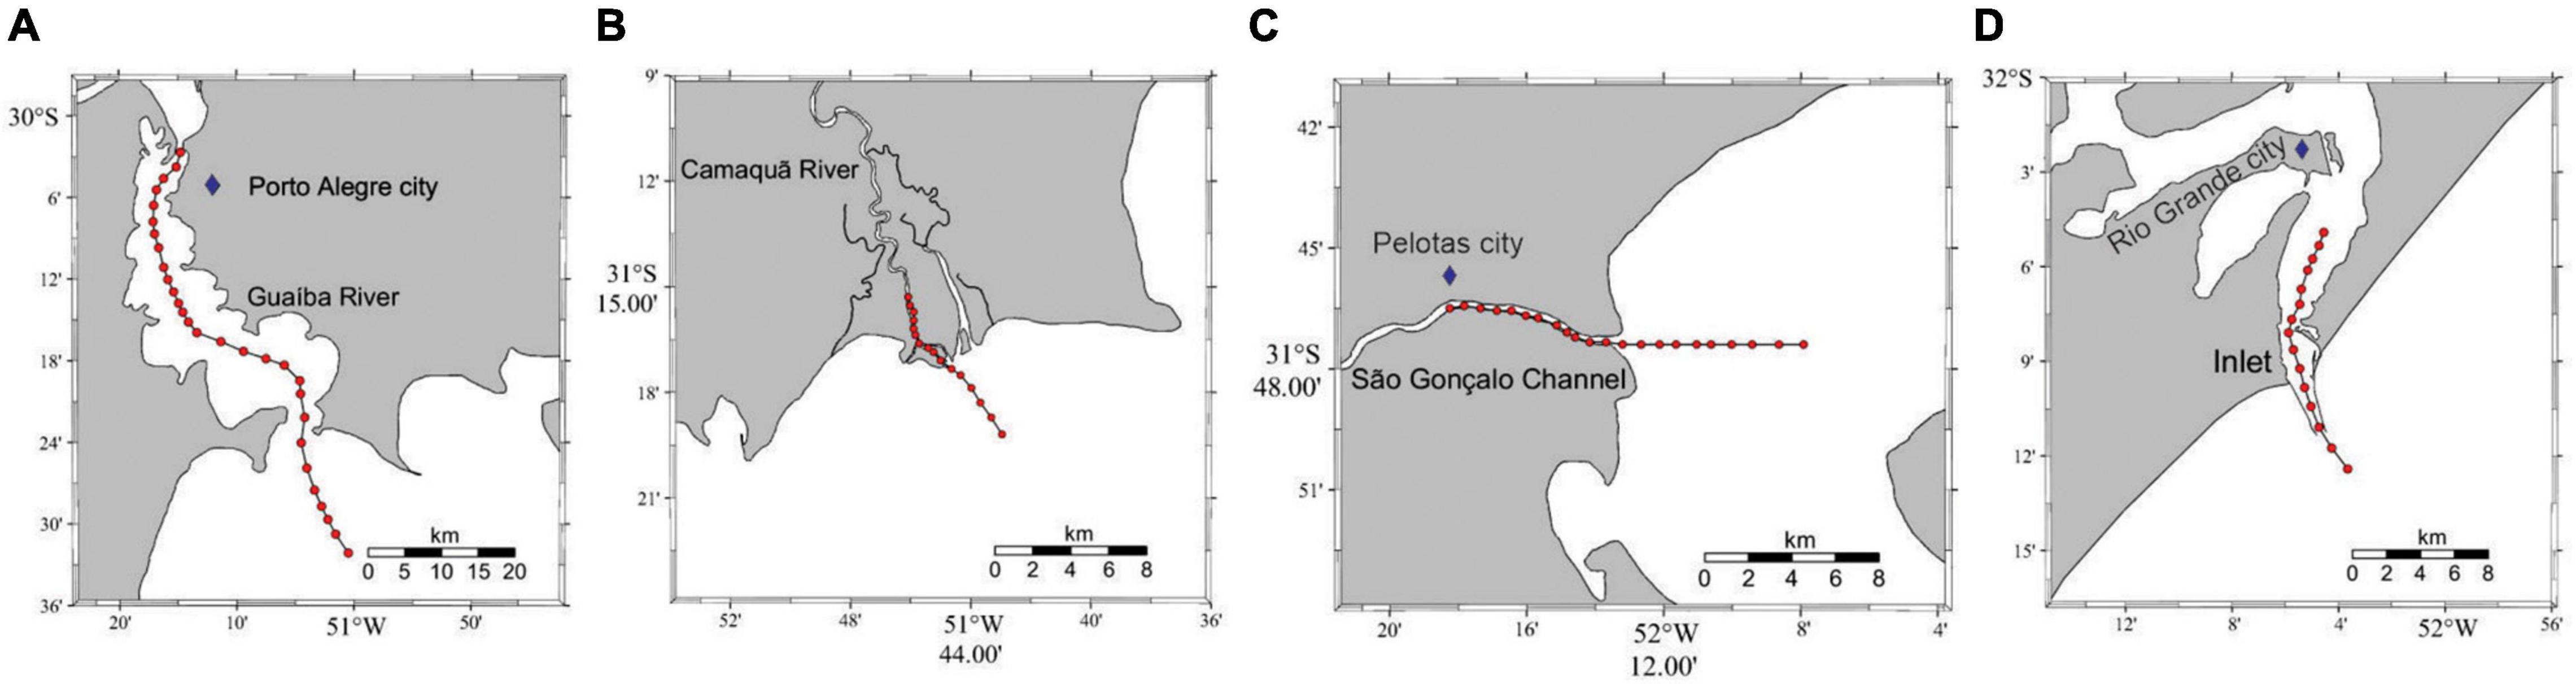
Figure 3. Representation of the points of the 10-x-10 pixel boxes which compose the transects determined for each tributary: (A) Guaíba River, (B) Camaquã River, (C) SGC, and (D) Inlet.
The SPM concentrations calculated along the transects presented a percentage of gaps in each tributary as follows, Guaíba (66%), Camaquã (73%), SGC (67%), and Inlet (67%). The mean SPM concentrations were calculated for each tributary region, respecting the determined box (see section “Atmospheric Correction”), then the in situ observed SPM concentration was also considered to reduce the percentage of gaps in the time series on each tributary. SPM concentrations both in situ and satellite-calculated were then integrated in a daily timestep. This strategy reduced the gaps in the SPM datasets, reaching more suitable percentages to Guaíba (39%), Camaquã (66%), SGC (63%), and Inlet (55%). This data integration strategy was only possible after assuring the accuracy of the satellite-derived SPM concentration estimates (see Supplementary Material). These results were compared with RGB true-color composite images processed by ACOLITE, allowing the development of a conceptual model about the SPM concentration behavior under periods of low and high freshwater discharges.
El Niño-Southern Oscillation Index (MEI v.2) and Discharges From Tributaries
The Multivariate ENSO Index (MEI.v2) data is provided by the Physical Sciences Laboratory of National Oceanic and Atmospheric Administration (NOAA)8, calculated for twelve-time intervals, in a bi-monthly arrangement. The MEI.v2 index can be considered one of the most representative ENSO indexes. It is calculated from the Empirical Orthogonal Function (EOF) combining five variables (i.e., sea level pressure, sea surface temperature, zonal and meridional components of the surface wind, and outgoing longwave radiation over the tropical Pacific basin). The MEI.v2 index indicates the intensity and phase of ENSO. Significant positive values indicate El Niño (warm) events, in contrast, La Niña phases are represented by significant negative values.
The Camaquã, Guaíba, and Inlet discharges were acquired from the ANA dataset, available online9. The Guaíba River discharge was calculated from the sum of Jacuí and Taquari freshwater discharges, which represent 85% of the Guaíba freshwater discharge input (Vaz et al., 2006). The SGC water level was provided by Agência de Desenvolvimento da Lagoa Mirim (ALM), and from this data it is possible to assess the SGC discharge based on a Rating Curve Method (Oliveira et al., 2015).
Spectral Method (Lomb-Scargle Periodogram)
Coastal systems are dynamic, respond to deterministic (e.g., tidal effects) and stochastic forcings (e.g., river load and wind). Spectral methods have been used to recognize periodicity in coastal events and identify the respective processes responsible for changes (Jalón-Rojas et al., 2016). The selection of a method should consider the percentage of gaps in the data, its sampling frequency, and the aim of the analysis, which in our case is to recognize the most energetic cyclicities in each of the Patos Lagoon tributaries.
The Lomb-Scargle Periodogram (LSP) (Lomb, 1976; Scargle, 1982) is considered the best-known method to detect periodicity in time series on unevenly sampled parameters, where the signal is processed in a Fourier-like power spectrum representing the periods of oscillation (VanderPlas, 2018). The MATLAB function plomb (Signal Processing Toolbox), introduced in R2014b10, was used in the present work, providing the significance levels of energy, where peak values over the determined threshold can be interpreted as reliable signals, not incidental fluctuations or any noise. This method can identify significant periodicity in multiannual time series with more than 70% randomly missing data. However, following previous studies, when gaps surpass 50% the method is more reliable in time series of at least 10–15 years (Jalón-Rojas et al., 2016).
The LSP was applied to the calculated mean SPM concentrations for each tributary region, with a significance level of 95% (α = 0.05) and only peaks over this limit were considered. The freshwater discharge exerts a direct influence on SPM concentration, and for complementary comparison, the LSP was also applied to this dataset with a threshold of 95% confidence (α = 0.05). In respect to the criteria previously described, spectral methods were not used for the Inlet discharge, because it has 61% of missing data over 6 years, exceeding the limitations of the method. In contrast, the other tributaries have at least 20 years of freshwater discharge data with a low percentage of gaps [i.e., Guaíba (23%), Camaquã (0.4%), and SGC (21%)]. The equation 1/peak frequency was calculated to convert frequencies to periods.
Results
Accuracy of Suspended Particulate Matter Concentration Estimates
The investigated 37 years period resulted in 653 cloud-free scenes, after image processing and selection. This amount represents the sum of the scenes from the area determined for each tributary, Guaíba (174 scenes), Camaquã (146 scenes), SGC (165 scenes), and Inlet (168 scenes).
The data set reached 47 match-ups, which represent sampling simultaneity (same day) between satellite scenes and in situ data (see text footnote 3, respectively). These match-ups were more frequent for Guaíba (43), secondarily for Camaquã (4), while it was absent for the Inlet and SGC, due to few in situ measurements at these locations. The match-ups were used for algorithm validation purposes, testing the accuracy associated with these atmospherically corrected satellite scenes, respecting the saturation threshold of 50% (see section “Multi-Proxy Suspended Particulate Matter Estimates”), assessing the modeled mean SPM value in 10-x-10 pixel boxes, and achieving satisfactory results (see Supplementary Material).
Periodicity in Suspended Particulate Matter Concentrations Variability
Figures 4A–D represents signals of the freshwater discharge and SPM concentrations periodograms (LSP) for each tributary. Results suggest that both parameters show a similar power behavior, with corresponding general trends and peaks. The dashed lines illustrate the significance threshold for SPM concentrations (black lines) and freshwater discharges (red lines), and peaks reaching these limits represent 95% significance. Peaks are marked on the y-axis and the period of occurrence is checked on the x-axis when it achieves the threshold lines. The SPM concentration peaks reach the significance level less often than the discharge peaks because of the larger percentage of gaps.
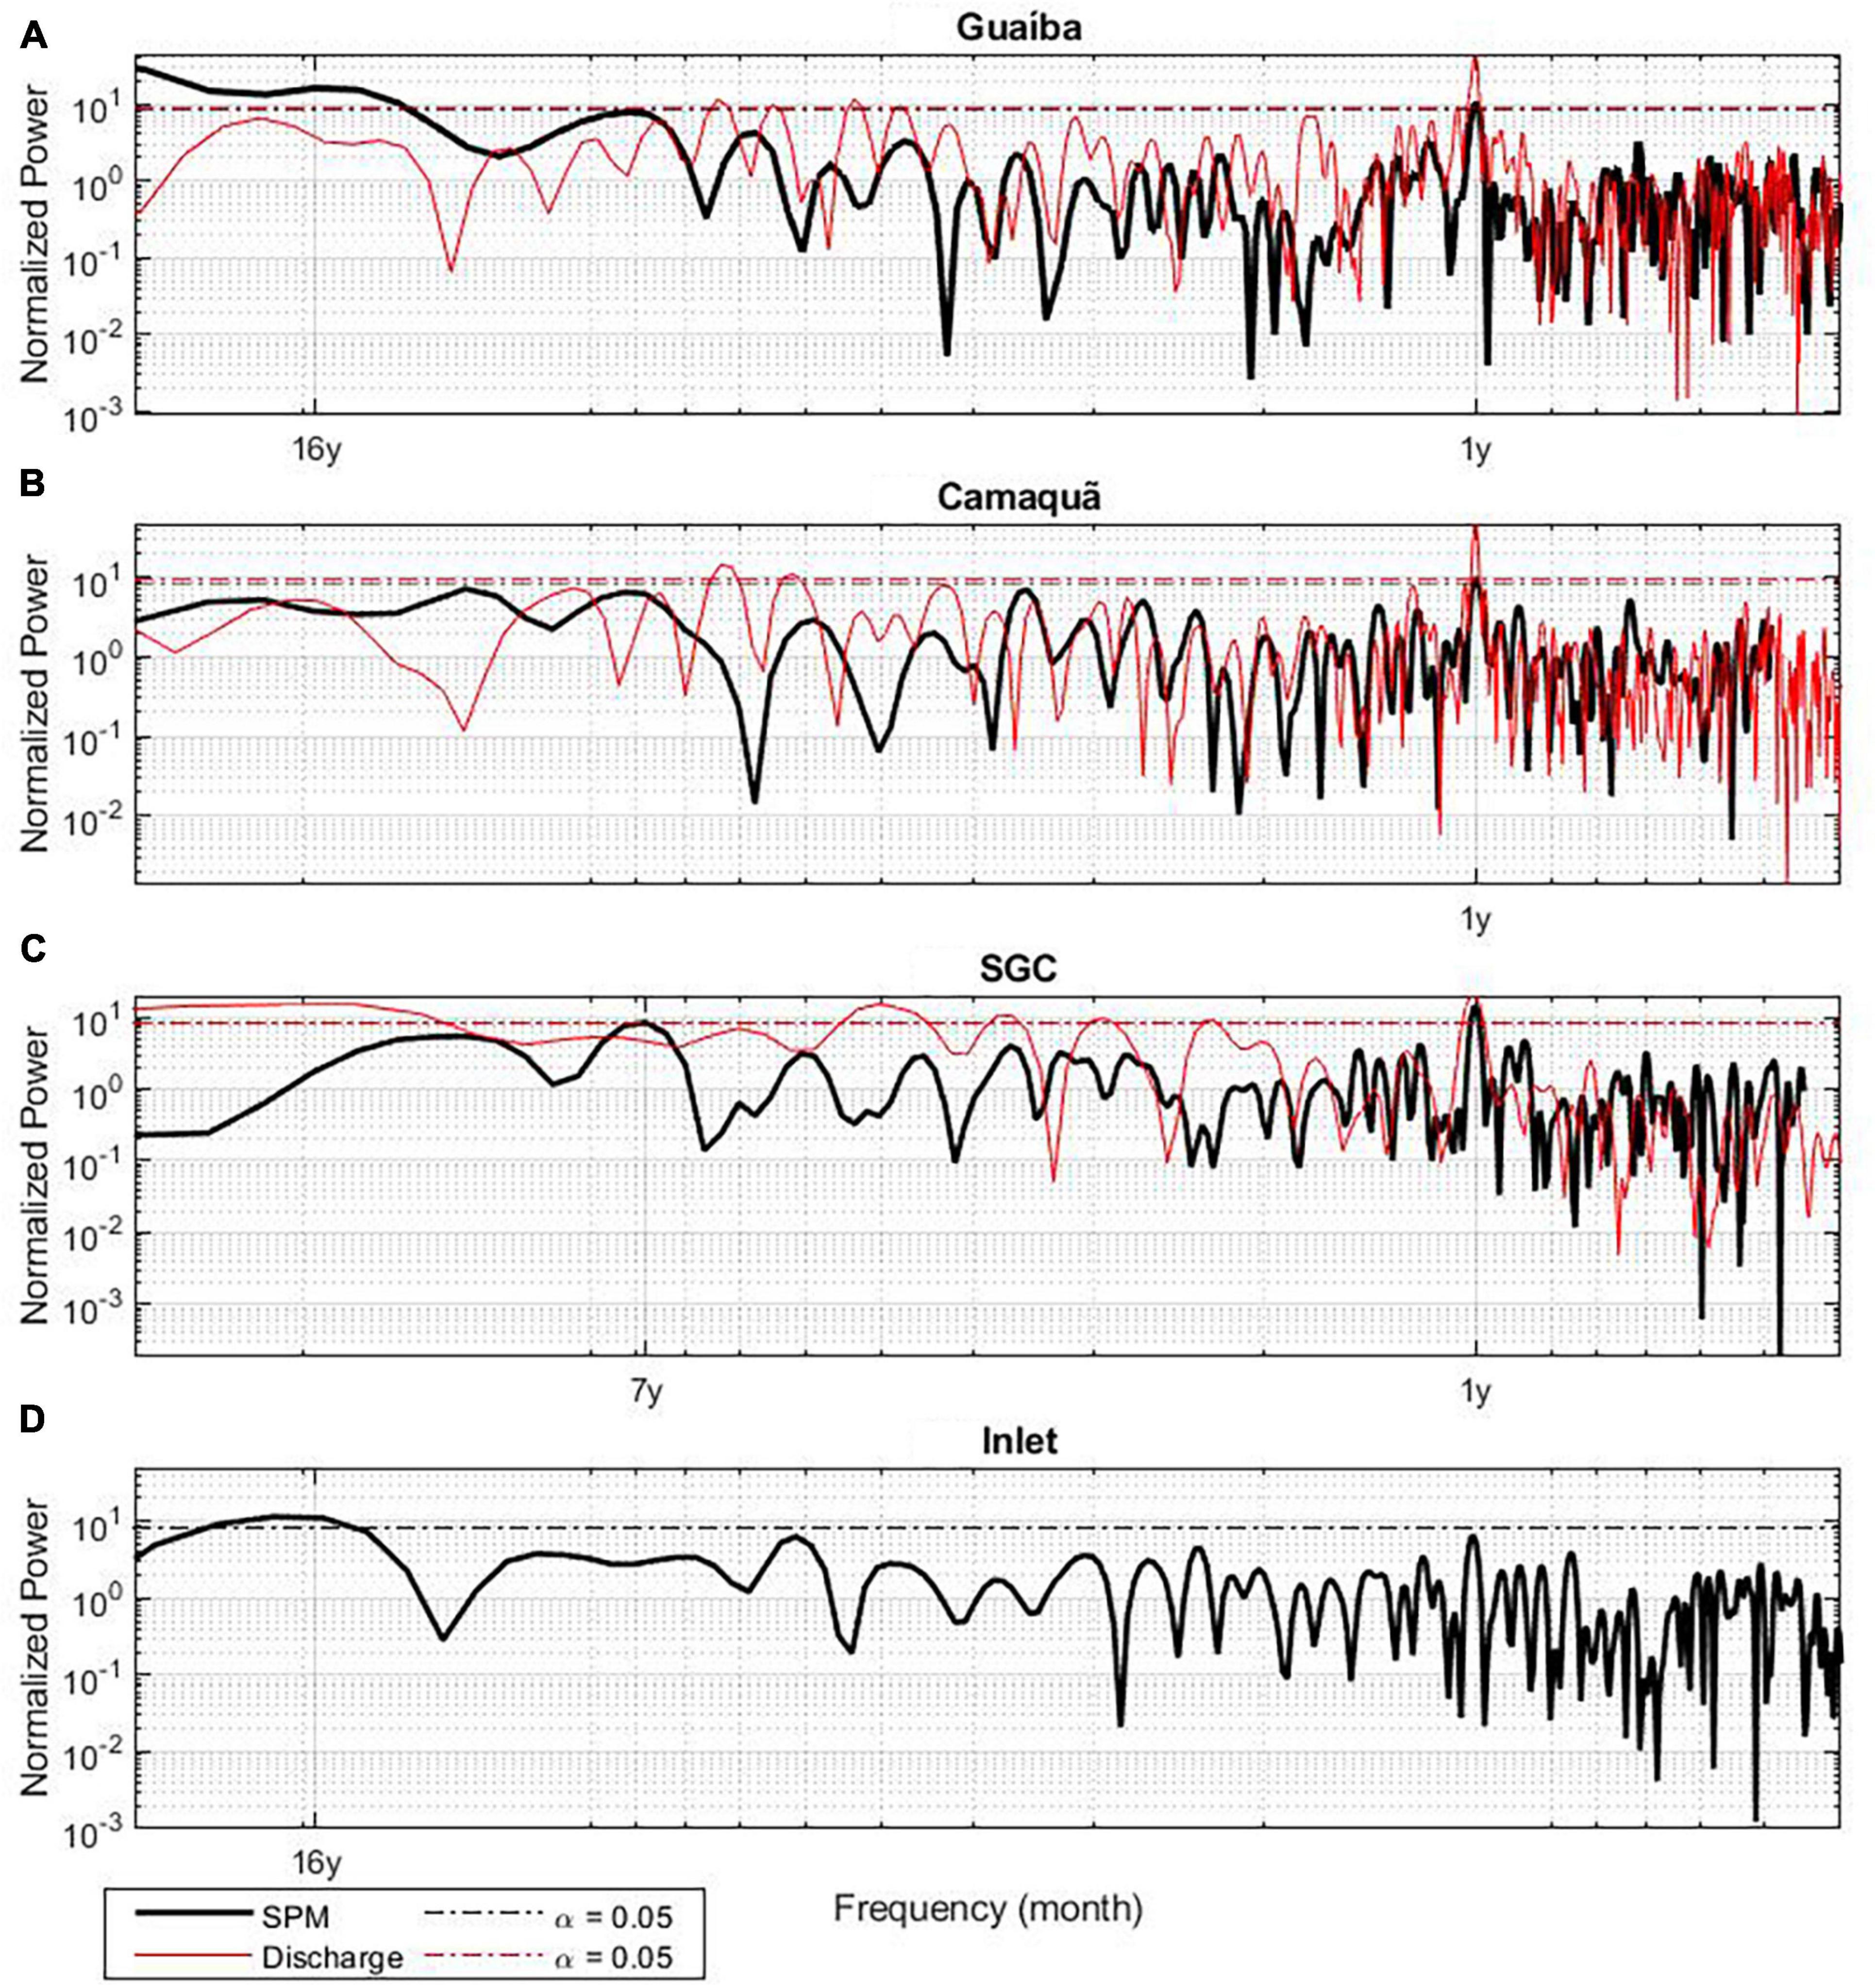
Figure 4. Lomb-Scargle periodograms of the discharge (red solid line) and mean SPM concentration (black solid line) for each tributary region [(A) Guaíba River, (B) Camaquã, (C) SGC, and (D) Inlet], encompassing the whole time series (1984–2020). The dashed lines represent the confidence threshold, red lines for discharge and black for SPM mean concentration, both with 95% reliability. The axes are on a logarithmic scale.
The three main tributaries (Guaíba, Camaquã, and SGC) present a well-marked 1-year peak above the confidence limit, and such power cyclicity is recognized for SPM concentrations and for freshwater discharge. In addition to the 1-year peak, other cyclicities are detected in the SPM signal, encompassing longer periods. One cycle of 16 years is marked for Guaíba River and Inlet, reaching the significance level, while for the other tributaries this peak presents a smaller magnitude, but the signal is also present. Camaquã highlights a 7 years cyclicity for SPM concentrations, and such peak is also detected on the other tributaries, though lower and not statistically significant.
Relationship Between El Niño-Southern Oscillation Index and Environmental Parameters
Figure 5 presents the relationship between environmental variables (freshwater discharges and SPM concentrations) and ENSO effects (Figure 5A). The yearly mean SPM concentrations which were calculated for each tributary region (see section “Atmospheric Correction”) is represented by the gray bars; their discharges also were expressed yearly (black dotted line) and monthly (gray line). Gray rectangles highlight the most significant El Niño event periods (MEI index around 2).
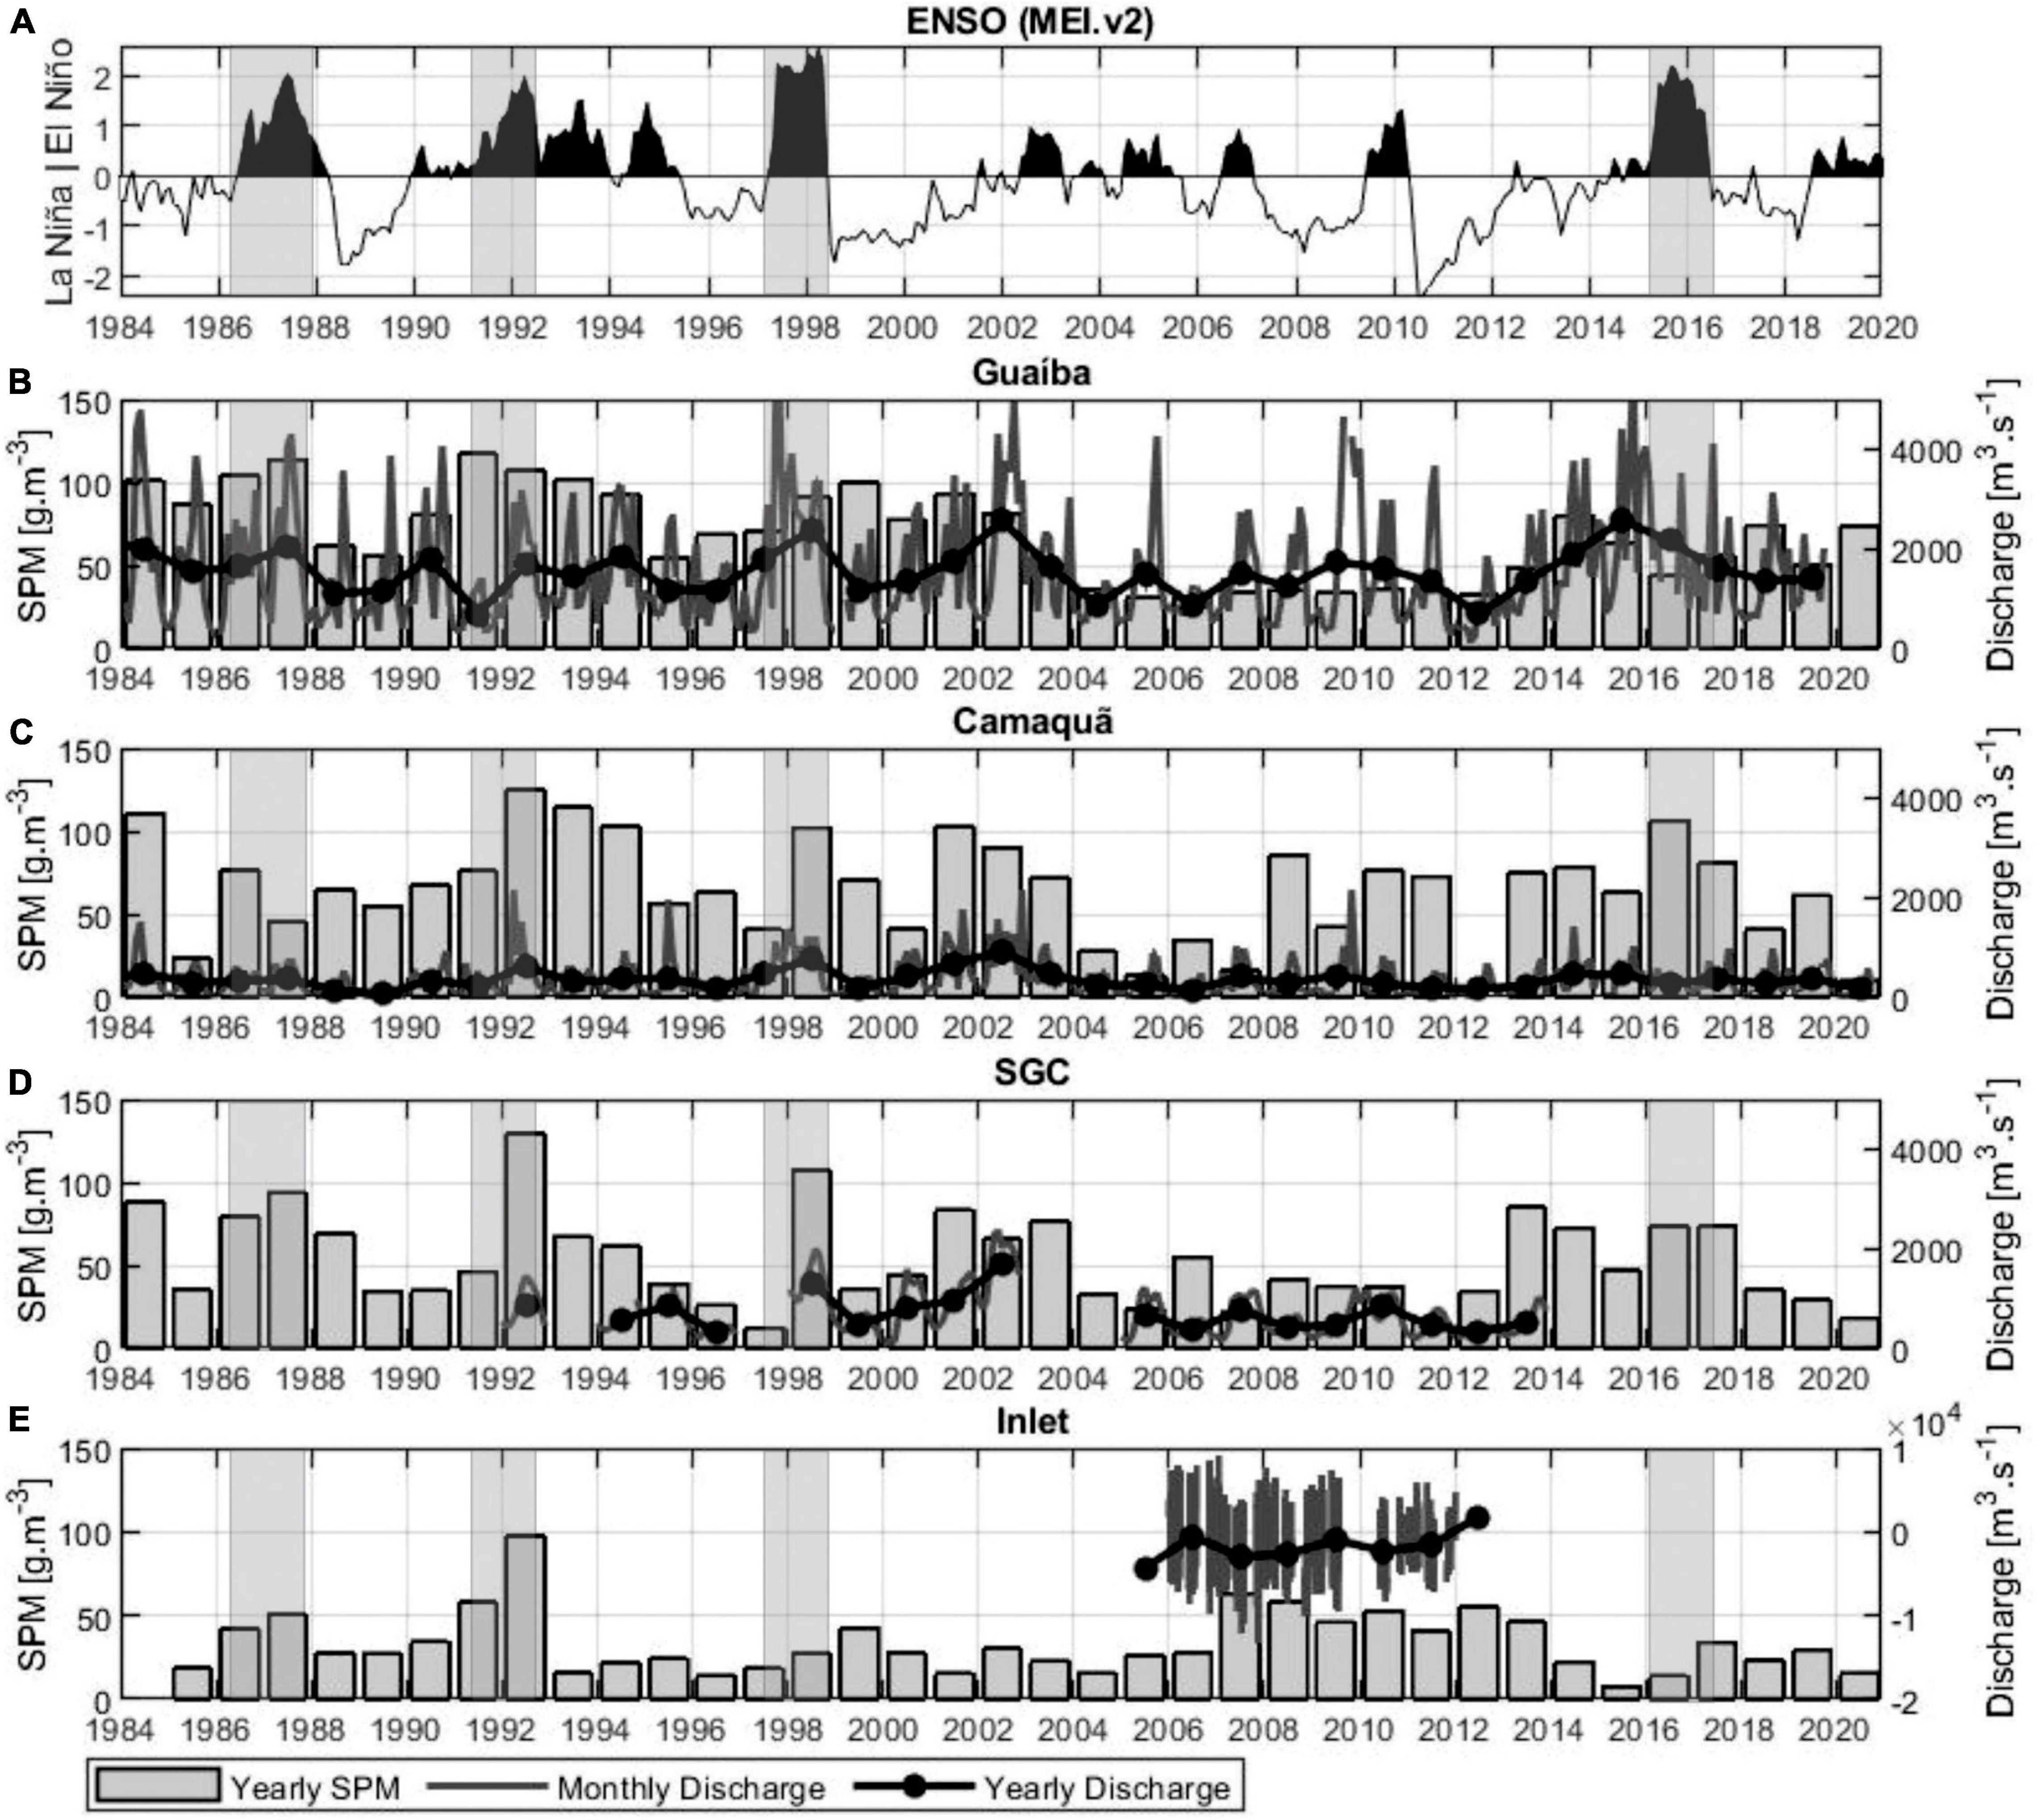
Figure 5. Comparison between ENSO phenomena, SPM concentrations (in situ + modeled), yearly and monthly discharges of each tributary. The ENSO index is represented on the top panel (A), where the periods of expressive El Niño events (MEI v.2 around 2) are highlighted by gray rectangles. The MEI v.2 positive values represent El Niño periods and the negative represent La Niña periods. The following panels represent the mentioned parameters for each tributary, Guaíba River (B), Camaquã River (C), SGC (D), and Inlet channel (E). The SPM concentration (g.m–3) is expressed by gray bars, with two exceptions without any data (SPM or scenes), one for Camaquã River in 2012, and the other for Inlet channel in 1984. The mean yearly discharge (m3.s–1) is illustrated by a black dotted line and the mean monthly discharge (m3.s–1) is demonstrated by the dark gray line.
Long-term (decadal scale) changes in SPM concentrations following ENSO oscillations are observed in Figure 5. The end of the last century (1984–2000) had more expressive El Niño
events than the more recent decades (Figure 5A). Such behavior is reflected in the SPM concentrations, presenting values that frequently overpass 100 g.m–3 (Figures 5B–E). This same period also shows a higher mean in comparison with the following decades. Non-significant El Niño events characterize the interval from 1999 to 2015, contrasting with more expressive La Niña periods, which present low SPM concentrations among all the tributaries, rarely reaching 100 g.m–3.
There is also a relationship regarding short-term variability (yearly scales), where peaks in El Niño events are synchronous with positive values of SPM concentrations, and valleys are linked to La Niña periods (Figures 5, 6). This positive association is best observed during extreme El Niño events, which occurred in 1986–1987, 1991–1992, 1997–1998, 2015–2016 (Figure 6). The overall maximum values of SPM concentrations of each tributary occurred in the 1991–1992 El Niño event, as follows: Guaíba River 117.6 g.m–3 in 1991, Camaquã River 125.2 g.m–3 in 1992, SGC 129.5 g.m–3 in 1992, Inlet 97.56 g.m–3 in 1992.
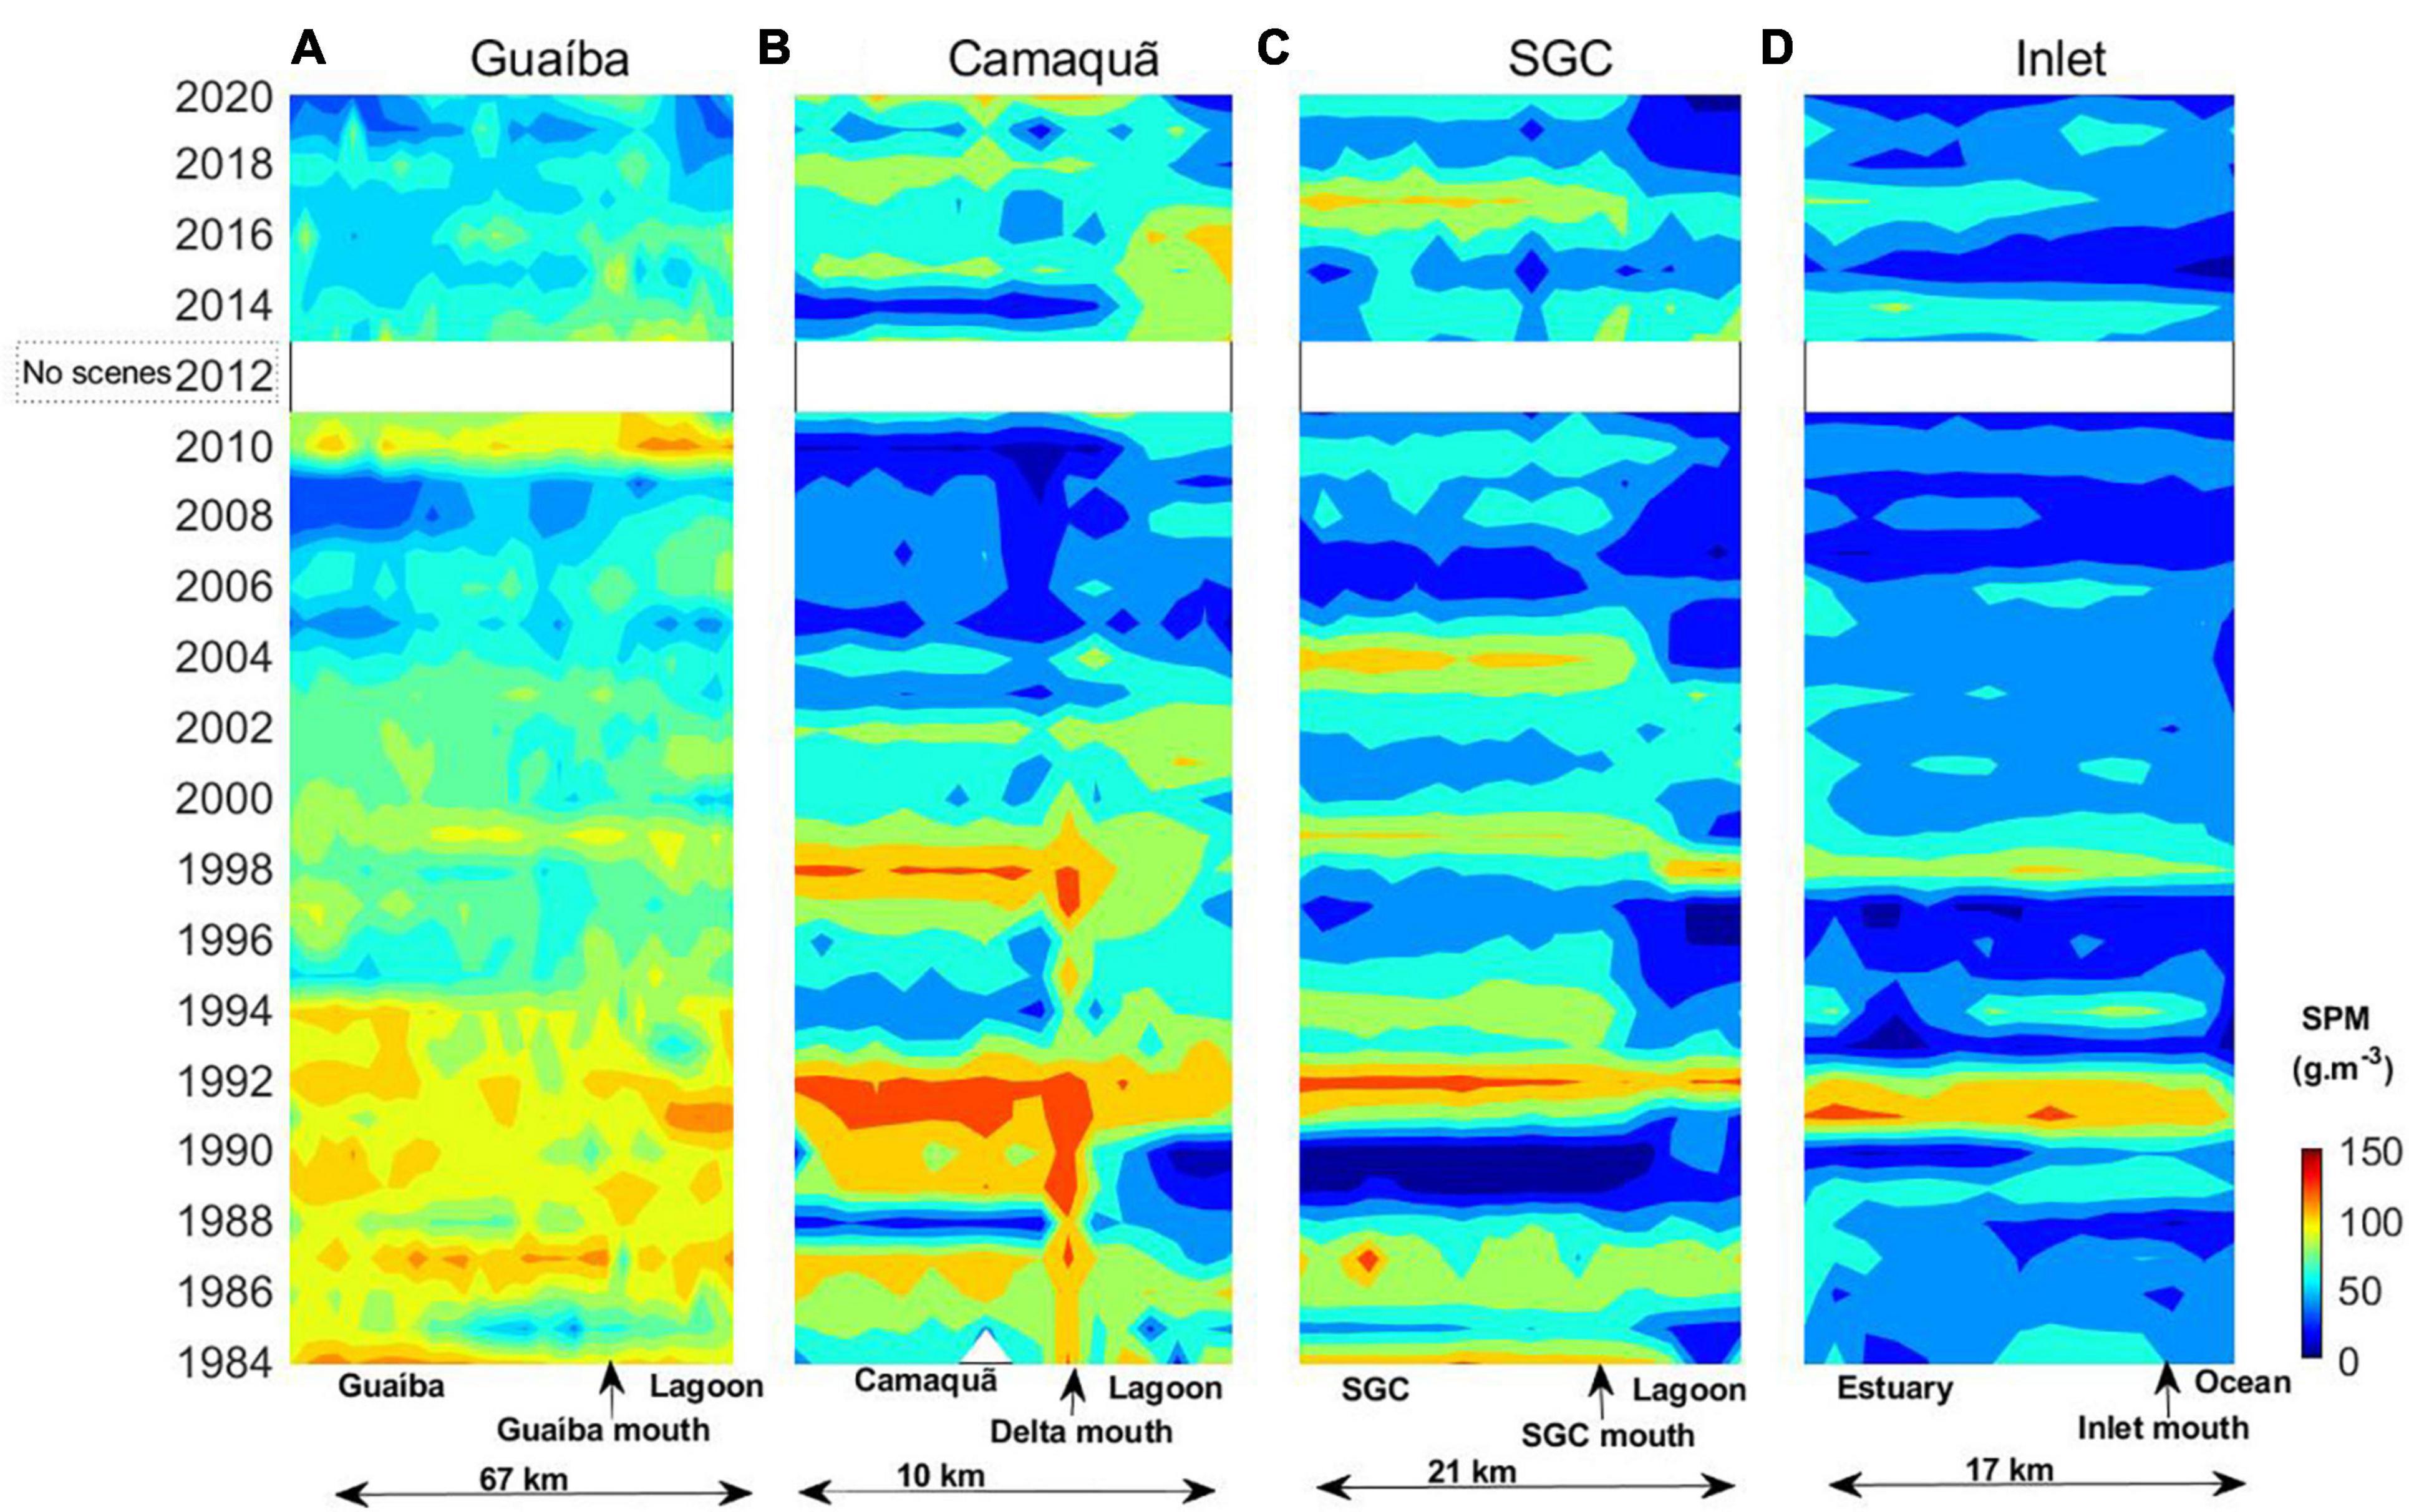
Figure 6. Space-time representation of mean SPM concentration (g.m–3) through the longitudinal transects of each tributary. The y-axis show the years of the time series (1984–2020), while the x-axes represent the spatial variation with plotted key points. Each tributary configuration is illustrated in a single panel, Guaíba River (A), Camaquã River (B), SGC (C), and Inlet channel (D). No scenes are available for the year 2012.
The tributaries have particularities when responding to ENSO cycles, and some present a more direct relationship than others. Guaíba River has less pronounced variability, and among the tributaries presented more homogeneous concentrations, with values usually over 50 g.m–3, except for the 10 years from 2003 to 2013, when La Niña events prevailed. Camaquã River and SGC have marked variabilities, whose averages oscillated more than 50 g.m–3 from 1 year to another, mainly when El Niño periods occurred. The two higher yearly mean SPM concentrations were calculated for SGC (129.5 g.m–3) and Camaquã (125.2 g.m–3) for the year 1992. The Inlet usually presents higher SPM concentrations at the end of El Niño periods and increasing trends from the peaks of each La Niña period, and such trends remained until the following El Niño peak. Thus, the increasing pattern in SPM concentrations is observed in all tributaries, although not so well defined in all of them.
Spatial and Temporal Suspended Particulate Matter Variability at the Tributaries
The interannual SPM variability (from 1984 to 2020) along the transects of each tributary is represented in Figures 6A–D, also evidencing relationship with the ENSO phenomena. The El Niño events in 1986–1987, 1991–1992, 1997–1998 are well marked in all the transects, mainly in the upstream portions. The 80s and 90s (last century) presented higher SPM concentrations, contrasting with the lower SPM concentrations of the first decade of the XXI century, in agreement with the previous section observations. SPM concentrations are relatively more homogeneous in Guaíba River across the years in comparison with the southward tributaries, where the peaks and low values are more contrasting. Regarding all the tributaries, the SPM concentrations are relatively higher northward, and the peaks of all of them are reflected in the inlet contribution.
Figures 7A–D presents the monthly mean SPM concentration throughout the 1984–2020 time series, allowing the identification of seasonal variability on the loads of the tributaries. The tributaries presented strong seasonality with relatively higher SPM concentration contributions from June to December (from winter to spring) and lower concentrations measured from January to May (from summer to autumn).
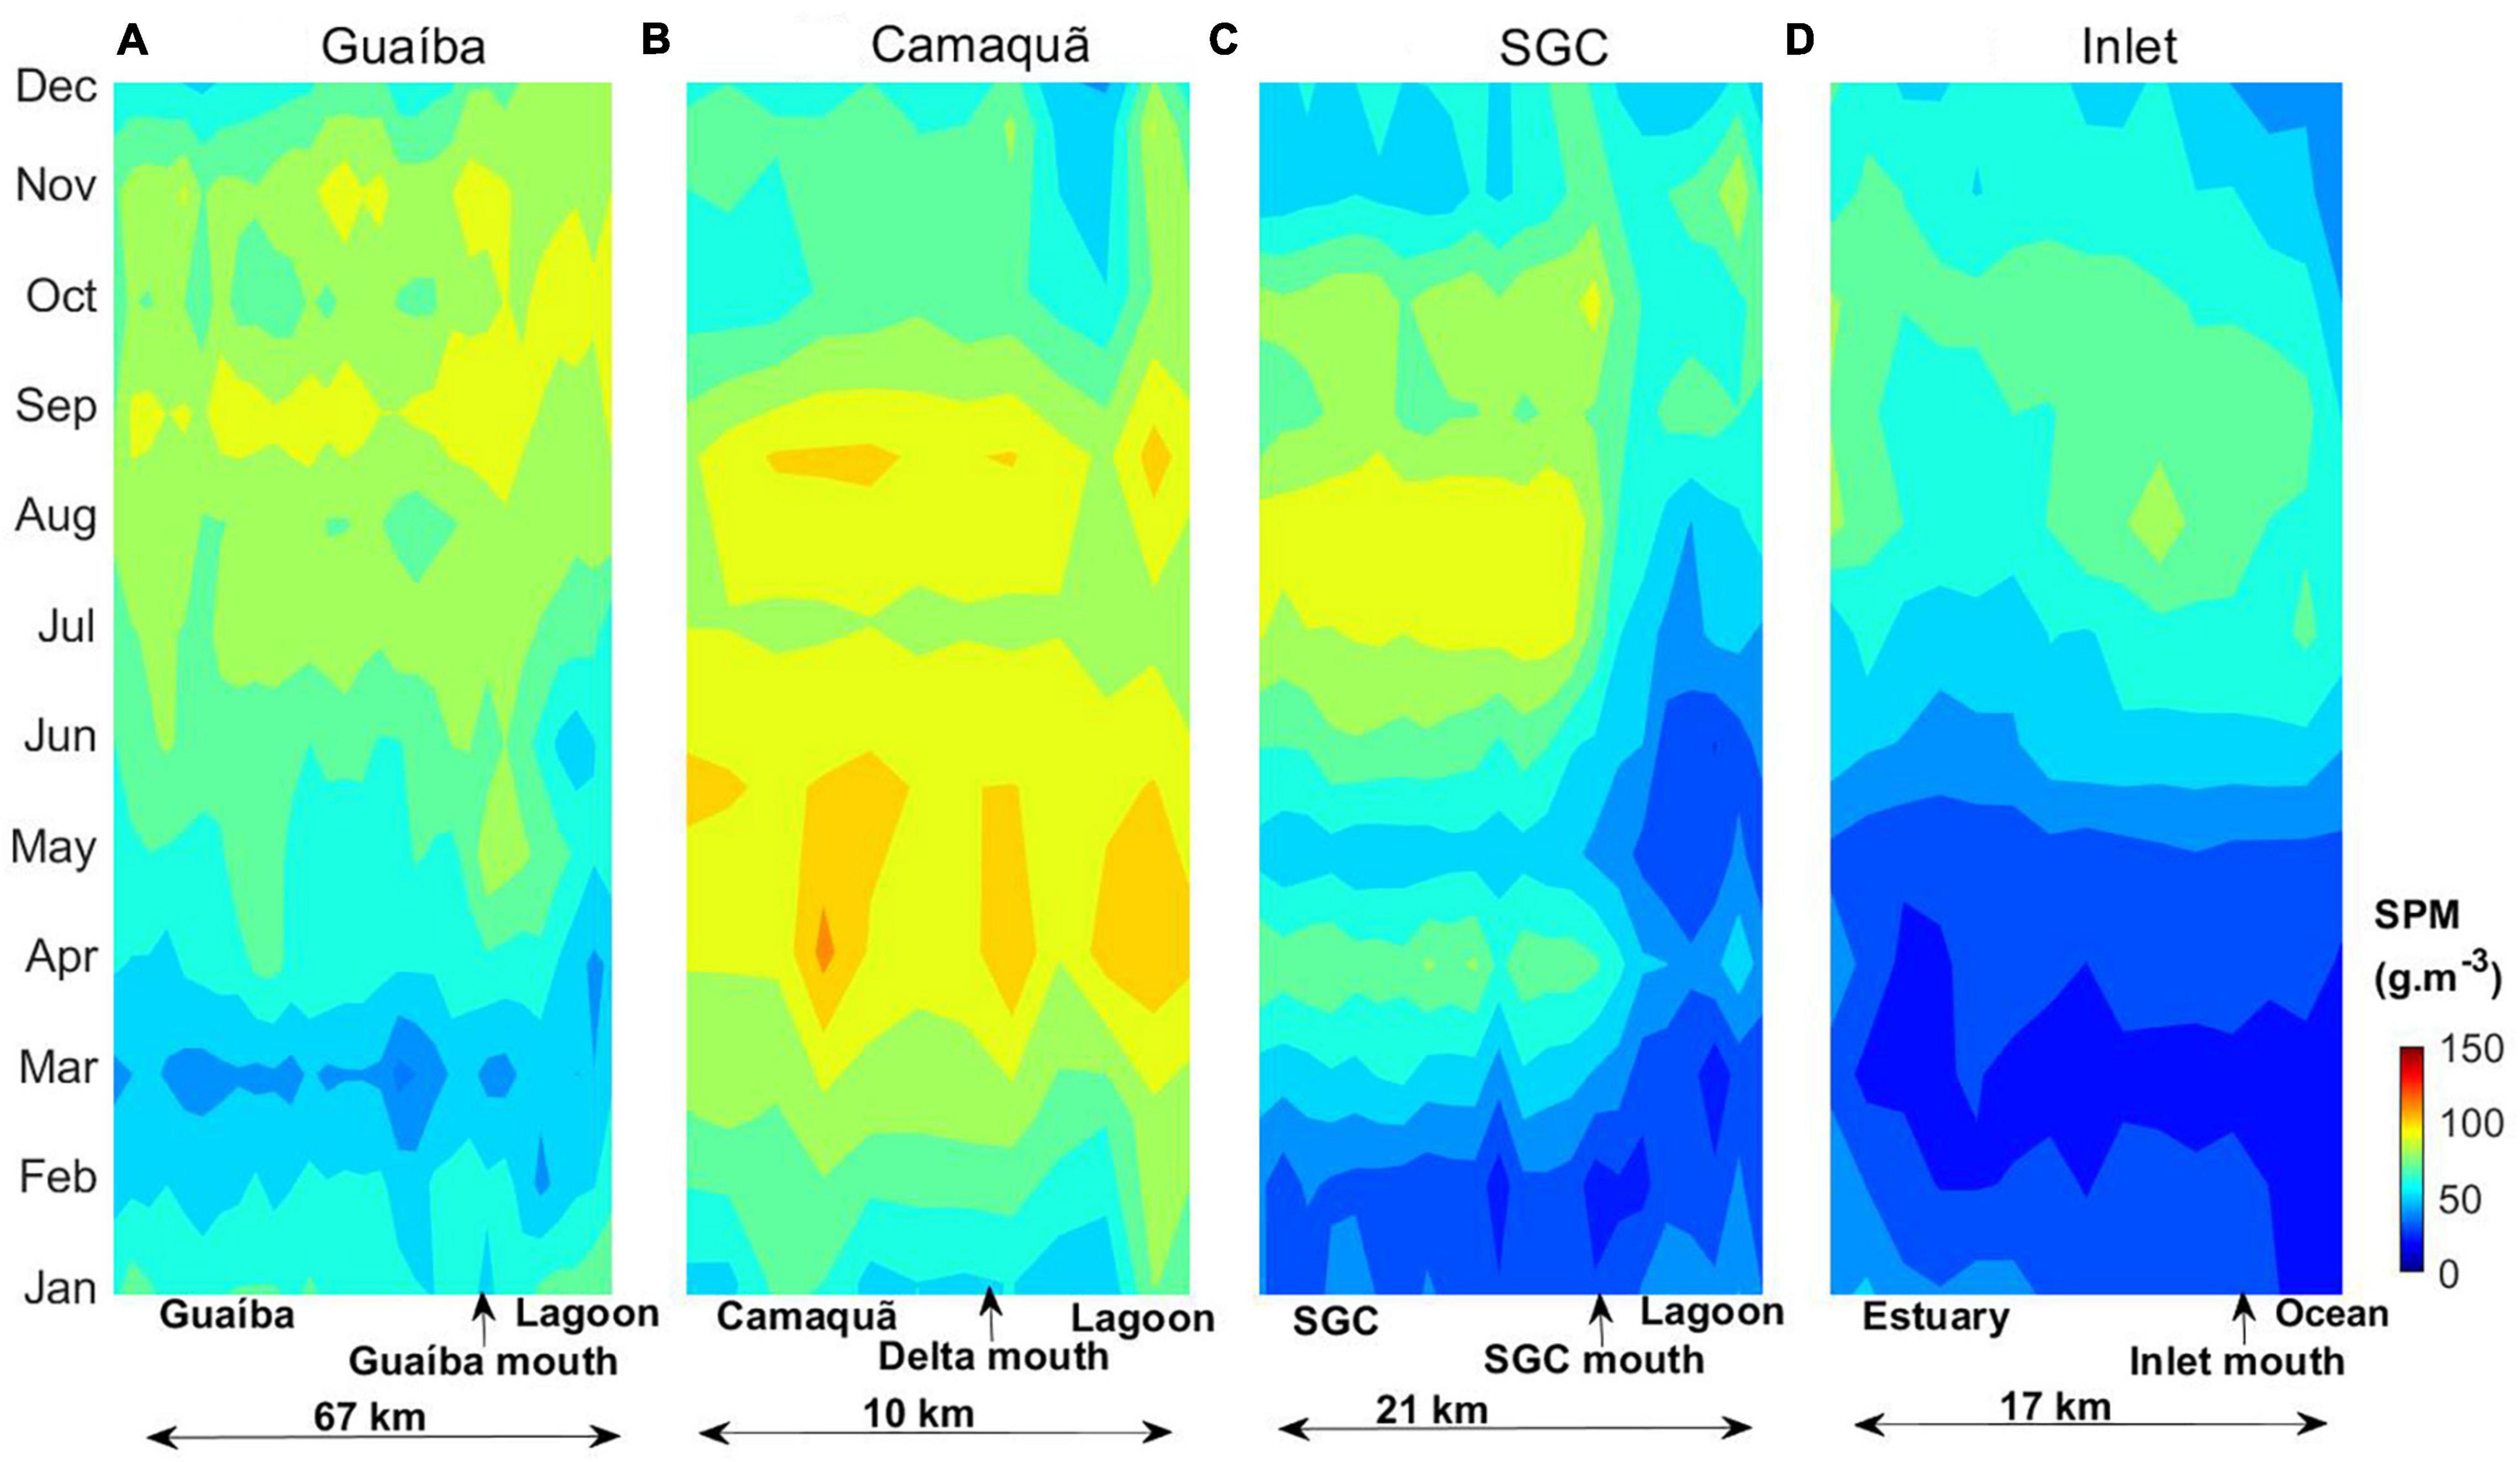
Figure 7. Spatial and temporal representation of mean SPM concentration (g.m–3) through the longitudinal transects of each tributary. The y-axis show the mean monthly SPM concentration, while the x-axes represent the spatial variation with plotted key points. Each tributary configuration is illustrated in a single panel, Guaíba River (A), Camaquã River (B), SGC (C), and Inlet channel (D).
The mouth of the tributaries represents a key point (Figures 6, 7) beyond which SPM concentration patterns usually switch from high SPM concentration (upstream) to low (downstream). However, high concentration rates remained basinward to which years of expressive SPM concentration coincide with El Niño events or occur from June to December.
Discussion
The SPM concentration in Patos Lagoon is mainly controlled by the freshwater discharge of the tributaries and secondarily by the winds (Moller et al., 2001; Távora et al., 2019, 2020b; Bitencourt et al., 2020). The long-term (1984–2020) period analyzed in the present study allows reliable interpretations of the seasonal, interannual and interdecadal SPM concentrations and spatial patterns. At these long timescales, the freshwater input is an important forcing on exchanges with the ocean, while winds are the main control at short time scales (Távora et al., 2019).
Cyclicity in Environmental Parameters From 1984 to 2020
The 1-year peak was the main signal variability recorded in the discharge and SPM concentrations for all the main tributaries (Figure 4), which means that there is a high energy cyclicity once a year when the discharges and SPM concentrations are higher. This cyclical time scale is associated with seasonal deterministic forcings (Jalón-Rojas et al., 2016), such as the increase in river flow (rainy seasons) on austral winters (21 Jun–21 Sep) and springs (21 Sep–21 Dec). In general, there is a good agreement between discharge and SPM concentration signals (Figure 4), however, the discharge reached the significance limit more often, probably due to fewer gaps in the dataset.
The observed long-term cyclicity (∼ 16 years) is likely related to stochastic discharge events and ENSO cycles. The Guaíba River has a secondary SPM concentration peak (Figure 4A), detected at about 16 years, and although the discharge is not a statistically significant threshold, it presents a relatively high power during this period. This 16 years peak is also well marked in the other tributaries, but only reached the significance level at the Inlet (Figure 4D). This signal was probably detected in response to the El Niño phases of 1998–2015, and 1986–2002 (Figure 5A), both spaced about 16 years, and it is not expected to represent a coastal process. The SGC tributary presents SPM concentration peaks around 7 years (Figure 4C), which can be linked to the spacing between ENSO cycles (Figure 5A) at the end of the last century (1986/1987–1991/1992–1997/1998), whose intervals correspond roughly to this scale. These 7-years peaks are marked in all the tributaries, although only the SGC had enough power to attain the significance level.
Seasonal to Interdecadal Response of Suspended Particulate Matter Concentrations to El Niño-Southern Oscillation
Each study area presents a peculiar response to ENSO, relying on the drainage basin characteristic, anthropogenic structural changes, agricultural land use, deforestation, mining, and urban expansion (Hestir et al., 2013; Dogliotti et al., 2016; Bueno et al., 2021). The environmental changes associated with the ENSO phenomenon have been studied in coastal systems from seasonal to decadal time scales (Hestir et al., 2013; Gray et al., 2015; Dogliotti et al., 2016; Bitencourt et al., 2020; Távora et al., 2020b; Karl et al., 2021). Interdecadal sampling, however, allows reliable interpretations about natural processes trends, as otherwise the interannual analysis can be based on the trends of a specific decade (Gray et al., 2015). Interdecadal studies already reported an increase of about 10 times in sediment transport of a coastal river during El Niño years (Gray et al., 2015). Other environments, however, observed low turbidity values associated with different responses of tributaries to interdecadal events (Dogliotti et al., 2016). Thus, study cases reporting the behavior of tributaries on interdecadal observations are crucial for monitoring the global scale ENSO influence on suspended sediment fluxes and climate variability (Rühl et al., 2021).
The El Niño events occurred with higher intensity for longer periods and more often during the last 16 years of the XX century (Figure 5A) than in the XXI century, as indicated by the proportional relationship between discharges, SPM concentrations, and ENSO positive peaks (Figure 5). The higher SPM concentrations of each tributary were measured during this 16 years period of intense El Niño events, while the following 16 years are marked by significant La Niña and moderate El Niño events, producing lower discharges and SPM concentrations, especially between 2003 and 2013. This decadal variability is also noted in Figure 6, where the longitudinal transects show higher SPM concentrations before 2000. The variability of SPM concentrations seems to behave in interannual trends. The increasing trends in SPM concentration from La Niña peaks to El Niño peaks are not well recognized in the XXI century because such a period is marked by the absence of expressive El Niño events.
The SPM concentrations also respond on a yearly scale to the El Niño events (Figures 5, 6). However, the magnitude of the response of each tributary relies on the characteristics of their watersheds and drainage morphology. The relatively more homogeneous SPM concentrations of Guaíba River (Figures 5B, 6A) are probably due to its broad depositional basin morphology (≤ 20 km width), which is similar to a lake and less vulnerable to flow variations. In addition, this water body has a residence time of about 10 days (Toldo and Almeida, 2009) and the deposited sediments are prone to resuspension by wind action (Nicolodi et al., 2013). This pattern can also result from its wide drainage basin11, which is about 84,763 km2, delivering the non-synchronized loads from nine sub-basins (Scottá et al., 2019).
The Camaquã River is a tributary with morphology and discharge behavior typical of fluvial systems, showing a good yearly proportion between ENSO events and SPM concentrations (Figures 5C, 6B). The Camaquã drainage basin (see text footnote 6) is about 21,657 km2, with a narrow river channel (∼ 150 m), turning it more susceptible to changes in water quality following discharge pulses. The SGC has a unidirectional flow through a narrow channel (∼350 m), developed by differences in water level between Patos Lagoon and Mirim Lagoon (Oliveira et al., 2015; Oliveira et al., 2019), whose watershed encompasses (see text footnote 6) 28,499 km2. The outflow through the channel is also controlled by wind effects (Oliveira et al., 2019). Nevertheless, the El Niño effects are well marked in the region (Figures 5D, 6C). Freshwater discharges over 3,000 m3.s–1 limit the inflow of seawater, which is also minimized by the microtidal regime (Moller et al., 2001; Fernandes et al., 2002). The prevailing ebb flow favors the export to the ocean, and the higher SPM concentrations at the Inlet have good correspondence with El Niño cycles (Figures 5E, 6D).
The SPM concentrations represented through the transects in Figure 6 show the contrast between the El Niño/La Niña periods. Years that represent intense El Niño events (1986–1987, 1991–1992, 1997–1998, 2015–2016) usually have high SPM concentrations, except for the years 2015–2016. Recent studies suggest that the 2015–2016 El Niño event might be overestimated (Van Oldenborgh et al., 2021), in agreement with what is observed in the present work and with Bitencourt et al. (2020). During years of El Niño events, SPM concentrations remained relatively high even downstream from the river mouth, evidencing the development of river plumes. Thus, these periods have a more significant load contribution to the lagoon and consequently to the Atlantic Ocean.
Seasonality of freshwater discharge is also very well marked in the SPM concentrations along the transects (Figure 7). Periods of higher discharges in the mid-latitude rivers (austral winter and spring) (Vaz et al., 2006; Marques and Moller, 2008) recorded the higher SPM concentrations for all the tributaries, with subtle variations according to each drainage basin characteristic, as discussed before. After the river load reaches the lagoon, solids in suspension can be deposited and the exceeding material is exported towards the ocean. Bortolin et al. (2020) showed that this fine suspended load is deposited inside Patos Lagoon forming mud depocenters established according the hydrodynamic conditions. The Inlet panel (Figure 7D) shows that from June to November the export of SPM to the Atlantic Ocean is higher.
Conceptual Model About the Dynamics of Suspended Particulate Matter Load
The SPM load in a choked lagoon under a microtidal regime is regulated by the discharge of the tributaries (Kjerfve, 1986, 1994). El Niño events and seasonal discharges are the main control to the SPM contribution of the tributaries, as they will drive the sediment export to the lagoon and later to the ocean. The El Niño cycles control the intensity and frequency of the discharge events, directly influencing the yearly mean SPM concentrations delivery to Patos Lagoon in a stochastic frequency (Figures 5, 6). The seasonality promotes SPM loads reaching the lagoon in a deterministic pattern (Figure 7), where the lower SPM concentrations occur during austral summer and autumn, while the higher concentrations are related to the winter and spring discharges (Vaz et al., 2006).
The tributary plumes behave differently during low input periods (LIP) and high input periods (HIP), whose conceptual models are illustrated in Figures 8A,B, respectively. These models were developed based on the interpretation of the spatial-temporal variability of SPM concentrations responding to ENSO and seasonal forcings described in the current work. Moreover, the dynamics of the discharged SPM was also characterized by: (1) examining Red-Green-Blue true-color composite images (hereon RGB composites) and (2) analyzing studies which also investigated the behavior of the SPM reaching Patos Lagoon (e.g., Pagot et al., 2007; Fassoni-Andrade et al., 2015; Távora et al., 2019, 2020b) and exported to Atlantic Ocean (Marques et al., 2009, 2010; Vinzon et al., 2009; Marta-Almeida et al., 2021).
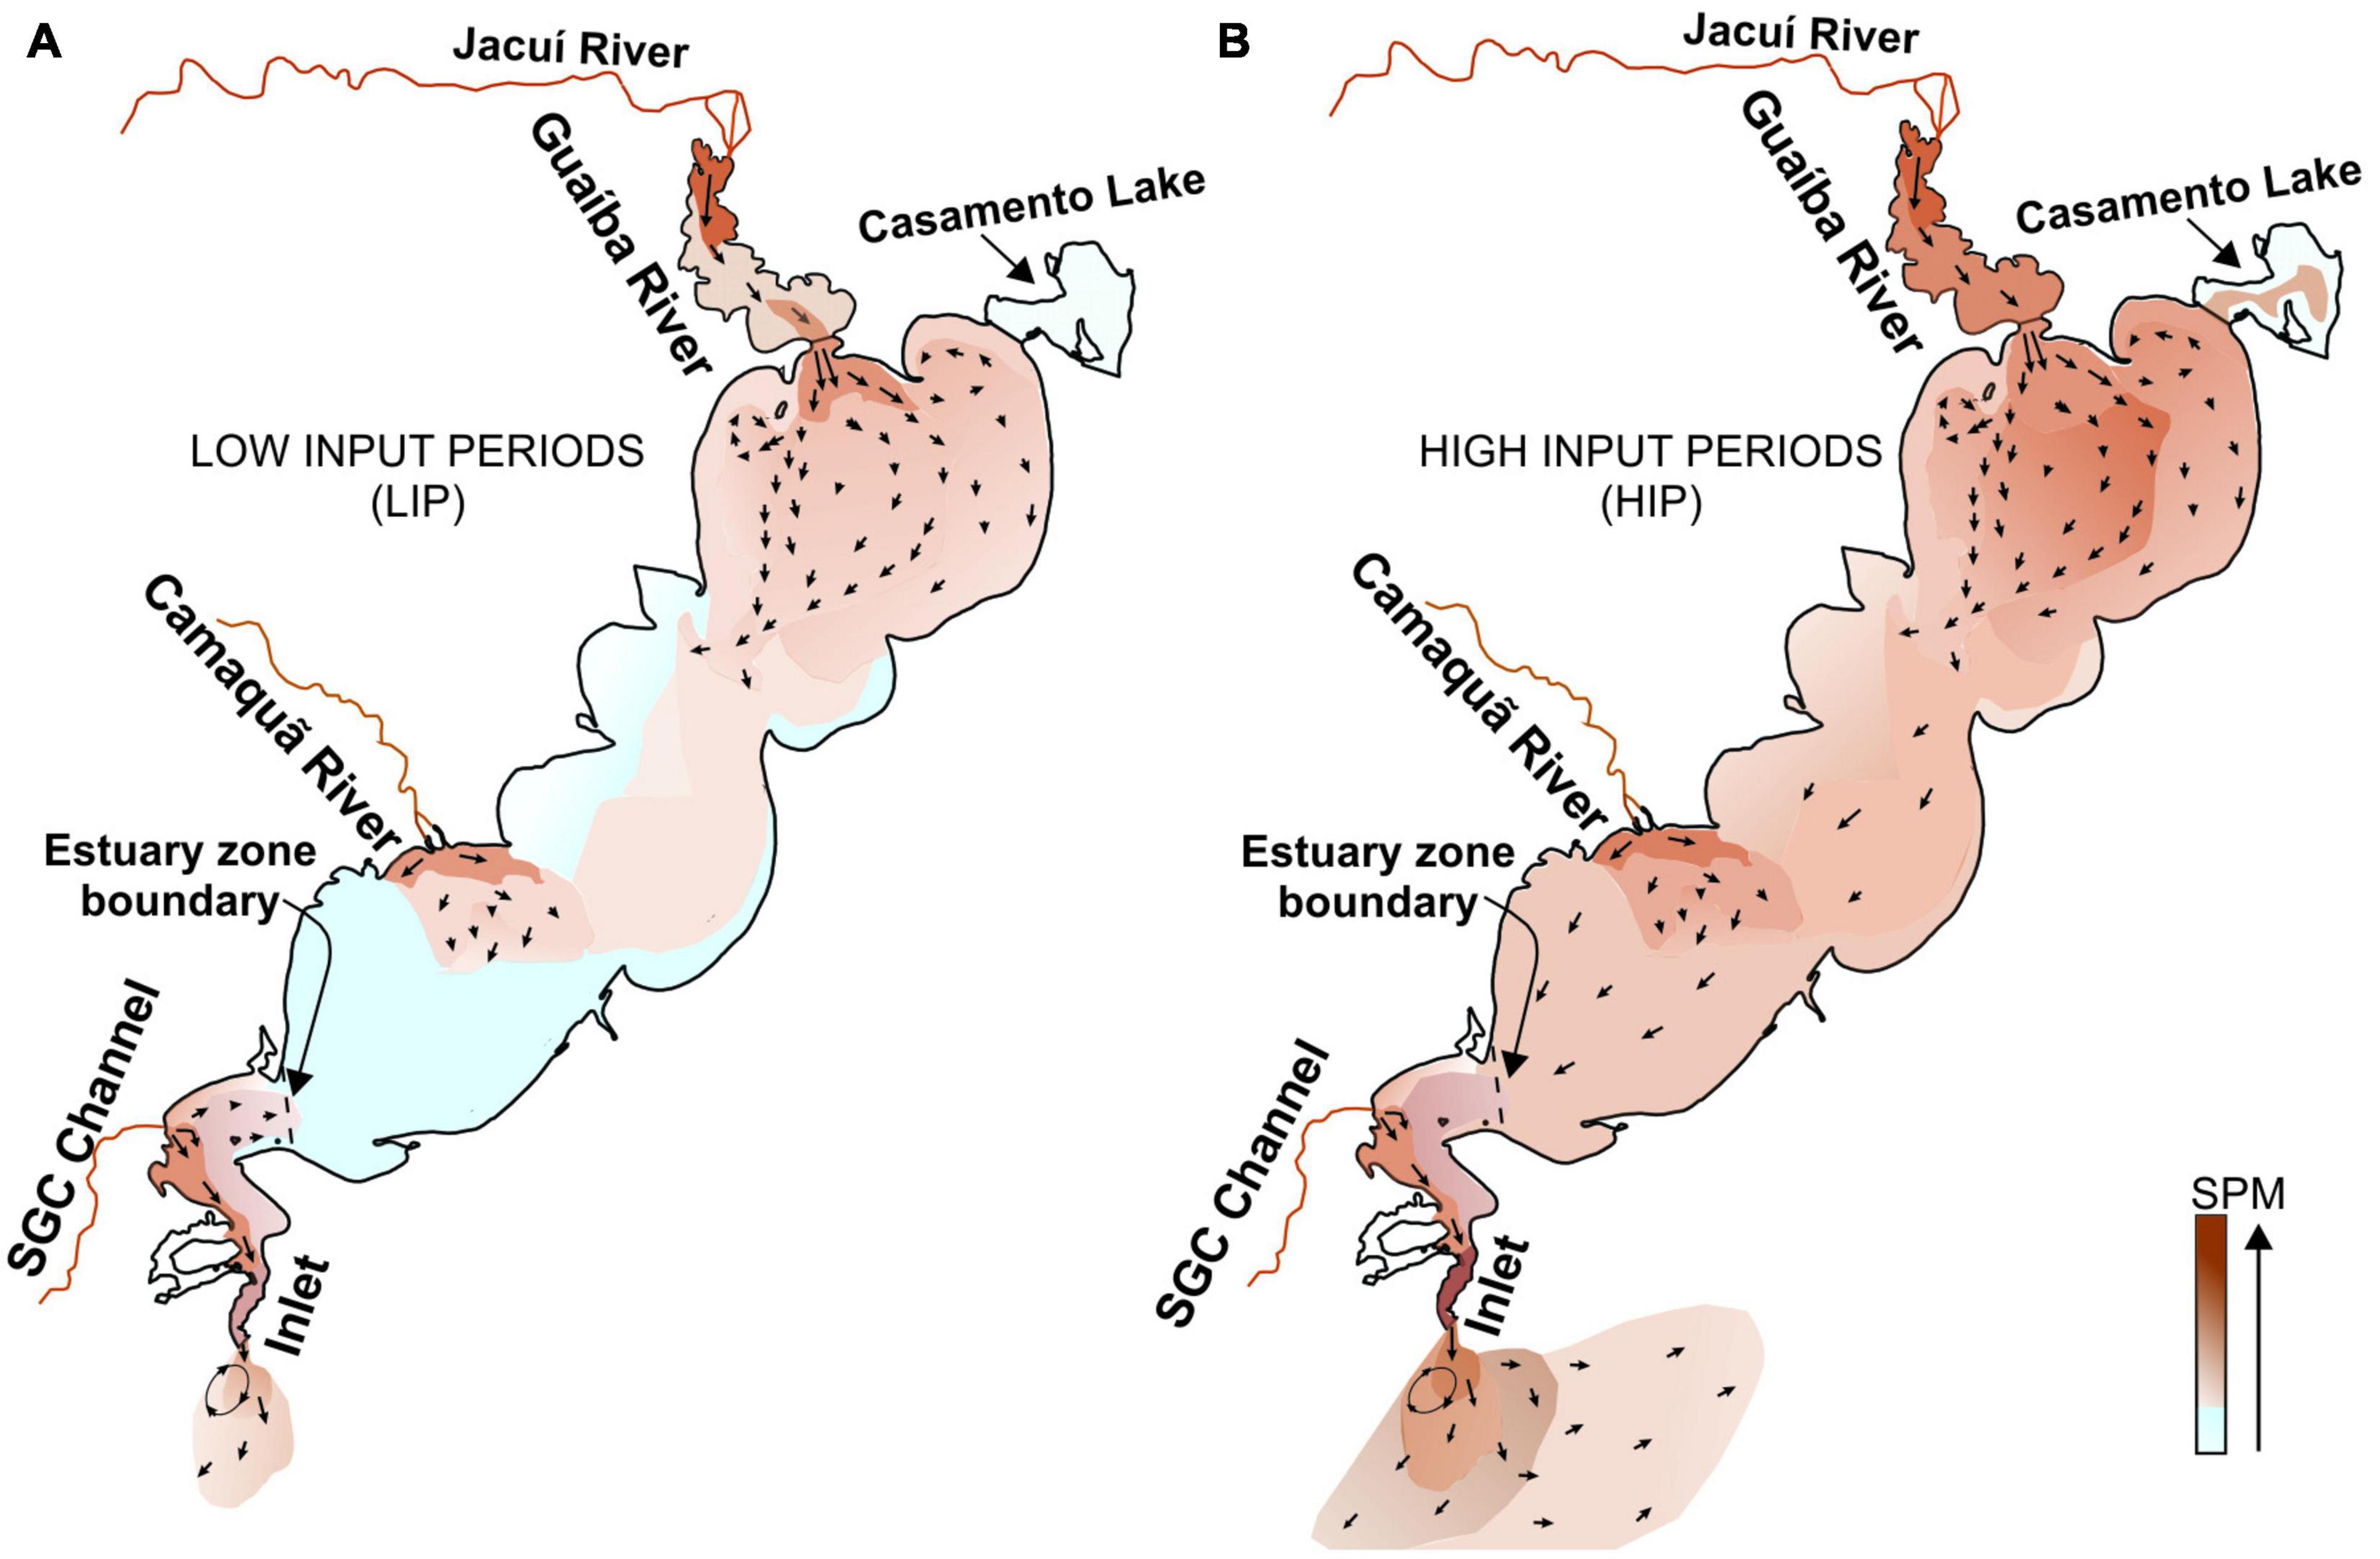
Figure 8. (A) Conceptual model developed for the regular behavior of each tributary SPM load during low input periods (LIP). (B) Conceptual model developed for the regular behavior of each tributary SPM load during high input periods (HIP).
The LIP (Figure 8A) presents reduced SPM concentrations through the lagoon, with limited environments where the plumes of the tributaries exert influence, which can be observed in the RGB composite images created by ACOLITE (Supplementary Material). During the LIP, the reduced SPM load remains in the sub environments (mud depocenters) of Patos Lagoon. Consequently, the low export to the Atlantic Ocean is controlled mainly by the SGC, which is in the estuarine zone. The HIP (Figure 8B) is developed by periods of intense and frequent discharges of the tributaries, where these loads increase the turbidity throughout Patos Lagoon, which has a residence time longer than the discharge frequency of the tributaries (Toldo et al., 2000; Toldo and Almeida, 2009). The plumes of all the tributaries reach the estuarine zone during the HIP, which increases the export to the Atlantic Ocean and also the size of the Inlet plumes. The SPM behavior in both proposed conceptual models (LIP and HIP) will be detailed below.
Both scales of variability (ENSO and seasonal) act combined to develop different concentration gradients throughout the lagoon body. Therefore, it is common for El Niño years to have occasionally low SPM concentrations during the dryer season (austral summer and autumn), as it is common to have high SPM concentrations during the wet seasons (austral winter and spring) even in the course of La Niña events, although the HIP configuration is more frequent and more intense during El Niño years. According to previous studies, the material reaching the lagoon is distributed by internal currents developed by wind effects (Bortolin et al., 2020), which control the sedimentation processes (Távora et al., 2019) and enhances or reduces the discharge to the Ocean (Moller et al., 2001).
The river plumes are usually investigated concerning the flow types in environments with tidal mixing and salinity variations (Hetland and Hsu, 2013; Horner-Devine et al., 2015; Shanmugam, 2018; Osadchiev and Zavialov, 2020). Such condition is, however, negligible nearby the main tributaries of this broad back-barrier environment, which is almost isolated from the ocean tides and currents, providing a singular opportunity to investigate the SPM behavior modulated by freshwater discharges and wind effects.
The Guaíba plume covers the largest area in comparison with the other tributaries reaching Patos Lagoon (Figures 8A,B), and is composed mainly of fine sediments (silt and clay), because the Guaíba river traps most of the coarse grains (Toldo et al., 2000; Vaz et al., 2006; Nicolodi et al., 2013). The Guaíba River has a residence time of about 10 days (Toldo and Almeida, 2009), and the variability on Guaíba River SPM concentration is mainly controlled by Jacuí River discharges (Vaz et al., 2006). During periods of low frequency (from January to June) in Jacuí River discharge, Guaíba river can become a low or moderate turbidity environment (Figure 9A), responding to each new Jacuí discharge (Figure 9B).
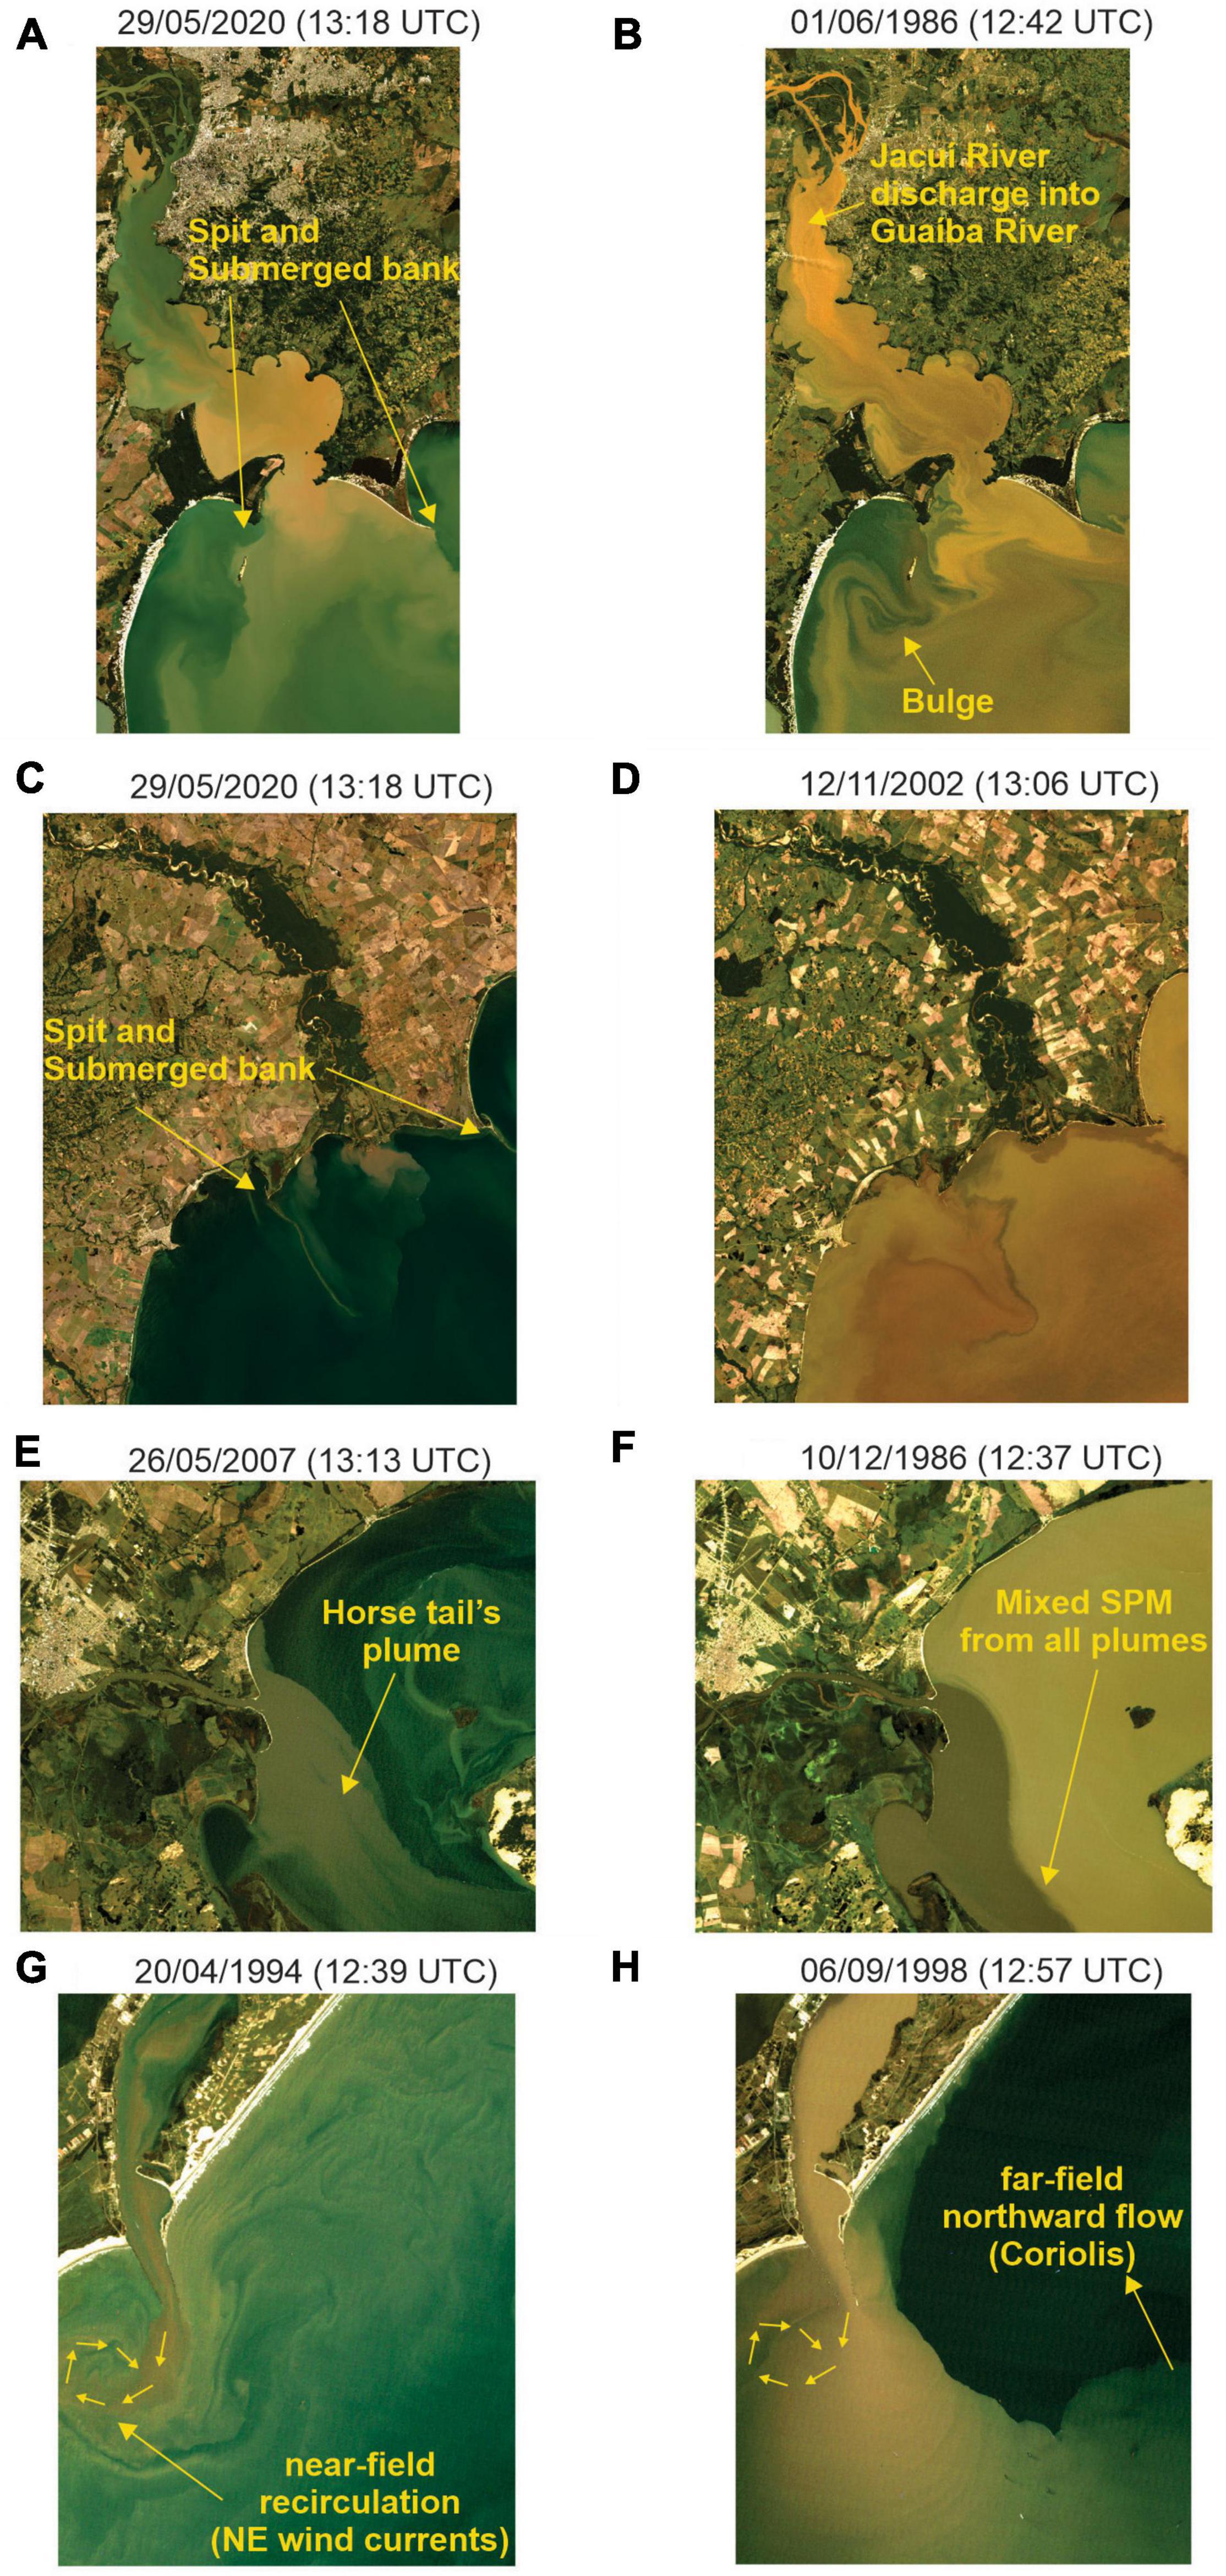
Figure 9. Landsat images representing the main characteristics described during the low input periods (LIP, left panels) and the high input periods (HIP, right panels) for each tributary. (A) Represents the load of Guaíba plume dissipating in the northern cell of Patos Lagoon between the two submerged banks which follow the spits. (B) Represents the development of a bulge of the Guaíba river plume, also evidences the contrasting color of a new Jacuí River load into Guaíba. (C) Camaquã River plume during the LIP, limited by the submerged banks. (D) Camaquã River load spreading over the region limited by the submerged banks. (E) Typical SGC plume during LIP. (F) Mixing between the plumes of all tributaries in the lower estuarine zone. (G) Recirculation at the near-field plume developed by NE wind-generated currents. (H) Represents the near-field recirculation under NE winds influence, while the far-field reached due to the development of larger plumes during HIP flow northward influenced by the Coriolis force.
The dynamic regions of a plume can be characterized by the distance that it reaches from the mouth of the tributaries, as follow, near-field, mid-field, and far-field (Hetland and Hsu, 2013). The fine grain composition of this plume associated with the wide river mouth of Guaíba River favors the plume dispersion, usually without developing a strong jet at the near-field. At the mid-field a recirculation feature (called bulge) is currently developed after the spit-bank structures of the northern cell of the lagoon (Figures 9A,B). The plume evolves its far-field towards the southern cells of Patos Lagoon (Figure 8), enhanced by the predominant NE winds (frequent during summer) (Hetland and Hsu, 2013; Távora et al., 2019). Although the Guaíba River contributes with almost 61% of the suspended load delivered to Patos Lagoon (Vaz et al., 2006), the suspended material has to be transported for more than 200 km to be exported to the ocean (Fernandes et al., 2002), and part of the fine material remains in the lagoon, mainly in the northern cell (Bortolin et al., 2020). Previous studies already reported decreasing sedimentation rates from the northern cell to the southern cell of the lagoon (Ivanoff et al., 2020).
During the LIP (Figures 8A, 9A), this far-field plume can be directed by NE winds, diluting gradually in the central cells (Távora et al., 2019), reaching the southern depositional environments but rarely attaining to the estuarine zone and the Casamento Lake (Figure 1). The Patos Lagoon reaches longer residence times (∼ 108 days) (Toldo et al., 2000; Fernandes et al., 2002), especially during low discharge circumstances, and this low discharge can cause a delay in the spread of the SPM plume towards the south. For this reason, material discharged during austral spring can be dissipated southward by NE wind-driven currents (Bortolin et al., 2020); a low discharge pattern that lasts until summer (Távora et al., 2019). Therefore, the fine sediments discharged tend to remain and accumulate in the mud depocenters of Patos Lagoon, especially in the northern cell (Bortolin et al., 2020). During the HIP (Figure 8B) this plume is spread throughout the lagoon, reaching all the lagoon cells, Casamento Lake, and the inlet.
Camaquã River plumes are usually limited between the sandy spits and the respective submerged banks during the LIP (Figure 9C). Its plume presents near-field hyperpycnal flow developed due to the sandy load of Camaquã River (Toldo et al., 2000), and a dissipating characteristic offshore from which the buoyant portion eventually reaches 16 km from the mouth. Camaquã River is smaller than Guaíba River and has a shorter residence time, hence has more drastic flow changes and its plume can change characteristics with each outflow episode. This significant variability in the plumes characteristics according to flow changes is typical in small rivers (Osadchiev and Zavialov, 2020). Such stronger variability is noticed in the SPM concentrations represented in Figures 5–7, as discussed in the last section. During the HIP, the magnitude and frequency of freshwater discharge increases, forcing the far-field plume to move to the southern cell (Figure 9D), and mixing with the material discharged from Guaíba and flowing towards the Inlet (Figure 8B).
The SGC plume is at the estuarine zone (Figure 8) and has a high occurrence frequency throughout the year combined with higher SPM concentrations during El Niño years (Figure 6). Although its SPM concentration is lower in comparison with the other tributaries (Figure 5), this plume has a horse tail’s shape (Shanmugam, 2018) and deflects directly towards the inlet region (Figure 9E). The SGC plume can be interpreted as the main plume influencing the inlet during summer, autumn, and the first winter month (July)—during this period SPM from the other tributaries usually remains limited to their area of influence. The plumes of the other tributaries finally reach the estuarine zone during winter, moved by the increase in discharge, and are mixed with the SGC plume (Figure 9F). Hence, during winter all the tributaries influence the export to the Atlantic Ocean.
The concentration of SPM at the inlet is proportional to the amount of the exceeding fine material exported to the ocean. Previous studies reported that the freshwater discharge is the main control on Patos Lagoon plumes size (Marques et al., 2009, 2010). Wind action exerts a secondary influence, because the lagoon axis is parallel to the prevailing wind direction (NE-SW) (Bitencourt et al., 2020; Bortolin et al., 2020). The fine SPM which did not deposit in the Patos Lagoon mud depocenters and remained in suspension is mostly clay (Bortolin et al., 2020).
The inlet plumes spread near the coast (Figure 9G), mainly controlled by wind effects, where NE winds are more frequent and drive the plumes southward due to the alongshore currents, while south-quadrant winds are less common and deflect the plumes northward (Moller et al., 2001; Marques et al., 2009). The southward plume deflection causes a recirculation bulge in the zone sheltered by the jetties (Figure 9G), developing areas prone to flocculation and deposition of fine SPM (Vinzon et al., 2009; Marques et al., 2010). The relatively high SPM concentration conditions occur preferably during El Niño periods (Figure 6), and austral winter and spring seasons (Figure 7). The high SPM concentration once aligned with NE winds enhances the export flows. These circumstances develop larger plumes in which the far-field portion deflects northward forced by the Coriolis effect (Figure 9H), independently of the direction of deflection of the near-field plume (Marques et al., 2009, 2010). Therefore, the discharge, winds and Coriolis forces together develop different configurations of the inlet plumes, according to the distance each plume reaches off the coast (Monteiro et al., 2011).
Our results suggest that Landsat satellites can provide long-term monitoring of SPM concentrations with detailed spatial resolution to allow estimates in narrow channels (as narrow as 200 m). Thus, they proved ideal for investigating the seasonal, interannual and interdecadal variability throughout decades on coastal systems. However, the temporal resolution of Landsat sensors is low compared to other satellites such as Moderate Resolution Imaging Spectroradiometer (MODIS). The latter offers daily temporal resolution, ideal to investigate shorter-term events, and might be more suitable to characterize episodic variations in the main lagoon water body, as long as those variations are larger than 250–1,000 m depending on the band of choice. The granulometry of the sediments discharged by each tributary also is a gap in knowledge and remote sensing methods are a promising possibility in future studies.
Conclusion
Patos Lagoon can be understood as a laboratory for studying the SPM contribution from tributaries and their plumes behavior under negligible tidal effects. The following topics represent the main conclusions achieved by the current work:
• A decadal variability is observed in SPM concentrations from the tributaries, which was associated with the intensity and magnitude of ENSO phases. Regarding the investigated period (1984–2020), the last two decades of the XX century were subject to El Niño events with higher intensity and duration than the XXI century.
• The SPM concentrations also respond yearly according to ENSO phases. The magnitude of the responses to ENSO is regulated by the characteristics of the watershed and the morphology of the tributary.
• Tributaries with narrow channels and typical discharge behavior of a fluvial system, such as Camaquã River, presented a proportion between ENSO events and SPM concentrations. The other tributaries were also influenced by other conditionings, as winds and residence time.
• The El Niño periods favor the development of the tributary’s plumes entering the Patos Lagoon and the Atlantic Ocean.
• Austral winter and spring are the seasons of higher SPM concentrations, and such amounts are enhanced during El Niño events.
• The ENSO and seasonal forcings combined regulate the delivery of SPM from the tributaries to Patos Lagoon and the fine sediments export to the Atlantic Ocean. These scales of variability led us to propose two conceptual models for Patos Lagoon, called Low Input Periods (LIP) and High Input Periods (HIP), based on the SPM load from tributaries and the SPM concentration gradient.
• The LIP is characterized by a reduced SPM concentration throughout the lagoon, and by the plumes of each tributary exerting local influence. During the LIP, there is a low export of SPM to the Ocean, when the SGC plume influences the estuarine zone the most, because the SPM from the other tributaries does not reach the estuarine area.
• The HIP present plumes spread throughout Patos Lagoon, and the whole water body becomes a turbid environment. The plumes of all the tributaries reach the estuarine zone. The Guaíba River plume is the largest plume of all tributaries. It develops a far-field portion towards the south and has to be transported about 200 km to reach the inlet. This plume influences the most Patos Lagoon exportation during the HIP periods, which represent the main export to the Atlantic Ocean. These periods develop larger plumes, where the far-field are under Coriolis effect, independently from the near-field portion which is influenced by wind action.
Data Availability Statement
The original contributions presented in the study are included in the article/Supplementary Material, further inquiries can be directed to the corresponding author/s.
Author Contributions
EB: intellectual development, writing, developing figures, and data collection and interpretation. JT: intellectual development, creating main MATLAB scripts, developing figures, and review. EF: intellectual development, writing, data interpretation, review, and discussion of ideas. All authors contributed to the article and approved the submitted version.
Funding
The authors are grateful to the LOAD Project—LOng-term analysis of Suspended Particulate Matter concentrations Affecting port areas in Developing countries (Office of Naval Research, Contract N62909-19-1-2145), for sponsoring this research; and to the SUNSET Project—SoUth BraziliaN ShElf Sediment Transport: sources and consequences, sponsored by the CAPES-COFECUB collaboration.
Conflict of Interest
The authors declare that the research was conducted in the absence of any commercial or financial relationships that could be construed as a potential conflict of interest.
Publisher’s Note
All claims expressed in this article are solely those of the authors and do not necessarily represent those of their affiliated organizations, or those of the publisher, the editors and the reviewers. Any product that may be evaluated in this article, or claim that may be made by its manufacturer, is not guaranteed or endorsed by the publisher.
Acknowledgments
We thank Isabel Jalon Rojas from Environnements et Paléoenvironnements Océaniques et Continentaux (EPOC-Université de Bordeaux) for the advices about the spectral methods.
Supplementary Material
The Supplementary Material for this article can be found online at: https://www.frontiersin.org/articles/10.3389/fmars.2022.836739/full#supplementary-material
Footnotes
- ^ https://earthexplorer.usgs.gov/ (Accessed August 31, 2021).
- ^ https://odnature.naturalsciences.be/remsem/software-and-data/acolite (Accessed August 31, 2021).
- ^ http://www2.portoalegre.rs.gov.br/dmae/ (Accessed August 31, 2021).
- ^ https://www.snirh.gov.br/hidroweb/mapa (Accessed August 31, 2021).
- ^ https://simcosta.furg.br/home (Accessed August 31, 2021).
- ^ https://peld.furg.br/ (Accessed August 31, 2021).
- ^ World Sea Water Temperatures. https://seatemperature.info/ (Accessed August 07, 2021).
- ^ Physical Sciences Laboratory of National Oceanic and Atmospheric Administration (NOAA). https://psl.noaa.gov/enso/mei/ (Accessed August 07, 2021).
- ^ Agência Nacional das Águas. https://www.snirh.gov.br/hidroweb/mapa (Accessed August 07, 2021).
- ^ MathWorks. https://www.mathworks.com/help/signal/ref/plomb.html (Accessed August 07, 2021).
- ^ Fundação Estadual de Proteção Ambiental Henrique Luiz Roessler—RS. http://ww2.fepam.rs.gov.br/bcrs25/ (Accessed August 07, 2021).
References
Abreu, P. C., Bergesch, M., Proença, L. A., Garcia, C. A. E., and Odebrecht, C. (2010). Short- and Long-Term Chlorophyll a Variability in the Shallow Microtidal Patos Lagoon Estuary. Southern Brazil. Estuaries Coasts 33, 554–569. doi: 10.1007/s12237-009-9181-9
Ávila, R. A., Orozco, P. M. S., Andrade, M. M., and Möller, O. O. (2021). Temporal variability of suspended-solids concentration in the estuarine channel of patos lagoon, southern Brazil. Water 13, 1–13. doi: 10.3390/w13050646
Beltrame, M. O., De Marco, S. G., and Marcovecchio, J. E. (2009). Dissolved and particulate heavy metals distribution in coastal lagoons. A case study from Mar Chiquita Lagoon, Argentina. Estuar. Coast. Shelf Sci. 85, 45–56. doi: 10.1016/j.ecss.2009.04.027
Bilotta, G. S., Burnside, N. G., Cheek, L., Dunbar, M. J., Grove, M. K., Harrison, C., et al. (2012). Developing environment-specific water quality guidelines for suspended particulate matter. Water Res. 46, 2324–2332. doi: 10.1016/j.watres.2012.01.055
Bitencourt, L. P., Fernandes, E. H., da Silva, P. D., and Möller, O. (2020). Spatio-temporal variability of suspended sediment concentrations in a shallow and turbid lagoon. J. Mar. Syst. 212:103454. doi: 10.1016/j.jmarsys.2020.103454
Bortolin, E. C., Weschenfelder, J., Fernandes, E. H., Bitencourt, L. P., Möller, O. O., García-Rodríguez, F., et al. (2020). Reviewing sedimentological and hydrodynamic data of large shallow coastal lagoons for defining mud depocenters as environmental monitoring sites. Sediment. Geol. 410:105782. doi: 10.1016/j.sedgeo.2020.105782
Bueno, C., Alves, F. L., Pinheiro, L. M., Perez, L., Agostini, V. O., Fernandes, E. H. L., et al. (2021). The effect of agricultural intensification and water-locking on the world’s largest coastal lagoonal system. Sci. Total Environ. 801:149664. doi: 10.1016/j.scitotenv.2021.149664
Bulgarelli, B., Kiselev, V., and Zibordi, G. (2017). Adjacency effects in satellite radiometric products from coastal waters: a theoretical analysis for the northern Adriatic Sea. Appl. Opt. 56:854. doi: 10.1364/ao.56.000854
Choi, J. K., Park, Y. J., Ahn, J. H., Lim, H. S., Eom, J., and Ryu, J. H. (2012). GOCI, the world’s first geostationary ocean color observation satellite, for the monitoring of temporal variability in coastal water turbidity. J. Geophys. Res. Ocean 117, 1–10. doi: 10.1029/2012JC008046
Dang, T. H., Coynel, A., Orange, D., Blanc, G., Etcheber, H., and Le, L. A. (2010). Long-term monitoring (1960-2008) of the river-sediment transport in the Red River Watershed (Vietnam): temporal variability and dam-reservoir impact. Sci. Total Environ. 408, 4654–4664. doi: 10.1016/j.scitotenv.2010.07.007
Dogliotti, A. I., Ruddick, K., and Guerrero, R. (2016). Seasonal and inter-annual turbidity variability in the Río de la Plata from 15 years of MODIS: El Niño dilution effect. Estuar. Coast. Shelf Sci. 182, 27–39. doi: 10.1016/j.ecss.2016.09.013
Eisma, D. (ed.) (1993). Suspended Matter in the Aquatic Environment. Berlin Heidelberg: Springer, doi: 10.1007/978-3-642-77722-6
Fassoni-Andrade, A. C., Guasselli, L. A., Toniolo, G. R., and Moreira, A. A. (2015). “Dinâmica espacial e temporal de sedimentos em suspensão na região estuarina da Lagoa dos Patos - RS, a partir de dados do sensor OLI, Landsat-8,” in Anais XVII Simposio Brasileiro De Sensoriamento Remoto (João Pessoa: Simpósio Brasileiro de Sensoriamento Remoto), 1953–1960.
Fernandes, E. H. L., Dyer, K. R., Moller, O. O., and Niencheski, L. F. H. (2002). The Patos Lagoon hydrodynamics during an El Niño event (1998). Cont. Shelf Res. 22, 1699–1713. doi: 10.1016/S0278-4343(02)00033-X
Gordeev, V. V., Rachold, V., and Vlasova, I. E. (2004). Geochemical behaviour of major and trace elements in suspended particulate material of the Irtysh river, the main tributary of the Ob river, Siberia. Appl. Geochem. 19, 593–610. doi: 10.1016/j.apgeochem.2003.08.004
Gray, A. B., Pasternack, G. B., Watson, E. B., Warrick, J. A., and Goñi, M. A. (2015). Effects of antecedent hydrologic conditions, time dependence, and climate cycles on the suspended sediment load of the Salinas River, California. J. Hydrol. 525, 632–649. doi: 10.1016/j.jhydrol.2015.04.025
Han, B., Loisel, H., Vantrepotte, V., Mériaux, X., Bryère, P., Ouillon, S., et al. (2016). Development of a semi-analytical algorithm for the retrieval of suspended particulate matter from remote sensing over clear to very turbid waters. Remote Sens. 8:211. doi: 10.3390/rs8030211
Hestir, E. L., Schoellhamer, D. H., Morgan-King, T., and Ustin, S. L. (2013). A step decrease in sediment concentration in a highly modified tidal river delta following the 1983 El Niño floods. Mar. Geol. 345, 304–313. doi: 10.1016/j.margeo.2013.05.008
Hetland, R. D., and Hsu, T. J. (2013). “Freshwater and sediment dispersal in large river plumes,” in Biogeochemical Dynamics at Large River-Coastal Interfaces: linkages With Global Climate Change, eds T. S. Bianchi, M. A. Allison and W. J. Cai (New York: Springer), 55–85. doi: 10.1017/cbo9781139136853.006
Horner-Devine, A. R., Hetland, R. D., and MacDonald, D. G. (2015). Mixing and transport in coastal river plumes. Annu. Rev. Fluid Mech. 47, 569–594. doi: 10.1146/annurev-fluid-010313-141408
Ivanoff, M. D., Toldo, E. E., Figueira, R. C. L., and de Ferreira, P. A. L. (2020). Use of 210 Pb and 137 Cs in the assessment of recent sedimentation in Patos Lagoon, southern Brazil. Geo-Mar. Lett. 40, 1057–1067. doi: 10.1007/s00367-019-00633-8
Jalón-Rojas, I., Schmidt, S., and Sottolichio, A. (2016). Evaluation of spectral methods for high-frequency multiannual time series in coastal transitional waters: advantages of combined analyses. Limnol. Oceanogr. Methods 14, 381–396. doi: 10.1002/lom3.10097
Jung, B. M., Fernandes, E. H., Möller, O. O., and García-Rodríguez, F. (2020). Estimating suspended sediment concentrations from river discharge data for reconstructing gaps of information of long-term variability studies. Water 12:2382. doi: 10.3390/W12092382
Karl, D. M., Letelier, R. M., Bidigare, R. R., Björkman, K. M., Church, M. J., Dore, J. E., et al. (2021). Seasonal-to-decadal scale variability in primary production and particulate matter export at Station ALOHA. Prog. Oceanogr. 195:102563. doi: 10.1016/j.pocean.2021.102563
Kjerfve, B. (1986). “Comparative Oceanography of Coastal Lagoons,” in. Estuarine variability, ed. D. Wolfe (Waltham, USA: Academic Press), 63–81. doi: 10.1016/b978-0-12-761890-6.50009-5
Kjerfve, B. (1994). “Coastal Lagoons,” in Coastal lagoon processes, ed. B. Kjerfve (Amsterdam: Elsevier)
Kreiling, R. M., and Houser, J. N. (2016). Long-term decreases in phosphorus and suspended solids, but not nitrogen, in six upper Mississippi River tributaries, 1991–2014. Environ. Monit. Assess. 188, 1–19. doi: 10.1007/s10661-016-5464-3
Lihan, T., Saitoh, S. I., Iida, T., Hirawake, T., and Iida, K. (2008). Satellite-measured temporal and spatial variability of the Tokachi River plume. Estuar. Coast. Shelf Sci. 78, 237–249. doi: 10.1016/j.ecss.2007.12.001
Liu, J. T., Zarillo, G. A., and Surak, C. R. (1997). The influence of river discharge on hydrodynamics and mixing in a subtropical lagoon. J. Coast. Res. 13, 1016–1034. doi: 10.1016/S0967-0653(98)80018-5
Lomb, N. R. (1976). Least-squares frequency analysis of unequally spaced data. Astrophys. Space Sci. 39, 447–462. doi: 10.1007/BF00648343
Marques, W., and Moller, O. O. (2008). Variabilidade Temporal em Longo Período da Descarga Fluvial e Níveis de Água da Lagoa dos Patos, Rio Grande do Sul, Brasil. Rev. Bras. Recur. Hídr. 13, 155–163. doi: 10.21168/rbrh.v13n3.p155-163
Marques, W. C., Fernandes, E. H., Monteiro, I. O., and Möller, O. O. (2009). Numerical modeling of the Patos Lagoon coastal plume, Brazil. Cont. Shelf Res. 29, 556–571. doi: 10.1016/j.csr.2008.09.022
Marques, W. C., Fernandes, E. H. L., Moraes, B. C., Möller, O. O., and Malcherek, A. (2010). Dynamics of the Patos Lagoon coastal plume and its contribution to the deposition pattern of the southern Brazilian inner shelf. J. Geophys. Res. Ocean 115, 1–22. doi: 10.1029/2010JC006190
Marta-Almeida, M., Dalbosco, A., Franco, D., and Ruiz-Villarreal, M. (2021). Dynamics of river plumes in the South Brazilian Bight and South Brazil. Ocean Dyn. 71, 59–80. doi: 10.1007/s10236-020-01397-x
Matthews, M. W. (2011). A current review of empirical procedures of remote sensing in Inland and near-coastal transitional waters. Int. J. Remote Sens. 32, 6855–6899. doi: 10.1080/01431161.2010.512947
Miller, R. L., and McKee, B. A. (2004). Using MODIS Terra 250 m imagery to map concentrations of total suspended matter in coastal waters. Remote Sens. Environ. 93, 259–266. doi: 10.1016/j.rse.2004.07.012
Moller, O. O. Jr., Castaing, P., Salomon, J.-C., and Lazure, P. (2001). The Influence of Local and Non-Local Forcing Effects on the Subtidal Circulation of Patos Lagoon. Estuaries 24, 297–311. doi: 10.2307/1352953
Moller, O. O., Lorenzzentti, J. A., Stech, J. L., and Mata, M. M. (1996). The Patos Lagoon summertime circulation and dynamics. Cont. Shelf Res. 16, 335–351. doi: 10.1016/0278-4343(95)00014-R
Monteiro, L. O., Marques, W. C., Fernandes, E. H., Gonçalves, R. C., and Möller, O. O. Jr. (2011). On the effect of earth rotation, river discharge, tidal oscillations, and wind in the dynamics of the Patos Lagoon coastal plume. J. Coast. Res. 27, 120–130. doi: 10.2112/JCOASTRES-D-09-00168.1
Nechad, B., Ruddick, K. G., and Park, Y. (2010). Calibration and validation of a generic multisensor algorithm for mapping of total suspended matter in turbid waters. Remote Sens. Environ. 9, 854–866.
Nicolodi, J. L., Toldo, E. E., and Farina, L. (2013). Dynamic and resuspension by waves and sedimentation pattern definition in low energy environments: guaíba lake (Brazil). Braz. J. Oceanogr. 61, 55–64. doi: 10.1590/S1679-87592013000100006
Novoa, S., Doxaran, D., Ody, A., Vanhellemont, Q., Lafon, V., Lubac, B., et al. (2017). Atmospheric corrections and multi-conditional algorithm for multi-sensor remote sensing of suspended particulate matter in low-to-high turbidity levels coastal waters. Remote Sens. 9:61. doi: 10.3390/rs9010061
Oliveira, H. A., Helena, E., Fernandes, L., Olinto, M. O. Jr., and Collares, G. L. (2015). Processos Hidrológicos e Hidrodinâmicos da Lagoa Mirim. Rev. Bras. Recur. Hídr. 20, 34–45.
Oliveira, H., Fernandes, E., Möller, O., and García-Rodríguez, F. (2019). Relationships between wind effect, hydrodynamics and water level in the world’s largest coastal lagoonal system. Water 11:2209. doi: 10.3390/w11112209
Osadchiev, A., and Zavialov, P. (2020). “Structure and Dynamics of Plumes Generated by Small Rivers,” in Estuaries and Coastal Zones–Dynamics and Response to Environmental Changes, eds J. Pan and A. Devlin (London: IntechOpen). doi: 10.5772/intechopen.87843
Pagot, M., Rodríguez, A., Hillman, G., Corral, M., Oroná, C., and Niencheski, L. F. (2007). Remote Sensing Assessment of Suspended Matter and Dynamics in Patos Lagoon. J. Coast. Res. 10047, 116–129. doi: 10.2112/1551-5036-47.sp1.116
Park, J., Kal, B., and Kim, S. (2018). Long-term Trend Analysis of Major Tributaries of Nakdong River Using Water Quality Index. J. Wetl. Res. 20, 201–209.
Rachold, V. (1999). “Major, Trace and Rare Earth Element Geochemistry of Suspended Particulate Material of East Siberian Rivers Draining to the Arctic Ocean,” in Land-Ocean Systems in the Siberian Arctic, eds H. Kassens, H. A. Bauch, I. A. Dmitrenko, H. Eicken, H. W. Hubberten, and M. Melles (Berlin: Springer), 1993–1994.
Rachold, V., Eisenhauer, A., Hubberten, H., Hansen, B., Meyer, H. (1997). Sr Isotopic Composition of suspended particulate material (SPM) of East Siberian Rivers: sediment transport to the Arctic Ocean. Arct. Alp. Res. 29, 422–429. doi: 10.2307/1551990
Rodrigues, J. P., Araujo, M. L. V., Emerich, P., Ávila, R., and Garcia, C. A. E. (2012). “Absorção e atenuação sa luz e sua relação com os (Rs-Brasil),” in Proceedings of the Congresso Brasileiro de Oceanografia (Rio de Janeiro: Associação Brasileira de Oceanografia (AOCEANO)), 1615–1629.
Rostad, C., and Leenheer, J. (1997). Organic Carbon and Nitrogen Content Associated with Colloids and Suspended Particulates from the Mississippi River and Some of Its Tributaries. Environ. Sci. Technol. 31, 3218–3225.
Rühl, S., Thompson, C. E. L., Queirós, A. M., and Widdicombe, S. (2021). Decadal patterns and trends in benthic-pelagic exchange processes. J. Mar. Syst. 222:103595. doi: 10.1016/j.jmarsys.2021.103595
Ryberg, K. R., Blomquist, J. D., Sprague, L. A., Sekellick, A. J., and Keisman, J. (2018). Modeling drivers of phosphorus loads in Chesapeake Bay tributaries and inferences about long-term change. Sci. Total Environ. 616–617, 1423–1430. doi: 10.1016/j.scitotenv.2017.10.173
Scargle, J. D. (1982). Studies in astronomical time series analysis. II. Statistical aspects of spectral analysis of unevenly spaced data. Astrophys. J. 263, 835–853. doi: 10.1086/160554
Schäfer, J., Blanc, G., Lapaquellerie, Y., Maillet, N., Maneux, E., and Etcheber, H. (2002). Ten-year observation of the Gironde tributary fluvial system: fluxes of suspended matter, particulate organic carbon and cadmium. Mar. Chem. 79, 229–242.
Scottá, F. C., Andrade, M. M., Silva Junior, V. O., Oliveira, N., Weschenfelder, J., Bortolin, E. C., et al. (2019). Geoacoustic patterns of the guaíba river bottom and subbottom and their relationship with sedimentary and hydrodynamic processes. Rev. Bras. Geofis. 37, 105–120. doi: 10.22564/rbgf.v37i1.1991
Shanmugam, G. (2018). A global satellite survey of density plumes at river mouths and at other environments: plume configurations, external controls, and implications for deep-water sedimentation. Pet. Explor. Dev. 45, 640–661. doi: 10.1016/S1876-3804(18)30069-7
Stech, J. L., and Lorenzetti, J. A. (1992). The response of the South Brazil Bight to the passage of wintertime cold fronts. J. Geophys. Res. 97, 9507–9520. doi: 10.1029/92JC00486
Távora, J., Fernandes, E. H., Paranhos Bitencourt, L. B., and Mulattieri Suarez Orozco, P. (2020b). El-Niño Southern Oscillation (ENSO) effects on the variability of Patos Lagoon Suspended Particulate Matter. Reg. Stud. Mar. Sci. 40:101495. doi: 10.1016/j.rsma.2020.101495
Távora, J., Boss, E., Doxaran, D., and Hill, P. (2020a). An algorithm to estimate suspended particulate matter concentrations and associated uncertainties from remote sensing reflectance in coastal environments. Remote Sens. 12, 1–24. doi: 10.3390/rs12132172
Távora, J., Fernandes, E. H. L., and Möller, O. O. (2020c). Data Publisher for Earth and Environmental Science. PANGAEA. Available online at: https://doi.pangaea.de/10.1594/PANGAEA.920924 (accessed August 7, 2021).
Távora, J., Fernandes, E. H., and Moller, O. O. (2021). Patos Lagoon, Brazil, Suspended Particulate Matter (SPM) data compendium. Geosci. Data J. 1–24. doi: 10.1002/gdj3.134
Távora, J., Fernandes, E. H. L., Thomas, A. C., Weatherbee, R., and Schettini, C. A. F. (2019). The influence of river discharge and wind on Patos Lagoon, Brazil, Suspended Particulate Matter. Int. J. Remote Sens. 40, 4506–4525. doi: 10.1080/01431161.2019.1569279
Toldo, E., and Almeida, L. E. S. B. (2009). Rio Guaíba. Available Online at: http://lproweb.procempa.com.br/pmpa/prefpoa/dmae/usu_doc/rioguaiba_eliriotoldojr.pdf (accessed August 31, 2009).
Toldo, J., Dillenburg, S. R., Correa, I. C. S., and Almeida, L. E. S. B. (2000). Holocene sedimentation in Lagoa dos Pantos Lagoon, Rio Grande do Sul, Brazil. J. Coast. Res. 16, 816–822.
Tomazelli, L. (1993). O Regime dos Ventos e a Taxa de Migração das Dunas Eólicas Costeiras do Rio Grande do Sul, Brasil. Pesqui. em Geociênc. 20, 18–26. doi: 10.22456/1807-9806.21278
Van Oldenborgh, G. J., Hendon, H., Stockdale, T., Heureux, M. L., De Perez, E. C., Singh, R., et al. (2021). Defining El Niño indices in a warming climate. Environ. Res. Lett. 16:044003.
VanderPlas, J. T. (2018). Understanding the Lomb–Scargle Periodogram. Astrophys. J. Suppl. Ser. 236:16. doi: 10.3847/1538-4365/aab766
Vanhellemont, Q. (2019). Adaptation of the dark spectrum fitting atmospheric correction for aquatic applications of the Landsat and Sentinel-2 archives. Remote Sens. Environ. 225, 175–192. doi: 10.1016/j.rse.2019.03.010
Vanhellemont, Q., and Ruddick, K. (2014). Turbid wakes associated with offshore wind turbines observed with Landsat 8. Remote Sens. Environ. 145, 105–115. doi: 10.1016/j.rse.2014.01.009
Vanhellemont, Q., and Ruddick, K. (2015). Advantages of high quality SWIR bands for ocean colour processing: examples from Landsat-8. Remote Sens. Environ. 161, 89–106. doi: 10.1016/j.rse.2015.02.007
Vanhellemont, Q., and Ruddick, K. (2016). “Acolite for Sentinel-2: aquatic applications of MSI imagery,” in Proceedings of the ESA Living Planet Symposium, ed. L. Ouwehand (Prague: ESA), 740, 9–13.
Vanhellemont, Q., and Ruddick, K. (2018). Atmospheric correction of metre-scale optical satellite data for inland and coastal water applications. Remote Sens. Environ. 216, 586–597. doi: 10.1016/j.rse.2018.07.015
Vaz, A. C., Möller, O. O. jr., and de Almeida, T. L. (2006). Análise quantitativa da descarga dos rios afluentes da Lagoa dos Patos. Atlântica 28, 13–23.
Vinzon, S. B., Winterwerp, J. C., Nogueira, R., and de Boer, G. J. (2009). Mud deposit formation on the open coast of the larger Patos Lagoon-Cassino Beach system. Cont. Shelf Res. 29, 572–588. doi: 10.1016/j.csr.2008.09.021
Ward, L., and Twilley, R. R. (1986). Seasonal Distributions of Suspended Particulate Material and Dissolved Nutrients in a Coastal Plain Estuary. Estuaries 9, 156–168.
Keywords: river plumes, landsat, Patos Lagoon, remote sensing, ENSO (El Nino/Southern Oscillation), tributaries, freshwater contribution, suspended particulate matter
Citation: Bortolin EC, Távora J and Fernandes EHL (2022) Long-Term Variability on Suspended Particulate Matter Loads From the Tributaries of the World’s Largest Choked Lagoon. Front. Mar. Sci. 9:836739. doi: 10.3389/fmars.2022.836739
Received: 15 December 2021; Accepted: 17 January 2022;
Published: 08 March 2022.
Edited by:
Alexander Yankovsky, University of South Carolina, United StatesReviewed by:
Andrew M. Fischer, University of Tasmania, AustraliaMukesh Gupta, Catholic University of Louvain, Belgium
Copyright © 2022 Bortolin, Távora and Fernandes. This is an open-access article distributed under the terms of the Creative Commons Attribution License (CC BY). The use, distribution or reproduction in other forums is permitted, provided the original author(s) and the copyright owner(s) are credited and that the original publication in this journal is cited, in accordance with accepted academic practice. No use, distribution or reproduction is permitted which does not comply with these terms.
*Correspondence: Eduardo C. Bortolin, ZWR1Ym9ydG9saW5AZ21haWwuY29t