
94% of researchers rate our articles as excellent or good
Learn more about the work of our research integrity team to safeguard the quality of each article we publish.
Find out more
ORIGINAL RESEARCH article
Front. Mar. Sci., 14 July 2022
Sec. Aquatic Physiology
Volume 9 - 2022 | https://doi.org/10.3389/fmars.2022.835379
This article is part of the Research TopicGenetic Adaption and Metabolic Response of Aquatic Animals to Diverse Water Environment ParametersView all 13 articles
 Andrea Aguilar1
 Humberto Mattos1Beatriz Carnicero1
 Nataly Sanhueza1
 David Muñoz1
 Mariana Teles2,3
 Lluis Tort2Sebastian Boltaña1*
Global warming is predicted to increase prolonged thermal challenges for aquatic ectotherms, i.e. it causes metabolic performance declines, impacts food intake, and finally causes impaired growth. In this research work, we investigated whether a tropical fish, Danio rerio (zebrafish), could tolerate prolonged thermal challenges and whether the temperature increase has a significant impact on growth and metabolism. To answer our questions, we evaluate the metabolomic performance, a question that has received little attention so far, using differential chemical isotope labeling (CIL) liquid chromatography-mass spectrometry (LC-MS). Three groups of fish were exposed to various temperatures of 27.6 ± 2°C, 30.7 ± 2°C or 32.2 ± 2°C during 270 days post fecundation (dpf) to evaluate the impact of the temperature increase on the growth and metabolomic performance. The results obtained demonstrated different metabolomic changes in response to acclimation to the different temperatures. After 270 days, the fish maintained at the highest tested temperature (32°C) showed reduced growth, reduced condition factor, and elevated levels of metabolites associated with amino acid catabolism and lipid metabolism pathways in the liver and intestine compared with fish kept at lower temperatures (27.6 ± 2°C). These findings demonstrate an explicit redistribution of energy stores and protein catabolism in fish at the highest temperature, thus showing a preference for maintaining length growth during limited energy availability. Moreover, here we also screened out both the marker metabolites and the altered metabolic pathways to provide essential insights to ascertain the effects of the water temperature increase on the growth and development of tropical fish.
• Metabolic response of zebrafish reared at different temperature were studied
• Brain, liver an intestine tissue reflects metabolic changes in physiology of fish
• Amino acid, protein catabolism and energy metabolism pathways are altered in all tissues by the temperature conditions
• The altered metabolome may be useful as a key indicator of adverse effect of the water warming
Aquatic ecosystems worldwide are warm-up, and their average temperatures are progressively increasing due to climate change. Environmental temperature commands growth and metabolic performance in ectotherms, including most fish (Neuheimer et al., 2011). Metabolites (e.g., glucose, glycerol, and alanine) are products and intermediate metabolism compounds that respond to shifts in the environment (Bundy et al., 2009). Metabolite profiles play essential roles in the biochemical pathways that shape individual phenotypes (Wagner et al., 2013; Wagner et al., 2014). Metabolomics is a cutting-edge technology that offers considerable advantage over other omics techniques since metabolites are preserved among organisms, unlike genes or proteins. Gas chromatography-mass spectrometry, liquid chromatography-mass spectrometry (LC-MS), and nuclear magnetic resonance are the three most commonly used analytical technologies for metabolic analysis (Samuelsson et al., 2006; Samuelsson and Larsson, 2008; Samuelsson et al., 2011). In aquatic organisms, researchers have used metabolomic approaches to evaluate the impact of temperature increases on organisms such as molluscs (Ellis et al., 2014), crustaceans (Hammer et al., 2012) and marine coral communities (Coelho et al., 2015). However, despite their advantages, the evaluation of the impact of the water temperature increase on the metabolite composition in fish is still an underexplored area.
The survival of aquatic organisms underwater temperature increases depends on their capacity for physiological and cellular adaptation (Donelson et al., 2012; Miller et al., 2012). Most studies on thermal impacts on fish relate elevated temperatures with traits relevant to thermal stress resistance, including the induction of heat shock proteins (HSPs). HSPs are highly conserved, ubiquitously expressed families of stress response proteins induced in diverse organisms by different physiological and environmental stressors (Sørensen et al., 2003; Fabbri et al., 2008). In fish, prolonged exposure to high temperatures induces proteotoxic stress. Thus, the rise in the temperature leads to severe problems, such as the accumulation of misfolded proteins that involve an additional stress source on the proteostasis network, including protein translation, folding, trafficking, and turnover. Specifically, HSPs prevent and reduce the aggregation of other proteins damaged by heat and assist in the refolding or degradation of stress-damaged proteins (Wallace et al., 2015; Riback et al., 2017). In fish, the HSP protein expression increases when individuals are exposed to elevated temperature, and their sensitivity varies with species, developmental stage and season (Wallace et al., 2015), indicating a potential ecological relevance of HSPs in global warming. HSPs in fish have been studied extensively at the protein level and from the molecular aspect to quantifying the mRNA abundance. For example, the hsp70 mRNA has been identified in rainbow trout (Kothary et al., 1984), medaka (Arai et al., 1995), zebrafish (Lele et al., 1997), and tilapia (Molina et al., 2000), and well-increased mRNA levels have been registered due to heat stress. Recent studies in fish have shown that hsp90 and hsp47 increase due to heat stress in Puntius sophore and Channa striatus; the expression of several HSP proteins as hsp60, hsp70, hsp78, and hsp90 was up-regulated by the action of the increase on the temperature (Purohit et al., 2014; Mahanty et al., 2017).In this research work, we report a method based on high-performance chemical isotope labelling (CIL) LC-MS platform (Su et al., 2016) that enables us to investigate the impact of the increase in water temperature on the metabolic performance of zebrafish a tropical species. Tropical fish species, in particular, are expected to have lower thermal adaptation capacity than temperate species because they have evolved in a more stable thermal environment (Wysocki et al., 2009; Sinclair et al., 2016; Rezende and Bozinovic, 2019; Morgan et al., 2020). In particular, adult zebrafish is eurythermal and can occasionally tolerate warm temperatures in a short time (days), around 38°C (López-Olmeda and Sánchez-Vázquez, 2011). However, during the development, the zebrafish larvae and juvenile stage are highly susceptible to warm temperatures above 32°C (Pype et al., 2015). Therefore, for the fish that live within the limits of their thermal capacities, such as zebrafish, the prolonged exposure to warm temperatures (as projected by climate change) during their development can pleasantly impact their physiology and metabolic performance (Somero, 2010). Consequently, this study addresses questions regarding the mechanisms underlying the long time-scale impact of the water temperature increase during the development of zebrafish Danio rerio. Previous studies have shown variable effects on the growth of fish reared at >2°C and > 3–4°C above the current-day temperature water (Johansen and Jones, 2011). However, even if the increase in water temperature can impact fish growth, its effects on the animal’s metabolic performance are unknown. The fish liver is an essential metabolic organ that controls metabolism, bile secretion, and glycogen storage and plays an essential role in environmental adaptation (Jiao et al., 2020). Additionally, the liver is vital to establishing energy balance to maintain general homeostasis and cope with environmental and physical disturbances. We use metabolomics to inspect changes in metabolites produced in a biological system (cell, tissue, or organism) in response to external stimuli, such as temperature in the liver. It can also be used to describe the observable chemical profiles of the metabolites (Ott et al., 2003). To inspect this metabolic profile, we also used the intestine, and brain tissue of fish reared for a long time at warm temperatures. Previous CL-based metabolomics studies on fish have revealed that the acute elevated temperature leads to changes in essential metabolites, including decreased liver glycogen and decreased muscle phosphocreatine and ATP levels, indicating increased energetic costs at the higher temperature. However, to the date no studies have investigated the long-term response to temperature on the tissue metabolome in zebrafish while monitoring growth. Thus, this study aimed to clarify the effect of elevated temperature on the metabolome and dynamics concerning growth and food consumption in the water environment.
All experiments were carried out at the ThermoFish Lab, Biotechnology Centre, University of Concepcion, Concepcion, Chile. Fish were handled in accordance with the “International Guiding Principles for Biomedical Research Involving Animals” established by the European Union Council (2010/63/EU). Zebrafish (Danio rerio) was used as a typical ectothermic animal. An advantage of these fishes is an enormous amount of scientific literature and a completely deciphered genome. Zebrafishes were maintained on a 14-h light/10-h dark cycle, and fertilized eggs were collected (Aquaneering zebrafish system). 540 embryos from the same parents were kept in 0.3× Danieau’s solution [17.4 mM NaCl, 0.21 mM KCl, 0.12 mM MgSO4·7H2O, 0.18 mM Ca (NO3) 2, 1.5 mM HEPES (pH 7.6)] were obtained from JT Baker Chemical (Phillipsburg, NJ, USA). The larvae were maintained at 25°C with a 12 h light:12 h dark cycle in culture water (UV-sterilized and well-aerated water, pH 7.2 ± 0.5, dissolved oxygen: 6.6 ± 0.3 mg/L, electrical conductivity: 0.256 ± 0.005 mS/cm, water hardness: 185 ± 9 mg/L CaCO3) and acclimated in 15 L glass tanks for 2 weeks before the experiment. At the start of the experiment, the temperature of three tanks was 27°C, then establishing experimental temperatures of 27.6 ± 0.9°C, 30.7 ± 1.2°C and 32.2 ± 0.8°C (Figure 1), in triplicate tanks for each temperature (3 thermal chambers per temperature). Each system had a flow rate of 5 m3 h-1, and water was U.V.-sterilized. The water temperature of each tank was measured twice per day. Dissolved oxygen was also measured daily and always remained above 6.6 ± 0.3 mg/L. Ammonia, nitrite, and pH were measured twice per week. Total ammonia and nitrite concentrations in each tank were kept under 0.05 and 0.01 mg L-1, and pH remained at 8.0 ± 0.5. The thermal gradient was fixed through an outer water jacket system situated at unlike temperatures. The experimental set up was carried out as to correlate whether differences in the thermoregulation environment drive different metabolic traits and establish whether the growth parameters, heat-shock proteins expression and metabolic regulation is influenced by the water temperature. Fish were allowed to acclimate to the tanks and experimental temperatures for 7 days, and during this period the fish were not fed. On day 8, feeding was started. At month 1 (30 dpf) and month 9 (270 dpf) after the start of temperature acclimation, 9 fish/per condition were randomly sampled. We reared fish for a long time at unlike thermal conditions during 270 dpf. Our first sample time was at 30dpf after the first feeding. There were 60 fish in each replicate and thermal tank (N=180 by thermal group; n= 60 by replicate) and were fed a maintenance diet (Skretting, GEMMA Micro 300) twice daily for 270 dpf. Fish were sacrificed by over-anaesthesia with tricaine methanesulfonate (MS222, Sigma Aldrich). Body weight (BW) and length (L) was immediately determined and posteriorly used to calculate Fulton’s K condition factor (100*(weight/length3)). After 270 days of exposure, liver, intestine and brain were dissected and treated according to the metabolomic and gene expression approaches.
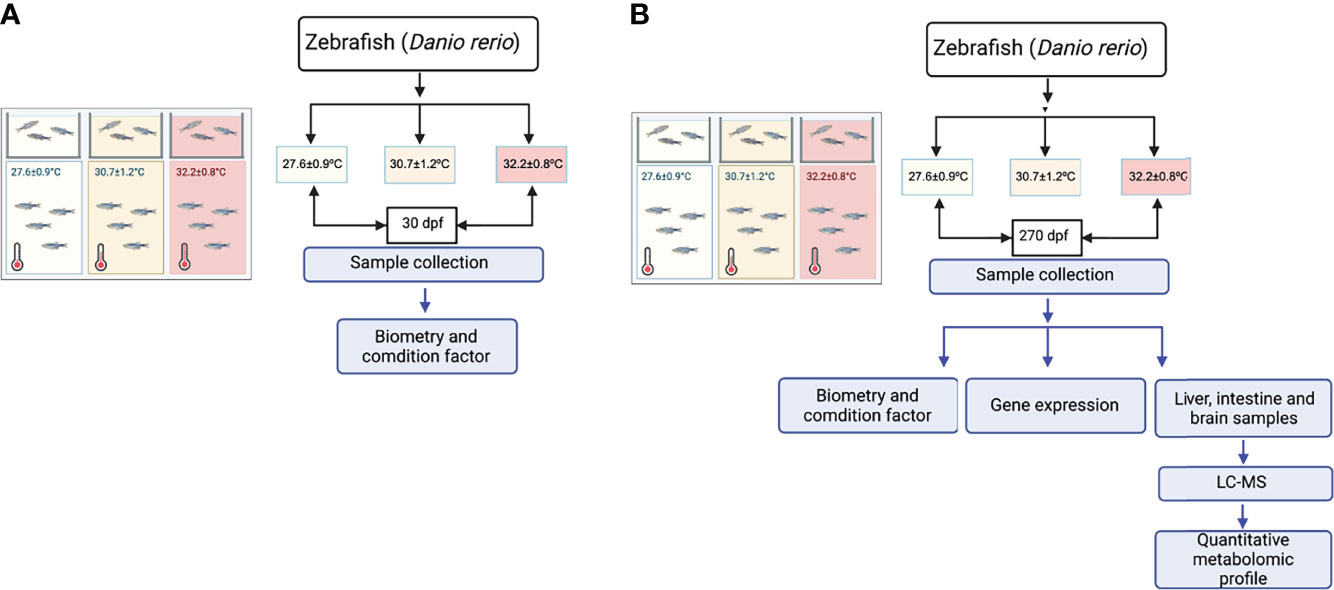
Figure 1 Experimental setup. (A) Schematic diagram of the experimental setup 30 dpf. (B) Schematic diagram of the experimental setup 270 dpf.
Liver, brain and intestine samples were collected from 9 individuals reared at three different temperatures. The individuals were randomly chosen. Milli-Q water was produced from a Millipore purification system (Waters-Millipore Corporation, Milford, MA, USA) Ceramic beads and 4:1 (v/v) pre-cooled LC-MS grade methanol:water (according to sample weight) were added into each of the individual sample tubes. Tissues were homogenized for one cycle of 15 seconds using a bead beater homogenizer (TissueLyser L, Qiagen). The tubes were centrifuged at 12,000 g for 10 min at 4°C. From each sample, all the supernatant was transferred into a new vial and dried down. The extracts were stored at -80°C until further analysis.
The dried extracts were taken from the -80°C freezer and re-dissolved in 30 μL of water. The total concentrations of samples were determined using the NovaMT Sample Normalization kit. For the samples having total concentration higher than 2 mM, water was added accordingly to adjust their concentrations to 2 mM. After concentration adjustment, supernatant was divided in 2 aliquots for labelling, backup and preparation of pooled sample. For the aliquot for amine-/phenol- labelling, 25 μL of samples was used. The individual samples were labelled separately using 12C2-dansyl chloride and quantified by LC-UV based on absorption at 338 nm (Wu and Li, 2012). A pooled reference by tissue (i.e., liver-pool, intestine-pool and brain-pool) was prepared by mixing the same amount of aliquot from each of the 3 tissues. The reference-pool was taken and labeled by 13C-dansylation (13C2-dansyl labeling). An aliquot of the 13C-labeled pool was mixed with a 12C-labeled individual sample in 1:1 molar ratio to produce a mixture for LC-MS analysis. 12C-dansyl chloride (DnsCl) and amino acid standards were purchased from Sigma-Aldrich Canada (Markham, ON, Canada). The isotopic compound used to synthesize 13C-dansyl chloride was purchased from Cambridge Isotope Laboratories (Cambridge, MA, USA).
An Agilent 1290 series binary UPLC system with a Waters ACQUITY UPLC BEH C18 column (2.1 mm 10 cm, 1.7 mm particle size, 130 Å pore size) connected to an Agilent electrospray ionization (ESI) time-of-flight mass spectrometer (Model 6230, Agilent, Palo Alto, CA, USA) was used for LC-MS analysis. For the TOF instrument, the ion source conditions were: nitrogen nebulizer gas: 1.38 Bar, dry gas flow: 5 L/min, dry temperature: 325 C, capillary voltage: 4000 V, end plate offset: 120 V, mass range: m/z up to 1700, and spectra rate: 1 Hz. The resolving power of the instrument was typically about 11,000 (FWHM) at m/z 622. All MS spectra were obtained in the positive ion mode. For LC-MS, LC solvent A was 0.1% (v/v) formic acid in water, and solvent B was 0.1% (v/v) formic acid in ACN. The gradient elution profile was as follows: t 1⁄4 0 min, 15% B; t 1⁄4 2 min, 15% B; t 1⁄4 15 min, 45% B; t 1⁄4 20 min, 65% B; t 1⁄4 26 min, 98% B; t 1⁄4 29 min, 98% B; t 1⁄4 29.1 min, 15% B. The flow rate was 250 mL/min. The sample injection volume varied, depending on the applications.
The MS data were internally mass-calibrated and then processed using a peak-pair picking software, IsoMS (Zhou et al., 2014). The level 1 peak pairs, along with their peak intensity ratios, were aligned from multiple runs by retention time within 20 s and accurate mass within 10 ppm using IsoMS-Align to generate the initial metabolite-intensity table. The Zero-fill program was used to find the missing ratios in the table from the raw LC-MS peak list and then fill in these values to produce the final table (Huan and Li, 2015a). Iso-Quant was finally applied to calculate the individual peak ratio based on chromatographic peak areas of the 12C- and 13C-labeled peaks with a peak pair in the table (Huan and Li, 2015b; Huan et al., 2015). The ratio values were used for statistical analysis (Supplementary Tables S1–S6).
9 random fish were sampled for each temperature (27.6 ± 2°C, 30.7 ± 2°C or 32.2 ± 2°C), and subsequently snap-frozen in liquid nitrogen and conserved at -80°C. Total RNA was extracted from the liver, intestine and brain of individual fish with the TRI Reagent® (0.5 ml; Sigma-Aldrich Missouri, United States) and quantified by absorbance at 260 nm. Only samples with an A260/280 ratio between 1.8 and 2.1, and an A260/230 ratio above 1.8 were used for reverse transcription. Purified RNA integrity was confirmed by agarose denaturing gel electrophoresis. cDNA was synthesized from 50 μl of total RNA (200 ng/µl) using the RevertAid H Minus First Strand cDNA Synthesis Kit (Fermentas, Waltham, MA, USA) according to the manufacturer’s indications. RT-qPCR was performed using the StepOnePlus™ Real-Time PCR System (Applied Biosystems, Life Technologies, Carolina, USA), and each assay was run in triplicate using the Maxima SYBR Green qPCR Master Mix-2X (Bio-Rad, Carolina, USA). For qPCR assays, 5 μl of synthetized cDNA were diluted with 15 μl of nuclease-free water (Qiagen, Hilden, Germany). Each qPCR mixture contained the SYBR Green Master Mix, 2 μl of diluted cDNA, 500 nmol/l each primer, and RNase free water to a final volume of 10 μl. Amplification was performed in triplicate on 96-well plates with the following thermal cycling conditions: initial activation for 10 min at 95°C, followed by 40 cycles of 15 seconds (s) at 95°C, 30 s at 60°C, and 30 s at 72°C (primer table in Supplementary Table S7). An absolute quantification approach was used that involved calculating the number of gene copies in unknown ‘‘test” samples from comparison with a standard curve prepared using a dilution series of linearized plasmids with known concentrations. The PCR product for each gene was extracted from agarose gel using the Nucleospin Gel and PCR Clean-Up Kit (Macherey-Nagel, Dueren, Germany). The PCR amplicons were cloned the using pGEM-T Easy Vector and JM109 High-Efficiency Competent Cells (Promega, Madison, WI, USA). The Nucleospin Plasmid Quick Pure Kit (MACHEREY-NAGEL) was used to purify the plasmid DNA containing the PCR insert. Then, the plasmid was linearized using the HindIII restriction enzyme to prevent amplification efficiency problems that can arise from using supercoiled plasmids, and the amount of dsDNA was quantified using the Quant-iT PicoGreen dsDNA Assay Kit (Invitrogen, California, United States). The concentration of each plasmid was calculated by absorbance at 260 nm, and a five-fold dilution series produced for copy number calculations via qPCR and using Eq. (1).
where the amount of DNA (ng) was derived from absorbance at 260 nm and length (base pairs) was determined by adding the PCR product length to the size of the plasmid. The use of these standard curves controlled for amplification efficiency differences between assays and permitted calculating the ‘‘absolute” number of mRNA transcripts, thereby facilitating gene comparisons.
For statistical analysis of the organ samples, only the common peak-pairs shown up in at least 50% of the samples were retained for analysis. No outliers were found and all observations (n=27 for each of the temperature groups for each time point) were included in the data analyses. Orthogonal Partial Least Squares Discriminant Analysis (OPLS-DA) (Trygg and Wold, 2002; Nicholson et al., 2007) was conducted to find differences between temperature groups and different time points. Since only pairwise comparisons are possible in OPLS-DA we focused on effects of the highest temperature. Evaluation of the OPLS-DA models were conducted by assessing the model fit (R2) and prediction quality (Q2). Principle component analysis (PCA) and orthogonal partial least square discriminant analysis (OPLS-DA) were performed using SIMCA-Pþ 12.0 (Umetrics, Umeå, Sweden). The data were mean-centered and pareto-scaled (unit variance) prior to analysis. Condition factor (CF) was calculated as 100 × (BW × FL− 3) for initial and final average sizes of each group. Positive metabolite identification was performed based on mass and retention time match to the dansyl standard library containing 273 unique amines/phenols using DnsID (Huan et al., 2015). Putative identification was done based on accurate mass match to the metabolites in the human metabolome database (HMDB) (8021 known human endogenous metabolites) and the Evidence-based Metabolome Library (EML) (375,809 predicted metabolites with one reaction) using MyCompoundID (Li et al., 2013). The mass accuracy tolerance window was set at 10 ppm for database search.
The fish in each thermal tank were acclimatized to an artificial photoperiod of 12 h light:12 h dark 300 dpf. The cumulative mortality at different thermal gradients was 0.67%, 1.1%, and 2.7%, respectively. There were no significant differences in cumulative mortality in the treatment groups (p > 0.05). The fish grew in weight and length at all three temperatures, but the highest temperature tested significantly affected the growth (two-way ANOVA temperature * time p = 0.0001). A significant interaction between temperature and time on growth (p = 0.0001) was detected, while there was no difference in growth among the groups exposed to different temperatures during the first month (30 dpf). Fish at 32.2°C had a significantly lower BW (Figure 2B) and L (Figure 2D) than fish kept at the lower temperatures after 270 dpf (p = 0.0001 for both variables, Figures 2A–D). CF was affected by temperature and time (p = 0.02 and p = 0.0001, respectively), with a significant interaction between these variables (p = 0.0001). The fish at 30.7 and 32.2°C show a significant difference in CF just at 270 dpf in fish reared at 32.2°C with lower CF than fish at 27.6 and 30.7°C (p =0.002 and 0.0001, respectively, Figures 2E, F). A commonly used molecular marker of thermal stress is the molecular expression of cell chaperones, such as heat-shock proteins (HSPs). his represents a response rate where hsp mRNA levels were significantly altered in response to high temperatures. As shown in Figure 3, the expression of the hsp genes in the zebrafish was greatly enhanced upon exposure to 32°C heat stress mainly, in the liver and brain.
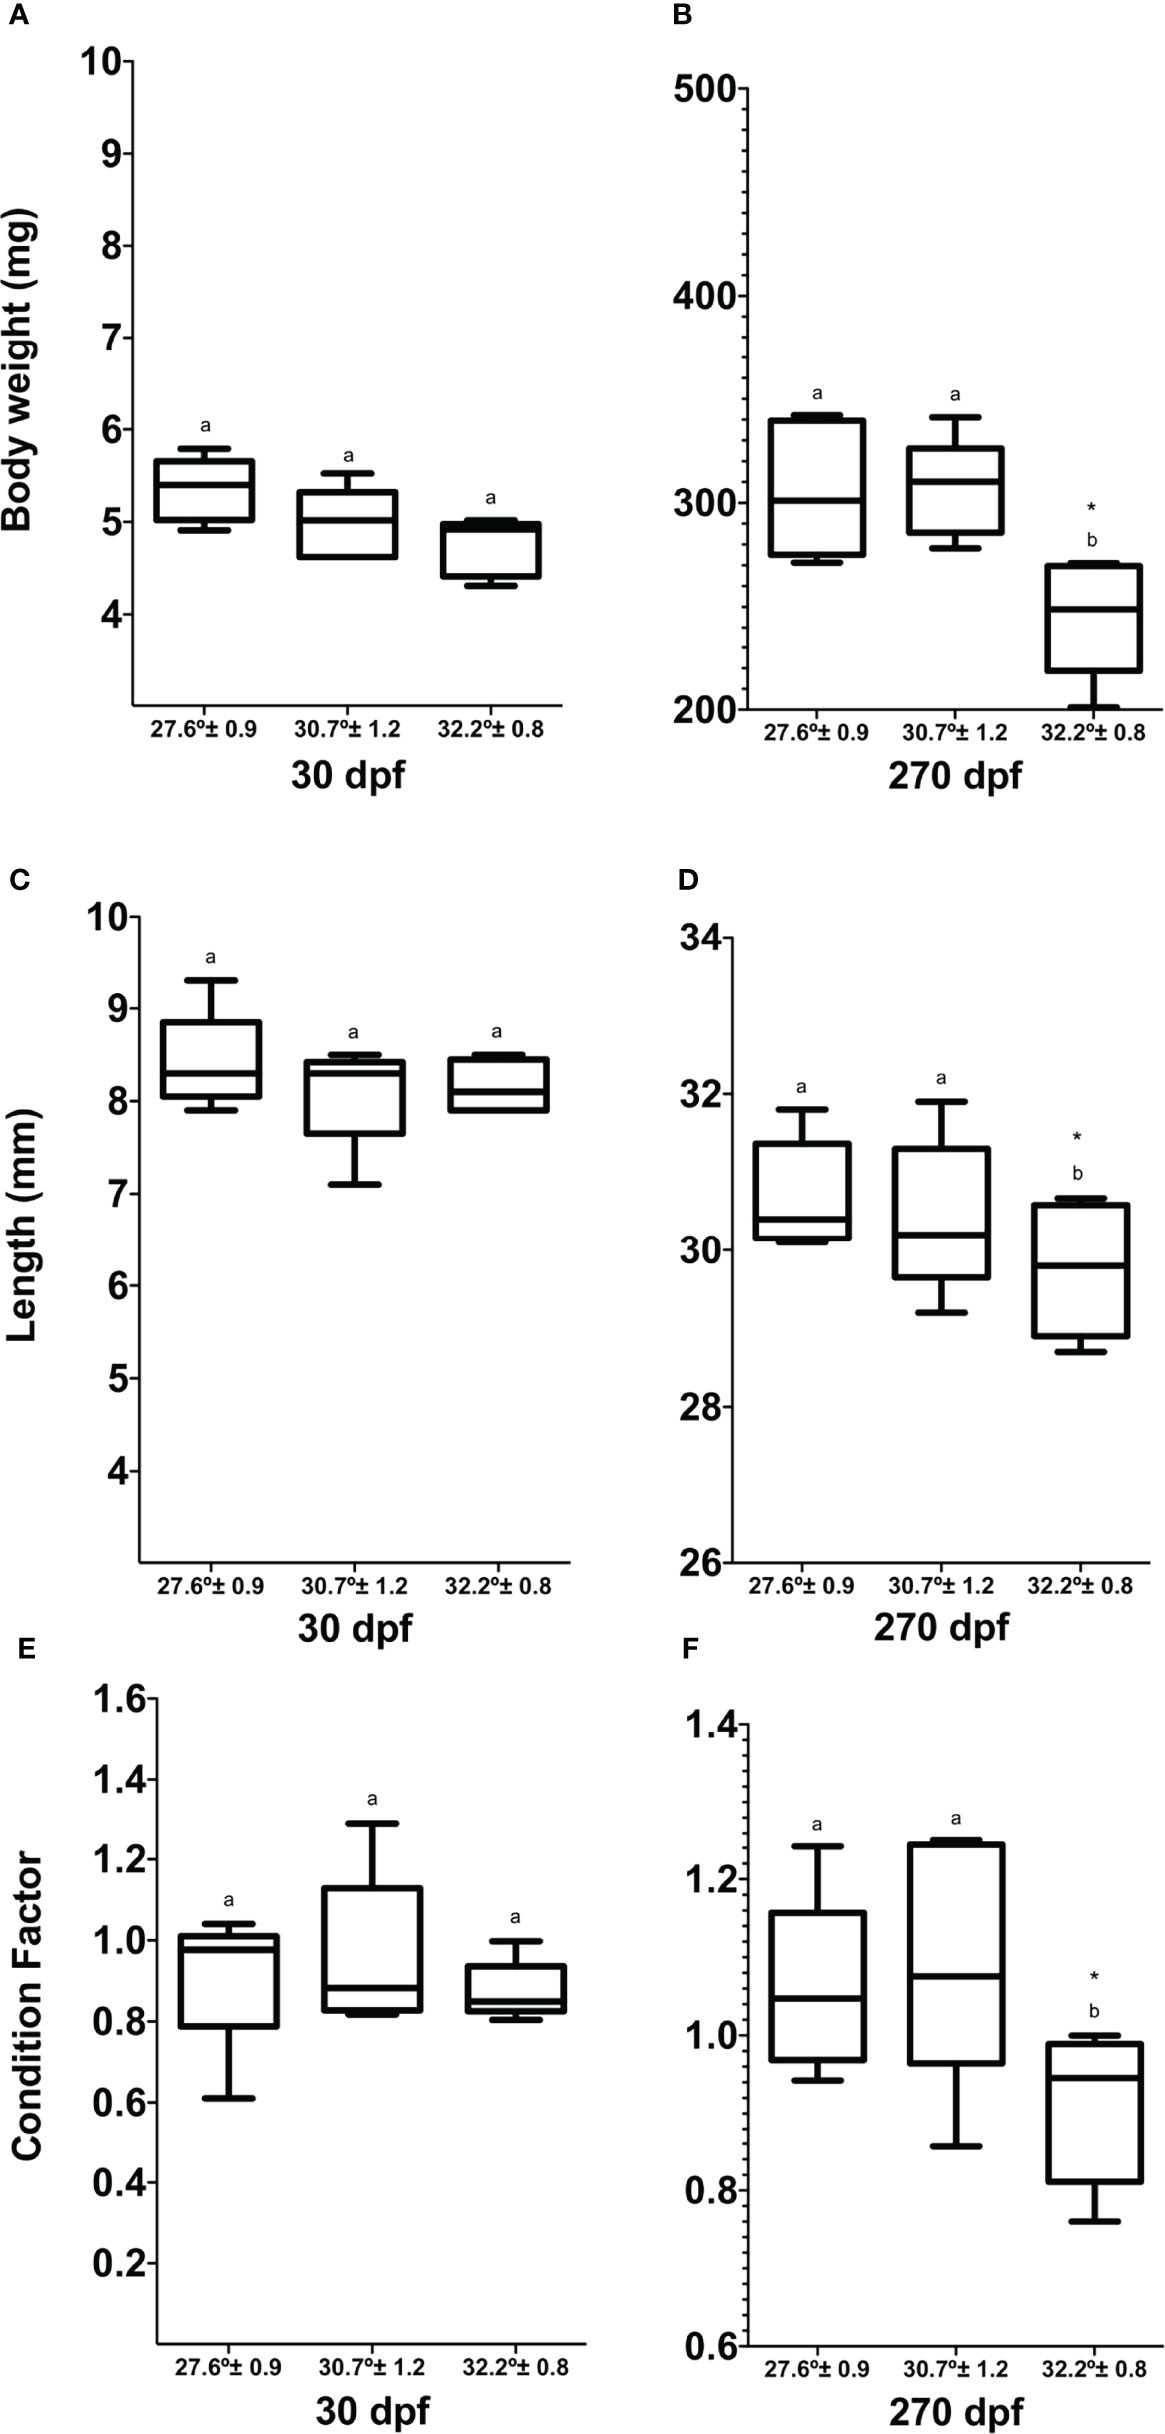
Figure 2 Analysis of biometric parameters and condition factor of Danio rerio during the experimental period. (A) Body weight 30 dpf, (B) body weight 180 dpf, (C) length 30 dpf, (D) length 180 dpf, (E) condition factor 30 dpf, (F) condition factor 180 dpf. Different letters correspond to significant differences among temperature groups for each time point. Asterisk denotes significant change over time within each temperature group. Values are means ± SEM (n=27 for each experimental group).
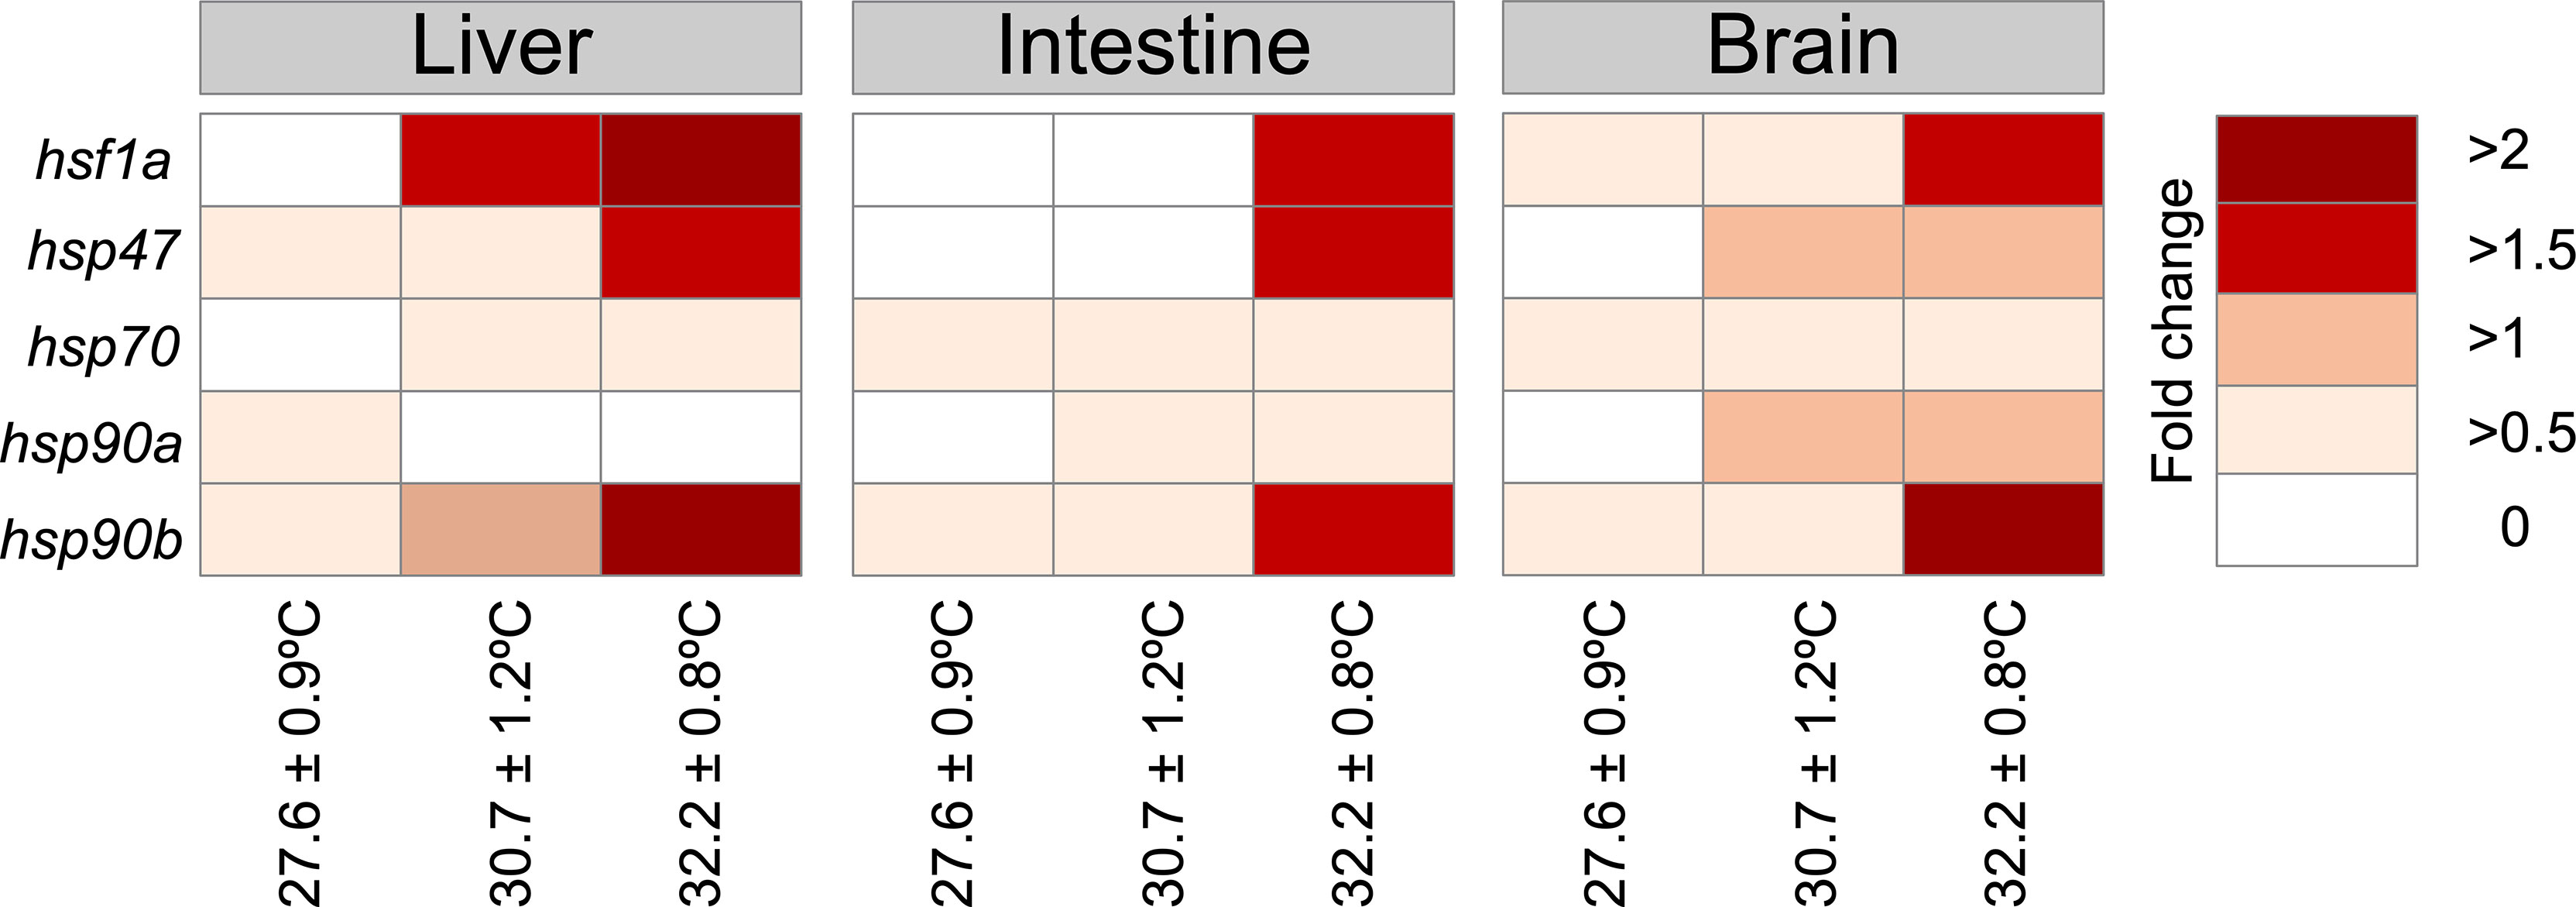
Figure 3 Gene expression of heat-shock proteins (hsp). Heatmap of hsp expression from Danio rerio when comparing fish exposed to 30.7°C and 32.7°C with control fish (exposed to 27.6°C.
Figure 1 shows the workflow for parallel organ metabolome profiling using CIL LC-MS. First, each organ is directly analysed. Next, the 12C-dansyl labelled individual samples are separately injected into LC-UV to measure each sample’s total concentration of labelled metabolites for sample amount normalisation. Based on the total concentration, the volume of an individual sample (unlabelled) was mixed with an equal amount of other unlabelled samples to generate a pooled organ sample (i.e., liver-pool, brain pool, and intestine pool from 9 individuals in each thermal treatment). Then, the pooled sample labelled by 13C-dansylation served as a reference or internal standard for the 12C-labelled samples. Next, an equal amount of the 12C-labelled individual sample and the 13C-labeled pooled sample was mixed. Finally, a quality control (QC) sample was prepared by mixing an equal amount of the 12C-labeled and 13C- labelled pooled samples. LC-TOF-MS analysed the mixtures of 13C-pool (Figure 4A). A table of metabolite intensity was produced after peak pair extraction and peak ratio calculation. The peak ratio values (12C2-peak vs 13C2-peak) for a given metabolite peak pair in all individual samples reflected the relative concentration differences of the metabolite in these samples. The quantitative metabolome tables generated from all organs were used for data comparison and statistical analysis.
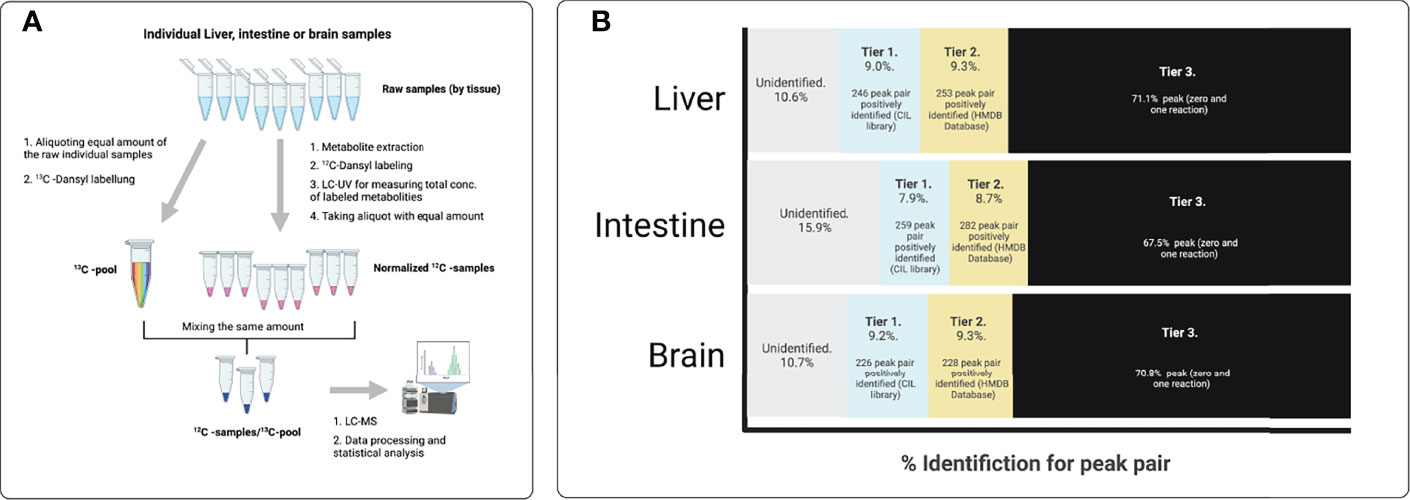
Figure 4 Workflow of the differential chemical isotope labeling LC-MS method for tissue metabolomic profiling. (A) Procedure for analyzing individual samples within liver, intestine or brain. (B) Identification results for each peak pair in liver, intestine or brain in each thermal set-up. Metabolites identified in tier 1 and tier 2 correspond to high confidence identified results, and were used for pathway analysis the pathway analysis tools (CIL Library and Pathway Analysis module in MetaboAnalyst. Metabolites that were identified in tier 1 and tier 2 are shown in Supplemental Tables 1–6.
The liver samples subjected to metabolic analysis by CIL-LC/MS were analysed posteriorly using the Metabolome Database (HMDB) and the Evidence-Based Metabolome Library (EML). A chart diagram (Figure 4B) was generated for the metabolites detected in the total sample after 270 dpf for each thermal treatment. Peak pairs that were presented in at least 89.4% of samples in any group were retained. Less commonly detected peak pairs were filtered out to ensure data quality (69.8%). The ratio of total proper signals was normalised for all data. The missing values of peak pairs in some samples due to low signal intensity (i.e., below the detection limit) were replaced with a rationally determined ratio by a unique zero-imputation program. 12 12C-/13C-mixtures were produced from triplicate experiments of 9 Liver samples using the workflow shown in Figure 4A. LC-MS individually analysed these mixtures, and three injections of the QC sample spaced evenly among the 9 sample injections were also performed (9 individual livers and three pools of the-liver samples, N=12). The QC data clustered together, indicating excellent analytical reproducibility in LC-MS data acquisition. Some separations of the three thermal treatments were already visible. Figure 5A shows the PCA plot of the liver dataset according to three individuals by thermal treatment. 500 metabolites were detected positively (Figure 4B), including amino acids, nucleotides, carbohydrates, organic acids, and lipids (Supplementary Tables S1, S2).
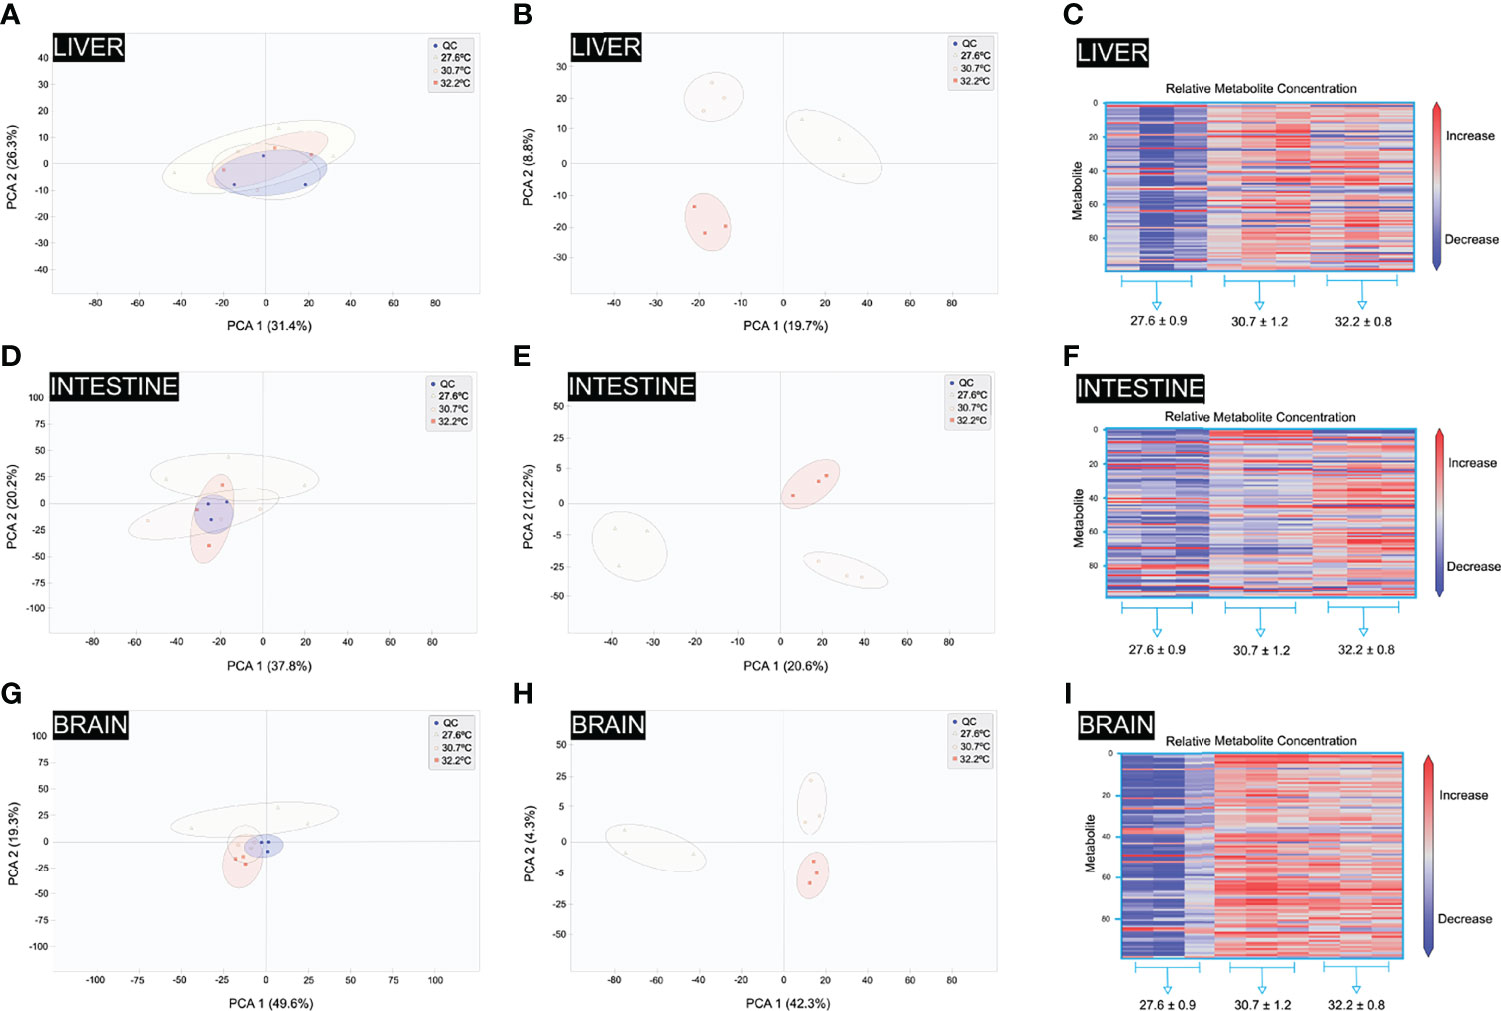
Figure 5 Validation diagrams of metabolomics data and orthogonal partial least square discriminant analysis of liver, intestine and brain samples. (A) Liver principle component analysis (PCA) 2D scores plot (with QC). (B) Liver OPLS-DA score plots (without QC). (C) Liver OPLS-DA VIP Scores Heatmap. (D) Intestine principle component analysis (PCA) 2D scores plot (with QC). (E) Intestine OPLS-DA score plots (without QC). (F) Intestine OPLS-DA VIP Scores Heatmap. (G) Brain principle component analysis (PCA) 2D scores plot (with QC). (H) Brain OPLS-DA score plots (without QC). (I) Brain OPLS-DA VIP Scores Heatmap.
PCA was used to show the impact of the temperature on the liver’s metabolic functions. The PCA results revealed clear differences in metabolite profiles among the thermal treatments, indicating great differences in liver function after 270 days at different temperatures. OPLS-DA was used to identify differentially expressed metabolites in the liver of D. rerio in response to different temperatures during the development. The OPLS-DA results revealed notable differences in the metabolite profiles among treatments after 270 days of exposure to 30.7°C and 32.2°C. Figure 5B shows the OPLS-DA plot of the liver dataset according to the treatments. These three treatments are clearly separated (R2X = 0.369, R2Y = 0.952, and Q2 = 0.944). The R2Y metric describes the percentage of variation explained by the model, while the Q2 metric describes the model’s predictive ability (27.6°C, Figure 5B).
Based on the OPLS-DA results, the differential metabolites among the groups were classified (Supplementary Tables S1, S2). The significant differences in the levels of differential metabolites among the groups were normalized, and clustered heat maps were generated (Figure 5C). Significant differences were registered in the liver metabolite profiles among the groups in response to different water temperatures, with most differences observed in the amino acid metabolism (20%), lipid metabolism (14.2%), protein and DNA methylation (13.9%, Figures 6A, B). Furthermore, a significant difference in the treatments were observed for the metabolites SCP-2 (sterol carrier protein 2), and HMG-CoA synthase (hydroxymethylglutaryl-CoA synthase), S-Adenosyl-L-homocysteine, N-acetyl-5-hydroxytryptamine, N-acetylserotonin, Serotonine, Alanine, Gamma-Glutamylglutamic acid, symmetric dimethylarginine, N(6)-Methyllysine, kanosamine, 7-Aminomethyl-7 carbaguanine and Very-low-density lipoprotein (VLDL), High-density lipoprotein (HDL). Interestingly, fish at normal thermal conditions also showed significantly lower concentrations of the metabolite annotated as Valyl-Aspartate than at higher temperatures. Valyl-Aspartate plays a critical role in the correct function of the fish liver. Significant treatment effects were observed for the metabolites annotated as α-ketoglutaric acid, which is an essential metabolite in the tricarboxylic acid cycle (TCA) and plays an important role in the synthesis and decomposition of glutamic acid. Glutamic acid is the precursor of arginine, proline, and glutathione. Therefore, variations in the amount of glutamic acid reflect changes in glutathione, arginine, and proline metabolism. Simultaneously, cysteamine was also identified as being differentially expressed between the groups. Cysteamine can directly or indirectly stimulate the release of growth hormones by inhibiting or weakening the effect of somatostatin, thereby promoting the growth differences observed in the fish reared at different temperatures. This observation highlights the impact of higher temperatures on the liver’s metabolism.
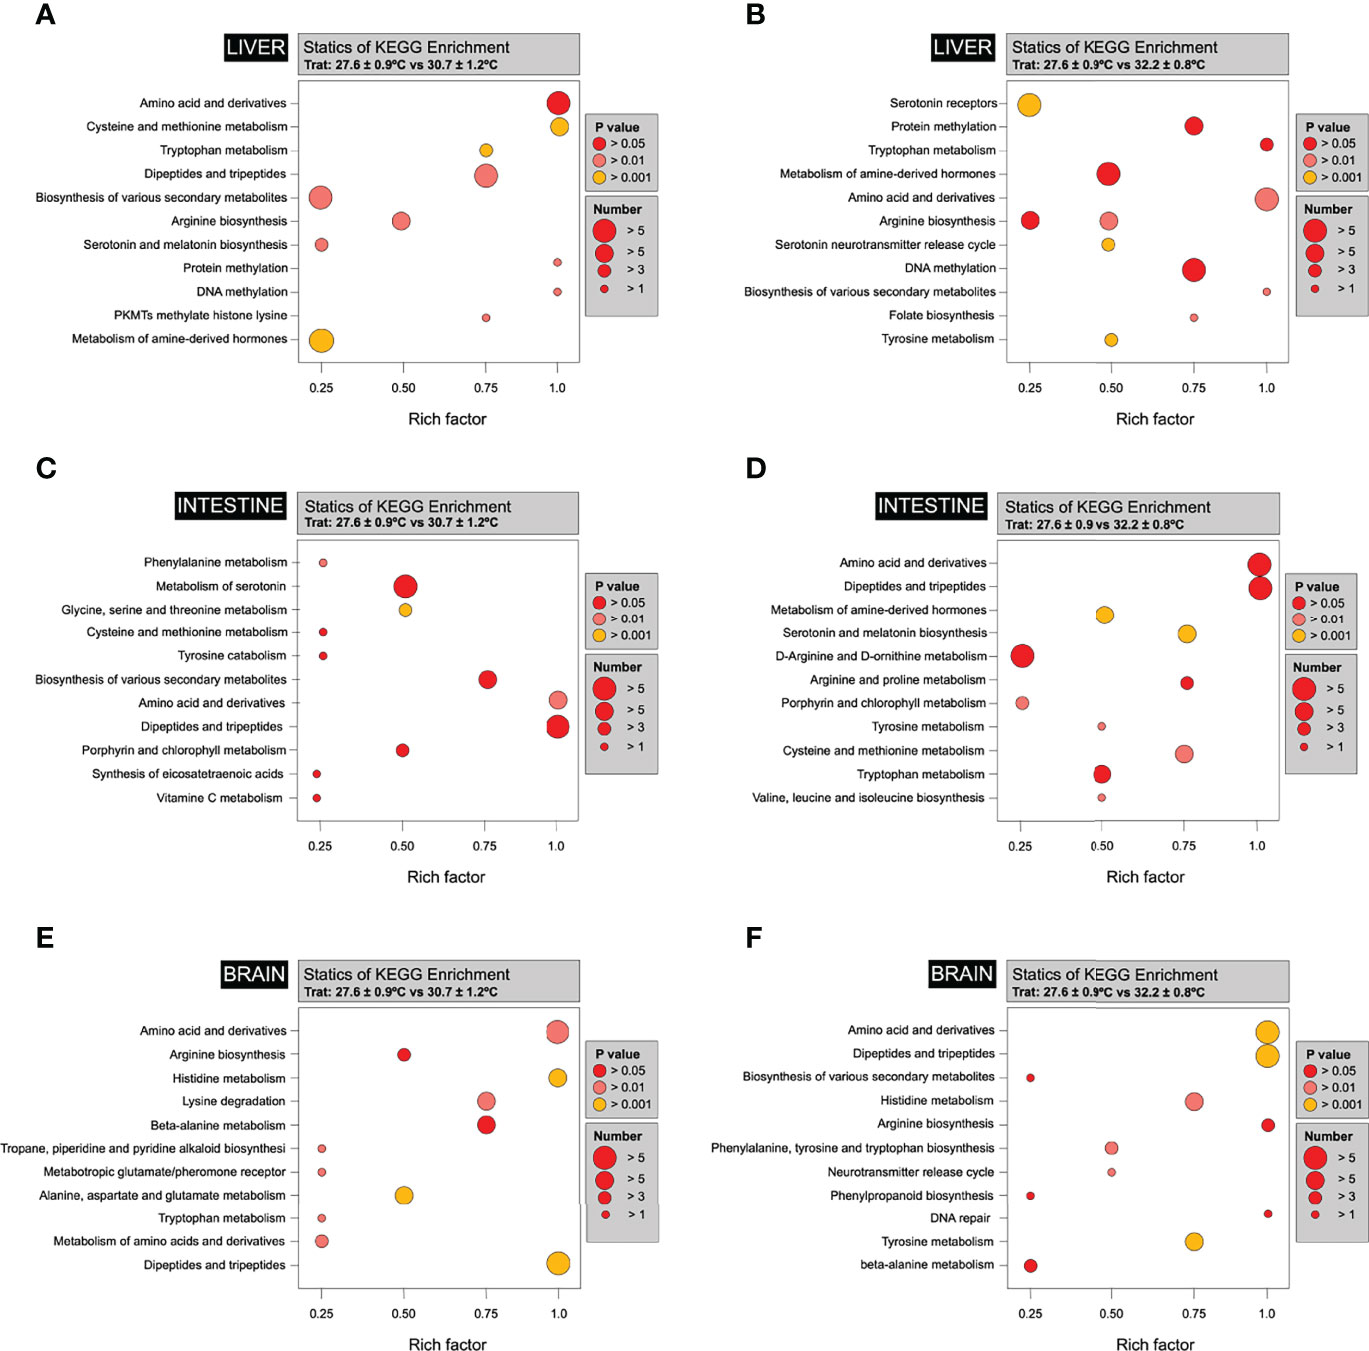
Figure 6 Bubble diagrams of different metabolites between tissues. The abscissa in the bubble graphs represents the Rich factor (the ratio of the number of differentially expressed metabolites in the corresponding pathway to the total number of metabolites annotated by the pathway detection; the greater the value, the greater the degree of enrichment), while the ordinate is the name of the passage. A deeper red colour of the points indicates that the enrichment is more significant. The size of the spots represents the number of enriched differential metabolites. (A) A bubble diagram of the differential metabolites of Liver individuals at 27.6 ± 2°C and 30.7 ± 2°C. (B) A bubble diagram of the differential metabolites of Liver control individuals 27.6 ± 2°C and 32.7 ± 2°C. (C) A bubble diagram of the differential metabolites of Intestine individuals at 27.6 ± 2°C and 30.7 ± 2°C. (D) A bubble diagram of the differential metabolites of Intestine individuals at 27.6 ± 2°C and 32.7 ± 2°C. (C) A bubble diagram of the differential metabolites of Brain individuals at 27.6 ± 2°C and 30.7 ± 2°C. (D) A bubble diagram of the differential metabolites of Brain individuals at 27.6 ± 2°C and 32.7 ± 2°C.
In total, 12 12C-/13C-mixtures were produced from triplicate experiments of 9 intestine samples by using the workflow shown in Figure 4A. These mixtures were analysed individually by LC-MS, and three injections of the QC sample spaced evenly among the 9 sample injections were also performed (9 individual intestines and three pool-intestine samples, N=12). The QC data were clustered together, indicating excellent analytical reproducibility in LC-MS data acquisition. Some separations of the three thermal treatments were already visible. Figure 5D shows the PCA plot of the intestine dataset according to three individuals by thermal treatment. A total of 541 metabolites were detected (Figure 4B and Supplementary Tables S3, S4). The PCA results revealed clear differences in the profiles of the metabolites among the different thermal treatments, showing higher differences in intestine function after 270 days of exposure to the different temperatures. The OPLS results also revealed notable differences in the metabolite profiles among treatments after 270 days of exposure to 27.6, 30.7 and 32.2°C. Figure 5E shows the OPLS-DA plot of the intestine dataset according to the treatments. These three treatments are clearly separated (R2X = 0.989, and Q2 = 0.193). Based on the OPLS-DA results, the differential metabolites among the groups were classified (Supplementary Tables S3, S4). The significant differences in the levels of differential metabolites among the groups were normalised, and clustered heat maps were generated (Figure 5F). The temperature-induced differences in the intestine metabolite profiles among the groups show the most differences in metabolites, such as nucleotide biosynthesis (46.4%), followed by D-amino acid metabolism and lipid metabolism-related metabolites (Figures 6C, D). A significant treatment effect was registered for the metabolites annotated as VLDL, HDL, 5-Guanidino-2-oxopentanoic acid, and Isomer 1 5-Guanidino-2-oxopentanoic acid, which display significantly higher concentrations than in the intestines of fish reared at higher temperatures (Figure 6D).
Interestingly, fish at normal thermal conditions also displayed significantly lower concentrations of the metabolite annotated as Aspartyl-Glycine and Valyl-Aspartate than the fish reared at the higher temperature. D-Amino acids play a significant role in relevant biological functions, such as D-Amino, which may have adverse effects as they can be found in some bacteria or form spontaneously in specific reactions for example, those induced by high temperatures. D-Amino acid oxidase (DAAO) is one of the main enzymes that metabolise D-Amino acids via deamination. DAAO is highly specific toward D-amino acids and favours free neutral D-amino acids or those with hydrophobic, polar, or aromatic groups (Figure 6D).
454 metabolites were positively detected in the brain (Figure 4B), including amino acids, nucleotides, carbohydrates, organic acids, and lipids (Supplementary Tables S5, S6). The QC data were clustered together, indicating excellent analytical reproducibility in LC-MS data acquisition. Some separations of the three thermal treatments were already visible. Figure 5G shows the PCA plot of the intestinal dataset according to three individuals by thermal treatment. PCA was carried out to explore the effect of temperature on the metabolic functions of the brain. The PCA results revealed clear differences in metabolite profiles among the different thermal treatments, showing higher differences in brain function after 270 days of exposure to the different temperatures. The OPLS results revealed differences in the metabolite profiles among treatments after 270 days of exposure to 27.6, 30.7 and 32.2°C (Figure 5H). These three treatments were separated (R2Y = 0.999 and Q2 = 0.765). Significant differences in the levels of differential metabolites among the groups were normalized, and clustered heat maps were generated (Figure 5I). Notable differences were observed in the brain metabolite profiles among the groups in response to different water temperatures, with the most differences in lipid metabolism, arginine biosynthesis and phenylalanine, tyrosine and tryptophan biosynthesis (Figures 6E, F).
Climate change imposes various thermal challenges on organisms, mainly those inhabiting aquatic environments. It is projected that the mean temperature will increase by 1.5-5°C compared to early 1900 (IPCC, 2014), with heatwaves increasing frequency and severity (Perkins et al., 2012). Ectotherms, especially aquatic organisms, are vulnerable as their body temperature directly follows their environment (Angilletta, 2009). In this study, the growth and the metabolic performance are influenced in fish conditioned during the long term (270 dpf) at high temperatures (32°C). Specifically, we showed that fish reared at higher temperatures below the lethal (32.2°C) presented a reduced growth, reduced condition factor and significant increase in metabolites related to protein catabolism energy and lipid metabolism. These results agree with previous studies and show that specific zebrafish is sensitive to temperatures above 32°C (Åsheim et al., 2020) and showed that fish conditioned to long-term to supra-optimal temperatures drive reduced growth and fecundity (Pörtner et al., 2001; Pörtner and Knust, 2007; Gräns et al., 2014; Åsheim et al., 2020).
In this study, we demonstrated the utility of the CIL-LC/MS-based metabolomics method for assessing changes in the metabolome of D. rerio in the brain, intestine and liver of fish reared at high temperatures. In ectotherms, have been observed that the liver is the tissue impacted mainly by high temperatures. The physiological response of the liver to high temperatures remains consistent between different taxa, with significant metabolite performance; in contrast, the impact of the warm temperature on the metabolite composition in the fish intestine and other tissues is still limited. In mammals, high temperatures significantly increase hepatic lactate uptake through gluconeogenesis (Lucke, 1978; Hall et al., 1980). For example, mice exposed to high temperatures for a long time have been observed to alter the gluconeogenesis process, TCA cycle components (fumarate, malate, and 2-ketoglutarate) and the urea cycle (Araújo et al., 2019). Our results agree with mammal studies and show that the high temperature impacts the TCA cycle, gluconeogenesis, and fatty acid metabolism.
Additionally, we observed the up-regulation of SCP-2 (sterol carrier protein 2) and HMG-CoA synthase (hydroxymethylglutaryl-CoA synthase). Specific, SCP-2 binds and transports lipid ligands such as long-chain fatty acids and their CoA thioesters 4 (Hayashi et al., 2002) and phospholipids (Shimazu et al., 2013). HMG-CoA synthase catalyzes the condensation of acetyl-CoA with acetoacetyl-CoA to form 3-hydroxy-3-methylglutaryl-CoA (HMG-CoA), an intermediate in cholesterol synthesis and ketogenesis (Shimazu et al., 2010). HMG-CoA contributes to the synthesis of cholesterol, an essential component of membrane fluidity (Polymeropoulos et al., 2009). Fatty acids synthesized in the liver should be integrated into triacylglycerols and packaged into VLDL or HDL (Vitali et al., 2017), which drives the fatty acids to other tissues for use or storage (Xiao et al., 2020). We observed that changes in VLDL and HDL levels induced by the rise in the temperature indicate that lipids might be broken down into smaller, simple molecules, suggesting that the individuals are in a catabolic state. Thus, our results are in concordance with previous studies and show that the metabolic activity of the liver is highly susceptible to a catabolic state by external stressors, such as a rise in the water temperature (Surai et al., 2019; Xiao et al., 2020; Zhang et al., 2021).Perhaps the most compelling finding is that heat treatment produced significant changes in the intestinal metabolites in the intestine, with most metabolites significantly reduced compared with the group reared at 27, 6°C, including oleic acid, palmitic acid, stearic acid, and mannose, myristic acid, and carbazole. These metabolites are involved in the fatty acid synthesis, mainly with energy and lipid metabolism (Savage et al., 2007; Loscalzo, 2011; Li et al., 2017). Previous reports have also shown that lengthy exposure to elevated temperature impacts the metabolism of the fatty acids in the intestine, including increased levels of VLDL and decreased HDL. As shown in Figure 6, the fatty acid pathway, VLDL, and HDL greatly impacted the intestine. This study also highlights those high temperatures induce a specific change in the amino-acid (AA) metabolism, mainly in the intestine and brain. The bubble diagram shows that the heat treatment inhibited fatty acid synthesis in the intestine and drove changes in the intestine’s amino-acid (AAs) metabolism, linked explicitly with the AA turnover (Bouchama and Knochel, 2002; Kovats and Hajat, 2008; He et al., 2019). Our results indicate that fish reared at high temperatures reduce the phenylalanine and tyrosine pathways, suggesting an increased AA turnover (Boglione et al., 2013; Messineo et al., 2018). Several reports have shown that high temperature impacts the AAs’ turnover (Kullgren et al., 2013; Sommer and Wolf, 2014; Salamanca et al., 2021), causing tyrosine and phenylalanine deficiency and reducing fish growth (Todgham et al., 2017; Valenzuela et al., 2018). These results are in concordance with our results that show that the warm temperature impacts AA turnover and reduces growth (Figures 2, 6). However, the specific roles of AA deficiency by increased temperature and its relationship with reduced growth need further investigation.One interesting finding is that AA deficiency is a process highly impacted in the three tissues. For example, in the liver and intestine, metabolites related to aminoacidic catabolism and some neuropeptides, both pathways linked to AA deficiency and feeding behaviour, were affected significantly in fish reared at high temperatures (Sanhueza et al., 2018), as observed in the brain. Our results are in concordance with the study in Acipenser stellatus and, in particular, show that warm temperature changes the turnover of L-glutamic acid, L-alanine, L-tryptophan, L-valine, and L-tryptophan, L-valine, L-valine L-leucine (Monselise et al., 2011; Mushtaq et al., 2014). We observed that other amino acids’ synthesis also significantly impacted the three tissues, liver, intestine and brain, such as D -Serine or Alanine. D-Serine is related to the locomotor activity induced by environmental stressors and diseases (Fry, 1971; Reilly and Thompson, 2007; Hayes and Volkoff, 2014; Rosewarne et al., 2016; Speers-Roesch et al., 2018; Jutfelt, 2020; Le et al., 2020). In our study, D-Serine was highly expressed in fish reared at warm temperatures in all tissues. In fish, reports show that modifications on the D-Serine and the Alanine levels were triggered by heat stress.
The current research allowed the identification of significant changes in the metabolite performance of fish reared at high temperatures. Moreover, at high temperatures, fish show significant differences in the mean body weights. We identified vital metabolites and processes involved in thermal acclimation, including enhanced fatty acid oxidation, lipid and carbohydrate metabolism and amino acid catabolism such as α-ketoglutaric acid, SCP-2, HMG-CoA synthase, D-serine or alanine, serotonin, 5-hydroxytryptamine. Future research into genetic and epigenetic mechanisms and their effect on the metabolic pathways identified will help improve our understanding concerning the fish responses to climate change. This information may also be valuable for biomarker discovery research in untargeted metabolomics.
The original contributions presented in the study are included in the article/Supplementary Material. Further inquiries can be directed to the corresponding author.
All experiments with fish were carried out at the ThermoFish Lab, Biotechnology Centre, University of Concepcion, Concepcion, Chile. Fish were handled in accordance with the “International Guiding Principles for Biomedical Research Involving Animals” established by the European Union Council (2010/63/EU).
The study was conceived by SB. The behavioural experiments were performed by NS and AA. BC, HM, AA, and SB performed metabolomic analysis. MT and AA have performed the gene expression and provided extensive additional input. SB obtained the funding acquisition. SB, MT, and AA drafted the manuscript with substantial contributions from all other authors. All authors contributed to the article and approved the submitted version.
This work was supported by the following grants, FONDECYT 1190627 awarded by CONICYT Chile to SB and CONICYT-PCHA/Doctorado Nacional/2018-21181886 to NS, and CONICYT-PCHA/Doctorado Nacional/2019-21190538 to BC. MT acknowledge the support provided by the “Ministerio de Economía y Competitividad” from Spain (“Plan Nacional de Investigación”, reference PID2020-113221RB-I00 and “Ramon y Cajal” contract, reference RYC2019-026841-I).
The authors declare that the research was conducted in the absence of any commercial or financial relationships that could be construed as a potential conflict of interest.
All claims expressed in this article are solely those of the authors and do not necessarily represent those of their affiliated organizations, or those of the publisher, the editors and the reviewers. Any product that may be evaluated in this article, or claim that may be made by its manufacturer, is not guaranteed or endorsed by the publisher.
The Supplementary Material for this article can be found online at: https://www.frontiersin.org/articles/10.3389/fmars.2022.835379/full#supplementary-material
Angilletta M. J. (2009). “Thermal Adaptation: A Theoretical and Empirical Synthesis,” in Thermal Adaptation, 1–302 p. doi:10.1093/acprof:oso/9780198570875.001.1
Arai A., Naruse K., Mitani H., Shima A. (1995). Cloning and Characterization of cDNAs for 70-kDa Heat-Shock Proteins (Hsp70) From Two Fish Species of the Genus Oryzias. Japanese J. Genet. 70 (3), 423–433. doi: 10.1266/jjg.70.423
Araújo A. M., Enea M., Carvalho F., Bastos M de L., Carvalho M., de Pinho P. G. (2019). Hepatic Metabolic Derangements Triggered by Hyperthermia: An In Vitro Metabolomic Study. Metabolites 9 (10), 228. doi: 10.3390/metabo9100228
Åsheim E. R., Andreassen A. H., Morgan R., Jutfelt F. (2020). Rapid-Warming Tolerance Correlates With Tolerance to Slow Warming But Not Growth at non-Optimal Temperatures in Zebrafish. J. Exp. Biol. 223 (23), 1–7. doi: 10.1242/jeb.229195
Boglione C., Gisbert E., Gavaia P., Witten P. E., Moren M., Fontagné S., et al. (2013). Skeletal Anomalies in Reared European Fish Larvae and Juveniles. Part 2: Main Typologies, Occurrences and Causative Factors. Rev. Aquac. 5 (SUPPL.1) S121–S167. doi: 10.1111/raq.12016
Bouchama A., Knochel J. P. (2002). Medical Progress: Heat Stroke. N Engl. J. Med. 346 (25), 1978–19788. doi: 10.1056/NEJMra011089
Bundy J. G., Davey M. P., Viant M. R. (2009). Environmental Metabolomics: A Critical Review and Future Perspectives. Metabolomics 5 (1), 3–21. doi: 10.1007/s11306-008-0152-0
Coelho F. J. R. C., Cleary D. F. R., Rocha R. J. M., Calado R., Castanheira J. M., Rocha S. M., et al. (2015). Unraveling the Interactive Effects of Climate Change and Oil Contamination on Laboratory-Simulated Estuarine Benthic Communities. Glob. Chang. Biol. 21 (5), 1871–1886. doi: 10.1111/gcb.12801
Donelson J. M., Munday P. L., McCormick M. I., Pitcher C. R. (2012). Rapid Transgenerational Acclimation of a Tropical Reef Fish to Climate Change. Nat. Clim. Chang. 2 (1), 30–32. doi: 10.1038/nclimate1323
Ellis R. P., Spicer J. I., Byrne J. J., Sommer U., Viant M. R., White D. A., et al. (2014). 1h NMR Metabolomics Reveals Contrasting Response by Male and Female Mussels Exposed to Reduced Seawater Ph, Increased Temperature, and a Pathogen. Environ. Sci. Technol. 48 (12), 7044–7052. doi: 10.1021/es501601w
Fabbri E., Valbonesi P., Franzellitti S. (2008). HSP Expression in Bivalves. Invertebr. Surviv. J. 5 (2), 135–161.
Fry F. E. J. (1971). The Effect of Environmental Factors on the Physiology of Fish. Fish. Physiol., 6, 1–98. doi: 10.1016/S1546-5098(08)60146-6
Gräns A., Jutfelt F., Sandblom E., Jönsson E., Wiklander K., Seth H., et al. (2014). Aerobic Scope Fails to Explain the Detrimental Effects on Growth Resulting From Warming and Elevated CO2 in Atlantic Halibut. J. Exp. Biol. 217 (5), 711–717. doi: 10.1242/jeb.096743
Hall G. M., Lucke J. N., Lovell R., Lister D. (1980). Porcine Malignant Hyperthermia. VII: Hepatic Metabolism. Br. J. Anaesth. 52 (1), 11–17.
Hammer K. M., Pedersen S. A., Storseth T. R. (2012). Elevated Seawater Levels of CO2 Change the Metabolic Fingerprint of Tissues and Hemolymph From the Green Shore Crab Carcinus Maenas. Comp. Biochem. Physiol. - Part D Genomics Proteomics 7 (3), 292–302. doi: 10.1016/j.cbd.2012.06.001
Hayashi H., De Bellis L., Hayashi Y., Nito K., Kato A., Hayashi M., et al. (2002). Molecular Characterization of an Arabidopsis Acyl-Coenzyme a Synthetase Localized on Glyoxysomal Membranes. Plant Physiol. 130 (4), 2019–2026. doi: 10.1104/pp.012955
Hayes J., Volkoff H. (2014). Characterization of the Endocrine, Digestive and Morphological Adjustments of the Intestine in Response to Food Deprivation and Torpor in Cunner, Tautogolabrus Adspersus. Comp. Biochem. Physiol. - A Mol. Integr. Physiol. 170, 46–59. doi: 10.1016/j.cbpa.2014.01.014
He J., Guo H., Zheng W., Xue Y., Zhao R., Yao W. (2019). Heat Stress Affects Fecal Microbial and Metabolic Alterations of Primiparous Sows During Late Gestation. J. Anim. Sci. Biotechnol. 10 (1), 84. doi: 10.1186/s40104-019-0391-0
Huan T., Li L. (2015a). Counting Missing Values in a Metabolite-Intensity Data Set for Measuring the Analytical Performance of a Metabolomics Platform. Anal. Chem. 87 (2), 1306–1313. doi: 10.1021/ac5039994
Huan T., Li L. (2015b). Quantitative Metabolome Analysis Based on Chromatographic Peak Reconstruction in Chemical Isotope Labeling Liquid Chromatography Mass Spectrometry. Anal. Chem. 87 (14), 7011–7016. doi: 10.1021/acs.analchem.5b01434
Huan T., Wu Y., Tang C., Lin G., Li L. (2015). DnsID in MyCompoundID for Rapid Identification of Dansylated Amine- and Phenol-Containing Metabolites in LC-MS-Based Metabolomics. Anal. Chem. 87 (19), 9838–9845. doi: 10.1021/acs.analchem.5b02282
IPCC (2014). Climate Change 2014: Synthesis Report. Contribution of Working Groups I, II and III to the Fifth Assessment Report of the Intergovernmental Panel on Climate Change ( Ipcc), 151 p.
Jiao S., Nie M., Song H., Xu D., engYou F. (2020). Physiological Responses to Cold and Starvation Stresses in the Liver of Yellow Drum (Nibea Albiflora) Revealed by LC-MS Metabolomics. Sci. Total Environ. 715, 136940. doi: 10.1016/j.scitotenv.2020.136940
Johansen J. L., Jones G. P. (2011). Increasing Ocean Temperature Reduces the Metabolic Performance and Swimming Ability of Coral Reef Damselfishes. Glob. Chang. Biol. 17 (9), 2971–2979. doi: 10.1111/j.1365-2486.2011.02436.x
Jutfelt F. (2020). Metabolic Adaptation to Warm Water in Fish. Funct. Ecol. 34 (6), 1138–1141. doi: 10.1111/1365-2435.13558
Kothary R. K., Burgess E. A., Candido E. P. M. (1984). The Heat Shock Phenomenon in Cultured Cells of Rainbow Trout: Hsp70mrna Synthesis and Turnover. Biochim. Biophys. Acta 783, 137–143. doi: 10.1016/0167-4781(84)90005-8
Kovats R. S., Hajat S. (2008). Heat Stress and Public Health: A Critical Review. Annu. Rev. Public Health, 29, 41–55. doi: 10.1146/annurev.publhealth.29.020907.090843
Kullgren A., Jutfelt F., Fontanillas R., Sundell K., Samuelsson L., Wiklander K., et al. (2013). The Impact of Temperature on the Metabolome and Endocrine Metabolic Signals in Atlantic Salmon (Salmo Salar). Comp. Biochem. Physiol. - A Mol. Integr. Physiol. 164 (1), 44–53. doi: 10.1016/j.cbpa.2012.10.005
Le M. H., Dinh K. V., Nguyen M. V., Rønnestad I. (2020). Combined Effects of a Simulated Marine Heatwave and an Algal Toxin on a Tropical Marine Aquaculture Fish Cobia (Rachycentron Canadum). Aquac. Res. 51 (6), 2535–2544. doi: 10.1111/are.14596
Lele Z., Engel S., Krone P. H. (1997). Hsp47 and Hsp70 Gene Expression is Differentially Regulated in a Stress-and Tissue-Specific Manner in Zebrafish Embryos. Dev. Genet. 21 (2), 123–133. doi: 10.1002/(SICI)1520-6408(1997)21:2<123::AID-DVG2>3.0.CO;2-9
Li L., Li R., Zhou J., Zuniga A., Stanislaus A. E., Wu Y., et al. (2013). MyCompoundID: Using an Evidence-Based Metabolome Library for Metabolite Identification. Anal. Chem. 85 (6), 3401–3408. doi: 10.1021/ac400099b
Li X., Yu X., Sun D., Li J., Wang Y., Cao P., et al. (2017). Effects of Polar Compounds Generated From the Deep-Frying Process of Palm Oil on Lipid Metabolism and Glucose Tolerance in Kunming Mice. J. Agric. Food Chem. 65 (1), 208–215. doi: 10.1021/acs.jafc.6b04565
López-Olmeda J. F., Sánchez-Vázquez F. J. (2011). Thermal Biology of Zebrafish (Danio Rerio). J. Therm. Biol. 36 (2), 91–104. doi: 10.1016/j.jtherbio.2010.12.005
Loscalzo J. (2011). Lipid Metabolism by Gut Microbes and Atherosclerosis. Circ. Res. Vol. 109, 127–129. doi: 10.1161/RES.0b013e3182290620
Lucke J. N. (1978). Liver Metabolism During Malignant Hyperthermia in the Pietrain Pig. Vet. Anaesth. Analg. 8 (1), 70–72. doi: 10.1111/j.1467-2995.1978.tb00445.x
Mahanty A., Purohit G. K., Yadav R. P., Mohanty S., Mohanty B. P. (2017). Hsp90 and Hsp47 Appear to Play an Important Role in Minnow Puntiussophore for Surviving in the Hot Spring Run-Off Aquatic Ecosystem. Fish. Physiol. Biochem. 43 (1), 89–102. doi: 10.1007/s10695-016-0270-y
Messineo A. M., Gineste C., Sztal T. E., McNamara E. L., Vilmen C., Ogier A. C., et al. (2018). L-Tyrosine Supplementation Does Not Ameliorate Skeletal Muscle Dysfunction in Zebrafish and Mouse Models of Dominant Skeletal Muscle α-Actin Nemaline Myopathy. Sci. Rep. 8 (1), 11490. doi: 10.1038/s41598-018-29437-z
Miller G. M., Watson S. A., Donelson J. M., McCormick M. I., Munday P. L. (2012). Parental Environment Mediates Impacts of Increased Carbon Dioxide on a Coral Reef Fish. Nat. Clim. Chang. 2 (12), 858–861. doi: 10.1038/nclimate1599
Molina A., Biemar F., Müller F., Iyengar A., Prunet P., Maclean N., et al. (2000). Cloning and Expression Analysis of an Inducible HSP70 Gene From Tilapia Fish. FEBS Lett. 474 (1), 5–10. doi: 10.1016/S0014-5793(00)01538-6
Monselise E. B. I., Levkovitz A., Gottlieb H. E., Kost D. (2011). Bioassay for Assessing Cell Stress in the Vicinity of Radio-Frequency Irradiating Antennas. J. Environ. Monit. 13 (7), 1890–1896. doi: 10.1039/c1em10031a
Morgan R., Finnøen M. H., Jensen H., Pélabon C., Jutfelt F. (2020). Low Potential for Evolutionary Rescue From Climate Change in a Tropical Fish. Proc. Natl. Acad. Sci. U. S. A. 117 (52), 33365–33372. doi: 10.1073/pnas.2011419117
Mushtaq M. Y., Marçal R. M., Champagne D. L., van der Kooy F., Verpoorte R., Choi Y. H. (2014). Effect of Acute Stresses on Zebra Fish (Danio Rerio) Metabolome Measured by Nmr-Based Metabolomics. Planta. Med. 80 (14), 1227–1233. doi: 10.1055/s-0034-1382878
Neuheimer A. B., Thresher R. E., Lyle J. M., Semmens J. M. (2011). Tolerance Limit for Fish Growth Exceeded by Warming Waters. Nat. Clim. Chang. 1 (2), 110–113. doi: 10.1038/nclimate1084
Nicholson J. K., Holmes E., Lindon J. C. (2007). “Metabonomics and Metabolomics Techniques and Their Applications in Mammalian Systems,” in The Handbook of Metabonomics and Metabolomics, 1–33. doi: 10.1016/B978-0- 444-52841-4.X5000-0
Ott K., Aran N., Singh B., Stockton G. (2003). Metabonomics Classifies Pathways Affected by Bioactive Compounds. Artificial Neural Network Classification of NMR Spectra of Plant Extracts. Phytochemistry 62 (6), 971–985. doi: 10.1016/S0031-9422(02)00717-3
Perkins S. E., Alexander L. V., Nairn J. R. (2012). Increasing Frequency, Intensity and Duration of Observed Global Heatwaves and Warm Spells. Geophys. Res. Lett. 39 (20), L20714. doi: 10.1029/2012GL053361
Polymeropoulos M. H., Licamele L., Volpi S., Mack K., Mitkus S. N., Carstea E. D., et al. (2009). Common Effect of Antipsychotics on the Biosynthesis and Regulation of Fatty Acids and Cholesterol Supports a Key Role of Lipid Homeostasis in Schizophrenia. Schizophr. Res. 108 (1–3), 134–142. doi: 10.1016/j.schres.2008.11.025
Pörtner H. O., Berdal B., Blust R., Brix O., Colosimo A., De Wachter B., et al. (2001). Climate Induced Temperature Effects on Growth Performance, Fecundity and Recruitment in Marine Fish: Developing a Hypothesis for Cause and Effect Relationships in Atlantic Cod (Gadus Morhua) and Common Eelpout (Zoarces Viviparus). Cont. Shelf. Res. 21 (18–19), 1975–1997. doi: 10.1016/S0278-4343(01)00038-3
Pörtner H. O., Knust R. (2007). Climate Change Affects Marine Fishes Through the Oxygen Limitation of Thermal Tolerance. Science 315 (5808), 95–97. doi: 10.1126/science.1135471
Purohit G. K., Mahanty A., Suar M., Sharma A. P., Mohanty B. P., Mohanty S. (2014). Investigating Hsp Gene Expression in Liver of Channa Striatus Under Heat Stress for Understanding the Upper Thermal Acclimation. BioMed. Res. Int. 2014, 381719. doi: 10.1155/2014/381719
Pype C., Verbueken E., Saad M. A., Casteleyn C. R., Van Ginneken C. J., Knapen D., et al. (2015). Incubation at 32.5°C and Above Causes Malformations in the Zebrafish Embryo. Reprod. Toxicol. 56, 56–63. doi: 10.1016/j.reprotox.2015.05.006
Reilly C. R. L., Thompson S. H. (2007). Temperature Effects on Low-Light Vision in Juvenile Rockfish (Genus Sebastes) and Consequences for Habitat Utilization. J. Comp. Physiol. A Neuroethol. Sensory. Neural. Behav. Physiol. 193 (9), 943–953. doi: 10.1007/s00359-007-0247-5
Rezende E. L., Bozinovic F. (2019). Thermal Performance Across Levels of Biological Organization. Philos. Trans. R Soc. B Biol. Sci. 374 (1778), 20180549. doi: 10.1098/rstb.2018.0549
Riback J. A., Katanski C. D., Kear-Scott J. L., Pilipenko E. V., Rojek A. E., Sosnick T. R., et al. (2017). Stress-Triggered Phase Separation Is an Adaptive, Evolutionarily Tuned Response. Cell 168 (6), 1028–1040.e19. doi: 10.1016/j.cell.2017.02.027
Rosewarne P. J., Wilson J. M., Svendsen J. C. (2016). Measuring Maximum and Standard Metabolic Rates Using Intermittent-Flow Respirometry: A Student Laboratory Investigation of Aerobic Metabolic Scope and Environmental Hypoxia in Aquatic Breathers. J. Fish. Biol. 88 (1), 265–283. doi: 10.1111/jfb.12795
Sørensen J. G., Kristensen T. N., Loeschcke V. (2003). The Evolutionary and Ecological Role of Heat Shock Proteins. Ecol. Lett. 6 (11), 1025–1037. doi: 10.1046/j.1461-0248.2003.00528.x
Salamanca N., Giráldez I., Morales E., de la Rosa I., Herrera M. (2021). Phenylalanine and Tyrosine as Feed Additives for Reducing Stress and Enhancing Welfare in Gilthead Seabream and Meagre. Animals 11 (1), 1–11. doi:10.3390/ani11010045
Samuelsson L. M., Björlenius B., Förlin L., Larsson D. G. J. (2011). Reproducible 1h NMR-Based Metabolomic Responses in Fish Exposed to Different Sewage Effluents in Two Separate Studies. Environ. Sci. Technol. 45 (4), 1703–1710. doi: 10.1021/es104111x
Samuelsson L. M., Förlin L., Karlsson G., Adolfsson-Erici M., Larsson D. G. J. (2006). Using NMR Metabolomics to Identify Responses of an Environmental Estrogen in Blood Plasma of Fish. Aquat. Toxicol. 78 (4), 341–349. doi: 10.1016/j.aquatox.2006.04.008
Samuelsson L. M., Larsson D. G. J. (2008). Contributions From Metabolomics to Fish Research. Mol. Biosyst. 4 (10), 974–979. doi: 10.1039/b804196b
Sanhueza N., Donoso A., Aguilar A., Farlora R., Carnicero B., Míguez J. M., et al. (2018). Thermal Modulation of Monoamine Levels Influence Fish Stress and Welfare. Front. Endocrinol. (Lausanne) 9. doi: 10.3389/fendo.2018.00717
Savage D. B., Petersen K. F., Shulman G. I. (2007). Disordered Lipid Metabolism and the Pathogenesis of Insulin Resistance. Physiol. Rev. Vol. 87, 507–520. doi: 10.1152/physrev.00024.2006
Shimazu T., Hirschey M. D., Hua L., Dittenhafer-Reed K. E., Schwer B., Lombard D. B., et al. (2010). SIRT3 Deacetylates Mitochondrial 3-Hydroxy-3-Methylglutaryl CoA Synthase 2 and Regulates Ketone Body Production. Cell Metab. 12 (6), 654–661. doi: 10.1016/j.cmet.2010.11.003
Shimazu T., Hirschey M. D., Newman J., He W., Shirakawa K., Le Moan N., et al. (2013). Suppression of Oxidative Stress by β-Hydroxybutyrate, an Endogenous Histone Deacetylase Inhibitor. Science 339 (6116), 211–214. doi: 10.1126/science.1227166
Sinclair B. J., Marshall K. E., Sewell M. A., Levesque D. L., Willett C. S., Slotsbo S., et al. (2016). Can We Predict Ectotherm Responses to Climate Change Using Thermal Performance Curves and Body Temperatures? Ecol. Lett. 19 (11), 1372–1385. doi: 10.1111/ele.12686
Somero G. N. (2010). The Physiology of Climate Change: How Potentials for Acclimatization and Genetic Adaptation Will Determine “Winners” and “Losers. J. Exp. Biol. 213 (6), 912–920. doi: 10.1242/jeb.037473
Sommer T., Wolf D. H. (2014). The Ubiquitin-Proteasome-System. Biochim. Biophys. Acta - Mol. Cell Res. 1843 (1), 1. doi: 10.1016/j.bbamcr.2013.09.009
Speers-Roesch B., Norin T., Driedzic W. R. (2018). The Benefit of Being Still: Energy Savings During Winter Dormancy in Fish Come From Inactivity and the Cold, Not From Metabolic Rate Depression. Proc. R Soc. B Biol. Sci. 285 (1886), 20181593. doi: 10.1098/rspb.2018.1593
Surai P. F., Kochish I. I., Fisinin V. I., Kidd M. T. (2019). Antioxidant Defence Systems and Oxidative Stress in Poultry Biology: An Update. Antioxidants 8 (7), 235. doi: 10.3390/antiox8070235
Su X., Wang N., Chen D., Li Y., Lu Y., Huan T., et al. (2016). Dansylation Isotope Labeling Liquid Chromatography Mass Spectrometry for Parallel Profiling of Human Urinary and Fecal Submetabolomes. Anal. Chim. Acta 903, 100–109. doi: 10.1016/j.aca.2015.11.027
Todgham A. E., Crombie T. A., Hofmann G. E. (2017). The Effect of Temperature Adaptation on the Ubiquitin-Proteasome Pathway in Notothenioid Fishes. J. Exp. Biol. 220 (3), 369–378. doi: 10.1242/jeb.145946
Trygg J., Wold S. (2002). Orthogonal Projections to Latent Structures (O-PLS). J. Chemom. 16 (3), 119–128. doi: 10.1002/cem.695
Valenzuela C. A., Zuloaga R., Mercado L., Einarsdottir I. E., Björnsson B. T., Valdés J. A., et al. (2018). Chronic Stress Inhibits Growth and Induces Proteolytic Mechanisms Through Two Different Nonoverlapping Pathways in the Skeletal Muscle of a Teleost Fish. Am. J. Physiol. - Regul. Integr. Comp. Physiol. 314 (1), R102–R113. doi: 10.1152/ajpregu.00009.2017
Vitali C., Khetarpal S. A., Rader D. J. (2017). HDL Cholesterol Metabolism and the Risk of CHD: New Insights From Human Genetics. Curr. Cardiol. Rep. 19 (12), 132. doi: 10.1007/s11886-017-0940-0
Wagner N. D., Hillebrand H., Wacker A., Frost P. C. (2013). Nutritional Indicators and Their Uses in Ecology. Ecol. Lett. 16 (4), 535–544. doi: 10.1111/ele.12067
Wagner L., Trattner S., Pickova J., Gómez-Requeni P., Moazzami A. A. (2014). 1h NMR-Based Metabolomics Studies on the Effect of Sesamin in Atlantic Salmon (Salmo Salar). Food Chem. 147, 98–105. doi: 10.1016/j.foodchem.2013.09.128
Wallace E. W. J., Kear-Scott J. L., Pilipenko E. V., Schwartz M. H., Laskowski P. R., Rojek A. E., et al. (2015). Reversible, Specific, Active Aggregates of Endogenous Proteins Assemble Upon Heat Stress. Cell 162 (6), 1286–1298. doi: 10.1016/j.cell.2015.08.041
Wu Y., Li L. (2012). Determination of Total Concentration of Chemically Labeled Metabolites as a Means of Metabolome Sample Normalization and Sample Loading Optimization in Mass Spectrometry-Based Metabolomics. Anal. Chem. 84 (24), 10723–10731. doi: 10.1021/ac3025625
Wysocki L. E., Montey K., Popper A. N. (2009). The Influence of Ambient Temperature and Thermal Acclimation on Hearing in a Eurythermal and a Stenothermal Otophysan Fish. J. Exp. Biol. 212 (19), 3091–3099. doi: 10.1242/jeb.033274
Xiao W., Zou Z., Li D., Zhu J., Yue Y., Yang H. (2020). Effect of Dietary Phenylalanine Level on Growth Performance, Body Composition, and Biochemical Parameters in Plasma of Juvenile Hybrid Tilapia, Oreochromis Niloticus × Oreochromis Aureus. J. World Aquac. Soc. 51 (2), 437–451. doi: 10.1111/jwas.12641
Zhang Z., Zhou C., Fan K., Zhang L., Liu Y., Liu P.f. (2021). Metabolomics Analysis of the Effects of Temperature on the Growth and Development of Juvenile European Seabass (Dicentrarchus Labrax). Sci. Total Environ. 769, 145155. doi: 10.1016/j.scitotenv.2021.145155
Keywords: metabolomics, climate change, ectotherm, fish, heat shock proteins
Citation: Aguilar A, Mattos H, Carnicero B, Sanhueza N, Muñoz D, Teles M, Tort L and Boltaña S (2022) Metabolomic Profiling Reveals Changes in Amino Acid and Energy Metabolism Pathways in Liver, Intestine and Brain of Zebrafish Exposed to Different Thermal Conditions. Front. Mar. Sci. 9:835379. doi: 10.3389/fmars.2022.835379
Received: 14 December 2021; Accepted: 14 June 2022;
Published: 14 July 2022.
Edited by:
Yu-Hung Lin, National Pingtung University of Science and Technology, TaiwanReviewed by:
Hsin-Wei Kuo, National Pingtung University of Science and Technology, TaiwanCopyright © 2022 Aguilar, Mattos, Carnicero, Sanhueza, Muñoz, Teles, Tort and Boltaña. This is an open-access article distributed under the terms of the Creative Commons Attribution License (CC BY). The use, distribution or reproduction in other forums is permitted, provided the original author(s) and the copyright owner(s) are credited and that the original publication in this journal is cited, in accordance with accepted academic practice. No use, distribution or reproduction is permitted which does not comply with these terms.
*Correspondence: Sebastian Boltaña, c2JvbHRhbmFAdWRlYy5jbA==
Disclaimer: All claims expressed in this article are solely those of the authors and do not necessarily represent those of their affiliated organizations, or those of the publisher, the editors and the reviewers. Any product that may be evaluated in this article or claim that may be made by its manufacturer is not guaranteed or endorsed by the publisher.
Research integrity at Frontiers
Learn more about the work of our research integrity team to safeguard the quality of each article we publish.