
95% of researchers rate our articles as excellent or good
Learn more about the work of our research integrity team to safeguard the quality of each article we publish.
Find out more
ORIGINAL RESEARCH article
Front. Mar. Sci. , 20 May 2022
Sec. Marine Biogeochemistry
Volume 9 - 2022 | https://doi.org/10.3389/fmars.2022.834691
 Alba González-Vega1,2
 Izar Callery1,2
 Jesús M. Arrieta2
 J. Magdalena Santana-Casiano3
 J. Francisco Domínguez-Yanes2,4
 Eugenio Fraile-Nuez2*
The shallow, near-shore submarine volcano Tagoro erupted in October 2011 at the Mar de las Calmas marine reserve, south of El Hierro island. The injection of lava into the ocean had its strongest episode during November 2011 and lasted until March 2012. During this time, in situ measurements of dissolved oxygen were carried out, using a continuous oxygen sensor constantly calibrated with water samples. A severe deoxygenation was observed in the area, particularly during October-November 2011, which was one of the main causes of the high mortality observed among the local marine ecosystem. The measured O2 concentrations were as low as 7.71 µmol kg-1, which represents a -96% decrease with respect to unaffected waters. The oxygen depletion was found in the first 250 m of the water column, with peaks between 70-120 m depth. The deoxygenated plume covered an area of at least 464 km2, distributed particularly south and south-west of the volcano, with occasional patches found north of the island. The oxygen levels were also monitored through the following years, during the degassing stage of the volcano, when oxygen depletion was no longer observed. Additionally, during the eruption, an island-generated anticyclonic eddy interacted with the volcanic plume and transported it for at least 80 km, where the O2 measurements still showed a -8% decrease after mixing and dilution. This feature draws attention to the permanence and transport of volcanic plumes far away from their source and long after the emission.
The study of changes in the oceanic content of dissolved oxygen has gained relevance in recent years, as ocean models predict declines of 1 to 7% in the global ocean O2 inventory over the next century (Plattner et al., 2001; Plattner et al., 2002; Frölicher et al., 2009; Keeling et al., 2010). The attention has been particularly driven towards the oxygen minimum zones (OMZs), defined as mid-depth O2 minima formed by a combination of intense respiration and weak ventilation (Sverdrup, 1938; Wyrtki, 1962; Keeling et al., 2010). These zones have been observed to be expanding due to ocean warming and increased stratification, especially in the North Pacific and tropical oceans (Ono et al., 2001; Whitney et al., 2007; Stramma et al., 2008; Keeling et al., 2010). However, other processes that can cause local declines in the dissolved oxygen content, such as the case of volcanic and hydrothermal emissions, have been less studied.
Submarine volcanism and hydrothermalism injects magma-derived volatiles into the ocean which are rich in reduced chemical compounds, such as reduced sulfur species and Fe(II) (Santana-Casiano et al., 2013), which are quickly oxidized when they come into contact with seawater (Campbell and Gieskes, 1984; Kump et al., 2001). This phenomenon can cause severe oxygen depletion and even anoxic episodes which can last from weeks to years (Campbell and Gieskes, 1984; Malahoff et al., 2006; Fraile-Nuez et al., 2012).
Volcanic-induced anoxia has been notably relevant throughout the geological history of our planet. Many paleoceanographic studies suggest that an increased rate of submarine volcanism during the mid-Cretaceous was likely the trigger for oceanic anoxic events at a global scale, which were linked to major events such as changes in marine productivity, CO2-induced global warming, rises in sea level, and mass extinctions (Vogt, 1989; Erba, 1994; Leckie et al., 2002; Méhay et al., 2009). However, present-day volcanogenic episodes of oxygen depletion are poorly documented. Only a handful studies reporting these events have been carried out, mainly in deep-sea hydrothermal settings in the Pacific (Edmond et al., 1979; Campbell and Gieskes, 1984; Malahoff et al., 2006; Staudigel et al., 2006), usually in remote locations where intensive monitoring is not an easy task to achieve.
The Canary Islands, located in the north-eastern margin of the Atlantic Ocean, are an active volcanic archipelago originated from hotspot activity (Carracedo et al., 1998). El Hierro is the westernmost and youngest of these islands (Figure 1), with an age of 1.12 Ma (Guillou et al., 1996). Although several subaerial eruptions have occurred over the last centuries in the Canary archipelago, no submarine volcanic activity had been reported in 600 years of historical records (López et al., 2012).
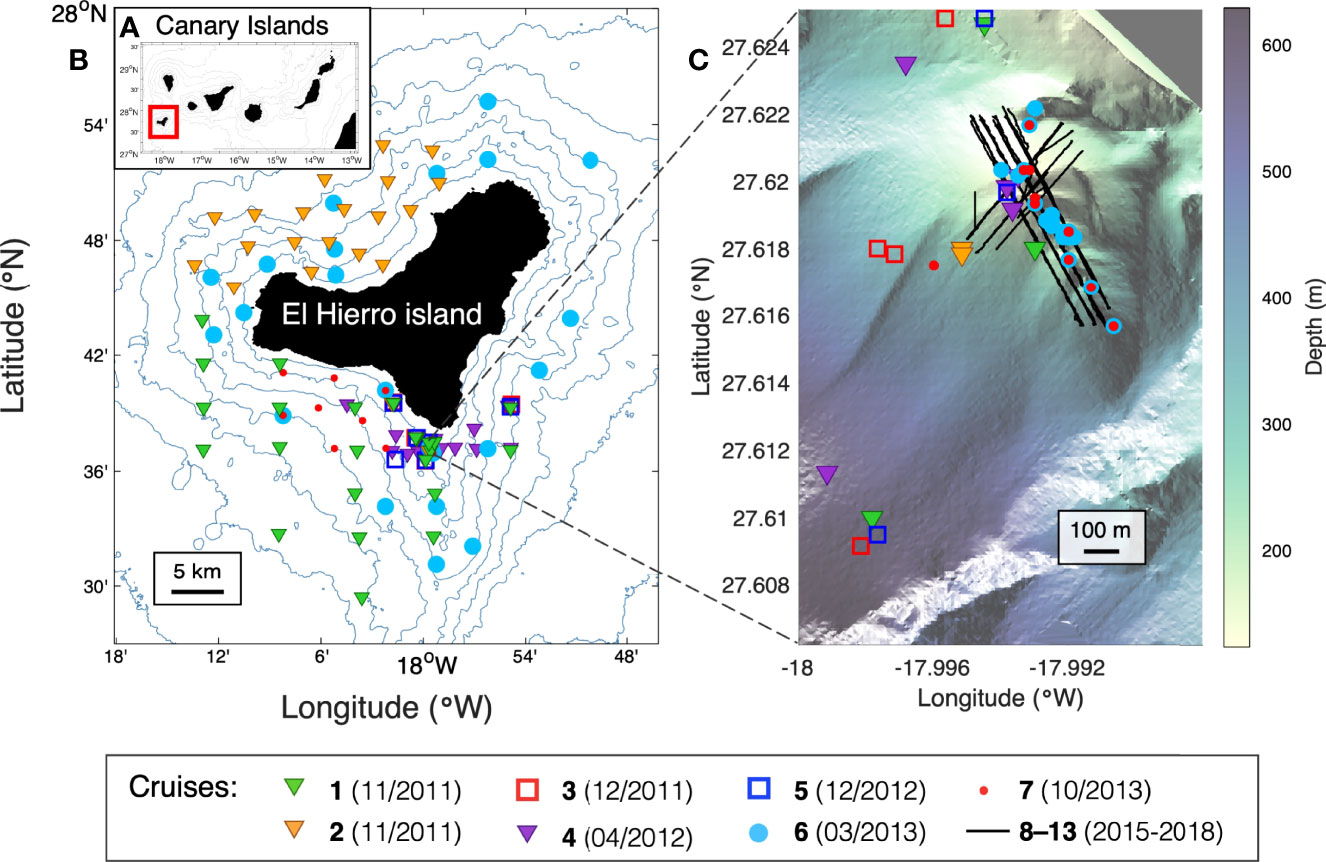
Figure 1 Study location. (A) Map of the Canary Islands. (B) Map of El Hierro island with the location of the vertical profiles carried out during all cruises. (C) 3D-High-resolution bathymetry of Tagoro submarine volcano, indicating the location of the hydrographic stations (cruises 1–7) and tow-yo transects (cruises 8–13).
On October 10th 2011, after more than 10,000 earthquakes were registered in three months at El Hierro island, a volcanic tremor marked the beginning of an underwater eruption. The newly formed submarine volcano, named Tagoro, was located 1.8 km offshore of La Restinga, the southernmost village of El Hierro, and at the Mar de las Calmas Marine Reserve. After several pulses of growth, the final form of the volcano presented an elongated summit in the NNW–SSE direction and an irregular base of 1–1.3 km (Fraile-Nuez et al., 2018), with a peak at 88 m depth and the main crater at 127 m depth (Figure 1).
The first six months of activity (October 2011 – March 2012) conformed the eruptive stage. This stage caused extreme physical–chemical perturbations in a wide area around El Hierro island, particularly south and south-west of the volcano, with visible water discoloration, bubbling and degassing (Santana-Casiano et al., 2013). The most affected part of the water column was 75–125 m depth, but anomalies could be found from roughly 300 m depth to surface. Temperature anomalies up to +18.8°C were found, as well as salinity anomalies of –0.3 (Fraile-Nuez et al., 2012). The carbonate chemistry was also severely affected. Total dissolved inorganic carbon was as high as 12015 µmol kg-1, with increases in the partial pressure of CO2 of up to three orders of magnitude. This caused severe water acidification, reaching pH values as low as 5.2 (Santana-Casiano et al., 2013).
During the eruptive stage, Tagoro volcano released remarkable amounts of reduced chemical species into the surrounding waters, particularly reduced sulfur species and Fe(II) (Fe2+, Fe(OH)+, Fe(OH)2, FeCl+, Fe(HCO3), FeHS). The main geochemical processes taking place were described in detail by Santana-Casiano et al. (2013) and Santana-González et al. (2017), including those responsible for oxygen consumption:
The chemical species responsible for this oxygen consumption were found in remarkable amounts during the eruption. Reduced sulfur species, which are normally below detection limit, presented concentrations as high as 476 µmol kg-1. A similar pattern was observed for Fe(II), which showed an increase of up to five orders of magnitude (50 µmol kg-1; reference values < 0.2 nM). The mixing of these reduced fluids with seawater caused a severe oxygen depletion, with patches of anoxia found at 100 m depth during the strongest eruptive episode (November 5th 2011) and concentrations as low as 100 µmol kg-1 reported during late November 2011 (Santana-Casiano et al., 2013).
These severe conditions (deoxygenation and acidification) caused a high mortality of local marine biota, particularly during the first two months of the eruption. No fish schools were acoustically detected within the affected area, and diel vertical migration was rather weak or absent (Fraile-Nuez et al., 2012). Picophytoplankton groups presented distinct responses; however, heterotrophic bacteria showed a dramatic increase (Fraile-Nuez et al., 2012; Ferrera et al., 2015).
The eruption of Tagoro submarine volcano in 2011 caused water discoloration which acted as a natural tracer detectable through ocean color imagery. This was the first time that the interaction between a volcanic eruption and a mesoscale structure could be recorded and thoroughly studied (Eugenio et al., 2014; Marcello et al., 2015). An island-generated anticyclonic eddy carrying volcanic discolored waters was monitored through satellite observations during October-November 2011 (Eugenio et al., 2014) and was sampled in situ on November 7th at the center of the eddy, 80 km away from the volcano.
In March 2012, the eruption came to an end and the volcano entered a new phase known as the degassing stage, which remains active. The system evolved towards a field of hydrothermal vents with release of heat, gases, metals, and inorganic nutrients (Fraile-Nuez et al., 2012; Santana-Casiano et al., 2013; González-Vega et al., 2020). The affected area was considerably reduced, reaching roughly 0.5 km around the volcano and close to the seafloor (Santana-Casiano et al., 2016). Although significant physical-chemical anomalies are still found in this area, there is a gap of knowledge about behavior of the spatial-temporal variability of the oxygen anomalies from this volcano.
The submarine volcano Tagoro has provided one of the most intensive monitoring of an ongoing underwater eruption and subsequent hydrothermal activity in the world, facilitated by its shallow and accessible location. Here we present a comprehensive study of the changes in the dissolved oxygen content of the waters affected by this volcano, with emphasis in the eruptive stage, and compare these with more recent measurements from the degassing stage. Additionally, we report and quantify the transport of the volcanic oxygen anomalies far from the source by means of an island-generated anticyclonic eddy.
The dataset used for this study comprises over 390 hydrographic stations and tow-yo transects, including up to 3500 discrete water samples for the calibration of the CTD-oxygen sensor data. The area was surveyed along 8 years of monitoring (2011-2018) through 13 different oceanographic cruises led by the Spanish Institute of Oceanography (IEO) (Figure 1). The cruises were carried out in the frame of different projects: BIMBACHE (cruises 1–2), RAPROCAN (cruises 3 and 5), CETOBAPH (cruise 4), VULCANO-I (cruises 6–7), VULCANA-I (cruises 8–10), VULCANO-II (cruises 11–12), and VULCANA-II (cruise 13). The vessels employed for the surveys were R/V Ramón Margalef (cruises 1, 2 and 6), R/V Cornide de Saavedra (cruises 3 and 4), and R/V Ángeles Alvariño (cruises 5 and 7–13).
An additional hydrographic station at 80 km south-west of the volcano was sampled during cruise 1 (November 7th 2011), when an island-generated anticyclonic eddy was transporting the discolored waters of the volcanic eruption offshore, as was observed by satellite image (Eugenio et al., 2014).
Conductivity, temperature and pressure data were acquired in every hydrographic station and tow-yo transect using a SeaBird 911-plus CTD, at a sampling interval of 24 Hz and with dual temperature and conductivity sensors with accuracies of 0.001°C and 0.0003 S/m respectively. A SBE43 dissolved oxygen sensor was coupled to the CTD system, with an accuracy of ±2% of saturation.
Different sampling strategies were used over the years in an effort to adapt our methodology to the evolution of the volcanic activity. During the eruptive stage (cruises 1–3), vertical profiles were carried out both in the vicinity of the volcano and in a wide area surrounding El Hierro island. This strategy continued during the early months of the degassing stage (cruises 4–5); however, seeing as the emissions at this stage reached a smaller area, a high-resolution transect across the main volcanic craters was established for cruises 6–7, with stations at few meters of distance. A different strategy was applied during cruises 8–13 by performing tow-yo transects (Santana-Casiano et al., 2016), which consist on continuously lowering and raising the rosette between 1 and 40 m above the seafloor while the vessel moves at 0.2–0.4 kn with the Dynamic Positioning system (DP). This last methodology provides a remarkably high spatial resolution in the area affected by the hydrothermal emissions.
Over 3500 discrete water samples were collected with an oceanographic rosette of 24-12-liter Niskin bottles. For the analysis of dissolved oxygen from these samples, we used the Winkler method with the subsequent modifications (Carpenter, 1965). The determination was always carried out on board, either manually or with an automated potentiometric titration. These samples were used to calibrate the continuous data from the dissolved oxygen sensor using a linear regression by least-squares. The original oxygen data in ml l-1 were converted to µmol kg-1 using the density values derived from the CTD data. A linear correlation was conducted for each of the cruises. All the calibrations presented a good fit (Table 1), with most r2 >0.9 and all p-values <0.05.
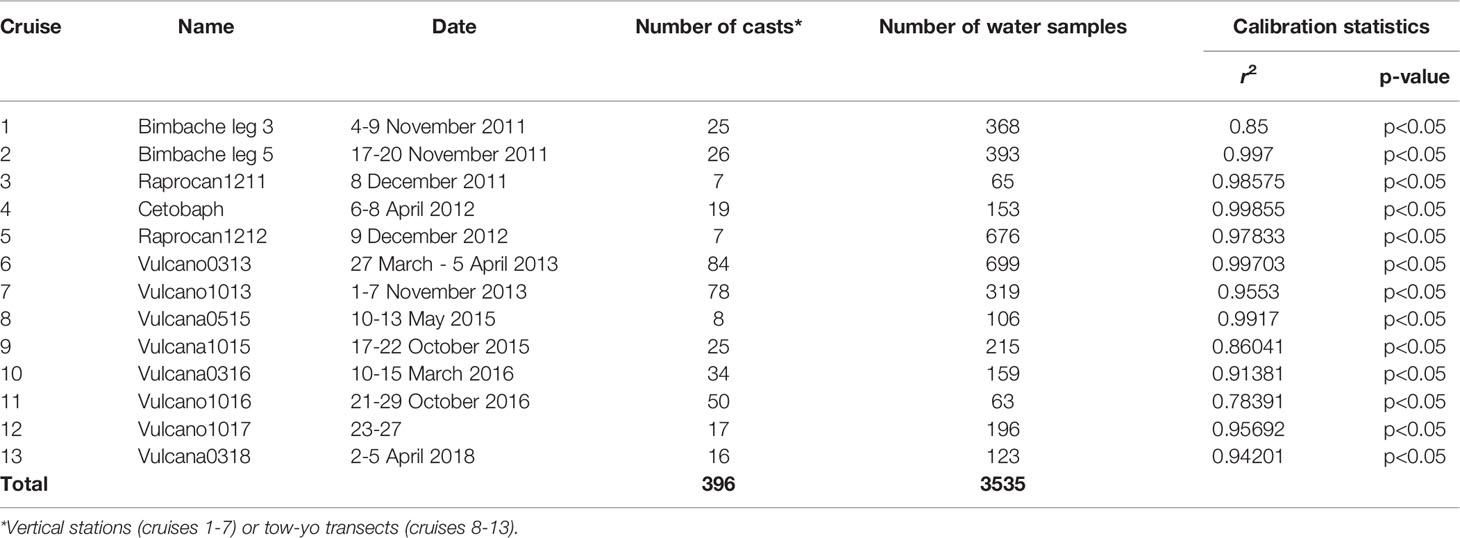
Table 1 Statistics of the calibration of [O2] data from the continuous sensor using water samples analyzed with the Winkler method.
For the calculation of oxygen anomalies (Δ[O2]), for each cruise we established reference (non-affected) stations, generally located in an area around El Hierro island far away from the volcano. The classification was based on various physical-chemical parameters such as temperature, oxidation-reduction potential (ORP), pH (Santana-Casiano et al., 2016), or concentration of silicate. In the case of tow-yo transects (cruises 8–13), the reference was the down-cast or up-cast profile, depending on the direction of the local currents and the mentioned physical-chemical parameters. The anomalies were calculated as the dissolved oxygen concentration in the affected stations minus an average profile of all the reference stations for each cruise.
The theoretical saturation of O2 in seawater was calculated for all the stations sampled during cruises 1–4 based on temperature and salinity data, as described by Weiss (1970).
The evolution of the dissolved oxygen content during the eruptive stage in the waters affected by the volcanic emissions can be observed in Figure 2 as vertical profiles from cruises 1-4 (Figures 2A–D). Unaffected stations were also measured during each cruise to establish a reference profile for comparison.
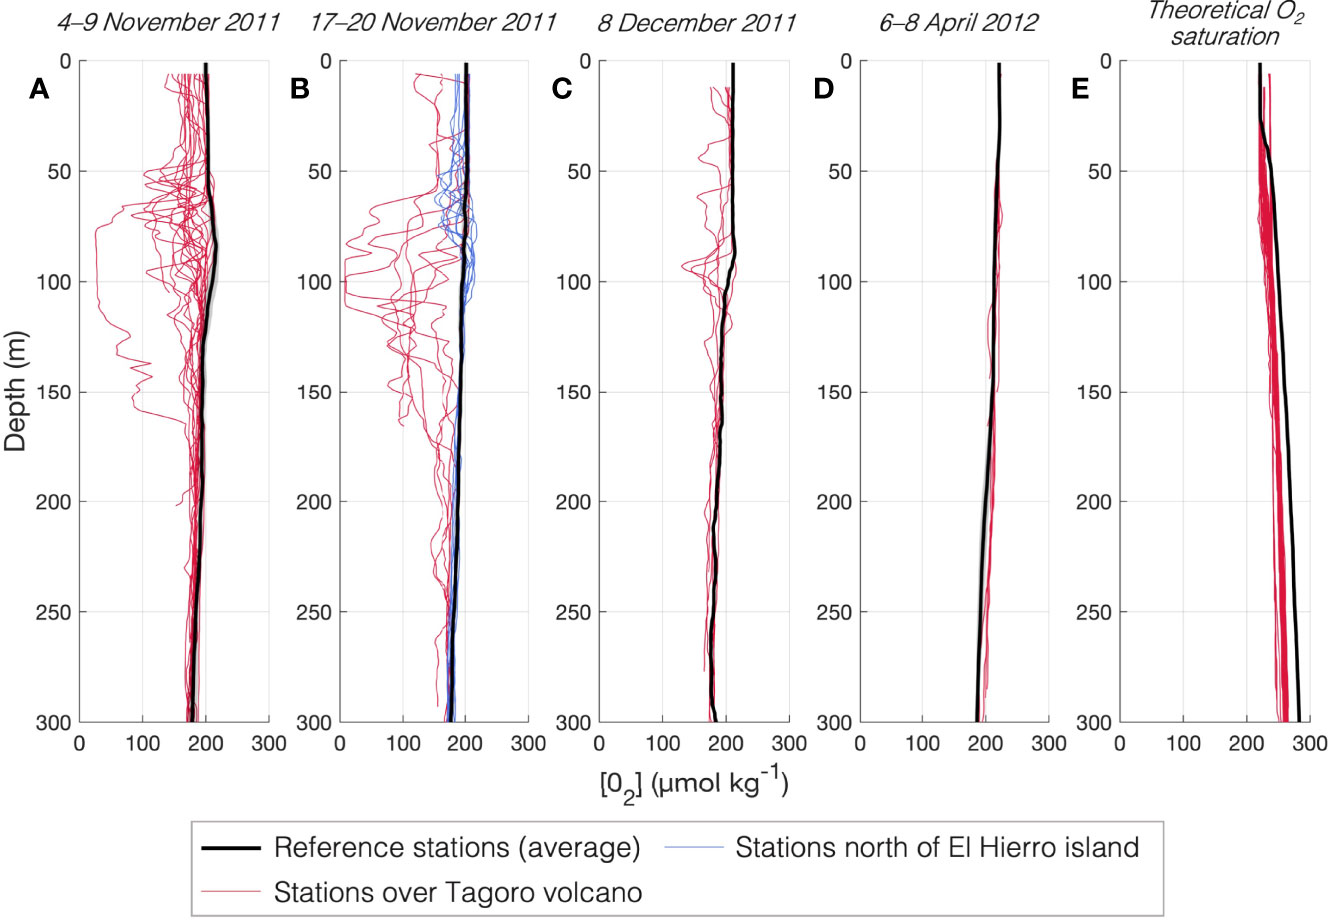
Figure 2 Vertical profiles of dissolved oxygen during the eruptive stage, measured during cruises 1,2,3,4 (A–D, respectively). Black line represents a reference profile, with standard deviation. Panel (E) shows the theoretical saturation of dissolved O2 based on temperature and salinity data, for the reference profile (black line) and for all the affected stations measured during cruises 1,2,3,4 (red lines).
In the first cruise (Figure 2A), which took place less than a month after the beginning of the eruption, severe oxygen depletion is evident in the first 150 m of the water column. A particularly deoxygenated profile is distinguished, with depletion up to -88% (minima of 25.33 µmol kg-1; Table 2), corresponding to a station located at 1.8 km northwest from the volcano. The disparity of this profile respect to the others illustrates the unsteady nature of the eruptive event. The strongest episode occurred in late November 2011 (Figure 2B), during cruise 2, when conditions close to anoxia were measured (minimum of 7.71 µmol kg-1, depletion of -96%) and the affection was observed in a wider range of the water column, up to 250 m depth. During this time, the volcanic plume was transported north-west of the island as observed by satellite image (Eugenio et al., 2014) and thus that northern area was measured as well, exhibiting depletion up to -25% (concentrations of 149.72 µmol kg-1). During a short survey in December 2011 (Figure 2C), the oxygen depletion was still remarkable but less dramatic, with anomalies up to -38% (129.72 µmol kg-1) in a depth range of 0-140 m. Finally, oxygen was measured again in April 2012, coinciding with the time when the eruptive stage was over and the degassing stage begun. Accordingly, no evident anomalies of dissolved oxygen were observed in the vertical profiles.
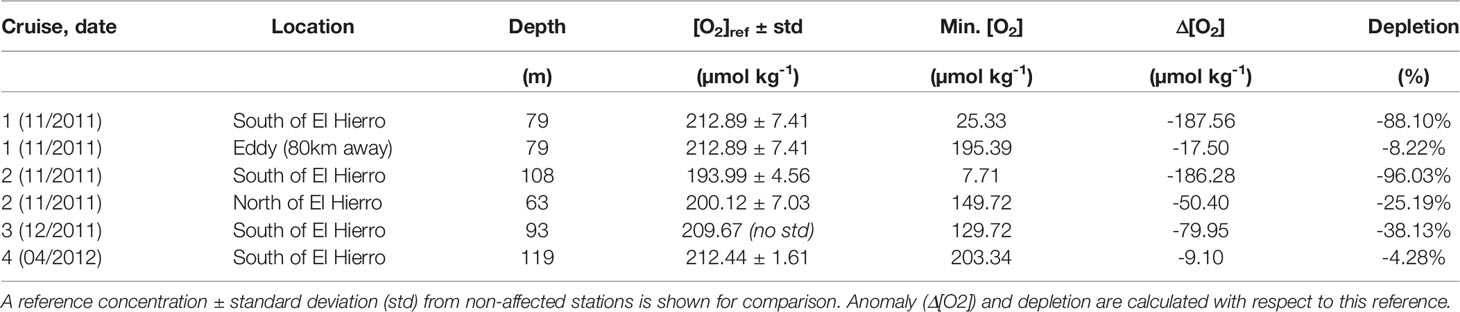
Table 2 Minimum concentrations of dissolved oxygen during the eruptive stage at the depth of maximum depletion.
During the eruption, an increase in temperature of +3°C and decrease in salinity of –0.3 were observed in the water column in the area affected by the volcanic plume (Fraile-Nuez et al., 2012). These physical anomalies are expected to have an impact on oxygen solubility (Weiss, 1970). For this reason, we calculated the theoretical O2 saturation based on temperature and salinity data, for both the reference profile and all the stations affected by the volcano throughout the eruptive stage (Figure 2E). Although a diminution is observed respect to the reference, this difference is a -6% (average), a small percentage compared to the up to -96% depletion found. Additionally, the vertical distribution of this theoretical saturation in the affected stations follows a very stable pattern and does not show the variability observed in the [O2] data in the water column. Thus, the contribution of the chemical oxygen consumption by reaction with emitted reduced species is more relevant than the oxygen loss caused by physical anomalies.
The oxygen anomalies observed during the eruptive stage were transported in a wide area around the volcano, particularly south-west. Figure 3 shows the distribution of dissolved oxygen concentration during the strongest period of the eruption, November 2011 (cruises 1 and 2). In this region and at this depth range (75-100 m), unaffected waters present O2 concentrations above or around 200 µmol kg-1. In the volcanic plume observed in Figure 3A at 100 m depth, we found an area of roughly 378 km2 with [O2]<200 µmol kg-1 (purple). Within this area, about 78 km2 presented [O2]<150 µmol kg-1 (yellow-orange), where the minimum concentration found was 7.71 µmol kg-1. In late November (Figure 3B) the plume reached the north of the island due to changes in local currents. This transported plume represents an additional affected area ([O2]<200 µmol kg-1) of at least 86 km2. The satellite images from October-November 2011 (Figure 3C; Eugenio et al., 2014) show that the distribution of the colored volcanic plume was very variable depending on local currents and intensity of the eruptive event. In most cases, the plume was wider than the area sampled for oxygen (Figures 3A, B). Thus, our calculation of the area affected by deoxygenation is only indicative of the order of magnitude and should not be considered as an exact estimation.
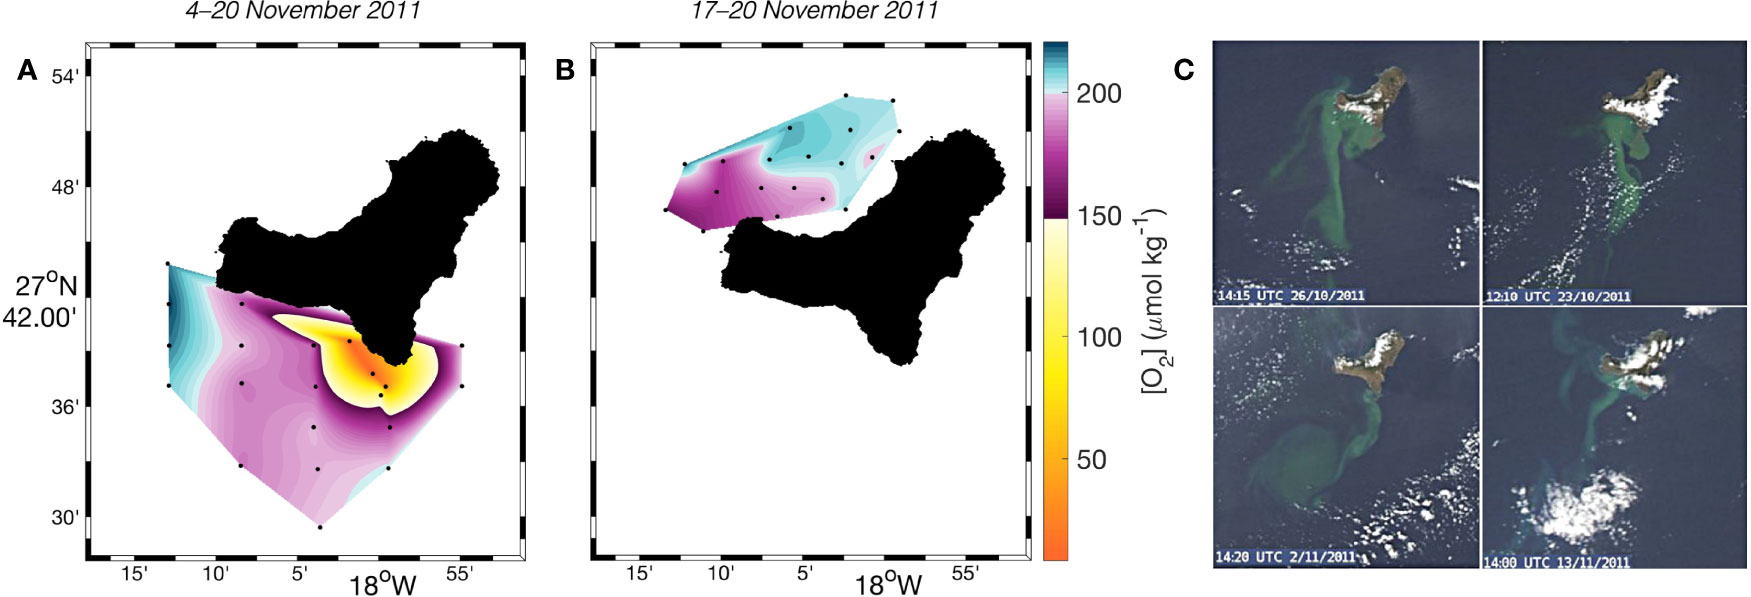
Figure 3 Horizontal contours of dissolved oxygen during the strongest eruptive episode. (A) Data from cruises 1 and 2, south-west of the volcano (100 m depth). (B) Data from cruise 2, when the volcanic plume was transported north of El Hierro island by the local currents (75 m depth). (C) Some examples of NASA MODIS RGB image of El Hierro island (Eugenio et al., 2014) from October-November 2011, showing the high spatial variability of the volcanic plume.
On November 7th 2011, satellite images indicated the presence of an island-generated anticyclonic eddy that trapped the visibly discolored waters affected by the volcanic eruption and was being transported south-westwards for tens of kilometers (Figure 4). Thus, a hydrographic station (914) was sampled in the center of this eddy, 80 km away from the volcano, in order to trace and quantify the transport of the volcanic emissions (Figure 4A). The vertical profile of dissolved oxygen in this station is compared to a reference profile in Figure 4B. A local minimum was found at 79 m depth which clearly deviates from the expectable shape of a typical [O2] profile, at exactly the same depth as the minima of [O2] found in the vicinities of the volcano. This peak represents a very small depletion (-8%) compared to the -88% depletion found in the volcanic area at the time, which reflects the effect of dilution and mixing with ambient waters through the 80 km journey of the eddy.
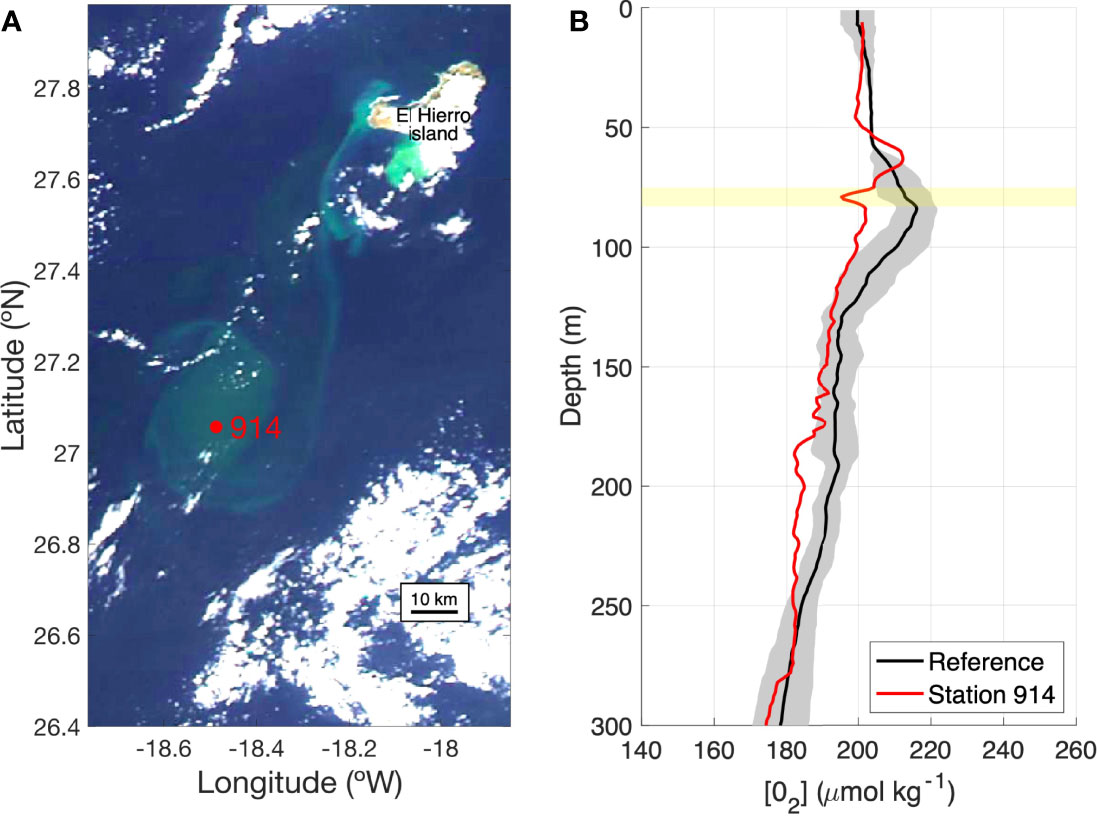
Figure 4 Dissolved oxygen in a plume transported 80 km southwest of the volcano by an anticyclonic eddy. (A) True color satellite image from November 5th 2011. (B) Vertical profile of dissolved oxygen within the transported plume. Black line shows a reference profile with standard deviation (grey shadow). A yellow stripe highlights the peak corresponding to the anomaly transported from the volcano.
After the eruptive stage came to an end in March-April 2012, these dramatic oxygen depletions were no longer observed. However, we have continued to monitor oxygen levels all throughout the degassing stage (2012-present), as can be observed in Figure 5. Here, the dissolved oxygen data are shown as anomalies respect to a reference profile for each cruise (Δ[O2]), in order to avoid the effects of depth and seasonality on the concentration of O2. This figure should not be understood as a temporal evolution, given the disparity in sampling strategies and sample size (n) over time. The large range and the abundance of outliers during the eruptive stage (orange boxes) are representative of the huge variability and instability of the eruptive process. For the degassing stage (blue and purple boxes), the data still show a high variability, particularly in those boxes with larger sample sizes (n); however, all the observed anomalies are close to zero, suggesting that oxygen depletion is no longer observed.
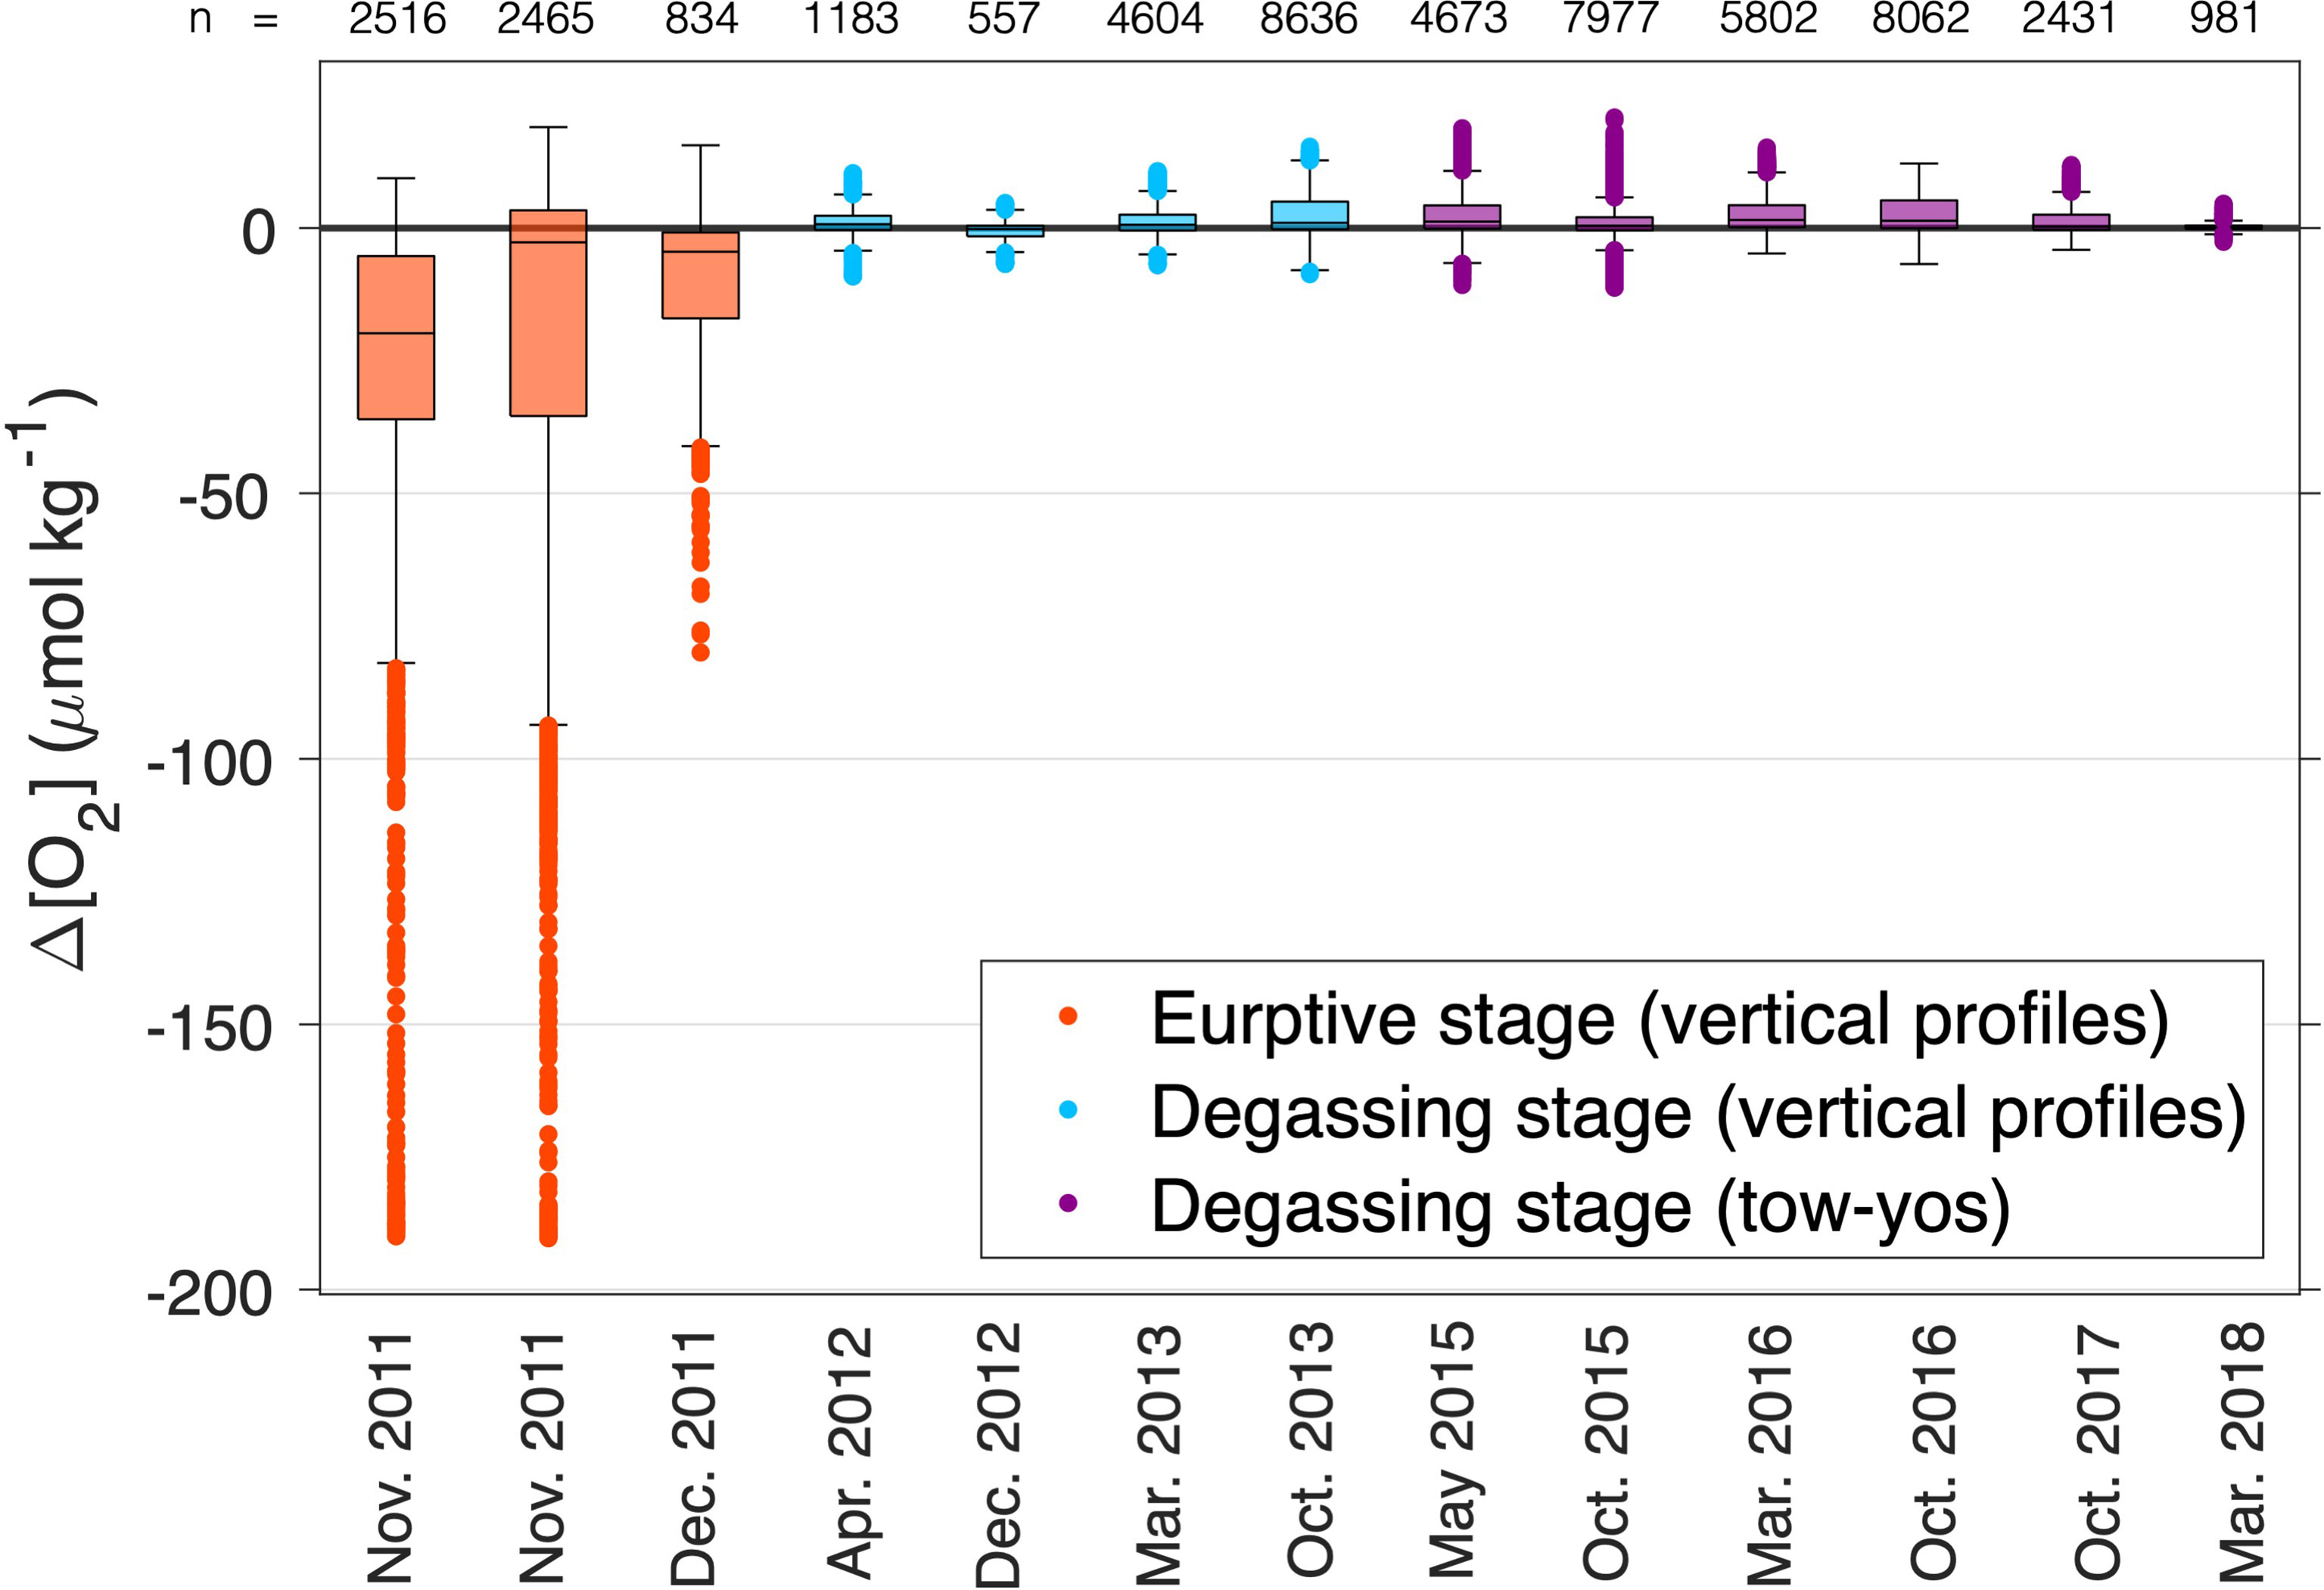
Figure 5 Anomalies of dissolved O2 through 2011-2018 represented as boxplots, which show the median, quartiles, and outliers. Sample size (n) is specified above each box, representing the number of data collected by the continuous oxygen sensor at a sampling interval of 1 meter (vertical profiles) or 1 second (tow-yos).
The eruption of the submarine volcano Tagoro in 2011 caused a drastic and initially negative impact on the ecosystem of the Mar de las Calmas marine reserve surrounding El Hierro island. Conditions close to anoxia were found during November 2011 in the first 250 m of the water column, with concentrations of dissolved oxygen as low as 7.71 µmol kg-1, which represents a -96% depletion respect to the normal conditions found in reference stations. These suboxic and anoxic conditions were the cause of the high mortality observed among fish and most planktonic groups, along with other factors such as the drop of pH and the high CO2 concentrations (Santana-Casiano et al., 2016). The cause of the deoxygenation was the emission of reduced chemical species, mainly of sulfur and iron (Fe2+, Fe(OH)+, Fe(OH)2, FeCl+, Fe(HCO3)+, FeHS) (Santana-Casiano et al., 2013). Some of these species presented concentrations up to five orders of magnitude higher than unaffected stations (Santana-Casiano et al., 2013).
The patch of deoxygenated waters reached a wide area around the island of El Hierro, particularly during the strongest eruptive episodes in November 2011. The total area of reach was at least of 464 km2 combining the south and north plumes (Figures 3A, B, respectively), likely even wider considering that both the south and north patches were not delimited within the sampled grid of stations as observed in the satellite images (Figure 3C). Note that this combined area is wider than the surface of El Hierro island (268 km2). The spatial distribution of this suboxic patch coincides with the distribution described for other parameters that were a consequence of the eruption of Tagoro volcano, such as seawater discoloration, total dissolved inorganic carbon, pH, and inorganic nutrients (Santana-Casiano et al., 2013; Eugenio et al., 2014; González-Vega et al., 2020).
Deoxygenation caused by volcanic or hydrothermal activity has long been known, although not many studies have focused on describing this feature. Edmond et al. (1979) described anoxic conditions at the Galapagos spreading center (East Pacific Ocean). In 1984, at Guaymas Basin (Gulf of California), it was observed that even though the hydrothermal component of the sampled waters was less than 1%, the decrease in O2 was about 10% in comparison to unaffected areas (Campbell and Gieskes, 1984). The authors deduced that the oxygen anomalies were not simply derived from mixing of O2-deficient waters with ambient waters, but were rather a consequence of chemical oxygen consumption by the oxidation of dissolved sulfide and methane injected by the hydrothermal vents. Anoxia induced by hydrothermal discharge was also later described within the East Pit at Lō’ihi Seamount, Hawai’i (Malahoff et al., 2006). Furthermore, at Nafanua volcano (Vailulu’s Seamount, Samoa), the low oxygen values measured within the crater were suggested to be one of the causes of the observed high mortality among local nekton (Staudigel et al., 2006).
Although present-day studies showing volcanic-induced anoxia are relatively sparse, many paleoceanographic studies correlate global low-oxygen events with periods of enhanced volcanic activity in past geological periods. Particularly, the Cretaceous period (145–66 Ma) was characterized by the occurrence of several oceanic anoxic events (OAEs) and long periods of CO2-induced global warming and climatic change (Clarke and Jenkyns, 1999), accompanied by mass extinctions in groups such as calcareous nannofossils, radiolarians, foraminifera, and mollusks (Snow et al., 2005). These events have been consistently associated with high rates of submarine volcanic activity (Vogt, 1989; Erba, 1994; Snow et al., 2005; Méhay et al., 2009), which could be linked to times of rapid oceanic plateau formation and/or increased rates of ridge crest volcanism (Leckie et al., 2002). Moreover, and going even further in the geological history of our planet, some studies have suggested a role of submarine volcanism on the establishment of an O2-rich atmosphere (Kump et al., 2001; Kump and Barley, 2007). This hypothesis intends to explain the time gap between the rise in atmospheric O2 levels (2400-1800 Ma) and the first records of cyanobacteria, the first oxygenic photosynthesizers, which have been identified in sediments from 2700 Ma (Brocks et al., 1999) and even associated morphologically with microfossils dated at 3500 Ma (Schopf, 1993). The authors argue that volcanism during the Archean era was predominantly submarine (which is more reducing than subaerial volcanism), acting as a sink for oxygen larger than the photosynthetic source; until a shift to a more mixed subaerial-submarine volcanism during the Archaean-Proterozoic transition allowed the establishment of a permanent oxygenated atmosphere (Kump et al., 2001; Kump and Barley, 2007).
The Canary archipelago acts as an obstacle to the flow of the Canary Current and the Trade Winds, originating mesoscale structures such as cyclonic and anticyclonic eddies, which can live >3 months and can be transported for hundreds of kilometers (Sangrà et al., 2009). The submarine volcano Tagoro represented a good opportunity to study these features, as the eruption caused water discoloration which acted as a natural tracer detectable through ocean color imagery. An island-generated anticyclonic eddy carrying volcanic discolored waters was monitored through satellite observations during October-November 2011 (Eugenio et al., 2014) and was sampled in situ on November 7th at the center of the eddy, 80 km away from the volcano. There, a -8% oxygen depletion was found at the same depth (79 m) as the oxygen minima observed on top of the volcano, which were up to a -88% depletion at the time, showing that the deoxygenation in the eddy was one order of magnitude weaker. This anomaly is very small and most likely it no longer had an impact on its local environment; however, the fact that the volcanic signal is still detectable 80 km away from the site of emission is an indicative of the importance of taking into account mesoscale structures when studying the transport of volcanic plumes.
Ocean models predict declines of -1 to -7% in the global ocean O2 inventory over the next century (Keeling et al., 2010). The eruption of Tagoro volcano caused a deoxygenation event of up to -96%. Furthermore, the fact that the signal was still detectable (although weak) 80 km away from the volcano raises attention on the permanence and transport of volcanic plumes at a larger scale. Several studies in different settings around the globe (particularly over spreading centers) have described phenomena called event plumes or “megaplumes”: voluminous patches of heat and chemical anomalies caused by a brief and massive release of volcanic or hydrothermal fluids (Lupton et al., 1989; Baker and Lupton, 1990). The term “megaplume” was first used by Baker et al. (1987) to describe a 700-m-thick, 20-km-diameter plume found at the southern Juan de Fuca ridge in 1986. Even though this megaplume was formed in a few days, its heat output was comparable to ~100 black smokers venting for one year (Lupton et al., 1989). Similar events were observed at the North Fiji Basin in 1987 (Nojiri et al., 1989), at the CoAxial segment of Juan de Fuca Ridge in 1993 (Baker et al., 1995; Embley et al., 1995; Lupton et al., 1995), and at the northern Gorda Ridge in 1996 (Baker, 1998). Baker (1994) argued that the observation of several independent event plumes over a relatively short period of time suggests that these features are not exceptional. If this is true, the occurrence of these events along spreading centers, plus other intraplate events such as the case of the Tagoro eruption, would represent an enormous volume of reduced fluids that are being emitted to the ocean. This would mean that the total percentage of the global ocean undergoing deoxygenation stress could be much wider than the current assumptions based only on features like OMZs and coastal processes.
The eruption of the shallow submarine volcano Tagoro in 2011 at El Hierro island generated suboxic and even anoxic conditions in the first 250 m of the water column. The minimum concentration of dissolved O2 measured was 7.71 µmol kg-1, representing a -96% decrease respect to the normal conditions found in unaffected waters. The affected area was at least 464 km2 during its strongest eruptive episode in November 2011, an area wider than El Hierro island itself. The plume was distributed mainly to the south and south-west of the volcano, but occasional patches were also observed north of the island due to changes in the local currents. This eruption also represented a unique opportunity to observe the interaction between a volcanic plume and a mesoscale structure: an anticyclonic eddy that was monitored through satellite observations during October-November 2011. The in situ oxygen measurements at the center of this eddy, 80 km away from the volcano, showed a -8% decrease respect to reference stations, which is an order of magnitude weaker than the deoxygenation found above the volcano at the time. However, considering the longevity of these structures and the long distances they can reach, this feature draws attention to the importance of the transport of volcanic plumes far away from the source and their permanence in the ocean.
The raw data supporting the conclusions of this article will be made available by the authors, without undue reservation.
Study design, AG-V and EF-N. Data acquisition, EF-N, JD-Y, and JS-C. Data processing and graphical representations, AG-V and IC. Writing—original draft preparation, AG-V and EF-N. Writing—draft contribution, AG-V, EF-N, JS-C, and JA. Supervision, EF-N, JS-C, and JA. Project administration, EF-N. Funding acquisition, EF-N. All authors contributed to the article and approved the submitted version.
This research was funded by the Ministerio de Economía y Competitividad del Gobierno de España (MINECO), FEDER through VULCANO-I (CTM2012-36317), VULCANO-II (CTM2014-51837-R), and CETOBAPH (CGL2009-13112) projects, and The Spanish Institute of Oceanography (IEO) through BIMBACHE (IEO-2011-2012), RAPROCAN-III (IEO-2010-2012), VULCANA-I (IEO-2015- 2017), and VULCANA-II (IEO-2018-2020) projects.
The authors declare that the research was conducted in the absence of any commercial or financial relationships that could be construed as a potential conflict of interest.
All claims expressed in this article are solely those of the authors and do not necessarily represent those of their affiliated organizations, or those of the publisher, the editors and the reviewers. Any product that may be evaluated in this article, or claim that may be made by its manufacturer, is not guaranteed or endorsed by the publisher.
We would like to thank the officers and crew of the R/V Ramón Margalef and Ángeles Alvariño from the IEO for their help at sea.
Baker E. T. (1994). A 6-Year Time Series of Hydrothermal Plumes Over the Cleft Segment of the Juan De Fuca Ridge. J. Geophys. Res. 99, 4889–4904. doi: 10.1029/93JB01030
Baker E. T. (1998). Patterns of Event and Chronic Hydrothermal Venting Following a Magmatic Intrusion: New Perspectives From the 1996 Gorda Ridge Eruption. Deep. Res. Part II. Top. Stud. Oceanogr. 45, 2599–2618. doi: 10.1016/S0967-0645(98)00085-X
Baker E. T., Lupton J. E. (1990). Changes in Submarine Hydrothermal 3He/Heat Ratios as an Indicator of Magmatic/Tectonic Activity. Nature 346, 556–558. doi: 10.1038/346556a0
Baker E. T., Massoth G. J., Feely R. A. (1987). Cataclysmic Hydrothermal Venting on the Juan De Fuca Ridge. Nature 329, 149–151. doi: 10.1038/329149a0
Baker E. T., Massoth G. J., Feely R. A., Embley R. W., Thomson R. E., Burd ,. B. J. (1995). Hydrothermal Event Plumes From the Coaxial Seafloor Eruption Site, Juan De Fuca Ridge. Geophys. Res. Lett. 22, 147–150. doi: 10.1029/94GL02403
Brocks J. J., Logan G. A., Buick R., Summons R. E. (1999). Archean Molecular Fossils and the Early Rise of Eukaryotes. Science (80) 285, 1033–1036. doi: 10.1126/science.285.5430.1033
Campbell A. C., Gieskes J. M. (1984). Water Column Anomalies Associated With Hydrothermal Activity in the Guaymas Basin, Gulf of California Andrew C. Campbell and Joris M. Gieskes. Earth Planet. Sci. Lett. 68, 57–72. doi: 10.1016/0012-821X(84)90140-7
Carpenter J. I. I. (1965). The Accuracy of the Winkler Method for Dissolved Oxygen Analysis. Limonol. Oceanogr. 10, 135–140. doi: 10.4319/lo.1965.10.1.0135
Carracedo J. C., Day S., Guillou H., Rodríguez Badiolas E., Canas J. A., Pérez Torrado F. J. (1998). Hotspot Volcanism Close to a Passive Continental Margin: The Canary Islands Geol. Mag. 135, 591–604. doi: 10.1017/S0016756898001447
Clarke L. J., Jenkyns H. C. (1999). New Oxygen Isotope Evidence for Long-Term Cretaceous Climatic Change in the Southern Hemisphere. Geology 27, 699–702. doi: 10.1130/0091-7613(1999)027<0699:NOIEFL>2.3.CO;2
Edmond J. M., Measures C., McDuff R. E., Chan L. H., Collier R., Grant B., et al. (1979). Ridge Crest Hydrothermal Activity and the Balances of the Major and Minor Elements in the Ocean: The Galapagos Data. Earth Planet. Sci. Lett. 46, 1–18. doi: 10.1016/0012-821X(79)90061-X
Embley R. W., Chadwick W. W., Jonasson I. R., Butterfield D. A., Baker E. T. (1995). Initial Results of the Rapid Response to the 1993 CoAxial Event: Relationships Between Hydrothermal and Volcanic Processes. Geophys. Res. Lett. 22, 143–146. doi: 10.1029/94GL02281
Erba E. (1994). Nannofossils and Superplumes: The Early Aptian “Nannoconid Crisis”. Paleoceanography 9, 483–501. doi: 10.1029/94PA00258
Eugenio F., Martin J., Marcello J., Fraile-Nuez E. (2014). Environmental Monitoring of El Hierro Island Submarine Volcano, by Combining Low and High Resolution Satellite Imagery. Int. J. Appl. Earth Obs. Geoinf. 29, 53–66. doi: 10.1016/j.jag.2013.12.009
Ferrera I., Arístegui J., González J. M., Montero M. F., Fraile-Nuez E., Gasol J. M. (2015). Transient Changes in Bacterioplankton Communities Induced by the Submarine Volcanic Eruption of El Hierro (Canary Islands). PloS One 10, 1–16. doi: 10.1371/journal.pone.0118136
Fraile-Nuez E., González-Dávila M., Santana-Casiano J. M., Arístegui J., Alonso-González I. J., Hernández-León S., et al. (2012). The Submarine Volcano Eruption at the Island of El Hierro: Physical-Chemical Perturbation and Biological Response. Sci. Rep. 2, 2–7. doi: 10.1038/srep00486
Fraile-Nuez E., Santana-Casiano J. M., González-Dávila M., Vázquez J. T., Fernández-Salas L. M., Sánchez-Guillamón O., et al. (2018). Cyclic Behavior Associated With the Degassing Process at the Shallow Submarine Volcano Tagoro, Canary Islands, Spain. Geoscience 8, 1–15. doi: 10.3390/geosciences8120457
Frölicher T. L., Joos F., Plattner G. K., Steinacher M., Doney S. C. (2009). Natural Variability and Anthropogenic Trends in Oceanic Oxygen in a Coupled Carbon Cycle-Climate Model Ensemble. Global Biogeochem. Cycle. 23, GB1003. doi: 10.1029/2008GB003316
González-Vega A., Fraile-Nuez E., Santana-Casiano J. M., González-Dávila M., Escánez-Pérez J., Gómez-Ballesteros M., et al. (2020). Significant Release of Dissolved Inorganic Nutrients From the Shallow Submarine Volcano Tagoro (Canary Islands) Based on Seven-Year Monitoring. Front. Mar. Sci. 6. doi: 10.3389/fmars.2019.00829
Guillou H., Carracedo J. C., Pérez Torrado F., Rodriguez Badiola E. (1996). K-Ar Ages and Magnetic Stratigraphy of a Hotspot-Induced, Fast Grown Oceanic Island: El Hierro, Canary Islands. J. Volcanol. Geotherm. Res. 73, 141–155. doi: 10.1016/0377-0273(96)00021-2
Keeling R. F., Körtzinger A., Gruber N. (2010). Ocean Deoxygenation in a Warming World. Ann. Rev. Mar. Sci. 2, 199–229. doi: 10.1146/annurev.marine.010908.163855
Kump L. R., Barley M. E. (2007). Increased Subaerial Volcanism and the Rise of Atmospheric Oxygen 2.5 Billion Years Ago. Nature 448, 1033–1036. doi: 10.1038/nature06058
Kump L. R., Kasting J. F., Barley M. E. (2001). Rise of Atmospheric Oxygen and the “Upside-Down” Archean Mantle. Geochem. Geophys. Geosyst. 2, n/a–n/a. doi: 10.1029/2000gc000114
Leckie R. M., Bralower T. J., Cashman R. (2002). Oceanic Anoxic Events and Plankton Evolution: Biotic Response to Tectonic Forcing During the Mid-Cretaceous. Paleoceanography 17, 13-1-13–29. doi: 10.1029/2001pa000623
López C., Blanco M. J., Abella R., Brenes B., Cabrera Rodríguez V. M., Casas B., et al. (2012). Monitoring the Volcanic Unrest of El Hierro (Canary Islands) Before the Onset of the 2011-2012 Submarine Eruption. Geophys. Res. Lett. 39, 1–7. doi: 10.1029/2012GL051846
Lupton J. E., Baker E. T., Massoth G. J. (1989). Variable 3He/Heat Ratios in Submarine Hydrothermal Systems: Evidence From Two Plumes Over the Juan De Fuca Ridge. Nature 337, 161–164. doi: 10.1038/337161a0
Lupton J. E., Baker E. T., Massoth G. J., Thomson R. E., Burd B. J., Butterfield D. A., et al. (1995). Variations in Water-Column 3He/Heat Ratios Associated With the 1993 CoAxial Event, Juan De Fuca Ridge. Geophys. Res. Lett. 22, 155–158. doi: 10.1029/94GL02797
Malahoff A., Kolotyrkina I. Y., Midson B. P., Massoth G. J. (2006). A Decade of Exploring a Submarine Intraplate Volcano: Hydrothermal Manganese and Iron at Lōihi Volcano, Hawai’i. Geochem. Geophys. Geosyst. 7, Q06002. doi: 10.1029/2005GC001222
Marcello J., Eugenio F., Estrada-Allis S., Sangrà P. (2015). Segmentation and Tracking of Anticyclonic Eddies During A Submarine Volcanic Eruption Using Ocean Colour Imagery. Sensors 15, 8732–8748. doi: 10.3390/s150408732
Méhay S., Keller C. E., Bermasconi S. M., Weissert H., Erba E., Bottini C., et al. (2009). A Volcanic CO2 Pulse Triggered the Cretaceous Oceanic Anoxic Event 1a and a Biocalcification Crisis. Geology 37, 819–822. doi: 10.1130/G30100A.1
Nojiri Y., Ishibashi J. I., Kawai T., Otsuki A., Sakai H. (1989). Hydrothermal Plumes Along the North Fiji Basin Spreading Axis. Nature 342, 667–670. doi: 10.1038/342667a0
Ono T., Midorikawa T., Watanabe Y. W., Tadokoro K., Saino T. (2001). Temporal Increases of Phosphate and Apparent Oxygen Utilization in the Subsurface Water of Western Subarctic Pacific From 1968 to 1998. Geophys. Res. Lett. 28, 3285–3288. doi: 10.1029/2001GL012948
Plattner G. K., Joos F., Stocker T. F. (2002). Revision of the Global Carbon Budget Due to Changing Air-Sea Oxygen Fluxes. Global Biogeochem. Cycle. 16, 43-1-43–12. doi: 10.1029/2001gb001746
Plattner G. K., Joos F., Stocker T. F., Marchal O. (2001). Feedback Mechanisms and Sensitivities of Ocean Carbon Uptake Under Global Warming. Tellus. Ser. B. Chem. Phys. Meteorol. 53, 564–592. doi: 10.3402/tellusb.v53i5.16637
Sangrà P., Pascual A., Rodríguez-Santana Á., Machín F., Mason E., McWilliams J. C., et al. (2009). The Canary Eddy Corridor: A Major Pathway for Long-Lived Eddies in the Subtropical North Atlantic. Deep. Res. Part I. Oceanogr. Res. Pap. 56, 2100–2114. doi: 10.1016/j.dsr.2009.08.008
Santana-Casiano J. M., Fraile-Nuez E., González-Dávila M., Baker E. T., Resing J. A., Walker S. L. (2016). Significant Discharge of CO2 From Hydrothermalism Associated With the Submarine Volcano of El Hierro Island. Sci. Rep. 6, 1–9. doi: 10.1038/srep25686
Santana-Casiano J. M., González-Dávila M., Fraile-Nuez E., De Armas D., González A. G., Domínguez-Yanes J. F., et al. (2013). The Natural Ocean Acidification and Fertilization Event Caused by the Submarine Eruption of El Hierro. Sci. Rep. 3, 5–12. doi: 10.1038/srep01140
Santana-González C., Santana-Casiano J. M., González-Dávila M., Fraile-Nuez E. (2017). Emissions of Fe(II) and its Kinetic of Oxidation at Tagoro Submarine Volcano, El Hierro. Mar. Chem. 195, 129–137. doi: 10.1016/j.marchem.2017.02.001
Schopf J. W. (1993). Microfossils of the Early Archean Apex Chert: New Evidence of the Antiquity of Life. Science 260, 640–646. doi: 10.1126/science.260.5108.640
Snow L. J., Duncan R. A., Bralower T. J. (2005). Trace Element Abundances in the Rock Canyon Anticline, Pueblo, Colorado, Marine Sedimentary Section and Their Relationship to Caribbean Plateau Construction and Ocean Anoxic Event 2. Paleoceanography 20, 1–14. doi: 10.1029/2004PA001093
Staudigel H., Hart S. R., Pile A., Bailey B. E., Baker E. T., Brooke S., et al. (2006). Vailulu’u Seamount, Samoa: Life and Death on an Active Submarine Volcano. Proc. Natl. Acad. Sci. U. S. A. 103, 6448–6453. doi: 10.1073/pnas.0600830103
Stramma L., Brandt P., Schafstall J., Schott F., Fischer J., Körtzinger A. (2008). Oxygen Minimum Zone in the North Atlantic South and East of the Cape Verde Islands. J. Geophys. Res. Ocean. 113, 1–15. doi: 10.1029/2007JC004369
Sverdrup H. U. (1938). On the Explanation of the Oxygen Minima and Maxima in the Oceans. ICES J. Mar. Sci. 13, 163–172. doi: 10.1093/icesjms/13.2.163
Vogt P. R. (1989). Volcanogenic Upwelling of Anoxic, Nutrient-Rich Water: A Possible Factor in Carbonate-Bank/Reef Demise and Benthic Faunal Extinctions? Geol. Soc. Am. Bull. 101, 1225–1245. doi: 10.1130/0016-7606(1989)101<1225:VUOANR>2.3.CO;2
Weiss R. F. (1970). The Solubility of Nitrogen, Oxygen and Argon in Water and Seawater. Deep. Res. Oceanogr. Abstr. 17, 721–735. doi: 10.1016/0011-7471(70)90037-9
Whitney F. A., Freeland H. J., Robert M. (2007). Persistently Declining Oxygen Levels in the Interior Waters of the Eastern Subarctic Pacific. Prog. Oceanogr. 75, 179–199. doi: 10.1016/j.pocean.2007.08.007
Keywords: Tagoro, submarine eruption, dissolved oxygen, deoxygenation, Canary Islands
Citation: González-Vega A, Callery I, Arrieta JM, Santana-Casiano JM, Domínguez-Yanes JF and Fraile-Nuez E (2022) Severe Deoxygenation Event Caused by the 2011 Eruption of the Submarine Volcano Tagoro (El Hierro, Canary Islands). Front. Mar. Sci. 9:834691. doi: 10.3389/fmars.2022.834691
Received: 13 December 2021; Accepted: 26 April 2022;
Published: 20 May 2022.
Edited by:
Aaron J. Beck, Helmholtz Association of German Research Centres (HZ), GermanyReviewed by:
Sabine Schmidt, Centre National de la Recherche Scientifique (CNRS), FranceCopyright © 2022 González-Vega, Callery, Arrieta, Santana-Casiano, Domínguez-Yanes and Fraile-Nuez. This is an open-access article distributed under the terms of the Creative Commons Attribution License (CC BY). The use, distribution or reproduction in other forums is permitted, provided the original author(s) and the copyright owner(s) are credited and that the original publication in this journal is cited, in accordance with accepted academic practice. No use, distribution or reproduction is permitted which does not comply with these terms.
*Correspondence: Eugenio Fraile-Nuez, ZXVnZW5pby5mcmFpbGVAaWVvLmVz
Disclaimer: All claims expressed in this article are solely those of the authors and do not necessarily represent those of their affiliated organizations, or those of the publisher, the editors and the reviewers. Any product that may be evaluated in this article or claim that may be made by its manufacturer is not guaranteed or endorsed by the publisher.
Research integrity at Frontiers
Learn more about the work of our research integrity team to safeguard the quality of each article we publish.