- 1School of Civil, Architecture and Environmental System Engineering, Sungkyunkwan University, Suwon, South Korea
- 2Graduate School of Water Resources, Sungkyunkwan University, Suwon, South Korea
Recently, studies have been conducted that long-term changes in shoreline position can be sufficiently interpreted using an ordinary differential equation that includes only erosion and recovery processes. Here, the erosion process term is given as a function of the breaking wave energy, which causes the shoreline to retreat to the ultimate erosion position by the incoming wave energy. The recovery process term is given as a function of the concentration of suspended sediment and allows it to recover to its shoreline position. Therefore, in this study, we propose a numerical technique that simulates long-term changes in the beach profile by extending the ordinary differential equation to be applied to the change in seabed constituting the beach profile by applying the parabolic equation of the equilibrium beach profile of the surf zone. This model also consists of a term that allows the beach profile to converge to the equilibrium beach profile due to the breaking wave energy and another term that allows it to converge back to the linear shoaling profile when the wave is extinguished. Therefore, it is possible to simulate the repeated formation and disappearance of scarp and berm whenever a storm wave passes, and it can also be applied to the morphological change at the beach with a large tidal range. The validity of the proposed methodology was verified by comparing the long-term shoreline observation data of Tairua Beach, New Zealand, where the tidal difference is about 2 m, with the results of the long-term beach section convergence model of this study. In addition, short-term observation data were also compared and analyzed to investigate the ability to simulate morphological changes due to episodic erosion and recovery processes. The results of this study are expected to be applied not only to the beach profile but also to the three-dimensional morphology change of the beach, and it is expected that it will serve as a cornerstone for a more detailed topographic change prediction study due to sea level rise.
Introduction
The rise of wave height and sea level due to climate change has increased the need for awareness of the importance of long-term changes in beaches for sustainable coastal conservation and research supporting long-term change prediction. Although the prevalence of predictive models based on morphodynamic modeling is increasing (Pender and Karunarathna, 2013), existing beach profile change models cannot simulate long-term sedimentation. Fang and Ron (2013) and Montaño et al. (2020) highlighted that no individual model is currently capable of simulating beach recovery and erosion processes over a long period. For that reason, it seems to be impossible to simulate long-term beach profile changes, including tidal effects, in the macro-environment.
Long-term morphological changes are a phenomenon that can only be achieved by simulating storm wave erosion and mild wave deposition. In particular, since it is not easy to simulate the sedimentation process, at present only the numerical model of shoreline position change that is less affected by the magnitude of wave energy and can include the sedimentation process is applied only to long-term topographic change simulation. The shoreline position change model, which was first suggested by Wright et al. (1985), is a bulk-type ordinary differential equation (ODE) model that does not allow numerical divergence (Wright et al., 1985; Miller and Dean, 2004; Yates et al., 2009). Recently, Lim et al. (2021) applied the concept of the horizontal behavior of suspended sediment to solidify the topographical and physical basis of this type of shoreline position change model and showed adequate similarity despite a long-term simulation.
The bulk-type model has a term given as the equilibrium erosion width or equilibrium beach profile, which is a target variable (shoreline position or beach profile) that retreats and ultimately converges due to the continuous breaking wave action. Several empirical formulae have been proposed for the study of the shape of the beach profile, starting with the equilibrium beach profile (EBP) suggested by Brunn (1954) and Dean (1977; 1991). Thereafter, several studies on the EBP (Larson, 1991; Bodge, 1992; Komar and McDougal, 1994) have been conducted. It is generally accepted that the empirical formula fits relatively well with the actual beach profile (Wang and Kraus, 2005). These studies established a series of formulae to simulate the configuration of the EBP and used mathematical models to predict beach profile behavior (Thieler et al., 2000). A study on the profile of the offshore region outside the surf zone was also performed. The so-called shoaling profile zone is considered a static region balanced by the continuous wave incidence (Bernabeu et al., 2003). There is no definite curve equation for this region; however, it can be considered a parabolic equation similar to the wave profile region (Bernabeu et al., 2003; Requejo et al., 2006).
In addition to these studies on the equilibrium beach profile since the first attempt by Wang et al. (1975), several numerical model development studies to predict the change in the beach profile for 45 years have been made. These studies have led to the development of a three-dimensional model that includes almost all physical phenomena, such as waves, currents, and topography changes. For example, Margvelashvili et al. (2008) developed one-dimensional vertical and three-dimensional fine-resolution numerical models of sediment transport. Nam et al. (2009) proposed a two-dimensional numerical model of nearshore waves, currents, and sediment transport. Hanson et al. (2010) presented a mathematical approach and numerical model that simulates beach and dune changes in response to cross-shore processes of dune growth by wind, dune erosion by storms, and gradients in longshore sand transport that will alter shoreline position. It is also useful to refer to Callaghan et al. (2006), who reviewed numerical models of sediment conservation. However, although existing models faithfully include all physical processes, they can only predict short-term erosion, and few models can simulate beach recovery and sedimentation processes over a long period (Swart, 1974; Wang et al., 1975; Larson and Kraus, 1989; Larson et al., 1999; Lesser et al., 2004; Roelvink et al., 2009; Fang and Ron, 2013; Deltares, 2018).
Although the existing beach profile change model has the advantage of including various physical phenomena of sediment transport, it also has drastic limitations. First, unlike the observation trend in the lab, where the beach section converges at the certain time point, it is continuously eroded. Second, when the waves become calm, it cannot be seen that it recovers to the original beach before the storm wave, as seen one or two months later with the development of berms in the natural beach. A method to solve this problem is to include a physical process in which the suspended sand particles are restored to their original position according to the horizontal movement of the shoreward. In this study, we propose a model that converges to the storm beach when the waves are high and converges to the normal beach when the waves are calm again by determining the EBP to converge introducing the concept of wave phase potential.
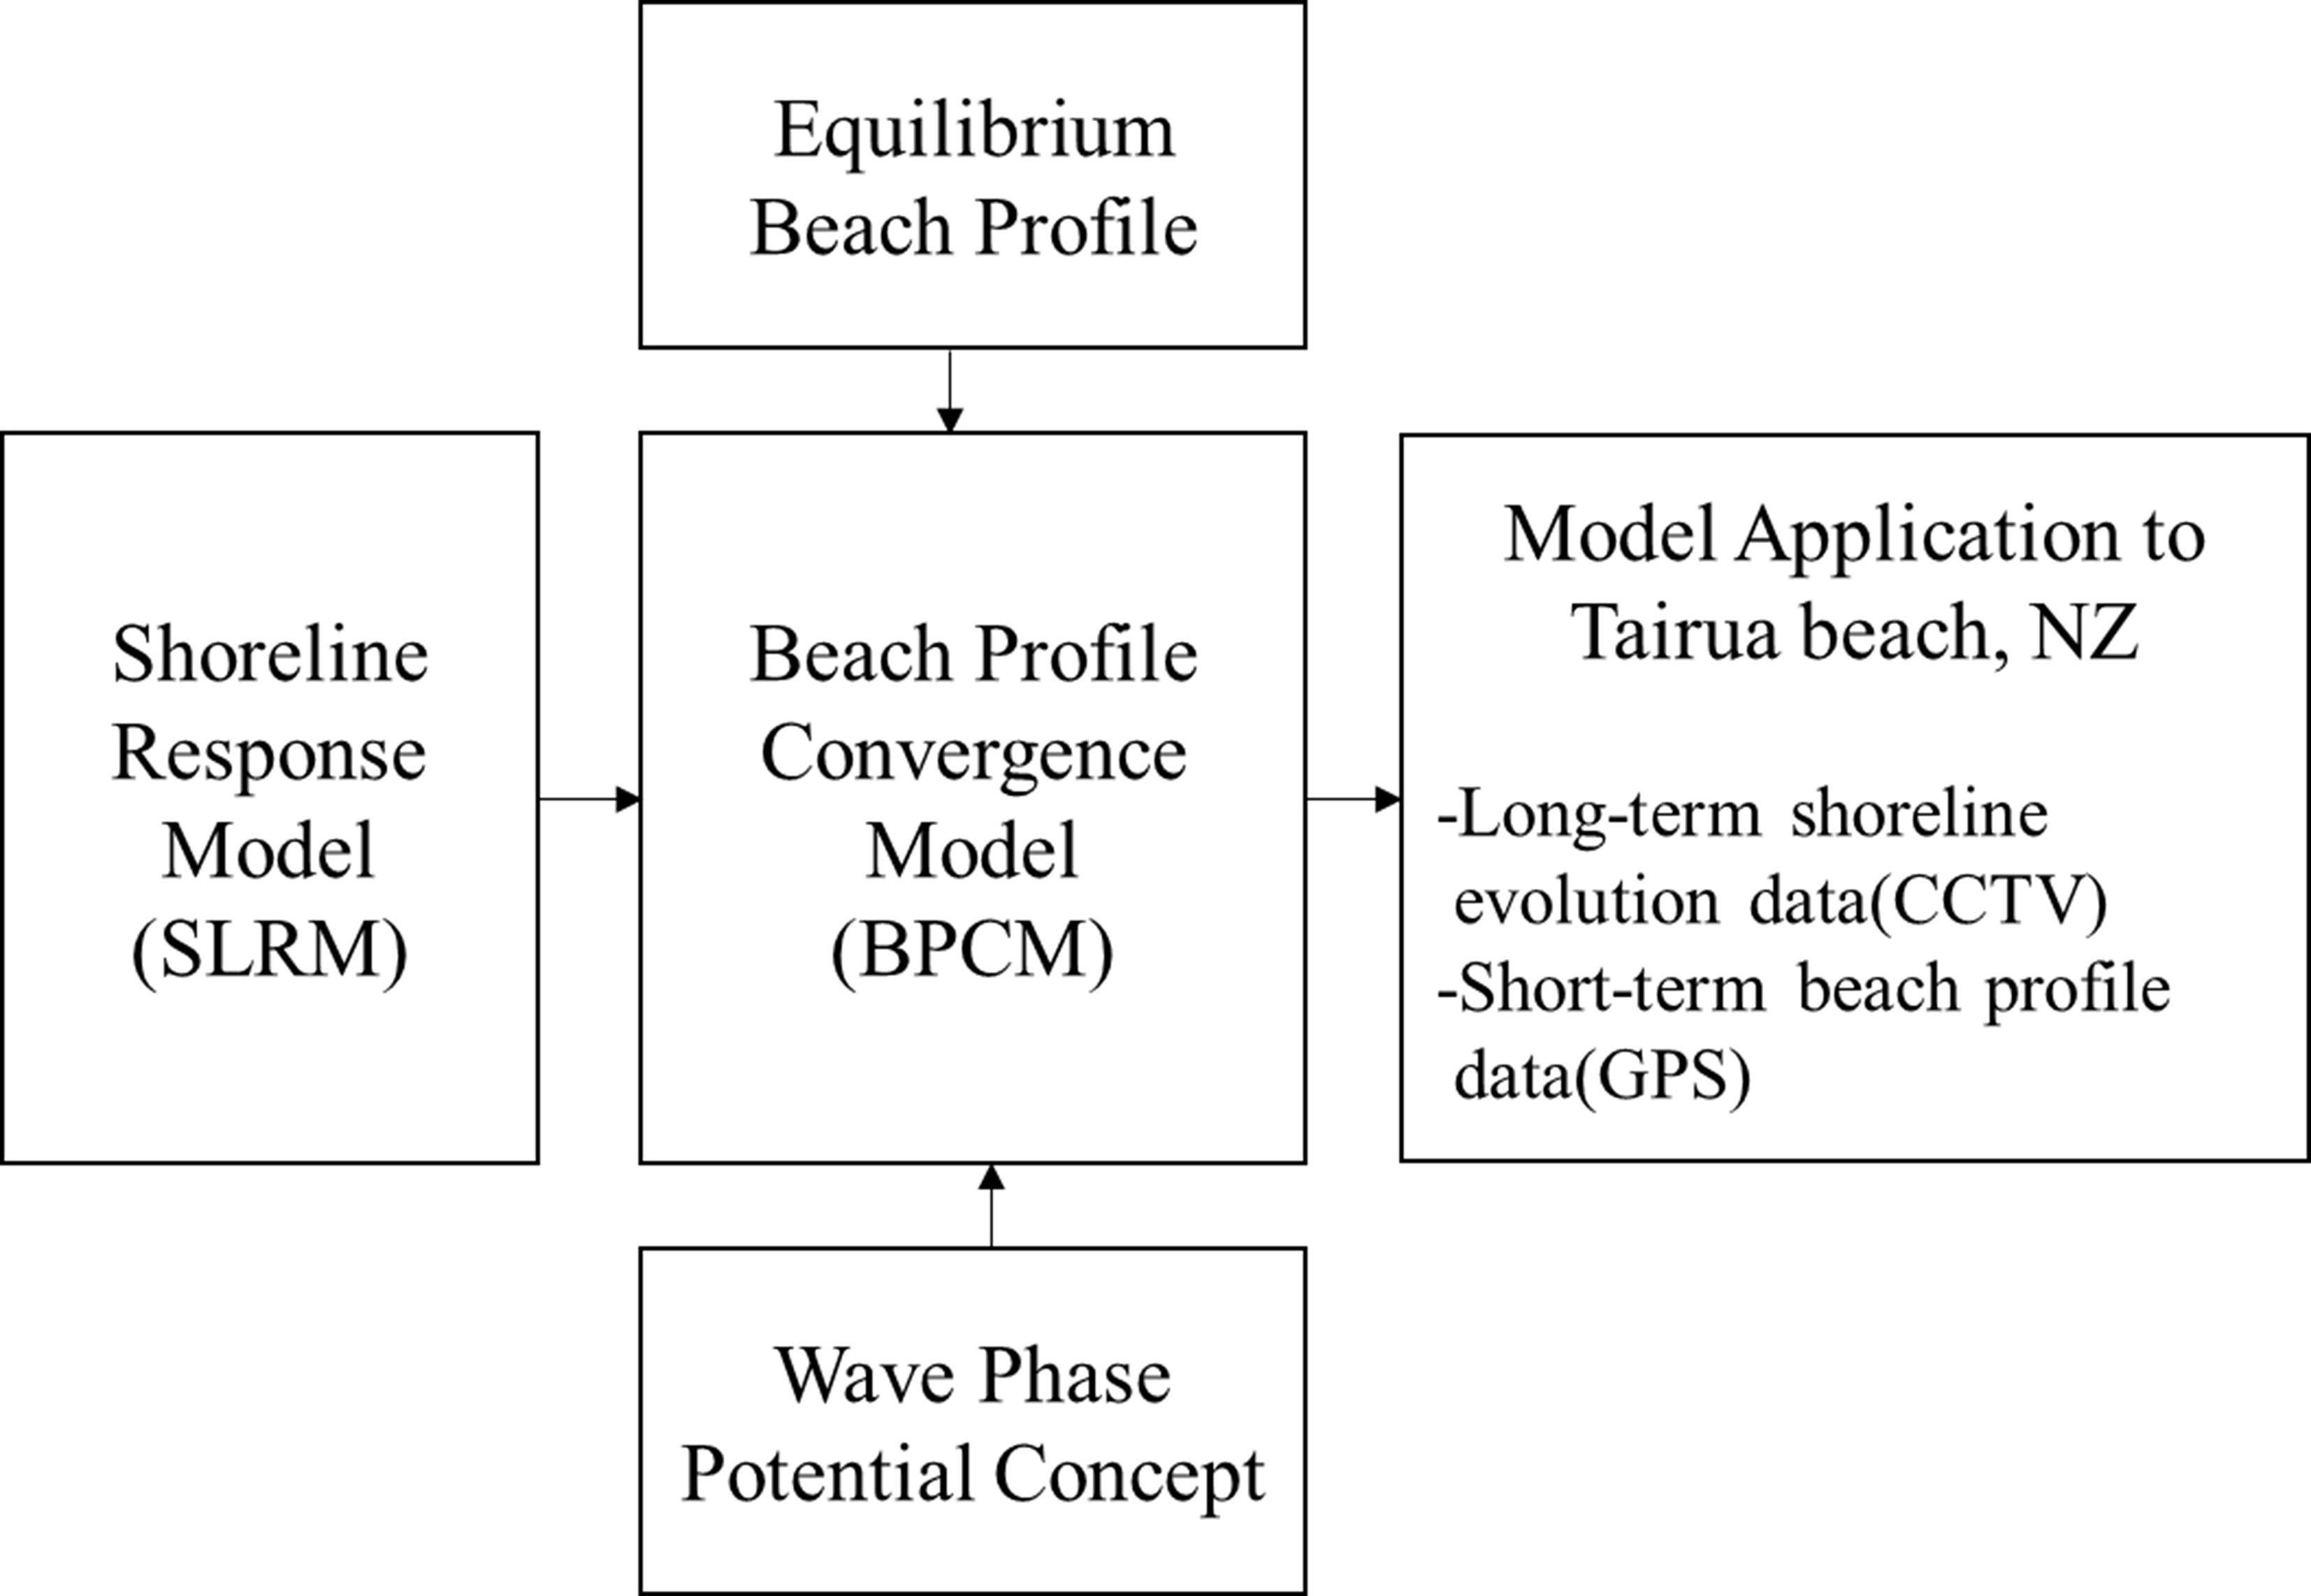
Figure 1 summarizes the contents of this study and explains the components and process of the study: The prediction of long-term beach profile evolution is derived based on the shoreline response model (SLRM), which simulates the temporal change in shoreline position as shown in the research process. Using the equilibrium beach profile, the governing equation of the beach profile convergence model (BPCM) with water depth as a variable was derived, and a numerical model was developed in which the target beach profile to converge by applying the wave phase potential was determined so that the water depth gradually converges to it. The long-term simulation validity of the model was verified using the wave and shoreline observation data taken at Tairua Beach in New Zealand by Montaño et al. (2020) to the BPCM of this study. The validity of whether detailed beach profile changes, such as bar migration, can be simulated was reviewed through a comparison with the short-term observed beach profile.
Model Description
Governing Equation of the Shoreline Response Model (SLRM)
The generation and deposition of suspended sediment is considered horizontal behavior in the direction of the wave force along the cross-shore rather than vertical behavior in the direction of gravity. Therefore, the temporal change in the shoreline is expressed by Eq. (1) (Lim et al., 2021):
where Ds is the vertical height limit at which the suspended sediment occurs, defined as the sum of the berm height and closure depth; is the erosion rate of the beach (per unit length of the shore) caused by suspension from the original location of the sediment, and is the rate of sedimentation (per unit length of the coast) that occurs by returning to the original position. When the wave height is reduced, the process of returning to the original shoreline is simulated as a sedimentation phenomenon in which the sand returns to its original position and is superior to that of erosion.
As shown in Eq. (2), the equation governing the change in shoreline position is derived from the horizontal behavior characteristics of the suspension and recovery of sediment proposed by Lim et al. (2021) as follows:
where kr is the beach recovery factor, which is the rate at which the suspended sand returns to the shore, which can vary depending on the characteristics of the sand.
The shoreline position reaching equilibrium yeqin an environment where a constant wave is continuously incident is expressed in terms of wave energy at the starting point of wave breaking Eb and beach response factor ar as shown in Eq. (3) below.
In this study, ar is a beach response factor obtained from a field experiment by Yates et al. (2009) and is regarded as a value determined according to beach characteristics regardless of wave energy.
The physical basis of the ODE equation was first empirically proposed by Miller and Dean (2004) and established by Lim et al. (2021). Kim et al. (2021) and Lim et al. (2021) conducted studies on the estimation of the beach response factor ar. Lim et al. (2021) obtained their results by applying the Tairua beach wave and shoreline observation data from Montaño et al. (2020) to Eq. (6). Compared to the blind test result found by Montaño et al. (2020), the correlation coefficient was 0.74, which was satisfactory even though it was compared with the long-term observation data for approximately 11 years.
Governing Equation of the Beach Profile Convergence Model (BPCM)
The EBP formula (Eq. 4) presented by Bruun (1954) and Dean (1977) was used to extend the ODE equation (Eq. 2), which simulates the shoreline position change with beach profile change.
where h is the depth of the water, and A is the beach scale factor, which is a coefficient dependent on the median grain size (D50), which can be calculated using Dean’s table (Dean, 1987). Furthermore, y is the seaward distance from the shoreline. If differentiation is considered in the EBP equation, (Eq. 4), the following relational equation (Eq. 5) is obtained:
Applying Eq. (4), we get
If the EPB equation (Eq. 4) is applied to the right side of the SLRM governing equation (Eq. 2) and Eq. (6) is applied to the left side, the following equation is obtained:
where qr is the convergence factor that allows the water depth to converge to the equilibrium water depth. The same value as the beach recovery factor kr, which was applied to the shoreline position equation (Eq. 2), is applied. However, this result is obtained under the assumption that Eq. (4) holds the relationship between the distance y from the shoreline and the water depth h.
Eq. (7) is rearranged by dhm = mhm–1 dh to the 3/2 power of h as shown in Eq. (8).
This equation becomes a governing equation that simulates temporal changes in the beach profile.
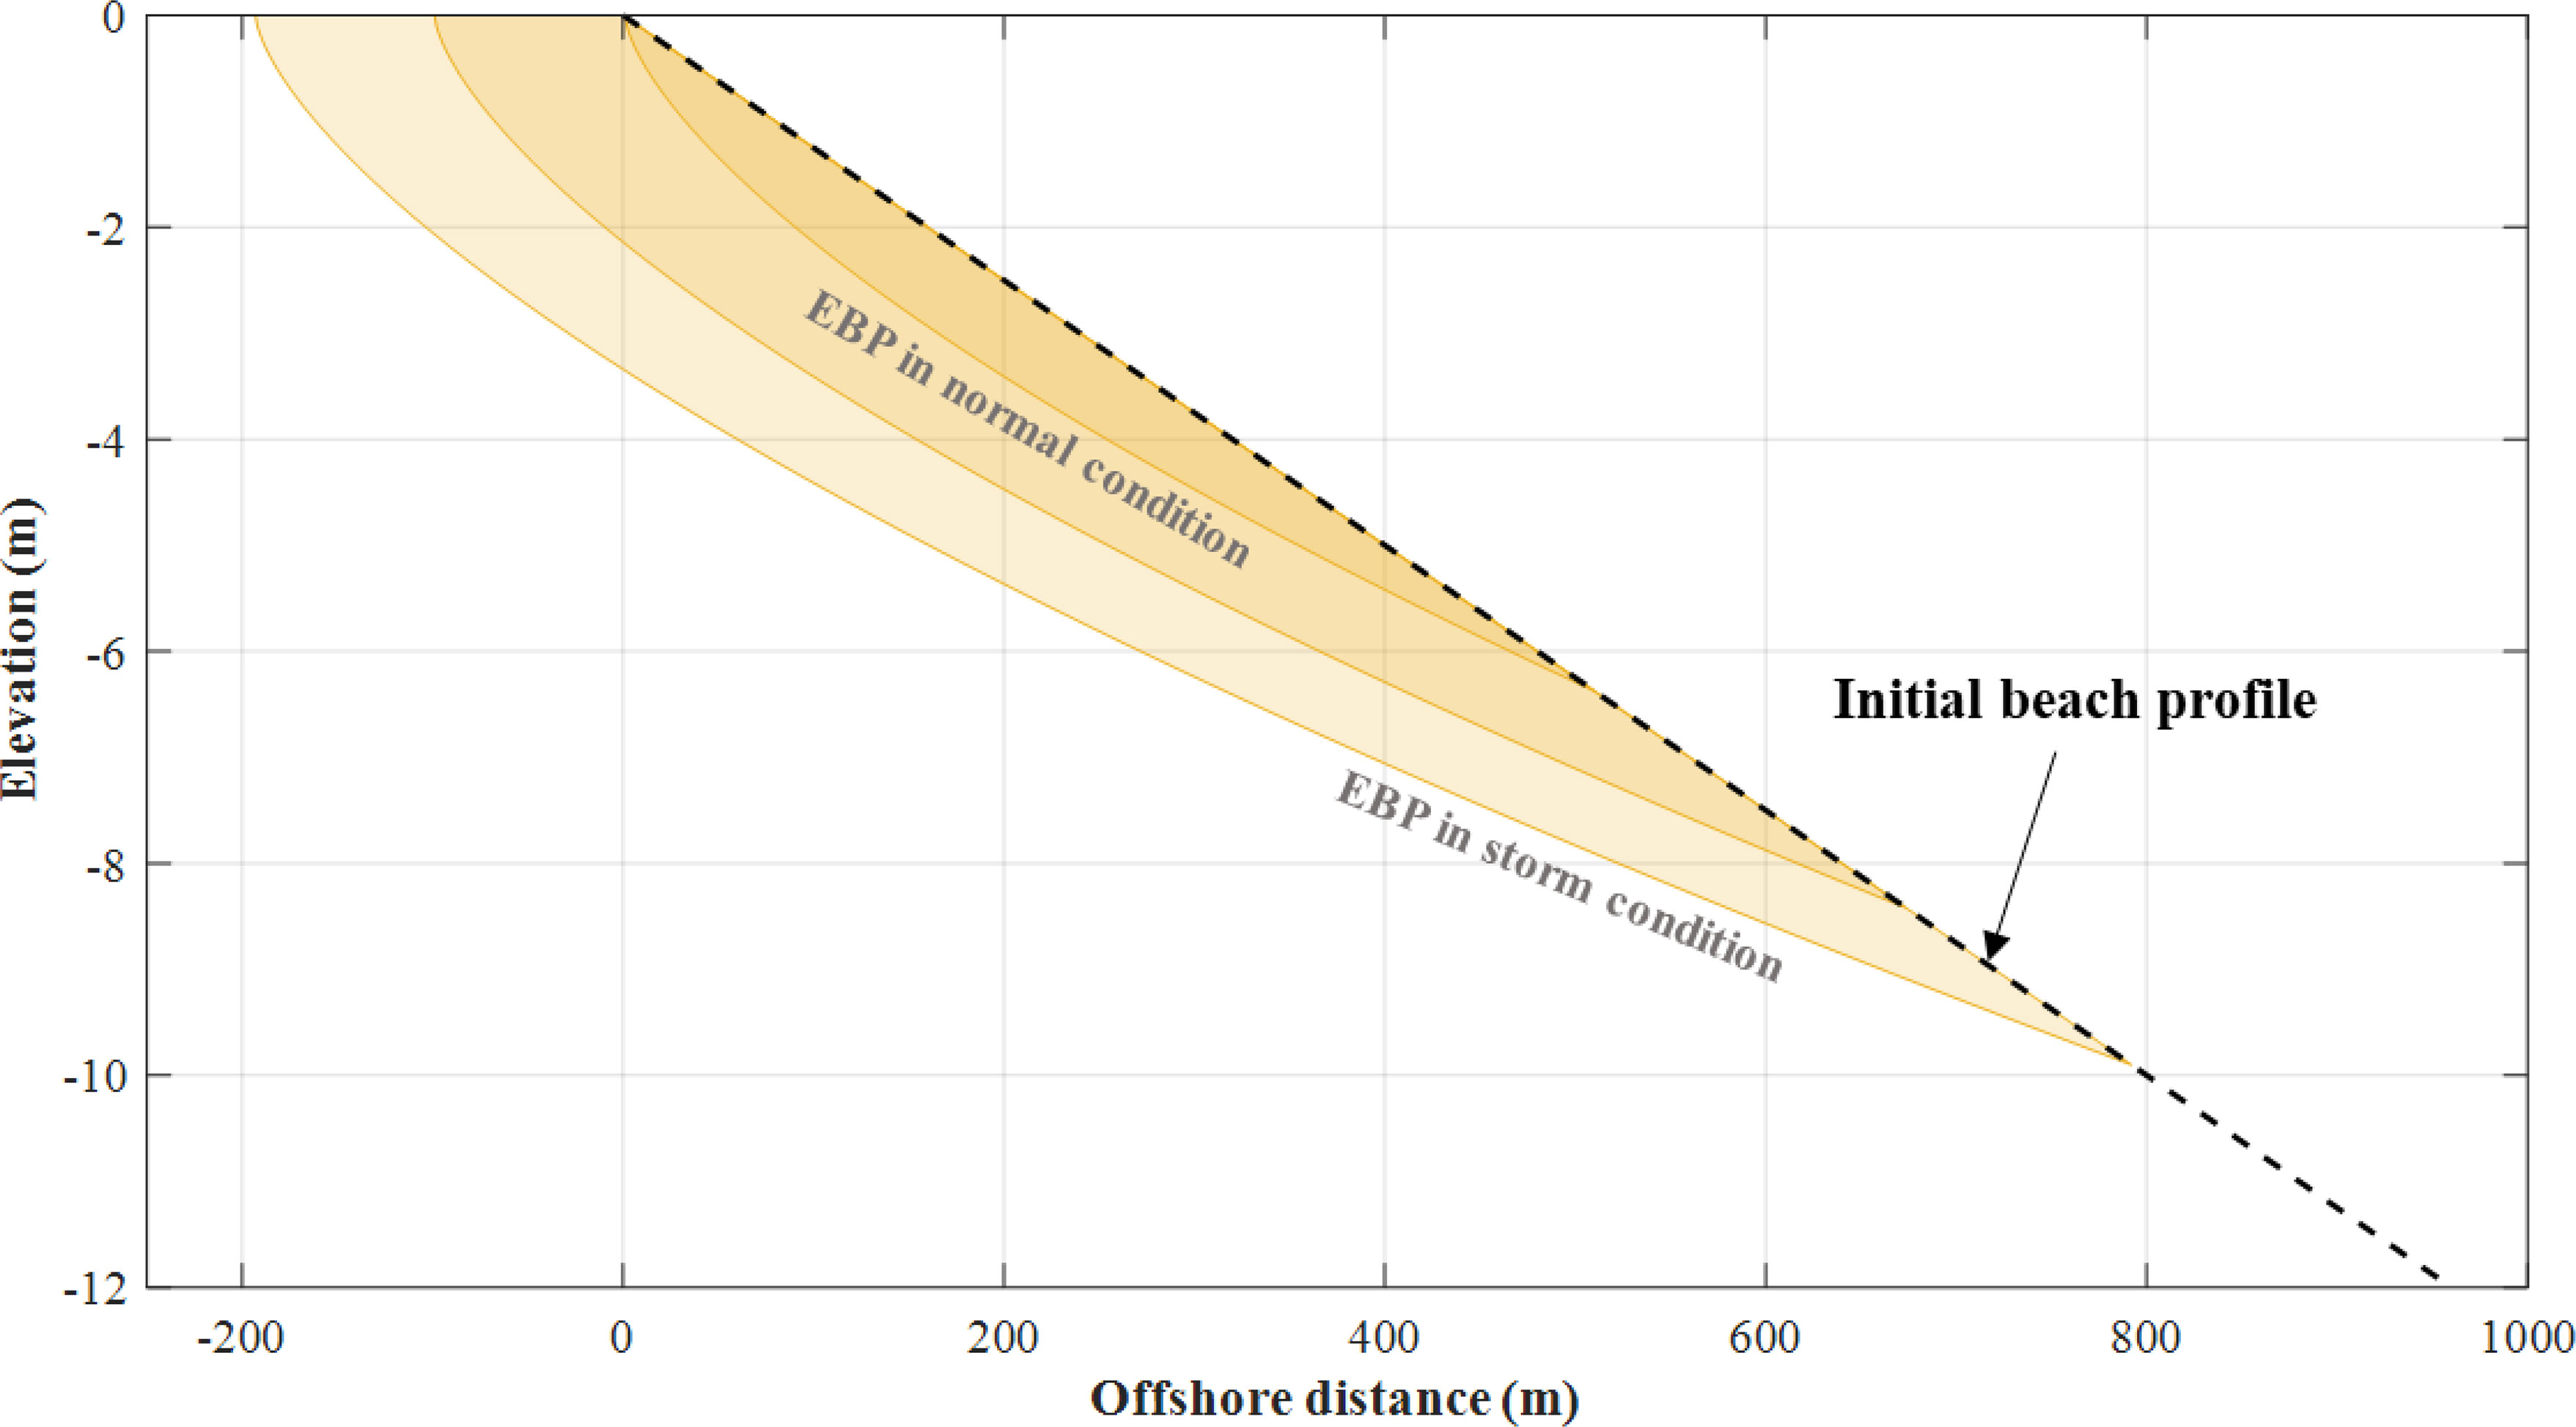
The formula for the equilibrium beach profile given in Eq. (4) corresponds to a shallow water region. However, for storm beaches that follow Eq. (4) formed by storm waves, when the wave period is shortened, the shallow water region to which the equilibrium beach cross-section is applied becomes narrow. And as formed on the offshore, the straight beach profile converges to the normal beach as the slope gradually becomes steeper (Figure 2).
To realize this phenomenon, the concept of wave phase potential is introduced and briefly summarized as follows. The wave phase potential can be expressed as the integral of the wave phase, which decreases as the wave advances from its point of origin. This mechanism is similar to the Earth’s gravitational field, the potential of which decreases from the distant atmosphere towards the center of the Earth (the center of gravity). Therefore, the wave phase potential for waves entering the shore is expressed by wave number k as follows:
Here, the wave number is defined by the angular frequency σ, and phase celerity C as follows:
By applying the wave number of shallow water to Eq. (10), the following equilibrium water depth is obtained in terms of the wave phase potential:
where the wave phase potential is defined as seaward from the shoreline (as wave phase decreases towards shoreline). Therefore, the wave phase potential ψp has a linear proportional relationship with the equilibrium depth heq and thus providing information on important physical properties that enable the simulation of morphological evolution such as scarp or berm converging to the equilibrium state by estimating the wave phase potential.
Numerical Scheme and Performance Test
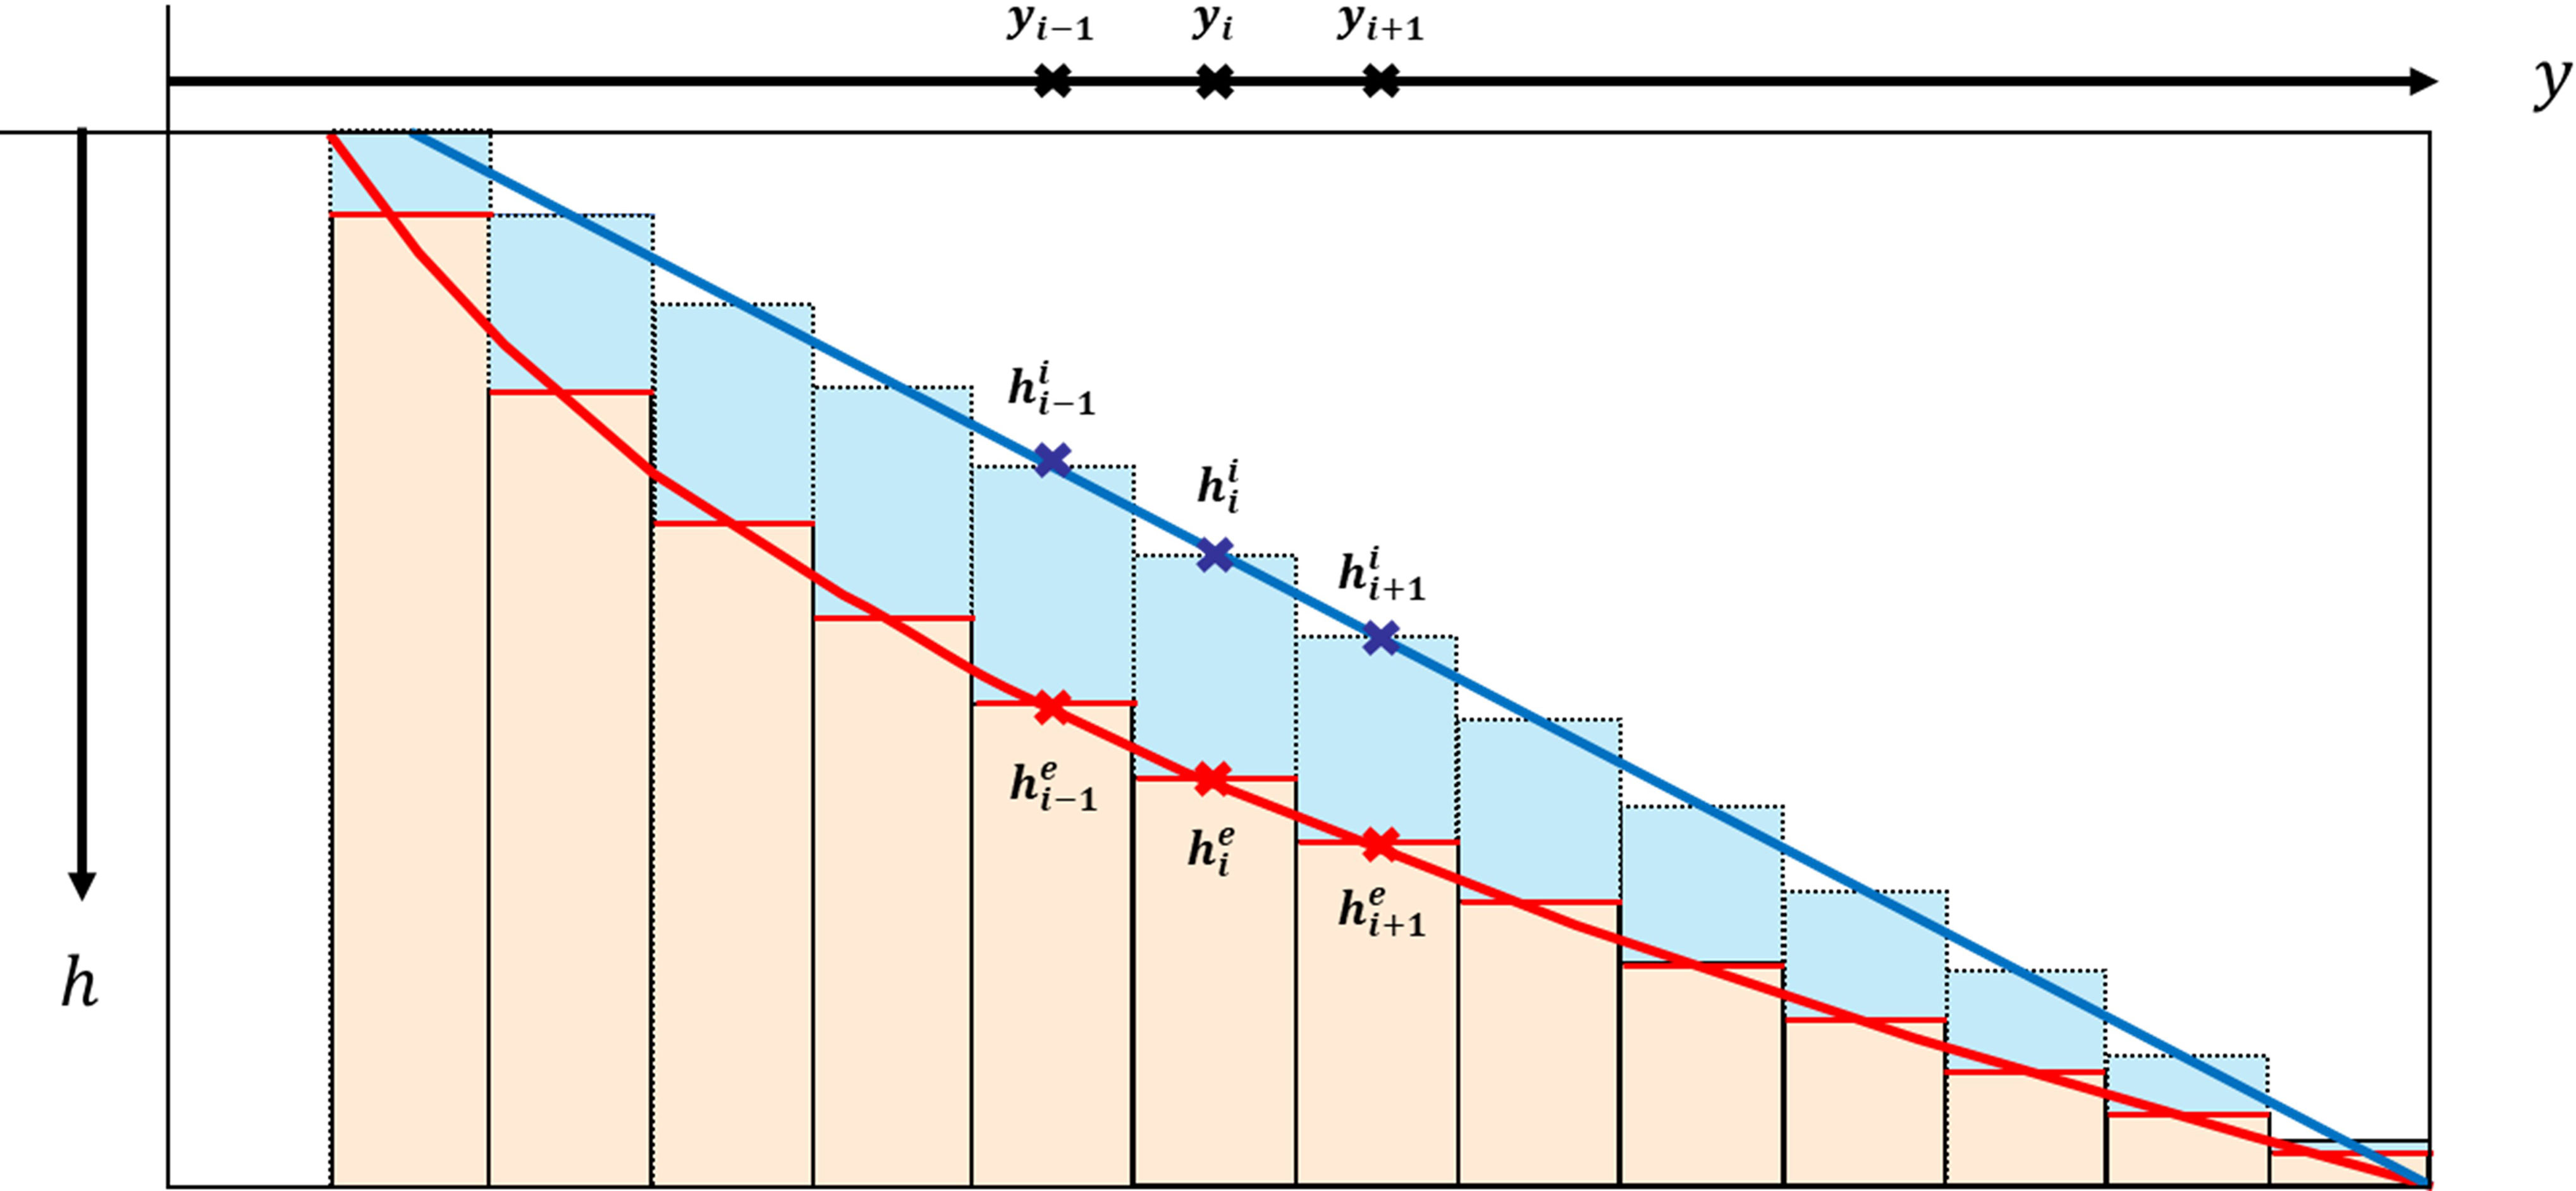
As shown in Figure 3, the water depth h converges to the equilibrium water depth he. Thereafter, the governing equation (Eq. 12) is numerically analyzed by a simple finite difference with respect to time at each y point where the grid is located, as shown in Eq. (12).
where is h3/2. Through this, it is possible to simulate the convergence from the initial water depth to the equilibrium depth based on the temporal change in the water depth using wave information.
The most difficult and important part of the model for changing the beach profile is to simulate the retreat or advance of the shoreline. In this study, when the shoreline retreat caused by erosion was steeper than the critical slope 1:mcr, the berm collapsed, and a new calculation grid was created. The numerical scheme is as follows:
where Δy is the grid size, and hl and hw are the water depths on the land side and the water side with the shoreline in between, respectively. When the water depth increased and the shoreline moved seaward, the berm height formula outlined by Sunamura (1975) was applied to ensure that the berm height rose only to the level given as a function of the breaking wave height Hb.
Figures 4 shows the simulated results obtained by applying the storm wave scenario function suggested by Kim et al. (2021). To extract the high wave scenario, Kim et al. (2021) non-dimensionalized the wave height data before and after the occurrence of the maximum wave height of the NOAA wave data across 40 years (1979–2018) by the peak wave height and period value. A storm wave scenario function (SWSF) that fits well by taking dimensionless values with respect to the peak wave height was proposed. The SWSF for the peak wave height (Hp) of 4.5 m and peak period (Tp) of 11.1 sec were applied following the shoreline response (Figure 4A) and the corresponding beach profile change result (Figure 4B) according to the high wave incidence. From the simulation results, it can be confirmed that the occurrence of scarp due to high waves and the formation of berms after the extinction of high waves can be reproduced.
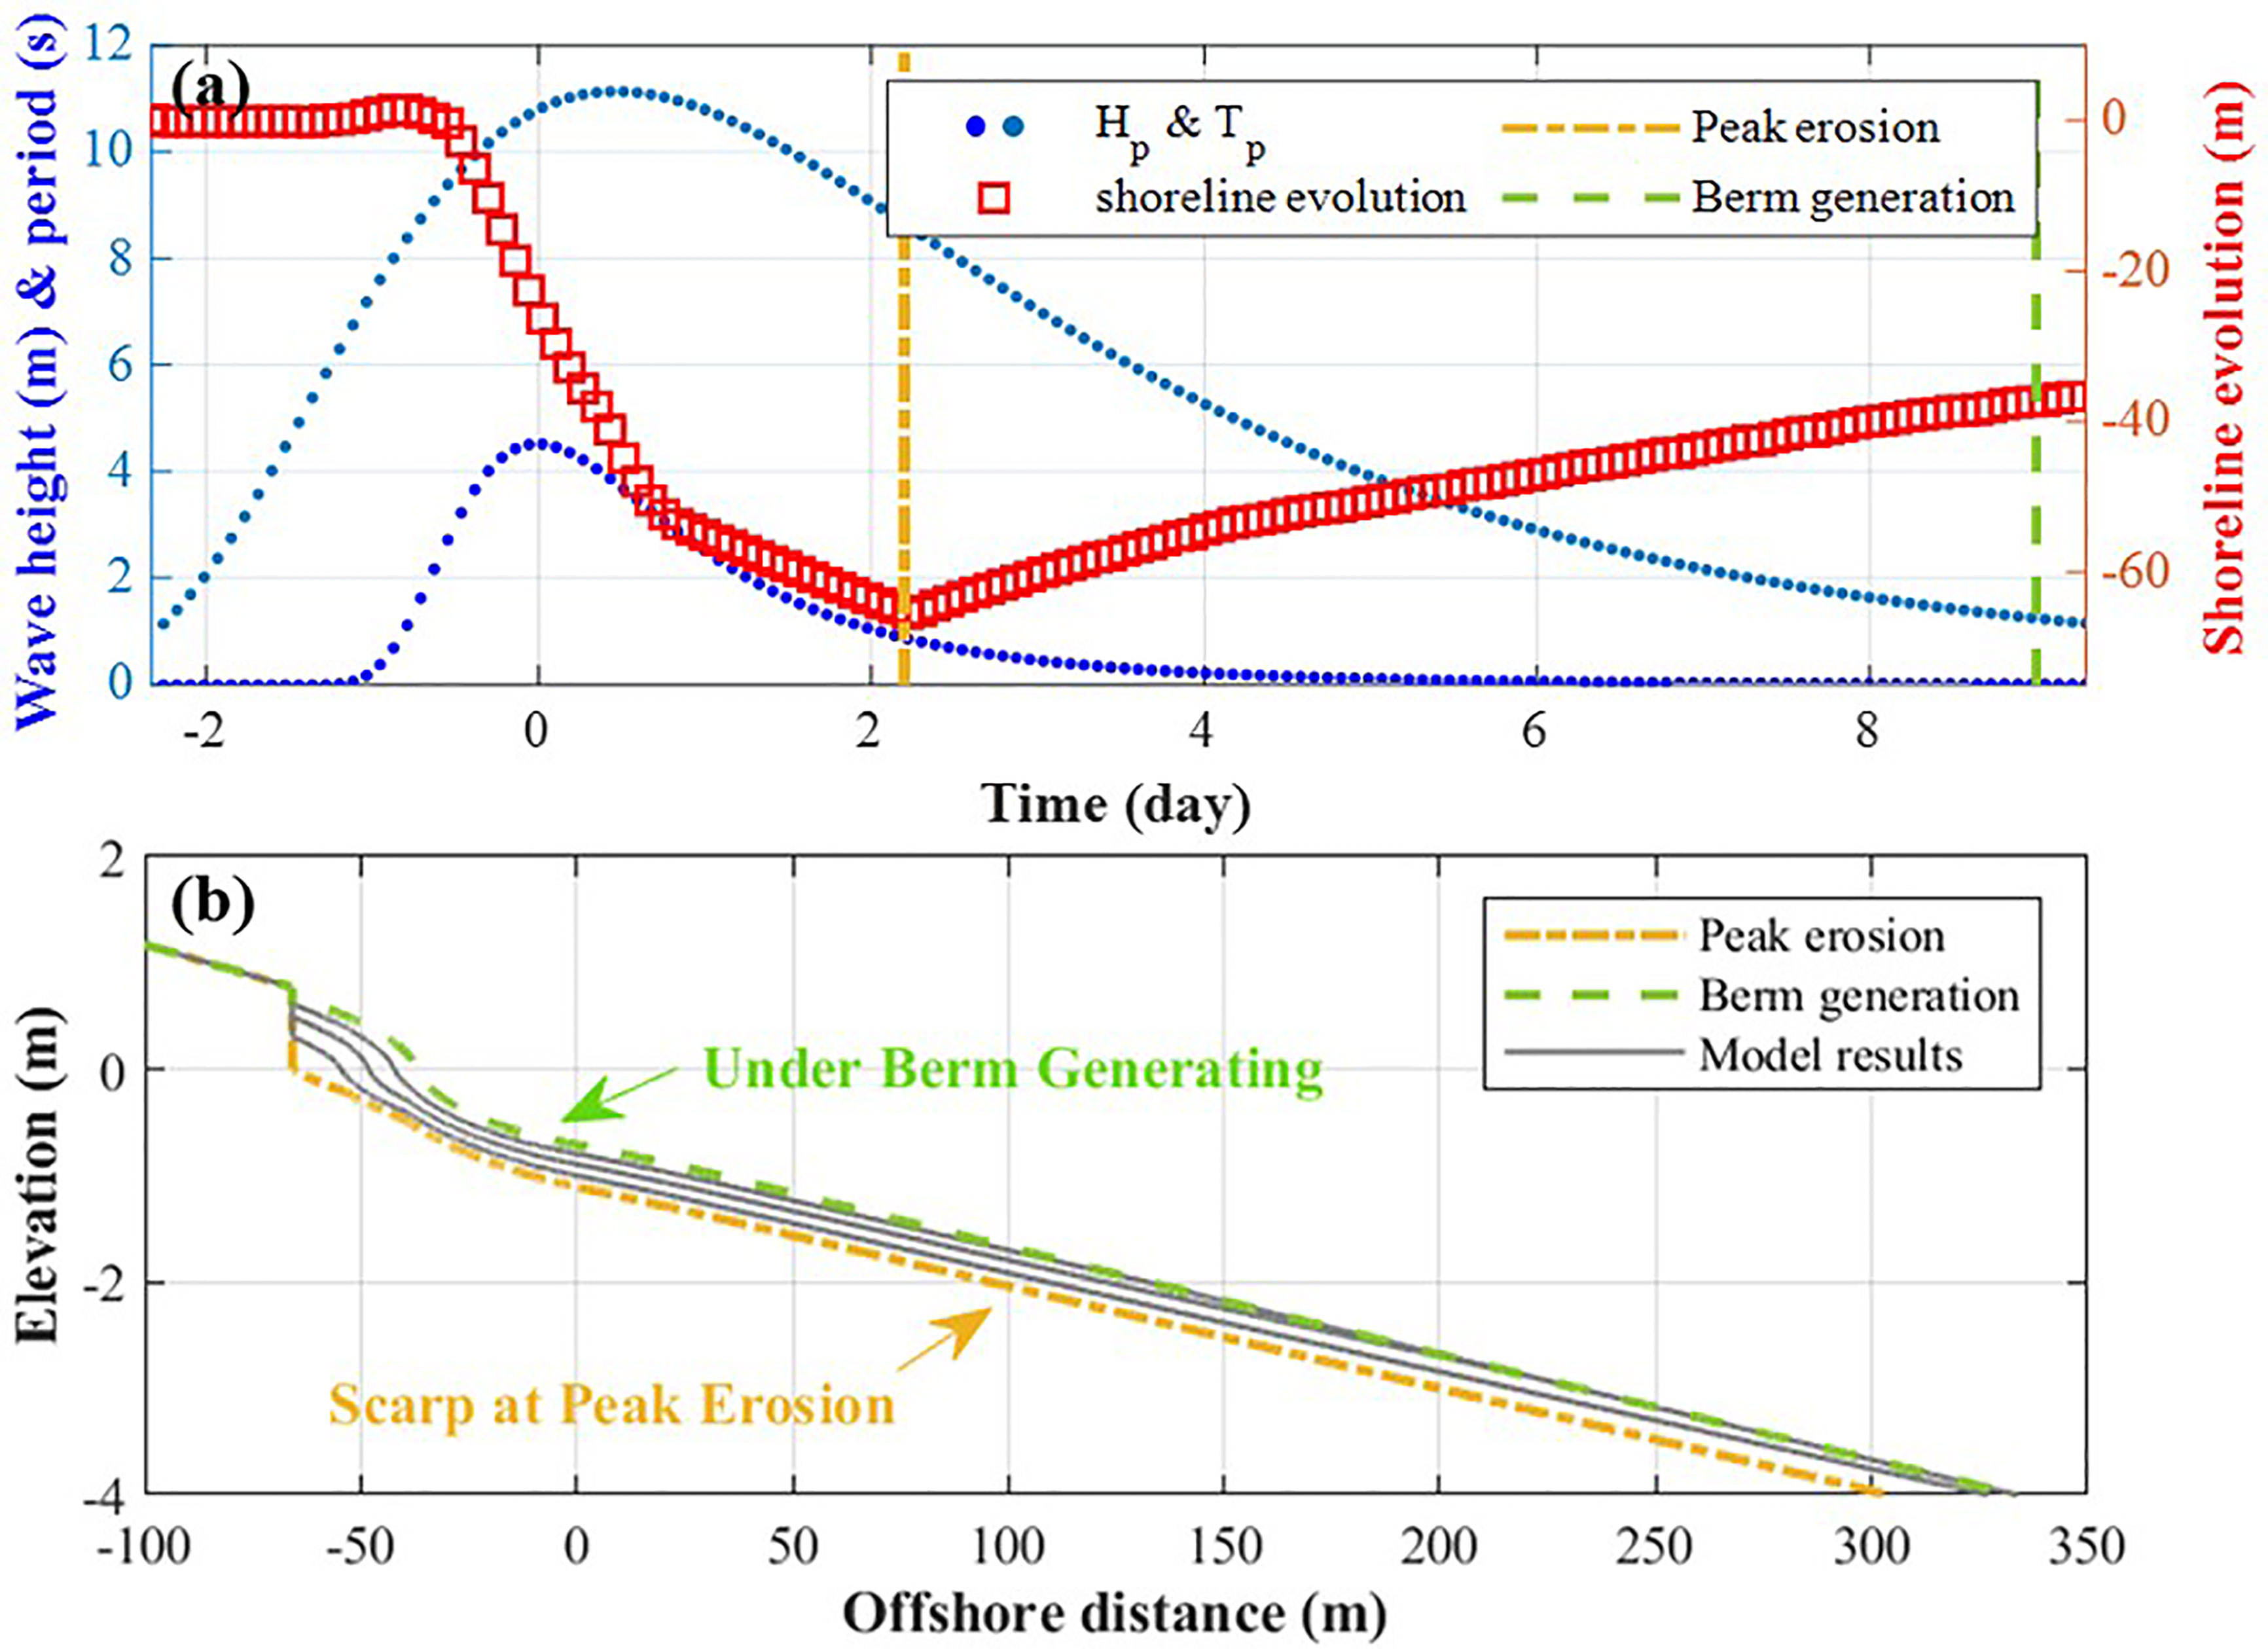
Figure 4 (A) Time evolution of SWSF (blue dots) and shoreline retreat width (red square) for Hp = 4.5 m and Tp = 11.1sec. (B) Beach profile change results applying SWSF (peak erosion and berm generation).
Verification of Long-Term Performance of the Model
Study Site for Model Validation
To investigate the practical field applicability, the results of this model were compared with long-term shoreline evolution data (Montaño et al., 2020) and short-term beach profile evolution data (van Maanen et al., 2008) obtained from Tairua Beach, New Zealand (Supplementary Figure 1). The data were extracted from video images acquired using a CCTV camera system installed on Tairua Beach.
Tairua Beach is located on the eastern coast of the northern island of New Zealand (36°5945″S, 17.5°5140″E) (Supplementary Figure 1A). It has a length of 1.2 km, and topographically, it is a relatively stable pocket beach that sits between Pumpkin Hill to the north and Paku Hill to the south (Supplementary Figure 1B). According to Wright and Short (1984), Tairua Beach is classified as an intermediate beach (Bogle et al., 1999) and frequently exhibits a transverse-bar-rip morphology.
Incident Wave Data
The long-term wave input data of this model were provided by MetOcean (Montaño et al., 2020), and were extracted from wave hindcast data between January 1, 1979, and December 31, 2016, at a depth of 10 m using a hydrodynamic model (SWAN), as shown in Supplementary Figure 1B. Further, Supplementary Figure 2 shows the time series change of wave information (wave height, period, wave direction) provided from “Shoreshop” (https://coastalhub.science/data).
Long-Term Shoreline Evolution Data
The Waikato Regional Council and the National Institute of Water and Atmospheric Research (NIWA) produced shoreline evolution data for the Tairua beach through image processing from 1999 to 2017 (Montaño et al., 2020). Shoreline data were extracted using a camera system installed on a hill (at an elevation of approximately 60 m) at the north end of the beach, and values were produced once a day from time-averaged images for 10 min. Although Tairua Beach is a microtidal environment (tidal range is between 1.2 and 2 m), the images taken at the time when the tide levels are 0.45 and 0.55 m were selected to exclude the effect of tidal waves as much as possible. Figure 5 shows the tidal fluctuations and historical tide data (only astronomical tide) of Tairua beach provided by “Shoreshop” (https://coastalhub.science/data). To compare the shoreline position results of the SLRM, the values between 0.45 m and 0.55 m which correspond to the shoreline are indicated by a red line in Figure 5.

Figure 5 Tide raw data (gray line) and tide data at the time of shoreline observation data (red line).
Figure 6 shows the temporal changes in shoreline evolution at the time of comparison. The validity of the model was verified by comparing it with the numerical results of the BPCM proposed in this study.
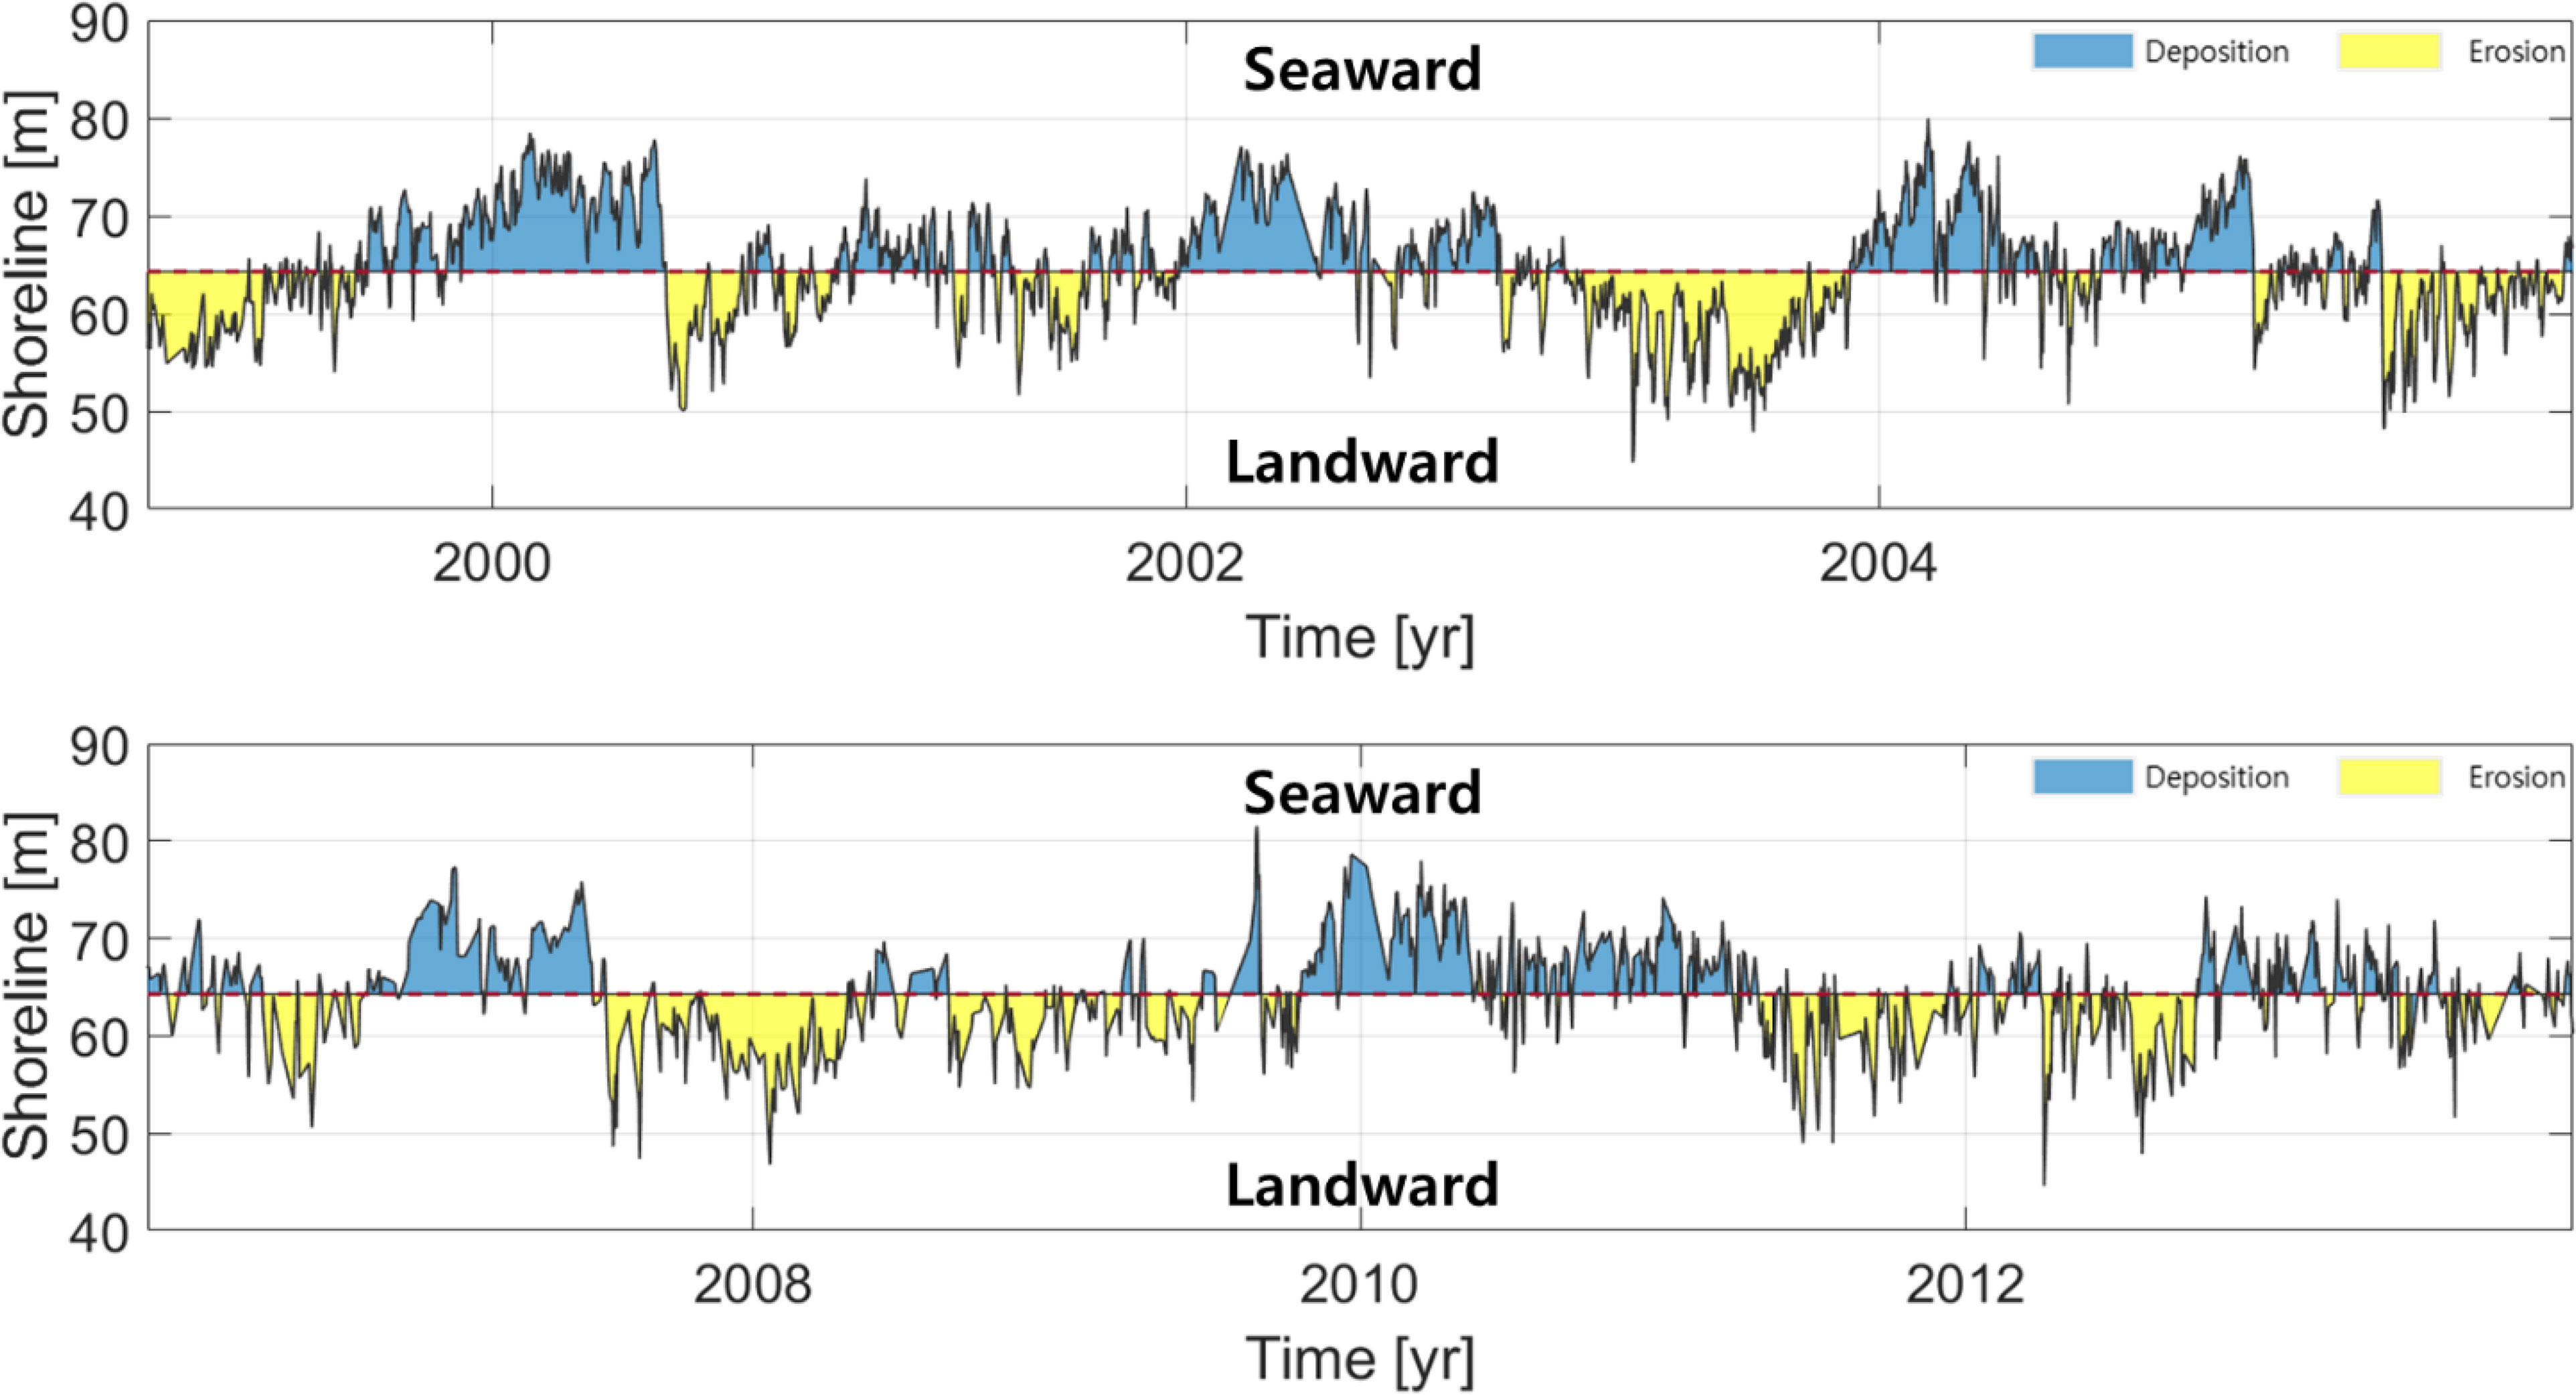
Figure 6 Temporal series of shoreline change on Tairua Beach, New Zealand (Montaño et al., 2020).
Determination of Input Data
It has been reported that the median grain size of the sand composing Tairua beach is between 0.3–0.6 mm, whereas the low tidal terrace (LTT) and upper beach face (UBF) are 0.02 mm and 0.2 mm, respectively (van Maanen et al., 2008; Blossier et al., 2016; Blossier et al., 2017; Montaño et al., 2020 and Smith and Bryan, 2007). However, the area with a median particle diameter of 0.3–0.6 mm is considered the upper beach face because of the relatively coarse median grain size. The point where the shoreline position data obtained through the shoreline image was extracted was presumed to be the LTT, where the particle size was finer.
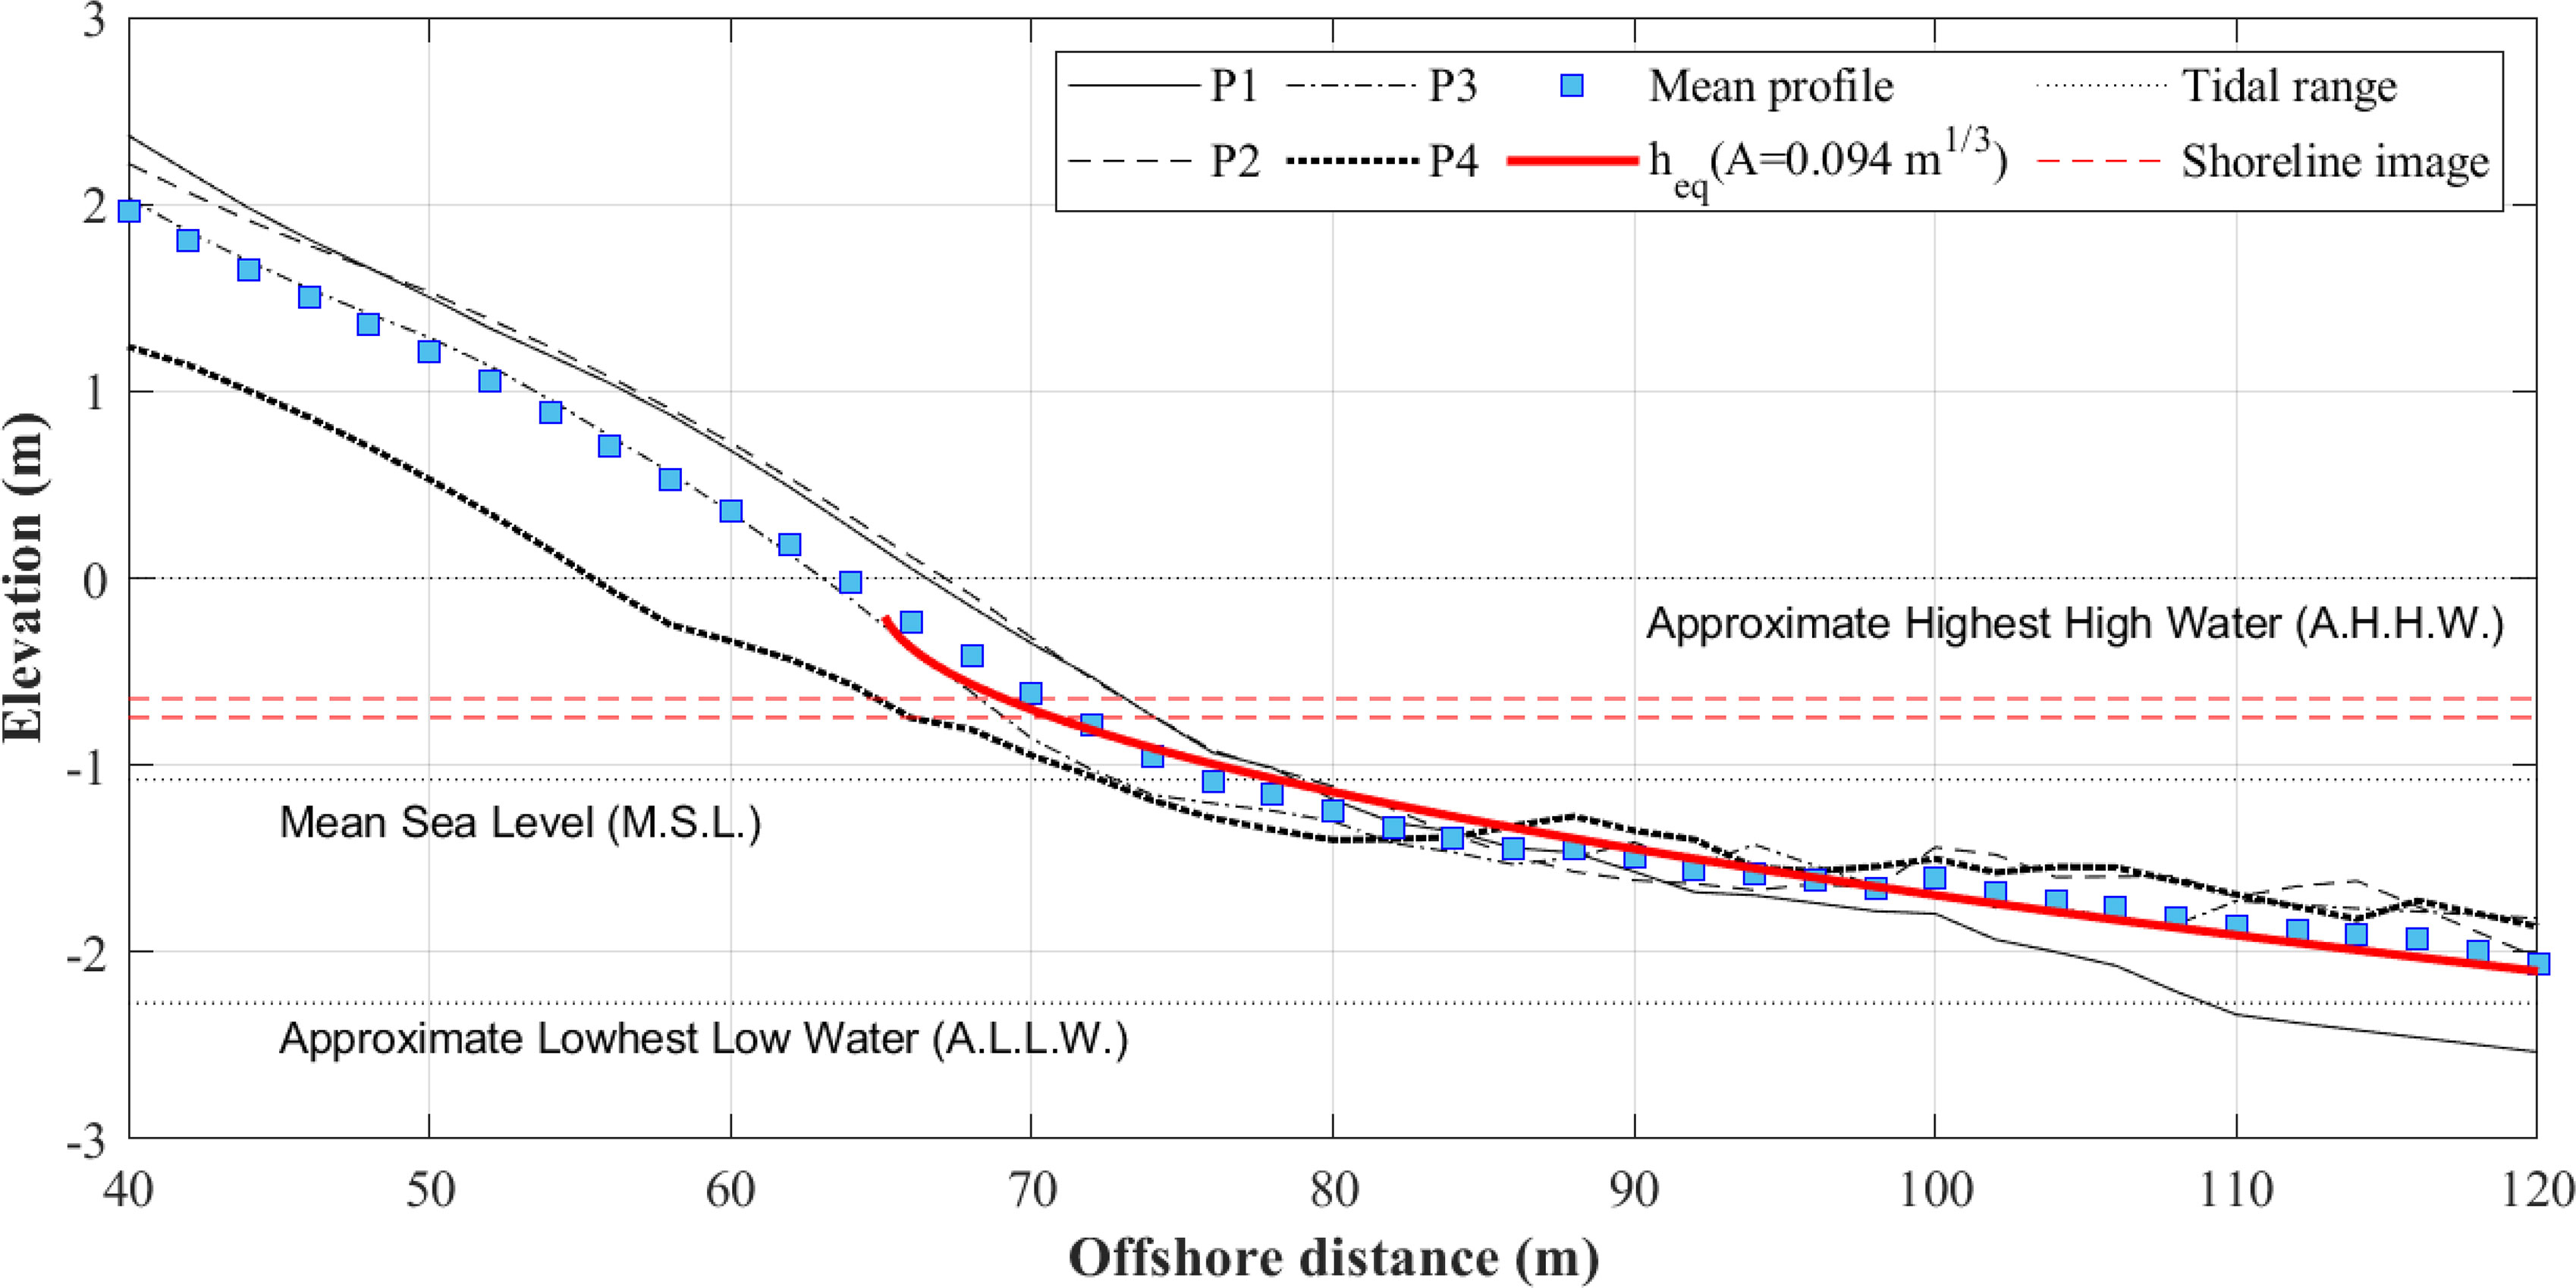
Supplementary Figure 3 shows the results of the equilibrium beach profile plotted on the beach profile data provided by “Shoreshop” (https://coastalhub.science/data) and shows the validity of the beach scale factor. Beach profile data were observed at four baselines (P1–P4) on March 15, 2001. By taking the average of the beach profile data, an EBP (heq) that best fits the beach scale factor of 0.094 m1/3 was obtained, as shown in Figure 7. Beach scale factor A of 0.094 m1/3 was applied to the LTT, which can represent the tidal environment, the beach scale factor A of 0.094 m1/3 was applied. This corresponds to median grain size (D50) of 0.18 mm.
Normal waves generally produce planar beach profiles. When high waves flow onto a planar beach, it naturally converges towards an equilibrium beach profile. The initial slope is determined using Eq. (14), which was proposed by Suh and Dalrymple (1988).
where hb is the breaking depth. The initial slope mi is set to 41, assuming hb = 2 m in consideration of the tidal range.
This BPCM can reproduce scarp and berm formation, for which the foreshore slope must be set. Kim et al. (2014) proposed an empirical formula for the equilibrium foreshore slope as a function of the wave period, and the median grain size as:
Furthermore, by applying experimental data performed on three indoor wave flumes, similar to Watanabe et al. (1980); Kajima et al. (1982), and Wise et al. (1996), the three parameters C, m, and n in Eq. (16) were determined to be 3.012, 0.416, and 0.122, respectively. Therefore, the foreshore slope (mf) can be conveniently estimated using only the information of the wave period and the sand median grain size (D50) in the foreshore as follows:
The convergence factor qr given in Eq. (12) is estimated using Eq. (18), which was proposed by Lim et al. (2021), to estimate the beach recovery factor using the beach scale factor.
The convergence factor qr = 0.047/day was estimated from a beach scale factor (A) of 0.094 m1/3. However, this is a calculation formula obtained for the eastern coast of Korea (tidal range <30 cm), which is a microtidal environment with little effect from tides; therefore, there may be errors in the tidal environment. Table 1 summarizes the input data used to simulate long-term shoreline response.
Comparison With Shoreline Position Data Extracted From CCTV
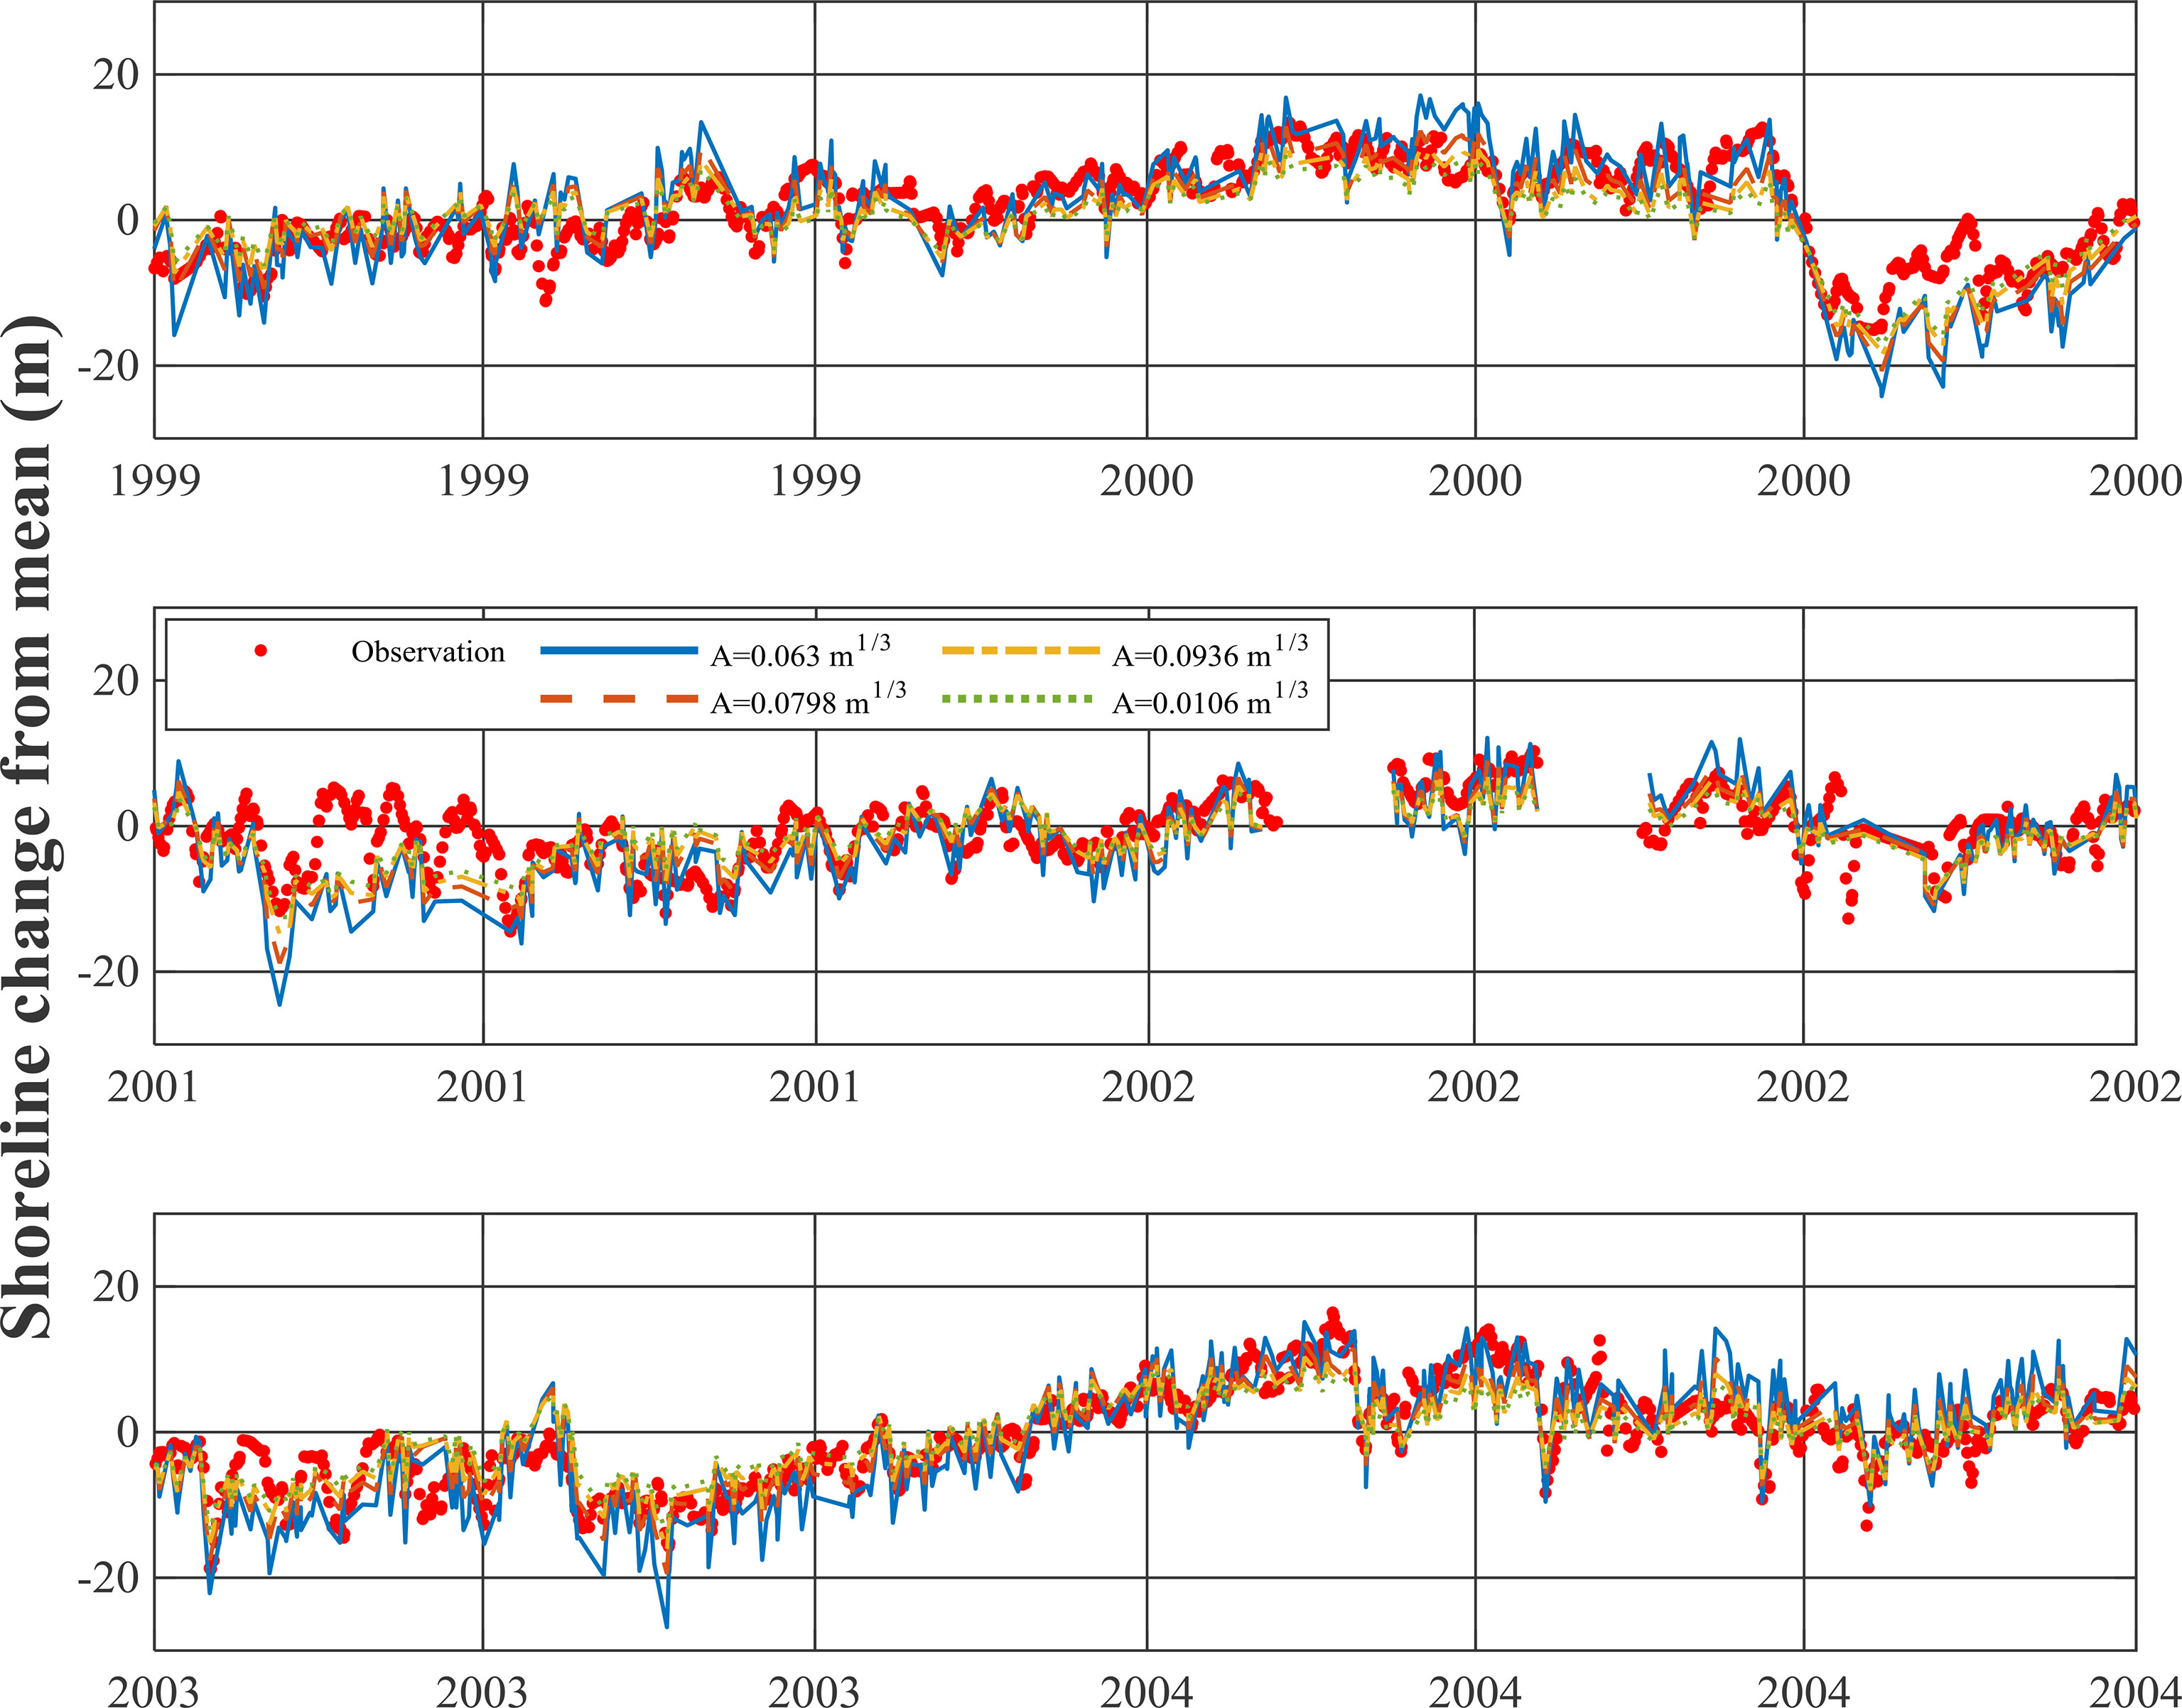
To compare the numerical results with the observed data, the BPCM was performed for six years from 1999 to 2004, and the effect of changes in the beach scale factor A, on the numerical results was investigated. Figure 8 shows a comparison with the observed results for four different A values of 0.063 m1/3, 0.080 m1/3, 0.094 m1/3, and 0.106 m1/3; suggesting that the numerical results change depending on the factor. The model is divided into three time periods (1999–2000, 2001–2002, and 2003–2004) with 2-year intervals. It can be confirmed that as the beach scale factor decreases, the range of shoreline fluctuation becomes more severe (Figure 8).
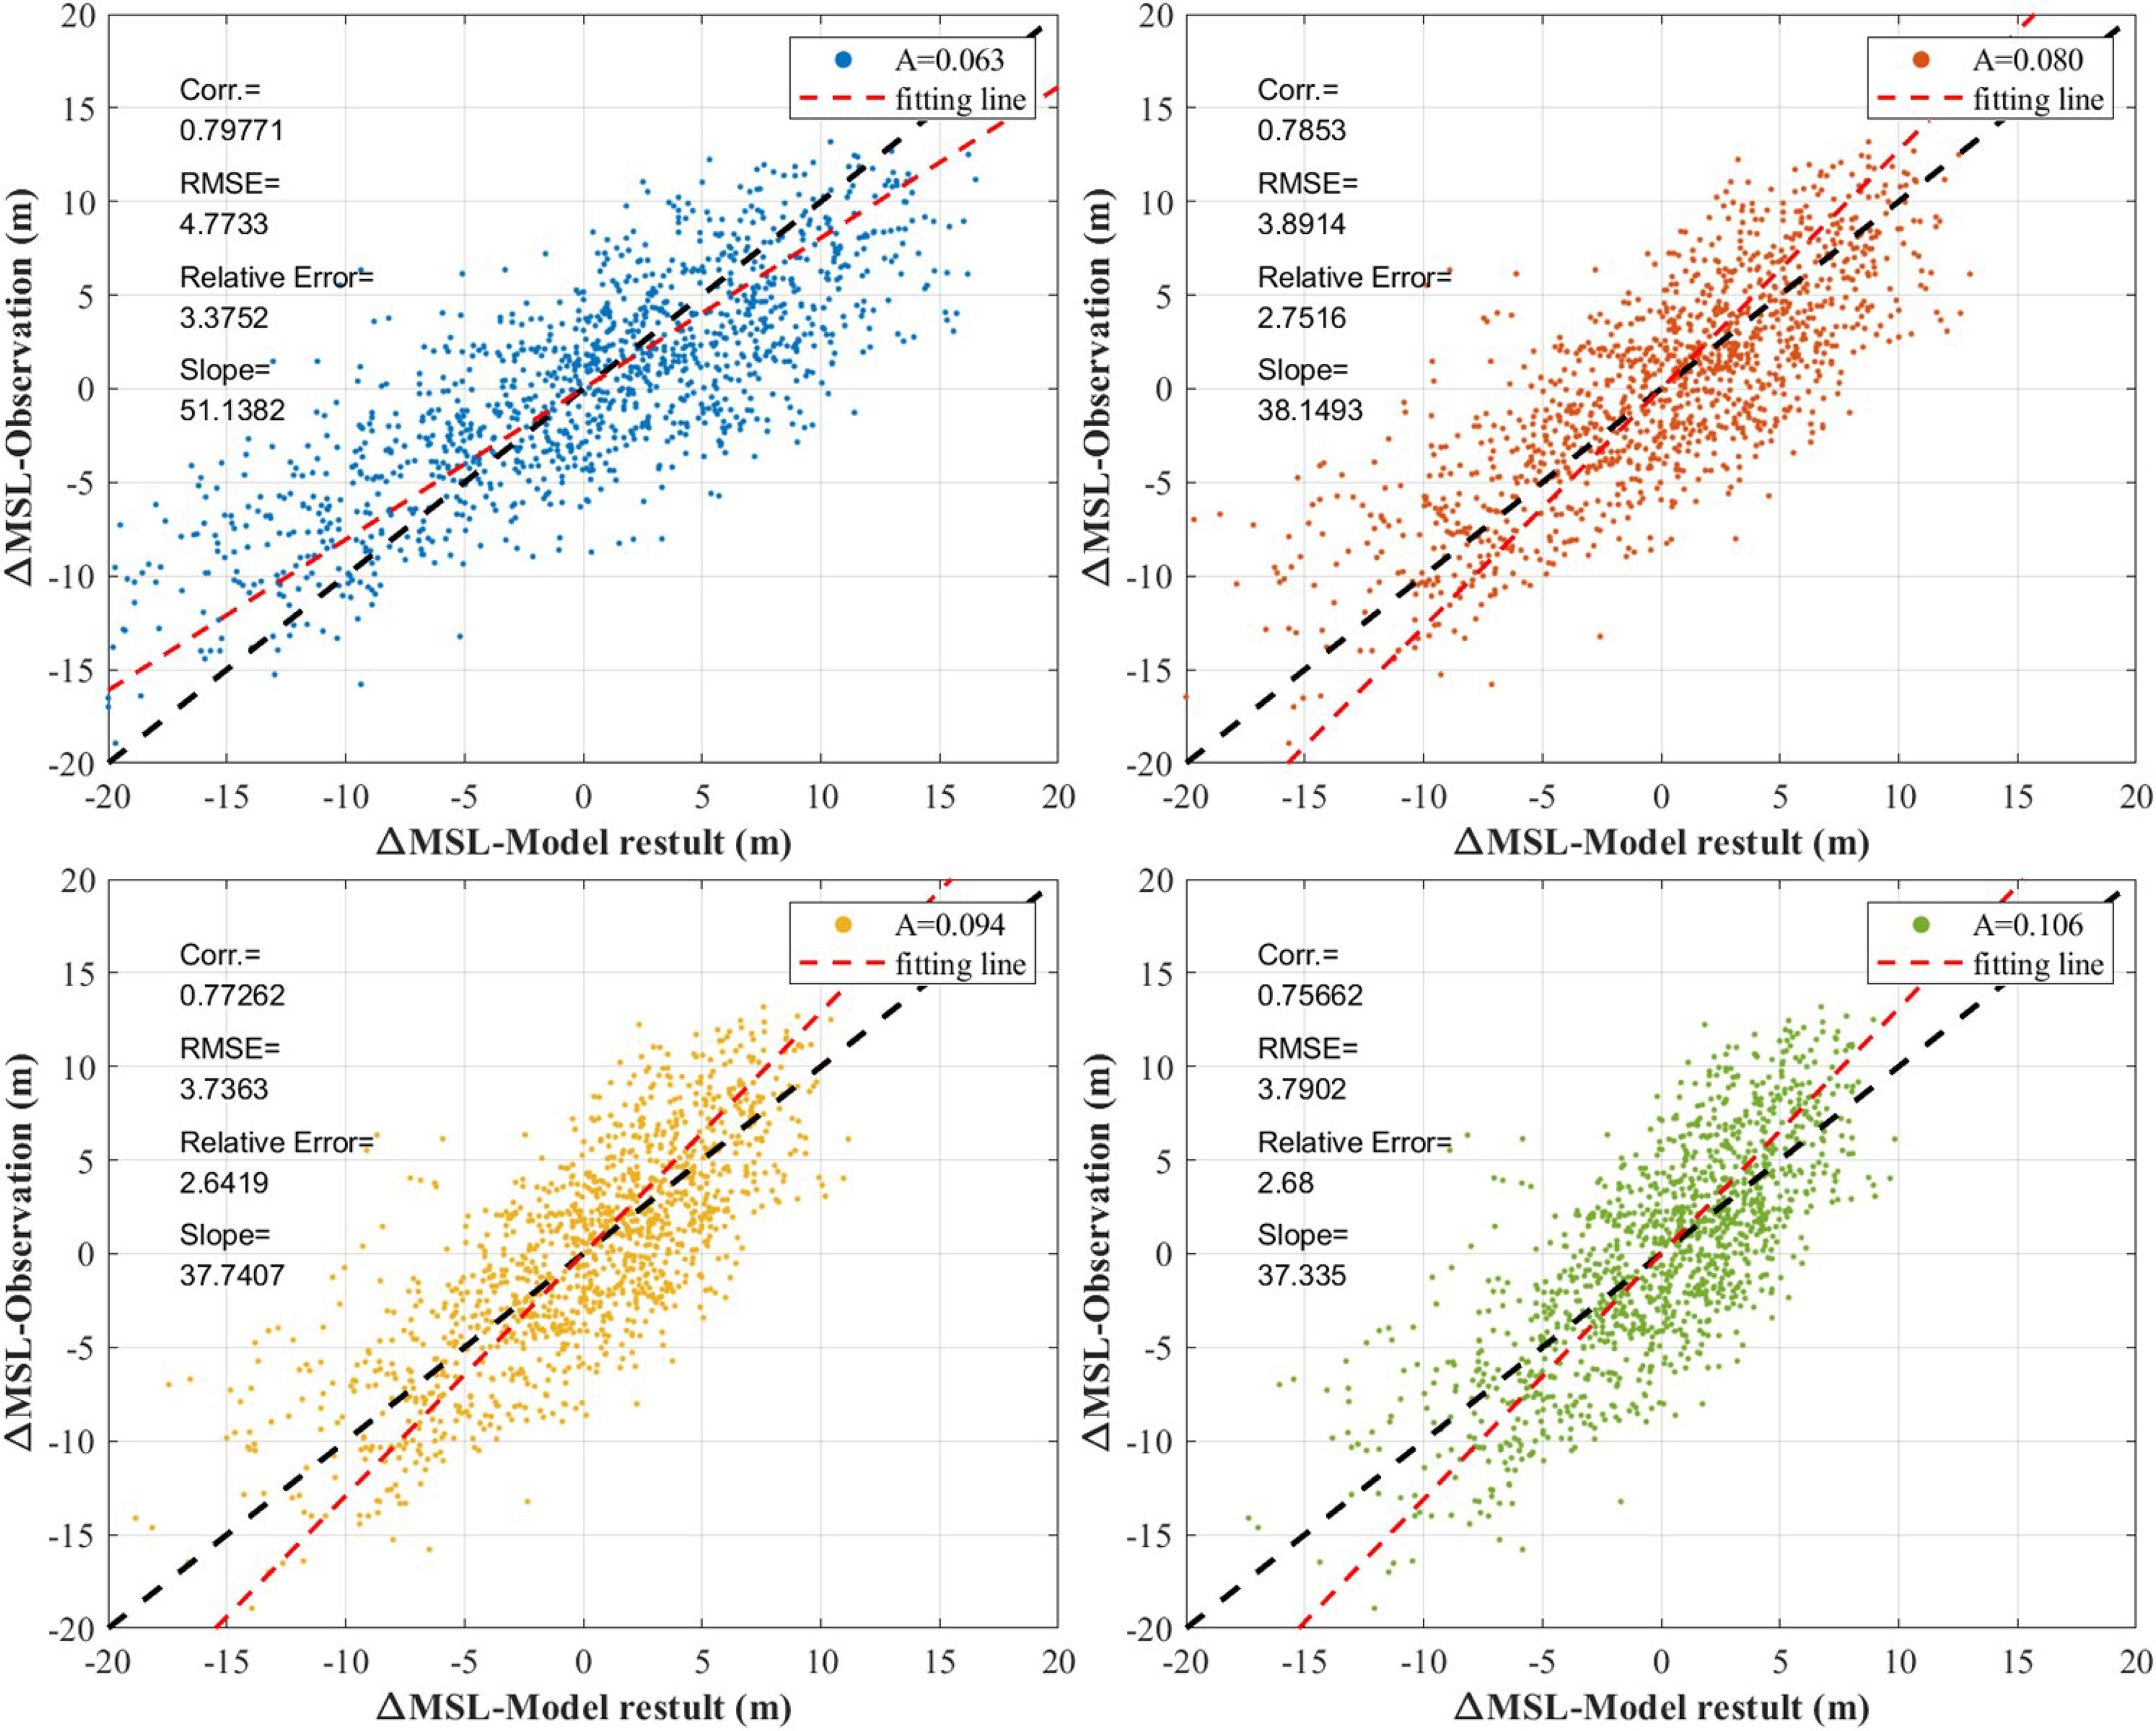
The only factor that affects the numerical values is the beach scale factor (A). The correlation coefficient (Rxy), root mean square error (RMSE), and slope θ of the fitting line were used as evaluation indicators to determine the level of similarity between the observed value and the numerical calculation value. Figure 9 shows the correlation distribution between the results of the shoreline position and the observed data according to four different beach scale factors and the fitting curves between them. The higher the correlation coefficient (Rxy), the lower the RMSE and the relative error; the closer the fitting curve slope is to 45°, the greater the similarity.
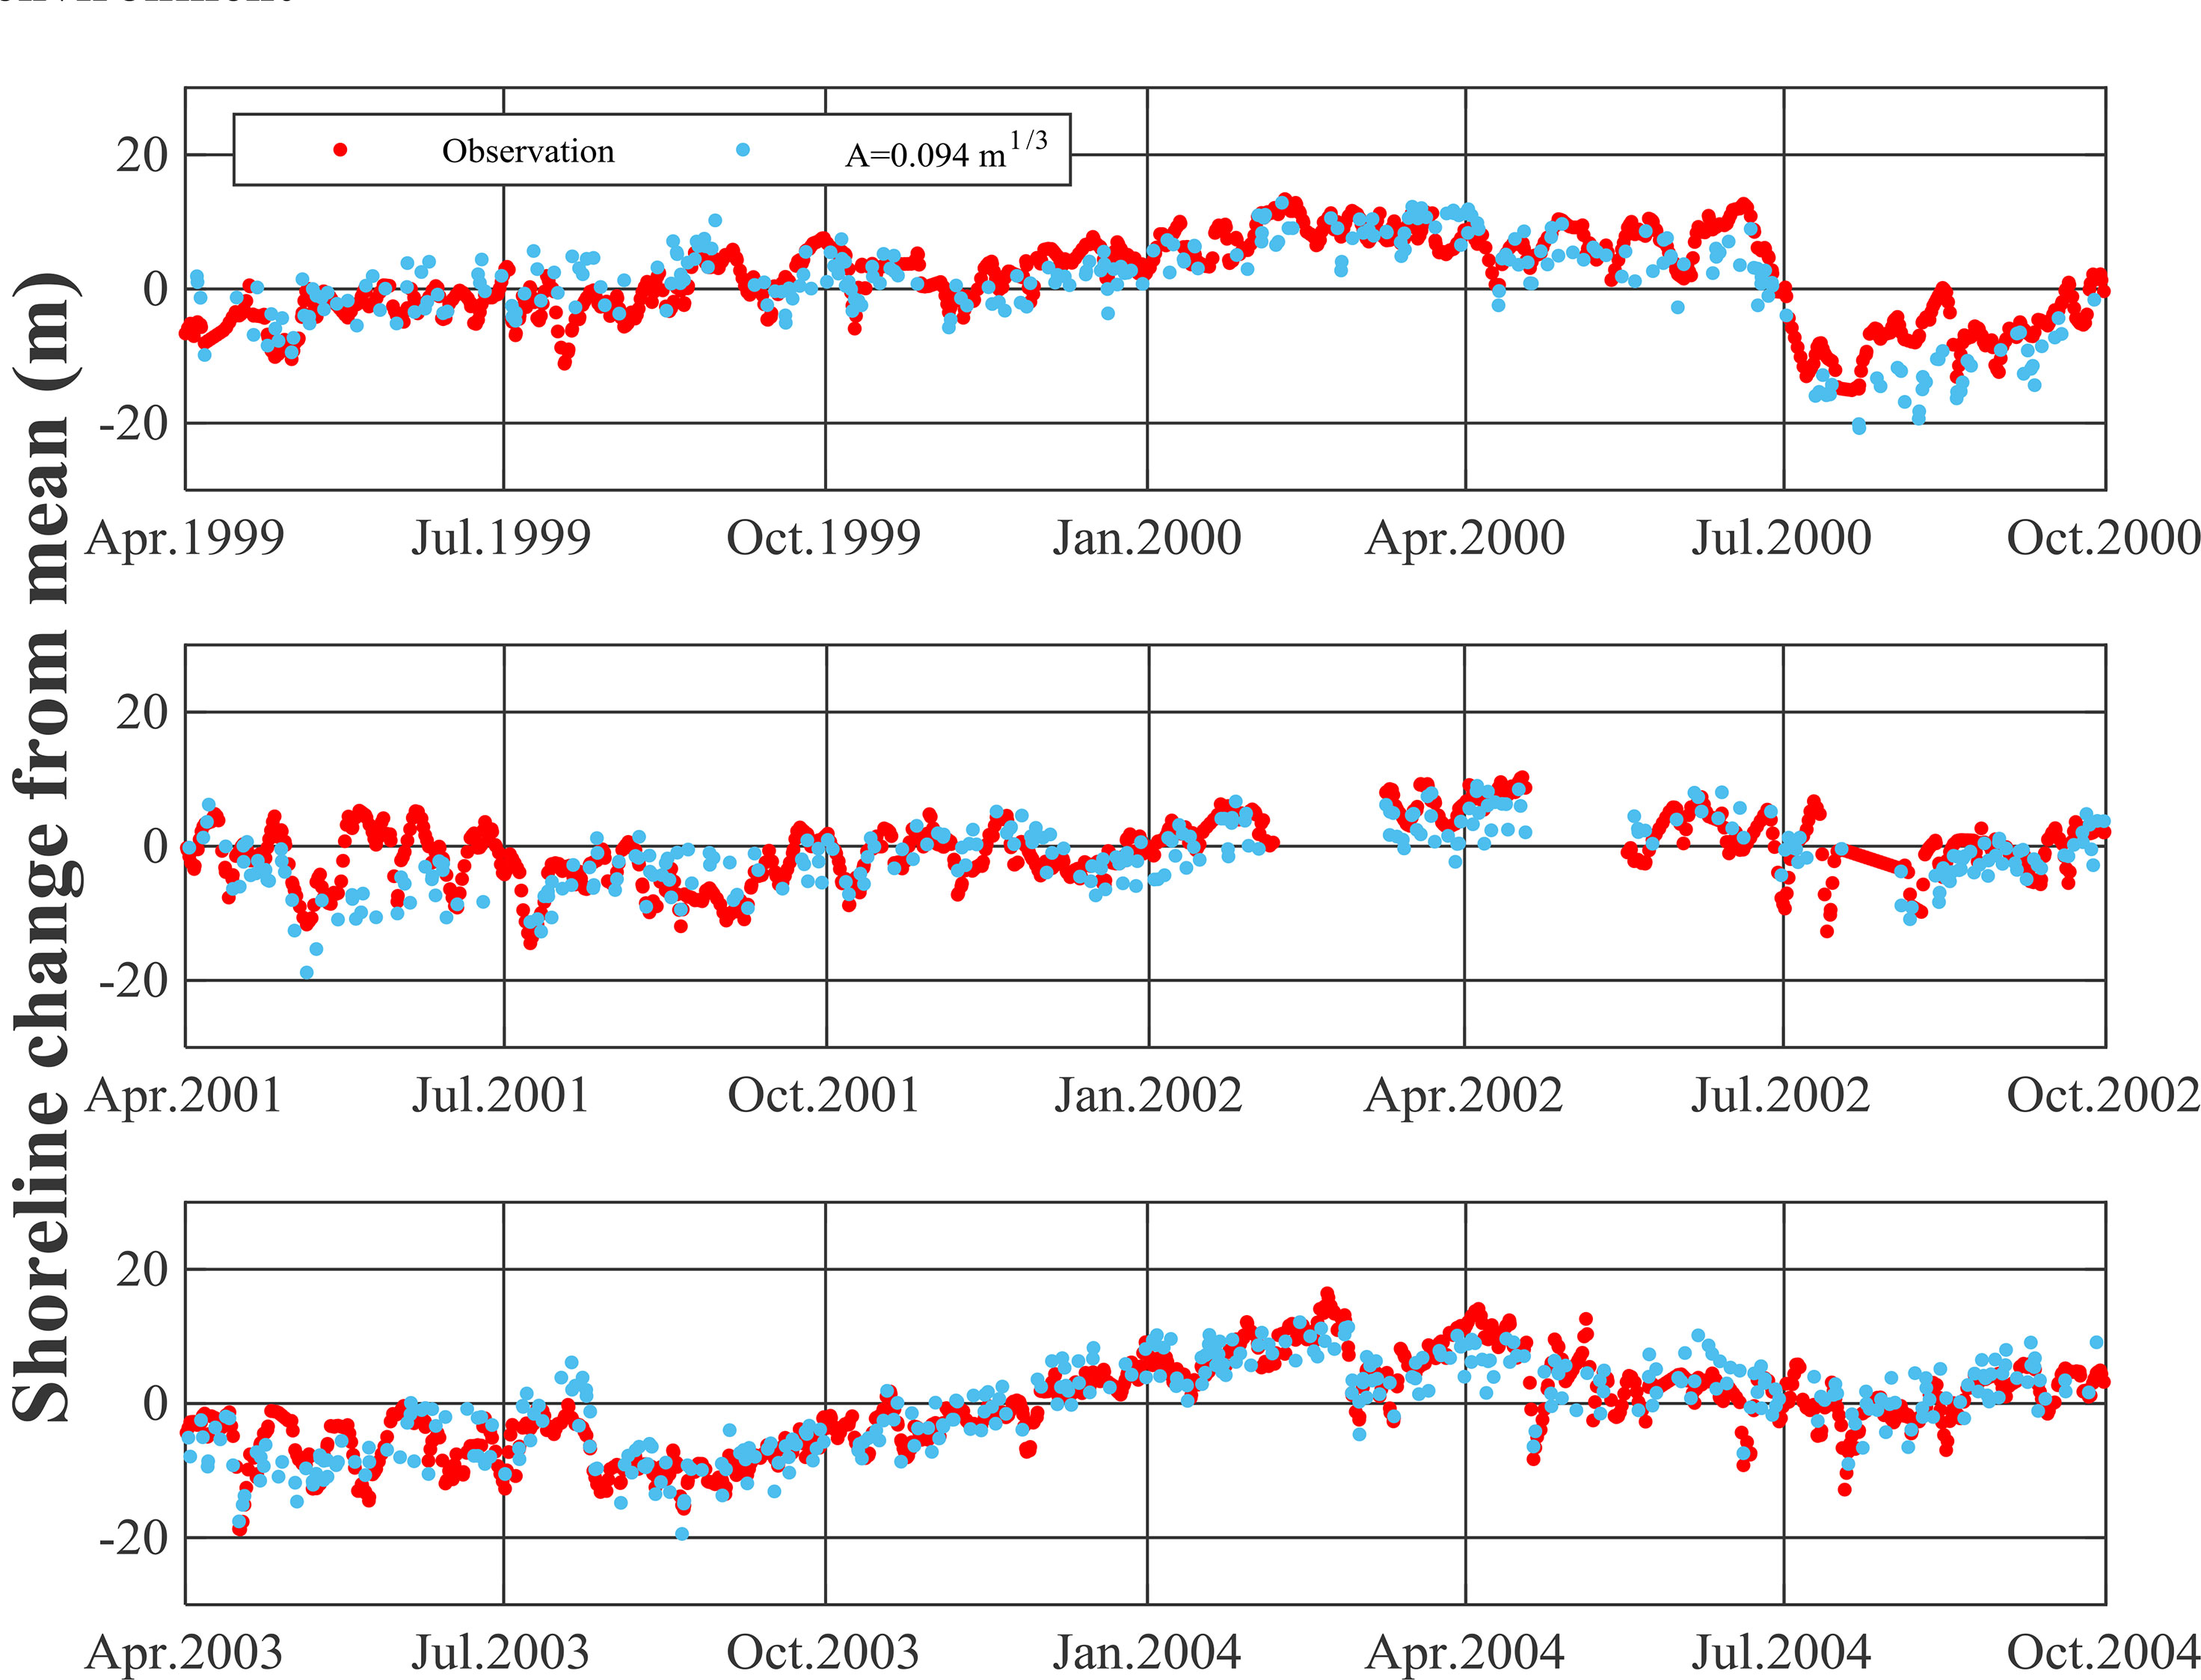
The results suggest that at the smallest RMSE and relative error of approximately 3.7 m and 2.6 m, respectively, the beach scale factor is 0.094 m1/3, whereas the beach scale factor showing the closest fitting line slope to 45° is 0.063 m1/3. And as the beach scale factor increased, the correlation also tended to increase, with the largest value at 0.063 m1/3. Figure 10 compares the results observed alone for the beach scale factor of 0.094 m1/3 with the numerical results (the smallest RMSE and relative error case).
Discussion
Bar Migration
Short-term beach profile data observed by van Maanen et al. (2008) were used to investigate the validity of the numerical model results for morphological changes along the beach cross-section from March 13 to 16, 2001. The measured bed elevation profiles show that the rate of onshore migration of the bar crest averaged 3.5 m/day. During the experiment, a beach profile was repeatedly measured up to a depth of 7 m below the mean sea level using an instrumented sea sled (Supplementary Figure 4A, B).
A pressure sensor deployed approximately 900 m offshore at a water depth of 10 m provided the offshore wave data necessary to force the model. The sensor measured the water pressure every 4 h for a 1 h period at a sampling frequency of 2 Hz. Supplementary Figure 5 shows the values of the root-mean-square wave height Hrms and zero-crossing wave period Tm02, which were only available every 4 h (Supplementary Figures 5A, B). Tidal elevation data were also recorded at a water depth of 10 m and were available every 30 min (Supplementary Figures 5C). The Hrms increased slowly from approximately 4.3 m to 0.65 m during observation, and Tm02 decreased from approximately 10 sec to 7 sec. The tide is a semidiurnal tide with a range of approximately 1.5 m. Simultaneously the video images taken at Tairua Beach showed waves breaking on the bar to be limited to low-tide conditions. The field site was monitored by a video camera mounted at the south end of the beach (70.5 m above the chart datum). The camera provided a snapshot and a 10-min time-exposure image every daylight hour (van Maanen et al., 2008).
Convergent Curves for Scarp and Bar Formation
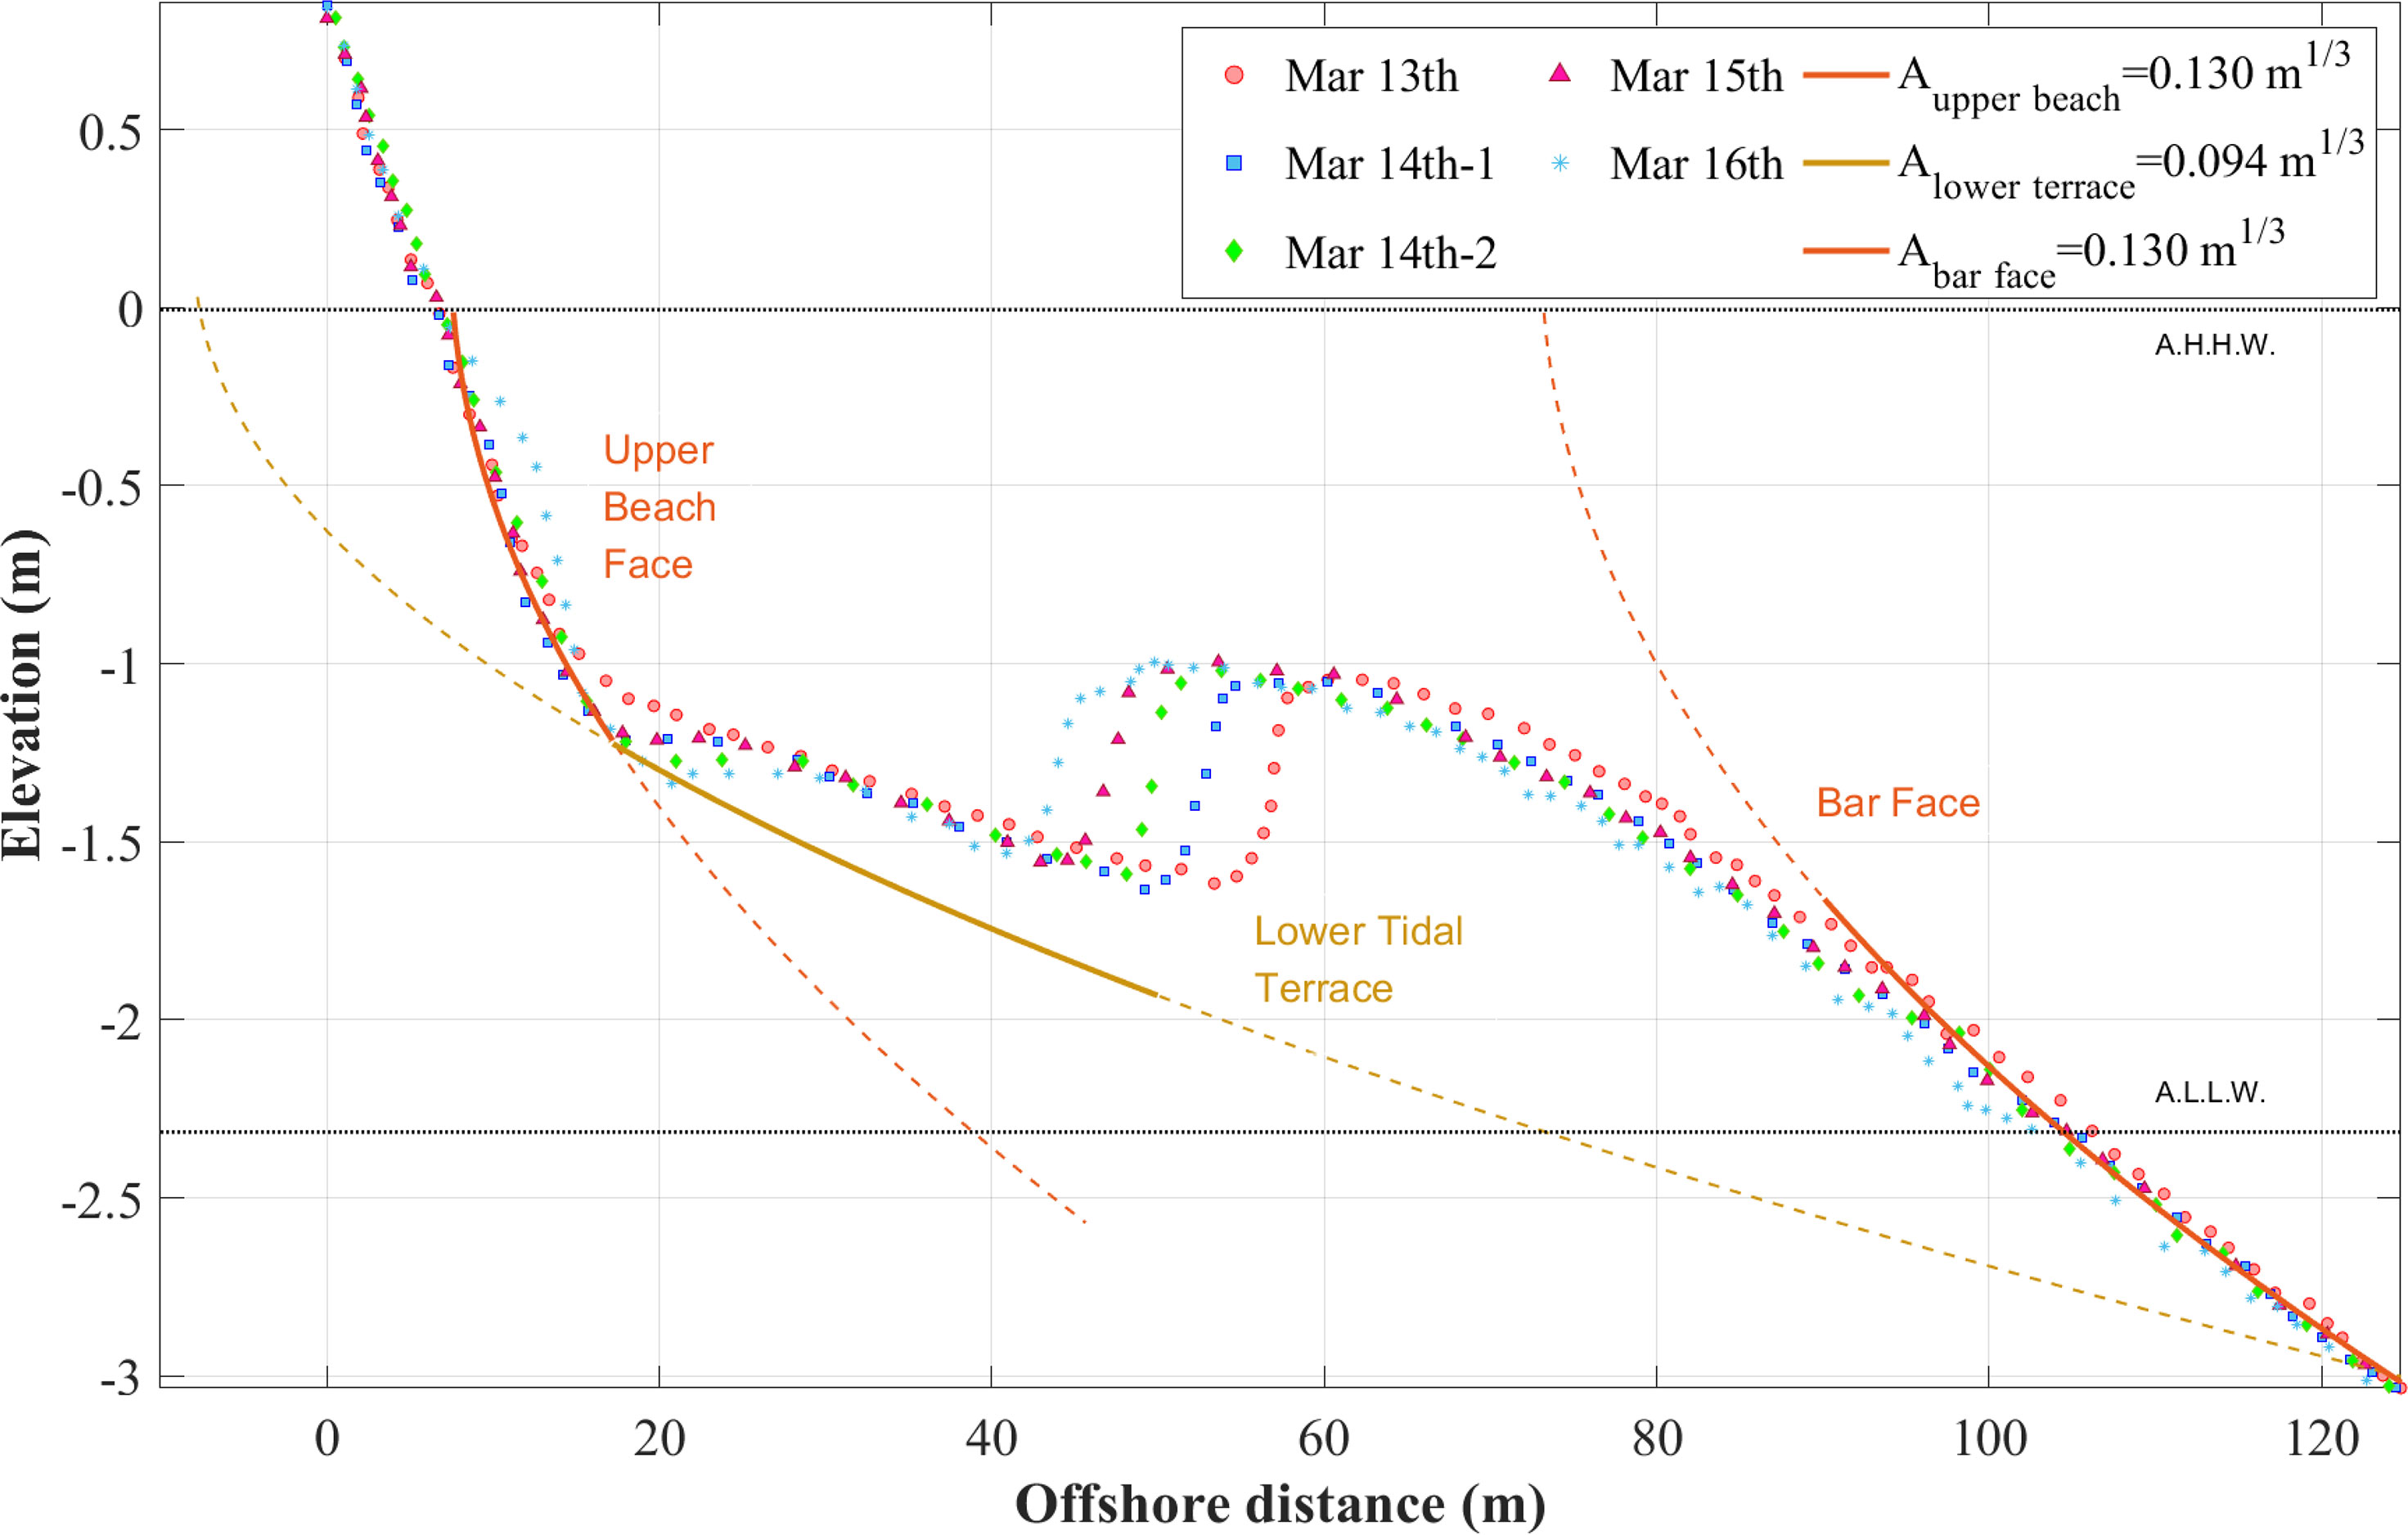
The beach profile data observed by van Maanen et al. (2008) show a UBF zone and an LTT zone, as shown in Figure 11, similar to the beach profile in any other tidal environment. The growth of the bar in Supplementary Figure 5 shows that as the waves become relatively calm after the storm event, coarse sands suspended from the UBF and moving seaward were deposited in the LTT, forming a bar, and growing toward the UBF. The beach scale factors of the beach profile that dominate UBF and LTT were evaluated to be 0.13 m1/3 and 0.094 m1/3, respectively (Supplementary Figure 5). These scale factors correspond to median particle diameters (D50) of 0.32 mm and 0.18 mm, respectively, in the table presented by Dean (1977). Based on the results, although there is a tidal range, the equilibrium beach profile can be applied from the approximate highest high water (A.H.H.W.). In addition, it also shows that the beach scale factor still follows the table of Dean (1977). This result is also applied to the west coast of Korea, where the tidal range is 5–10 m.
The bar that grows from LTT to UBF is similar to the process of developing the berm, which is formed by re-accumulating the suspended sand on the foreshore as the waves become calm, in contrast to the bar growing at the breaking point under the influence of the undertow in a no-tide environment. Therefore, the beach scale factor of the beach profile that dominates the shape of the bar follows 0.13 m1/3 corresponding to the UBF value rather than the beach scale factor A of the LTT, as shown in Figure 11.
Among the major local tidal constituents, the principal lunar semi-diurnal tide (M2) and the principal solar semi-diurnal tide (S2) are factors that affect 99% of tides (Defant, 1961; MacMillan, 1966; Neumann and Pierson, 1966). Therefore, tide fluctuations can be expressed as M2 and S2 constituents (Hardisty, 2007). An M2 of 1.9 m and S2 of 0.4 m were reported at Tairua Beach (Green, 1994; Zhi, 2014).
Numerical Results
Using the BPCM, it was simulated that a steep slope UBF is generated while converging to an equilibrium beach profile under storm duration from an initial slope of 1:41, and a bar is formed similar to the process in which a berm is formed toward the corresponding EBF as the wave condition becomes milder. Table 2 summarizes the input data required for BPCM simulation.
Figure 12A shows the BPCM results assuming that the storm and normal wave conditions in Table 2 are continuously applied. It shows the model result in which a double slope is formed under the storm wave condition before the bar is created. The double slopes of the UBF and LTT were reproduced by varying the beach scale factors.
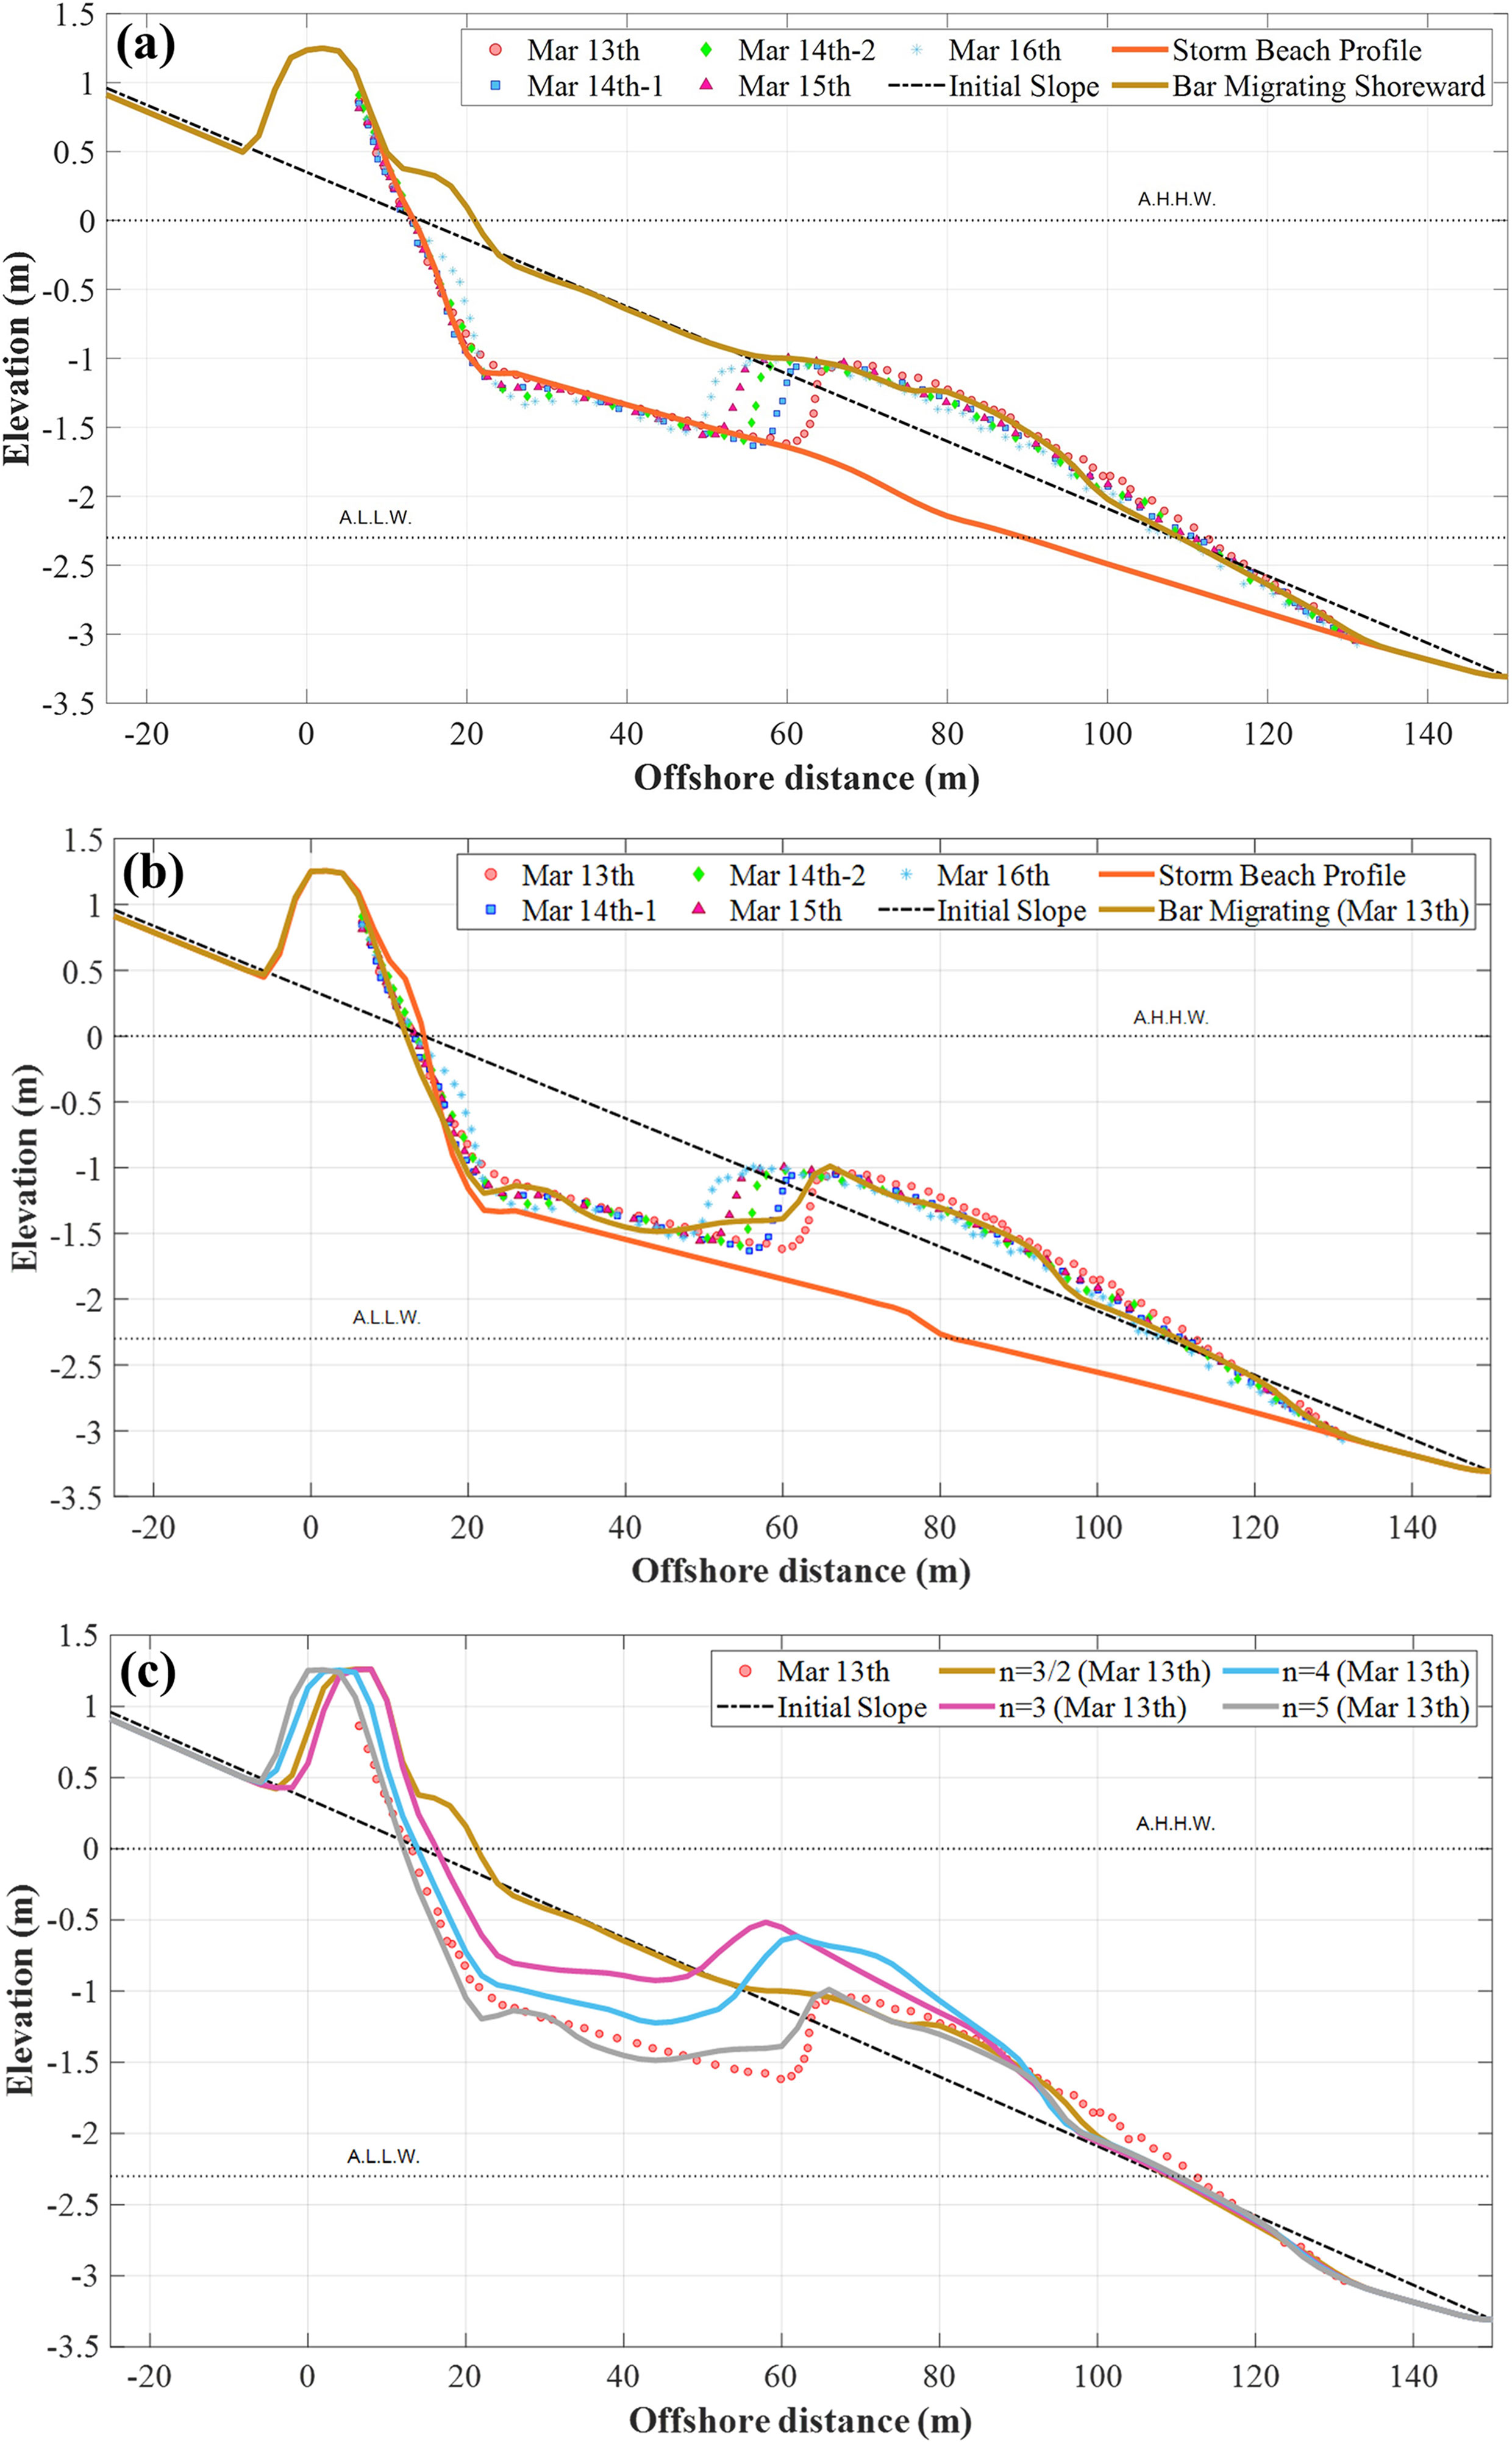
Figure 12 (A) Model results of scarp and bar formation from initial slope, (B) model results simulated with 5th power in Eq. (12) and (C) variation of bar shape according to n value.
Owing to the storm wave incidence, the intersection where the double slope appears is formed at a lower level than the MSL. However, the reproduction of the longshore bar formed at the breaking point of the storm beach under a storm wave cannot be reproduced in the BPCM model. However, it is difficult to observe this in a tidal environment. Figure 12A also shows the model results at the observation starting on March 13, as an environment was created in which the sands escaping from the UBF were deposited while the milder wave condition continued. However, the model result shows a berm formation rather than a bar shape, possibly due to excessive deposition.
In Eq. 12, h3/2 was taken for ; however, the deposition amount can be adjusted by taking the nth power, which is a different value from the (3/2)th power, and satisfactory results were obtained when n=5. Figure 12B shows the model results simulated with the 5th power, showing results similar to the bar shape at the time of the observation starting on March 13. It was found that the bar shape measured on Mar 13th was simulated relatively well by applying a beach scale factor of 0.13 m1/3 on the LTT zone. Figure 12C shows the shape of the bar that varies according to the value of n. As n increased, the dominant depth zone for generating the bars was limited.
The reproducibility of this water depth change model was verified using data observed from March 13 to 16, 2001 at Tairua Beach, whereas the initial depth was obtained from a beach profile observed on March 13, 2001. Figure 13 shows a comparison of the numerical results with the observed beach profiles. The numerical model simulates bar migration shoreward over time. The front side of the bar moved forward to the shore; however, the speed was underestimated differently from the observed results. In addition, the seaward berm formation on the UBF appears to be well reproduced. The model results were obtained using the 5th power in Eq. (12).
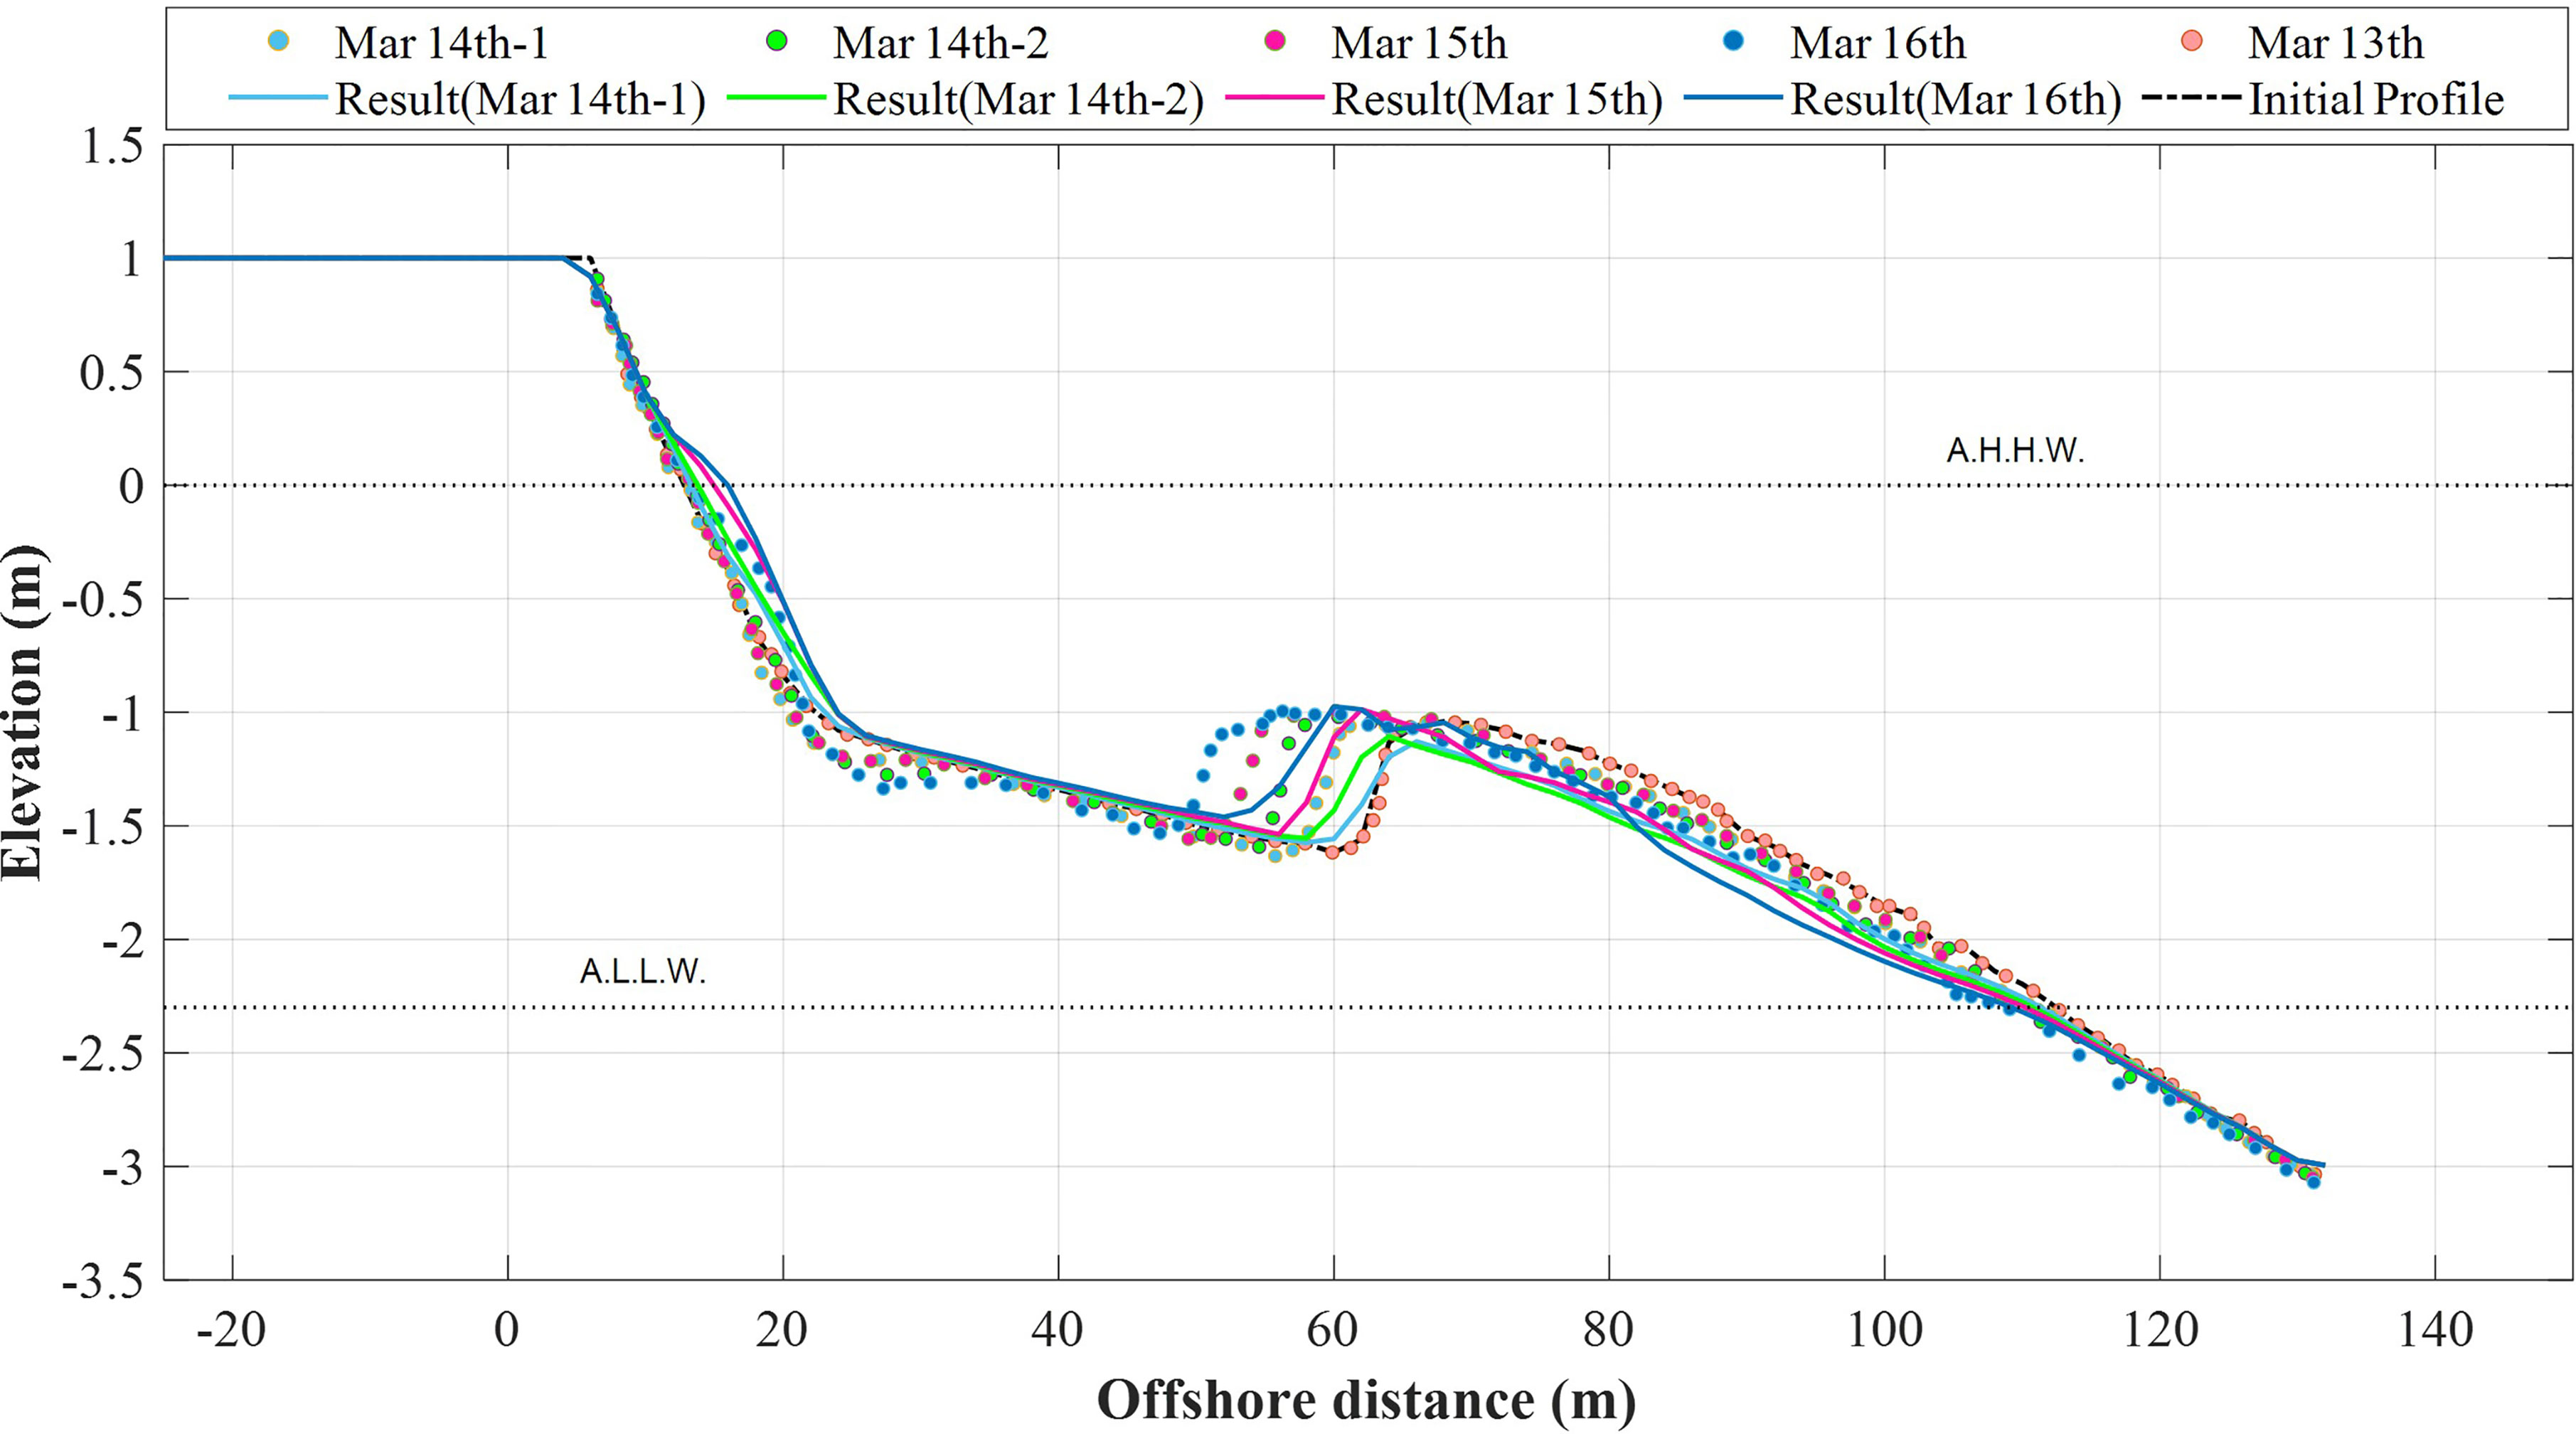
Figure 13 Observed data (symbols) and model (solid line) of beach profile versus cross-shore distance.
Conclusions
A model has been established that can simulate changes in the beach profile over several decades with time steps from several seconds to several hours, regardless of the time interval of wave information. This provides a means to predict the long-term changes in the beach profile if there is a predicted scenario of the model input data for the rise in wave height or sea level due to climate change.
This study applied this model, with results showing a correlation of 77% and an RMSE of 3.7 m when comparing the observed data of shoreline position at Tairua Beach in New Zealand, which had a tidal range of 2–3 m, with the model results proposed in this study. Compared to the shoreline response model of Lim et al. (2021), which ignores the influence of the berm and tides, the present model requires a slightly longer computing time and shows higher reproducibility of model results.
The model presented in this study is based on the shoreline position response model of the ODE governing equation, which converges to the equilibrium erosion width, which is the maximum erosion width ideally formed by the continuous incidence of the same wave energy as the shoreline position as a variable. However, in contrast to the ODE governing equation, the governing equation of the model presented in this study uses water depth as a variable and converges to the equilibrium beach profile set in the surf zone according to the breaking wave height. This idea is consistent with the fact that the beach response coefficient ar, as suggested by Yates et al. (2009), can be derived from the equilibrium beach profile formula, as revealed by Kim et al. (2021) and Lim et al. (2021).
The unique beach convergence coefficient (qr) in BPCM is related to the beach recovery coefficient (kr), one of the two coefficients in the shoreline response model, and is a constant that can be extracted from the sand grain size. However, it is assumed that the same value is applied only within the surf zone and decreases with water depth in the offshore area outside the breaking zone. The beach recovery factor is a constant whose unit is the reciprocal of time-related to the property of the suspended sediment to return to its original location. The role of the other beach response coefficients is replaced by allowing the water depth to converge to an equilibrium beach profile in the surf zone.
Satisfactory results were obtained by comparing shoreline observation data at Tairua Beach, New Zealand, which has a micro-tidal range, with the long-term shoreline response model of this study. In addition, we comparatively analyzed short-term observational data to examine our ability to simulate changes in beach profiles more closely. In the tidal environment, it was confirmed that a double slope was formed under the storm wave condition before the bar was created, and the reinforcing bar migrated by the recovery process of sediments suspended from the UBF as the wave height became mild.
Data Availability Statement
Publicly available datasets were analyzed in this study. This data can be found here: https://coastalhub.science/data.
Author Contributions
SL: conceptualization, acquisition of data, visualization, and writing – original draft and editing. CL: acquisition of data, visualization, and writing – editing. J-LL: conceptualization, supervision, validation, and writing – original draft and review. All authors contributed to the article and approved the submitted version.
Funding
This research was part of the “Practical Technologies for Coastal Erosion Control and Countermeasure” project supported by the Ministry of Oceans and Fisheries, Korea (Grant No. 20180404).
Conflict of Interest
The authors declare that the research was conducted in the absence of any commercial or financial relationships that could be construed as a potential conflict of interest.
Publisher’s Note
All claims expressed in this article are solely those of the authors and do not necessarily represent those of their affiliated organizations, or those of the publisher, the editors and the reviewers. Any product that may be evaluated in this article, or claim that may be made by its manufacturer, is not guaranteed or endorsed by the publisher.
Supplementary Material
The Supplementary Material for this article can be found online at: https://www.frontiersin.org/articles/10.3389/fmars.2022.831262/full#supplementary-material
Supplementary Figure 1 | Study site. (A) Location of Tairua, New Zealand North Island (B) detail of Tairua Beach. Pressure sensor (S4_N) location used for SWAN model validation (Montaño et al., 2020).
Supplementary Figure 2 | Input conditions. (A) Significant wave height (B) mean wave period (C) wave direction (Montaño et al., 2020).
Supplementary Figure 3 | Information related to beach profile observation data (https://coastalhub.science/data).
Supplementary Figure 4 | (A) Instrumented sled used during the experiment at Tairua Beach. (B) Time averaged video image of Tairua Beach during the experiment. Measurements were taken in the cross-shore transect as indicated by the black line (van Maanen et al., 2008).
Supplementary Figure 5 | Measured (A) wave height Hrms and offshore zero crossing (B) wave period Tm02, and (C) tidal elevation during the experiment (van Maanen et al., 2008).
References
Bernabeu A. M., Raúl M., Cesar V. (2003). An Equilibrium Profile Model for Tidal Environments. Sci. Marina 66 (4), 177–198. doi: 10.3989/scimar.2002.66n4325
Blossier B., Bryan K. R., Daly C. J., Winter C. (2016). Nearshore Sandbar Rotation at Single-Barred Embayed Beaches. J. Geophys. Res. Ocean 121, 2286–2313. doi: 10.1002/2015JC011031
Blossier B., Bryan K. R., Daly C. J., Winter C. (2017). Shore and Bar Cross-Shore Migration, Rotation, and Breathing Processes at an Embayed Beach. J. Geophys. Res. Earth Surf. 122, 1745–1770. doi: 10.1002/2017JF004227
Bodge K. R. (1992). Representing Equilibrium Beach Profiles With an Exponential Expression. J. Coastal Res. 8 (1), 47–55.
Bogle J. A., Bryan K. R., Black K. P., Hume T. M., Healy T. R. (1999). “Observations of Geomorphic Parameters Using Video Images. Coasts and Ports ‘99,” in Proceedings of the 14th Australasian Coastal and Ocean Engineering conference and the 7th Australasian Port and Harbour Conference, , April 14–16, Vol. vol I. 70–75(Perth, Australia).
Bruun P. (1954). Coast Erosion and the Development of Beach Profiles, Beach Erosion Board Technical Memorandum. No. 44. U.s (Vicksburg, MS: Army Engineer Waterways Experiment Station).
Callaghan D. P., Saint-Cast F., Nielsen P., Baldock T. E. (2006). Numerical Solutions of the Sediment Conservation Law; a Review and Improved Formulation for Coastal Morphological Modeling. Coastal Eng. 53 (7), 557–571. doi: 10.1016/j.coastaleng.2006.03.001
Dean R. G. (1977). Equilibrium Beach Profiles: U.s. Atlantic and Gulf Coasts, Technical Report No. 12, Newark, DE: Department of Civil Engineering (University of Delaware).
Dean R. G. (1987). Coastal Sediment Processes: Toward Engineering Solutions. Proceedings of the Specialty Conference on Coastal Sediments ‘87 ( New York: American Society of Civil Engineers), 1–24.
Dean R. G. (1991). Equilibrium Beach Profiles: Characteristics and Applications. J. Coastal Res. 7 (1), 53–84.
Deltares (2018). Delft3D-FLOW User Manual: Simulation of Multidimensional Hydrodynamic Flows and Transport Phenomena Including Sediments (The Netherlands: Deltares).
Fang Y., Ron J. C. (2013). Modelling Coastal Process for Long-Term Shoreline Change, Proceeding of Coast and Ports 2013 Conference. (Sydney: National Committee for Coastal and Ocean Engineering).
Green J. P. B. (1994). “Estuarine Enclosed Beaches and the Geomorphic Processes Affecting Their Morphology,” in Master of Science (Geography) Thesis (Tairua Estuary, New Zealand: University of Auckland).
Hanson H. H., Larson M., Kraus N. C. (2010). Calculation of Beach Change Under Interacting Cross- Shore and Longshore Processes. Coastal Eng. 57 (6), 610–919. doi: 10.1016/j.coastaleng.2010.02.002
Hardisty J. (2007). Estuaries: Monitoring and Modelling the Physical System (Oxford: Blackwell Publishing).
Kajima R., Shimizu T., Maruyama K., Saito S. (1982). “Experiments on Beach Profile Change With a Large Wave Flume,” in International Conference on Coastal Engineering. (Cape Town: ASCE) 1385–1404.
Kim H., Kevin H., Jin J. Y., Park G. S., Lee J. (2014). Empirical Estimation of Beach-Face Slope and its Use for Warning of Berm Erosion. J. Meas. Eng. 2 (1), 29–42.
Kim T. K., Lim C., Lee J. L. (2021). Vulnerability Analysis of Episodic Beach Erosion by Applying Storm Wave Scenarios to a Shoreline Response Model. Front. Mar. Sci. 8. doi: 10.3389/fmars.2021.759067
Komar P. D., McDougal W. G. (1994). The Analysis of Exponential Beach Profiles. J. Coastal Res. l0 (l), 56–69.
Larson M. (1991). “Equilibrium Profile of a Beach With Varying Grain Size,” in Sediments ‘91 (New York: American Society of Civil Engineers), 905–919.
Larson M., Kraus N. C. (1989). “SBEACH: Numerical Model for Simulating Storm-Induced Beach Change,” in Report 1 Empirical Foundation and Model Development, Technical Report, CERC-89(9) (Vicksburg: US Army Corps of Engineering).
Larson M., Kraus N. C., Byrnes M. R. (1999). “SBEACH: Numerical Model for Simulating Storm-Induced Beach Change,” in Report 2 Numerical Formulation and Model Tests. Technical Report. CERC-89(9), 116.
Lesser G. R., Roelvink J. A., van Kester J. A. T. M., Stelling G. S. (2004). Development and Validation of a Three-Dimensional Morphological Model. Coastal Eng. 51, 883–915. doi: 10.1016/j.coastaleng.2004.07.014
Lim C., Kim T. K., Lee J. L. (2021). Evolutionary Response of Shoreline Position Inferred by Horizontal Behavior of Suspension and Recovery Processes of Wave-Driven Sediments Shoreline Response Induced by Spatial Suspension and Recovery Processes of Wave-Induced Sediments. Geomorphology. Submitted for review.
Margvelashvili N., Saint- Cast F., Condie S. (2008). Numerical Modeling of the Suspended Sediment Transport in Torres Strait. Cont. Shelf Res. 28 (16), 2241–2256. doi: 10.1016/j.csr.2008.03.037
Miller J. K., Dean R. G. (2004). A Simple New Shoreline Change Model. Coastal Eng. 51 (7), 531–556. doi: 10.1016/j.coastaleng.2004.05.006
Montaño J., Coco G., Antolnez J. A. A., Beuzen T., Bryan K. R., Castelle L., et al. (2020). Blind Testing of Shoreline Evolution Models. Sci. Rep. 10, 2137. doi: 10.1038/s41598-020-59018-y
Nam P. T., Larson M., Hanson H., Hoan L. X. (2009). Numerical Model of Nearshore Waves, Currents, and Sediment Transport. Coastal Eng. 56 (11-12), 1084–1096. doi: 10.1016/j.coastaleng.2009.06.007
Neumann G., Pierson W. J. (1966). Principles of Physical Oceanography (Englewood Cliffs: Prentice-Hall), 230–233.
Pender D., Karunarathna H. (2013). A Statistical Process-Based Approach for Modelling Beach Profile Variability. Coastal Eng. 81 (2013), 19–29. doi: 10.1016/j.coastaleng.2013.06.006
Requejo S., Medina R., González M. (2006). “Equilibrium Beach Profile for Refraction-Diffraction Areas,” in Coastal Dynamics 2005: State of the Practice. (Barcelona: ASCE) 1–13.
Roelvink D., Reniers A., van Dongeren A., Van Thiel de Vries J., McCall R., Lescinsky J. (2009). Modelling Strom Impacts on Beaches, Dunes and Barrier Islands. Coastal Eng. 56, 1133–1152. doi: 10.1016/j.coastaleng.2009.08.006
Smith R. K., Bryan K. R. (2007). Monitoring Beach Face Volume With a Combination of Intermittent Profiling and Video Imagery. J. Coast. Res. 234, 892–898. doi: 10.2112/04-0287.1
Suh K. D., Dalrymple R. A. (1988). Expression for Shoreline Advancement of Initially Plane Beach. J. Waterw. Port Coastal Ocean Eng. 114 (6), 770–777. doi: 10.1061/(ASCE)0733-950X(1988)114:6(770)
Sunamura T. (1975). A Study of Beach Ridge Formation in Laboratory. Geog. Rev. Jpn. 48 (11), 761–767. doi: 10.4157/grj.48.761
Swart D. H. (1974). “A Schematization of Onshore- Offshore Transport,” in Proceedings of the Fourteenth International Conference on Coastal Engineering (Copenhagen: American Society of Civil Engineers), 884.
Thieler E. R., Pilkey O. H., Young R. S., Bush D. M., Chai F. (2000). The Use of Mathematical Models to Predict Beach Behavior for U.s. Coastal Engineering: A Critical Review. J. Coastal Res. 16 (1), 48–70.
van Maanen B., de Ruiter P. J., Coco G., Bryan K. R., Ruessink B. G. (2008). Onshore Sandbar Migration at Tairua Beach (New Zealand): Numerical Simulations and Field Measurements. Mar. Geol. 253, 99–106. doi: 10.1016/j.margeo.2008.05.007
Wang H., Dalrymple R. A., Shiau J. C. (1975). “Computer Simulation of Beach Erosion and Profile Modification Due to Waves,” in Proceedings of the 2nd. Annual Symp. Of Waterways, Harbours and Coastal Eng. Div. ASCE on Modeling Techniques(Modeling ‘75, San Franc), vol. 2. (San Francisco: ASCE) 1369–1384.
Wang P., Kraus N. C. (2005). Beach Profile Equilibrium and Patterns of Wave Decay and Energy Dissipation Across the Surf Zone Elucidated in a Large-Scale Laboratory Experiment. J. Coastal Res. 21 (3), 522–534. doi: 10.2112/03-003.1
Watanabe A., Riho Y., Horikawa K. (1980). “Beach Profiles and on-Offshore Sediment Transport,” in International Conference on Coastal Engineering. (Sydney: ASCE) 1106–1121.
Wise R. A., Smith S. J., Larson M. (1996). “SBEACH: Numerical Model for Simulating Storm-Induced Beach Change: Report 4 Cross-Shore Transport Under Random Waves and Model Validation With Supertank and Field Data,” in Coastal Engineering Technical Report Cerc-89-9. (Vicksburg: US Army Corps of Engineering)
Wright L. D., Short A. D. (1984). Morphodynamic Variability of Surf Zones and Beaches: A Synthesis. Mar. Geol. 56, 93–118. doi: 10.1016/0025-3227(84)90008-2
Wright L. D., Short A. D., Green M. O. (1985). Short-Term Changes in the Morphologic Statses of Beaches and Surf Zones: An Empirical Model. Mar. Geol. 62, 339–364. doi: 10.1016/0025-3227(85)90123-9
Yates M. L., Guza R. T., O’Reilly W. C. (2009). Equilibrium Shoreline Response: Observations and Modeling. J. Geophys. Res. 114 (C9), C09014. doi: 10.1029/2009JC005359
Keywords: numerical model, equilibrium beach profile, beach response, beach scale factor, bar migration
Citation: Lee S, Lim C and Lee J-L (2022) Prediction of Long-Term Beach Profile Evolution Due to Episodic Wave Incidence Under Tidal Environment. Front. Mar. Sci. 9:831262. doi: 10.3389/fmars.2022.831262
Received: 08 December 2021; Accepted: 04 March 2022;
Published: 07 April 2022.
Edited by:
Juan Jose Munoz-Perez, University of Cádiz, SpainReviewed by:
Zhaoqing Yang, Pacific Northwest National Laboratory (DOE), United StatesPushpa Dissanayake, University of Kiel, Germany
Copyright © 2022 Lee, Lim and Lee. This is an open-access article distributed under the terms of the Creative Commons Attribution License (CC BY). The use, distribution or reproduction in other forums is permitted, provided the original author(s) and the copyright owner(s) are credited and that the original publication in this journal is cited, in accordance with accepted academic practice. No use, distribution or reproduction is permitted which does not comply with these terms.
*Correspondence: Jung-Lyul Lee, amxsZWU2MzU5QGhhbm1haWwubmV0
 Sahong Lee
 Changbin Lim
 Jung-Lyul Lee