 Shengpeng Li
 Ruyue Wang2
 Yueming Jiang
 Jianfeng Feng
- 1School of General Education, Tianjin Foreign Studies University, Tianjin, China
- 2College of Environmental Science and Engineering, Nankai University, Tianjin, China
The last 30 years have witnessed the degradation and loss of function in the ecosystem of the Bohai Sea, China. Great efforts, such as artificial reefs, have been used to restore the ecosystem of the Bohai Sea in recent years. In this study, we examined the seasonal variation of food webs in artificial reefs of Juehua Island by the Ecopath model. Results showed that the number of species, range of trophic level, energy cycle proportion, energy complexity, nutrition transfer efficiency, and ecosystem maturity have increased from summer to autumn. However, the food web stability of artificial reefs has no obvious change from summer to autumn. Loop analysis revealed that the heaviest feedback loops are the interactions among benthos, zooplankton, and phytoplankton, and the predator-prey negative interaction strength between zooplankton and phytoplankton dominated the stability of the artificial reef, whether in summer or autumn. This study suggests that stability is a more robust indicator for ecosystem assessment and could provide useful information in future restoration plans of the marine ecosystem.
Introduction
The Bohai Sea ecosystem is an important nursery and feeding ground for coastal species and now is under tremendous pressure due to economic and social development. Studies have shown that over the past decades the Bohai Sea ecosystem has rapidly degraded and lost its function to a great extent due to overfishing and eutrophication. In recent years, great efforts (e.g., artificial reef) have been used in slowing down, halting, and finally reversing the environmental deterioration of the Bohai Sea. Thus, understanding the change of structure and stability of the ecosystem under restoration projects is critical for future restoration plans.
Natural communities of species embody complex interrelationships between the structure of the interspecific interaction network, the dynamics of the populations of species, and the stability of the system as a whole. It is particularly important to study the food web embedded in each interaction network because trophic interactions are the main channels of energy flow in all ecosystems (Curtin and Prellezo, 2010). However, it is a challenge to quantify the ecosystem properties, especially for the coastal ecosystem with multiple stressors. The Ecopath with Ecosim (EwE) modeling approach1 is a suitable tool to assess the food web characteristics and is being widely used for the analysis of exploited aquatic ecosystems. For example, based on the EwE modeling, a total of 23 functional groups were modeled based on a year-round trawl survey of the Bohai Sea conducted in 2016 (Rahman et al., 2019). An overview of the trophic structure and flow of the Bohai Sea ecosystem was also illustrated by 13 functional groups using the data collected from April 1982 to May 1983 (Tong et al., 2000). To quantify the historical ecosystem changes in the Bohai Sea, the Ecopath models were developed in three periods (1982–1983, 1992–1993, and 1998–1999). The trends in the structure, maturity, and keystone species of the Bohai Sea ecosystem from 1982 to 1999 were assessed, and planning management measures were proposed (Zheng and You, 2014). A comparative study was carried out on the changes in the food web structure of 17 functional groups between 1982 and 1992 (Zhang and Lin, 2009). Studies also showed that the decadal decline in the mean trophic level of the biomass in the Bohai Sea is more apparent than the decline of the mean trophic level of the catch extracted from that sea (Liang and Pauly, 2020). A recent study investigated the steady-state trophic models in different seasons of a newly created artificial coastal oyster reef within the Luanhe River estuary in the Bohai Sea, which could help fisheries managers to understand whether the ecosystem function of artificial oyster reef habitat is consistent throughout the seasons and to assess the reasonability of the current fishing production policy which varies with seasons (Min and Xin, 2021). Although the structures of the ecosystem are often assessed, the stability is seldom considered, especially for the real ecosystem.
Due to particular features (e.g., isolation and ocean currents) of land and sea in the island, the island ecosystem is more sensitive and vulnerable, prone to degrade for disturbance, and difficult to recover (Leclerc et al., 2020). Therefore, taking Juehua Island as an example, we examined the seasonal variation of food web structure and stability. The Juehua Island in this case is different from other study areas in previous studies, in that artificial reefs are thrown into the seawater for recovery ecosystem (de Vries et al., 2013). Since stability is very important to ecosystem function, current manifestations of anthropological stresses on ecosystems have heightened the need to understand and predict the stability of ecosystems (MacArthur, 1955; Paine, 1966). Considering the previous scenarios of ecological changes, we aimed to present the seasonal ecological changes in Juahua Island in summer and autumn of 2019 using the Ecopath mass-balance model (Christensen et al., 2005) and estimate their stability by Jacobian community matrix (May, 1972; Stone and Lewi, 2001; Tang et al., 2014; Jacquet et al., 2016). We also investigated the most dangerous omnivorous loop and the decisive factor of food web stability (Neutel et al., 2002, 2007; Mitchell and Neutel, 2012; Neutel and Thorne, 2015, 2016).
Materials and Methods
Study Area
Located in Liaodong Bay in the north Bohai Sea, the Juehua Island (40.5°N, 120.8°E) is a typical nearshore island ecosystem (Figure 1), with its seacoast encircled by reef and its shallow water of 10- to 15-m depth and a feature of the mixed semidiurnal tide with a mean tidal range of about 2.06 m. The artificial reefs were deposited in 2018.
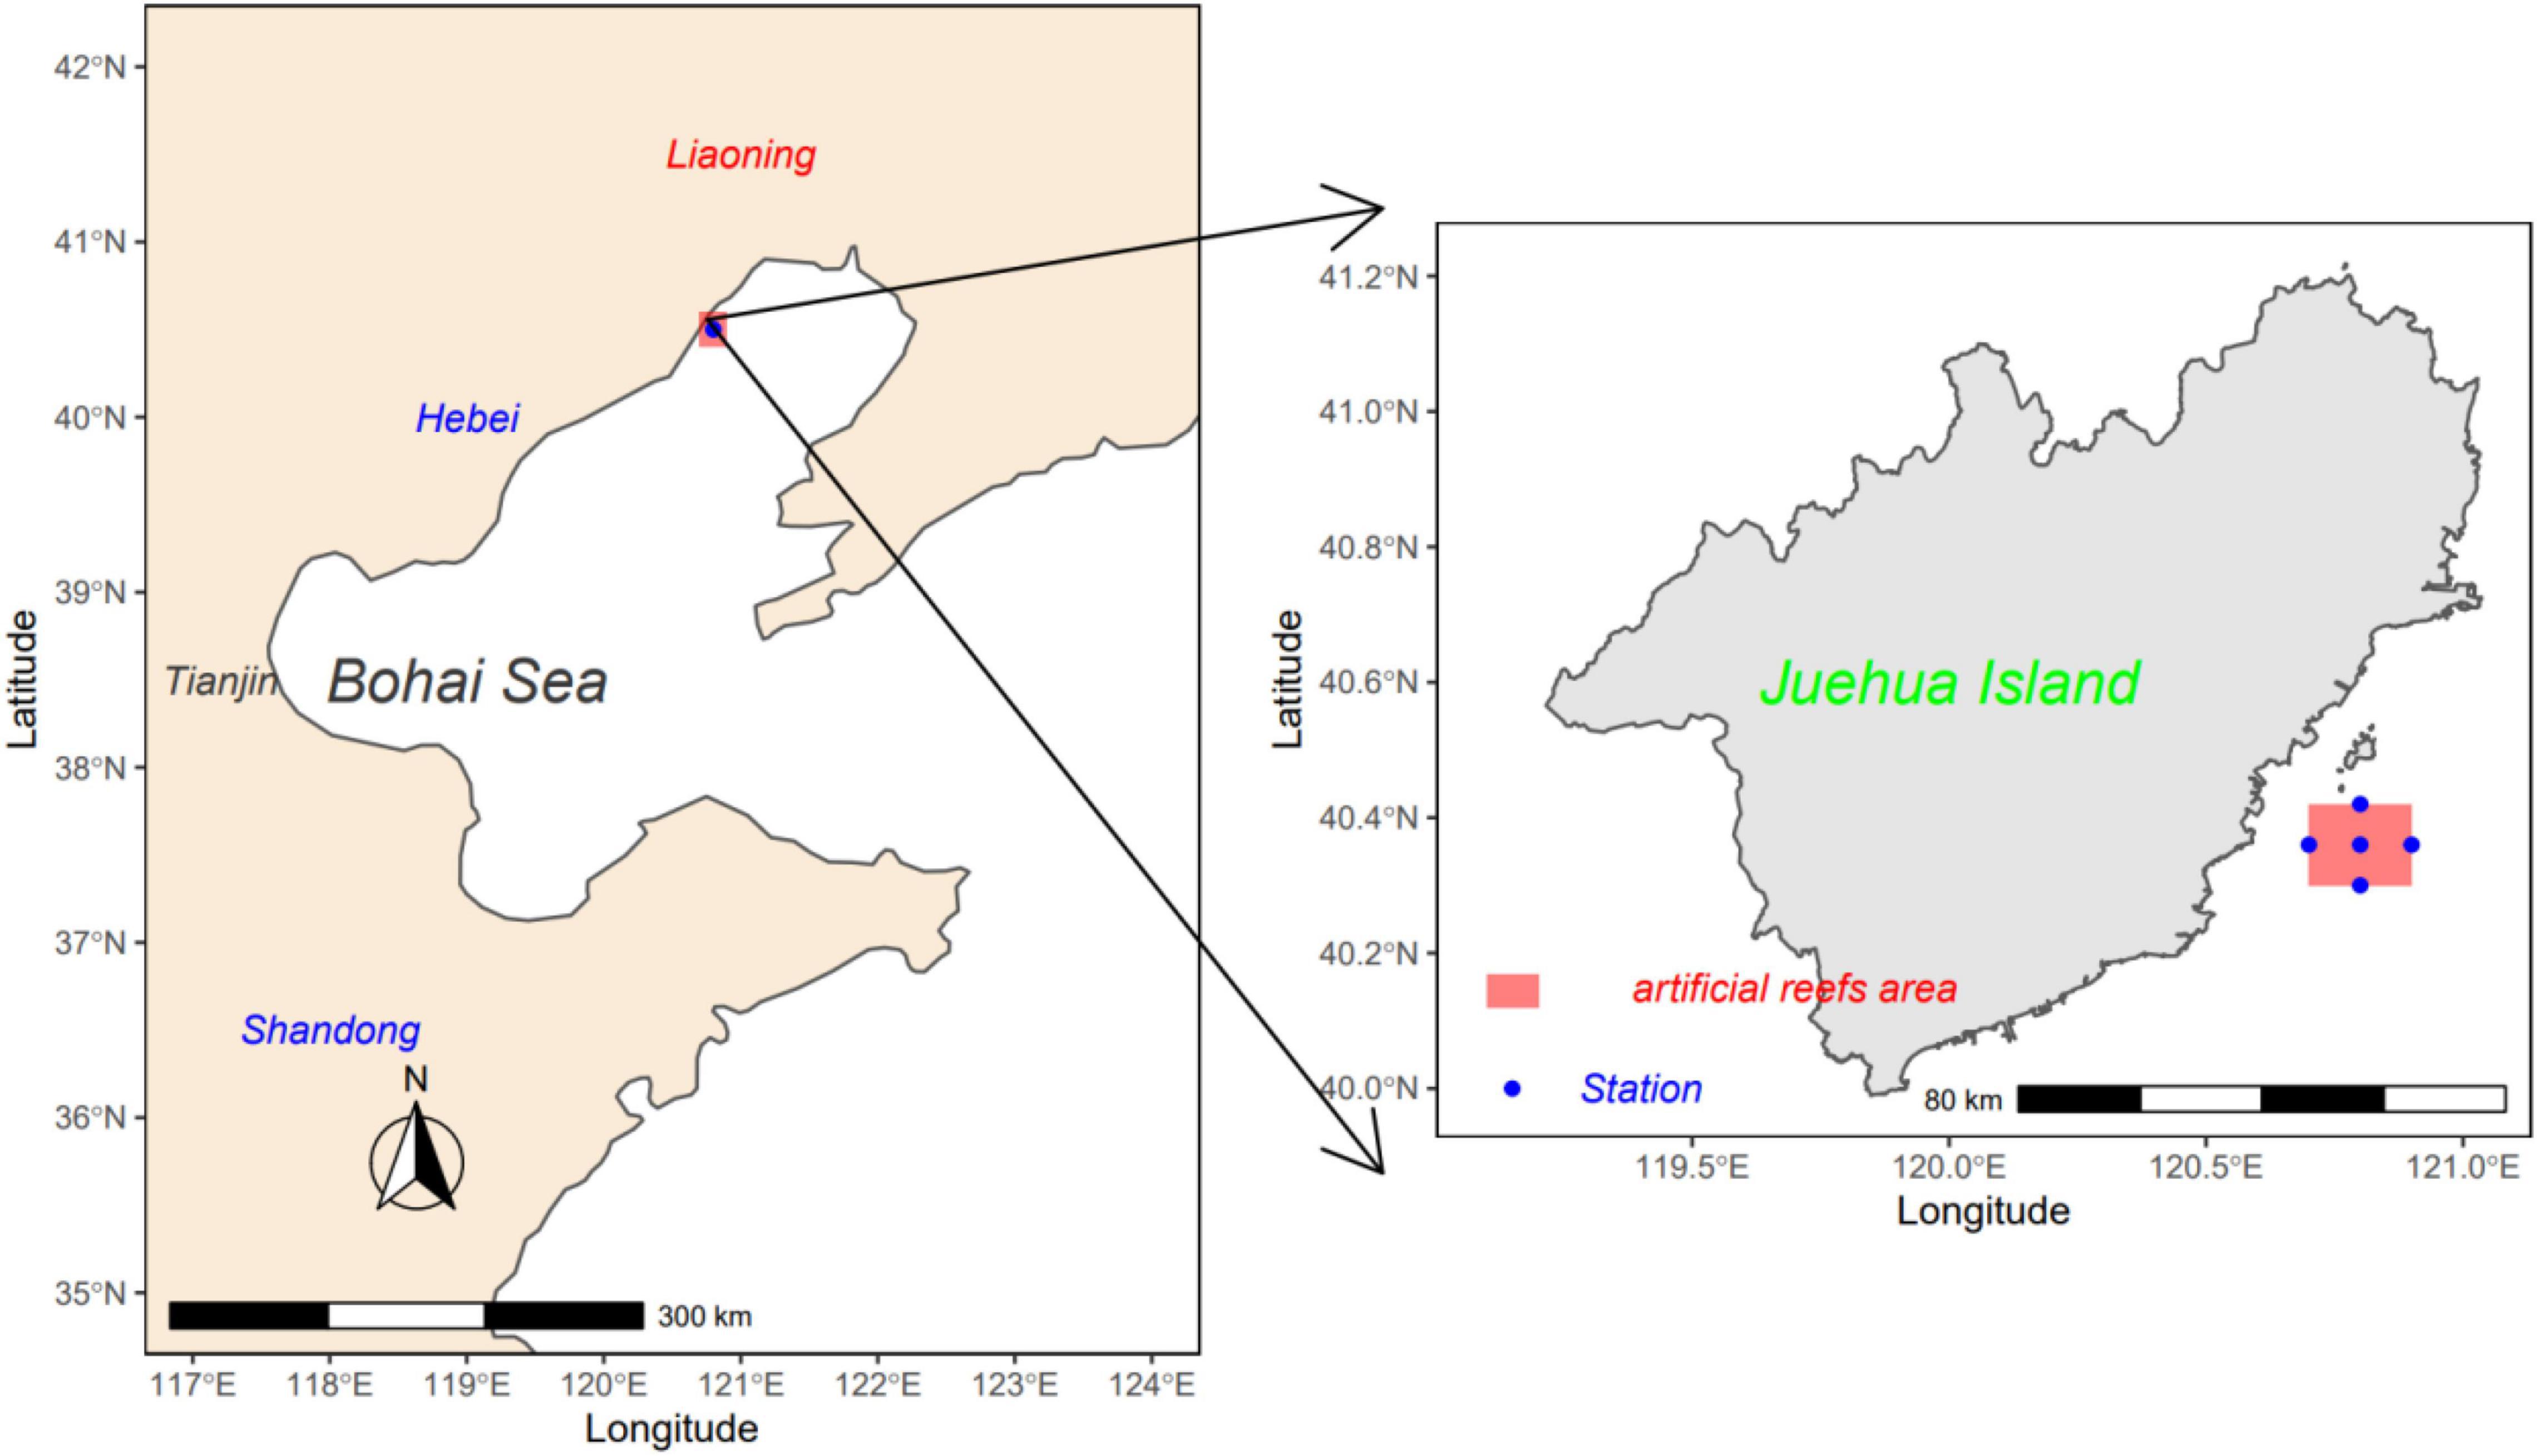
Figure 1. Monitoring stations in the artificial reef ecosystem near Juehua Island in the Bohai Sea.
Sampling and Analysis
Phytoplankton, zooplankton, benthos, and nekton in monitoring stations were sampled and tested according to “Specifications for Oceanographic Survey—Part 6: Marine Biological Survey” (GB12763.6-2007). Zooplankton was collected with NORPAC plankton net (mesh 300 μm) by horizontal towing method at 1.5-m depth, and phytoplankton samples were collected with Kitahara plankton net (mesh 80 μm) using exactly the same method as zooplankton sampling. The net was towed from south to north at a 2-knot boat speed in 5 min. Samples were preserved in 250-cc plastic bottles and fixated with 1% Lugol’s solution. Chlorophyll a concentration was measured in 1 L sampled seawater and collected by the filtration of the seawater. Marine sediments were extracted by a bottom grab sampler with 0.05 m2. The preserved sediment sample was washed through the sieves of 63- and 500-μm mesh opening to remove sand and clay from the sample. Then, the floatation technique in silica colloidal (LudoxTM) with 1.15 of specific gravity was used to extract meiobenthos from fine particles in the residue on a 63-μm mesh sieve. The extracted meiobenthos was washed with filtered freshwater through a 63-μm mesh sieve. The residue on a 63-μm mesh sieve was moved into a mixture of 10% glycerin and 90% ethanol solution in a plastic bottle. Nektons were collected by 8-m trawls at a stable boat speed in 30–60 min.
Species identification of phytoplankton, zooplankton, and meiobenthos was performed with an optical microscope, and Chlorophyll a was determined by spectrophotometry. Phytoplankton biomass was transformed on the basis of Chlorophyll a concentration, and zooplankton biomass is calculated as follows:
where Pz is biomass on the unit area (mg/m2), mz is the wet weight of zooplankton, V is filtered water amount (m3), and L is the length of rope.
Benthos biomass is computed as follows:
where Pd is benthos biomass on the unit area (mg/m2), md is the wet weight of benthos, and S is the opening area of the bottom grab sampler (m2).
Nekton biomass is estimated by stock density method with the following formula:
where Pn is nekton biomass on the unit area (kg/km2), c represents trawl yields per hour (kg/h), α is sweep area per hour (km2/h) that equals the product of expanded width of net mouth (km) and trawl speed (km/h), and q is capture efficiency whose default value is 0.5. All biomass is unified at the wet weight (t ⋅ km−2).
Model Analysis
Based on survey datum of Juehua Island in summer and autumn of 2019, food web models were established to analyze the structure and functional variation of community matrices by EwE. The food web stability of artificial reefs was evaluated by the Ecosim models driven by Ecopath, and consequently, the effect of ecological restoration can be assessed.
Functional Groups
In total, 12 functional groups and 16 functional groups in summer and autumn, respectively (Table 1), were identified according to division rules that are essentially the same to ensure the comparability of the two seasons. Charybdis japonica is further classified into juvenile and adult groups in autumn for more precise diet proportion since it plays an important role in the autumn survey and has a different diet during growth.
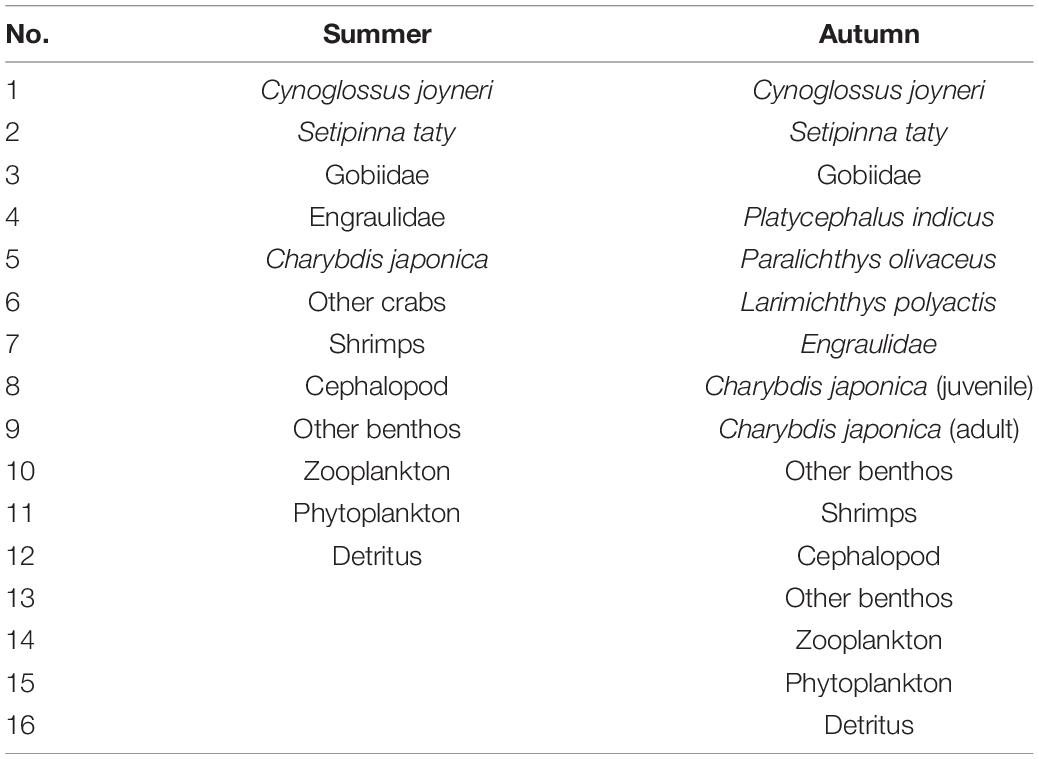
Table 1. Functional groups of Juehua Island ecosystem in summer and autumn of 2019.
Model Parameters
For the Ecopath model of Juehua Island, the input data include biomass (B), production/biomass ratio (P/B), consumption/biomass ratio (Q/B), ecotrophic efficiency (EE), diet composition, and fishery landings. B is estimated based on the marine survey. P/B and Q/B ratios are primarily referenced to the values of nearby Ecopath parameters seawater. Most EE values are estimated by the model. Diet composition is initially assigned according to Fishbase and stomach content analysis. The landing data are collected primarily from peer-reviewed publications, stock assessments, and government reports.
Model Calibration
There is an energy balance equation between input and output in the Ecopath model that adheres to ecological and thermodynamics law. EE and Q/B ratio are tested for a valid range which requires 0 < EE≤1 and 0.1 < P/Q < 0.3. If EE is greater than 1, the corresponding functional group has undergone overhunting and overfishing. P/Q lie in 0.1 and 0.3 as the consumption of most organisms is generally believed to be 10–30% of its production. For functional groups without balance energy, P/B, Q/B ratios, and diet matrix are adjusted until all EEs reach a reasonable level to ensure energy flow balance.
Pedigree coefficient (P) is defined to indicate the uncertainty of input parameters and model quality in Ecopath. The coefficient P is defined as follows:
where Iij is the pedigree coefficient of functional group i and input parameter j that may be B, P/B ratio, Q/B ratio, and diet matrix (DCij). While statistics in Morissette et al. (2006) showed that all pedigree coefficients of 150 Ecopaths from all over the world are between 0.16 and 0.68, the pedigree coefficients are 0.38 and 0.44, which testify the credibility and reliability of o ur model.
Food Web Traits and Stability Metrics
Food Web Traits
The Ecopath model can calculate multiple indicators for the evaluation of ecosystem functioning that include intrinsic structure and external pressure. We chose four complexity metrics (i.e., richness, connectance, omnivory index, and interaction strength), two energy recycling metrics (i.e., Finn’s cycling index and Finn’s mean path length), three maturity metrics (i.e., total net primary production, the ratios of total primary production (TPP) with total respiration, and ascendency), and two fishery metrics (i.e., fishery efficiency and mean trophic level of catches). Food web structure is depicted by complexity, energy recycling, and maturity metrics, and fishery metrics represent environmental pressure. All data are transferred by a natural logarithm to satisfy the normal distribution hypothesis.
Stability Metrics
This study focuses on two widely discussed categories of stability metrics: local stability and non-local stability. The former indicates the stability of the ecosystem near the equilibrium point. It is quantified by Re(λmax) that is the real part of the maximum eigenvalue of community matrix C, with a smaller value suggesting higher local stability. Lotka–Volterra interaction coefficient (αij), representing the effect of predator j on the per capita growth rate of prey i, is estimated as follows:
αji, representing the effect of prey i on the per-capita growth rate of predator j, is estimated as follows:
where,
is the predator conversion efficiency.
Since we focused only on interspecific interactions, diagonal elements αii are set to zero. Community matrix C is obtained through multiplying interaction matrix A = [αij] by corresponding biomass and
The non-local stability reflects the overall characteristics of the ecosystem responding to relatively large perturbations. To simulate external disturbance, we increased fishing effort by 50% in Ecosim, which is observed as a moderate impact of fishing (Marco and Wolff, 2002; Adam et al., 2015). The disturbance remains constant during the first 10 years, then decreases to the baseline, and continues for the next 70 years (Marcelo et al., 1997). The three aspects of non-local stability are measured based on the ratio of simulated biomass to initial values (Pérez-España and Arreguın-Sánchez, 1999). Resistance reflects the ability of an ecosystem to maintain its original state in the context of disturbances. It is calculated as the reciprocal of the magnitude of biomass change (the difference between the maximum and minimum biomass values during the simulation). Resilience is defined as the speed at which species return to initial values after perturbations (Pimm and Lawton, 1978), and the resilience of an ecosystem depends on the least resilient species (Blanche et al., 2015). It is computed as the inverse tangent of the ratio of the magnitude of biomass change to recovery time (the time required to recover to original biomass values) (Pérez-España and Arreguın-Sánchez, 1999). Variability is the variance of biomass during simulation, which is quantified as the coefficient of variation of population biomass (the SD of population biomass divided by the mean value).
Results and Discussion
Food Web Traits
Functional groups increase from 11 to 15, corresponding to summer and autumn in 2019, and species with a high trophic level, such as platycephalus, Paralichthys olivaceus, and less yellow croakers, are found in autumn but not in summer (Table 2). As is suggested in most marine surveys, the species in summer are believed to be more plentiful than in autumn, since migratory fish schools enter the Bohai area for food in spring and leave in autumn. However, our research tells a different story: the species in autumn are more diversified than in summer. One possible reason for our paradoxical results is that marine living are attracted to the artificial reef that provides more suitable habitats and thus biodiversity in the artificial reef is enhanced. The other contributing factor may be the fishing moratorium in summer that leads to the recovery of fish richness and fish resources. The omnivory index and the connectance index are almost the same in summer and autumn, whereas a minimal decrease in food web connectance could be observed from summer to autumn in 2019.
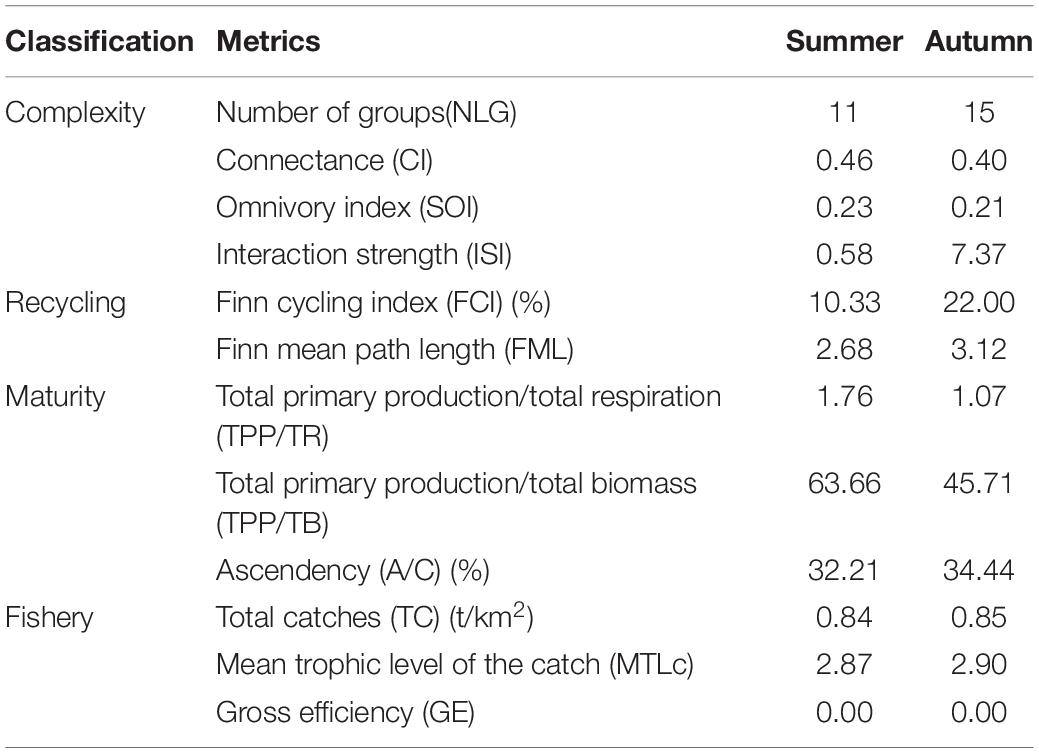
Table 2. Food web trait metrics of artificial reef of Juehua Island in summer and autumn of 2019.
The recycling metrics Finn cycling index (FCI) and Finn mean path length (FML) have increased by 112.97 and 16.36% from summer to autumn, respectively, which indicates obvious promotion of matter recycling proportion, organic matter flow, and cycling diversity in autumn compared with that of summer. A longer cycle period and a slower cycle are manifested in autumn. Maturity metrics TPP/TR (the best indicator for food web maturity) and TPP/TB show a decrease from summer to autumn. Results showed that the artificial reef near Juehua Island has good maturity with TPP/TR of 1.76 and 1.07 in summer and autumn, respectively, and maturity in autumn is higher than that in summer.
Food Web Structure
The food web of artificial reef of Juehua Island mainly consists of graze and detritus food chain. During summer, twelve functional groups of artificial reef occupy three trophic levels (assessed by EwE) with a range of 1.00–3.63 where Cynoglossus joyneri has the highest trophic (Figure 2A). In contrast, in autumn, 16 groups are divided into four levels with a range of 1.00–4.20 where P. olivaceus is at the top of the food chain (Figure 2B). The bottom of food webs from summer to autumn remains the same: detritus, phytoplankton, zooplankton, and other benthos.
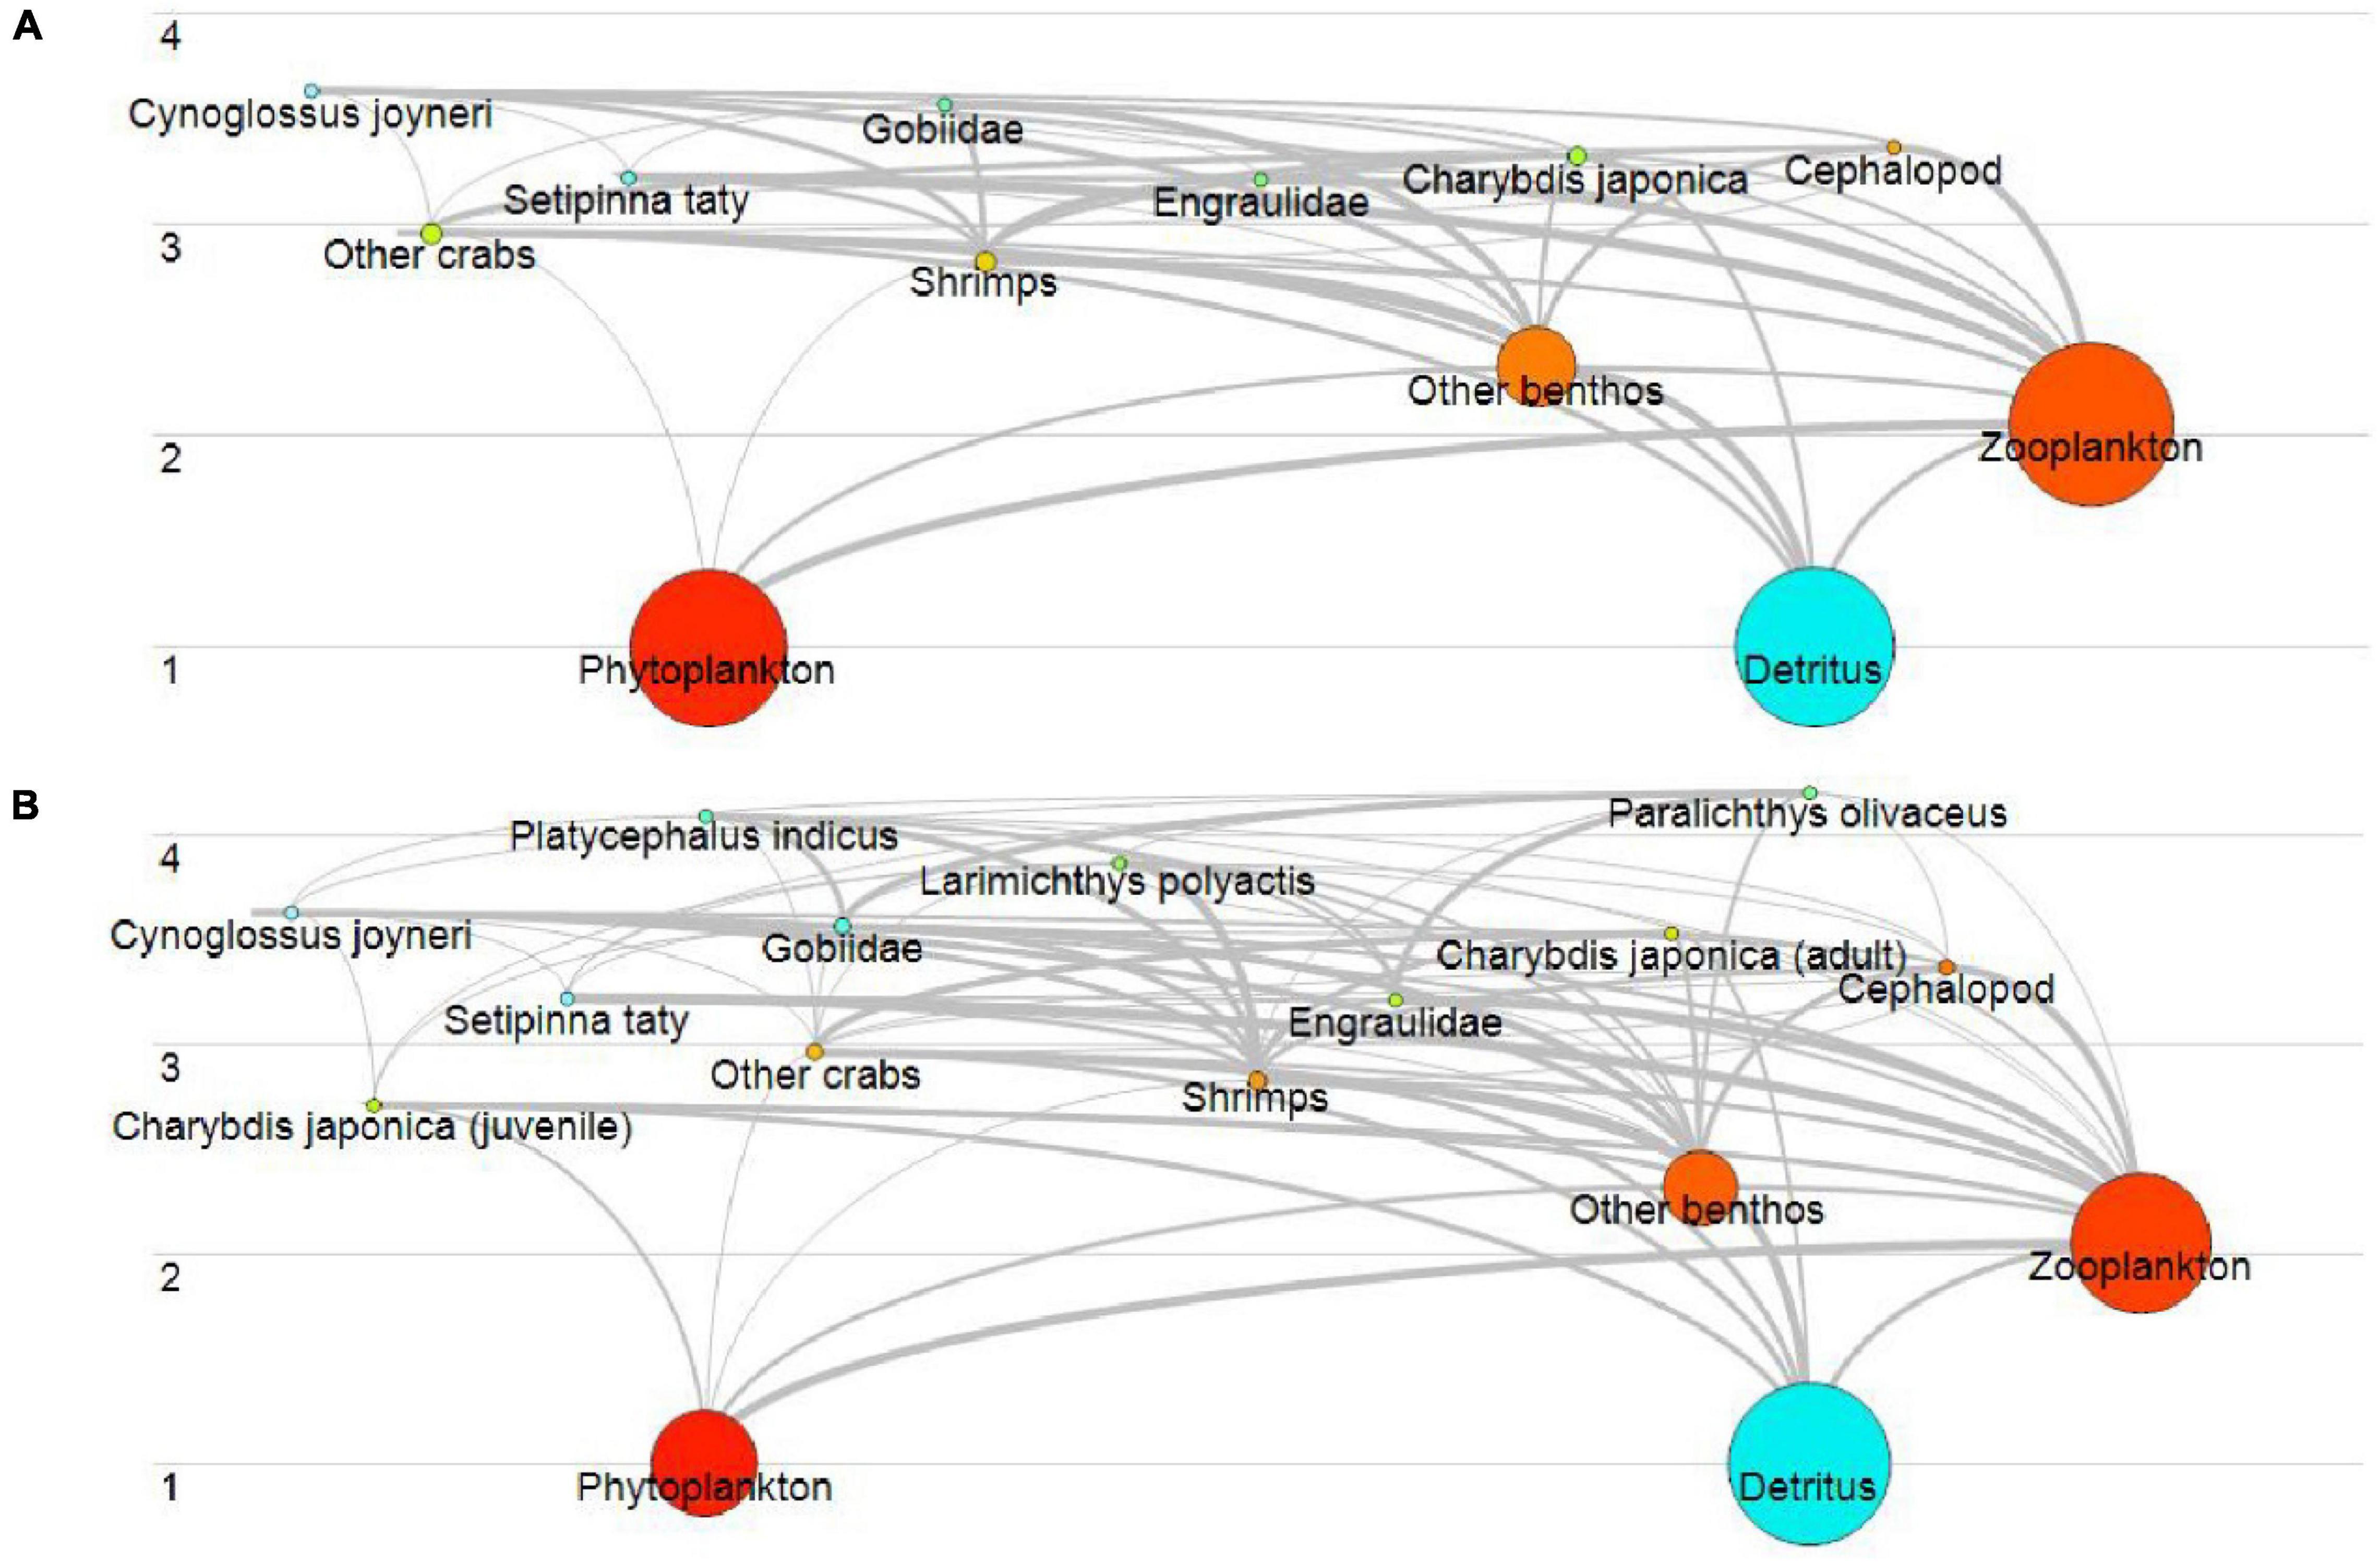
Figure 2. Food web of artificial reef of Juehua Island in summer (A) and autumn (B) of 2019.
Food Web Stability
The food web stability, local and non-local, decreases mildly from summer to autumn since Re(λmax), resilience, and variability in autumn are higher than in summer, whereas resistance got worse at the same time (Table 3). The result did not support the assumption that artificial reefs can improve food web stability in Juehua Island. This occurs because the restoring time is too short to let the fish community arrive at equilibrium. As artificial reefs planning started in September, 2018 and the release launch took place in January, 2019, the time from reefs launching to this marine survey is less than 1 year. In most cases, it takes 4–5 years for the fish community to reach its steady-state after artificial reefs are thrown into the ocean bottom since reefs would generate some disturbance on fishes and invertebrate communities nearby. To precisely evaluate the recovering effect and stability promotion of the sea area near Juehua Island after the launch of artificial reefs, a tracking survey must be conducted along the long-term scale until a stable point of the community is reached.
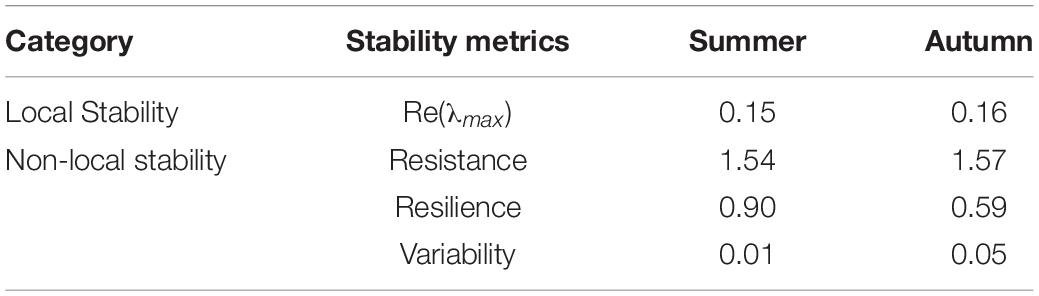
Table 3. Food web stability of artificial reef of Juehua Island in summer and autumn of 2019.
Food Web Function
The energy flow proportions of phytoplankton to the total energy in the summer and autumn of 2019 are greater than that of detritus (Figure 3), which indicates that the food web of reefs in Juehua Island is dominated by the graze food chain. Trophic levels I and II take 65.59 and 34.01% of the total energy in summer and take 51.41 and 48.26% in autumn, respectively, which shows that the energy flows in Juehua Island give priority to lower trophic species, and the energy flows between level III and above are poorer for the absence of high-trophic marine living, although the use of detritus and primary production in the ecosystem is improving from summer to autumn.

Figure 3. Energy flows of the artificial reef food web in summer (A) and autumn (B) of 2019.
Energy flow efficiencies were approximate and improved a bit from summer to autumn (Table 4), whereas they are less than Lindeman’s efficiency of 10%. The efficiencies from trophic level II to level III in summer and autumn are both around 1%, which manifests that low efficiency from trophic level II to level III is the main cause of the inefficiency of the total food web. The low resource of trophic level III cannot consume explosive growth biomass of level II since there is a great rise in plankton, benthos near reefs, and filter feeder adhering to fish reefs as a result of expanding habitat space and enough bait of artificial reefs. There is a transferring bottleneck from trophic level II to level III for its low efficiency. New species in autumn, such as platycephalus and P. olivaceus with trophic level IV that feeds on C. joyneri, Setipinna taty, goby, and anchovy, speed up the consumption of living in trophic level III, but the flow efficiency from level III to level IV declined from summer to autumn. This may be caused by the catch reduction of trophic level III biomass. Energy flow efficiency from level IV to level V has a slight increase due to additional fishery of high trophic species. In brief, the lack of high trophic species brings about the low energy flow efficiency in Juehua Island although the efficiency goes up slightly from summer to autumn. To get the normal efficiency of energy flows in Juehua Island, the resource of high trophic species must be enhanced for a long time.
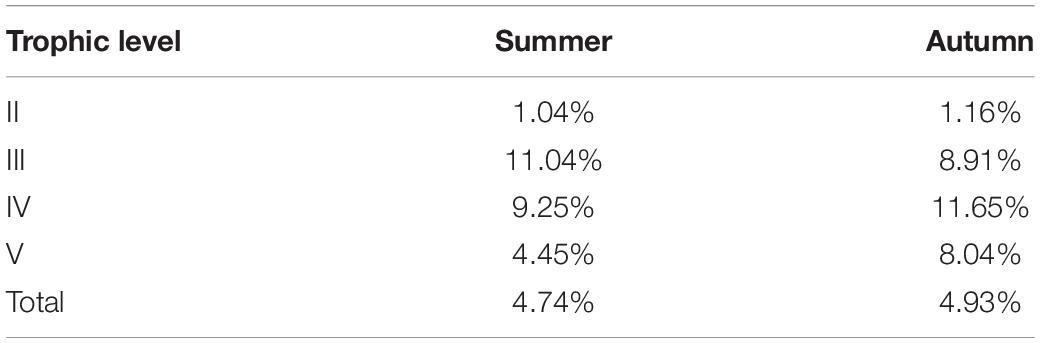
Table 4. Energy flow efficiencies of the artificial reef food web in summer and autumn of 2019.
Food Web Loop Analysis
Loop weights of the community matrix are almost symmetric at zero for a given length, and their absolute values decrease with length increasing (Figures 4C,D), which means that long loops relatively contain many weak links. The three-species omnivory feedback loop has a maximum weight that is close to four in summer (Figure 4C) and exceeds four in autumn (Figure 4D). The maximum weight loops that are considered as the most dangerous ones for food web stability are both other benthos, zooplankton, and phytoplankton in summer and autumn in Juehua Island of 2019 (Figures 4A,B), which confirms the conclusion that lower trophic level is dominant in the food web of Juehua Island. The largest interaction strength −81.2 is from zooplankton to phytoplankton, whereas the mean interaction strength is 3.6 in summer and autumn. To improve food web stability in Juehua Island, one effective method is to reduce the predator-prey negative interaction strength between zooplankton and phytoplankton by promoting zooplankton biomass.
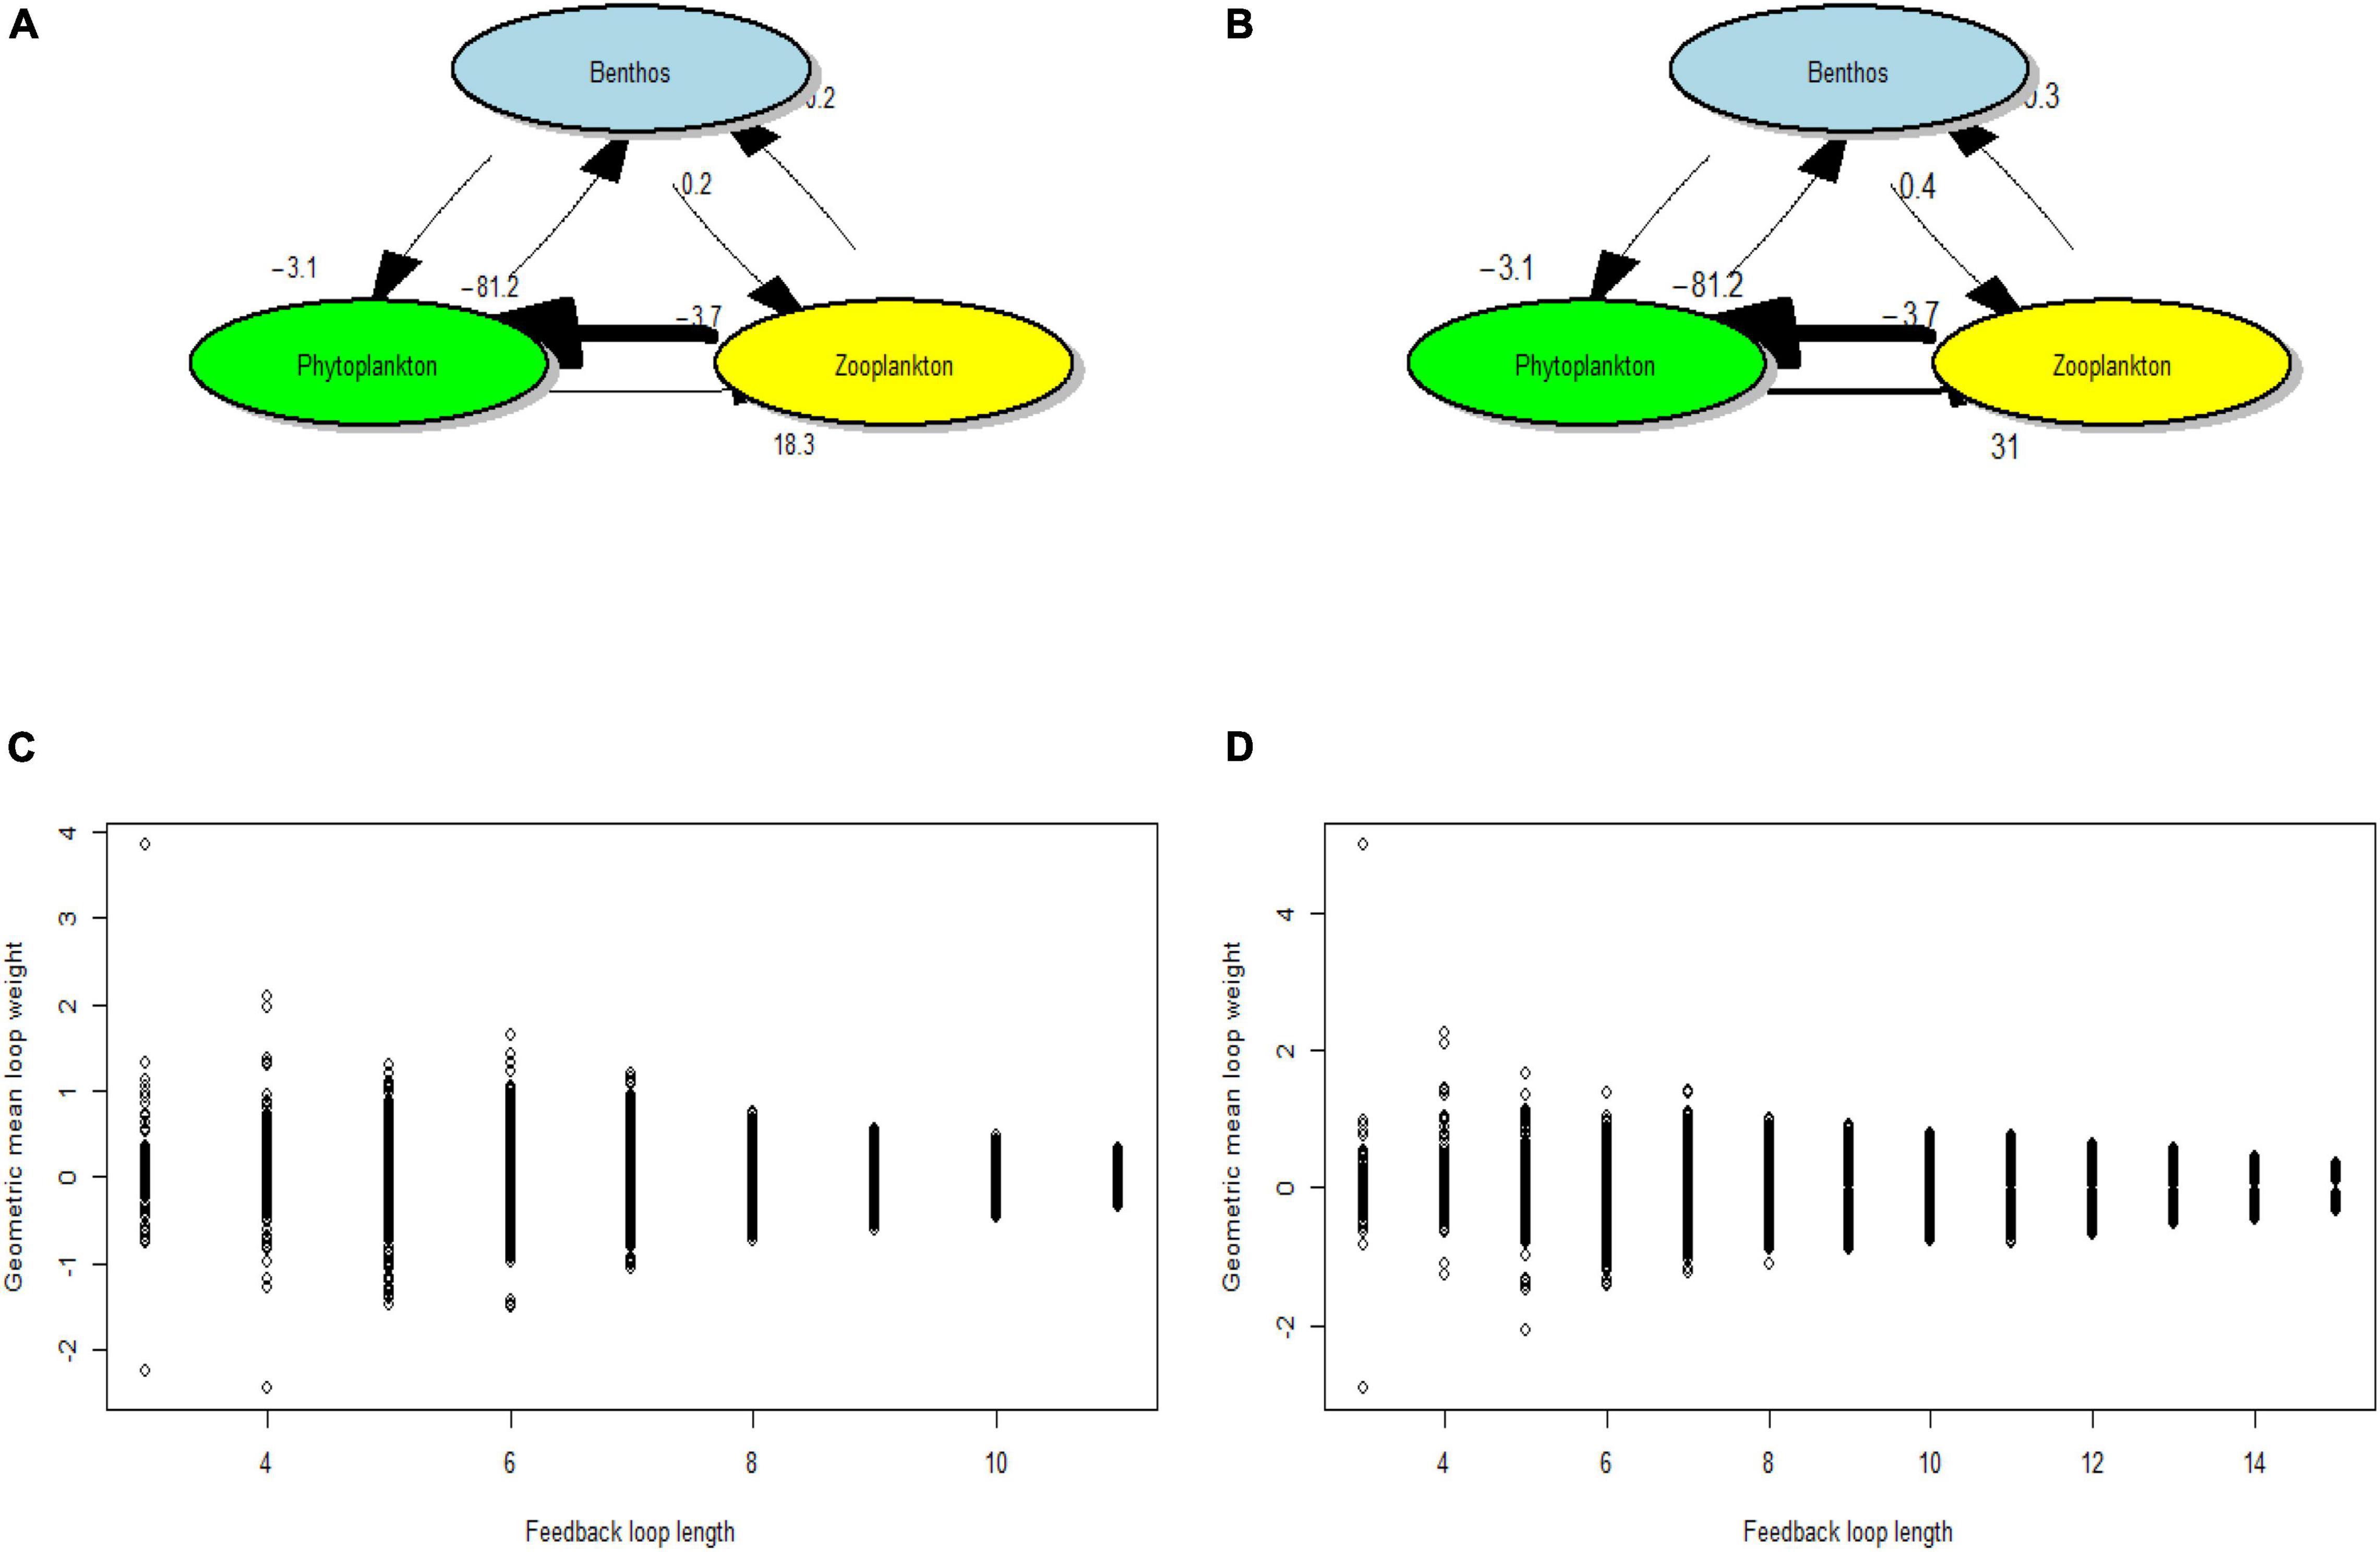
Figure 4. The mean loop weights that are defined as the geometric mean of the values of the interaction strengths in the loop and their maximum of different lengths in the summer and autumn in Juehua Island of 2019. The maxima both occur at the smallest omnivory feedback loop (length three). (A) Benthos, zooplankton, and phytoplankton have maximum loop weight among all loops in the summer of 2019 in Juehua Island since the interaction strength from zooplankton to phytoplankton is –81.2 that far outweigh the other interaction strengths. (B) The maximum weight loop in autumn is the same as the one in summer. (C) All loop weights of different lengths in summer. (D) All loop weights of different lengths in autumn.
Conclusion
Artificial reefs are often used to restore the degraded marine ecosystem. This study analyzed the seasonal variations, structure, stability, and function of a typical artificial reef food web. We found that the structure (species number, trophic level, and interaction), function (energy cycle proportion, energy complexity, and energy transfer efficiency), and maturity of the food web increased from summer to autumn. However, no significant change for food web stability was found between the two seasons, which is possibly due to the relatively slow process for stability restoration. Furthermore, the feedback loop analysis revealed that interaction strengths in the omnivorous feedback loop (benthos, zooplankton, and phytoplankton) are the maximum loop, which suggests that the predator-prey negative interaction strength between zooplankton and phytoplankton dominates the stability of the artificial reef, whether in summer or autumn. This study also suggests that stability is a more robust indicator for ecosystem assessment and could provide useful information in future restoration plan of the marine ecosystem.
Data Availability Statement
The original contributions presented in the study are included in the article/supplementary material, further inquiries can be directed to the corresponding author.
Author Contributions
SL, RW, and YJ: formal analysis. SL: investigation. LZ and JF: resources. JF: supervision. All authors have read and agreed to the published version of the manuscript.
Funding
This study was supported by the National Key R&D Program of China (2018YFC1406403).
Conflict of Interest
The authors declare that the research was conducted in the absence of any commercial or financial relationships that could be construed as a potential conflict of interest.
Publisher’s Note
All claims expressed in this article are solely those of the authors and do not necessarily represent those of their affiliated organizations, or those of the publisher, the editors and the reviewers. Any product that may be evaluated in this article, or claim that may be made by its manufacturer, is not guaranteed or endorsed by the publisher.
Footnotes
References
Adam, G., Lavery, P. S., and Lonzano-Montes, H. (2015). Trophic implications and faunal resilience following one-off and successive disturbances to an Amphibolis griffithii seagrass system. Mar. Pollut. Bull. 94, 131–143. doi: 10.1016/j.marpolbul.2015.03.001
Blanche, S. B., Baird, D., Asmus, H., Asmus, R., Bacher, C., Pacella, S. R., et al. (2015). Trophic networks: how do theories link ecosystem structure and functioning to stability properties? A review. Ecol. Ind. 52, 458–471. doi: 10.1016/j.ecolind.2014.12.017
Christensen, V., Walters, C., and Pauly, D. (2005). “Ecopath with ecosim: a User’s guide,” in Fisheries Centre, University of British Columbia, Vancouver, Canada and ICLARM, Penang, 01.
Curtin, R., and Prellezo, R. (2010). Understanding marine ecosystem based management: a literature review. Marine Policy 09, 821–830. doi: 10.1016/j.marpol.2010.01.003
de Vries, F. T., Thébault, E., Liiri, M., Birkhofer, K., Tsiafouli, M., Bjørnlund, L., et al. (2013). Soil food web properties explain ecosystem services across European land use systems. Proc. Natl. Acad. Sci. U.S.A. 110, 14296–14301. doi: 10.1073/pnas.1305198110
Jacquet, C., Moritz, C., Morissette, L., Legagneux, P., Massol, F., Archambault, P., et al. (2016). No complexity-stability relationship in empirical ecosystems. Nat. Commun. 71:12573. doi: 10.1038/ncomms12573
Leclerc, C., Courchamp, F., and Bellard, C. (2020). Future climate change vulnerability of endemic island mammals. Nat. Commun. 11:4943. doi: 10.1038/s41467-020-18740-x
Liang, C., and Pauly, D. (2020). Masking and unmasking fishing down effects: the Bohai Sea (China) as a case study. Ocean Coast. Manag. 184:105033.
MacArthur, R. (1955). Fluctuations of animal populations and a measure of community stability. Ecology 07, 533–536. doi: 10.2307/1929601
Marcelo, V., Mackinson, S., Sloman, K., and Pauly, D. (1997). The stability of trophic mass-balance models of marine ecosystems: a comparative analysis. Ecol. Model. 100, 125–134. doi: 10.1016/s0304-3800(97)00150-6
Marco, O., and Wolff, M. (2002). Dynamical simulation of mass-balance trophic models for benthic communities of north-central Chile: assessment of resilience time under alternative management scenarios. Ecol. Model. 148, 277–291. doi: 10.1016/s0304-3800(01)00454-9
Min, X., and Xin, Y. (2021). Seasonal analysis of artificial oyster reef ecosystems: implications for sustainable fisheries managemen. Aquacul. Int. 29, 167–192. doi: 10.1007/s10499-020-00617-x
Mitchell, E., and Neutel, A.-M. (2012). Feedback spectra of soil food webs across a complexity gradient, and the importance of three-species loops to stability. Theor. Ecol. 05, 153–159. doi: 10.1007/s12080-011-0143-z
Morissette, L., Hammill, M. O., and Savenkoff, C. (2006). The trophic role of marine mammals in the northern gulf of st. lawrence. Mar. Mamm. Sci. 22, 74–103. doi: 10.1111/j.1748-7692.2006.00007.x
Neutel, A.-M., Heesterbeek, J. A., and De Ruiter, P. C. (2002). Stability in real food webs: weak links in long loops. Science 296, 1120–1123. doi: 10.1126/science.1068326
Neutel, A.-M., Heesterbeek, J. A., van de Koppel, J., Hoenderboom, G., Vos, A., Kaldeway, C., et al. (2007). Reconciling complexity with stability in naturally assembling food webs. Nature 11, 599–602. doi: 10.1038/nature06154
Neutel, A.-M., and Thorne, M. (2015). Linking saturation, stability and sustainability in food webs with observed equilibrium structure. Theor. Ecol. 9, 73–81.
Neutel, A.-M., and Thorne, M. A. (2016). Beyond connectedness: why pairwise metrics cannot capture community stability. Ecol. Evol. 6, 7199–7206. doi: 10.1002/ece3.2461
Paine, R. (1966). Food web complexity and species diversity. Am. Nat. 01, 65–75. doi: 10.1086/282400
Pérez-España, H., and Arreguın-Sánchez, F. (1999). Complexity related to behavior of stability in modeled coastal zone ecosystems. Aquat. Ecosyst. Health Manag. 2, 129–135. doi: 10.1111/jeb.13524
Pimm, J. H., and Lawton, S. L. (1978). On feeding on more than one trophic level. Nature 275, 542–544.
Rahman, M. F., Qun, L., Xiujuan, S., Chen, Y., Ding, X., and Liu, Q. (2019). Temporal changes of structure and functioning of the bohai sea ecosystem: insights from ecopath models. Thalassas 10, 625–641.
Stone, I. D., and Lewi, R. (2001). Complexity can enhance stability in competitive systems. Ecol. Lett. 6, 397–400.
Tang, S., Pawar, S., and Allesina, S. (2014). Correlation between interaction strengths drives stability in large ecological networks. Ecol. Lett. 17, 1094–1100. doi: 10.1111/ele.12312
Tong, L., Tang, Q., and Pauly, D. (2000). A preliminary approach on mass-balance ecopath model of the Bohai Sea. Chin. J. Appl. Ecol. 07, 435–440.
Zhang, Q., and Lin, X. S. (2009). Comparative study on the changes of the Bohai Sea ecosystem structure based on Ecopath model between ten years. Acta Ecol. Sin. 07, 3613–3620.
Keywords: Bohai Sea, Ecopath, feedback loop, food web, stability
Citation: Li S, Wang R, Jiang Y, Li Y, Zhu L and Feng J (2022) Seasonal Variation of Food Web Structure and Stability of a Typical Artificial Reef Ecosystem in Bohai Sea, China. Front. Mar. Sci. 9:830324. doi: 10.3389/fmars.2022.830324
Received: 07 December 2021; Accepted: 11 January 2022;
Published: 02 February 2022.
Edited by:
Meilin Wu, South China Sea Institute of Oceanology, Chinese Academy of Sciences (CAS), ChinaReviewed by:
Wenzhe Xu, Tianjin University of Science and Technology, ChinaHongxia Ming, National Marine Environmental Monitoring Center, China
Copyright © 2022 Li, Wang, Jiang, Li, Zhu and Feng. This is an open-access article distributed under the terms of the Creative Commons Attribution License (CC BY). The use, distribution or reproduction in other forums is permitted, provided the original author(s) and the copyright owner(s) are credited and that the original publication in this journal is cited, in accordance with accepted academic practice. No use, distribution or reproduction is permitted which does not comply with these terms.
*Correspondence: Jianfeng Feng, ZmVuZ2pmQG5hbmthaS5lZHUuY24=