
94% of researchers rate our articles as excellent or good
Learn more about the work of our research integrity team to safeguard the quality of each article we publish.
Find out more
ORIGINAL RESEARCH article
Front. Mar. Sci., 18 May 2022
Sec. Coastal Ocean Processes
Volume 9 - 2022 | https://doi.org/10.3389/fmars.2022.829579
This article is part of the Research TopicOceanographic Processes Linking Nearshore, Continental Shelf, and Shelf BreakView all 34 articles
Observations on the lee of a topographic ridge show that the turbulence kinetic energy (TKE) dissipation rate due to shear instabilities is three orders of magnitude higher than the typical value in the open ocean. Laboratory-scale studies at low Reynolds number suggest that high turbulent dissipation occurs primarily within the core region of shear instabilities. However, field-scale studies indicate that high turbulence is mainly populated along the braids of shear instabilities. In this study, a high-resolution, resolving the Ozmidov-scale, non-hydrostatic model with Large Eddy Simulation (LES) turbulent closure is applied to investigate dominant mechanisms that control the spatial and temporal scales of shear instabilities and resulting mixing in stratified shear flow at high Reynolds number. The simulated density variance dissipation rate is elevated in the cusp-like bands of shear instabilities with a specific period, consistent with the acoustic backscatter taken by shipboard echo sounder. The vertical length scale of each cusp-like band is nearly half of the vertical length scale of the internal lee wave. However, it is consistent with instabilities originating from a shear layer based on linear stability theory. The model results indicate that the length scale and/or the period of shear instabilities are the key parameters to the mixing enhancement that increases with lateral Froude number FrL, i.e. stronger shear and/or steeper ridge.
Understanding how turbulence leads to the enhanced mixing of heat and other scalars, such as salt and pollutants, in density-stratified fluids is a fundamental and central problem in geophysical and environmental fluid dynamics. Physical processes such as the topographically induced water intrusion, lee wave breaking, and shear instabilities are crucial to the spatial and temporal variation in biological productivity and biodiversity in ecosystems of the coastal ocean. Strong turbulent mixing could enhance the mean nitrate flux and had a maximal value of 10.0 mmol m–2 day–1, which was much higher than typical values for the open ocean (Tanaka et al., 2019; Acabado et al., 2021; Nagai et al., 2021). Field observations show that the high TKE dissipation rate enhances the vertical nitrate flux (Acabado et al., 2021). The mixing processes over topographic features along the Kuroshio are important agents for nutrient delivery to the primary producers and supporting migratory fish species in the Kuroshio Extension and subpolar regions. Because nutrients lie in the deep, dark subsurface layers, they are not immediately available for the photosynthesis process in the surface layer (Durán Gómez et al., 2020; Nagai et al., 2021). When ocean currents interact with seafloor topography, turbulent mixing may occur by breaking internal lee waves through shear instabilities (Farmer and Armi, 1999; Eiff and Bonneton, 2000). Lee-wave breaking provides a mechanism for extracting energy from the geostrophic flow and transferring energy to small-scale turbulence, which leads to a dissipative loss of mechanical energy and an irreversible transfer from kinetic energy to potential energy (Winters et al., 1995). Parameterizations based on a linear theory (Bell, 1975) for the energy flux into lee waves in the stratified flow have been implemented in global ocean models, highlighting the potential role of lee wave-driven mixing on overturning circulations. However, recent field observations in Drake Passage showed that turbulent dissipation rates are on average two to three times smaller than linear lee-wave generation predictions. This is because a greater fraction of high-frequency lee wave energy may be reabsorbed by the mean flow, and the reabsorption process influences the energy remaining for dissipation and mixing (Kunze and Lien, 2019). Hence, the nonlinear mechanisms leading to lee wave breaking and dictating turbulent dissipation processes still require adequate assessment (Legg, 2021).
The typical value of turbulent diffusivity in the open ocean pycnocline is O(10-5 m2 s-1) (Munk and Wunsch, 1998). Direct measurements of the TKE dissipation rate in the Tokara Strait, where the strong shear flow, Kuroshio interacts with a series of seamounts, demonstrate that the turbulent diffusivity reaches O(10-1 m2 s-1) in the lee of the seamount. The strong shear generated by the interaction of bathymetry and the geostrophic flow can result in instabilities at the interface of the lee wave and greatly enhance vertical mixing (Tsutsumi et al., 2017). Observations behind a topographic ridge near Green Island along the route of the Kuroshio also show that the TKE dissipation rate due to the observed shear instabilities is two orders of magnitude higher than other areas without topographic effects along the route of the Kuroshio (Mensah et al., 2014; Chang et al., 2016).
Field observations at high Reynolds number (Re ~ O(106), Re = Uδ/υ, where U, δ, and υ are the velocity scale, the half-thickness of the shear zone, and kinematic viscosity, respectively) suggest that the primary source for turbulent mixing in Kelvin-Helmholtz (KH) billows is not only within their convective overturning core but within the intensified shear layer, separating the cores, where secondary shear instabilities are present (Geyer et al., 2010; Chang et al., 2016). The ‘zoo’ of secondary instabilities within the braids is the important mechanism for turbulence generation (Mashayek and Peltier, 2012; Mashayek and Peltier, 2013). However, laboratory-scale studies at low Reynolds number (Re ~ 1000) demonstrate that the high TKE dissipation rate primarily occurs within the core region of shear instabilities, inconsistent with field observations at high-Re flows (Staquet, 1995; Smyth and Moum, 2000; Smyth et al., 2001; Smyth and Moum, 2012). A major challenge in estimating the amount of turbulent mixing in large-scale flow in the ocean, i.e., the parameterization, is the remarkably broad range of spatial and temporal scales involved, from those of smallest turbulent eddies (the submillimeter scale) to the largest scales of ocean circulations (thousands of kilometer scale). The Reynolds-averaged Navier–Stokes (RANS) model with k-ε turbulent closure has been used to study the characteristics of stratified flow in large-scale hydrodynamic model frameworks (e.g., ROMS, POMS) at high Reynolds number. In RANS models, all turbulent motions are modeled, and a scalar eddy viscosity is used to parameterize the turbulent mixing processes. Although the standard RANS k-ε model could produce the mean flow accurately, it produces large discrepancies in predicting the second-order flow characteristics such as shear instabilities (Shi et al., 2016) or convective overturning, which are important turbulence generation mechanisms for stratified flows at high Reynolds number, as demonstrated in field observations.
On the other hand, LES models resolve important large-scale turbulent eddies and can accurately capture the unsteadiness of coherent turbulent motions due to hydrodynamic instabilities. LES has been employed to study the development of shear instabilities and the transition from shear instabilities to turbulence at the edge of the river plume (Zhou et al., 2017; Shi et al., 2019). Therefore, LES is an ideal tool for investigating the dominant turbulent generation mechanism in stratified flows at high Reynolds number. In addition, the LES model can provide insights into the key parameters controlling KH billow properties, including the size, frequency, and propagation speed, when shear instability occurs.
In this study, a high-resolution LES model is implemented to explain the evolution of breaking lee waves in space and time and the resulting instabilities at high Reynolds number. The effect of density stratification on the strength and characteristics of turbulence is explored using a vertical grid resolution smaller than the Ozmidov length scale (, where ε is the TKE dissipation rate, and N is the buoyancy frequency) representing the outer scale of turbulence. The model governing equation and the model setup are described in Section 2. Model results are discussed in Section 3. A comparison with field measurements of acoustical backscatter intensity, acoustic Doppler current profiler (ADCP) velocity profiles, and conductivity-temperature-depth (CTD) profiles behind a topographic ridge along the route of the Kuroshio is discussed in Section 4. Finally, model experiments based on different upstream velocities, background stratifications, and topography structures are discussed to understand better the key parameters controlling the nonlinear mechanisms dictating turbulent generation and dissipation processes of flow-topography interactions at high-Re flows. The dependence of the vertical mixing enhancement on the scale of shear instabilities will be discussed.
In this study, the computational fluid dynamics (CFD) model OpenFOAM (Weller et al., 1998) is applied to investigate dominant mechanisms that control the variations in the strength and spatial/temporal scales of shear instabilities in stratified shear flow at high Reynolds number. The effect of density stratification on shear instability-induced turbulence is explored using LES models that resolve the unsteadiness of large-scale turbulent motions and parameterize subgrid turbulent motions at smaller scales. Turbulence generation mechanisms such as shear instabilities and convective instabilities are resolved using LES models with fine grid resolution (the vertical grid size is smaller than the Ozmidov scale). The governing equations for the LES model are:
where ui is the i-th component of the resolved velocity, p is the resolved dynamic pressure, τ is the sum of the viscous stress and Reynolds stress, δ3i is the Kronecker delta, and the coefficient α = (ρ–ρ0)/sρ0, in which ρ is the density of the fluid with a given tracer concentration s, and ρ0 is the background density. When the density variation caused by tracer s is small, the Boussinesq approximation can be applied and a linear relation between the density ρ and tracer concentration s is ρ = ρ0 (1 + αs). In the momentum equation [the second equation in (1)], the last term represents the density stratification Δρg/ρ0 by the scalar tracer s, where Δρ is the density difference between the top and bottom boundary. The third equation in (1) is the tracer transport equation for any conservative tracer s such as salinity or temperature where κ is the sum of the molecular diffusion coefficient and the subgrid diffusion coefficient.
In LES models, the turbulent stress term represents the momentum flux in the small-scale processes occurring at length scales that the computational grid cannot adequately resolve. We implemented the wall-adapting local eddy viscosity (WALE) subgrid closure model. The stress term is given by:
where ν is the kinematic viscosity of the fluid, vt is the eddy viscosity given by Ducros et al. (1998), and Sij is the strain rate tensor of the resolved large scale, expressed as
with
where Cw = 0.325 is a constant and Vc is the volume of the grid cell.
Observations behind a topographic ridge along the route of the Kuroshio demonstrate trains of shear instabilities characterized by strong shear flows and density gradients (Chang et al., 2016; Tsutsumi et al., 2017). Applying the Buckingham π theorem, the key dimensionless parameters for the system can be determined as
where Re is the Reynolds number, Uo is the freestream velocity of the layer, δ is the width of the shear zone, and ν is the kinematic viscosity of the fluid. Ri is the gradient Richardson number with buoyancy frequency with g being the gravitational acceleration constant, and ρ being the potential density. The gradient Richardson number defined here is the ratio of the buoyancy term (represented by N2) to the mean vertical shear term G2 = (∂zU)2 + (∂zV)2. The Fr is the internal Froude number for a given seamount height H. The Froude number Fr defined in this study is the inverse of the Long number (Aguilar and Sutherland, 2006) or the steepness parameter (Nikurashin and Ferrari, 2010a). S is the steepness of the topographic ridge defined by the ratio of the height of a given seamount H and the corresponding width L.
Field observations along the route of Kuroshio indicate that strong currents are confined to the upper layers and rapidly weaken toward 400-m depth (Taniguchi et al., 2013; Jan et al., 2015). Therefore, the vertical length in the model domain is scaled down from 400 m to 100 m. Field measurements indicate that the maximum Kuroshio flow velocity, ranging between 0.5 m s-1 and 1.2 m s-1, is modulated by tidal flows and internal waves. The tidally induced flow is weaker than the Kuroshio flow so that the flow direction is relatively steady, and total flow reversal does not occur (Chang et al., 2013). The freestream velocity at top the shear zone in the model inflow boundary is prescribed as U0 =0.125-0.3 m s-1, corresponding to one-fourth of the maximum observed flow velocity ranging between 0.5 m s-1 and 1.2 m s-1.
The best available bathymetry data have a relatively low resolution for resolving the small-scale variations in topographic ridges. Therefore, similar to the approach used in previous studies (Klymak and Legg, 2010; Winters and Armi, 2012; Winters and Armi, 2014; Dossmann et al., 2016), the three-dimensional simulation was conducted over a two-dimensional topographic ridge parameterized by a Gaussian function:
where x0 is the center location of a topographic ridge, and L is the horizontal length scale.
In this study, a scaled-down turbulence resolving simulation was carried out in which both the length scale and velocity scale were chosen as one-fourth of the field conditions adapted to the constraint of the model grid resolution. The Ozmidov length scale can be estimated as where ε is the TKE dissipation rate estimated by the Thorpe scale (Chang et al., 2016) and direct turbulence measurements (Tsutsumi et al., 2017). Therefore, a vertical grid resolution of 0.4 m is used in the model, which is smaller than the Ozmidov length scale. The simulation domain is a straight channel with a Gaussian seamount, in which the topographic ridge height from the bottom of the shear zone is scaled down from 200 m to 50 m and the horizontal length scale of the topographic ridge is scaled down from 800-1200 m to 200-300 m (Figure 1). The model is designed to keep the above nondimensional parameters the same as the field observations such that the resulting shear layer characteristics and shear instabilities are similar to the field observations. Initially, the background density field is prescribed by a linear function such that the buoyancy frequency is the same as the field observation. The shear rate and the time scale (calculated as the length scale divided by the velocity scale) is kept the same as the field observation because both the velocity and length scales are scaled by one-fourth. The density variation is therefore also scaled by one-fourth to have the same gradient Richardson number. The friction factor does not change significantly due to the scaling in the fully developed turbulent, high Reynolds number (Re~O(106)) flow (Moody, 1944). In the present model simulation, a linear velocity profile u(z) = Gz is prescribed at the inflow boundary. The maximum velocity of U0 = 0.125-0.3 m s-1 is located at the top, and the velocity is zero at the bottom (the vertical length in the model domain is 100 m), which gives a constant shear rate G. For example, U0 = 0.125 m s-1 gives G = 1.25 × 10⁻³ s-1. Since the velocity and length are scaled-down by one-fourth, the velocity gradient is kept the same.
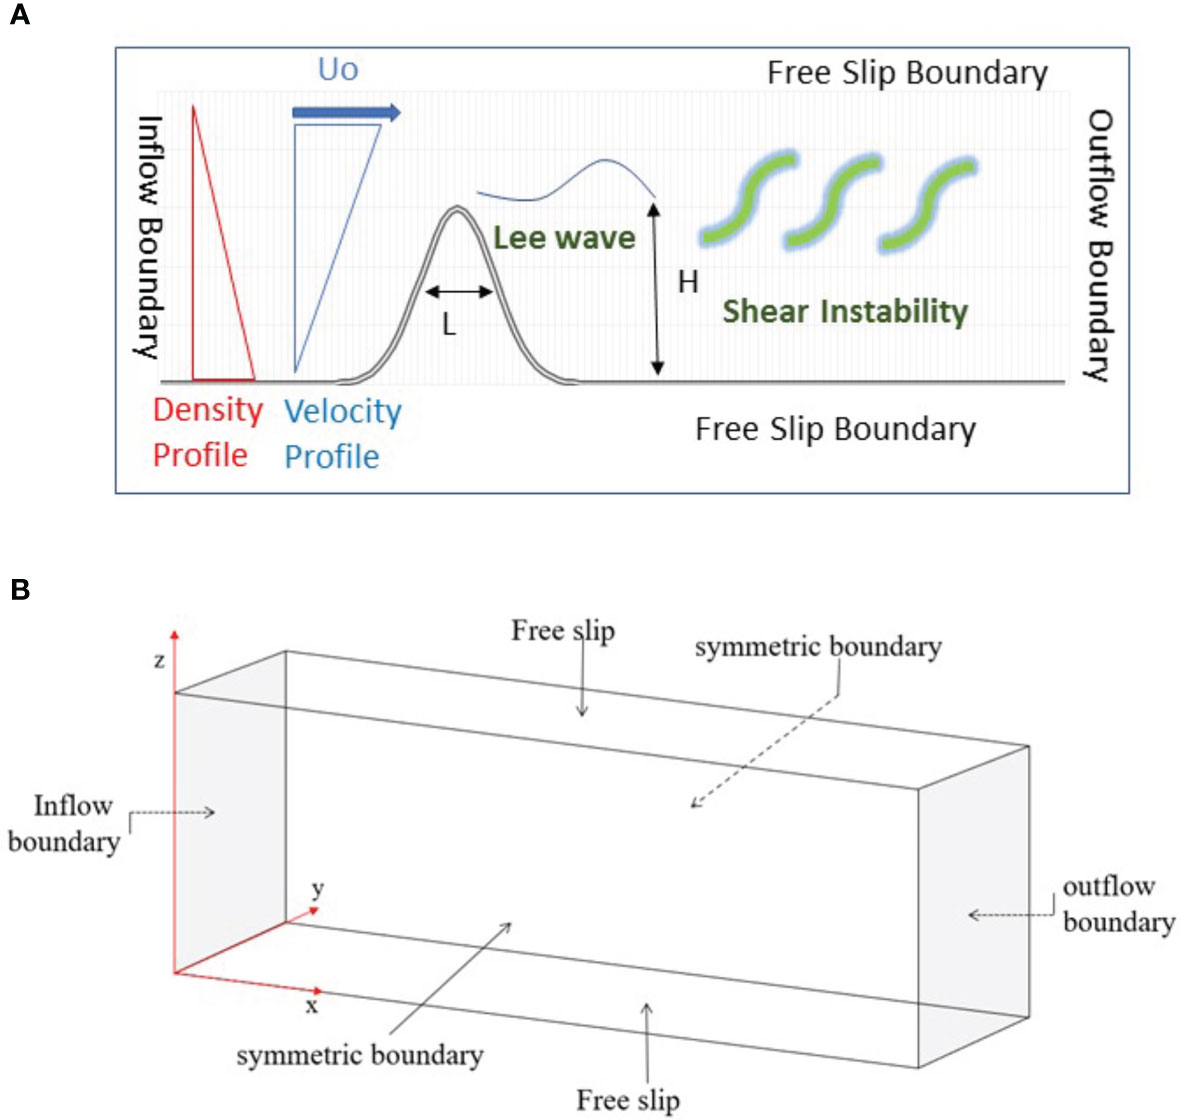
Figure 1 (A) Model setup (B) A sketch of the computational domain. The inflow boundary condition implemented at the left and the outflow boundary condition at the right. A linear velocity profile is prescribed at the inflow boundary with the maximum velocity at the top and the minimum velocity at the bottom with a constant shear rate. Initially, the flow is stably stratified with a linear distribution of the density profile. The free-slip boundary condition is used at the top and the bottom.
The free-slip boundary condition is used at the top and the bottom. The symmetric boundary condition is used for the two lateral boundaries, in which the velocity normal to the boundaries, and the gradients of density and velocity parallel to the wall are set to be zero. The outflow boundary condition is a mixed boundary condition. When the fluid flows out of the domain at the boundary, the velocity gradient is set to zero. When the fluid flows into the domain, the flow velocity is set to zero so there is no back flow at the outflow boundary. Initially, the background density is stably stratified with a linear distribution of density based on the observed buoyancy frequency N = 0.014-0.018 s-1 (Table 1). Therefore, the Froude number of this study falls within the regime three of the regime diagram for lee waves in Legg (2021), suggesting the occurrences of blocking, hydraulic control, and lee wave saturation. Rotation effects set the lower bound frequency for internal lee wave and determine the internal wave ray propagation and critical layer. Therefore, rotation effects could also be important for inertial instabilities. When flow bifurcation occurs for Froude numbers below the critical value (see Figure 1 from Perfect et al., 2020a), the top of the topography forms a region where the flow goes over the topographic ridge, hereafter referred to as the ‘‘cap’’. The flow over the cap is associated with the generation of internal lee waves (Voisin, 1991). When flow bifurcation occurs, the scale of internal lee waves and the resulting shear instabilities on the top of the topography is controlled by the corresponding width to the bifurcation cap when L<1km and the velocity of Kuroshio U0 = 0.5- 1.2 m s-1 in our study site. The effect of the Coriolis force on the scale of internal lee waves and the resulting shear instabilities is less significant due to a relatively large Rossby number . The Burger number is greater than 1 so rotational effects are less significant comparing to stratification.
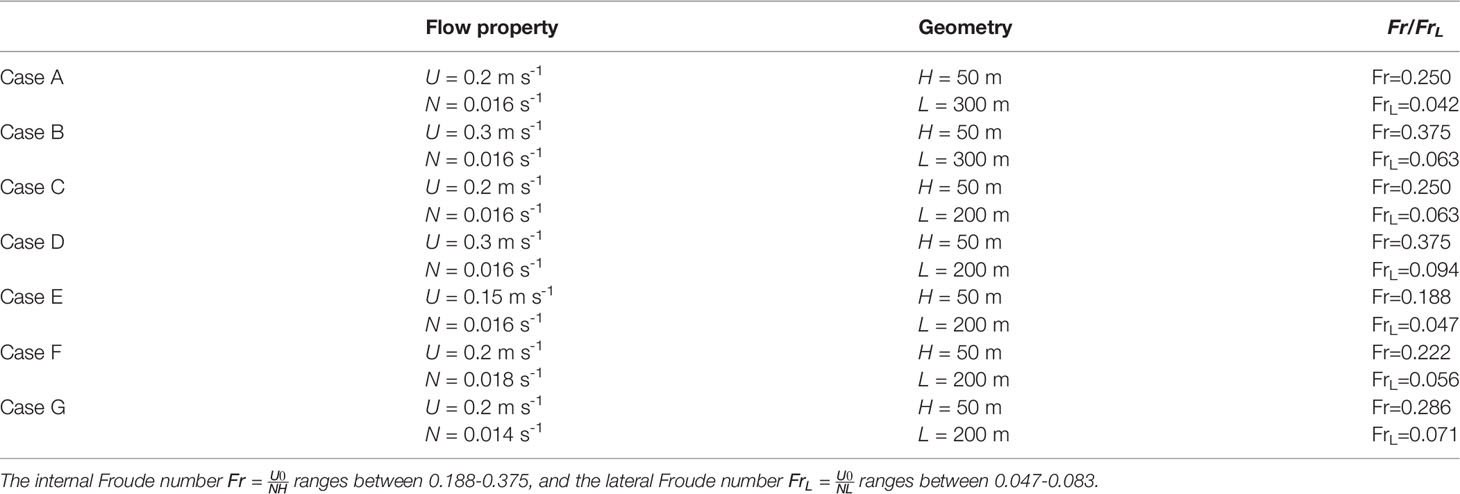
Table 1 In this study, model experiments with different intensities of shear flows and background stratification are conducted over narrow to wide ridges.
We used a body-fitting structured grid with uniform cells in each direction. The length of the computational domain is 2 km in the streamwise direction and 100 m in the spanwise direction, with a horizontal grid resolution of 1.25 m. The height of the computational domain in the vertical direction is 100 m with a vertical grid resolution of 0.4 m away from the topographic ridge. The smallest grid cells were at the peak of the ridge, which was 0.2 m, leading to the total number of grid points is 3.2 × 10⁷. A second-order TVD scheme was chosen for spatial discretization, and the first-order Euler method was used for time marching. A fixed time step was chosen for each case based on the CFL condition (CFL < 0.5). All simulations were first run for 20,000 to 30,000 seconds (simulation time) to ensure that the flow reached a quasi-steady state. After the initial spin-up, each simulation was continued for another 20,000 seconds to obtain data for analysis.
The CFD model OpenFOAM has been validated with water tank experiments (Stiperski et al., 2017) in the stratified flow over Gaussian-shaped obstacles in a water flume in which the given salinity controlled the flow stratification. In recent years, many prior studies of internal waves (Eiff and Bonneton, 2000) and flow-topography interactions (Lacaze et al., 2013; Dossmann et al., 2014) have been carried out in this facility in the geophysical fluid dynamics laboratory in Toulouse, France. The size of the flume is 22 m long, 1 m high, and 3 m wide. The model is able to reproduce the horizontal and vertical scales of trapped lee waves (Figure 2A), long waves (Figure 2B), and hydraulic jump (Figure 2C) observed in the laboratory experiment.
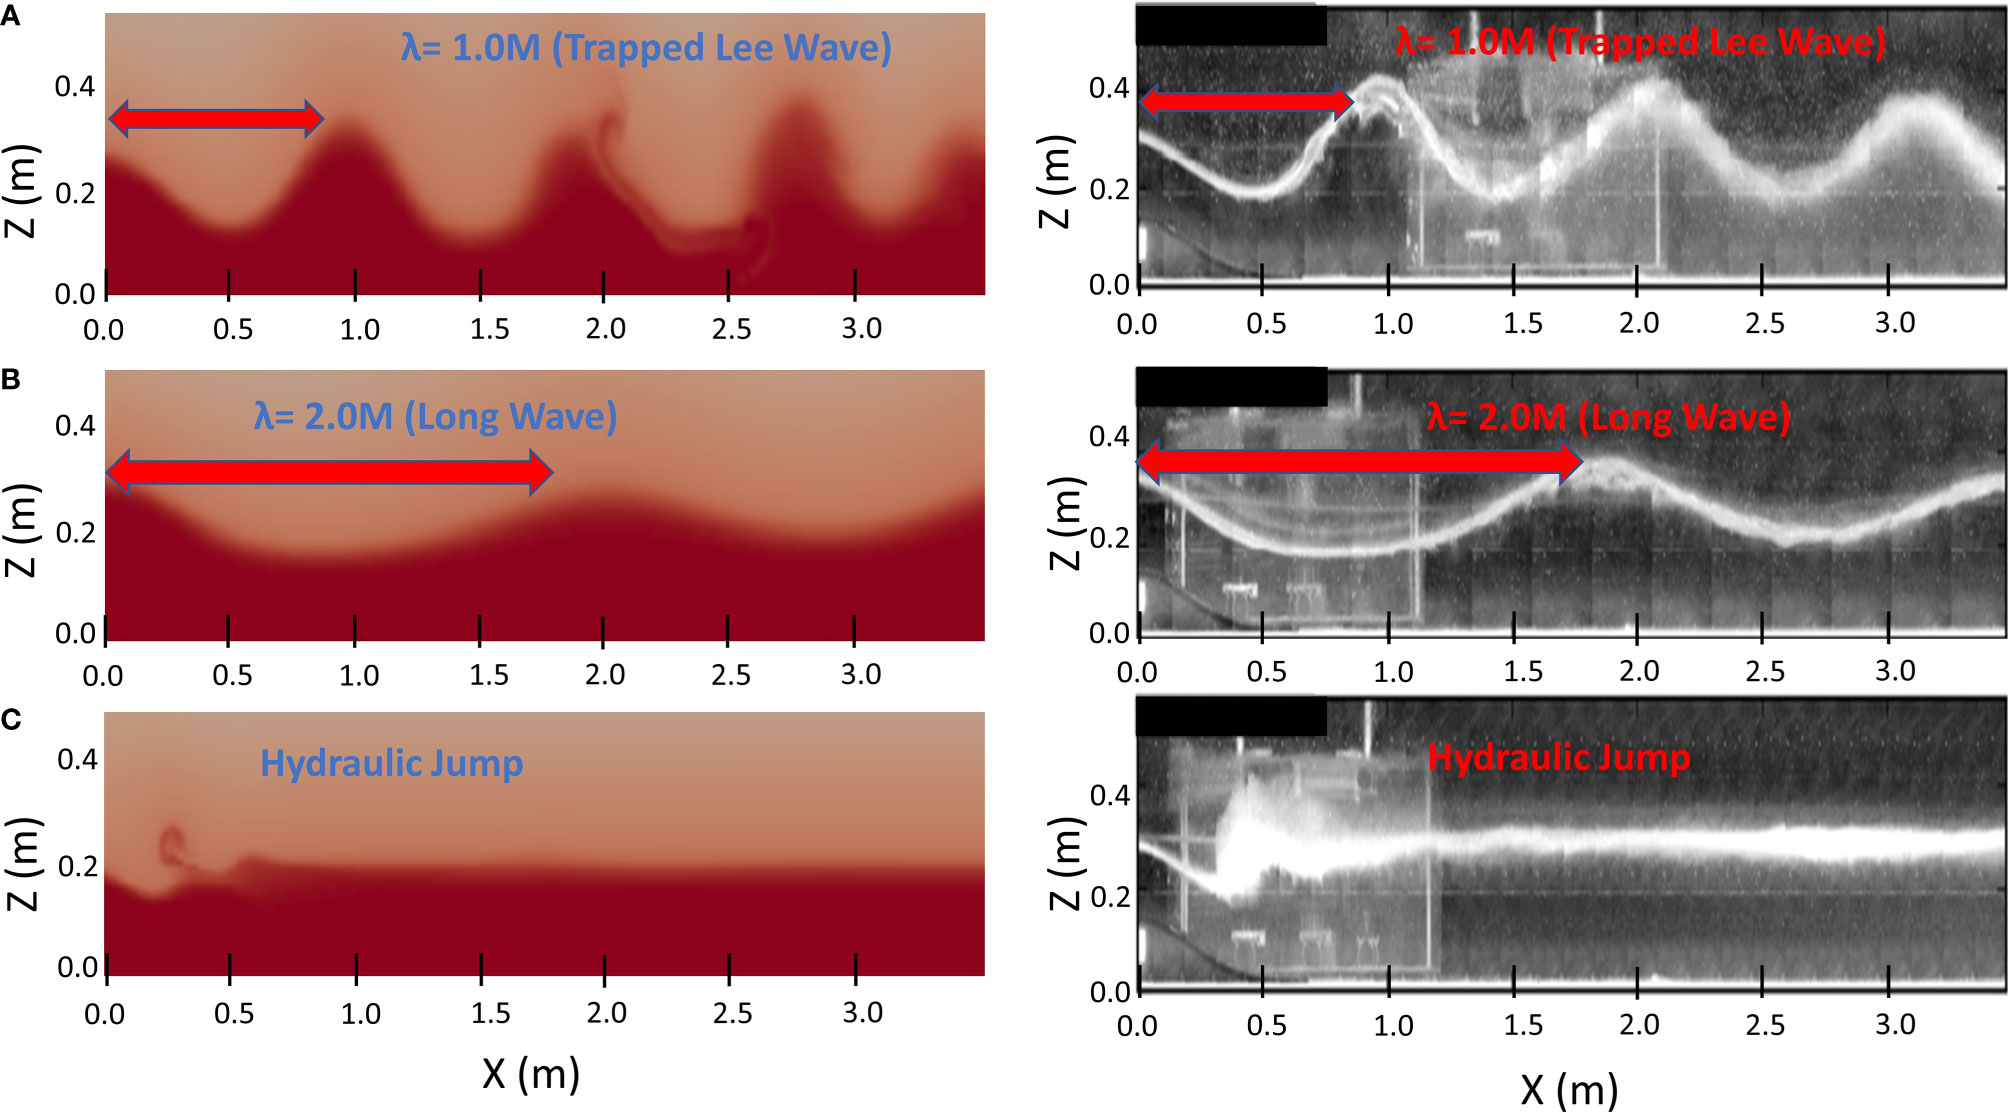
Figure 2 The numerical model is validated with water tank experiments (Stiperski et al., 2017) in the stratified flow over a two dimensional Gaussian-shaped obstacle in a water flume in which the given salinity controlled the flow stratification. Model simulations (the left panels) show that the numerical model is able to reproduce the horizontal and vertical scales of (A) trapped lee waves, (B) long waves, and (C) hydraulic jump observed in the laboratory experiment (the right panels).
For any conservative tracer s and velocity uj, the ensemble-mean and fluctuating components could be decomposed through Reynolds decomposition:
We assume incompressible flow and denote the ensemble-averaged tracer as 〈s〉 with the mean of the fluctuation vanishing 〈s'〉 and .
TKE can be produced by shear flow or bottom friction, transferred through the process of turbulence energy cascade, and dissipated by viscous forces at the Kolmogorov scale. The process of production, transport and dissipation of TKE is expressed as:
where k is the TKE, which is defined as one half of the sum of the velocity variance, with time t and the spatial coordinates xi (x1 = x, east westward, x2 = y, north southward, and x3 = z, up downward). The first term on the right-hand side (RHS) represents the pressure diffusion, the second term represents the turbulent transport, the third term represents molecular viscous transport, the fourth term represents turbulent production, the fifth term represents the turbulent dissipation, and the last term represents the buoyancy distraction.
In addition, the mass conservation can be described by the advection-diffusion equation for conservative tracer s without interior sinks or sources:
By applying several physically motivated mathematical rules (Pope, 2000), the conservation equation for the mean density 〈s〉 could also be derived as:
and a dynamic equation for the density variance 〈s'2〉 could be written as:
where ks is the turbulent tracer eddy diffusivity and the first term on the RHS represents the density variance production, and the last term represents the density variance dissipation. The density variance equation, in which the time change rate of density variance is modulated by the interplay of density variance production and dissipation due to microstructure shear, provides a mean for quantifying the contributions of turbulent generation and dissipation to the mixing processes of the conservative tracer such as salinity, nutrient, or other biological properties (Pope, 2000; Burchard and Rennau, 2008; MacCready et al., 2018).
The present numerical simulation with a spatial resolution close to the Ozmidov length scale successfully simulated three-dimensional turbulent coherent structures behind the topographic ridge. Figures 3, 4 show an example of the model results with the internal Froude number, Fr = 0.25. The freestream velocity on the top of the shear zone in the model inflow boundary is given as U0 =0.2 m s-1, corresponding to the should delete max observed flow velocity of 0.8 m s-1. When the energy flux ceases to increase due to topographic blocking effects, the saturated energy flux leads to the critical Froude number, Frc = 1 (Nikurashin and Ferrari, 2010b). A Froude number smaller than 1 implies downstream nonlinear internal lee waves and the blocking of flow upstream of the topography (Drazin, 1961; Aguilar and Sutherland, 2006; Winters and Armi, 2012). Figure 3A shows a snapshot of the simulation results of strong shear causing lee wave breaking and isopycnal heaving due to the involvement of irregular turbulent perturbations. Similar to the model results, the shipboard observation of echo sounder image also shows that the occurrence of lee waves and irregular oscillations in the lee of the topographic ridge (Figure 3B). The two-dimensional rollers and three-dimensional rib structures are shown in Figure 3C using the Q-method (Jeong and Hussain, 1995). At a high Reynolds number, shear instabilities evolve into turbulent coherent structures and break into smaller structures with local irregularities in terms of shapes and intensities.
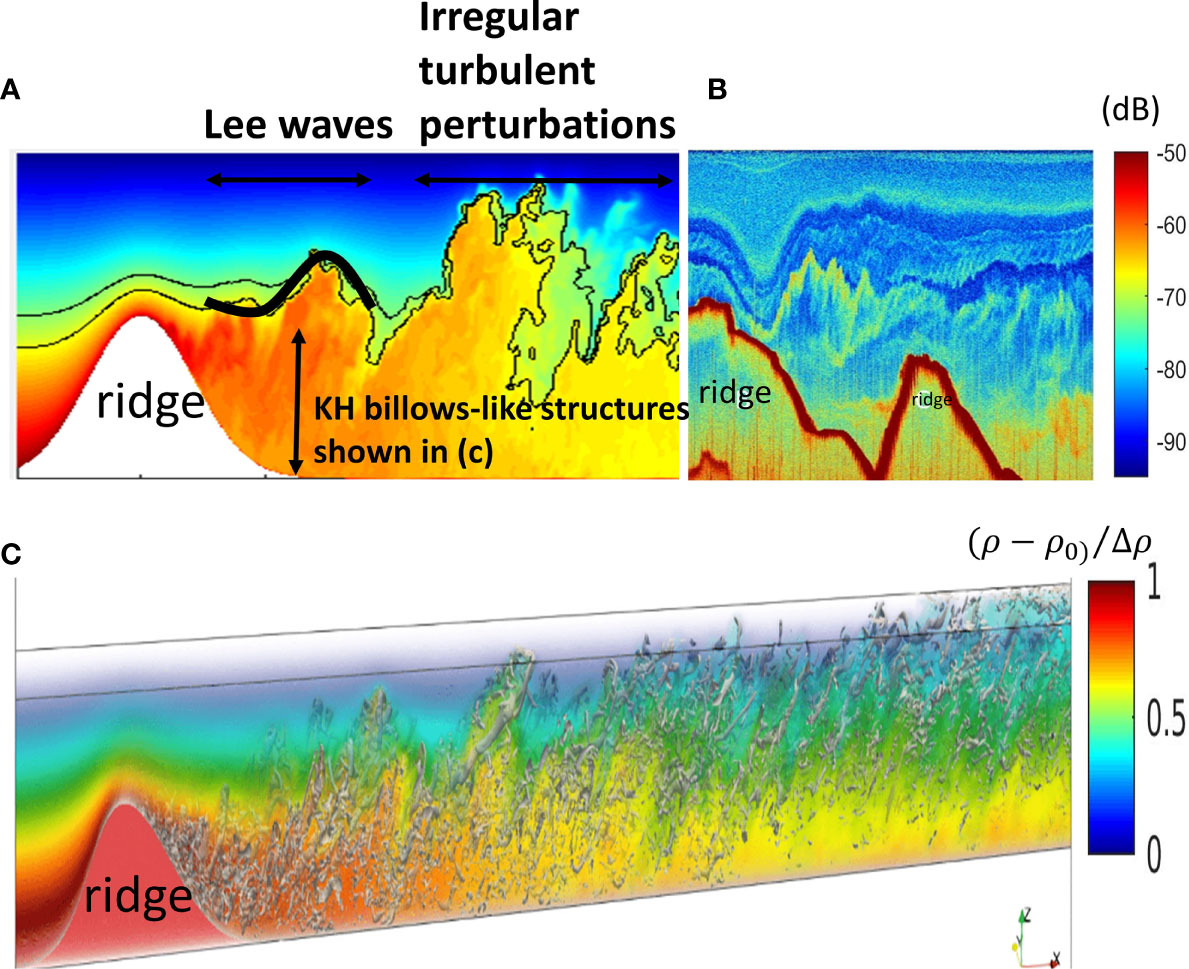
Figure 3 (A) A schematic diagram shows the process of lee wave breaking and irregular turbulent perturbations in the lee of the topographic ridge. The color shows normalized density (ρ – ρ0)/Δρ, where Δρ is the density difference between the top and bottom boundary and ρ0 is the background density [see the color legend in (C)]. (B) The shipboard observation of echo sounder intensity shows that the occurrence of lee waves and irregular oscillations in the lee of the topographic ridge. (C) Model results of KH billows-like structures. The coherent structures associated with shear instabilities are visualized by Q-method (Jeong and Hussain, 1995). The vertical coordinate is scale up five times for the visualization purpose.
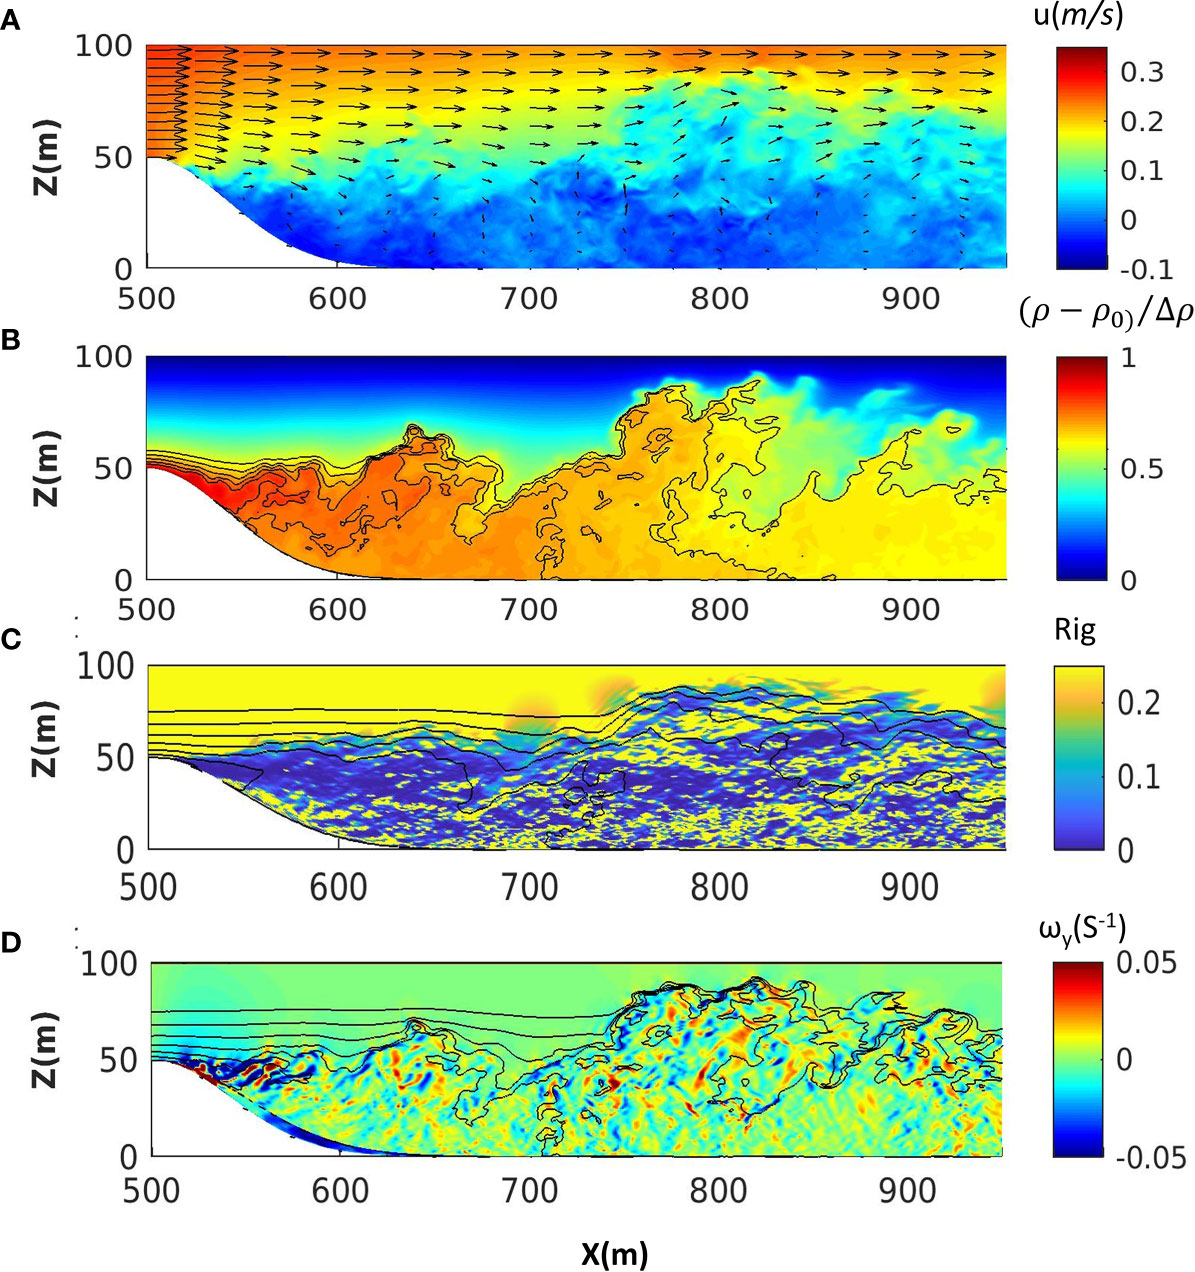
Figure 4 Model simulations (Fr=0.25) of (A) streamwise velocity at the central transect of the spanwise direction, (B) normalized density (ρ – ρ0)/Δρ, where Δρ is the density difference between the top and bottom boundary and ρ0 is the background density, (C) the gradient Richardson number calculated based on the spanwise averaged density gradient and velocity gradient (the spanwise averaged normalized density is shown as contour lines), and (D) the instantaneous spanwise vorticity ω_y=∂_z U+∂_x W (the instantaneous normalized density is shown as contour lines). The two-dimensional topography is parameterized by a Gaussian function.
Figure 4A shows the simulated instantaneous velocity model results along the spanwise direction’s central transect. An accelerated jet-like layer formed over the ridge crest, and strong flow shear was induced in the boundary layer as the jet accelerated. The enhanced vertical shear and the return flow at the Z = 0-50 m (opposing the mean flow shown in blue in Figure 4A) appear downstream of the topography. Consequently, the strong shear flow between the jet and return flow leads to instabilities and mixing of the stratification (Figure 4B). The entrainment of denser fluid driven by shear-induced turbulent processes leads to an increase in the mixing layer thickness (Baines and Hoinka, 1985; Best, 2005; Talke et al., 2010; Klymak and Legg, 2010; Winters and Armi, 2013; Winters and Armi, 2014). The gradient Richardson number is computed to help identify the presence of shear instabilities (Figure 4C). The model results show that shear instabilities characterized by Rig < 0.25 occur below the interface of the lee wave (Farmer and Armi, 1999; Eiff and Bonneton, 2000). The vertical flow shear overcomes the stratification leading to Rig < 0.25 and initializes the generation of instabilities with strong spanwise vorticity (vortex rollers) near topography (strong blue color shown in Figure 4D).
The model result based on the three-dimensional topography parameterized by a Gaussian function is also discussed and compared with the results based on the simulations over two-dimensional topography shown in the above section. The return flow and lee wave generation are relatively weaker on the downstream side of the three-dimensional topography because of the flow splitting around the topographic ridge (Figure 5A). Model results show that the entrainment of denser fluid drives the mixing layer. An example of the entrainment of the denser fluid from the lower layer to the upper layer of the water column could be clearly seen between x=700-800 m in Figures 4B and 5B. The mixing layer thickness indicated by the normalized density between 0.6 and 0.8 (the minimum and maximum value of the contour line) shows that the mixing layer thickness behind the two-dimensional topography (Figure 4B) is greater/thicker than that behind the three-dimensional topography (Figure 5B). The major difference between the model result based on the three-dimensional topography and the two-dimensional topography is the flow separation around the topography. Because deep flow does not go over the top of the three-dimensional topography, the effective topography height is smaller and the lee wave generation is weaker. In addition to breaking lee waves and shear instabilities shown in the X-Z plane, the turbulent wake is another process to generate horizontal instabilities in the X-Y plane (Figure 5C). The normalized density at z= 50 m in the X-Y plane is around 0.7, and is up to 0.8 at the side of the turbulent wake. The lighter fluid from the upper layer could be clearly seen along the central transect where the normalized density is as low as 0.3 (indicated by the black dash line in Figure 5C). It is noted that the focus of this study is the vertical mixing enhancement generated by lee wave breaking and shear instabilities along the central transect. Therefore, the three-dimensional simulation shown earlier in Figure 4 was conducted over a two-dimensional topographic ridge with different ambient conditions, similar to the approach used for simulating flow over the west ridge of Luzon Strait (Jalali and Sarkar, 2017). The model result shows the snapshot of the simulated shear instabilities, which evolve into turbulent coherent structures and break into smaller structures with local irregularities in terms of shapes and intensities (Figure 3C). Horseshore vortex can be clearly identified, which characterizes the shear layer and is the main vortex structure. The vortex structure altering by different simulation parameters is analyzed by the characteristics of the turbulent shear layer in the next section.
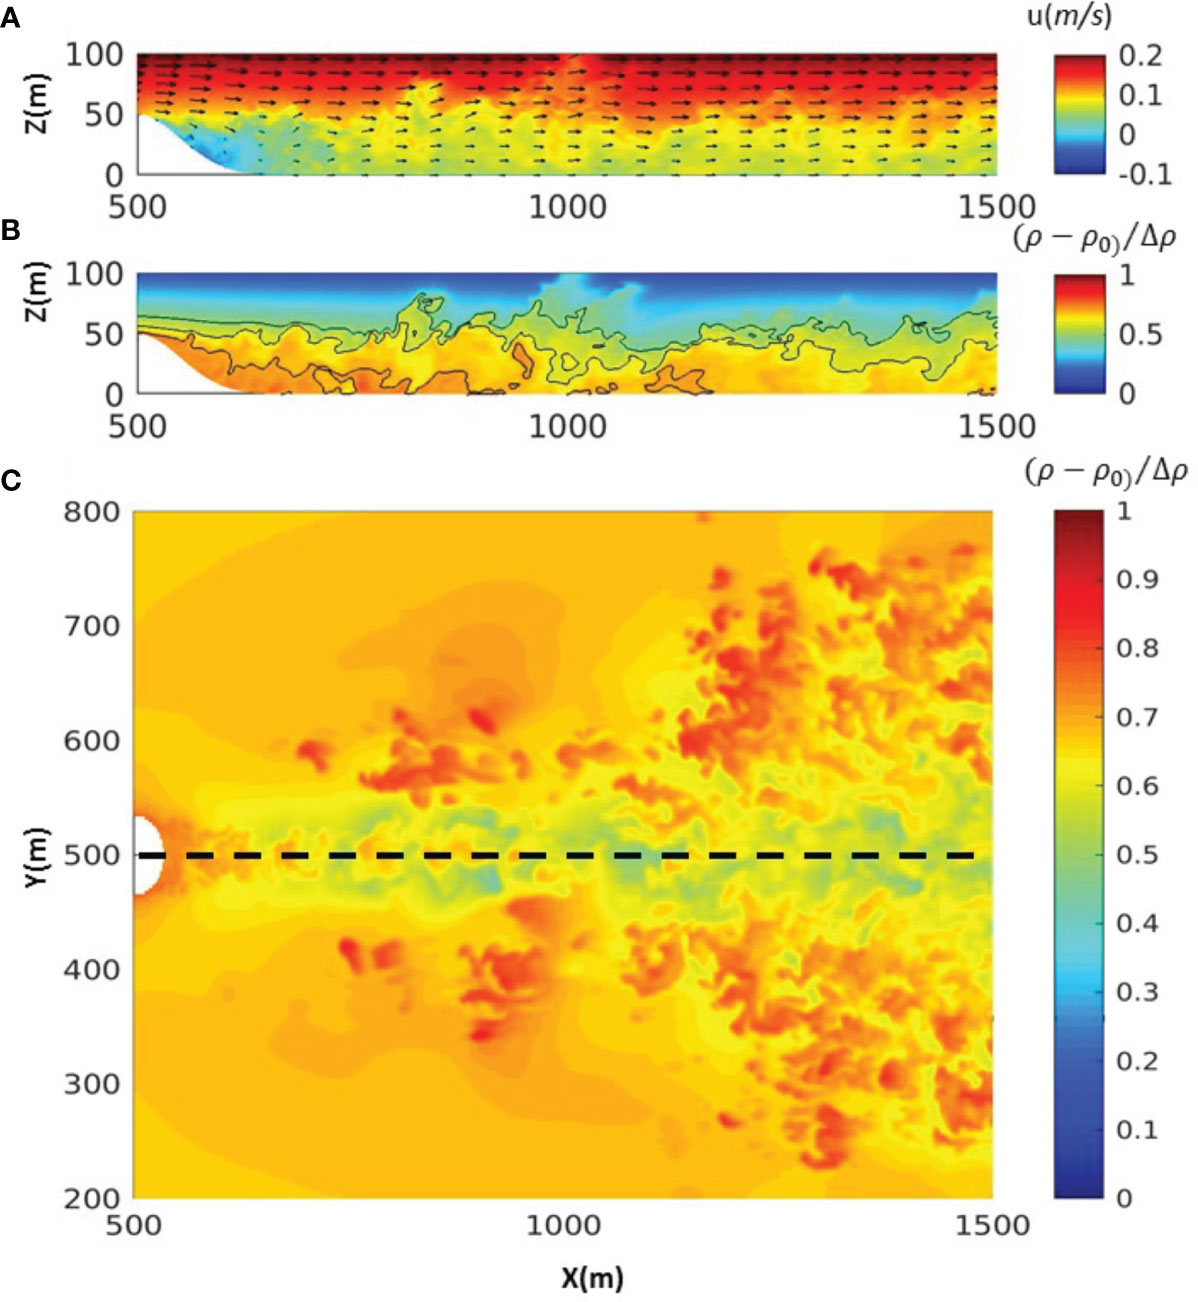
Figure 5 Model simulations (Fr=0.25) of (A) streamwise velocity at the central transect of the spanwise direction, (B) normalized density (ρ – ρ0)/Δρ, where Δρ is the density difference between the top and bottom boundary and ρ0 is the background density, and (C) the plane view of normalized density at z= 50m. The yellow dashed line indicates the central transect in the spanwise direction. The three-dimensional topography is parameterized by a Gaussian function.
The simulated time series of coherent structures behind the topographic ridge are further discussed with field observations. Figure 6 shows the observed echo intensity measured behind a topographic ridge along the route of the Kuroshio by a 120 kHz shipboard echo sounder (Figure 6A), density obtained from CTD profiling, velocity profiles obtained from a 150 kHz ADCP, and the gradient Richardson number, which provides a rough indication of shear instabilities (Figure 6B). The scattering of sound waves caused by the presence of a strong density gradient indicates that inclined, asymmetric, cusp-like bands form the temporal distribution of sound waves (Lavery et al., 2013; Chang et al., 2016). These patterns are different from the symmetric structure caused by an inflection point where a change in the horizontal velocity direction occurs at the middle of the water column (Chang et al., 2016). Figure 7A shows the observed time averaged density profile (red, original profile) and the density profile reordered as a function of depth (blue, reordered profile); Figure 7B shows the time averaged flow shear G2 (red) and buoyancy frequency (blue). The gradient Richardson number falls between 0.2 and 0.25 at depths below the cusp-like band (depth< -140 m, indicated by the white dashed line in Figure 6A). The regime below the cusp-like band satisfies the condition of shear instability with Rig < 0.25, overlapping with the locations of density overturns (comparing the original and re-ordered density profiles in Figure 7A).
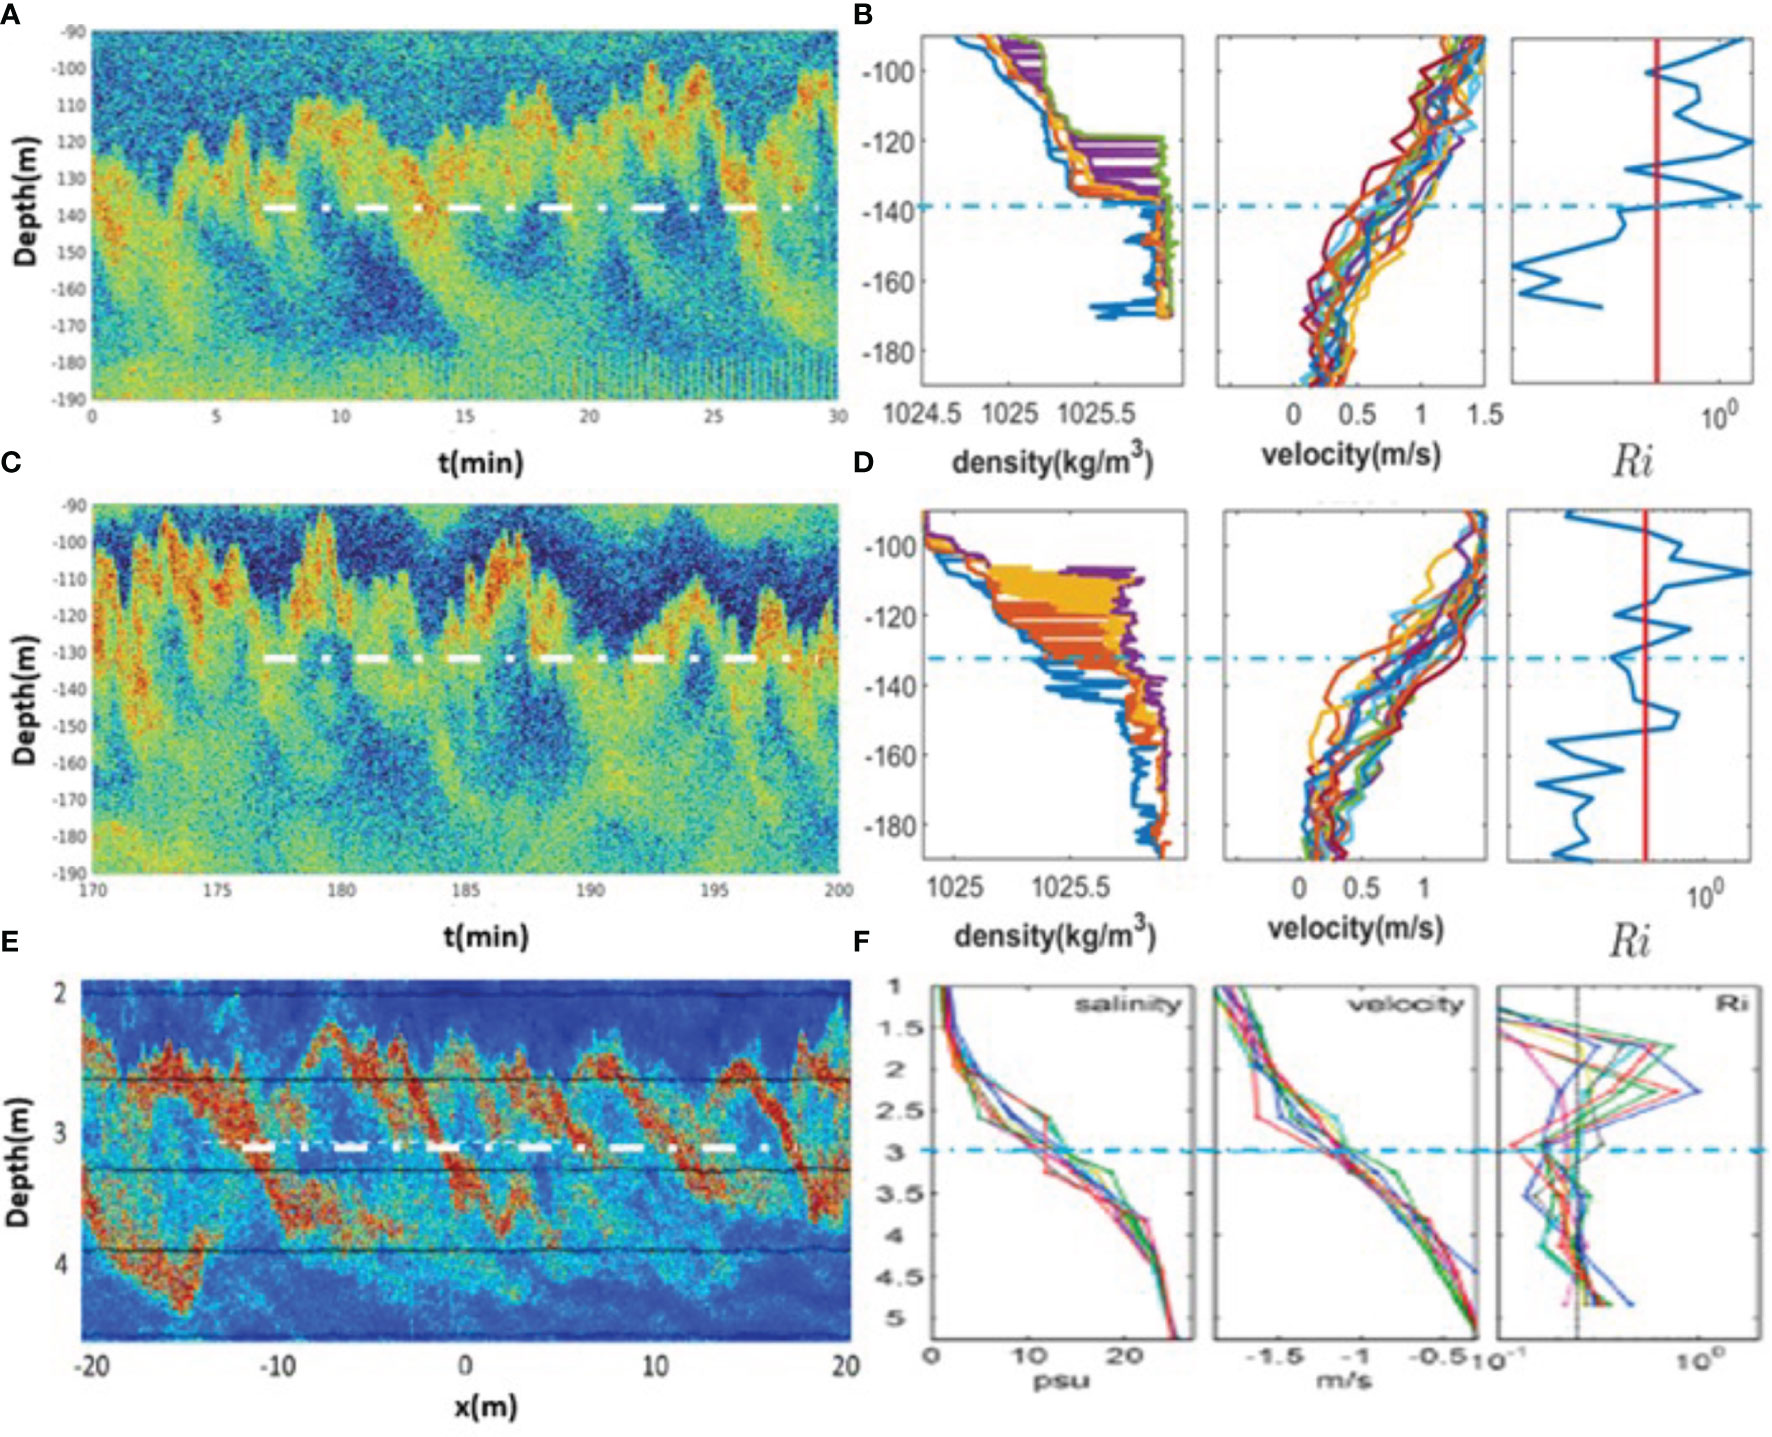
Figure 6 (A, C) The observed echo sounder intensity, (B, D) density profiles, velocity profiles, and the gradient Richardson number (red solid lines indicate Rig=0.25) in the lee of a topographic ridge near the Green Island along the route of the Kuroshio. Observations were taken between (A) 03/22/2012 06:22:23-06:52:23AM and (C) between 03/22/2012 09:13:43-09:43:43AM. In the x axis t=0 is set as 03/22/2012 06:22:23. The white/blue dash lines separate the cusp-like band and the core of shear instabilities (indicated by white circles in Figure 5A) with Rig<0.25. (E) The observed echo sounder intensity, (F) salinity profiles, velocity profiles, and the gradient Richardson number in the Connecticut River, USA. The figure is adopted from Geyer et al. (2010).
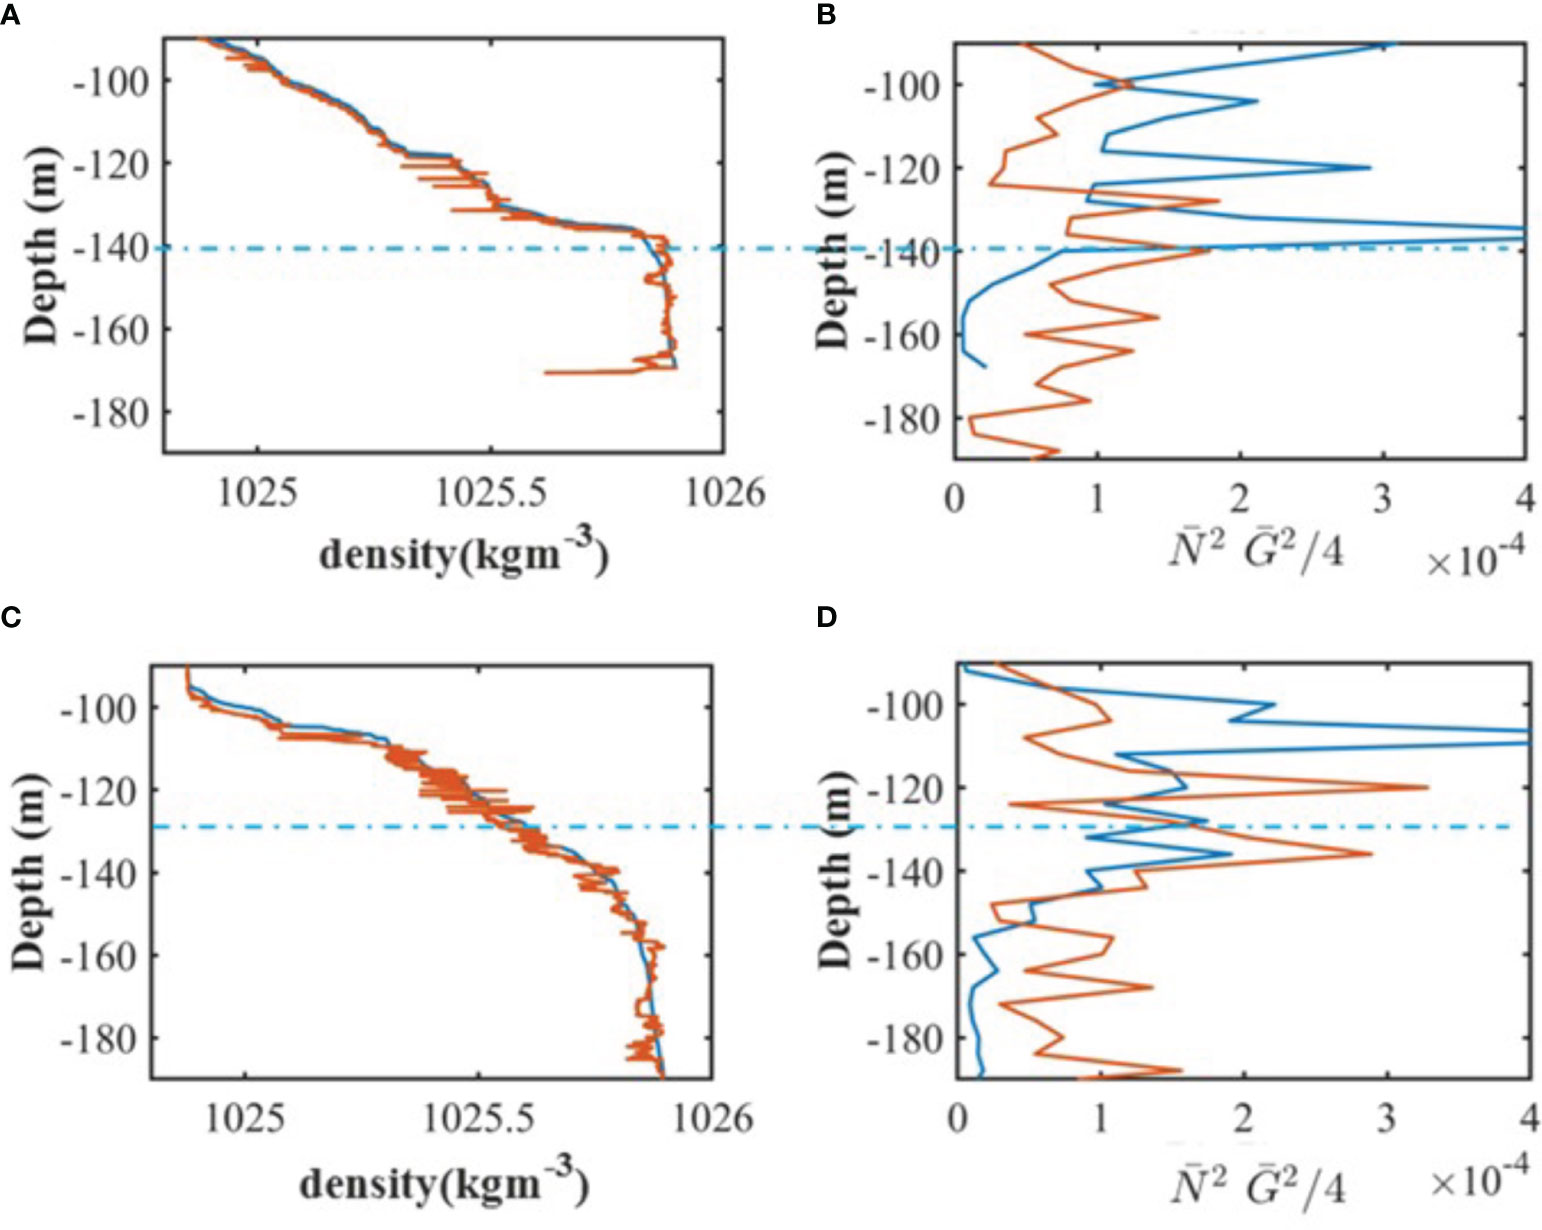
Figure 7 (A) the left panel: the observed time averaged density profile (red, original profile) and (B) the density profile reordered as a function of depth (blue, reordered profile); the right panel: the time averaged flow shear G2 = (∂zU)2 + (∂zV)2 (red) and buoyancy frequency (blue) between 03/22/2012 06:22:23-06:52:23AM. The blue dash line separates the cusp-like band and the core of shear instabilities (indicated by white circles in Figure 5A) with Rig<0.25. (C) the left panel: the observed time averaged density profile; (D) the right panel: the time averaged flow shear and buoyancy frequency between 03/22/2012 09:13:43-09:43:43AM.
Previous literature shows that the distributions of the density variance dissipation rate clearly indicates that the mixing of tracer occurs exclusively in the braids of shear instabilities (Geyer et al., 2010). Therefore, the temporal distribution of the density variance dissipation [the second term of the RHS in the Equation (11)] provides a means to visualize the structure of shear instabilities and the resulting turbulent mixing. The simulated density variance dissipation at location x=800m (see Figure 4 for the location) is compared with the temporal variation of acoustical backscatter intensity (see Figure 8). The observed echo intensity (Figure 8A) and the simulated density variance dissipation (Figure 8B) are considerably elevated in the braid mixing zone of shear instabilities with a specific period of 10 to 15 minutes (‘M-B’ indicates the location of the braid and the white circle indicates the core of shear instabilities in Figure 8). Correspondingly, each inclined cusp-like pattern has a horizontal length scale of 200 m and a vertical scale of 100 m. The vertical length scale of each inclined cusp-like pattern is nearly half of the vertical length scale of the internal lee wave (Klymak et al., 2010), but the wavelength is consistent with instabilities originating from a shear‐layer based on the linear stability theory (Hazel, 1972). Therefore, the observed echo intensity and the simulated density variance dissipation in the lee of a topographic ridge are relevant to KH billows-like structures of shear instabilities.
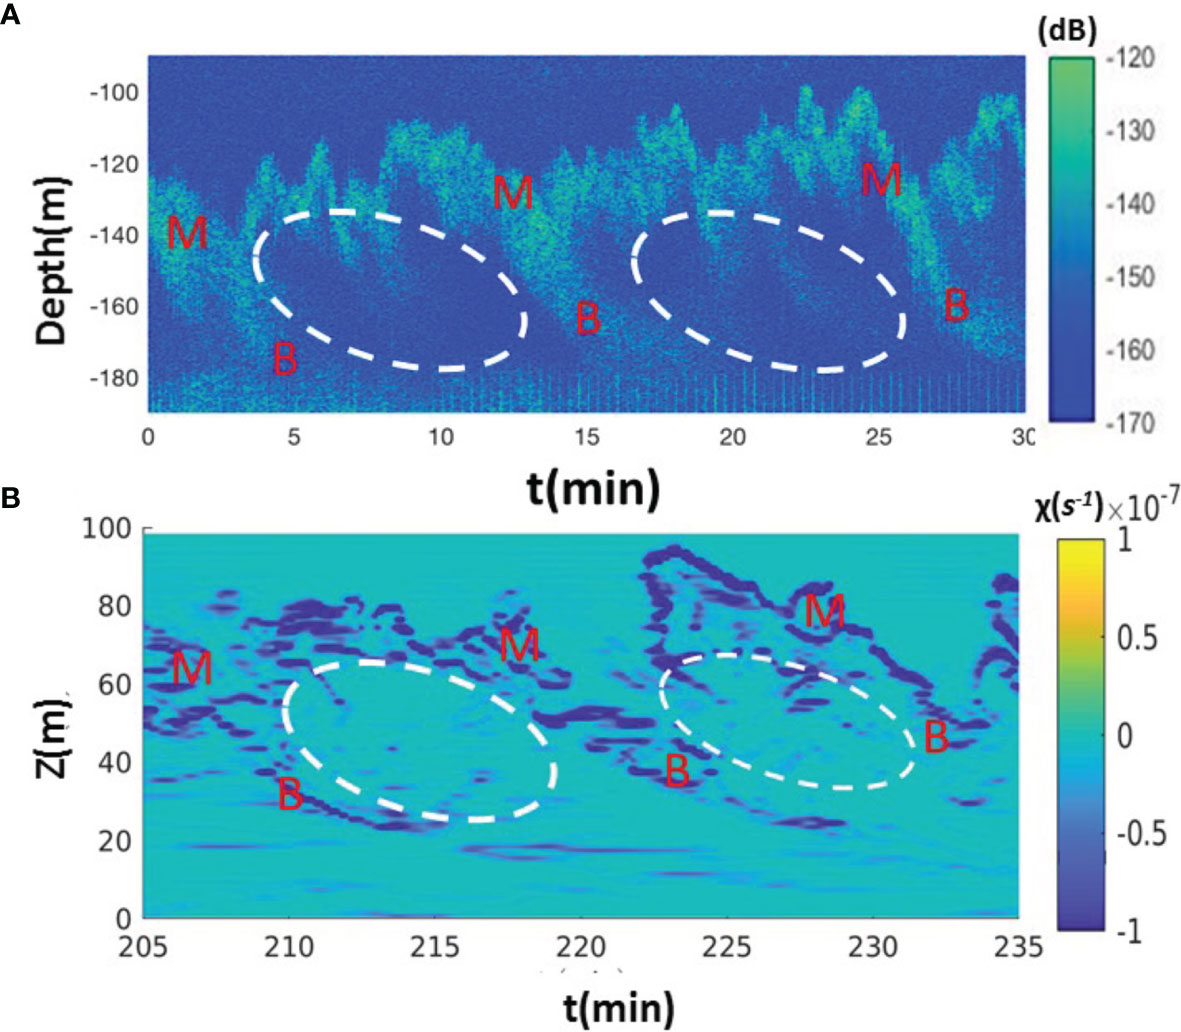
Figure 8 (A) The observed echo intensity. ‘M-B’ indicates the location of the braid mixing zone and white circles indicate the core of shear instabilities. Observations were taken between 03/22/2012 06:22:23-06:52:23AM. In the x axis t=0 is set as 03/22/2012 06:22:23. (B) The patterns of the simulated density variance dissipation rate at x=800m (see Figure 4 for the location).
Figures 6C and D shows another example of the observed echo intensity, density profiles, and velocity profiles. The temporal variations in acoustic backscatter intensity exhibit a specific period of 5 to 8 minutes. The regimes with Rig < 0.25 overlap with the locations of density overturns (comparing the original and re-ordered density profiles in Figure 7C). The vertical flow shear is greater than the buoyancy frequency at depths greater than 130 m (Figure 7D). The pattern of the observed echo intensity is similar to previous field observations in the inner transect at the mouth of the Connecticut River, where strong shear flow is generated by the interaction of tidal currents and river plumes (Geyer et al., 2010). Strong density anomaly variance occurs mainly along the braids of shear instabilities indicated by high acoustic backscatter intensity (Figures 6E, F). The mixing zones appear more extensively in the upper limb of the braid due to the stronger vertical shear induced by the greater relative velocity in the upper water column.
Echo sounder images from shipboard observations suggest that both horizontal and vertical distribution of oscillation patterns could be modulated by the ambient conditions. For example, the horizontal scale of the braid shown in Figure 6C is smaller than the one shown in Figure 6A possibly due to the stronger shear rate (the maximum value of the red curve in Figure 7D is greater than that in Figure 7B). In this study, model experiments with different inflow velocities and background stratification is further discussed in this section. Prior laboratory experiments showed that the boundary layer separation and the source for turbulence generation downstream of the topographic ridge depend strongly on the shape of the topography (Aguilar and Sutherland, 2006). In this study, numerical are conducted over narrow and wide ridges. The internal Froude number (F_r = Uo/NH) ranges between 0.188-0.375 and the lateral Froude number Fr_L=Uo/NL ranges between 0.047-0.094, where L is the width of the ridge (Table 1).
The model result used to compare with the observed core-braid structure of shear instabilities is Case C with Fr = 0.25 and FrL = 0.063. The core of shear instabilities with Rig <0.25 is shown as white dashed circles under the braids of shear instabilities with the strong density variance dissipation (Figures 8B, 9). The high-density variance dissipation rate [up to O(10-4 s-1)] are exclusively localized to the cusp-like band with a period of 10-15 minutes. The effect of the internal Froude number on down-stream nonlinear internal lee-waves has been discussed in previous studies (Drazin, 1961; Aguilar and Sutherland, 2006; Winters and Armi, 2012; Dossmann et al., 2016; Perfect et al., 2020b). In this section, the effect of the lateral Froude number on down-stream conditions is discussed based on numerical experiments over a wide and narrow ridge. Figures 9, 10 show the model results of flow shear, TKE dissipation, density variance dissipation, and eddy diffusivity of Case C and A at location x=800 m (see Figure 4 for the location). Model results over a relatively wide ridge show that the shear instabilities have a period of 20-30 minutes (Case A with Fr = 0.25 and FrL = 0.043, Figures 10A). In addition to the changes in period and the horizontal length scale of shear instabilities, the thickness of the mixing layer (indicated by the stronger density variance shown in Figure 12A) also decreases in the case with the milder geometric slope. The TKE dissipation rate of Case C is up to 10-6 m2 s-3 (Figure 9C) and the TKE dissipation rate of Case A is in the order of 10-7 m2 s-3 (Figure 10C). Although regimes of Rig > 0.25 are found above z = 70 m in both cases, it is noted that the density variance dissipation of Case A is an order of magnitude smaller than the density variance dissipation of Case C (see Figures 9D and Figure 10D). Correspondingly, the vertical eddy viscosity is heterogeneously distributed over the water depth and the estimated eddy diffusivity of Case A is up to ks= 10-3 m2 s-1, which is an order of magnitude smaller than the estimated eddy diffusivity of Case C (see Figures 9E and Figure 10E). The model results show that the vertical mixing enhancement due to flow topography interactions could be ten times weaker when the flow goes over a relatively milder ridge and FrL decreases from 0.063 to 0.043.
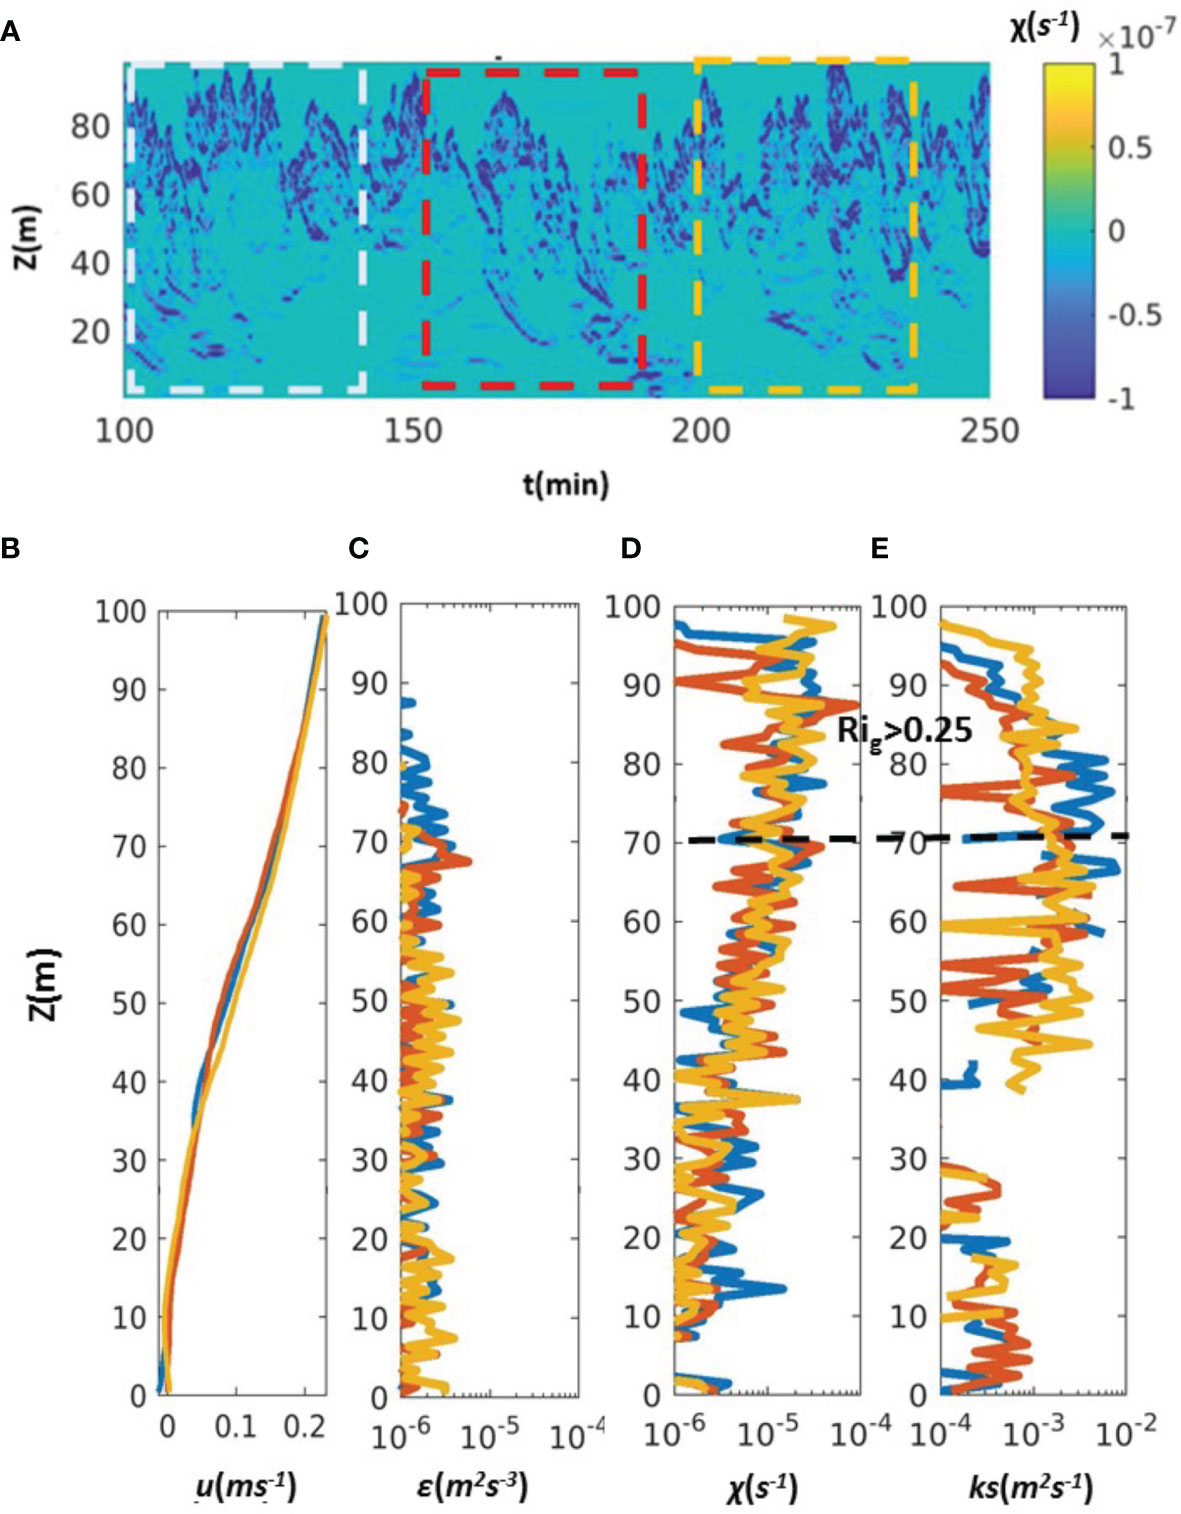
Figure 9 Model results of Case C: the time series of (A) density variance dissipation. The blue, red, and orange lines indicate the interval for 30 minutes time average. (B) The time average profiles of flow shear, (C) TKE dissipation rate, (D) density variance dissipation, and (E) eddy diffusivity at location x=800 m (see Figure 4 for the location).
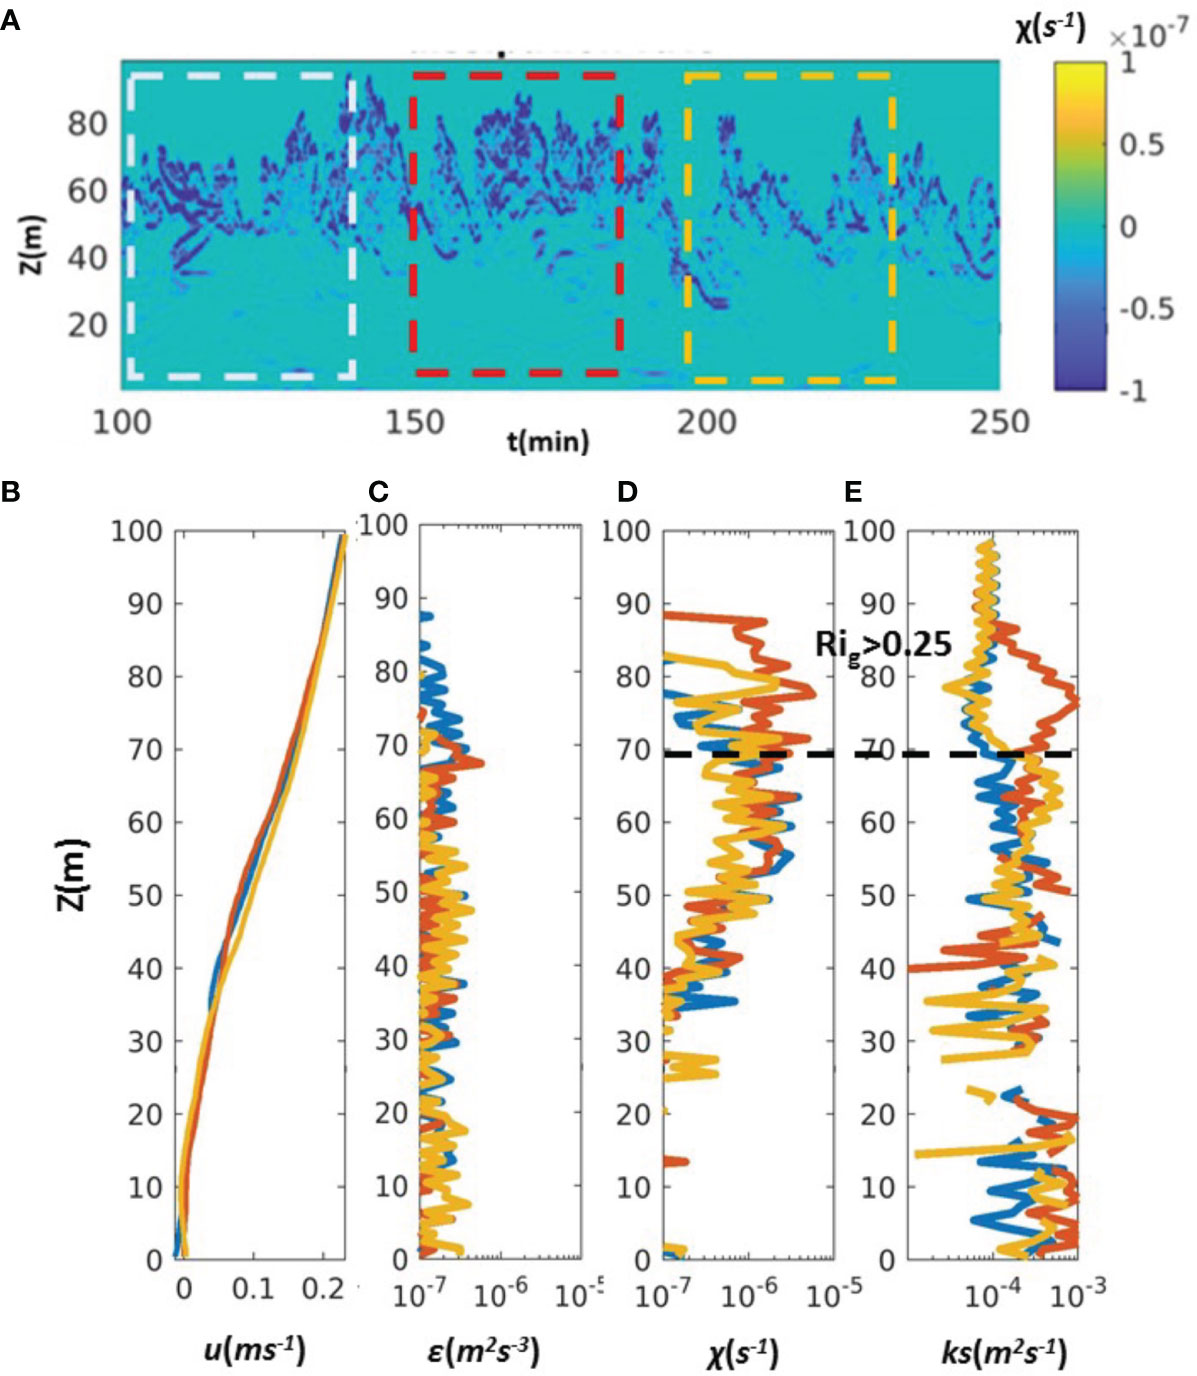
Figure 10 Model results of Case A: the time series of (A) density variance dissipation. The blue, red, and orange lines indicate the interval for 30 minutes time average. (B) The time average profiles of flow shear, (C) TKE dissipation rate, (D) density variance dissipation, and (E) eddy diffusivity at location x=800 m (see Figure 4 for the location).
In this section, model experiments with different inflow velocities are discussed to characterize the intensity of turbulent mixing due to shear instabilities. The freestream velocity on the top of the shear zone is given as U0 = 0.125-0.3 m s-1, corresponding to the maximum observed flow velocity ranging from 0.5 m s-1 to 1.2 m s-1, which represents the velocity of Kuroshio flow modulated by diurnal and semidiurnal tides and internal waves. Model results indicate that shear instabilities do not occur when the lower free stream velocity (U0 = 0.15 m s-1, Case E, with Fr = 0.188 and FrL = 0.047) is given in the inflow boundary. As the shear flow increases to 0.3 m s-1, the simulated shear instabilities have a shorter period of 5 minutes (Case B, with Fr = 0.375 and FrL = 0.063, Figure 11). A diagram including the density variance of Cases A-C further indicates that the period of shear instabilities and the thickness of mixing layer is relevant to Fr or FrL (Figures 12A), and the braid mixing zone with a high TKE dissipation rate appears more frequently while the flow shear increases. The resulting depth-averaged density variance dissipation rate of Case B (U0 = 0.3 m s-1) is greater than O(10-5 s-1) and the estimated eddy diffusivity ks is up to 10-2 m2 s-1, which is one order magnitude greater than that of Case A (U0 = 0.2 m s-1, Figure 11). A diagram including model results of the depth-averaged mixing rate (the depth-averaged TKE dissipation rate and density variance dissipation rate) of Case A-G is summarized in Figure 13. Each dot represents the depth-averaged TKE dissipation rate or the density variance dissipation rate based on 30-minute average profiles at location x=800 m (see Figure 4 for the location). The lowest depth-averaged TKE dissipation rate is shown in Case A (O(10-7 m2 s-3)) with FrL=0.024, and the highest mixing rate is shown in Case D (O(10-5 m2 s-3)) with FrL=0.094. The FrL values are the same for Case B and Case C, but the depth-averaged TKE dissipation rate of Case B (U0 = 0.3 m s-1) is slightly higher. The model results indicate that the depth-averaged TKE dissipation rate ranges between O(10-7 m2 s-3) and O(10-5 m2 s-3) and increases with the strength of shear flows.
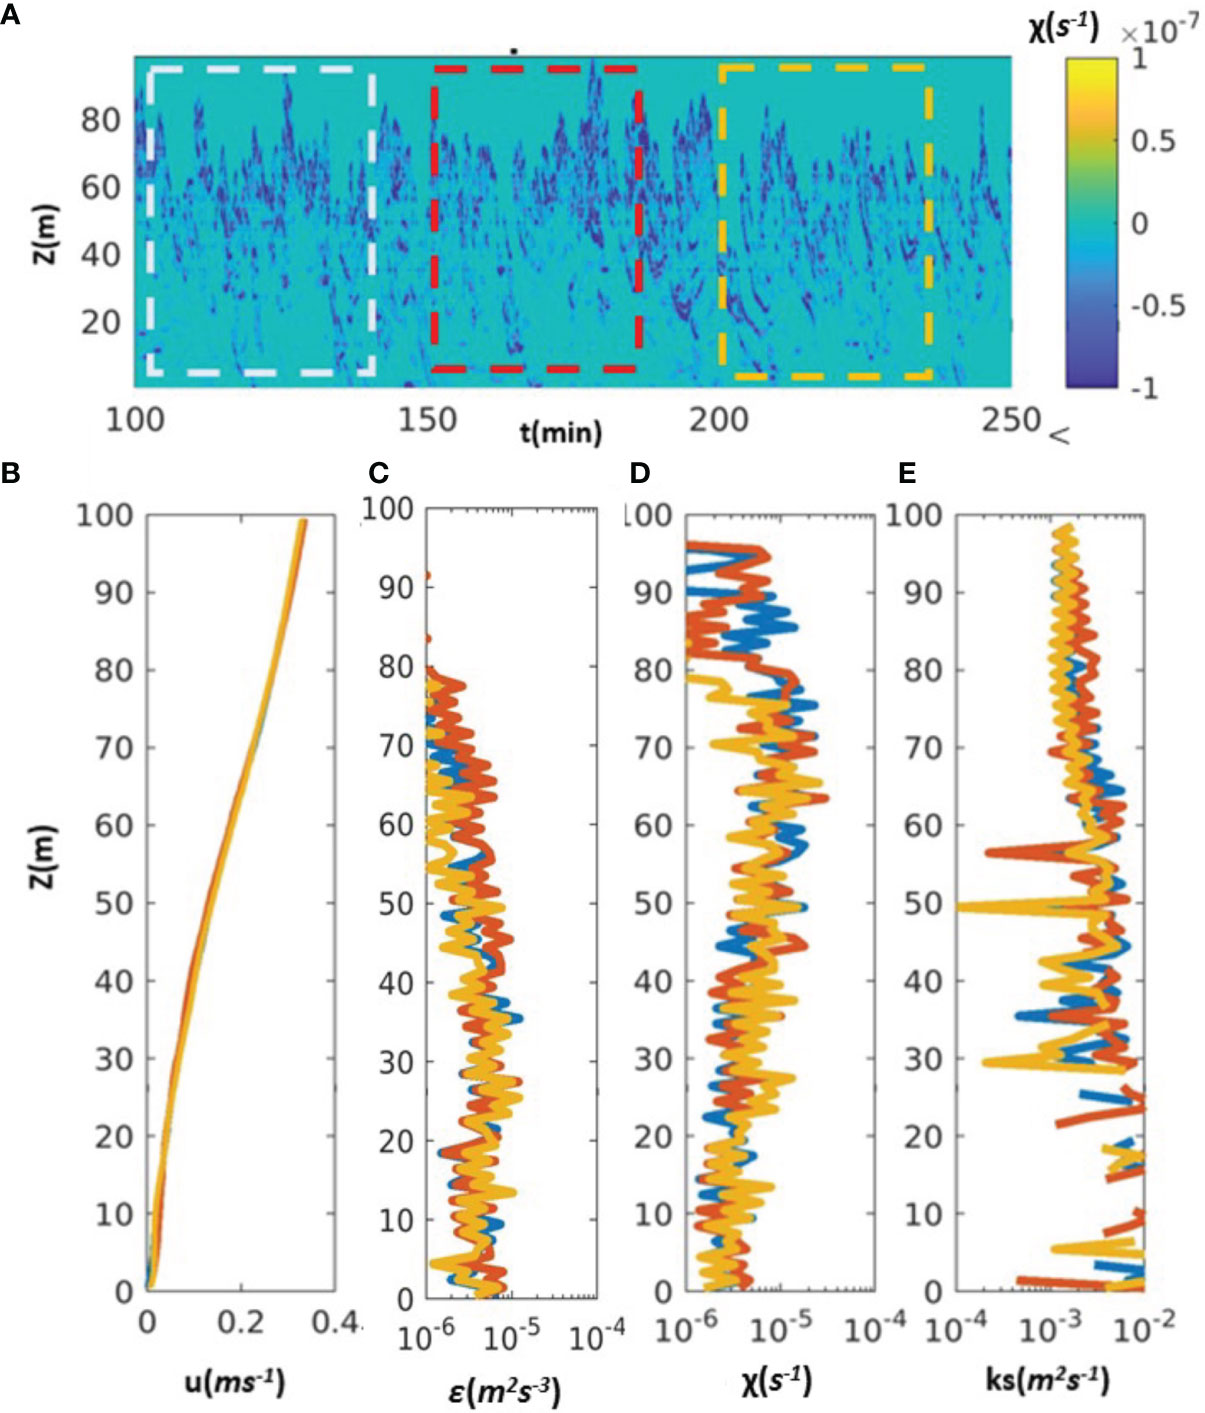
Figure 11 Model results of Case B: the time series of (A) density variance dissipation. The blue, red, and orange lines indicate the interval for 30 minutes time average. (B) The time average profiles of flow shear, (C) TKE dissipation rate, (D) density variance dissipation, and (E, C) eddy diffusivity at location x=800 m (see Figure 4 for the location).
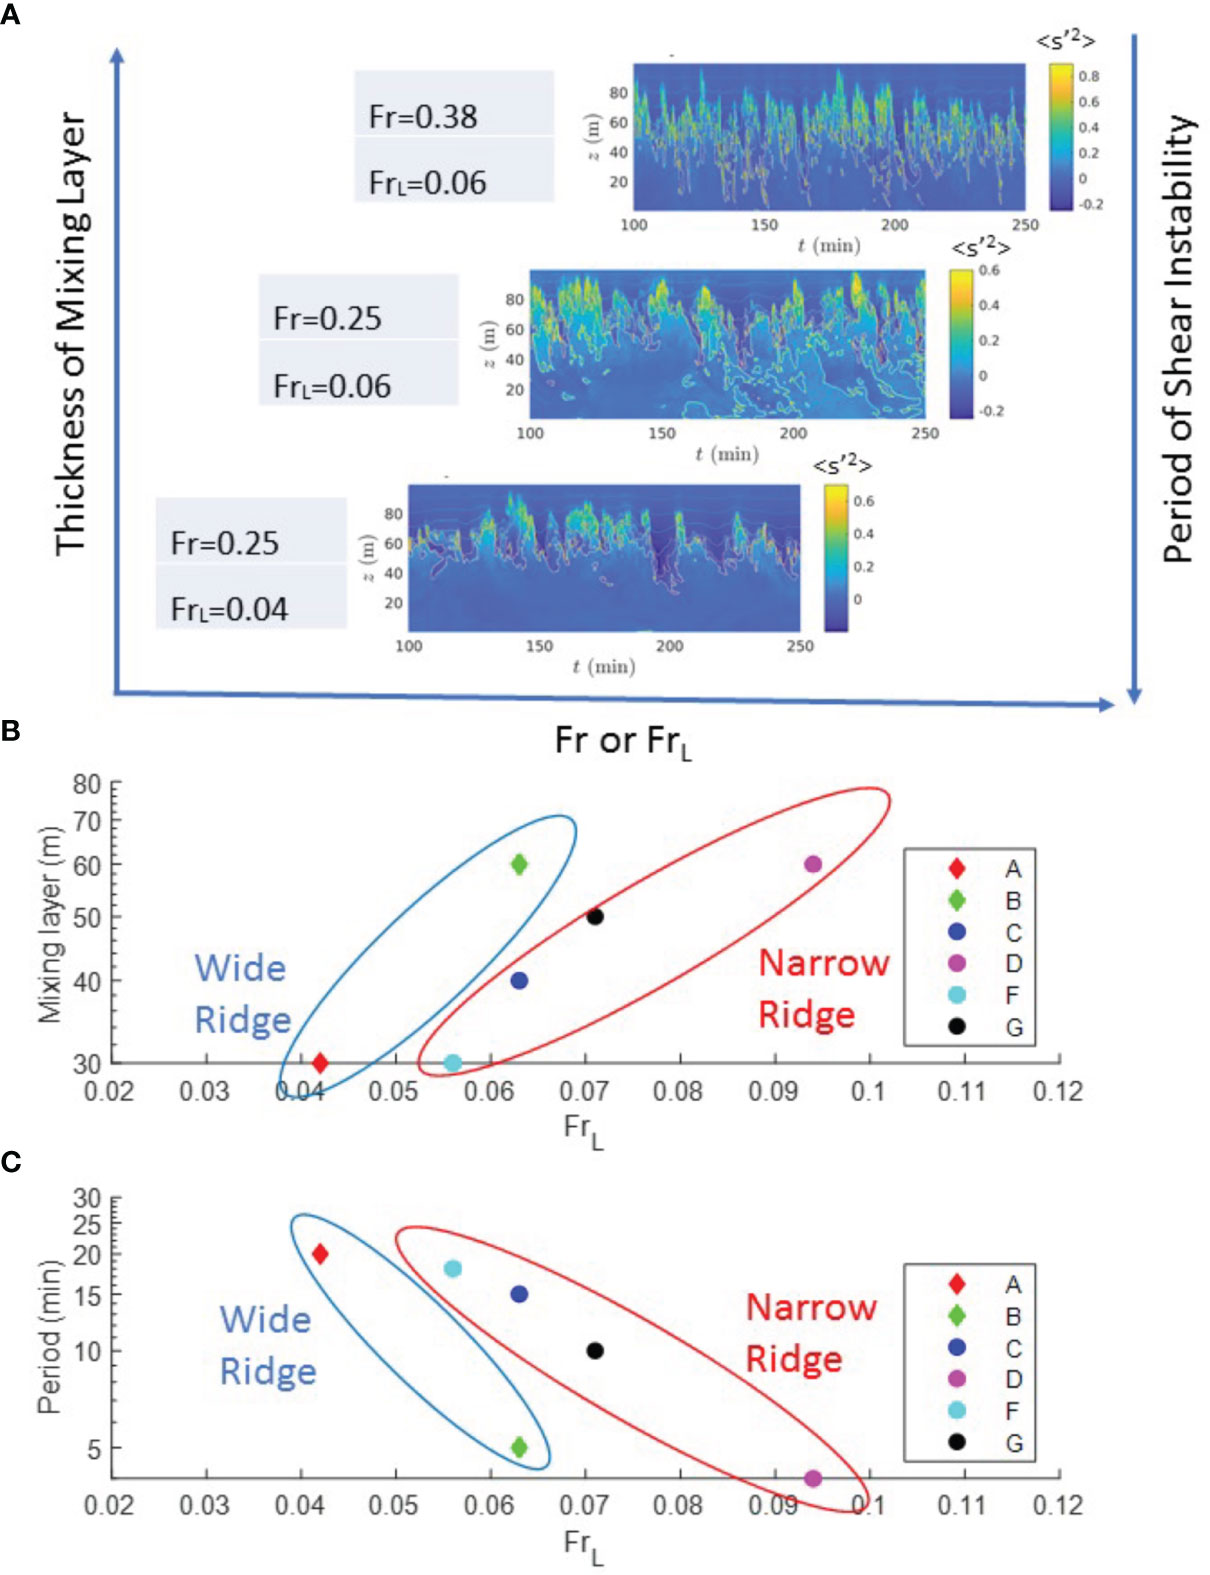
Figure 12 (A) A diagram including the density variance of Case A-C shows the period of shear instabilities and the thickness of the mixing layer are relevant to Fr or FrL. Diagrams show the relationship of FrL versus (B) the thickness of the mixing layer (unit:meter) and (C) the period of shear instabilities (unit: minute).
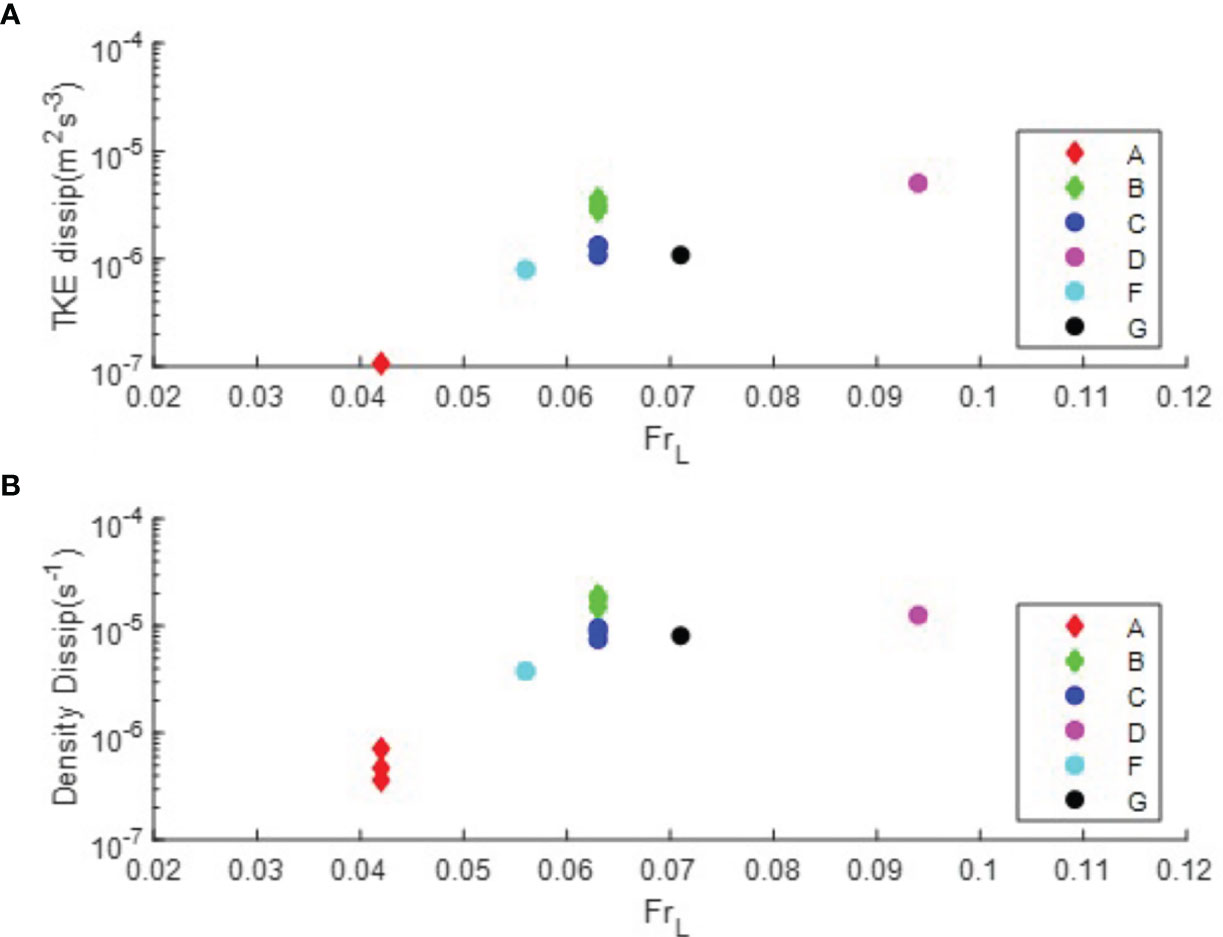
Figure 13 Diagrams show FrL versus (A) the depth-averaged TKE dissipation rate (unit: m2 s-3) and (B) the depth-averaged normalized density dissipation rate (unit: s-1).
Previous studies in the upper equatorial ocean show that the period of shear instabilities depends on to the buoyancy frequency (Smyth and Moum, 2012). The laboratory study at moderate Reynolds number also shows that fluid parcels oscillate at the buoyancy frequency after passing over the ridge and strong mixing is generated during the buoyancy period (Klymak and Legg, 2010; Dossmann et al., 2016). In this section, numerical experiments with different background stratifications (Cases G, C, and F, N=0.014, 0.016, and 0.018 s-1 based on CTD measurements) are conducted to understand the effect of baroclinic variability on the observed temporal and spatial scales of shear instabilities induced by the flow-topography interaction. The diagram including Cases A-G indicates that the thickness of the mixing layer is proportional to FrL (Figure 12B) and the period of shear instabilities is inversely proportional to the given FrL (Figure 12C). The depth averaged mixing rate slightly increases in the case with a lower buoyancy frequency (Case G, N=0.014 s-1 Figures 13A, B). Generally the depth-averaged TKE dissipation rate and the normalized density variance dissipation rate increase with FrL. However, the estimated eddy diffusivity (ks = 10-3 m2 s-1) and the resulting mixing are on the same order of magnitude among the cases with different buoyancy frequencies. Model results indicate that the period of shear instabilities is not only relevant to the background stratification, as shown in previous literature but also relevant the ridge geometry and the intensity of the flow shear. The estimated eddy diffusivity and the resulting mixing are more sensitive to the intensity of the flow shear than the variation in density gradients in the stratified background.
Studying the nonlinear process of lee waves and the evolution of shear instabilities is crucial in understanding the turbulent process and of key interest in developing mixing parameterizations for ocean circulations and scalar transport models. Proper parameterization of small-scale physical processes, such as shear instabilities, is required in large-scale ocean circulation models with a horizontal grid resolution of kilometer scale. For example, in the vertical diffusivity in the Regional Ocean Modeling System (ROMS), the shear-generated mixing term is parameterized by a stability function of local buoyancy and flow shears. The viscosity coefficient is estimated by adding the effects of internal wave-generated mixing and shear mixing (Large et al., 1994).
where the eddy diffusivity due to the internal wave-generated mixing term vw is 10-5m2 s-1 is estimated based on the data of Ledwell et al. (1993). The shear mixing term vsh is calculated using a gradient Richardson number formulation with viscosity estimated as:
where v0 is 0.005 m2 s-1, Ri0 =0.7. The maximum of vsh = 0.005 m2 s-1 can be obtained when shear instability occurs and Rig<0.25. Therefore, the maximum eddy diffusivity with the combination of internal wave and shear instability generated mixing is O(10-3 m2 s-1), which is one to two orders of magnitude smaller than the observed eddy diffusivity under flow-topography interaction along the Kuroshio (Chang et al., 2016; Tsutsumi et al., 2017).
More recently, Klymak and Legg (2010) proposed eddy diffusivities related to the combination of the Ozmidov relation and the Osborn relation. Observational evidence indicates that the size of convectively unstable vertical displacements in a turbulent patch LT is approximately equivalent to the Ozmidov scale (Lt ≈ Lo) (Dillon, 1982; Wesson and Gregg, 1994; Moum, 1996). The Osborn relation related to the strength of the dissipation to the vertical eddy diffusivity is:
where the Ozmidov scale that defines the scale of turbulence overturning can be defined as:
Combining (14) and (15), the vertical diffusivity can be estimated as:
where Γ≈0.2 and Lo is the size of the density overturns. Based on Equation (16), the estimation of vertical diffusivity due to internal wave-generated mixing is O(10-2 m2 s-1), which corresponds to the eddy diffusivity estimated based on the field observation under flow topography interactions along the Kuroshio. However, the dependence of eddy diffusivities on the intensity of flow shears and the ridge geometry is not considered in the existing model parameterization. Our study shows that high turbulence with vertical diffusivity up to O(10-2 m2 s-1) is populated primarily along the braids of shear instabilities with a specific period of 5 minutes (Figure 11E). The thickness of the mixing layer and the period of shear instabilities are modulated by the flow shear, background stratification, and ridge geometry. The difference in depth-averaged mixing rates can be up to two orders of magnitude. Therefore, it is suggested that the dependency of vertical mixing enhancement on FrL should be further considered in estimating the enhancement of eddy diffusivities and TKE dissipation rates under the circumstance of lee wave breaking.
In this study, the CFD model OpenFOAM with LES turbulent closure is applied to investigate dominant mechanisms that control the spatial and temporal scales and intensities of shear instabilities and resulting mixing in the stratified shear flow at high Reynolds numbers. The model successfully reproduced the bulk properties of shear instabilities at high Reynolds numbers using a model spatial resolution close to the Ozmidov length scale. Both the observed echo intensity and model results of density variance dissipation show the spatial evolution of oscillations formed by inclined, asymmetric, cusp-like bands with high mixing in the braid. Strong mixing is located in the braids of shear instabilities above the core region with a greater Richardson number. These features have not been investigated in previous modeling and experimental studies at lower Reynolds numbers.
Observations under different ambient conditions conjecture that the frequency of shear instabilities and the elevated vertical mixing enhancement are modulated by inflow velocities and bouyancy frequencies. Model results show that the estimated eddy diffusivity and the resulting mixing are more sensitive to the flow shear rate than the variability of background stratification. The typical value of TKE dissipation rate in the open ocean is O(10-9 m2 s-3) (Munk and Wunsch, 1998) but the depth-averaged TKE dissipation rate can approach to O(10-5 m2 s-3) due to flow-topography interaction (Figure 13). The horizontal scale of shear instabilities and the resulting mixing enhancement behind the seamount are less significant when the shear flow is weaker or over milder seafloor topography. In contrast, the resulting mixing enhancement appears more frequently when FrL is greater. The frequency of mixing enhancement increases when shear flow becomes more intense or goes over relatively steeper seafloor topography (Figure 14).
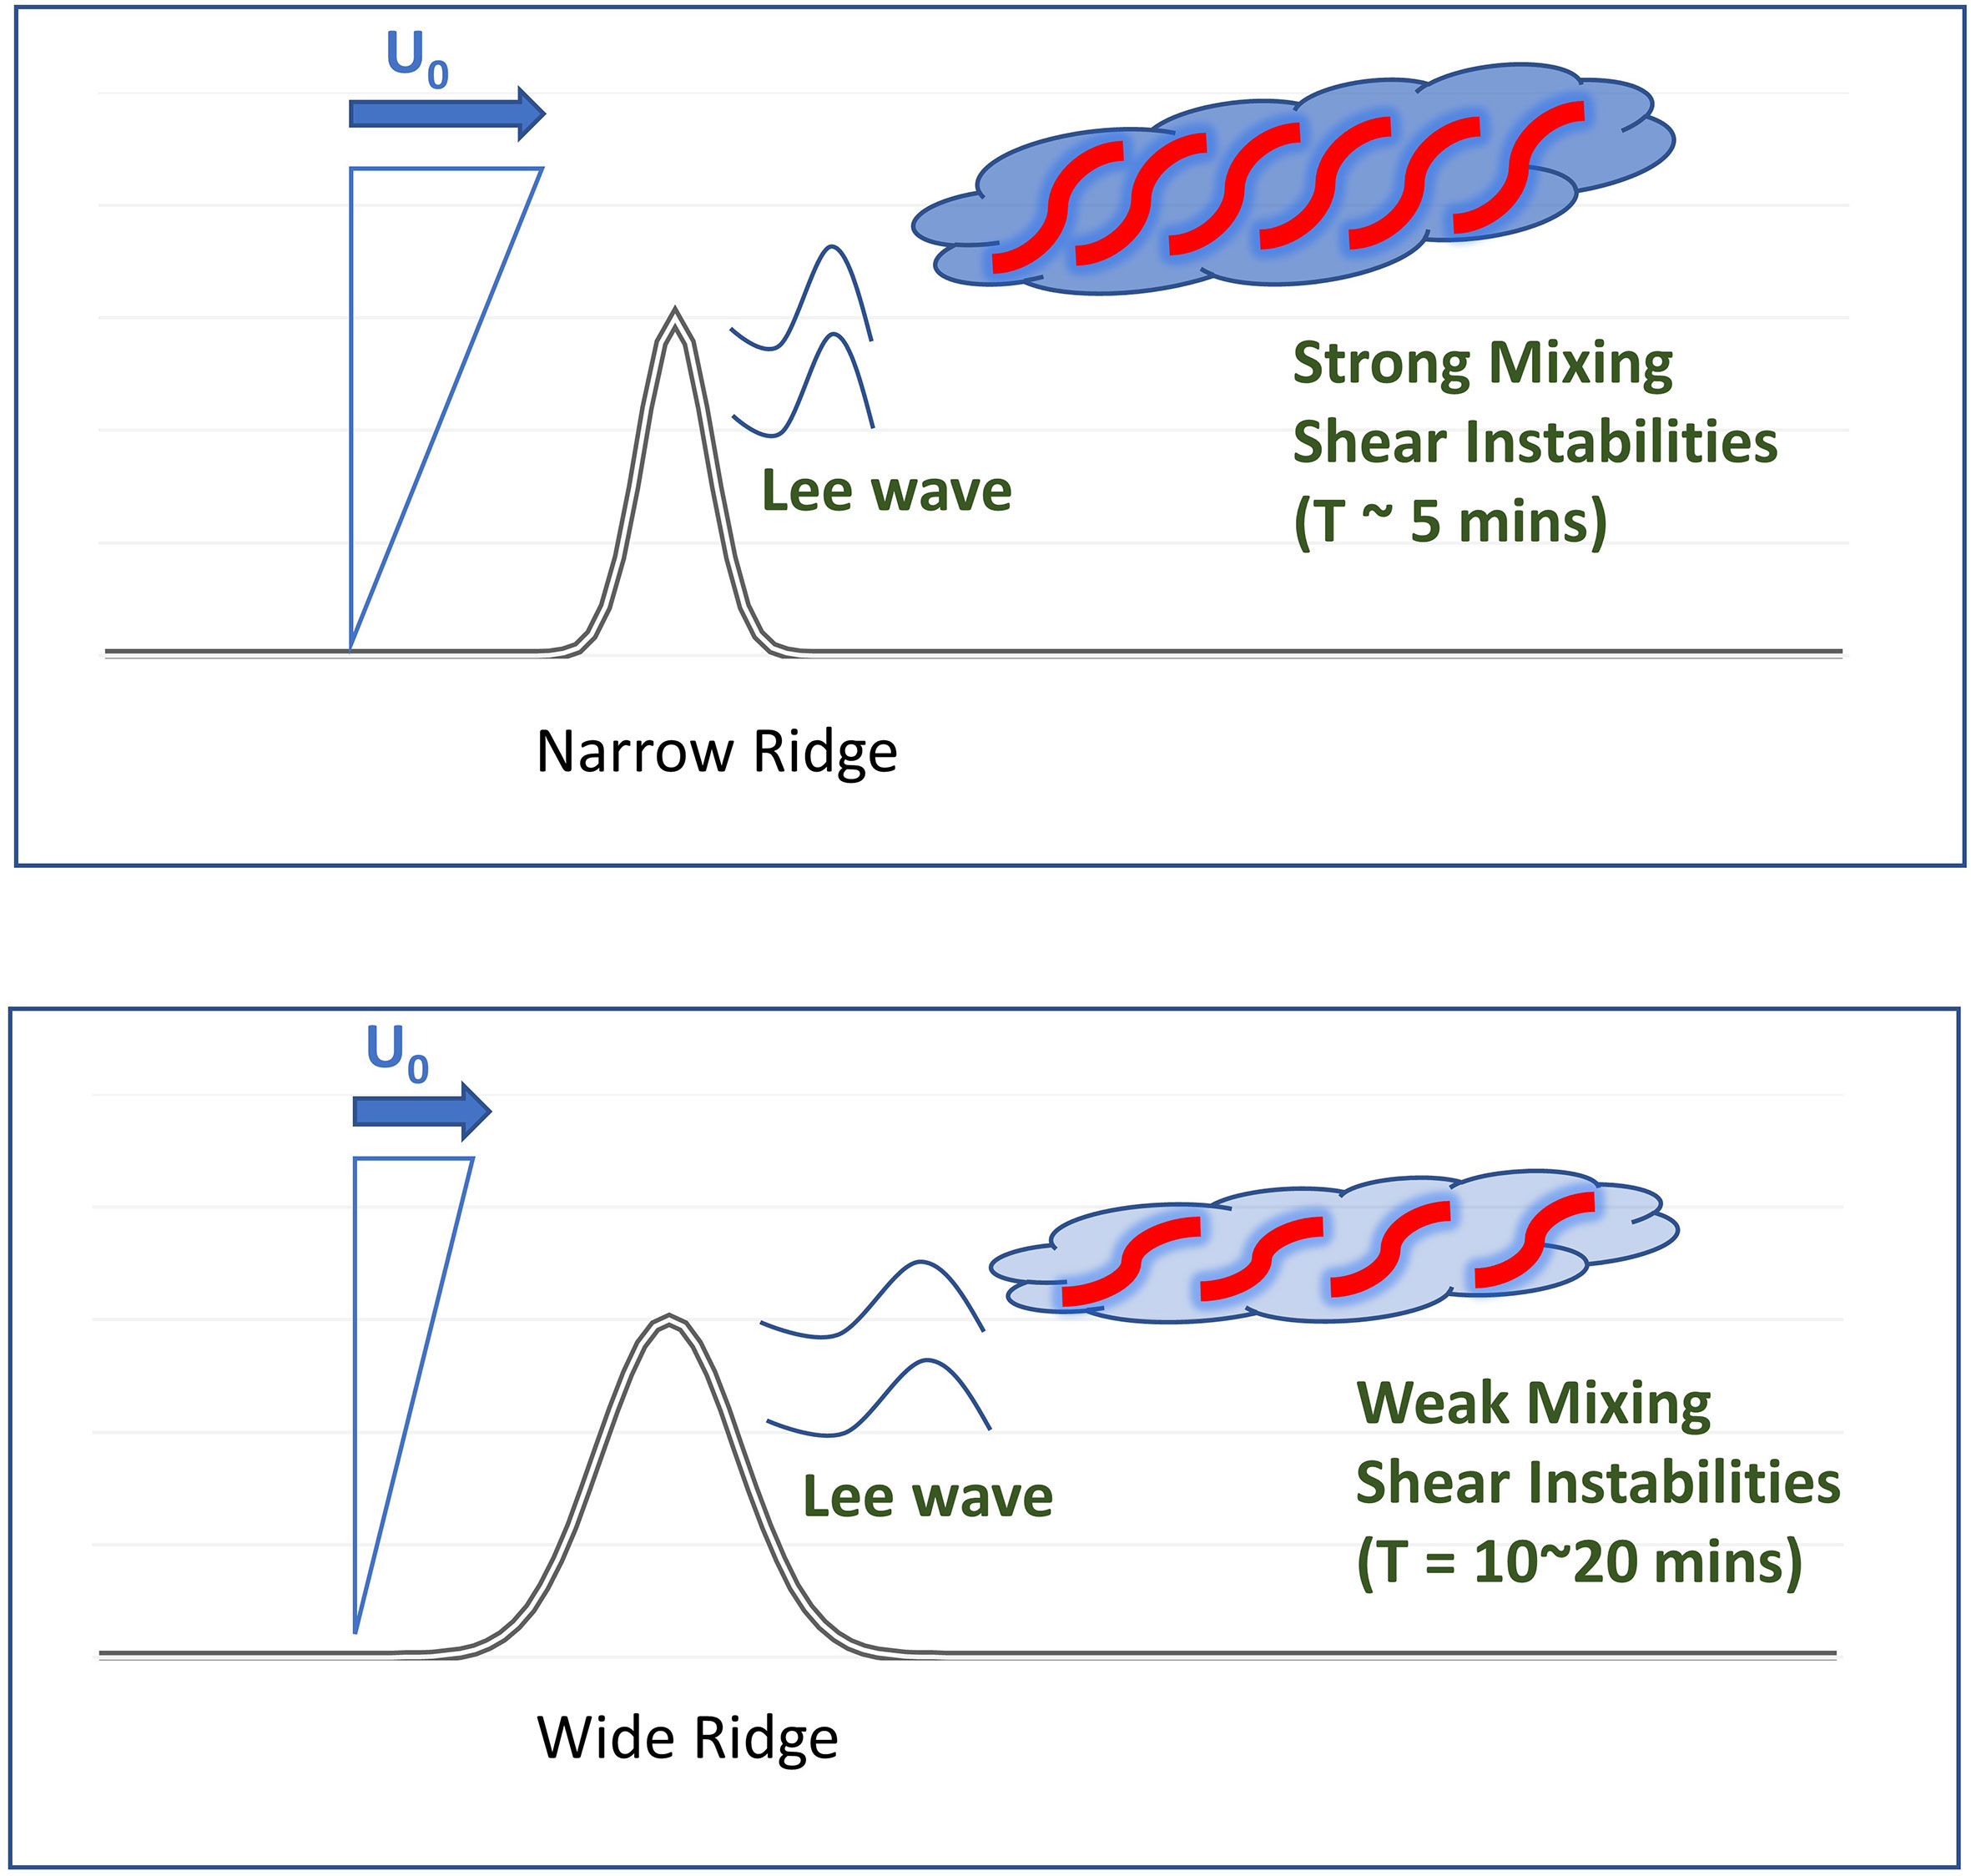
Figure 14 A schematic diagram for the occurrence of mixing intensification due to flow-topography interaction. The typical value of turbulent in the open ocean is O(10-9 m2 s-3) (Munk and Wunsch, 1998) but the depth-averaged TKE dissipation rate is up to O(10-5 m2 s-3) due to flow-topography interaction. The frequency of mixing enhancement (red braids) and the thickness of mixing layer (blue clouds) are mainly modulated by the flow shear and the seafloor topography.
The evolution of shear instabilities is of crucial importance in understanding the turbulent process and of key interest in developing mixing parameterizations for ocean circulation and scalar transport models (Smyth and Moum, 2012). Conventionally, the vertical diffusivity in the ocean circulation model is parameterized by a stability function of local buoyancy and flow shear (Large et al., 1994). The dependence of the eddy diffusivity on the intensity of flow shear and the ridge geometry is not considered in the existing model parameterization. The estimation of the eddy diffusivity coefficient with the combination of internal wave and shear instability generated mixing might be one to two order magnitude smaller than the actual eddy diffusivity under flow-topography interaction, incapable to capture the field observation of Chang et al. (2016); Tsutsumi et al. (2017). Our study indicates that the length scale or the period of shear instabilities are the keys to the mixing enhancement. FrL should be further considered under the circumstance of lee wave breaking dictating turbulent dissipation processes.
The data presented in this study are available through the corresponding author by request.
J-LC, XY, M-HC, and R-CL planned the research. J-LC, M-HC, SJ, and YY carried out the ship-based experiments with the assistance from marine technicians of NTU and crew members of R/Vs New Ocean Researcher 1, 2, and 3. J-LC wrote the manuscript with input from all co-authors. All authors contributed to the article and approved the submitted version.
Funding was provided by Taiwan’s Ministry of Science and Technology (J-LC: MOST 110-2611-M-006-003, SJ: MOST 108-2611-M-002-019). XY contribution towards this research was also partly supported by the US National Science Foundation (NSF) under grant CMMI-2128895. R-CL contribution towards this research was supported by the US NSF under grant OCE-2048764.
The authors declare that the research was conducted in the absence of any commercial or financial relationships that could be construed as a potential conflict of interest.
All claims expressed in this article are solely those of the authors and do not necessarily represent those of their affiliated organizations, or those of the publisher, the editors and the reviewers. Any product that may be evaluated in this article, or claim that may be made by its manufacturer, is not guaranteed or endorsed by the publisher.
We thank Dr. Rocky Geyer, WHOI, for providing suggestions of the density variance analysis, and Shun-Yan Hsu, Sheng-De Tsai, Wei-Zhan Tsai, Cheng-Chien Hou, and Andhy Romdani for figure illustrations. Simulations were carried out on the HiperGator super computer at the University of Florida and MobyDick in National Cheng Kung University. Computer resources, technical expertise and assistance provided by the HiperGator and MobyDick staff are gratefully acknowledged. The CFD model OpenFOAM is developed primarily by OpenCFD Ltd and available at https://www.openfoam.com/.
Acabado C. S., Cheng Y. H., Chang M.-H., Chen C. C. (2021). Vertical Nitrate Flux Induced by Kelvin-Helmholtz Billows Over a Seamount in the Kuroshio. Front. Mar. Sci. doi: 10.3389/fmars.2021.680729
Aguilar D. A., Sutherland B. R. (2006). Internal Wave Generation From Rough Topography. Phys. Fluids 18, 066603. doi: 10.1063/1.2214538
Baines P. G., Hoinka K. P. (1985). Stratified Flow Over Two-Dimensional Topography in Fluid of Infinite Depth: A Laboratory Simulation. J. Atmospheric Sci. 42, 1614–1630. doi: 10.1175/1520-0469(1985)042<1614:SFOTDT>2.0.CO;2
Bell T. H. (1975). Lee Waves in Stratified Flows With Simple Harmonic Time Dependence. J. Fluid Mech. 67, 705–722. doi: 10.1017/S0022112075000560
Best J. (2005). The Fluid Dynamics of River Dunes: A Review and Some Future Research Directions. J. Geophys. Res. Earth Surf. 110, 1–21. doi: 10.1029/2004JF000218
Burchard H., Rennau H. (2008). Comparative Quantification of Physically and Numerically Induced Mixing in Ocean Models. Ocean Model. 20, 293–311. doi: 10.1016/j.ocemod.2007.10.003
Chang M.-H., Jheng S.-Y., Lien R.-C. (2016). Trains of Large Kelvin-Helmholtz Billows Observed in the Kuroshio Above a Seamount. Geophys. Res. Lett. 43, 8654–8661. doi: 10.1002/2016GL069462
Chang M.-H., Tang T. Y., Ho C.-R., Chao S.-Y. (2013). Kuroshio-Induced Wake in the Lee of Green Island Off Taiwan. J. Geophys. Res. Oceans 118, 1508–1519. doi: 10.1002/jgrc.20151
Dillon T. M. (1982). Vertical Overturns: A Comparison of Thorpe and Ozmidov Length Scales. J. Geophys. Res. Oceans 87, 9601–9613. doi: 10.1029/JC087iC12p09601
Dossmann Y., Paci A., Auclair F., Lepilliez M., Cid E. (2014). Topographically Induced Internal Solitary Waves in a Pycnocline: Ultrasonic Probes and Stereo-Correlation Measurements. Phys. Fluids 26, 056601–056621. doi: 10.1063/1.4873202
Dossmann Y., Rosevear G., Griffiths R. W., McC. Hogg A., Hughes G. O., Copeland M. (2016). Experiments With Mixing in Stratified Flow Over a Topographic Ridge. J. Geophys. Res. Oceans 121, 6961–6977. doi: 10.1002/2016JC011990
Drazin P. G. (1961). On the Steady Flow of a Fluid of Variable Density Past an Obstacle. Tellus 13, 239–251. doi: 10.3402/tellusa.v13i2.9451
Ducros F., Nicoud F., Poinsot T. (1998). Wall-Adapting Local Eddy-Viscosity Models for Simulations in Complex Geometries. Numerical Methods for Fluid Dynamics VI. p. 1–7
Durán Gómez G. S., Nagai T., Yokawa K. (2020). Mesoscale Warm-Core Eddies Drive Interannual Modulations of Swordfish Catch in the Kuroshio Extension System. Front. Mar. Sci. 7. doi: 10.3389/fmars.2020.00680
Eiff O. S., Bonneton P. (2000). Lee-Wave Breaking Over Obstacles in Stratified Flow. Phys. Fluids 12, 1073–1086. doi: 10.1063/1.870362
Farmer D., Armi L. (1999). Stratified Flow Over Topography: The Role of Small-Scale Entrainment and Mixing in Flow Establishment. Proc. R Soc. Lond. Ser. A 455, 3221–3258. doi: 10.1098/rspa.1999.0448
Geyer W. R., Lavery A. C., Scully M. E., Trowbridge J. H. (2010). Mixing by Shear Instability at High Reynolds Number. Geophys. Res. Lett. 37, 1–5. doi: 10.1029/2010GL045272
Hazel P. (1972). Numerical Studies of the Stability of Inviscid Stratified Shear Flows. J. Fluid Mech. 51, 39–61.
Jalali M., Sarkar S. (2017). Large Eddy Simulation of Flow and Turbulence at the Steep Topography of Luzon Strait. Geophys. Res. Lett. 44, 9440–9448. doi: 10.1002/2017GL074119
Jan S., Yang Y. J., Wang J., Mensah V., Kuo T.-H., Chiou M.-D., et al. (2015). Large Variability of the Kuroshio at 23.75°N East of Taiwan. J. Geophys. Res. Oceans 120, 1825–1840. doi: 10.1002/2014JC010614
Klymak J. M., Legg S. M. (2010). A Simple Mixing Scheme for Models That Resolve Breaking Internal Waves. Ocean Model. 33, 224–234. doi: 10.1016/j.ocemod.2010.02.005
Klymak J. M., Legg S. M., Pinkel R. (2010). High-Mode Stationary Waves in Stratified Flow Over Large Obstacles. J. Fluid Mech. 644, 321–336. doi: 10.1017/S0022112009992503
Kunze E., Lien R.-C. (2019). Energy Sinks for Lee Waves in Shear Flow. J. Phys. Oceanogr. 49, 2851–2865. doi: 10.1175/JPO-D-19-0052.1
Lacaze L., Paci A., Cid E., Cazin S., Eiff O., Esler J., et al. (2013). Wave Patterns Generated by an Axisymmetric Obstacle in a Two-Layer Flow. Phys. Fluids 54, 1–10. doi: 10.1007/s00348-013-1618-z
Large W. G., McWilliams J. C., Doney S. C. (1994). Oceanic Vertical Mixing: A Review and a Model With a Nonlocal Boundary Layer Parameterization. Rev. Geophys. 32, 363–403. doi: 10.1029/94RG01872
Lavery A. C., Geyer W. R., Scully M. E. (2013). Broadband Acoustic Quantification of Stratified Turbulence. J. Acoust. Soc Am. 134, 40–54. doi: 10.1121/1.4807780
Ledwell J., Watson A., Law C. (1993). Evidence for Slow Mixing Across the Pycnocline From an Open-Ocean Tracer-Release Experiment. Nature 364, 701–703. doi: 10.1038/364701a0
Legg S. (2021). Mixing by Oceanic Lee Waves. Annu. Rev. Fluid Mech. 53, 173–201. doi: 10.1146/annurev-fluid-051220-043904
MacCready P., Geyer W. R., Burchard H. (2018). Estuarine Exchange Flow Is Related to Mixing Through the Salinity Variance Budget. J. Phys. Oceanogr. 48, 1375–1384. doi: 10.1175/JPO-D-17-0266.1
Mashayek A., Peltier W. R. (2012). The ‘Zoo’ of Secondary Instabilities Precursory to Stratified Shear Flow Transition. Part 1 Shear Aligned Convection, Pairing, and Braid Instabilities. J. Fluid Mech. 708, 5–44. doi: 10.1017/jfm.2012.304
Mashayek A., Peltier W. R. (2013). Shear-Induced Mixing in Geophysical Flows: Does the Route to Turbulence Matter to Its Efficiency? J. Fluid Mech. 725, 216–261. doi: 10.1017/jfm.2013.176
Mensah V., Jan S., Chiou M.-D., Kuo T. H., Lien R.-C. (2014). Evolution of the Kuroshio Tropical Water From the Luzon Strait to the East of Taiwan. Deep Sea Res. Part Oceanogr. Res. Pap. 86, 68–81. doi: 10.1016/j.dsr.2014.01.005
Moum J. N. (1996). Efficiency of Mixing in the Main Thermocline. J. Geophys. Res. Oceans 101, 12057–12069. doi: 10.1029/96JC00508
Munk W., Wunsch C. (1998). Abyssal Recipes II: Energetics of Tidal and Wind Mixing. Deep Sea Res. Part Oceanogr. Res. Pap. 45, 1977–2010. doi: 10.1016/S0967-0637(98)00070-3
Nagai T., Rosales Quintana G. M., Durán Gómez G. S., Hashihama F., Komatsu K. (2021). Elevated Turbulent and Double-Diffusive Nutrient Flux in the Kuroshio Over the Izu Ridge and in the Kuroshio Extension. J. Oceanogr. 77, 55–74. doi: 10.1007/s10872-020-00582-2
Nikurashin M., Ferrari R. (2010a). Radiation and Dissipation of Internal Waves Generated by Geostrophic Motions Impinging on Small-Scale Topography: Application to the Southern Ocean. J. Phys. Oceanogr. 40, 2025–2042. doi: 10.1175/2010JPO4315.1
Nikurashin M., Ferrari R. (2010b). Radiation and Dissipation of Internal Waves Generated by Geostrophic Motions Impinging on Small-Scale Topography: Theory. J. Phys. Ocean. 40, 2025–2042. doi: 10.1175/2010JPO4315.1
Perfect B., Kumar N., Riley J. J. (2020a). Energetics of Seamount Wakes. Part II: Wave Fluxes. J. Phys. Oceanogr. 50, 1383–1398. doi: 10.1175/JPO-D-19-0104.1
Perfect B., Kumar N., Riley J. J. (2020b). Energetics of Seamount Wakes. Part I: Energy Exchange. J. Phys. Oceanogr. 50, 1365–1382. doi: 10.1175/JPO-D-19-0105.1
Pope S. B. (2000). Turbulent Flows (Cambridge: Cambridge University Press). doi: 10.1017/CBO9780511840531
Shi Z., Chen J., Chen Q. (2016). On the Turbulence Models and Turbulent Schmidt Number in Simulating Stratified Flows. J. Build. Perform. Simul. 9, 134–148. doi: 10.1080/19401493.2015.1004109
Shi J., Tong C., Zhang C., Gao X. (2019). Kelvin-Helmholtz Billows Induced by Shear Instability Along the North Passage of the Yangtze River Estuary, China. J. Mar. Sci. Eng. 7, 92. doi: 10.3390/jmse7040092
Smyth W., Moum J. (2000). Length Scales of Turbulence in Stably Stratified Mixing Layers. Phys. Fluids 12, 1327–1342. doi: 10.1063/1.870385
Smyth W., Moum J. (2012). Ocean Mixing by Kelvin-Helmholtz Instability. Oceanography 25, 140–149. doi: 10.5670/oceanog.2012.49
Smyth W. D., Moum J. N., Caldwell D. R. (2001). The Efficiency of Mixing in Turbulent Patches: Inferences From Direct Simulations and Microstructure Observations. J. Phys. Oceanogr. 31, 1969–1992. doi: 10.1175/1520-0485(2001)031<1969:TEOMIT>2.0.CO;2
Staquet C. (1995). Two-Dimensional Secondary Instabilities in a Strongly Stratified Shear Layer. J. Fluid Mech. 296, 73–126. doi: 10.1017/S0022112095002072
Stiperski I., Serafin S., Paci A., Ágústsson H., Belleudy A., Calmer R., et al. (2017). Water Tank Experiments on Stratified Flow Over Double Mountain-Shaped Obstacles at High-Reynolds Number. Atmosphere 8, 1–19. doi: 10.3390/atmos8010013
Talke S. A., Horner-Devine A. R., Chickadel C. C. (2010). Mixing Layer Dynamics in Separated Flow Over an Estuarine Sill With Variable Stratification. J. Geophys. Res. Oceans 115, 1–17. doi: 10.1029/2009JC005467
Tanaka T., Hasegawa D., Yasuda I., Tsuji H., Fujio S., Goto Y., et al. (2019). Enhanced Vertical Turbulent Nitrate Flux in the Kuroshio Across the Izu Ridge. J. Oceanogr. 75, 195–203. doi: 10.1007/s10872-018-0500-2
Taniguchi N., Huang C.-F., Kaneko A., Liu C.-T., Howe B. M., Wang Y.-H., et al. (2013). Measuring the Kuroshio Current With Ocean Acoustic Tomography. J. Acoust. Soc Am. 134, 3272–3281. doi: 10.1121/1.4818842
Tsutsumi E., Matsuno T., Lien R.-C., Nakamura H., Senjyu T., Guo X. (2017). Turbulent Mixing Within the Kuroshio in the Tokara Strait. J. Geophys. Res. Oceans 122, 7082–7094. doi: 10.1002/2017JC013049
Voisin B. (1991). Internal Wave Generation in Uniformly Stratified Fluids. Part 1. Green’s Function and Point Sources. J. Fluid Mech. 231, 439–480. doi: 10.1017/S0022112091003464
Weller H. G., Tabor G., Jasak H., Fureby C. (1998). A Tensorial Approach to Computational Continuum Mechanics Using Object-Oriented Techniques. Comput. Phys. 12, 620–631. doi: 10.1063/1.168744
Wesson J. C., Gregg M. C. (1994). Mixing at Camarinal Sill in the Strait of Gibraltar. J. Geophys. Res. Oceans 99, 9847–9878. doi: 10.1029/94JC00256
Winters K. B., Armi L. (2012). Hydraulic Control of Continuously Stratified Flow Over an Obstacle. J. Fluid Mech. 700, 502–513. doi: 10.1017/jfm.2012.157
Winters K. B., Armi L. (2013). The Response of a Continuously Stratified Fluid to an Oscillating Flow Past an Obstacle. J. Fluid Mech. 727, 83–118. doi: 10.1017/jfm.2013.247
Winters K. B., Armi L. (2014). Topographic Control of Stratified Flows: Upstream Jets, Blocking and Isolating Layers. J. Fluid Mech. 753, 80–103. doi: 10.1017/jfm.2014.363
Winters K. B., Lombard P. N., Riley J. J., D’Asaro E. A. (1995). Available Potential Energy and Mixing in Density-Stratified Fluids. J. Fluid Mech. 289, 115–128. doi: 10.1017/S002211209500125X
Keywords: lee wave breaking, shear instability, flow topography interaction, LES simulation, turbulent mixing and diffusivity
Citation: Chen J-L, Yu X, Chang M-H, Jan S, Yang YJ and Lien R-C (2022) Shear Instability and Turbulent Mixing in the Stratified Shear Flow Behind a Topographic Ridge at High Reynolds Number. Front. Mar. Sci. 9:829579. doi: 10.3389/fmars.2022.829579
Received: 06 December 2021; Accepted: 25 March 2022;
Published: 18 May 2022.
Edited by:
Hiroaki Saito, The University of Tokyo, JapanReviewed by:
Takeyoshi Nagai, Tokyo University of Marine Science and Technology, JapanCopyright © 2022 Chen, Yu, Chang, Jan, Yang and Lien. This is an open-access article distributed under the terms of the Creative Commons Attribution License (CC BY). The use, distribution or reproduction in other forums is permitted, provided the original author(s) and the copyright owner(s) are credited and that the original publication in this journal is cited, in accordance with accepted academic practice. No use, distribution or reproduction is permitted which does not comply with these terms.
*Correspondence: Jia-Lin Chen, amlhbGluY2hlbnBzQGdzLm5ja3UuZWR1LnR3
Disclaimer: All claims expressed in this article are solely those of the authors and do not necessarily represent those of their affiliated organizations, or those of the publisher, the editors and the reviewers. Any product that may be evaluated in this article or claim that may be made by its manufacturer is not guaranteed or endorsed by the publisher.
Research integrity at Frontiers

Learn more about the work of our research integrity team to safeguard the quality of each article we publish.