 Xu Wang
 Jie Feng2,3,4
 Chenggang Lin
 Muyan Chen
94% of researchers rate our articles as excellent or good
Learn more about the work of our research integrity team to safeguard the quality of each article we publish.
Find out more
ORIGINAL RESEARCH article
Front. Mar. Sci., 16 March 2022
Sec. Marine Ecosystem Ecology
Volume 9 - 2022 | https://doi.org/10.3389/fmars.2022.829557
This article is part of the Research TopicSeafloor Heterogeneity: Artificial Structures and Marine Ecosystem Dynamics - Recent AdvancesView all 16 articles
Oyster reefs are gaining more and more attention in marine ranching and coastal ecosystem restoration, but tremendous knowledge gaps still exist. In this study, we developed trophic models for the established artificial oyster reef (EAOR), newly deployed artificial oyster reef (NAOR), and non-reef bare substratum (NBS) ecosystems located in the Bay of Xiangyun, Bohai Sea, China, to assess the benefits of artificial oyster reef construction and to characterize the unique role of these reefs in coastal management. The analysis showed that the EAOR and NAOR ecosystems were similar to each other, but both were greatly different than the NBS ecosystem. Reefs showed greater “ecological size” and stronger top-down effects compared to the bare area. The ecosystems were not yet mature, but the EAOR and NAOR ecosystems had more complicated trophic relationships, greater potential to withstand perturbations, and higher biological carrying capacities of commercial organisms compared to the NBS ecosystem. These results demonstrated that artificial oyster reef construction resulted in great advantages to the ecosystem. For example, oysters became the structuring functional group and played a critical role in the trophic structure of the reef areas. The phytoplankton/detritus-oysters-carnivorous macrobenthos pathway developed and became dominant in these areas, thereby contributing to highly efficient secondary production. The ratios of total primary production/total respiration were < 1, indicating that the reef ecosystems responded effectively to nutrient inputs from adjacent ecosystems. We speculate that water exchange might be a critical factor influencing the maintenance of the system. Long-term monitoring of the EAOR and NAOR should be implemented for oyster protection and to assess the need to manipulate carnivorous macrobenthos to keep the systems in balance. Results of this study could benefit the restoration, exploitation, and management of oyster reefs. Further studies should take the adjacent ecosystems and anthropogenic activities into account.
Oyster reefs, which are formed by clustering oysters, are widely distributed in temperate and subtropical estuaries and coastal areas. Oyster reefs provide the basic structure for the whole ecosystem and support various crucial ecological functions, thus serving as the “ecological engineer” in shallow waters (Gutiérrez et al., 2003; Chowdhury et al., 2021). Filter-feeding oysters ingest suspended detritus and phytoplankton, which can improve water quality and transparency and inhibit eutrophication (Hoellein et al., 2015). The water column and sediment are coupled through the feeding and excreting processes of oysters, further enhancing the ecosystem’s denitrification and carbon sequestration functions (Miller et al., 2009; Hoellein et al., 2015). The complex three-dimensional structure of oyster reefs provides habitats for a variety of marine organisms, thus contributing to high biodiversity and complex food webs and increasing fishery resources (Zu Ermgassen et al., 2015; Gain et al., 2016). Furthermore, oyster reefs can act as natural surf shields to buffer wave erosion and protect the coastline (Piazza et al., 2005; Borsje et al., 2011). However, due to destructive fishing and habitat degeneration, more than 85% of natural oyster reefs worldwide have declined in the last 100 years, and < 10% of historical abundance remains in most bays (Beck et al., 2011). The loss of oyster reefs has caused serious desertification of the seabed, and it is crucial to advance the restoration of oyster reefs (Coen et al., 2007).
Over the last four decades, artificial structures have been developed and deployed in subtidal zones around the world as efficient alternatives to declining natural habitats (Baine, 2001; Layman and Allgeier, 2020). Studies on artificial reefs showed that well-designed artificial reefs could effectively enhance the biomass and biodiversity of ecosystems and provide suitable habitats for organisms in coastal areas, indicating that such restoration approaches are advisable (Lee et al., 2018; Cresson et al., 2019; Wu et al., 2019). When deployed in substrate-limited places, artificial structures would become adherence sites for oyster larvae and thereby benefit oyster reef restoration (Theuerkauf et al., 2014; Walles et al., 2016). Along the coastlines of North America, Australia, and Europe, specially designed artificial structures have been used to promote the preservation and restoration of oyster reefs (La Peyre et al., 2014; Rodriguez-Perez et al., 2019; Gillies et al., 2020). Successful artificial reefs include the Half Moon Reef in Texas’ Matagorda Bay, Oyster Castle in Long Island, New York, and the concrete modular reef in the Rappahannock River, Virginia (La Peyre et al., 2014). Some restoration work has also been conducted from northern to southern China in recent years, including Dashentang (Tianjin), Xiangyun Bay (Hebei), Laizhou Bay (Shandong), Xiaomiaohong (Jiangsu), Yangtze River Estuary (Shanghai), and Houhai Bay (Hongkong) (Quan et al., 2017; Liu et al., 2018; Xu et al., 2019; Yang, 2019). Studies have mainly focused on the oyster population status, trophic interactions and enhancement of biodiversity and fishery resources (Powers et al., 2009; Blomberg et al., 2017; Yang, 2019). To date, analyses of the whole ecosystem based on trophic models are rare (Xu et al., 2019; Samonte et al., 2020).
The Bohai Sea is the only semi-closed inland sea in China. It covers an area of 77,000 km2, with an average depth of < 20 m. Because of its fertile water and abundant prey, the Bohai Sea once was an important habitat for spawning, feeding, and migrating of various organisms, and historically it has supported abundant fishery resources (Jin and Deng, 2000). Massive Holocene oyster reefs and shell ridges once existed along the northwest coast of the Bohai Sea (Yue et al., 2012), but now only patches of oyster reefs distribute in estuaries and shoals. As urbanization progressed, the population in the Bohai Sea coastal region increased dramatically, leading to increases in destructive fishing practices and anthropogenic disturbances (Jin and Deng, 2000). The whole ecosystem of the Bohai Sea changed greatly, and desertification of most coastal seabeds has been occurring since the late 1980s (Jin et al., 2013; Rahman et al., 2019).
To mitigate the current ecosystem decline, restoration and construction of artificial oyster reefs began in Xiangyun Bay in 2011. This bay is located at the confluence of Luan River and Bohai Bay. By the end of 2018, 930,000 m3 of various kinds of artificial reefs had been deployed, and two artificial oyster reef areas of 200 ha and 57 ha had been successively been constructed. Persistent investigation and monitoring of these artificial oyster reefs showed that significant positive ecological effects were achieved, including a more complex community and higher productivity (Yang, 2018). Combined with bottom seeding of the sea cucumber Apostichopus japonicas and recreational fishing, considerable economic benefits were generated (unpublished commercial data). Previous studies focused on the effects of the artificial oyster reefs on the environment and fishery resources and seasonal differences of the ecosystem (Yang, 2019; Xu et al., 2020). However, a holistic comparison analysis of ecosystem properties has not yet been conducted, and the role of artificial oyster reefs in coastal ecological restoration has not been specified.
Ecological trophic models provide a means to conduct studies at the ecosystem level and thereby deepen our understanding of the ecosystem. The Ecopath with Ecosim (EwE) model is one of the most well-accepted models among those currently available. The Ecopath module is a mass-balanced model based on ecosystem approaches, and it is usually applied to quantitative analysis of aquatic ecosystems (Christensen and Walters, 2004). Its first application was for a coral reef ecosystem at French Frigate Shoals by Polovina (1984). Since then, it has been used for estuaries, lagoons, continent shelfs, lakes, and artificial reefs (Darwall et al., 2010; Blomberg and Montagna, 2014; Heymans and Tomczak, 2016; Wu et al., 2016; Xu et al., 2019). In application, species are grouped in terms of their ecological niches, and all functional groups should basically cover the whole process of energy flow in the ecosystem. The output indicators can be used to describe the energy flow, ecological interactions, stability, and maturity of the ecosystem, and the biological carrying capacities of each group can be calculated. Thus, the results can greatly benefit ecosystem-based management (Heymans et al., 2016).
In this study, we developed three Ecopath models for the established artificial oyster reef (EAOR), newly deployed artificial oyster reef (NAOR), and non-reef bare substratum (NBS) ecosystems based on surveys conducted during 2019–2020 in Xiangyun Bay. Our aims were to: (1) Identify the structural distinctions between the reef and non-reef ecosystems to clarify the benefits of artificial oyster reef construction; (2) summarize the main properties of the artificial oyster reefs and demonstrate their unique role in coastal management; and (3) propose practical strategies for optimizing and managing oyster reef restoration and construction.
The study area is located in Xiangyun Bay, Bohai Sea, China (39°10′N, 119°00′E) (Figure 1). The transmeridional semi-diurnal tides flow back and forth from Luan River Estuary to the coast of the Caofeidian district, with an average flow velocity of 0.28∼0.37 m⋅s−1 (Sun and Zhang, 2018).
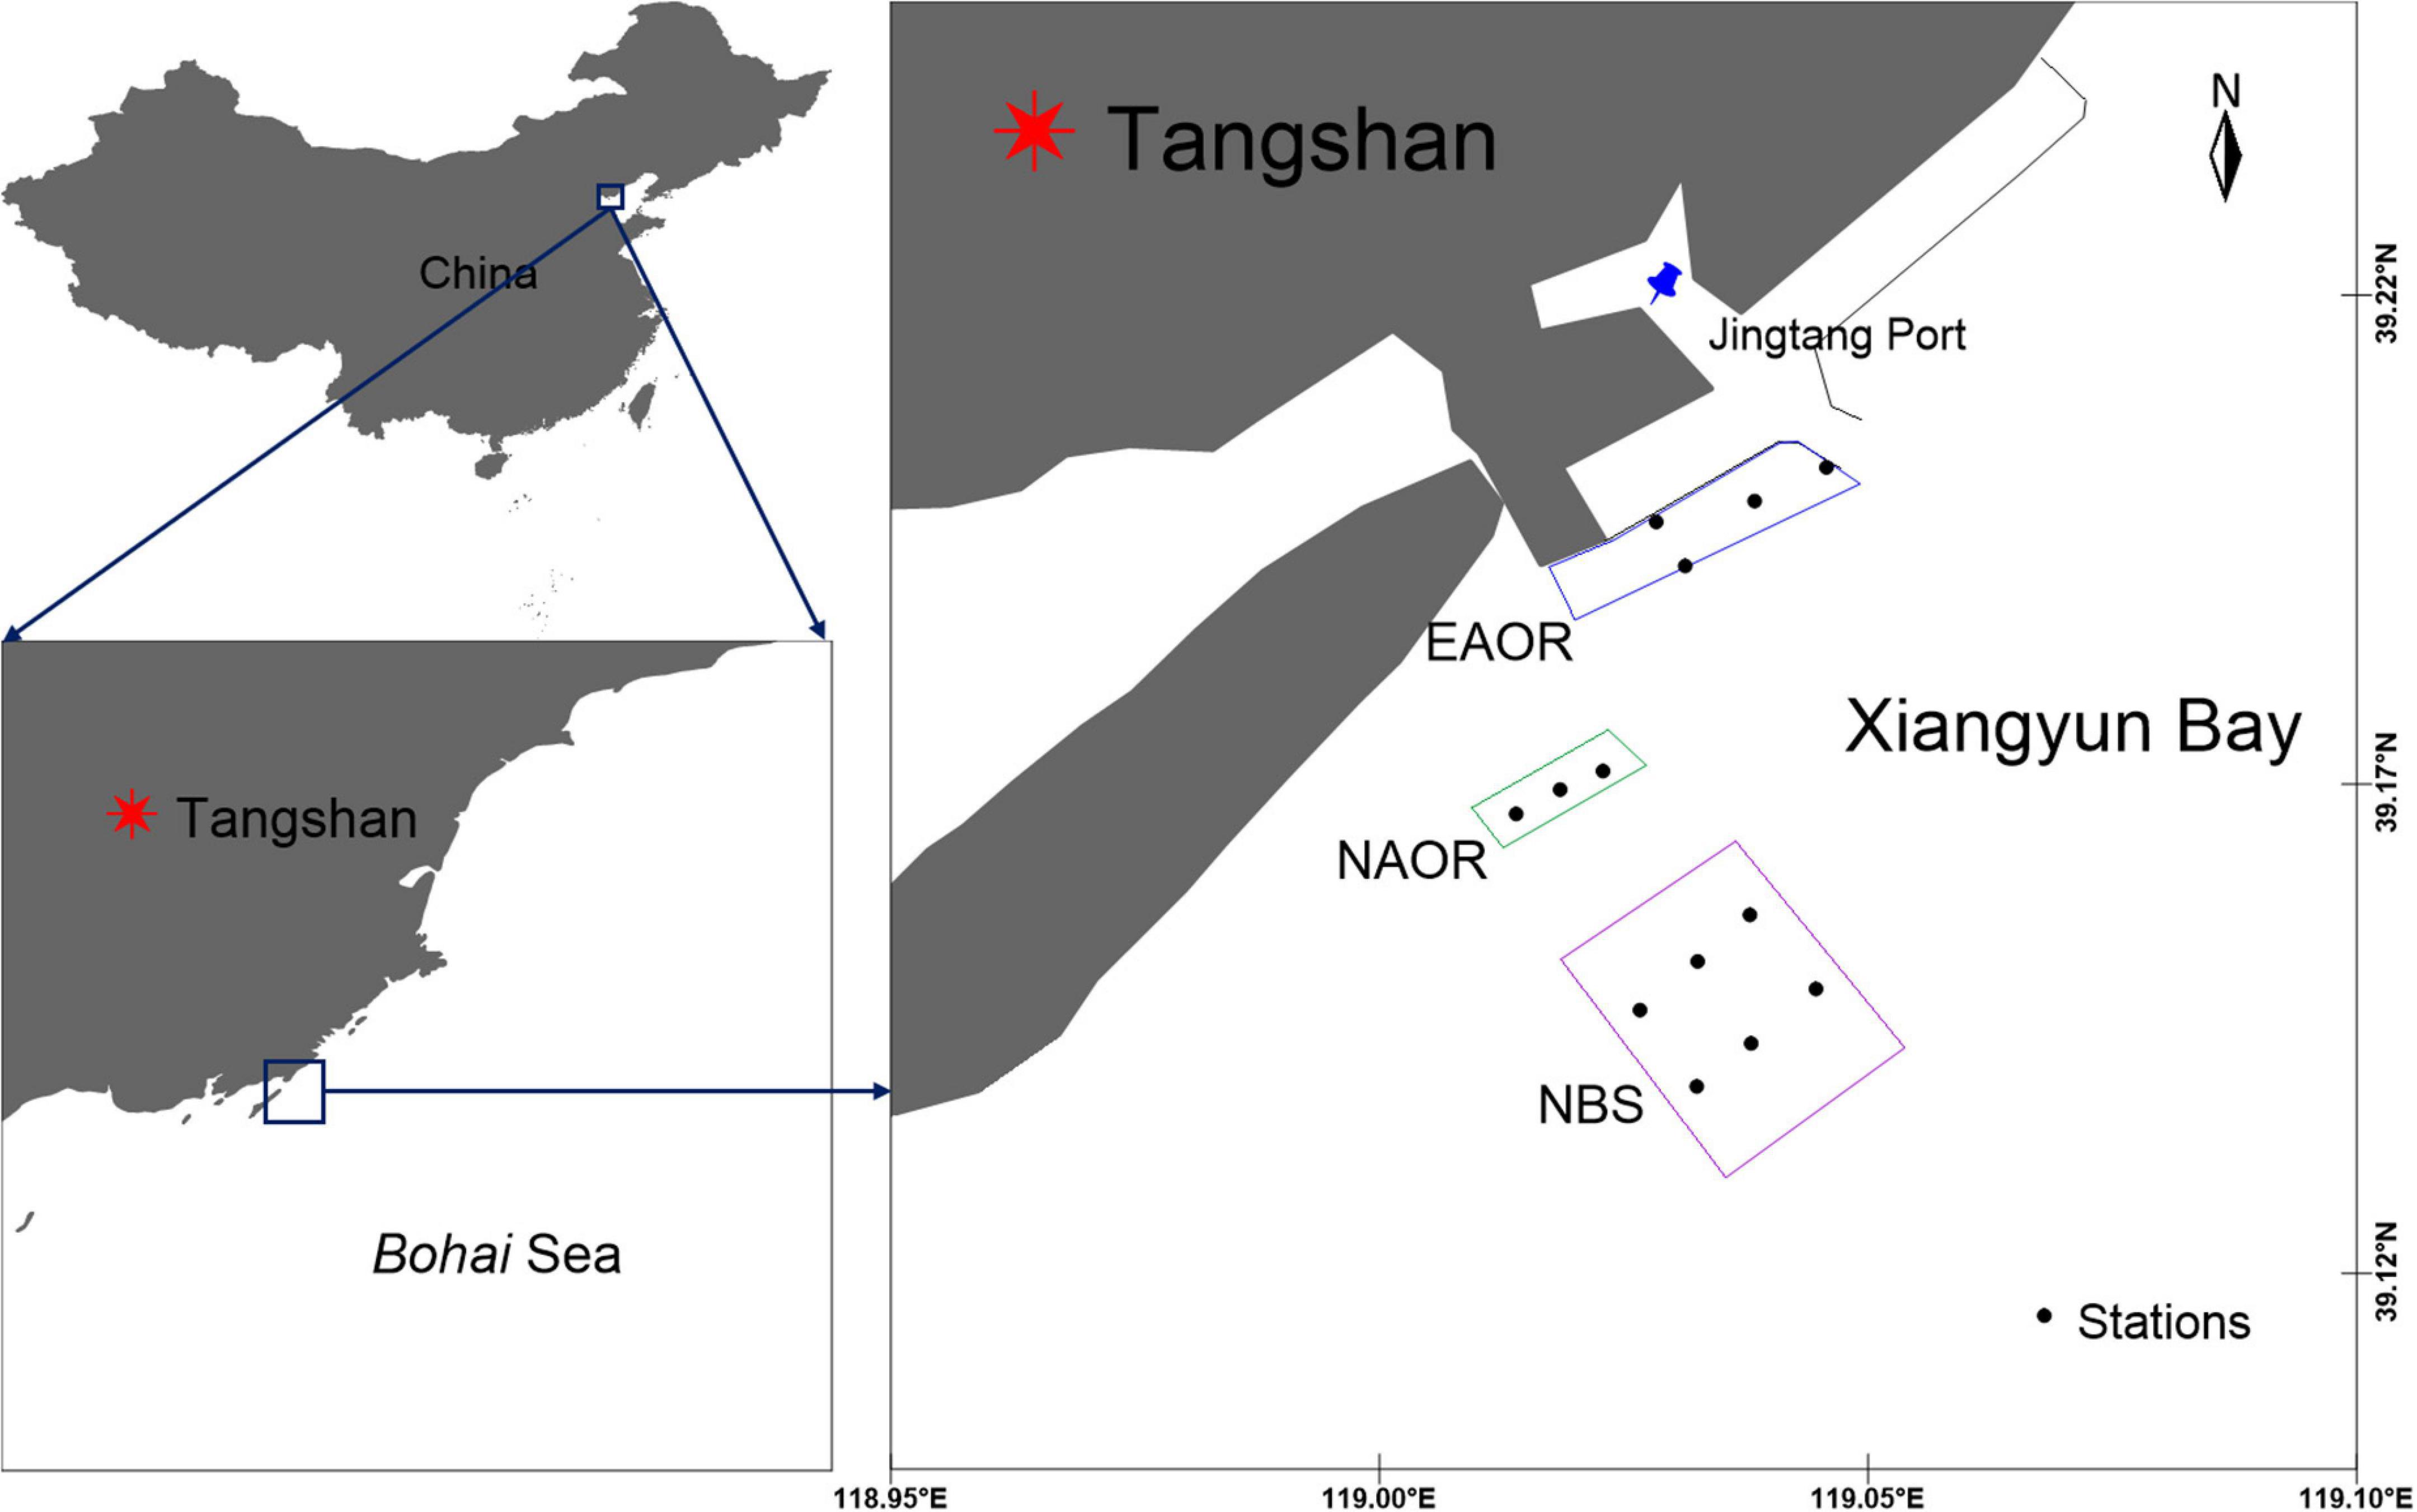
Figure 1. Geographic location and sampling sites of EAOR, NAOR and NBS ecosystems in the Bay of Xiangyun, Bohai Sea, China.
The EAOR ecosystem was constructed between 2011 and 2017 and forms an area of about 200 ha. It is located nearshore, with an average depth of 6.50 m and temperature of 13.34°C during the study year. Tremendous quantities of oysters and macroalgae coexist on the hard substrates, forming a stable kelp-shellfish-reef ecosystem (Figure 2). However, it lies next to the channel of Jingtang Port and is susceptible to dredging disturbances [Video data provided by Tangshan Marine Ranching Co., Ltd. (Hebei, China)].
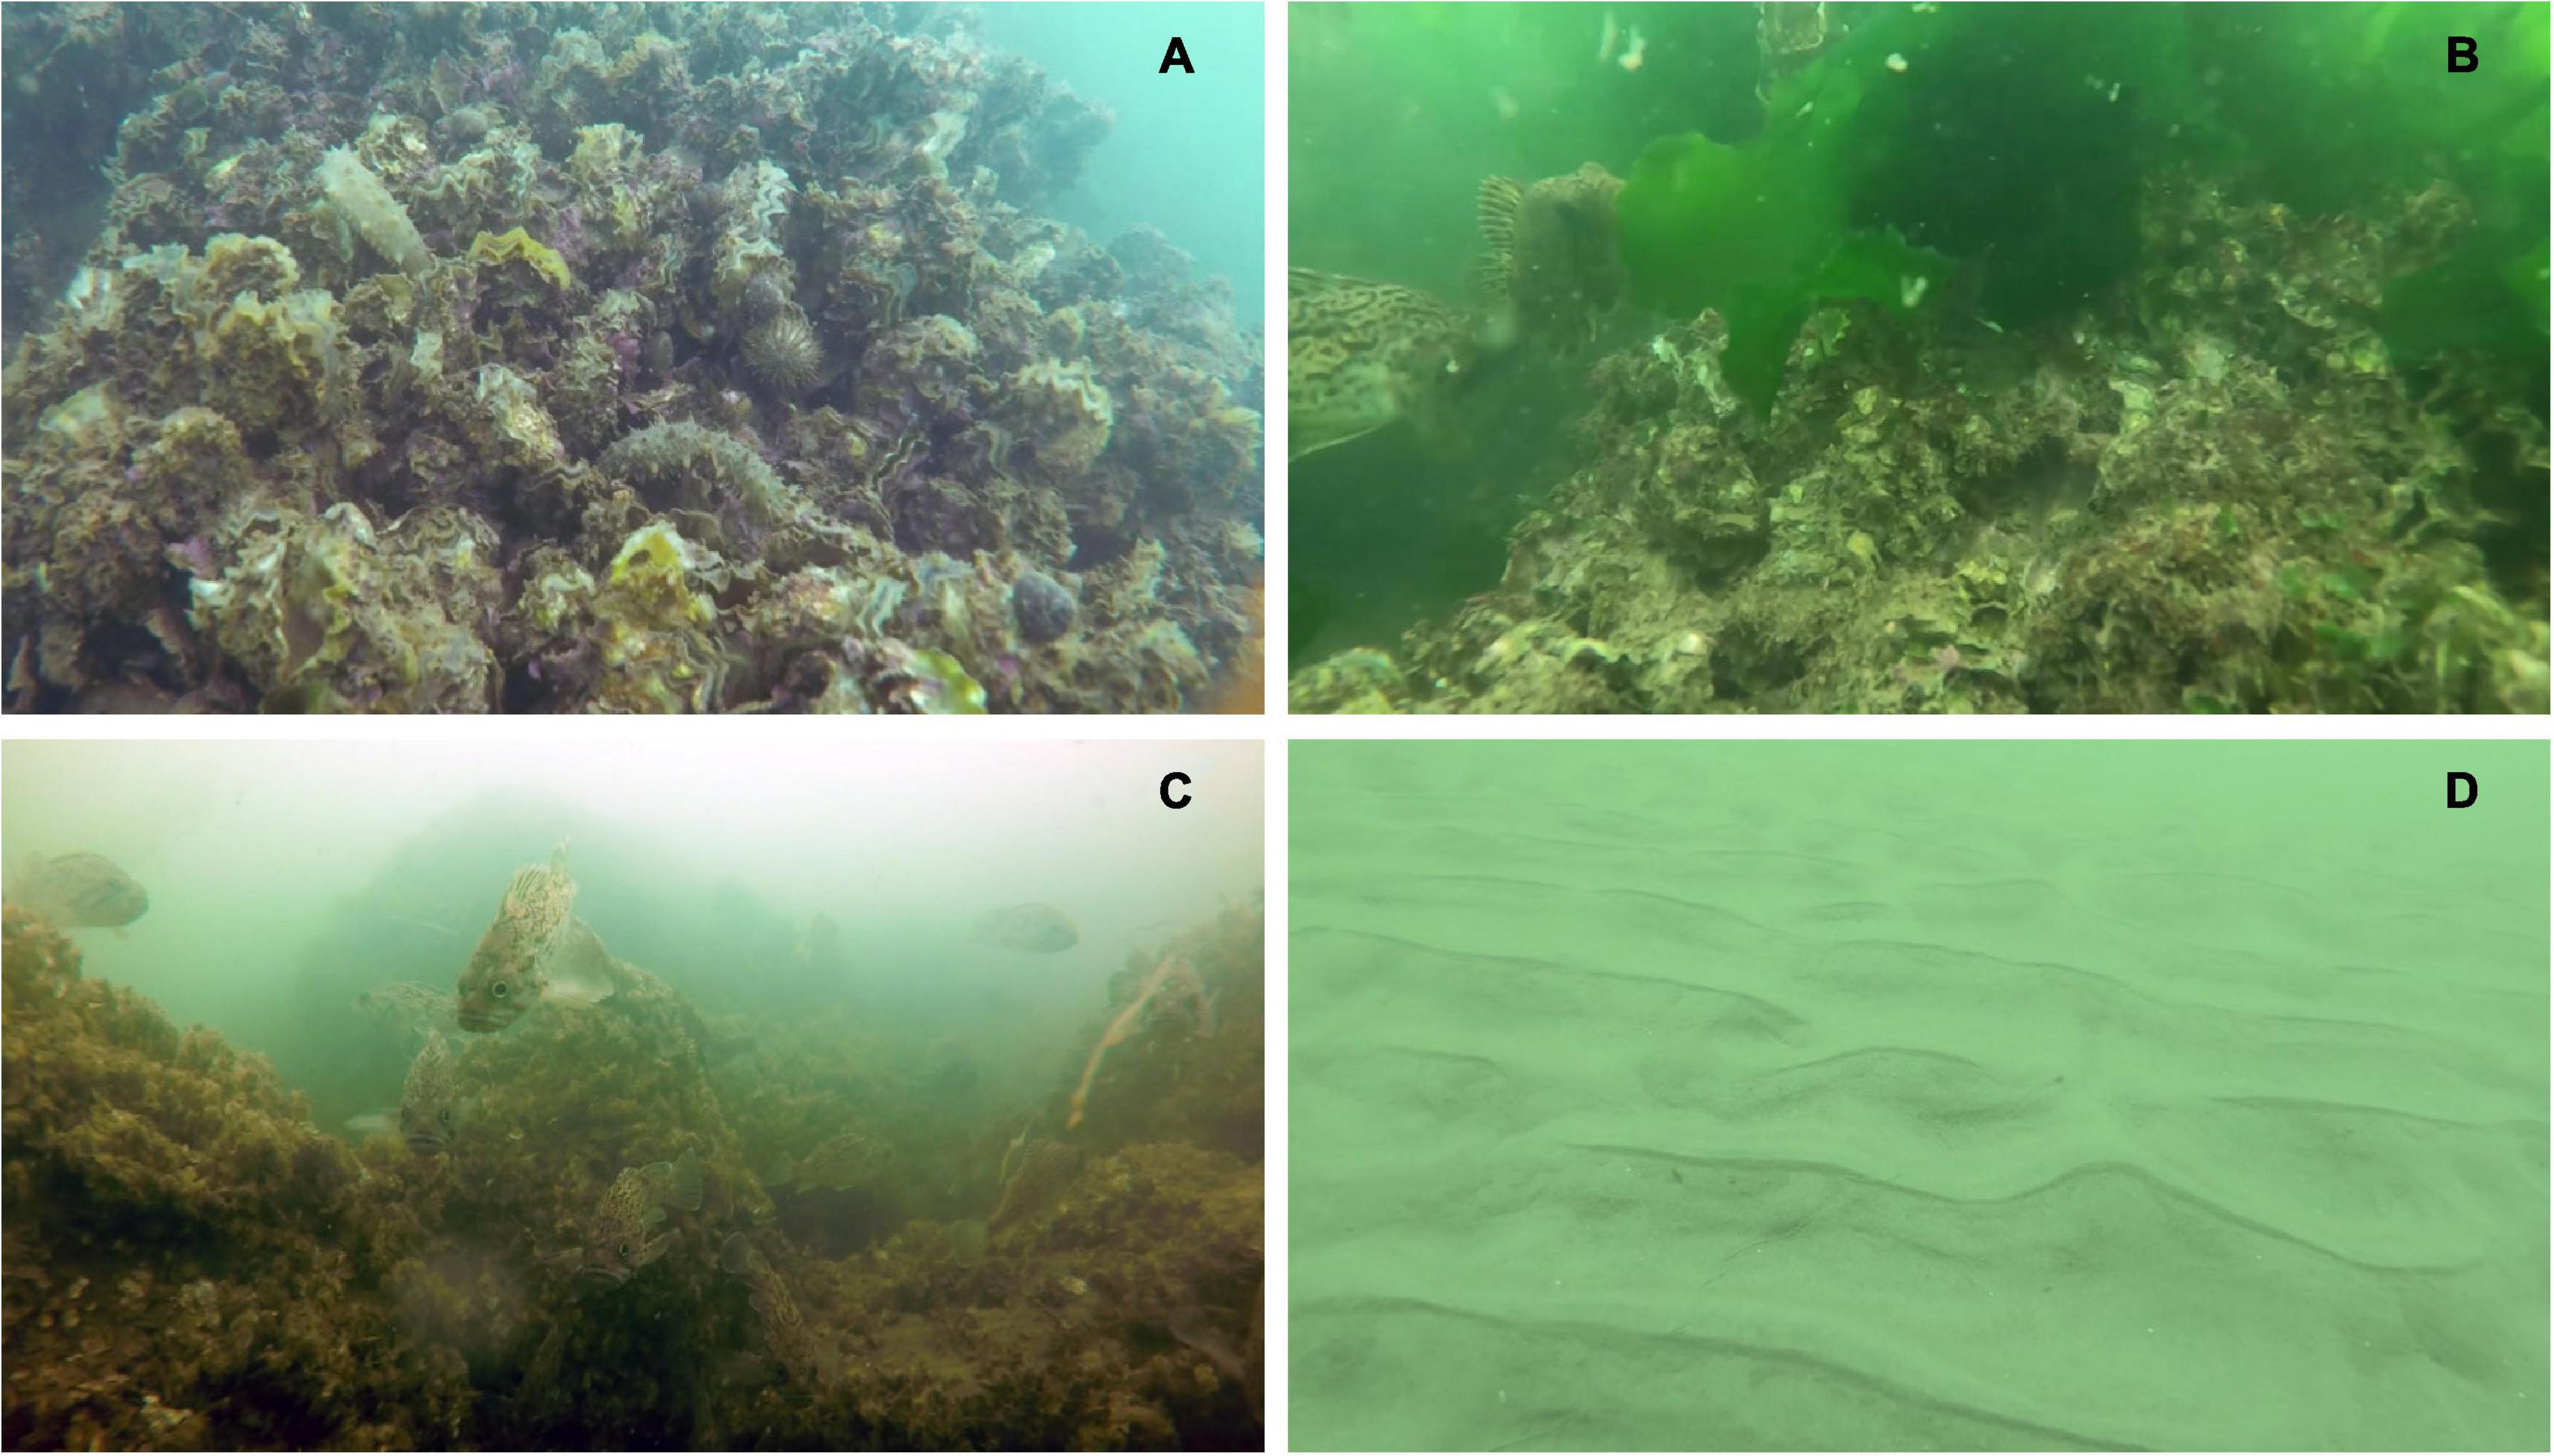
Figure 2. Benthic environment of EAOR (A,B), NAOR (C) and NBS (D) ecosystems.
The NAOR ecosystem was constructed between December, 2017 and June, 2018 and covers an area of 57 ha. It is located to the southwest of the EAOR, with a deeper depth of 8.22 m and average temperature of 13.22°C during the study year. The NAOR is more open and is characterized by entire submerged reefs with no macroalgae (Figure 2). Its further location from the coast makes it difficult to regulate, and it is more disturbed by navigation issues and illegal fishing.
The NBS ecosystem is located further south and lacks reefs. It had an average depth of 10.44 m and temperature of 12.94°C during the study year. Although the site is deeper than the other sites, the characteristics of the NBS ecosystem are similar to those of the EAOR and NAOR areas before the ecosystems were constructed, and it is located far away from the influence of the NAOR ecosystem. It is subject to intense fishery activities and its species composition has been unchangeable in recent 10 years (Sun and Zhang, 2018). Therefore, we viewed the NBS ecosystem as the background ecosystem before the addition of artificial oyster reefs, and it also represented the current natural marine ecosystem in Xiangyun Bay (Sun and Zhang, 2018; Figure 2).
The Ecopath model is commonly used to quantitatively estimate the mass transfer and energy flow in an ecosystem (Christensen and Walters, 2004; Christensen et al., 2005). According to thermodynamic theories, the energy input and output of a certain biological functional group should be in balance, meaning that productivity equals the sum of mortalities. We used another equation to determine the inner mass balance of the group; the consumption (Q) of each group was equal to the sum of the production (P), respiration (Ri), and unassimilated food (Ui) of the group. The equations are written as follows:
where Bi is the biomass of functional group i, (P/B)i is the production ratio, (Q/B)i is the consumption ratio, EEi is the ecotrophic efficiency (the proportion of the production utilized in the system), DCij is the proportion of prey i in the diet of predator j, Yi is the fishery mortality, BAi is the biomass accumulation rate, and Ei is the net migration rate. In the process of parameter input, Bi, (P/B)i, (Q/B)i, and DCij were required. If one of the first three was missing, the corresponding EE value could be designated. Besides, Ei and catches were also required.
Biological wet weight unit (t⋅km–2) was used in this study to represent the system energy flow. The biomass (B) of each functional group was obtained from the results of ecological surveys conducted during from 2019 to 2020 (Summer: June 2019, Autumn: September 2019, Winter: December 2019, Spring: March 2020). Sampling methods for nekton included trap nets, gill nets, and small trawl nets around reef areas. The biomass of fishes and cephalopods was estimated predominantly from trap nets and gill nets, while trawl nets and underwater videos were used for correction. Fish were collected using the trap nets (section × length × width × height: 5 × 8 m × 30 cm × 20 cm; mesh size: 2 cm) for 72 h each time. Fish biomass was calculated using the following equation (modified from Li et al., 2020, 2021):
where B is the fish biomass (g⋅m–2), C is the total catch weight per net (g), v is velocity (here, 0.30 m⋅s–1; Sun and Zhang, 2018), t is the effective working time (6 h/d × 3 d), a is the efficient area of the cage (here, 4.0 m2), and q is the capture efficiency (0.5; Li et al., 2020), h is the height of the nets (0.20 m here), d is the mean water depth (6.50, 8.22 and 10.44 m for EAOR, NAOR and NBS, respectively). When nekton was only caught by trap nets or gill nets, the d-value was divided by 2 (detailed calculation can be seen in Supplementary Material).
The biomass and abundance of macrobenthos (the whelks, sea cucumbers, and sea stars) were estimated by SCUBA grasping and videos combined with net operations. Bivalves, epizoites, and macroalgae were scraped from reefs using 0.5 × 0.5 m quadrats by SCUBA diving, with three to six replicates evenly distributed each season. Meiobenthos were sampled using a box sampler (0.05 m2) at each station. Zooplankton samples were obtained by vertical towing using plankton nets with mesh size of 169 μm. Phytoplankton biomass was calculated in terms of chlorophyll a measured according to standard procedures (Parsons et al., 1984). Detritus was obtained as the organic matter in the water column by filtering 1 L of subsurface and bottom seawater through a mesh size of 77 μm. Physical factors were measured in situ using a YSI meter (EXO2, Yellow Springs, OH, United States). The survey design was referred to Xu et al. (2020).
The P/B and Q/B ratios of fishes were calculated using empirical formulas (Christensen and Walters, 2004; Christensen et al., 2005), and the parameters used were from previous reports (Tang et al., 2007; Ouyang and Guo, 2010). The P/B ratios of invertebrates were estimated based on formulas in Tumbiolo and Downing (1994) and Q/B ratios were mainly estimated from previously reported laboratory culture experiments (Xu and Ma, 2009; Zhu et al., 2016; Lv et al., 2018) or expert consultation (Supplementary Tables 3–5). The food composition matrix of the functional groups was derived in part from stomach content analysis of sampled fishes and also from literature reports from nearby areas (Wei and Jiang, 1992; Deng et al., 1997; Yang, 2001a,b; Zhang, 2018) and www.fishbase.de. The catch data of EAOR came from the statistics of the fishery company Tangshan Marine Ranching Co., Ltd. (Hebei, China).
Ecopath models were balanced followed Heymans et al. (2016). First, the EE of each functional group was set to ≤ 1, meaning that the proportion of the production that was utilized in the ecosystem could not exceed 1. Second, the gross food conversion efficiency (GE = P/Q, acquired through P/B divided by Q/B) values of most functional groups were set to fall between 0.1 and 0.3. For some fast-growing species, they have higher P/Q values. The Production/Respiration (P/R) ratio, which expresses the fate of assimilated food, could not exceed 1, and the group with higher turnover has a greater Respiration/Biomass (R/B) value, which indicates the “metabolic activity level” of a group (Darwall et al., 2010).
The pre-balanced diagnosis (Link, 2010) was used to identify issues in the model structure and in data quality before balancing the network model. The uncertainty of Ecopath model input parameters was analyzed using the pedigree index (Christensen et al., 2005). For B, P/B, Q/B, and diet composition (DC) values, the uncertainty indices were assigned in terms of data resources. Summarizing the uncertainties of all functional groups, pedigree index could evaluate the overall quality of the Ecopath model for a particular ecosystem.
Ecological network analysis was performed directly within the EwE software using the network analysis plugin (Christensen and Walters, 2004). A set of ecological indices was employed to describe the structure and function of the ecosystem. The total system throughput (TST), total consumption (TQ), total exports (TEx), total respiration (TR), and flows into detritus (FD), as well as the total primary production (TPP) and total biomass (TB), characterize the overall activity and the size of the ecosystem (Latham, 2006; Ortiz et al., 2015). The TPP/TR and TPP/TB ratios are the most important indicators of the stability and maturity of the ecosystem (Odum, 1969; Christensen, 1995). Finn’s cycling index (FCI), the connectance index (CI), and the system omnivory index (SOI) together with the Finn’s mean path length (FMPL) represent stress and structural complexity of the ecosystem (Finn, 1976; Christensen and Walters, 2004; Libralato, 2013). Ascendency (A) indicates the degree of development and maturity of an ecosystem, while overhead (O) represents the capacity of an ecosystem to withstand perturbations (Ulanowicz, 1986; Christensen, 1995).
The non-integral trophic level (TL) of each functional group was calculated from the food web matrix. The mean TL (mTL) reflects the structure of the functional groups, and it can be calculated by the weighted average TL for functional groups with TL ≥ 2 (Pauly et al., 1998). The total mean transfer efficiency (mTE) was calculated as the geometric mean of TEs of flow transferred from each discrete TL to the next one starting from TL II (Christensen et al., 2005).
Mixed trophic impact (MTI) analysis provides quantification of direct (predation) and indirect (competition) feeding interactions between compartments in an ecosystem (Ulanowicz and Puccia, 1990). The negative and positive elements of MTI enable estimation of top-down and bottom-up effects, respectively (Libralato et al., 2006). The overall impact (εi) of each compartment characterizes its functional role in the system and is useful for identifying key functional groups (Libralato et al., 2006). Key functional groups are distinguished as keystone and structuring groups according to their biomass (Power et al., 1996). Keystone groups have high overall effect but low biomass proportion, while structuring groups have both high overall trophic effect and high biomass proportion (Heymans et al., 2011). The keystoneness index (KSi) and dominance index (KDi) were quantified to identify the keystone functional groups (i.e., with KS ≥ 0) and structuring functional groups (i.e., with KD ≥ –0.7) in the three ecosystems following Libralato et al. (2006) and Heymans et al. (2011):
where εi represents the overall impact of group i on the other groups (excluding itself), and pi represents the biomass proportion of group i.
We also estimated the biological carrying capacity (BCC) of the ecologically or economically important functional groups, which is defined as the maximum biomass that could be sustained indefinitely without significantly changing the major energy fluxes or structure of the ecosystem (Jiang and Gibbs, 2005).
In terms of species composition and their ecological traits, we identified 23, 23, and 18 functional groups for the EAOR, NAOR, and NBS ecosystems, respectively (Table 1 and Supplementary Tables 6–8). Commercially or ecologically important species (e.g., black rockfish, whelks, sea cucumbers, et.) were treated as separate functional groups in the models. For commercially important species, they either hold massive biomass or might act as joints in the trophic cascade effect exerted by fishery. Pedigree index values for the EAOR (0.596), NAOR (0.581), and NBS (0.515) ecosystems were within a reasonable range, indicating that input data for the three models were of good quality (Morissette, 2007).
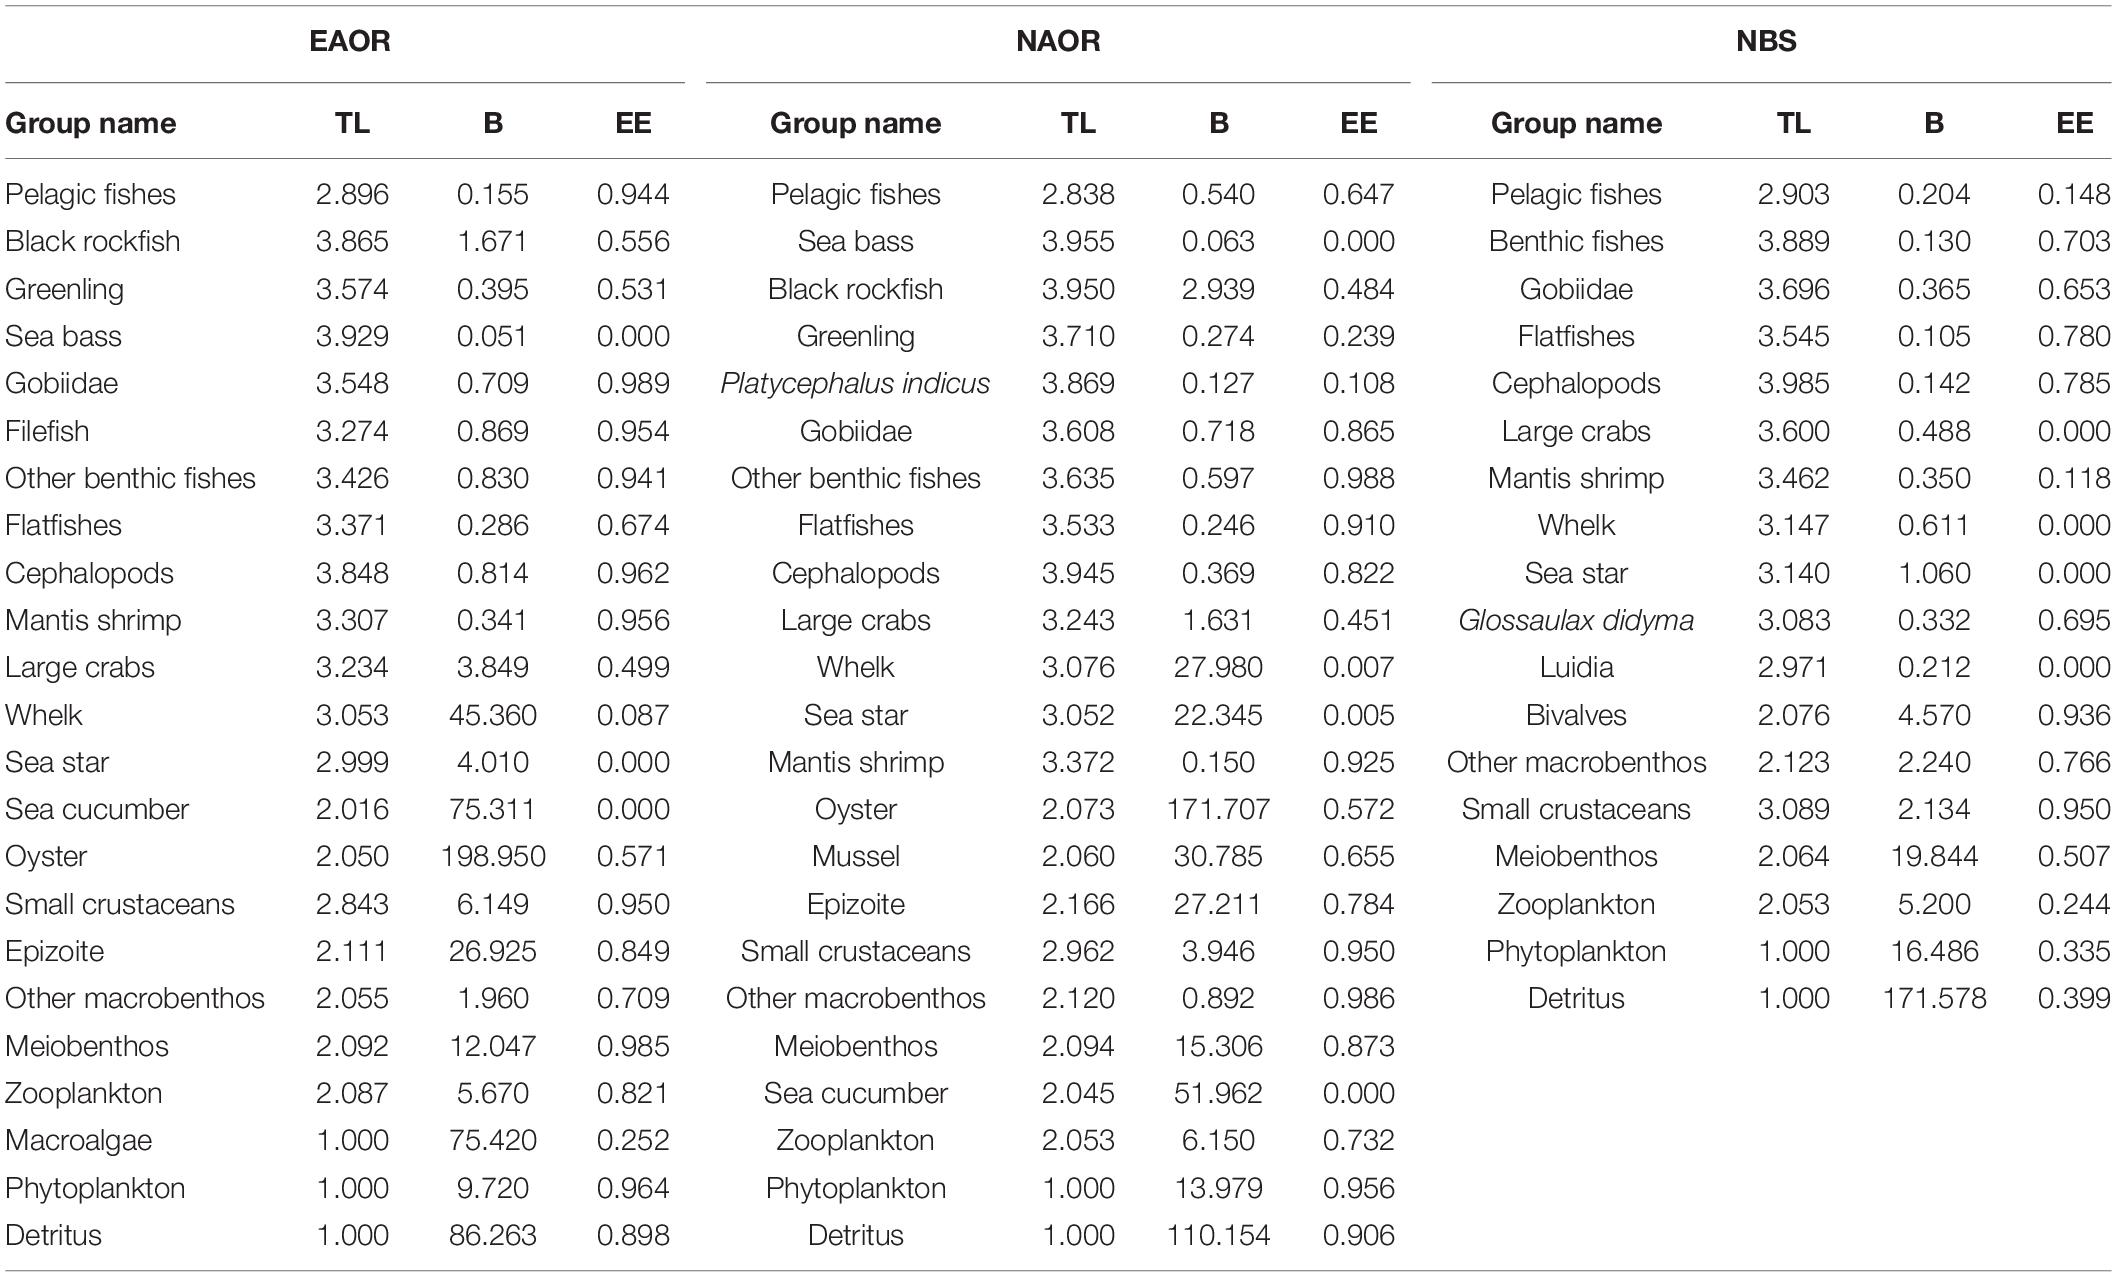
Table 1. Biomass (B, t⋅km−2⋅yr–1), Ecotrophic Efficiency (EE) and Trophic level (TL) of each group in the three models (EAOR, NAOR, and NBS ecosystems).
Total biomass (TB) values (except for detritus) of the EAOR, NAOR, and NBS ecosystems were 471.492, 379.915, and 54.474 t⋅km−2⋅year–1, respectively (Table 2). For all three ecosystems, biomass was mainly concentrated in TL II (Figure 3). Oysters, epizoites, and sea cucumbers constituted the major component of the biomass of TL II in the EAOR and NAOR ecosystems. While in the NBS ecosystem, because of the lower biomass in TL II (57.96%), the biomass ratio of TL I was relatively higher (30.27%). The mean EE values of the EAOR, NAOR, and NBS ecosystems were 0.497, 0.572, and 0.417 apart. The EEs of different functional groups varied greatly (Table 2). In the EAOR and NAOR areas, the high EE value groups were mainly prey groups in medium and low TLs, whereas the EE values for top predators and macroinvertebrate groups were rather low. But most functional groups in the NBS ecosystem were quite underutilized.
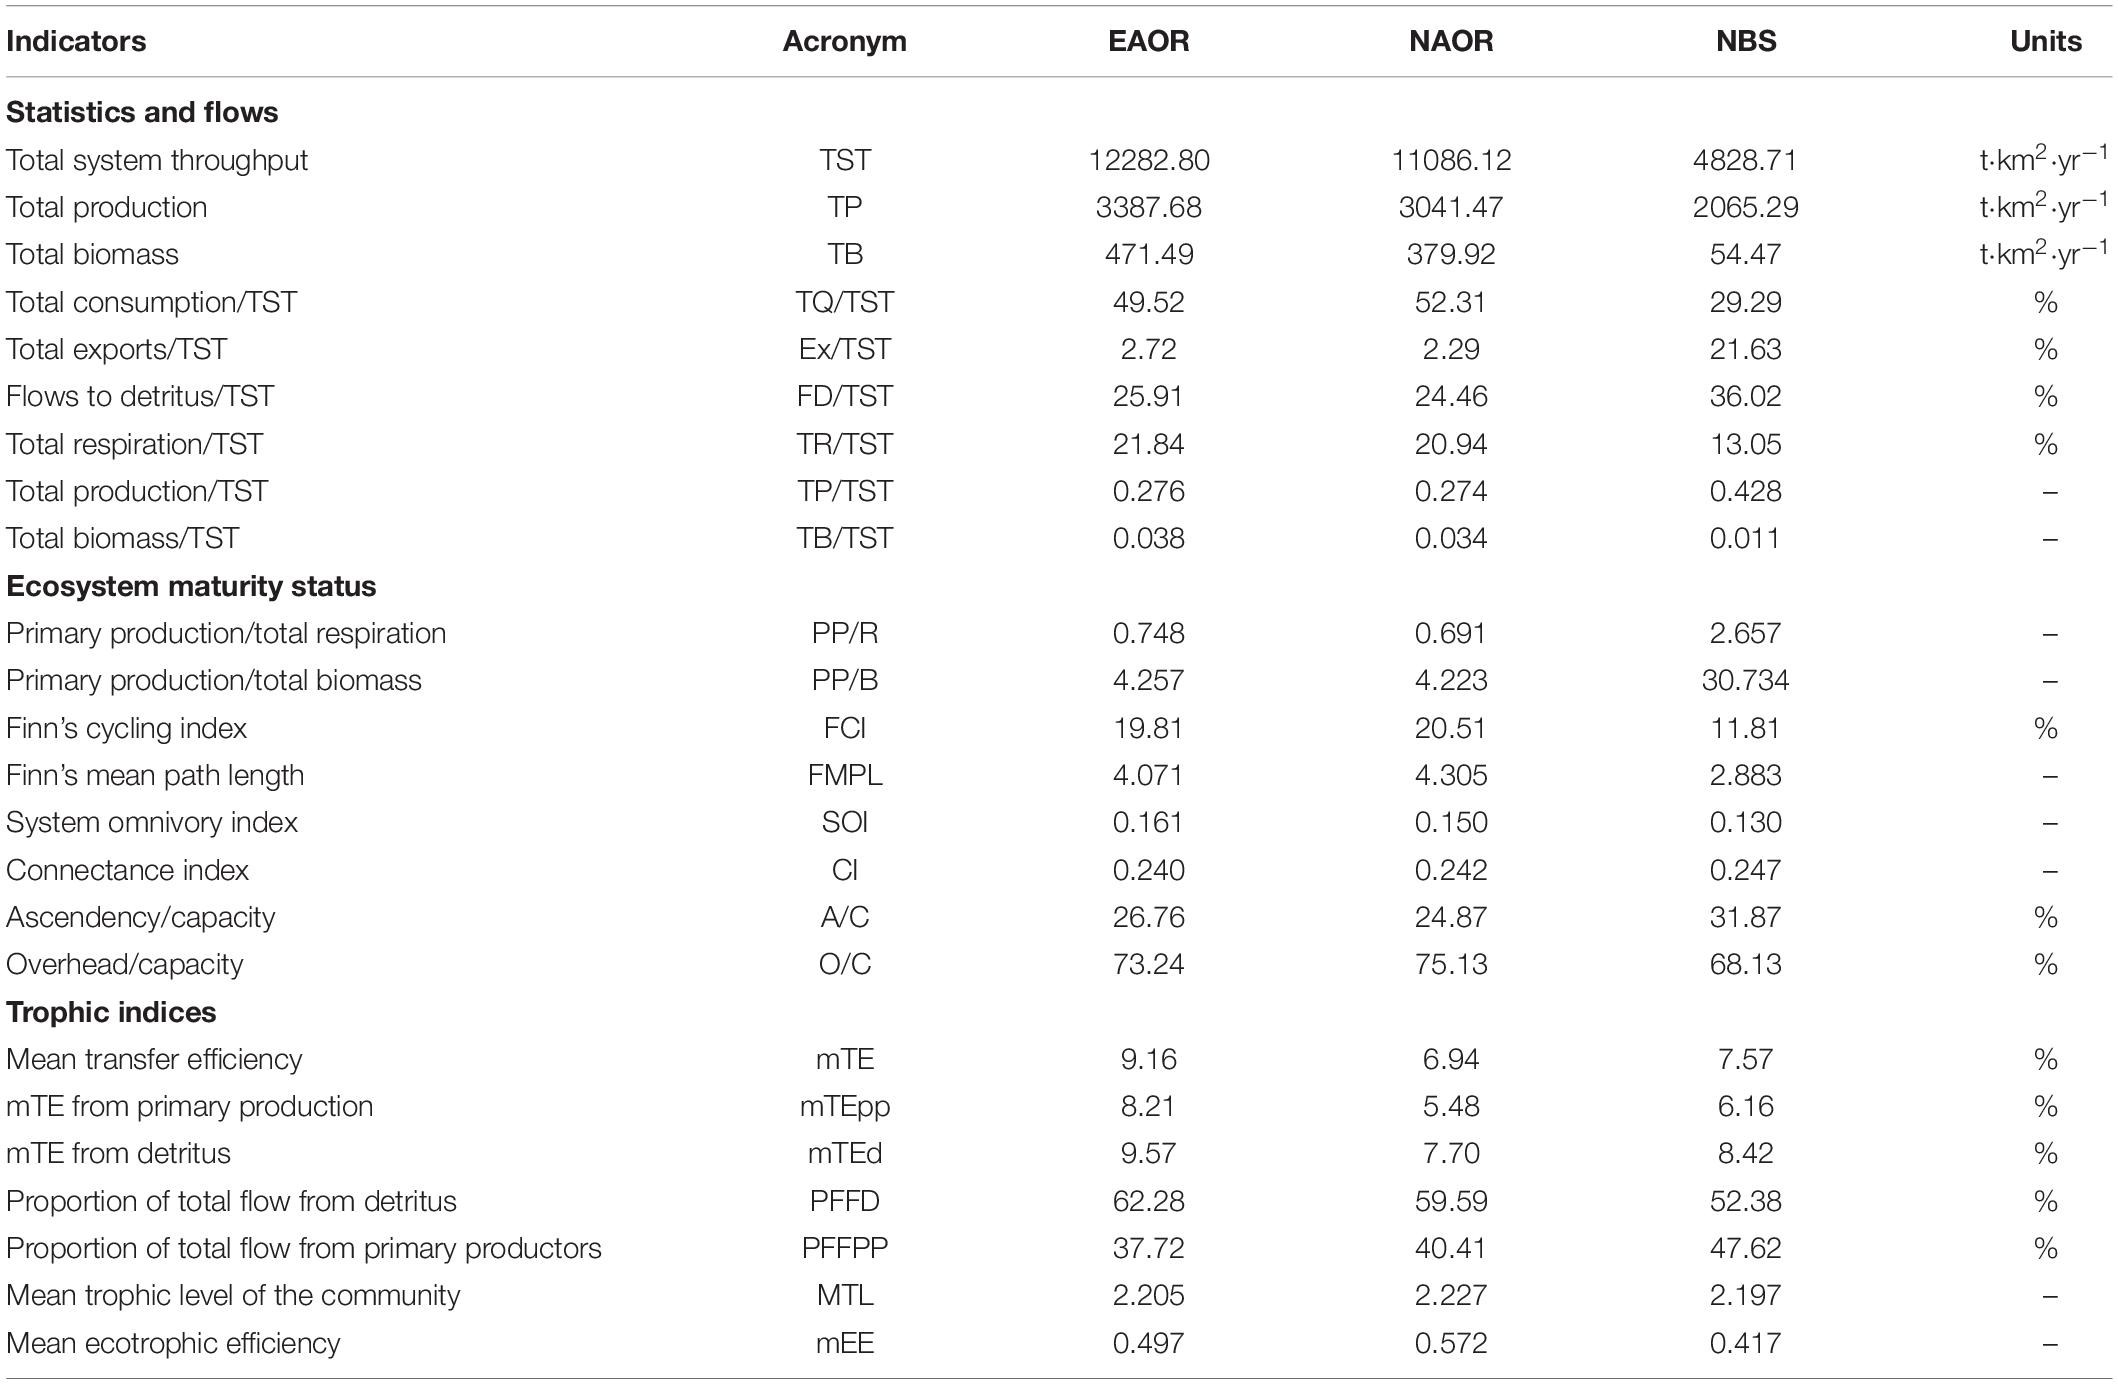
Table 2. Ecological indicators (statistics and flows, ecosystem maturity status and trophic indices) estimated by the Ecopath models of EAOR, NAOR, and NBS ecosystems.
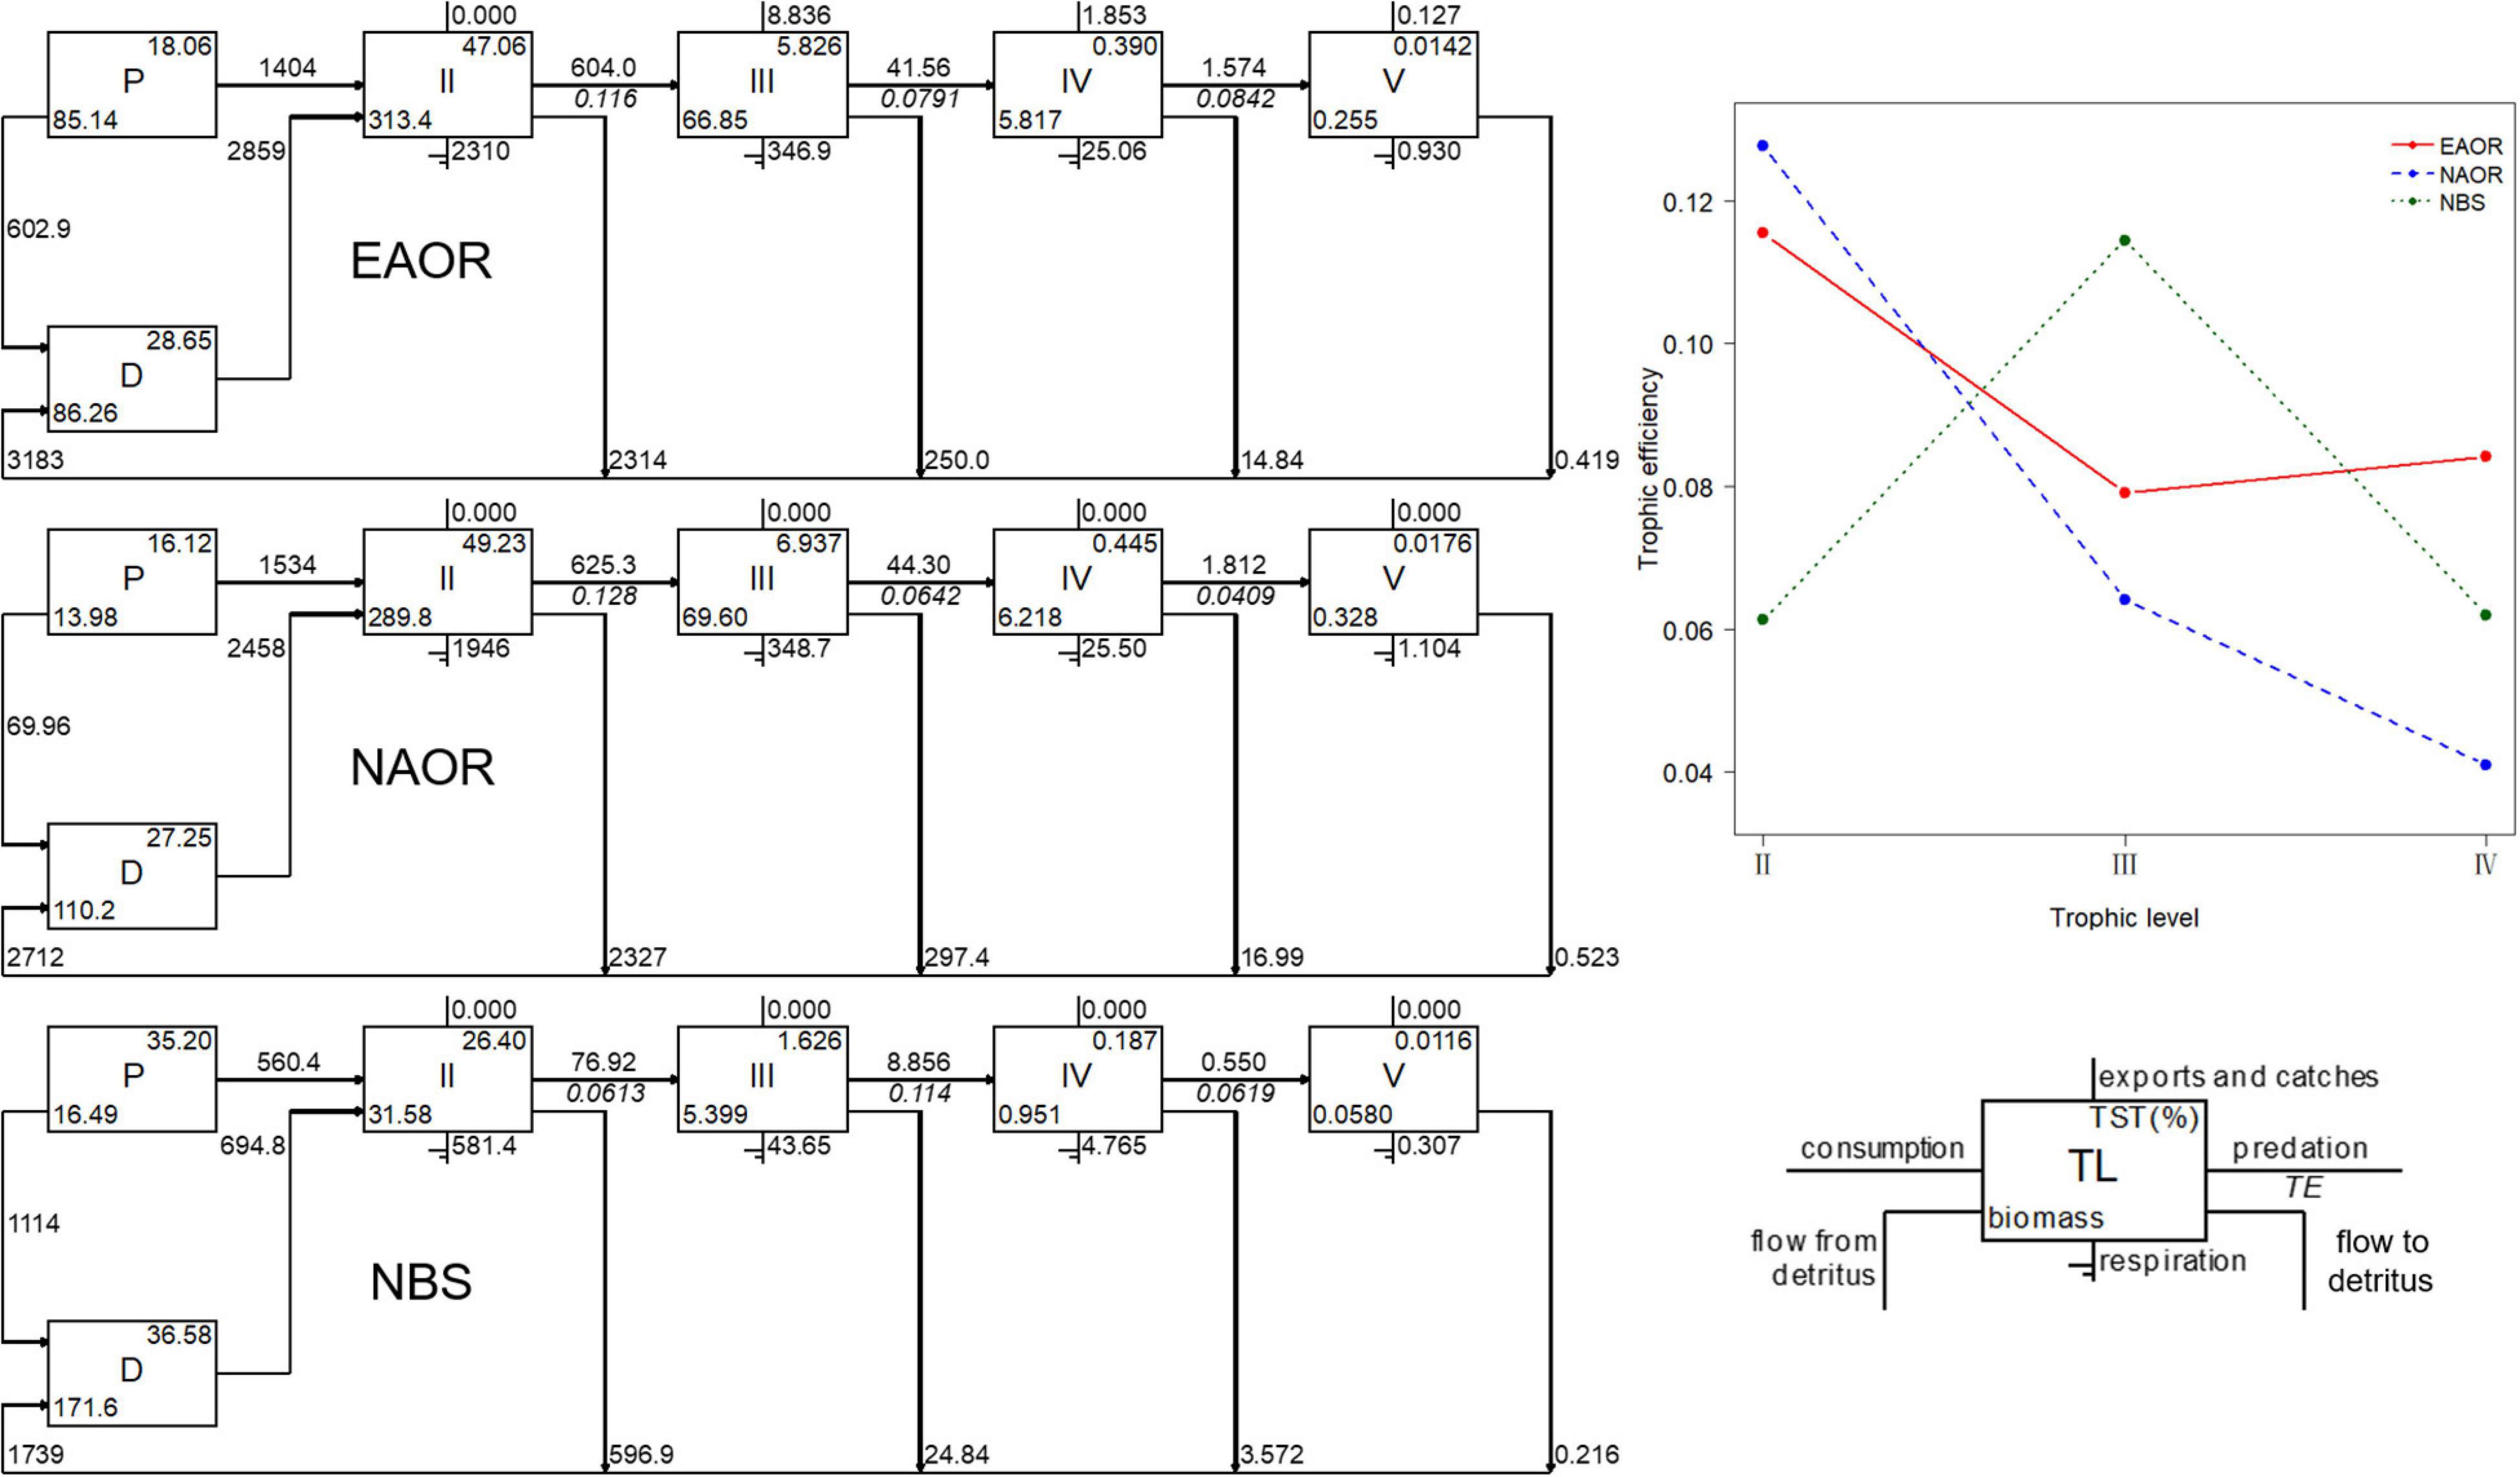
Figure 3. Flow diagrams (left) and transfer efficiencies (upper right) between discrete trophic levels for the three models (EAOR, NAOR and NBS ecosystems).
For all three models, the system energy flow was mainly concentrated in TLs I and II, which accounted for over 90% of TST (Figure 3). Particularly, in the NBS area, the energy flow in TL I reached more than 70% of the system. The fraction of total energy flew from detritus to TL II was greater than that from primary productors in all three models and increased in sequence as EAOR > NAOR > NBS (Table 2). The holistic mTE showed that the EAOR system was more efficient than the NBS and NAOR ecosystems. The mTE originating from detritus (mTEd) exceeded that from primary production (mTEpp) in all three systems (Table 2).
In the EAOR ecosystem, we identified four distinctive trophic pathways based on the ecological niches and trophic interactions (Figure 4): (1) From macroalgae to herbivorous epizoites and macrobenthos, which were further mainly consumed by euryphagous fishes; (2) from phytoplankton and detritus to zooplankton or meiobenthos; the materials were used by small shrimps/fishes and finally flowed to top nekton predators; (3) phytoplankton and detritus, which were mostly filtered by the massive numbers of bivalves, which then were consumed by carnivorous macrobenthos such as whelks, sea stars, and large crabs; and (4) from detritus to sea cucumbers, which mainly ended to fishery. We identified the latter three pathways in the NAOR ecosystem; it was missing the macroalgae chain. The NBS system lacked sea cucumbers, and only pathways two and three were detected. However, the bivalve pathway was quite weak compared with the two reef ecosystems because of the small number of bivalves present.
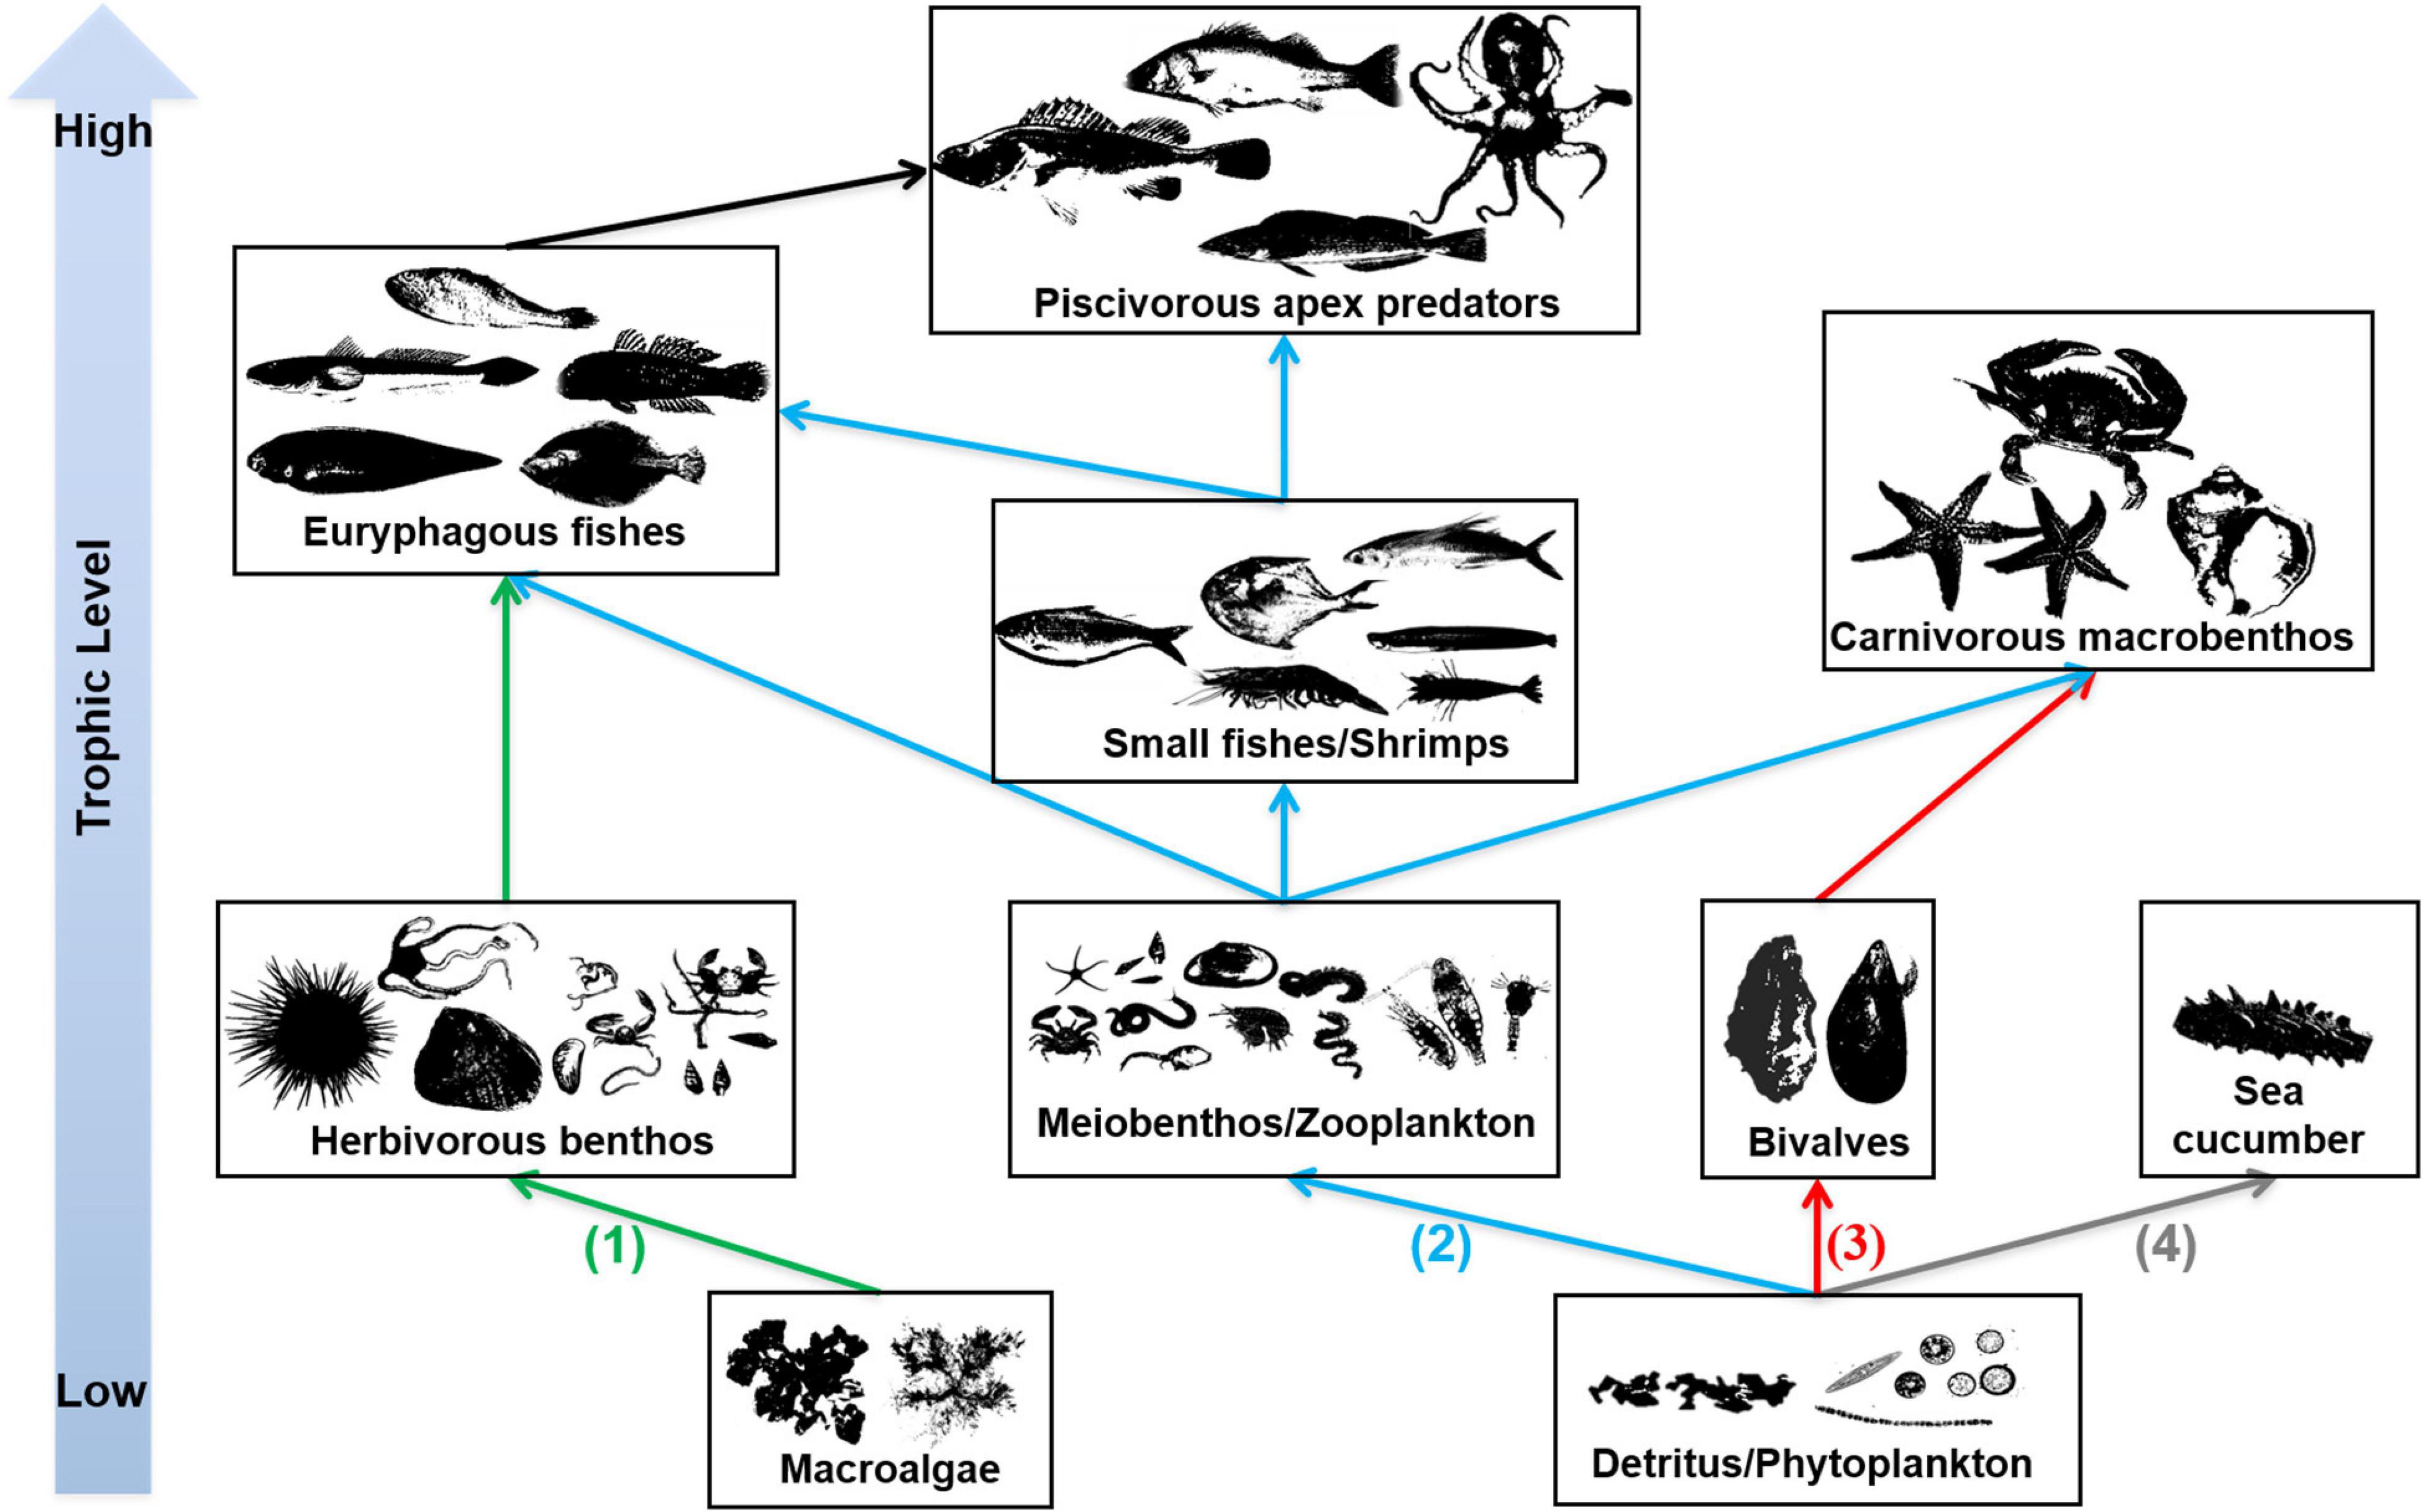
Figure 4. Trophic pathways in EAOR ecosystem [(1)–(4)], NEOR ecosystem [(2)–(4)], and NBS ecosystem [only (2)–(3)].
Table 2 provides aggregated summary statistics and indicators of network analysis for each system. The TSTs estimated for the EAOR, NAOR, and NBS ecosystems were 12,282.800, 11,086.120, and 4848.713 t⋅km−2⋅year–1, respectively. Differences in TST and its four distributions illustrated larger size and better energy utilization in the EAOR and NAOR systems than in the NBS area. The TB/TST ratio in the three models showed the same trend (Table 2).
In the EAOR and NAOR systems, the TPP/TR ratios were < 1 (0.748 and 0.691, respectively), and the TPP/TB ratios were 4.257 and 4.223 (Table 2). In the NBS area, the TPP exceeded TR (2.657), and the PP/TB ratio was 30.734. The FCI and SOI displayed increasing tendencies in the order of EAOR > NAOR > NBS. However, the opposite trend was observed for the CI.
The development capacity (C) of the three models was 57,214, 54,175, and 16,675 flowbits in the EAOR, NAOR, and NBS ecosystems, respectively. The A/C and O/C ratios were 26.76 and 73.24% in the EAOR, 24.87 and 75.13% in the NAOR, and 31.87 and 68.13% in the NBS ecosystems (Table 2).
Figure 5 shows the ε of each functional group in the three models determined based on the results of MTI analysis. In the EAOR ecosystem, cephalopods (0.832) and oysters (0.749) had the greatest ε on the ecosystem (Table 3), whereas pelagic fishes (0.072) and sea bass (0.042) had relatively low impacts. Cephalopods group had the highest KS value (–0.081) and thus was identified as the keystone functional group of the system. Oysters had the greatest KD value (–0.501) and acted as the structuring functional group of the system (Table 3).
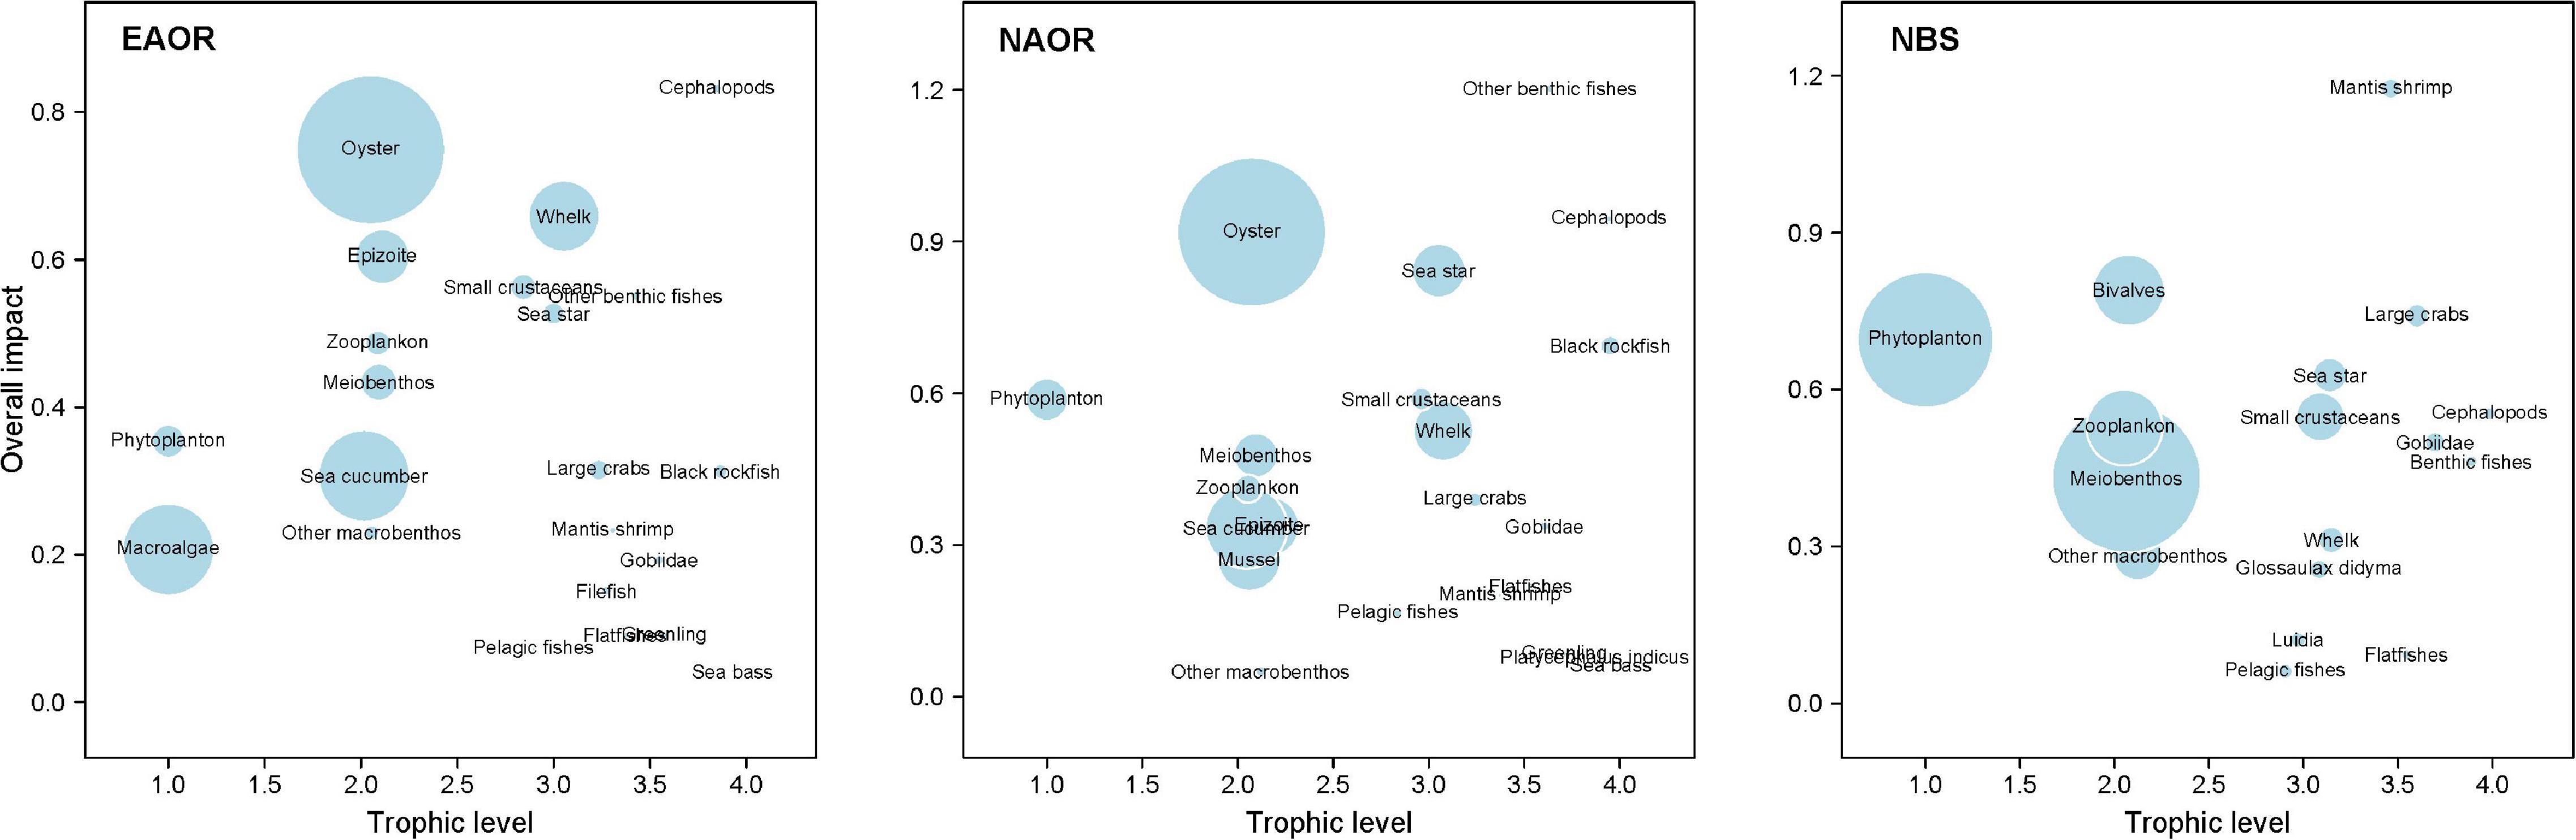
Figure 5. Overall impact (ε) of each functional group in the three models (EAOR, NAOR, and NBS ecosystems). Circle size indicates the proportional biomass.

Table 3. Keystone and structuring functional groups for the three ecosystems.
In the NAOR system, other benthic fishes (1.203), cephalopods (0.946), and oysters (0.919) had the top three ε values. Sea bass (0.063), greenling (0.085), the fish Platycephalus indicus (0.075), and other macrobenthos (0.050) had relatively lower impacts on the whole system. Other benthic fishes and cephalopod groups were identified as the keystone groups of the system (KS values of 0.080 and –0.025, respectively). Oysters group with KD of –0.382 was recognized as the structuring group of the ecosystem (Table 3).
In the NBS system, mantis shrimp had the greatest total mixed ε value of 1.176. With a KS value of 0.067, it was regarded as the keystone group of the system. Large crabs (0.741) and bivalves (0.790) also had high ε values, but they were not identified as keystone groups. Phytoplankton with a KD of –0.677 was the structuring group of the ecosystem. Pelagic fishes (0.061) and flatfishes (0.093) had the lowest ε values in this ecosystem (Table 3).
According to the precondition of maintaining the balance and stability of the current marine ecosystems, the biomass of relevant economically and ecologically important organisms in the Ecopath model of the system was gradually increased until the EE value of any one group exceeded 1, and finally the biocapacities of these groups in the ecosystem were obtained (Table 4). For four of the six common groups, there were greater biological carrying capacities (BCCs) in the EAOR ecosystem than in the NAOR and NBS systems. However, mantis shrimp had a greater BCC in the NBS than in the other two ecosystems. As one of the most commercially important aquaculture species in northern China, sea cucumbers had the highest BCC among the functional groups in the EAOR and NAOR ecosystems, and they were principally sustained by detritus. The whelk Rapana venosa mostly benefited from the massive bivalves, had the second highest BCC, and had the most enhancement potential. As the critical structuring functional group of the reef ecosystems, the BCCs of bivalves were also evaluated. The NAOR area had the greatest bivalve BCC value among the three sites, followed by the EAOR and NBS ecosystems. Overall, the EAOR system had very similar but slightly better BCC values than the NAOR system, and both were much better than the NBS system. The reef systems could maintain greater biomass for top predator groups and economically important macrobenthos groups.
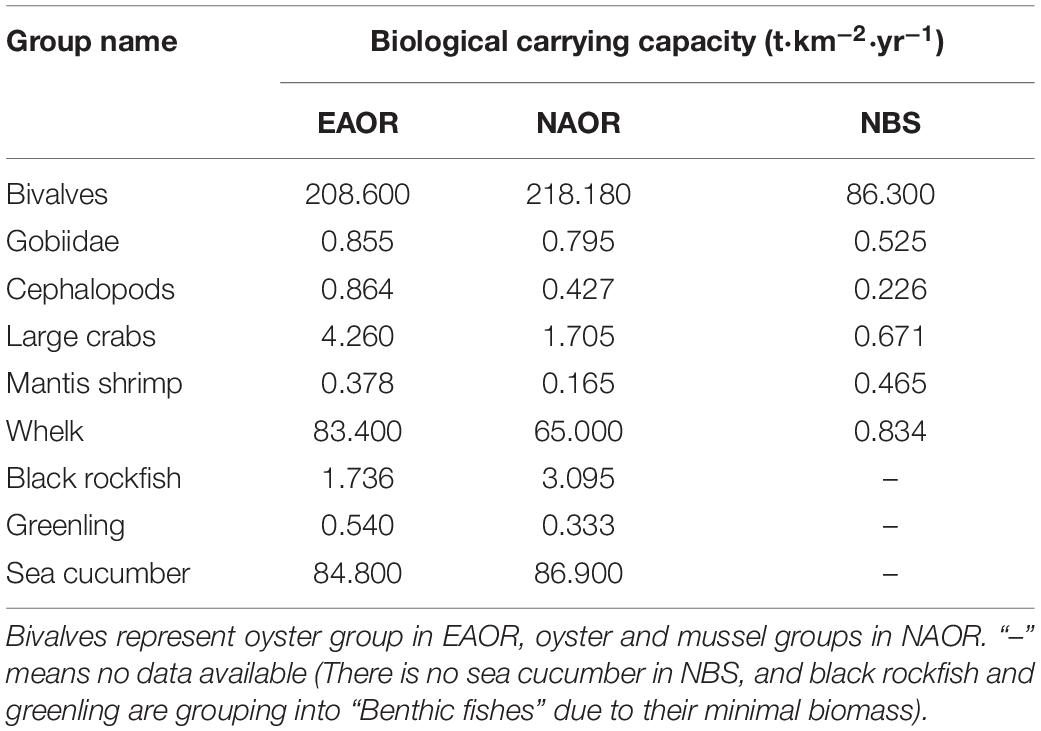
Table 4. Biological carrying capacities (BCC) of ecological or economical important groups in the three models (EAOR, NAOR, and NBS ecosystems).
Because of the wide distribution of oysters, restoration work for oyster reefs can be carried out from temperate to tropical coastal regions in water depths of < 20 m. The deployment of artificial structures that can provide a suitable substrate for oyster larvae to settle on offers a kick-start for oyster reef establishment (Walters and Coen, 2006). The projects in Xiangyun Bay represent progress in artificial habitat construction from bare substratum to rocky reefs in the Bohai Sea nearshore zone. In this study, we conducted integrated analysis of the structure and function of reef and non-reef ecosystems using the Ecopath model to clarify the role of artificial oyster reefs in coastal ecological restoration. We explored the similarities and differences in biomass composition, trophic transfer, mixed trophic impact, total system characteristics, and ecosystem maturity and stability among three different ecosystem types, thereby providing a holistic and profound understanding of artificial oyster reefs in the Bohai Sea. Our results can further facilitate oyster reef restoration and preservation.
Based on the description in Libralato et al. (2006) and Heymans et al. (2011), we identified keystone functional groups (i.e., with KS ≥ 0) and dominant/structuring functional groups (i.e., with KD ≥ –0.7) in each of the three ecosystems. The TL, biomass proportion, and top-down effects of keystone functional groups and structuring functional groups calculated from the three models were almost all within the reasonable ranges averaged for 105 models in Heymans et al. (2014), except for cephalopods in reef systems presenting stronger top-down effects than the average 67 ± 28%.
For the EAOR and NAOR ecosystems, cephalopods constituted the keystone functional group and oysters were the structuring functional group (Table 3). In the NBS system, the keystone and structuring groups were mantis shrimp and phytoplankton, respectively. Although keystone functional groups exhibited a clear prevalent top-down effect in each ecosystem, their trophic levels decreased from the EAOR to the NAOR to the NBS ecosystem. The oyster group in the EAOR and NAOR ecosystems exerted a moderate top-down effect, but phytoplankton in the NBS ecosystem exhibited a strong bottom-up effect. These differences between the three ecosystems demonstrated the presence of stronger top-down effects in artificial oyster reefs compared to the NBS ecosystem (Mcqueen et al., 2011). Rahman et al. (2019) also indicated the strong bottom-up dynamics in the entire Bohai Sea ecosystem.
In ecosystems, keystone functional groups usually had higher trophic level and mainly affected food webs through top-down effects, whereas structuring groups affected ecosystems mainly through bottom-up effects. However, researches referring to structuring functional group were scarce. Heymans et al. (2014) concluded that producers, especially benthic primary producers, were key structuring groups following method of Libralato et al. (2006). But those ecosystems were shallow water with depth < 10 m. In deeper waters, phytoplankton was identified as structuring functional group (NBS ecosystem in this study; Morales-Zárate et al., 2004). Ju et al. (2020) proposed that zooplankton, meiobenthos, and shrimp were the structuring functional groups based on their pelagic-benthic coupling effect in the ecosystem following Valls et al. (2015). In this study, we followed the calculation of Libralato et al. (2006). But the results of our reef ecosystems were differed from them, mainly due to different ecosystem structures. In EAOR and NAOR systems, the biomass proportions of oysters were 42.20 and 45.20%, and their flow to detritus took percentages of 45.07 and 44.39%. Their dominant role in ecosystem structure and energy flow made them the structuring groups of the systems. The ecological role of oysters might be even larger because of their non-predatory roles (Heymans et al., 2014). As the oyster population is quite vulnerable to various disturbances (Walles et al., 2016), long-term monitoring of environmental factors and protection strategies for the oyster populations need to be implemented.
The relative values of total system throughput (TST) of the three systems were 1.000, 0.903, and 0.393, respectively, indicating that the overall scales of the EAOR and NAOR were nearly comparable, but both were much greater than that of the NBS system. This result was consistent with that of reef and non-reef ecosystems reported by Feng et al. (2018). The TST scale of the EAOR and NAOR were of same magnitude as that of Lidao Island (Wu et al., 2016) and Jurien Bay (Lozano-Montes et al., 2011), but smaller than that of Tongyeong Bay (Lee and Zhang, 2018) and the Galapagos subtidal rocky reef (Okey et al., 2004), which are all characterized by reefs. Meanwhile, the scale of the NBS ecosystem was similar to that of Bohai Sea (Lin et al., 2009), Laizhou Bay (Ju et al., 2020) and the southern Yellow Sea (Lin et al., 2013), which represent non-reef large-scale systems. The ratios of allocation of TST in each system revealed the same utilization pattern for the EAOR and NAOR areas, with the most consumed and least exported. This pattern was in line with the natural reef ecosystem modeled in Zhang (2021). However, the NBS system showed a totally different pattern, with the most flows to detritus and the least to respiration, which was in agreement with results from Laizhou Bay and Haizhou Bay (Ju et al., 2020). These two diverse patterns were also consistent with the artificial reef system and its control area system studied by Feng et al. (2018) and Xu et al. (2019). Greater energy flows occurred in consumption and respiration activities in the EAOR and NAOR systems, whereas larger quantities of energy flowed into detritus and accumulated in the NBS system, which was also in agreement with the high TPP/TR ratio and low FCI index of the NBS system (Table 2).
In each of the three ecosystems, the energy of the system was mainly transferred through grazing and the detrital chain, but the latter played a more important role in the reef systems than in the bare substratum system. Simultaneously, the mTEd was greater than the mTEpp in the three models. Detritus-feeding activities increased with artificial oyster reef construction. The same conclusion was drawn from similar filter feeder-dominated ecosystems (Jiang and Gibbs, 2005; Pinkerton et al., 2008; Raoux et al., 2017). Raoux et al. (2017) suspected that the colonization by bivalves of the turbines of offshore wind farms would increase detritivory in the food web. In the field experiment conducted at Vanarna, on the west coast of Sweden, abundance and biomass of associated flora and fauna and their biodiversity increased because of mussels biodeposition (Norling and Kautsky, 2007). Increased numbers of bivalves improved the benthic-pelagic link by filtering organic matter out of the water column and depositing it on the seafloor, making it biologically available to benthic consumers (Newell, 2004; Wilhelmsson et al., 2006; Maar et al., 2009). The production of benthic organisms was enhanced by the sufficient food supply and thus improved the efficiency of energy recycling. In this process, bivalves ultimately initiated the shift from primary producer- and grazing-dominated food chains toward a more detritus-feeding community (Norling and Kautsky, 2007). Blomberg and Montagna (2014) also identified that 63–80% of total secondary production of ecosystems in Gulf of Mexico was supported by the benthic food chain than the pelagic food chain and with more efficiency in energy transfer.
The mean transfer efficiencies (mTEs) in the three ecosystems were all under the average of 10.1% of 48 global aquatic ecosystems (Pauly and Christensen, 1995) and 15% for temperate coastal ecosystems (Ryther, 1969), but they were comparable to values from systems shallower than 20 m (Heymans et al., 2014). However, these three systems exhibited different transfer patterns, indicating disparate functioning processes (Figure 3). For the EAOR and NAOR ecosystems, the TEs of TL II–III were 12.77 and 11.55%, but they rapidly decreased in the next two TL transfers. In the NBS system, the TE between TL III and IV was the highest (11.45%), while other transfers were ∼6%. These differences might be due to the high mean EEs of TL II in the EAOR and NAOR ecosystems. Prey groups were well utilized in TL III, but a large proportion of the biomass consisted of whelks, large crabs, and sea stars in TL III, which could not be consumed by top predators such as cephalopods, sea bass, and black rockfish. This contributed to the low TEs in the next TL transfers. In the NBS system, instead of carnivorous macroinvertebrates, fish functional groups constituted the larger percentage of the biomass in TL III, which can be exploited more efficiently by top predators. However, due to its lower biomass, herbivorous and detritivorous groups could not be utilized as well. Similar results could be seen in Daya Bay (Chen et al., 2015) and Haizhou Bay (Ju et al., 2020).
In EAOR and NAOR ecosystems, 67.73 and 71.00% of the energy flowing to TL II were consumed by oysters, respectively. As the zooplankton and meiobenthos mostly passed energy on to demersal or pelagic fishes, the bivalves efficiently deposited it to the macrobenthos through predation. In this way, the linear phytoplankton/detritus-oyster-carnivorous macrobenthos pathway developed and dominated and sustained highly efficient secondary production in oyster reefs. As the energy decreases by 90% with each increase of a discrete TL, a large amount of energy was dissipated through biological respiration and excretion, leading to a great reduction of biomass with increasing TL (Pauly and Christensen, 1995). However, ecosystems with massive numbers of oysters or other bivalves can effectively alter this situation (Blomberg and Montagna, 2014). Oysters or bivalves feed on phytoplankton and detritus of TL I and promptly transfer the energy to predators of TL III, such as whelks, large crabs, and sea stars. From the beginning to the end, the energy was transferred twice with about 1% of the energy of the fractional primary production conserved in TL III, thus it could support the large biomass of economically important macroinvertebrates. Compared with traditional grazing food chains flowing through zooplankton or meiobenthos, at least one energy transfer was shortened. Hence, the utilization of primary production became more efficient and was able to sustain the great biomass of carnivorous gastropods and crabs (Xu et al., 2019). Vander Zanden et al. (2006) and Blomberg and Montagna (2014) also found that benthic trophic pathways might be more efficient in their transfer compared to pelagic pathways. Therefore, we proposed that the artificial oyster reefs have produced carnivorous macrobenthos with high efficiency (Cresson et al., 2014, 2019). Considerable economic benefits can be generated through reasonable exploitation.
As an ecosystem develops, its biomass, information, and complexity increase. However, when the ecosystem is affected by external disturbances, such as overfishing activities, it may show the opposite trend (Essington et al., 2006; Heymans and Tomczak, 2016). The TPP/TR and TPP/TB ratios are both significant parameters that reflect the maturity of an ecosystem (Odum, 1969; Christensen et al., 2005). When an ecosystem develops into maturity, the TPP/TR ratio approaches 1 and the TPP/TB ratio decreases. As an ecosystem becomes more mature, the food chains change from linear into web-like, and the TST, FCI, FMPL, CI, and SOI values increase (Ulanowicz, 1986; Libralato, 2013). The TPP/TR ratio of the NBS ecosystem was > 1 and was comparable to those of Laizhou Bay and Haizhou Bay (Ju et al., 2020), indicating their similar unmature ecosystem status. Large amounts of surplus primary production deposited or exported (Feng et al., 2018). In the EAOR and NAOR ecosystems, the TPP/TR ratio was < 1, which was different from values of many other ecosystems, except for the Galapagos rock reefs (Okey et al., 2004), Fuhan artificial reefs (Feng et al., 2018), and Laizhou Bay artificial reefs (Xu et al., 2019). The Galapagos ecosystem was characterized by large biomass of filter feeders, urchins, and herbivorous fish concentrated in TL II. The Fuhan and Laizhou Bay ecosystems had structural features similar to those of the EAOR and NAOR ecosystems, with large amounts of bivalves settled on the reefs. As the macroalgae could not be consumed directly (Krumhansl and Scheibling, 2012), and the phytoplankton and detritus in the oyster reef ecosystems could not support the massive consumption of oysters and other bivalves, these systems required nutrient input along with water exchange from other areas (Okey et al., 2004). Zhang et al. (2008) also discovered that suspended particle organic materials supporting massive biomass of scallop mainly coming from the water exchange. This might explain why most natural oyster reefs always occurred in estuaries (Kirby, 2004).
The FCI and FMPL indices of reef systems were comparable with the ratios of the 1–10 km2 ecosystems described in Heymans et al. (2011), indicating that both systems had stability and energy flow diversity (Finn, 1976). The difference in FCI between the EAOR and NAOR systems and the NBS system supports the premise that strong recycling activity is linked to high bivalve biomass (Raoux et al., 2017, 2020). The SOI and CI were relatively low in all three models compared to the models listed in Wu et al. (2016) and to the SOI of reef ecosystems described in Heymans et al. (2011), demonstrating that the food webs of the three systems were simple and linear (Libralato, 2013). This might be strongly related to the increase of stenophagous oysters, whelks and sea cucumbers. The linear phytoplankton/detritus-oysters-carnivorous macrobenthos and detritus-sea cucumbers pathways enhanced the energy utilization efficiency but decreased the complexity of food webs (Heymans et al., 2014).
System maturity also can be evaluated by the development capacity, A, and O (Ulanowicz, 1986; Monaco and Ulanowicz, 1997). The development capacities of the EAOR and NAOR ecosystems were much greater than that of the NBS system by factors of 2.431 and 2.249, respectively. The A/C ratio, which describes the system organization and efficiency, and the O/C ratio, which describes the system’s resilience, were all moderate in the three systems compared with values reported for other reef models (Wu et al., 2016; Calderon-Aguilera et al., 2021). The higher O/C values in the NAOR and EAOR ecosystems (about 7.00 and 5.11% greater than that of the NBS system) suggested that the food webs in reefs were more stable than that of the NBS area (Pérez-España and ArreguìN-Sánchez, 2001), with a greater capacity to resist disturbances (Ulanowicz, 1986; Christensen, 1995). This scenario was confirmed by the current states of the reef ecosystems. The NAOR system is located farther from the coast and it is more vulnerable to illegal fishing and disturbed by freighters than the EAOR area. The EAOR ecosystem, however, is negatively impacted by nearby channel dredging. In contrast, the NBS ecosystem has become more specialized under generally intensive fishery pressures (Heymans and Tomczak, 2016). Its A/C and O/C ratios were comparable to those of Laizhou Bay described in Ju et al. (2020), demonstrating that these ecosystems gradually reorganized under various disturbances and easily return to equilibrium (Pezy et al., 2017; Raoux et al., 2020). Overfishing activities shifted the regime of the bare substratum ecosystem, and trapped it at the early development stages (Heymans and Tomczak, 2016; Sun and Zhang, 2018).
In short, all three ecosystems evaluated in this study were not yet mature, but the EAOR and NAOR ecosystems had more complicated trophic relationships and greater capacity to withstand perturbations compared to the NBS ecosystem. The differences could be attributed to the oyster reef construction and restoration, which enhanced the ecosystem complexity and diversity, and energy transfer efficiency. The nutrient input through water exchange would compensate the prey deficit of oysters and influence the maintenance of the system. Water exchange rate might be a critical factor in oyster reefs site selection and design.
The main economically important organisms in the study area include the rockfish Sebastes schlegelii, the greenling Hexagrammos otakii, gobies, cephalopods, and macroinvertebrates such as the crab Charybdis japonica, the mantis shrimp Oratosquilla oratoria, the whelk R. apana venosa, and sea cucumbers. The BCCs of the bivalves in the EAOR and NAOR ecosystems were comparable with those of Fuhan artificial reefs (Feng et al., 2018), Laoshan Bay (Liu et al., 2019), and Zhangzi Island (Xu et al., 2016). The BCCs of sea cucumbers in our study were relatively low in comparison with that of Lidao (Wu et al., 2013). Comparative analysis of the BCCs of functional groups between the artificial oyster reef ecosystems and the NBS ecosystem showed that the BCCs of the economically and ecologically important groups in the reef systems were much greater than those of the NBS system, which illustrated that the artificial oyster reef construction could sustain more massive biomass of organisms and benefit to resources conservation.
The BCC assessment could become one of the foundations of ecosystem-based management (Byron et al., 2011; Kluger et al., 2016; Yang, 2018). Results of BCC analysis could be a meaningful guidance for marine ranching and food web optimizing to enhance the utilization efficiency of organic matter and energy. In the EAOR and NAOR ecosystems, the biomass of whelks and sea cucumbers could be reasonably enhanced by feeding on oysters and detritus. Additionally, sea stars predation on oysters can be severe and they compete with whelks and large crabs, so they need to be eliminated in a timely manner. In the NBS system, however, the low EEs of phytoplankton and detritus were consistent with the enormous BCC of bivalves, indicating insufficient utilization of primary production and the potential to restore oyster reefs in such areas.
Keystone and structuring functional groups both have a strong overall effect on entire ecosystems (Power et al., 1996; Libralato et al., 2006). In our study, cephalopods and oysters were identified as the common keystone and structuring groups, respectively, in the reef ecosystems. A small change in their biomass would alter the structure and function of the systems. Therefore, both groups should be well preserved. Cephalopods are also important fishing targets, so they need to be carefully managed. Although it is not a fishery target in the local region, the oyster population is quite vulnerable to various disturbances (Kirby, 2004; Walles et al., 2016). Therefore, long-term monitoring of environmental factors and protection strategies for the oyster populations need to be implemented.
Numerous oyster reef restoration or preservation projects have been launched by governments and non-governmental organizations around the world in last few decades (La Peyre et al., 2014; Pogoda, 2019; Gillies et al., 2020; Mcafee et al., 2020). However, the restoration and construction of oyster reefs began more recently in China, and great knowledge gaps still exist (Quan et al., 2017; Yang et al., 2020). The results of this study could facilitate our understandings of oyster reef ecosystems. In artificial oyster reef ecosystem: (1) the oyster group was the structuring functional group and played a critical role in trophic structure; (2) the phytoplankton/detritus-oyster-carnivorous macrobenthos pathway developed and dominated, leading to highly efficient secondary production; (3) detritus-feeding activities increased with artificial oyster reef construction; (4) the TPP/TR ratio was < 1 and relied on nutrient inputs from adjacent ecosystems; and (5) there was great potential to resist disturbances.
The overall better ecosystem status of oyster reefs than the bare substratum indicates that artificial oyster reef restoration/construction provides great advantages to the ecosystem, such as habitat provisions and improved trophic structure, which can fundamentally alleviate the trend of seabed desertification and benefit coastal ecological restoration (Langlois et al., 2006; Gain et al., 2016). The high secondary productivity of the ecosystem is catering to the demand for aquatic products. Combined with marine ranching of commercial important species and recreational fishing, considerable economic benefits can be generated (Xu et al., 2019). This study also certifies its suitability and great potential for oyster reef restoration and construction in coastal waters shallower than 10 m. Besides, the NAOR ecosystem demonstrates the short temporal scales (1–2 years) for artificial oyster reef ecosystems evolving into a reasonable stage.
However, our study had some limitations. We failed to take the effects of water depth, temporal scale and ecosystem size into account. Offshore distance and water depth may influence the community composition and food webs (Giraldo et al., 2017; Wu et al., 2019; Cresson et al., 2020). Temporal scale is the main factor of community composition and biomass (Walters and Coen, 2006; Paxton et al., 2018; Cresson et al., 2019). Heymans et al. (2014) indicated that shallower systems had more flow to detritus and smaller systems usually had lower mean Ecotrophic Efficiencies. In this study, although with shorter constructed time, the NAOR ecosystem showed similar community composition and ecosystem structure with EAOR systems and artificial reefs reported in Feng et al. (2018) and Xu et al. (2019). The main difference between EAOR and NAOR ecosystem is the macroalgae influenced by depth. Further studies should focus on the detailed differences between these two ecosystems.
Besides, only 1 year of data was used in the modeling, resulting in static snapshots of the ecosystems. In the future, multi-year data should be used and dynamic simulations of the system should be performed. Then, the sampling and investigations were carried out only in artificial reef areas, and that the relationship with adjacent ecosystems and impacts of river inputs were not considered. Additionally, the artificial oyster reefs are still subject to severe anthropogenic impacts. More studies should focus on how these systems respond to external disturbances. Finally, additional models could be used, such as the Ecosim and Ecotroph modules, to help us better understand the ecosystems for better ecosystem-based management.
The raw data supporting the conclusions of this article will be made available by the authors, without undue reservation.
XW carried out the experiments, implemented the models and drafted the manuscript. JF and CL contributed to the design of the work and revised the manuscript. HL and YZ prepared materials and carried out the experiments. MC revised the manuscript. All authors contributed to the article and approved the final manuscript.
This work was supported by the National Key R&D Program of China (2019YFD0900800) and the National Natural Science Foundation of China (42030408).
YZ was employed by Tangshan Marine Ranching Co., Ltd.
The remaining authors declare that the research was conducted in the absence of any commercial or financial relationships that could be construed as a potential conflict of interest.
All claims expressed in this article are solely those of the authors and do not necessarily represent those of their affiliated organizations, or those of the publisher, the editors and the reviewers. Any product that may be evaluated in this article, or claim that may be made by its manufacturer, is not guaranteed or endorsed by the publisher.
The Supplementary Material for this article can be found online at: https://www.frontiersin.org/articles/10.3389/fmars.2022.829557/full#supplementary-material
Baine, M. (2001). Artificial reefs: A review of their design, application, management and performance. Ocean Coast. Manage 44, 241–259. doi: 10.1016/S0964-5691(01)00048-5
Beck, M. W., Brumbaugh, R. D., Airoldi, L., Carranza, A., Coen, L. D., Crawford, C., et al. (2011). Oyster reefs at risk and recommendations for conservation, restoration, and management. Bioscience 61, 107–116. doi: 10.1525/bio.2011.61.2.5
Blomberg, B. N., and Montagna, P. A. (2014). Meta-analysis of Ecopath models reveals secondary productivity patterns across the Gulf of Mexico. Ocean Coast. Manage 100, 32–40.
Blomberg, B. N., Lebreton, B., Palmer, T. A., Guillou, G., Beseres Pollack, J., and Montagna, P. A. (2017). Does reef structure affect oyster food resources? A stable isotope assessment. Mar. Environ. Res. 127, 32–40. doi: 10.1016/j.marenvres.2017.03.003
Borsje, B. W., Van Wesenbeeck, B. K., Dekker, F., Paalvast, P., Bouma, T. J., Van Katwijk, M. M., et al. (2011). How ecological engineering can serve in coastal protection. Ecol. Eng. 37, 113–122. doi: 10.1016/j.ecoleng.2010.11.027
Byron, C., Link, J., Costa-Pierce, B., and Bengtson, D. (2011). Calculating ecological carrying capacity of shellfish aquaculture using mass-balance modeling: Narragansett Bay, Rhode Island. Ecol. Model. 222, 1743–1755. doi: 10.1016/j.ecolmodel.2011.03.010
Calderon-Aguilera, L. E., Reyes-Bonilla, H., Olán-González, M., Castañeda-Rivero, F. R., and Perusquía-Ardón, J. C. (2021). Estimated flows and biomass in a no-take coral reef from the eastern tropical Pacific through network analysis. Ecol. Indic. 123:107359. doi: 10.1016/j.ecolind.2021.107359
Chen, Z., Xu, S., and Qiu, Y. (2015). Using a food-web model to assess the trophic structure and energy flows in Daya Bay, China. Cont. Shelf Res. 111, 316–326. doi: 10.1016/j.csr.2015.08.013
Chowdhury, M. S. N., La Peyre, M., Coen, L. D., Morris, R. L., Luckenbach, M. W., Ysebaert, T., et al. (2021). Ecological engineering with oysters enhances coastal resilience efforts. Ecol. Eng. 169:106320. doi: 10.1016/j.ecoleng.2021.106320
Christensen, V. (1995). Ecosystem maturity — towards quantification. Ecol. Model. 77, 3–32. doi: 10.1016/0304-3800(93)E0073-C
Christensen, V., Walters, C., and Pauly, D. (2005). Ecopath with Ecosim: A user’s guide. Vancouver: Fisheries Centre of University of British Columbia.
Christensen, V., and Walters, C. J. (2004). Ecopath with Ecosim: methods, capabilities and limitations. Ecol. Model. 172, 109–139. doi: 10.1016/j.ecolmodel.2003.09.003
Coen, L. D., Brumbaugh, R. D., Bushek, D., Grizzle, R., Luckenbach, M. W., Posey, M. H., et al. (2007). Ecosystem services related to oyster restoration. Mar. Ecol. Prog. Ser. 341, 303–307.
Cresson, P., Le Direach, L., Rouanet, E., Goberville, E., Astruch, P., Ourgaud, M., et al. (2019). Functional traits unravel temporal changes in fish biomass production on artificial reefs. Mar. Environ. Res. 145, 137–146. doi: 10.1016/j.marenvres.2019.02.018
Cresson, P., Ruitton, S., and Harmelin, M. (2014). Artificial reefs do increase secondary biomass production: Mechanisms evidenced by stable isotopes. Mar. Ecol. Prog. Ser. 509, 15–26. doi: 10.3354/meps10866
Cresson, P., Chouvelon, T., Bustamante, P., Bănaru, D., Baudrier, J., Le Loc’h, F., et al. (2020). Primary production and depth drive different trophic structure and functioning of fish assemblages in French marine ecosystems. Prog. Oceanogr. 186:102343. doi: 10.1016/j.pocean.2020.102343
Darwall, W. R. T., Allison, E. H., Turner, G. F., and Irvine, K. (2010). Lake of flies, or lake of fish? A trophic model of Lake Malawi. Ecol. Model. 221, 713–727. doi: 10.1016/j.ecolmodel.2009.11.001
Deng, J. Y., Jiang, W. M., Yang, J. M., and Li, J. (1997). Species interaction and food web of major predatory species in the Bohai Sea. J. Fish. Sci. China. 4, 2–8.
Essington, T. E., Beaudreau, A. H., and Wiedenmann, J. (2006). Fishing through marine food webs. Proc. Natl. Acad. Sci. USA 103:3171. doi: 10.1073/pnas.0510964103
Feng, J., Zhang, T., Li, H. Z., Jiang, H., Yang, H. S., Zhou, Y., et al. (2018). “Assessment of biocapacity and prediction of future biomass change in marine ranching area based on ecopath with ecosim model,” in The 3rd International Symposium on Modern Marine Ranching; 2018 Annual Conference of Fishery Resources and Environment Committee, (Chinese Fisheries Society), 104.
Finn, J. T. (1976). Measures of ecosystem structure and function derived from analysis of flows. J. Theor. Biol. 56, 363–380. doi: 10.1016/S0022-5193(76)80080-X
Gain, I. E., Brewton, R. A., Reese Robillard, M. M., Johnson, K. D., Smee, D. L., and Stunz, G. W. (2016). Macrofauna using intertidal oyster reef varies in relation to position within the estuarine habitat mosaic. Mar. Biol. 164:8. doi: 10.1007/s00227-016-3033-5
Gillies, C. L., Castine, S. A., Alleway, H. K., Crawford, C., Fitzsimons, J. A., Hancock, B., et al. (2020). Conservation status of the oyster reef ecosystem of southern and eastern Australia. Glob. Ecol. Conserv. 22:e00988. doi: 10.1016/j.gecco.2020.e00988
Giraldo, C., Ernande, B., Cresson, P., Kopp, D., Cachera, M., Travers-Trolet, M., et al. (2017). Depth gradient in the resource use of a fish community from a semi-enclosed sea. Limnol. Oceanogr. 62, 2213–2226. doi: 10.1002/lno.10561
Gutiérrez, J., Jones, C., Strayer, D., and Iribarne, O. (2003). Mollusks as ecosystem engineers: The role of shell production in aquatic habitats. Oikos 101, 79–90. doi: 10.1034/j.1600-0706.2003.12322.x
Heymans, J., Coll, M., Libralato, S., and Christensen, V. (2011). “Ecopath theory, modeling, and application to coastal ecosystems,” in Treatise on estuarine and coastal science, eds E. Wolanski and D. Mclusky (Oxford: Elsevier), 93–113.
Heymans, J., Coll, M., Libralato, S., Morissette, L., and Christensen, V. (2014). Global patterns in ecological indicators of marine food webs: A modelling approach. PLoS One 9:e95845. doi: 10.1371/journal.pone.0095845
Heymans, J. J., Coll, M., Link, J. S., Mackinson, S., Steenbeek, J., Walters, C., et al. (2016). Best practice in ecopath with ecosim food-web models for ecosystem-based management. Ecol. Model. 331, 173–184. doi: 10.1016/j.ecolmodel.2015.12.007
Heymans, J. J., and Tomczak, M. T. (2016). Regime shifts in the Northern Benguela ecosystem: Challenges for management. Ecol. Model. 331, 151–159. doi: 10.1016/j.ecolmodel.2015.10.027
Hoellein, T. J., Zarnoch, C. B., and Grizzle, R. E. (2015). Eastern oyster (Crassostrea virginica) filtration, biodeposition, and sediment nitrogen cycling at two oyster reefs with contrasting water quality in Great Bay Estuary (New Hampshire, USA). Biogeochemistry 122, 113–129. doi: 10.1007/s10533-014-0034-7
Jiang, W., and Gibbs, M. T. (2005). Predicting the carrying capacity of bivalve shellfish culture using a steady, linear food web model. Aquaculture 244, 171–185. doi: 10.1016/j.aquaculture.2004.11.050
Jin, X., Shan, X., Li, X., Wang, J., Cui, Y., and Zuo, T. (2013). Long-term changes in the fishery ecosystem structure of Laizhou Bay. China. Sci. China Earth Sci. 56, 366–374. doi: 10.1007/s11430-012-4528-7
Jin, X. S., and Deng, J. Y. (2000). Variations in community structure of fishery resources and biodiversity in the Laizhou Bay. China. Biodivers. Sci. 11, 65–72. doi: 10.17520/biods.2000009
Ju, P., Cheung, W. W. L., Chen, M., Xian, W., Yang, S., and Xiao, J. (2020). Comparing marine ecosystems of Laizhou and Haizhou Bays, China, using ecological indicators estimated from food web models. J. Mar. Syst. 202:103238. doi: 10.1016/j.jmarsys.2019.103238
Kirby, M. (2004). Fishing down the coast: Historical expansion and collapse of oyster fisheries along continental margins. Proc. Natl. Acad. Sci. USA 101, 13096–13099. doi: 10.1073/pnas.0405150101
Kluger, L. C., Taylor, M. H., Mendo, J., Tam, J., and Wolff, M. (2016). Carrying capacity simulations as a tool for ecosystem-based management of a scallop aquaculture system. Ecol. Model. 331, 44–55. doi: 10.1016/j.ecolmodel.2015.09.002
Krumhansl, K. A., and Scheibling, R. E. (2012). Production and fate of kelp detritus. Mar. Ecol. Prog. Ser. 467, 281–302. doi: 10.3354/meps09940
Langlois, T. J., Anderson, M. J., and Babcock, R. C. (2006). Inconsistent effects of reefs on different size classes of macrofauna in adjacent sand habitats. J. Exp. Mar. Biol. Ecol. 334, 269–282. doi: 10.1016/j.jembe.2006.02.001
La Peyre, M., Furlong, J., Brown, L. A., Piazza, B. P., and Brown, K. (2014). Oyster reef restoration in the northern Gulf of Mexico: Extent, methods and outcomes. Ocean Coast. Manage. 89, 20–28. doi: 10.1016/j.ocecoaman.2013.12.002
Latham, L. G. (2006). Network flow analysis algorithms. Ecol. Model. 192, 586–600. doi: 10.1016/j.ecolmodel.2005.07.029
Layman, C., and Allgeier, J. (2020). An ecosystem ecology perspective on artificial reef production. J. Appl. Ecol. 57:13748. doi: 10.1111/1365-2664.13748
Lee, M. O., Otake, S., and Kim, J. K. (2018). Transition of artificial reefs (ARs) research and its prospects. Ocean Coast. Manage. 154, 55–65. doi: 10.1016/j.ocecoaman.2018.01.010
Lee, S. I., and Zhang, C. I. (2018). Evaluation of the effect of marine ranching activities on the Tongyeong marine ecosystem. Ocean Sci. J. 53, 557–582. doi: 10.1007/s12601-018-0045-8
Li, X., Yang, W., Li, S., Sun, T., Bai, J., Pei, J., et al. (2020). Asymmetric responses of spatial variation of different communities to a salinity gradient in coastal wetlands. Mar. Environ. Res. 158:105008. doi: 10.1016/j.marenvres.2020.105008
Li, X., Yang, W., Sun, T., and Gaedke, U. (2021). Quantitative food web structure and ecosystem functions in a warm-temperate seagrass bed. Mar. Biol. 168:74.
Libralato, S. (2013). “System omnivory index,” in Encyclopedia of ecology, eds S. E. Jørgensen and B. D. Fath (Oxford: Elsevier), 481–486. doi: 10.1007/s00227-021-03878-z
Libralato, S., Christensen, V., and Pauly, D. (2006). A method for identifying keystone species in food web models. Ecol. Model. 195, 153–171. doi: 10.1016/j.ecolmodel.2005.11.029
Lin, Q., Jin, X. S., Zhang, B., and Guo, X. (2009). Comparative study on the changes of the Bohai Sea ecosystem structure based on Ecopath model between ten years. Acta Ecol. Sin. 07, 3613–3620.
Lin, Q., Jin, X. S., and Zhang, B. (2013). Trophic interactions, ecosystem structure and function in the southern Yellow Sea. Chin. J. Oceanol. Limnol. 31:6. doi: 10.1007/s00343-013-2013-6
Link, J. S. (2010). Adding rigor to ecological network models by evaluating a set of pre-balance diagnostics: A plea for PREBAL. Ecol. Model. 221, 1580–1591. doi: 10.1016/j.ecolmodel.2010.03.012
Liu, H. Y., Yang, C. J., Zhang, P. D., Li, W. T., and Zhang, X. M. (2019). An Ecopath evaluation of system structure and function for the Laoshan Bay artificial reef zone ecosystem. J. Ocean Univ. China 39, 168–177.
Liu, Z., Yu, P., Chen, M., Cai, M., Fan, B., Lv, W., et al. (2018). Macrobenthic community characteristics and ecological health of a constructed intertidal oyster reef in the Yangtze Estuary, China. Mar. Pollut. Bull. 135, 95–104. doi: 10.1016/j.marpolbul.2018.07.019
Lozano-Montes, H., Loneragan, N., Babcock, R., and Jackson, K. (2011). Using trophic flows and ecosystem structure to model the effects of fishing in the Jurien Bay marine park, temperate western Australia. Mar. Freshwat. Res. 62, 421–431. doi: 10.1071/MF09154
Lv, X., Wang, X., Wu, Y., Jiang, W., Fang, J., Fang, J., et al. (2018). Effect of temperature on the energy budget of Arcuatula senhousei. Prog. Oceanogr. 39, 119–125. doi: 10.19663/j.issn2095-9869.20170420002
Maar, M., Bolding, K., Petersen, J. K., Hansen, J. L. S., and Timmermann, K. (2009). Local effects of blue mussels around turbine foundations in an ecosystem model of nysted off-shore wind farm, Denmark. J. Sea Res. 62, 159–174. doi: 10.1016/j.seares.2009.01.008
Mcafee, D., Mcleod, I. M., Boström-Einarsson, L., and Gillies, C. L. (2020). The value and opportunity of restoring Australia’s lost rock oyster reefs. Restor. Ecol. 28, 304–314. doi: 10.1111/rec.13125
Mcqueen, D., Post, J., and Mills, E. (2011). Trophic relationships in freshwater pelagic ecosystems. Can. J. Fish. Aquat. Sci. 43, 1571–1581. doi: 10.1139/f86-195
Miller, W., Reynolds, A., Sobrino, C., and Riedel, G. (2009). Shellfish face uncertain future in high CO2 world: Influence of acidification on oyster larvae calcification and growth in estuaries. PLoS One 4:e5661. doi: 10.1371/journal.pone.0005661
Monaco, M. E., and Ulanowicz, R. E. (1997). Comparative ecosystem trophic structure of three U.S. Mid-Atlantic estuaries. Mar. Ecol. Prog. Ser. 161, 239–254. doi: 10.3354/meps161239
Morales-Zárate, M. V., ArreguìN-Sánchez, F., López-MartìNez, J., and Lluch-Cota, S. E. (2004). Ecosystem trophic structure and energy flux in the Northern Gulf of California, México. Ecol. Model. 174, 331–345.
Morissette, L. (2007). Complexity, cost and quality of ecosystem models and their impact on resilience : A comparative analysis, with emphasis on marine mammals and the Gulf of St. Lawrence. (Doctoral thesis). Vancouver: University of British Columbia, doi: 10.14288/1.0074903
Newell, R. I. E. (2004). Ecosystem influences of natural and cultivated populations of suspension-feeding bivalve molluscs: A review. J. Shellfish Res. 23, 51–61.
Norling, P., and Kautsky, N. (2007). Structural and functional effects of Mytilus edulis on diversity of associated species and ecosystem functioning. Mar. Ecol. Prog. Ser. 351, 163–175. doi: 10.3354/meps07033
Odum, E. P. (1969). The strategy of ecosystem development. Science 164, 262–270. doi: 10.1126/science.164.3877.262
Okey, T. A., Banks, S., Born, A. F., Bustamante, R. H., Calvopiña, M., Edgar, G. J., et al. (2004). A trophic model of a Galápagos subtidal rocky reef for evaluating fisheries and conservation strategies. Ecol. Model. 172, 383–401. doi: 10.1016/j.ecolmodel.2003.09.019
Ortiz, M., Berrios, F., Campos, L., Uribe, R., Ramirez, A., Hermosillo-Núñez, B., et al. (2015). Mass balanced trophic models and short-term dynamical simulations for benthic ecological systems of Mejillones and Antofagasta bays (SE Pacific): Comparative network structure and assessment of human impacts. Ecol. Model. 309-310, 153–162. doi: 10.1016/j.ecolmodel.2015.04.006
Ouyang, L. J., and Guo, X. W. (2010). Studies on the Q/B values and food consumption of major fishes in the East China Sea and the Yellow Sea. Prog. Oceanogr. 31, 23–29.
Parsons, T. R., Maita, Y., and Lalli, C. M. (1984). “Determination of chlorophylls and total carotenoids: Spectrophotometric method,” in A manual of chemical & biological methods for seawater analysis, eds T. R. Parsons, Y. Maita, and C. M. Lalli (Pergamon: Amsterdam), 101–104. doi: 10.1016/b978-0-08-030287-4.50032-3
Pauly, D., and Christensen, V. (1995). Primary production required to sustain global fisheries. Nature 374, 255–257. doi: 10.1038/374255a0
Pauly, D., Christensen, V. V., Dalsgaard, J., Froese, R., and Torres, F. Jr. (1998). Fishing down marine food webs. Science 279, 860–863. doi: 10.1126/science.279.5352.860
Paxton, A. B., Revels, L. W., Rosemond, R. C., Van Hoeck, R. V., Lemoine, H. R., Taylor, J. C., et al. (2018). Convergence of fish community structure between a newly deployed and an established artificial reef along a five-month trajectory. Ecol. Eng. 123, 185–192. doi: 10.1016/j.ecoleng.2018.09.012
Pérez-España, H., and ArreguìN-Sánchez, F. (2001). An inverse relationship between stability and maturity in models of aquatic ecosystems. Ecol. Model. 145, 189–196. doi: 10.1016/S0304-3800(01)00390-8
Pezy, J.-P., Raoux, A., Marmin, S., Balay, P., Niquil, N., and Dauvin, J.-C. (2017). Before-after analysis of the trophic network of an experimental dumping site in the eastern part of the Bay of Seine (English Channel). Mar. Pollut. Bull. 118, 101–111. doi: 10.1016/j.marpolbul.2017.02.042
Piazza, B. P., Banks, P. D., and La Peyre, M. K. (2005). The potential for created oyster shell reefs as a sustainable shoreline protection strategy in Louisiana. Restor. Ecol. 13, 499–506. doi: 10.1111/j.1526-100X.2005.00062.x
Pinkerton, M. H., Lundquist, C. J., Duffy, C. A. J., and Freeman, D. J. (2008). Trophic modelling of a New Zealand rocky reef ecosystem using simultaneous adjustment of diet, biomass and energetic parameters. J. Exp. Mar. Biol. Ecol. 367, 189–203. doi: 10.1016/j.jembe.2008.09.022
Pogoda, B. (2019). Current status of european oyster decline and restoration in Germany. Humanities 8:9. doi: 10.3390/h8010009
Polovina, J. J. (1984). Model of a coral reef ecosystem. Coral Reefs 3, 1–11. doi: 10.1007/BF00306135
Power, M. E., Tilman, D., Estes, J. A., Menge, B. A., Bond, W. J., Mills, L. S., et al. (1996). Challenges in the quest for keystones: Identifying keystone species is difficult—but essential to understanding how loss of species will affect ecosystems. Bioscience 46, 609–620. doi: 10.2307/1312990
Powers, S. P., Peterson, C., Grabowski, J., and Lenihan, H. S. (2009). Success of constructed oyster reefs in no-harvest sanctuaries: Implications for restoration. Mar. Ecol. Prog. Ser. 389, 159–170. doi: 10.3354/meps08164
Quan, W. M., Feng, M., Zhou, Z., Wu, Z., Tang, F., Wang, Y., et al. (2017). Ecological assessment of the oyster Crassostrea sikamea population and associated benthic communities on restored oyster reefs along Jiangsu Province coast, China. Acta Ecol. Sin. 37, 1709–1718. doi: 10.5846/stxb201510102049
Rahman, M. F., Qun, L., Xiujuan, S., Chen, Y., Ding, X., and Liu, Q. (2019). Temporal changes of structure and functioning of the Bohai Sea ecosystem: Insights from ecopath models. Thalassas 35, 625–641. doi: 10.1007/s41208-019-00139-1
Raoux, A., Noémie, B., Pezy, J.-P., Balay, P., Lesourd, S., and Dauvin, J.-C. (2020). Evaluating ecosystem functioning of a long-term dumping site in the Bay of Seine (English Channel). Ecol. Indic. 115:106381. doi: 10.1016/j.ecolind.2020.106381
Raoux, A., Tecchio, S., Pezy, J.-P., Lassalle, G., Degraer, S., Wilhelmsson, D., et al. (2017). Benthic and fish aggregation inside an offshore wind farm: Which effects on the trophic web functioning? Ecol. Indic. 72, 33–46. doi: 10.1016/j.ecolind.2016.07.037
Rodriguez-Perez, A., James, M., Donnan, D. W., Henry, T. B., Møller, L. F., and Sanderson, W. G. (2019). Conservation and restoration of a keystone species: Understanding the settlement preferences of the European oyster (Ostrea edulis). Mar. Pollut. Bull. 138, 312–321. doi: 10.1016/j.marpolbul.2018.11.032
Ryther, J. H. (1969). Photosynthesis and fish production in the sea. Science 166, 72–76. doi: 10.1126/science.166.3901.72
Samonte, G., Ihde, T., and Lipton, D. (2020). Estimating Ecological Benefits and Socio-Economic Impacts from Oyster Reef Restoration in the Choptank River Complex. Chesapeake Bay: Morgan State University.
Sun, Y., and Zhang, Z. (2018). Background environmental data analysis report of Xiangyun bay Marine Ranching and surrounding sea area in Tangshan city. Qingdao: First Institute of Oceanography, Ministry of Natural Resources.
Tang, Q., Guo, X., Sun, Y., and Zhang, B. (2007). Ecological conversion efficiency and its influencers in twelve species of fish in the Yellow Sea ecosystem. J. Mar. Syst. 67, 282–291. doi: 10.1016/j.jmarsys.2006.04.013
Theuerkauf, S. J., Burke, R. P., and Lipcius, R. N. (2014). Settlement, growth and survival of eastern oysters on alternative reef substrates. bioRxiv 2014:010793. doi: 10.1101/010793
Tumbiolo, M. L., and Downing, J. A. (1994). An empirical model for the prediction of secondary production in marine benthic invertebrate populations. Mar. Ecol. Prog. Ser. 114, 165–174. doi: 10.3354/meps114165
Ulanowicz, R. E. (1986). Growth and development: Ecosystems phenomenology. New York, NY: Springer-Verlag.
Valls, A., Coll, M., and Christensen, V. (2015). Keystone species: toward an operational concept for marine biodiversity conservation. Ecol. Monogr. 85, 29–47. doi: 10.1890/14-0306.1
Vander Zanden, J., Chandra, S., Park, S., Vadeboncoeur, Y., and Goldman, C. (2006). Efficiencies of benthic and pelagic trophic pathways in a subalpine lake. Can. J. Fish. Aquat. Sci. 63, 2608–2620. doi: 10.1139/F06-148
Walles, B., Troost, K., Ende, D., Nieuwhof, S., Smaal, A. C., and Ysebaert, T. (2016). From artificial structures to self-sustaining oyster reefs. J. Sea Res. 108, 1–9. doi: 10.1016/j.seares.2015.11.007
Walters, K., and Coen, L. (2006). A comparison of statistical approaches to analyzing community convergence between natural and constructed oyster reefs. J. Exp. Mar. Biol. Ecol. 330, 81–95. doi: 10.1016/j.jembe.2005.12.018
Wei, S., and Jiang, W. M. (1992). Study on food web of fishes in the Yellow Sea. Oceanol. Limnol. Sin. 23, 182–192.
Wilhelmsson, D., Malm, T., and Öhman, M. C. (2006). The influence of offshore windpower on demersal fish. ICES J. Mar. Sci. 63, 775–784. doi: 10.1016/j.icesjms.2006.02.001
Wu, Z., Tweedley, J. R., Loneragan, N. R., and Zhang, X. (2019). Artificial reefs can mimic natural habitats for fish and macroinvertebrates in temperate coastal waters of the Yellow Sea. Ecol. Eng. 139:105579. doi: 10.1016/j.ecoleng.2019.08.009
Wu, Z., Zhang, X., Lozano-Montes, H. M., and Loneragan, N. R. (2016). Trophic flows, kelp culture and fisheries in the marine ecosystem of an artificial reef zone in the Yellow Sea. Estuar. Coast. Shelf Sci. 182, 86–97. doi: 10.1016/j.ecss.2016.08.021
Wu, Z. X., Zhang, X. M., Zhang, L., Tong, F., and Liu, H. J. (2013). Predicting the ecological carrying of the lidao artificial reef zone of Shandong Province for the sea cucumber, Apostichopus japonicus, (Selenck) and the abalone, Haliotis discus hannai, using a linear food web model. J. Fish. Sci. China. 20, 327–337. doi: 10.3724/sp.j.1118.2013.00327
Xu, M., Qi, L., Zhang, L., Zhang, T., Yang, H., and Zhang, Y. (2019). Ecosystem attributes of trophic models before and after construction of artificial oyster reefs using ecopath. Aquac. Environ. Interact. 11, 111–127. doi: 10.3354/aei00284
Xu, M., Yang, X. Y., Song, X. J., Xu, K. D., and Yang, L. L. (2020). Seasonal analysis of artificial oyster reef ecosystems: Implications for sustainable fisheries management. Aquacult. Int. 29, 167–192. doi: 10.1007/s10499-020-00617-x
Xu, Y., and Ma, S. (2009). Effects of different diets on the growth and bioenergetics of swimming crab Portunus trituberculatus. J. Ocean Univ. China 39, 353–358. doi: 10.16441/j.cnki.hdxb.2009.s1.064
Xu, Z. X., Chen, Y., Tian, T., Liu, Y. H., Yin, Z. Q., and Liu, H. C. (2016). Structure and function of an artificial reef ecosystem in Zhangzi island based on ecopath model. J. Dalian Ocean. Univ. 31, 85–94. doi: 10.16535/j.cnki.dlhyxb.2016.01.015
Yang, H. S. (2018). Monitoring and biocapacity evaluation of marine ranch ecosystem. Beijing: Sciences Press.
Yang, H. S., Xu, S., Lin, C. G., Sun, J. C., and Zhang, L. B. (2020). Research progress and prospects of restoration and resource conservation in typical sea areas. Oceanol. Limnol. Sin. 51, 809–820.
Yang, J. M. (2001a). A study on food and trophic levels of Bohai Sea fish. Mod. Fish. Inform. 16, 10–19.
Yang, J. M. (2001b). A study on food and trophic levels of Bohai Sea invertebrates. Mod. Fish. Inform. 16, 8–16.
Yang, X. Y. (2019). The community characteristics and ecological functions of artificial oyster reef at Xiangyun Bay marine ranching. (Master’s thesis). Qingdao: University of Chinese Academy of Sciences.
Yue, J., Zhang, B. H., Han, F., Zhao, X. T., Liu, D. Y., Duan, H. C., et al. (2012). Several oyster barrier reefs in the northernwest coast of Bohai Sea. Acta Geogr. Sin. 86, 1175–1187.
Zhang, B. (2018). Feeding ecology of fishes in the Bohai Sea. Prog. Oceanogr. 39, 11–22. doi: 10.19663/j.issn2095-9869.20171103001
Zhang, J., Fang, J., and Wang, S. (2008). Carryiny capacity for Patinopecten yessoensis in Zhang Zidao Island. China. J. Fish. China. 02, 236–241.
Zhang, R. L. (2021). The comparative study of the food web structure and function between the artificial and natural reef s in the nearshore. (Doctoral thesis). Yantai: University of Chinese Academy of Sciences.
Zhu, W., Sun, Y., Zhao, H., Yu, M., Guo, J., and Li, D. (2016). Effects of different diets on growth of shot arm octopus Octopus ocellatus. Fish. Sci. 35, 573–577. doi: 10.16378/j.cnki.1003-1111.2016.05.020
Keywords: artificial oyster reefs, Ecopath model, ecological network analysis, comparative analysis, coastal ecological restoration, Bohai Sea
Citation: Wang X, Feng J, Lin C, Liu H, Chen M and Zhang Y (2022) Structural and Functional Improvements of Coastal Ecosystem Based on Artificial Oyster Reef Construction in the Bohai Sea, China. Front. Mar. Sci. 9:829557. doi: 10.3389/fmars.2022.829557
Received: 06 December 2021; Accepted: 07 February 2022;
Published: 16 March 2022.
Edited by:
Victoria Louise Georgia Todd, Ocean Science Consulting Ltd., United KingdomReviewed by:
Ashley M. Fowler, New South Wales Department of Primary Industries Fisheries, AustraliaCopyright © 2022 Wang, Feng, Lin, Liu, Chen and Zhang. This is an open-access article distributed under the terms of the Creative Commons Attribution License (CC BY). The use, distribution or reproduction in other forums is permitted, provided the original author(s) and the copyright owner(s) are credited and that the original publication in this journal is cited, in accordance with accepted academic practice. No use, distribution or reproduction is permitted which does not comply with these terms.
*Correspondence: Chenggang Lin, TGluY2hlbmdnYW5nQHFkaW8uYWMuY24=
Disclaimer: All claims expressed in this article are solely those of the authors and do not necessarily represent those of their affiliated organizations, or those of the publisher, the editors and the reviewers. Any product that may be evaluated in this article or claim that may be made by its manufacturer is not guaranteed or endorsed by the publisher.
Research integrity at Frontiers
Learn more about the work of our research integrity team to safeguard the quality of each article we publish.