
94% of researchers rate our articles as excellent or good
Learn more about the work of our research integrity team to safeguard the quality of each article we publish.
Find out more
ORIGINAL RESEARCH article
Front. Mar. Sci. , 04 March 2022
Sec. Physical Oceanography
Volume 9 - 2022 | https://doi.org/10.3389/fmars.2022.825973
This article is part of the Research Topic Physics and Biogeochemistry of the East Asian Marginal Seas View all 30 articles
 Junghee Yun1,2
 Kyung-Ja Ha1,2,3*
The Yellow Sea is the most fog-prone region of the East Asian marginal seas. Since sea fog is caused due to complex interactions between atmospheric and oceanic environments, direct observations can help understand the physical processes involved in fogging over the oceans. Completed in 2014, the Socheongcho Ocean Research Station (S-ORS) plays a critical role in monitoring air-sea interactions over the Yellow Sea. This study aimed to evaluate the conditions favorable for fog generation and the physical processes underlying it using a suite of observations and turbulent heat flux data from S-ORS. First, we used the visibility data from S-ORS to quantify the frequency of sea fog over the Yellow Sea. From April to June 2016, sea-fog occurred 61 times, with a maximum duration of 135 h (approximately 5.6 days). Next, to understand the origin and characteristics of air mass associated with fog events, we classified the primary airflow paths in the region using a Hybrid Single-Particle Lagrangian Integrated Trajectory model. Among the four clusters identified from the cluster analysis, the third and fourth had distinct physical properties characteristic of cold and warm fog, respectively. The third cluster was characterized by relatively weak or negative heat advection and weak vertical mixing, while the fourth one featured strong positive heat transport and moisture convergence over the Yellow Sea. Finally, based on cluster analysis, we choose the representative cases related to these two clusters observed at S-ORS and compared the characteristics of turbulent air-sea fluxes associated with fog formations.
The Yellow Sea is a semi-enclosed marginal sea of the northwestern Pacific Ocean surrounded by the Korean Peninsula to the east and the Chinese mainland to the west and is recognized for its strong ocean-atmosphere interactions (Xie et al., 2002; Subrahamanyam et al., 2007, 2009; Kim et al., 2018; Sim et al., 2018; Yang et al., 2019). As a shallow basin with small bathymetric gradients, the Yellow Sea significantly contributes to the transfer of heat, moisture, and momentum owing to warm sea surface temperatures (Naimie et al., 2001; Chu et al., 2005; Ma et al., 2006; Belkin, 2009; Park et al., 2015), by controlling the oceanic conditions and modifying the properties of air masses passing over the ocean (Heo and Ha, 2010; Heo et al., 2010, 2012; Kim et al., 2017; Yun et al., 2018; Pak et al., 2019). Therefore, the air-sea exchange over the Yellow Sea plays a pivotal role in the weather and climate systems of the Korean Peninsula and the surrounding regions.
To better understand the underlying processes driving air-sea interactions, direct and accurate quantification of the turbulent fluxes over the ocean surface are needed (Garratt, 1992; Paw et al., 2000; Ha et al., 2007; Oh et al., 2010, 2011; Yun et al., 2015; Katz and Zhu, 2017). Despite the importance of extensive observational data, most experiments on air-sea interactions are usually limited to short durations and require buoys that are located too close to land, deeming them unsuitable to accurately and explicitly explain oceanic characteristics (Yelland et al., 2009). Thus, fluxes over the seas need to be continuously measured for longer than a few months to understand the variation over time and explore trends and extreme events. There are three main observatories based in the Yellow Sea: Ieodo Ocean Research Station (I-ORS), installed in 2003; Gageocho Ocean Research Station (G-ORS), established in 2009; Socheongcho Ocean Research Station (S-ORS) completed in 2014. The northernmost of these stations, S-ORS performs direct, long-term measurements of turbulent fluxes, which facilitates studies on regional air-sea interactions.
Previous studies have sought to understand the physical processes that characterize sea fog formation in the Yellow Sea (Zhang et al., 2009, 2012; Heo et al., 2010; Li et al., 2012; Wang and Chen, 2014; Huang et al., 2015, 2018; Ye et al., 2015; Yang et al., 2018; Lee et al., 2021). Zhang et al. (2009) investigated the seasonal cycle of sea fog over the Yellow Sea using ocean buoy data. Zhang et al. (2012) examined the different mechanisms between spring and summer sea fogs based on observations and model simulations. Li et al. (2012) showed that the turbulent mixing triggered by the wind shear developed by the low-level jets could help enhance sea fog vertically. Kim et al. (2021), which experimented with the cooling effect of sea surface temperature on sea fog formation after a typhoon passed through the Yellow Sea, found that the typhoon-induced sea surface cooling cooled the air temperature at the low-level atmosphere and enhanced the horizontal moisture flux convergence over the cool ocean. Those conditions contributed to the formation of widespread sea fog over the Yellow Sea. These studies show that sea fog events in the Yellow Sea are accompanied by complex physical processes. However, it is still uncertain what atmospheric and oceanic conditions drive fog formation, development, persistence, and dissipation and how air-sea interactions influence fog stimulating processes. The objective of this study is twofold: (1) to determine favorable conditions for fog generation and (2) to understand fog physical processes using a suite of observational and turbulent heat flux data from S-ORS. Section “Materials and Methods” describes the study site and S-ORS data, additional data, and methods. Section “Results” reports atmospheric and oceanic conditions at the air-sea interface; describes the sea fog events observed at S-ORS, including air-sea interactions and major airflow paths associated with fog events using an air trajectory model; and investigates two sea fog case studies. Finally, section “Conclusions and Discussion” presents the conclusions and discussion.
We used a suite of observations from S-ORS, two reanalysis datasets from April to June 2016, and a Hybrid Single-Particle Lagrangian Integrated Trajectory (HYSPLIT) model from the National Oceanic and Atmospheric Administration (NOAA) (Stein et al., 2015; Rolph et al., 2017) to categorize primary airflow paths.
S-ORS, the third ocean research station constructed by the Korea Institute of Ocean Science and Technology (KIOST) in 2014, lies in the central Yellow Sea approximately 50 km away from the western coast of the Korean Peninsula (37°25′23.28″N, 124°44′16.94″E). This station was constructed to keep track of the oceanic and atmospheric environments of the Yellow Sea (Ha et al., 2019; Kim et al., 2019). This monitoring platform is equipped with dozens of oceanic, meteorological, and environmental sensors. They include infrared radiation thermometer (KT19.85, Heitronics, Germany), CT (CT3919, AANDERAA, Norway), CTD (RBR Concerto, RBR, Canada), CTD (SBE37 and SEB19plus, respectively, Sea-Bird Scientific), wind monitor (05106, R.M. Young, United States), ultrasonic wind sensor (VENTUS, Lufft, United States), thermo-hygrometer, digital barometer and visibility meter (HMP155, PTB210B, and PWD-21, respectively, Vaisala, Finland), pyranometer (CMP21, Kipp and Zonen, Netherlands), and 3-D sonic anemometer and open-path CO2/H2O gas analyzer (CSAT3 and EC150, respectively, Campbell Scientific, United States) (see Kim et al., 2019 for detailed information of S-ORS on essential observation instruments, variables, and the installation height). It also has two sets of the open-path eddy-covariance system consisting of a 3-D sonic anemometer and an open-path CO2/H2O gas analyzer on the northeastern and southwestern sides of the platform at 18 m above the sea surface for the direct measurement of turbulent fluxes (Figure 1). Those two systems sampled three-dimensional wind components, air pressure, air temperature, and absolute carbon dioxide and water vapor densities at 20 Hz, and then processed to turbulent fluxes, such as latent heat flux, sensible heat flux, momentum flux, friction velocity, and carbon dioxide flux at 30 min intervals using a data logger (CR3000, Campbell Scientific, United States). To cleanse the erratic signals from the original turbulent fluxes, we post-processed them by checking absolute limits and de-spiking in a similar fashion to the method of Oh et al. (2010, 2011). During the analysis period from April to June 2016, the coverage of turbulent fluxes was 59.6% (61.3%) for latent heat flux, 63.9% (62.1%) for sensible heat flux, and 43.2% (51.6%) for friction velocity at the northeastern (southwestern) direction. In order to explore temporal variations of turbulent fluxes during foggy days, we also calculated the fluxes using the Coupled Ocean-Atmosphere Response Experiment (COARE) 3.5 bulk air-sea flux algorithm (Edson et al., 2013). All data from S-ORS were averaged hourly.

Figure 1. Socheongcho Ocean Research Station (S-ORS) over the Yellow Sea. The meteorological tower at S-ORS includes the following instruments: wind monitor, ultrasonic wind sensor, thermo-hygrometer, barometer, visibility meter, and pyranometer. Flux and CO2/H2O gas analyzers are mounted on the 2 m long boom on the northeastern and southwestern sides of the platform at 18 m above sea level.
This study used two reanalysis datasets for the period from April to June 2016 to understand the atmospheric circulation patterns and air-sea interaction processes. A slew of atmospheric and oceanic variables from the European Centre for Medium-Range Weather Forecasts Re-analysis 5 (ERA5) dataset (Hersbach et al., 2020), including geopotential height, air temperature, specific humidity, and wind, at a horizontal resolution of 0.25°× 0.25°, with 37 pressure levels from 1,000 to 1 hPa, and 2 m temperature, sea surface temperature, mean surface heat fluxes, and vertically integrated moisture divergence on single levels, were employed. Also, 2 m temperature, sea surface temperature, and latent and sensible heat fluxes from the National Centers for Environmental Prediction Global Data Assimilation System/Final Global Surface Flux Grids (NCEP/FNL) dataset (National Centers for Environmental Prediction/National Weather Service/NOAA/U.S. Department of Commerce, 2015) on a T574 Gaussian global grid with a temporal resolution of 6 h (observed at 00, 06, 12, and 18 UTC) were also adopted.
We explored the difference between direct observation data and reanalysis data. First, the direct observation data from SORS is highly correlated with the ERA5 and NCEP/FNL datasets. The Spearman’s correlation coefficients between the directly observed and reanalyzed air temperature, water temperature, humidity, and wind speed are 0.95, 0.94, 0.92, and 0.65 for ERA5 and 0.95, 0.91, 0.93, and 0.6 for NCEP/FNL at S-ORS. They are all significant at the 99% confidence level. Also, the air temperature, water temperature, humidity, wind speed, and wind direction from S-ORS are mainly overestimated compared to those from ERA5 and NCEP/FNL datasets (not shown).
We employed PySPLIT, a python package for the HYSPLIT model from the NOAA (Cross, 2015; Warner, 2018), to understand the origin and pathway of the air masses that brought about fog events recorded at S-ORS. The air mass 24 h backward trajectory was generated four times (at 00, 06, 12, and 18 UTC) at initial back-trajectory heights being 500 m above ground level for fog events, defined as having 6 h-averaged visibility at S-ORS less than 1 km, using the Global Data Assimilation System (GDAS) reanalysis dataset at a horizontal resolution of 1°× 1°.
Sea-fog occurs more commonly in the Yellow Sea than in other China Seas (Zhang et al., 2009; Heo et al., 2014). Many studies have demonstrated the seasonal variations in its frequency, reporting more frequent occurrences from April to July (Zhang et al., 2009, 2011; Heo et al., 2014). To evaluate the atmospheric and oceanic conditions that influence fog formation at the air-sea interface from April to June 2016, we examined the mean geopotential height and wind vectors at 1,000 and 925 hPa, air-sea temperature difference, and the vertical distribution of air temperature and specific humidity in the lower troposphere (Figure 2). The air-sea temperature difference is estimated by subtracting the 2 m air temperature from the sea surface temperature. Climatologically, the Yellow and East China Seas are influenced by an anticyclonic circulation at 1,000 hPa (Figure 2A), which is generally induced by the land-sea thermal contrast (Zhang et al., 2009, 2011). Due to the anticyclonic circulation, the southeasterly (southwesterly) prevails over the southern (northern) Yellow Sea, resulting in surface air temperature higher than sea surface temperature (Figure 2C) and the transport of warm and humid air from the East China Sea (Figure 2D). Along the longitude of 124.5°E over the Yellow Sea (35°–40°N), the high specific humidity is present near the sea surface, with an overlying dry layer (Figure 2D). However, the anticyclonic circulation does not exist at 925 hPa, where the westerly wind passes from the Chinese mainland to the central Yellow Sea (Figure 2B). The low-level westerlies from the continent, related to the advection of the warm and dry air, create a temperature inversion over the Yellow Sea under the cooler and wetter near-surface atmospheric conditions, extending from 1,000 to 950 hPa near S-ORS (Figures 2B,D).
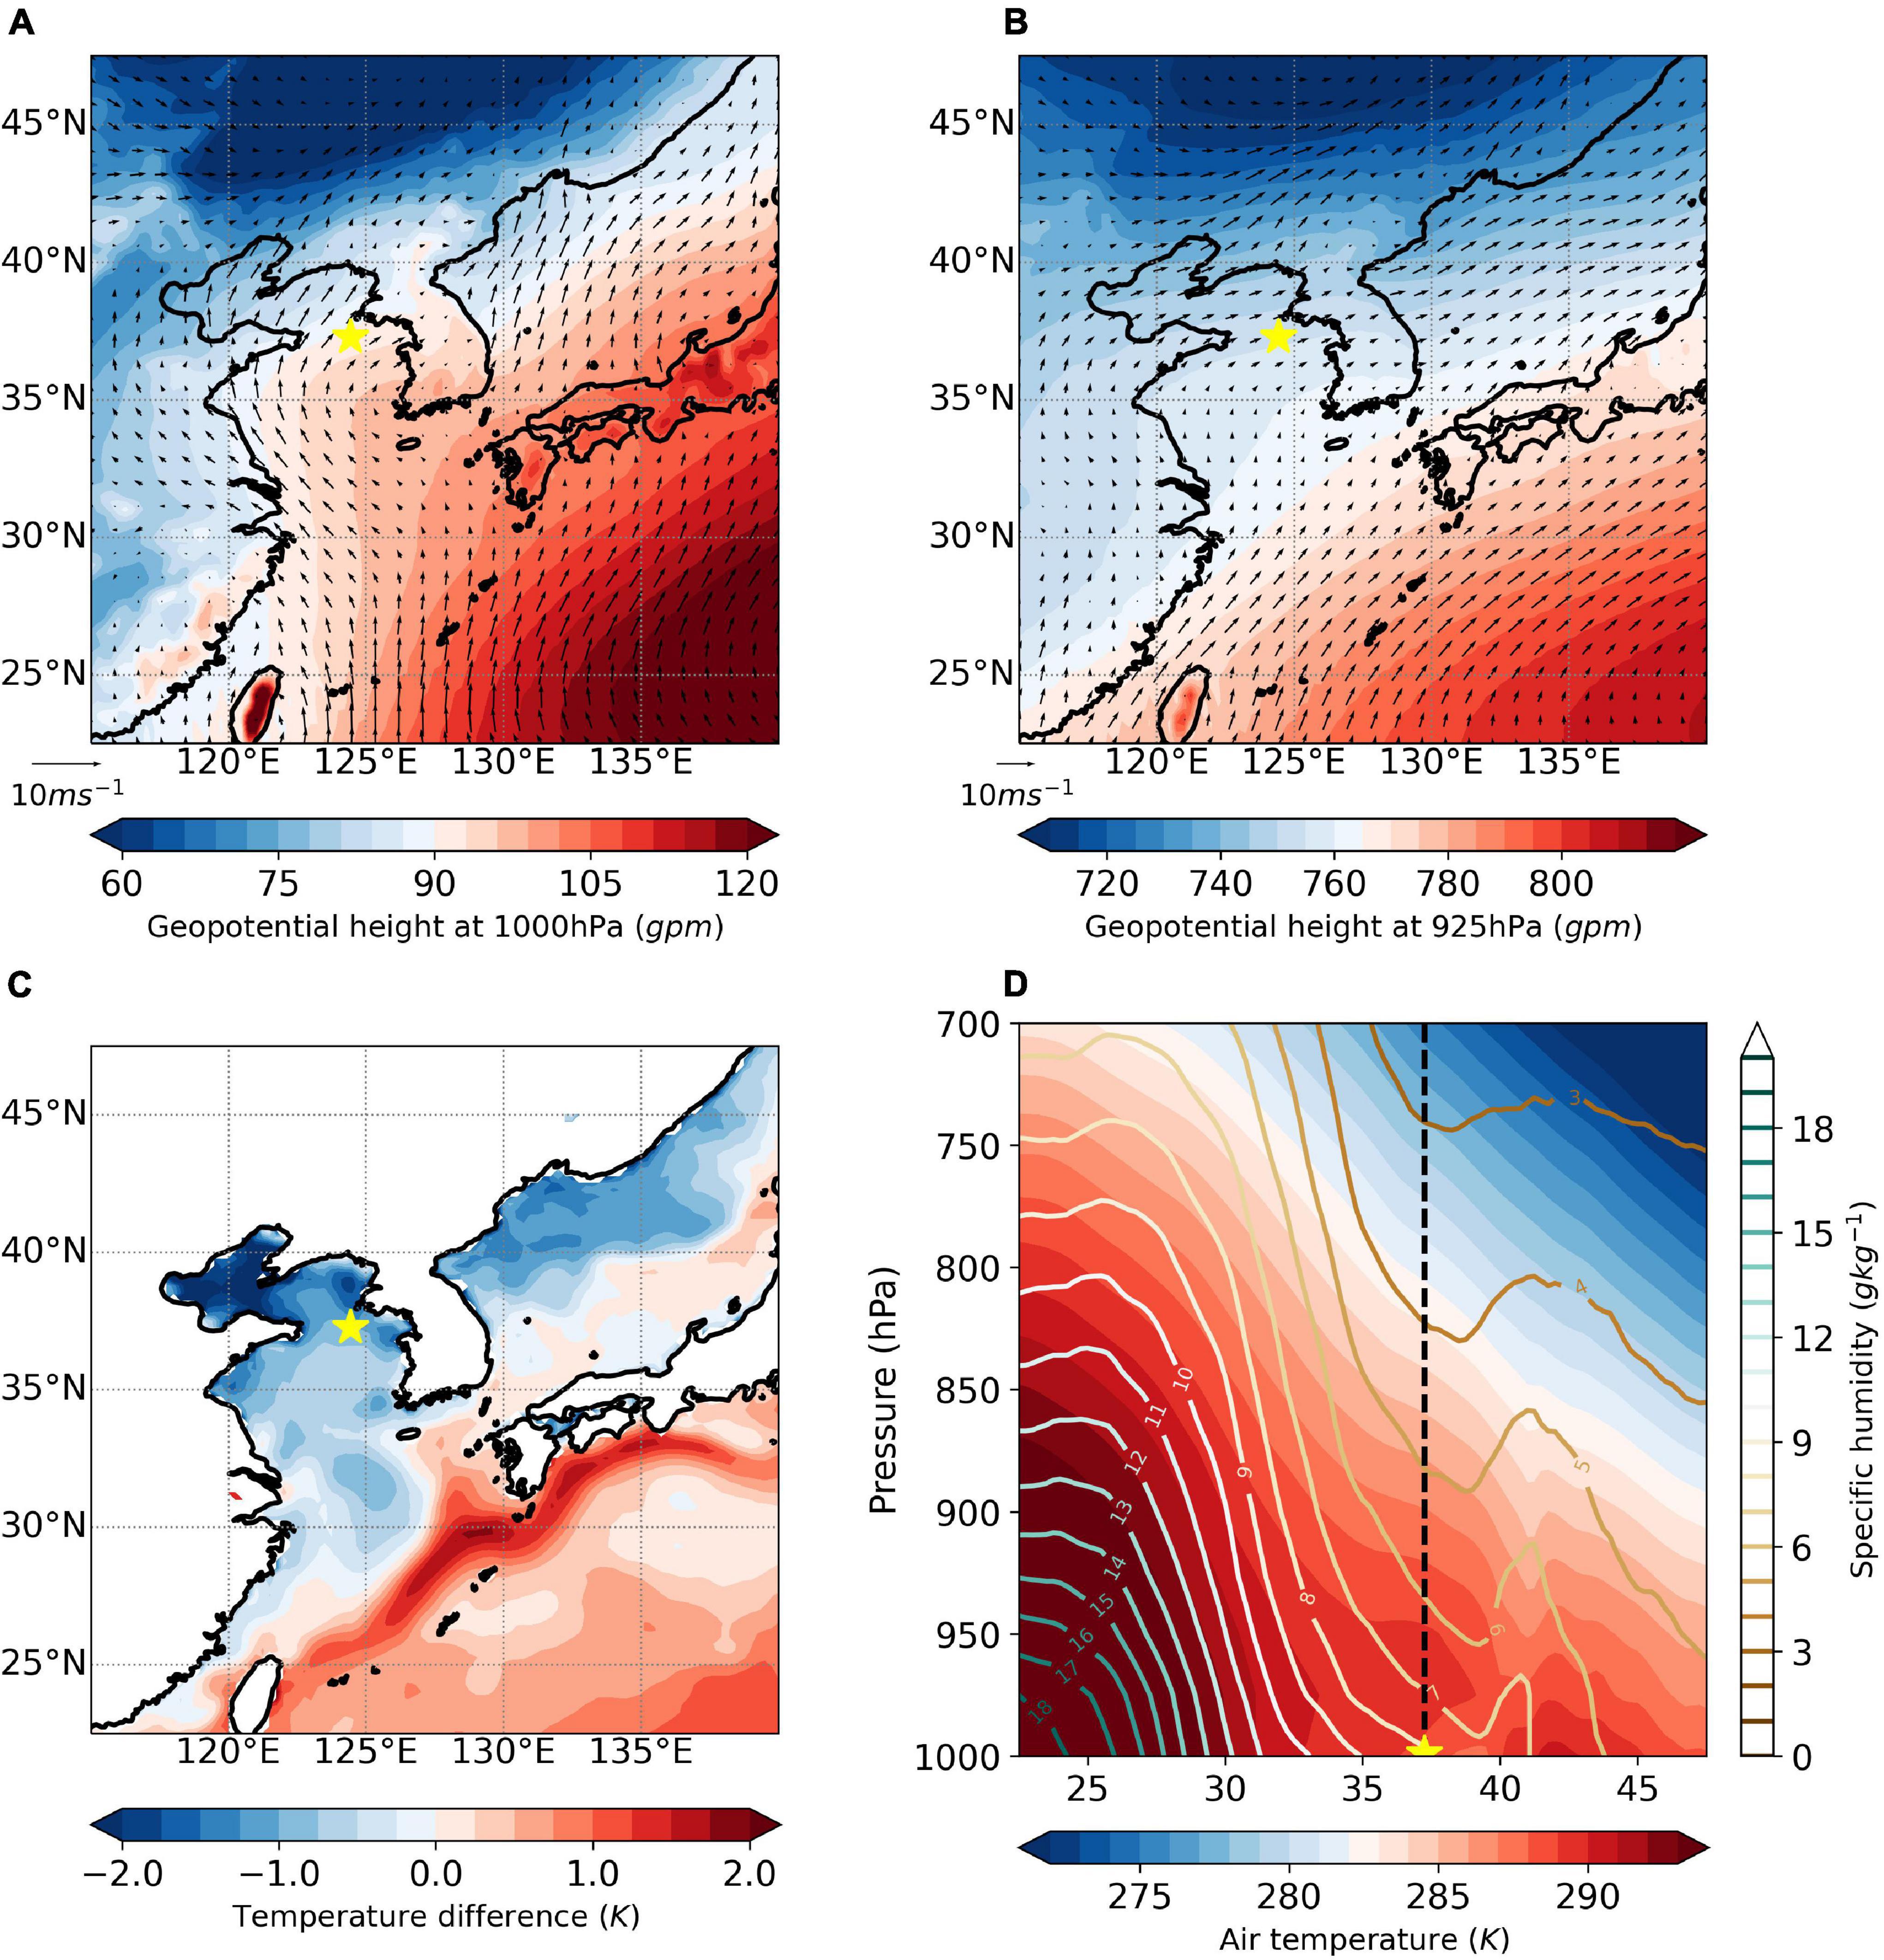
Figure 2. (A) Geopotential height (gpm) and horizontal wind vectors (m s–1) at 1,000 hPa from April to June 2016. (B) Same as (A) but for 925 hPa. (C) Air-sea temperature difference (K). (D) Latitude-height cross-sections of air temperature (K) and specific humidity (g kg–1) from 1,000 to 700 hPa at the grid point closest to S-ORS’s longitude (124.5°E). The location of S-ORS is marked with a yellow star.
We used visibility data from S-ORS to quantify the frequency of sea fog over the Yellow Sea. Fog events were defined as when the visibility at 1 h intervals was less than 1 km. During the analysis period, sea fog occurred 61 times, with a maximum duration of 135 h (approximately 5.6 d). Figure 3 shows the probability density functions (PDFs) of hourly wind direction and temperature difference with the statistical interval of 30° and 1 K, respectively, at S-ORS from April to June 2016 for the full data records and the fog events. First, we examined the frequency of wind directions and temperature differences for the entire data. During the analysis period, more than 36.9% (23.3%) of wind directions are between 150 and 240° (300 and 360°), representing the southeasterly or southwesterly wind (the northwesterly wind), while more than half of the temperature differences are between −2 and 0 K with the highest probability in the interval of −2 to −1 K and about 8.5% of it are in the range of 0–1 K (gray bars in Figure 3). In association with the fog events, the southerly or southwesterly winds are frequent (nearly 47.5%) in the interval of 150–240°, and the negative temperature differences are dominant (nearly 85.3%) (blue bars in Figure 3). This result shows that S-ORS was under favorable conditions for sea fog, as shown in Figure 2. However, it is also significant that about 16.1% of sea fog is recorded when winds are from the northwest and about 10% of it is when temperature differences are 0–1 K; therefore, the origins and characteristics of air masses arriving at S-ORS should be considered. Additionally, to understand air-sea interactions associated with sea fog, Figure 4 shows the PDFs of temperature difference, latent heat flux, and sensible heat flux from S-ORS data, ERA5 and NCEP/FNL reanalysis datasets, with the statistical interval of 1 K, 10 and 10 Wm–2, respectively. For the PDFs of temperature difference, three data shows that temperature differences were mainly negative, with the highest probability being between −2 and −1 K (between −2 and −1 K) in the S-ORS data (ERA5 and NCEP/FNL) (Figure 4A). Similarly, for the PDFs of latent and sensible heat fluxes, about 53% of 68.5% of latent and sensible heat fluxes from S-ORS were between −10 and 0 Wm–2, respectively (Figures 4B,C). The ERA5 and NCEP/FNL showed a slightly different distribution in the latent heat flux, with the highest probability being between 0 and 10 Wm–2. The PDFs of sensible heat flux from the ERA5 and NCEP/FNL were consistent with those from the S-ORS.
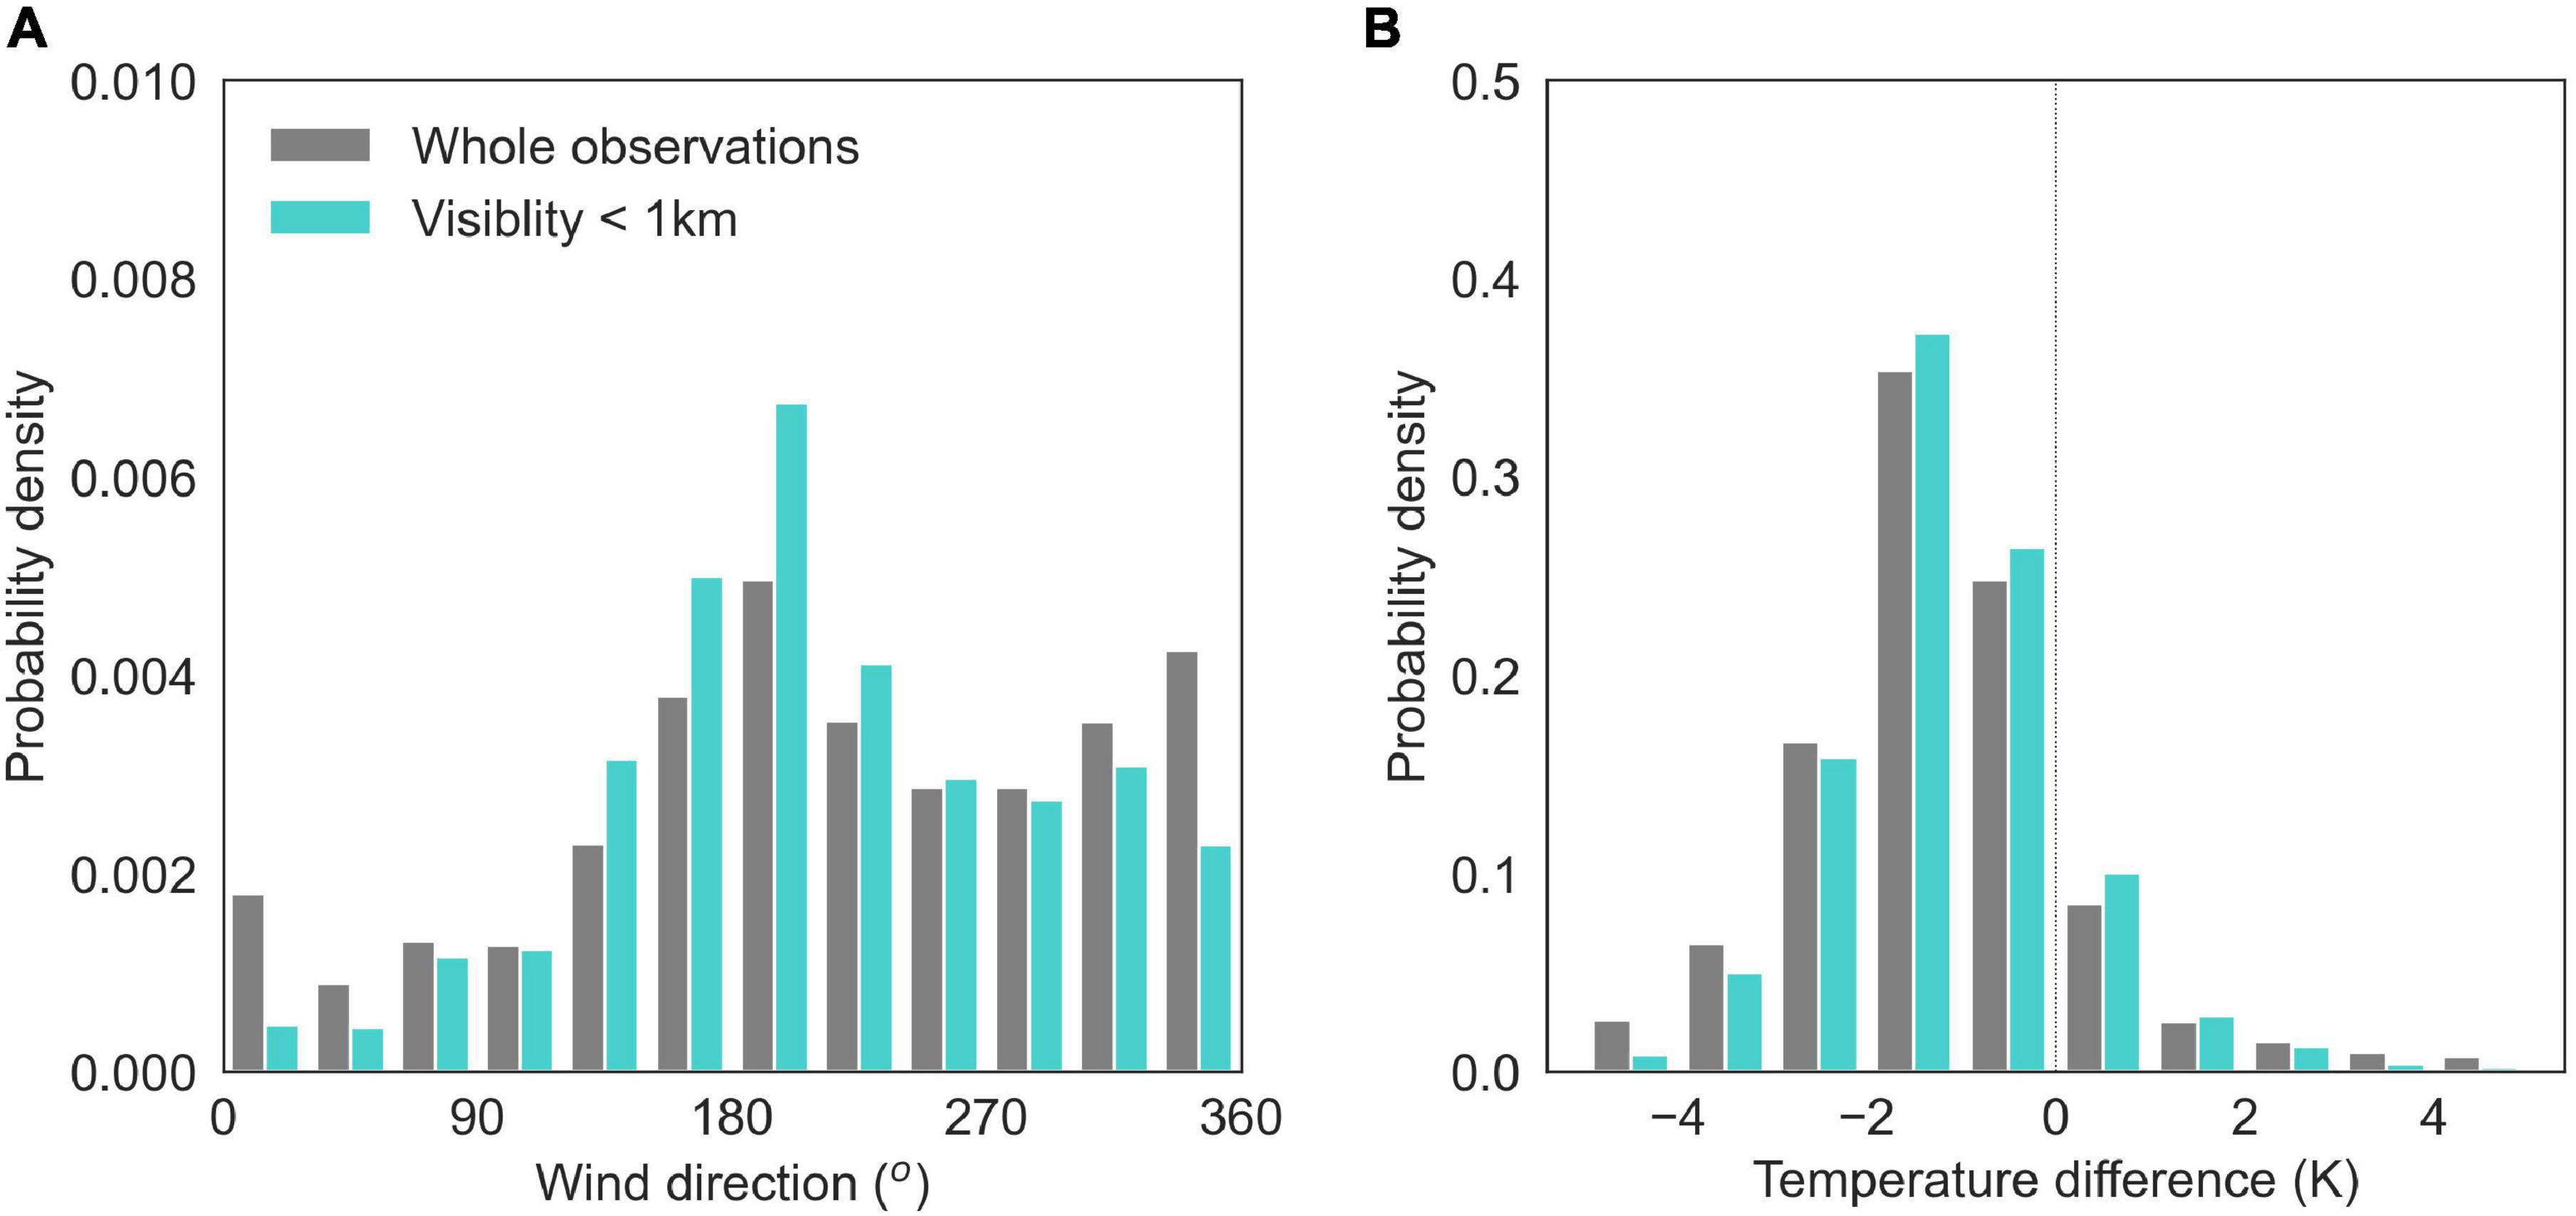
Figure 3. Probability density functions of hourly (A) wind direction (°) and (B) air-sea temperature difference (K) at S-ORS from April to June 2016 for the entire data records (gray bars) and the fog events (blue bars).
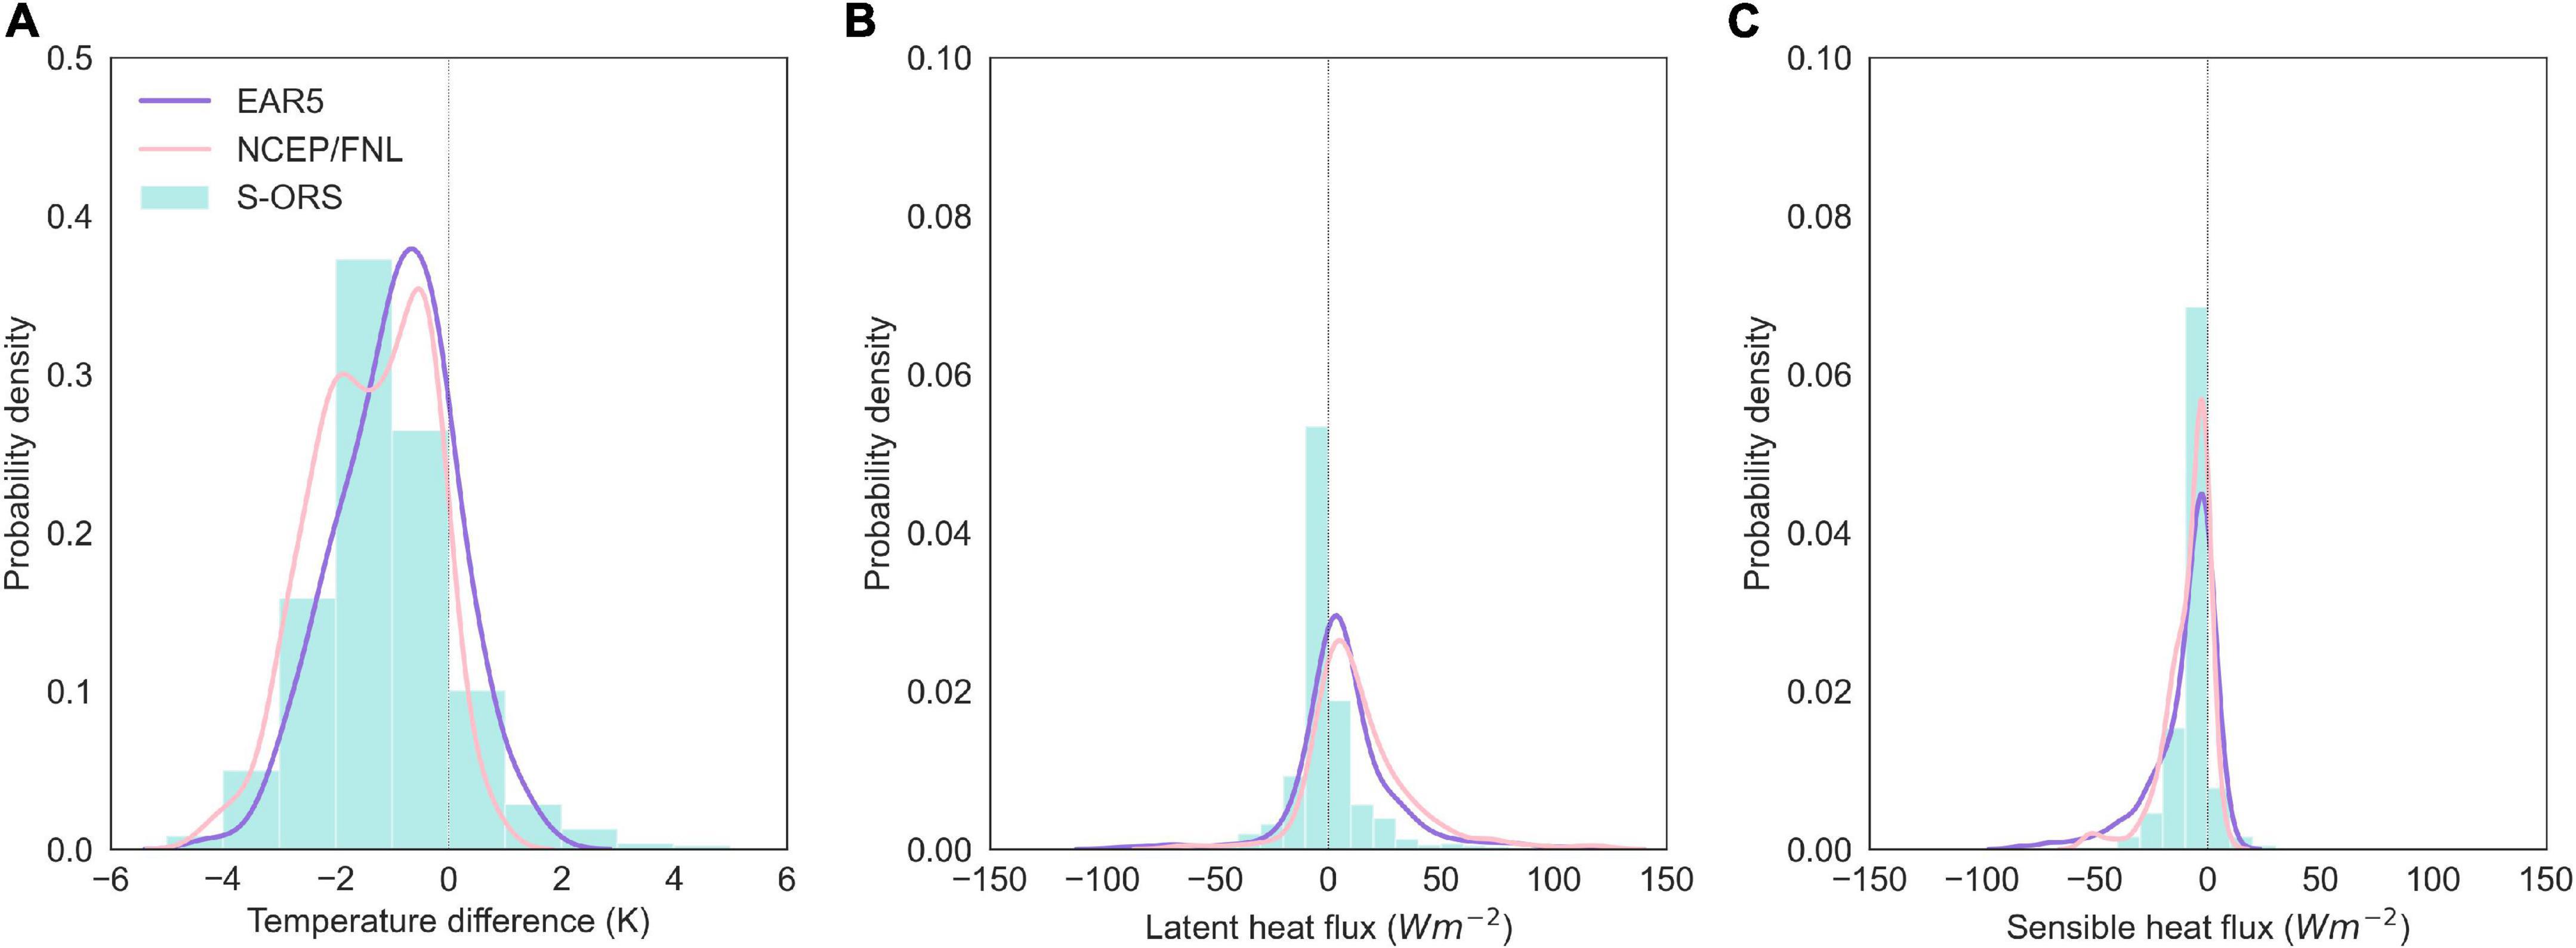
Figure 4. Probability density functions of (A) air-sea temperature difference (K), (B) latent heat flux (W m–2), (C) sensible heat flux (W m–2) associated with fog events at S-ORS from April to June 2016. Blue bars indicate the hourly data from S-ORS. The pink and purple line denotes the six-hourly dataset from ERA5 and NCEP/FNL at the grid point closest to S-ORS, respectively.
Most sea fog events in the Yellow Sea are caused by the advection of heat and water vapor by the prevailing wind (Heo et al., 2010; Kim and Yum, 2010; Wang and Chen, 2014; Han et al., 2022); therefore, it is so essential to understand the origin and characteristics of air masses to predict fog events. Figure 5A shows all air trajectory objects at S-ORS resulting from the NOAA HYSPLIT 24 h back trajectories and their four major clusters. Of the 335 samples from April to June 2016, 209 were identified as fog events, with an occurrence rate of more than 62%. The air trajectories clustered into four distinct air paths: C1, a west airflow from the waters around the Shandong Peninsula; C2, a southwest airflow coming from around the Yangtze River Delta; C3, a southeast airflow from the northeast of the East China Sea; and C4, a northwest airflow originating from the continent and passing through the Shenyang area. The four distinct air paths generated sea fog over the Yellow Sea from mid-spring to early summer of 2016, accounting for 55% (C1), 20% (C2), 13% (C3), and 13% (C4) of the total sea fog events observed. C1 and C3 had the slowest and fastest speeds, respectively, as determined by each cluster’s path length. Figure 5B shows distributions of sea surface temperatures with airflow trajectories for each cluster. For C1 (C4), along the airflow path, the underlying sea surface temperatures are near-constant between 15 and 16°C (between 12 and 11°C). Unlike them, for C2 and C3, the sea surface temperatures are changed from nearly 18 to 14°C and from nearly 20 to 9°C, respectively. As an air mass travels over the Yellow Sea along the path of C3, there is the sharpest decrease in the underlying sea surface temperatures.
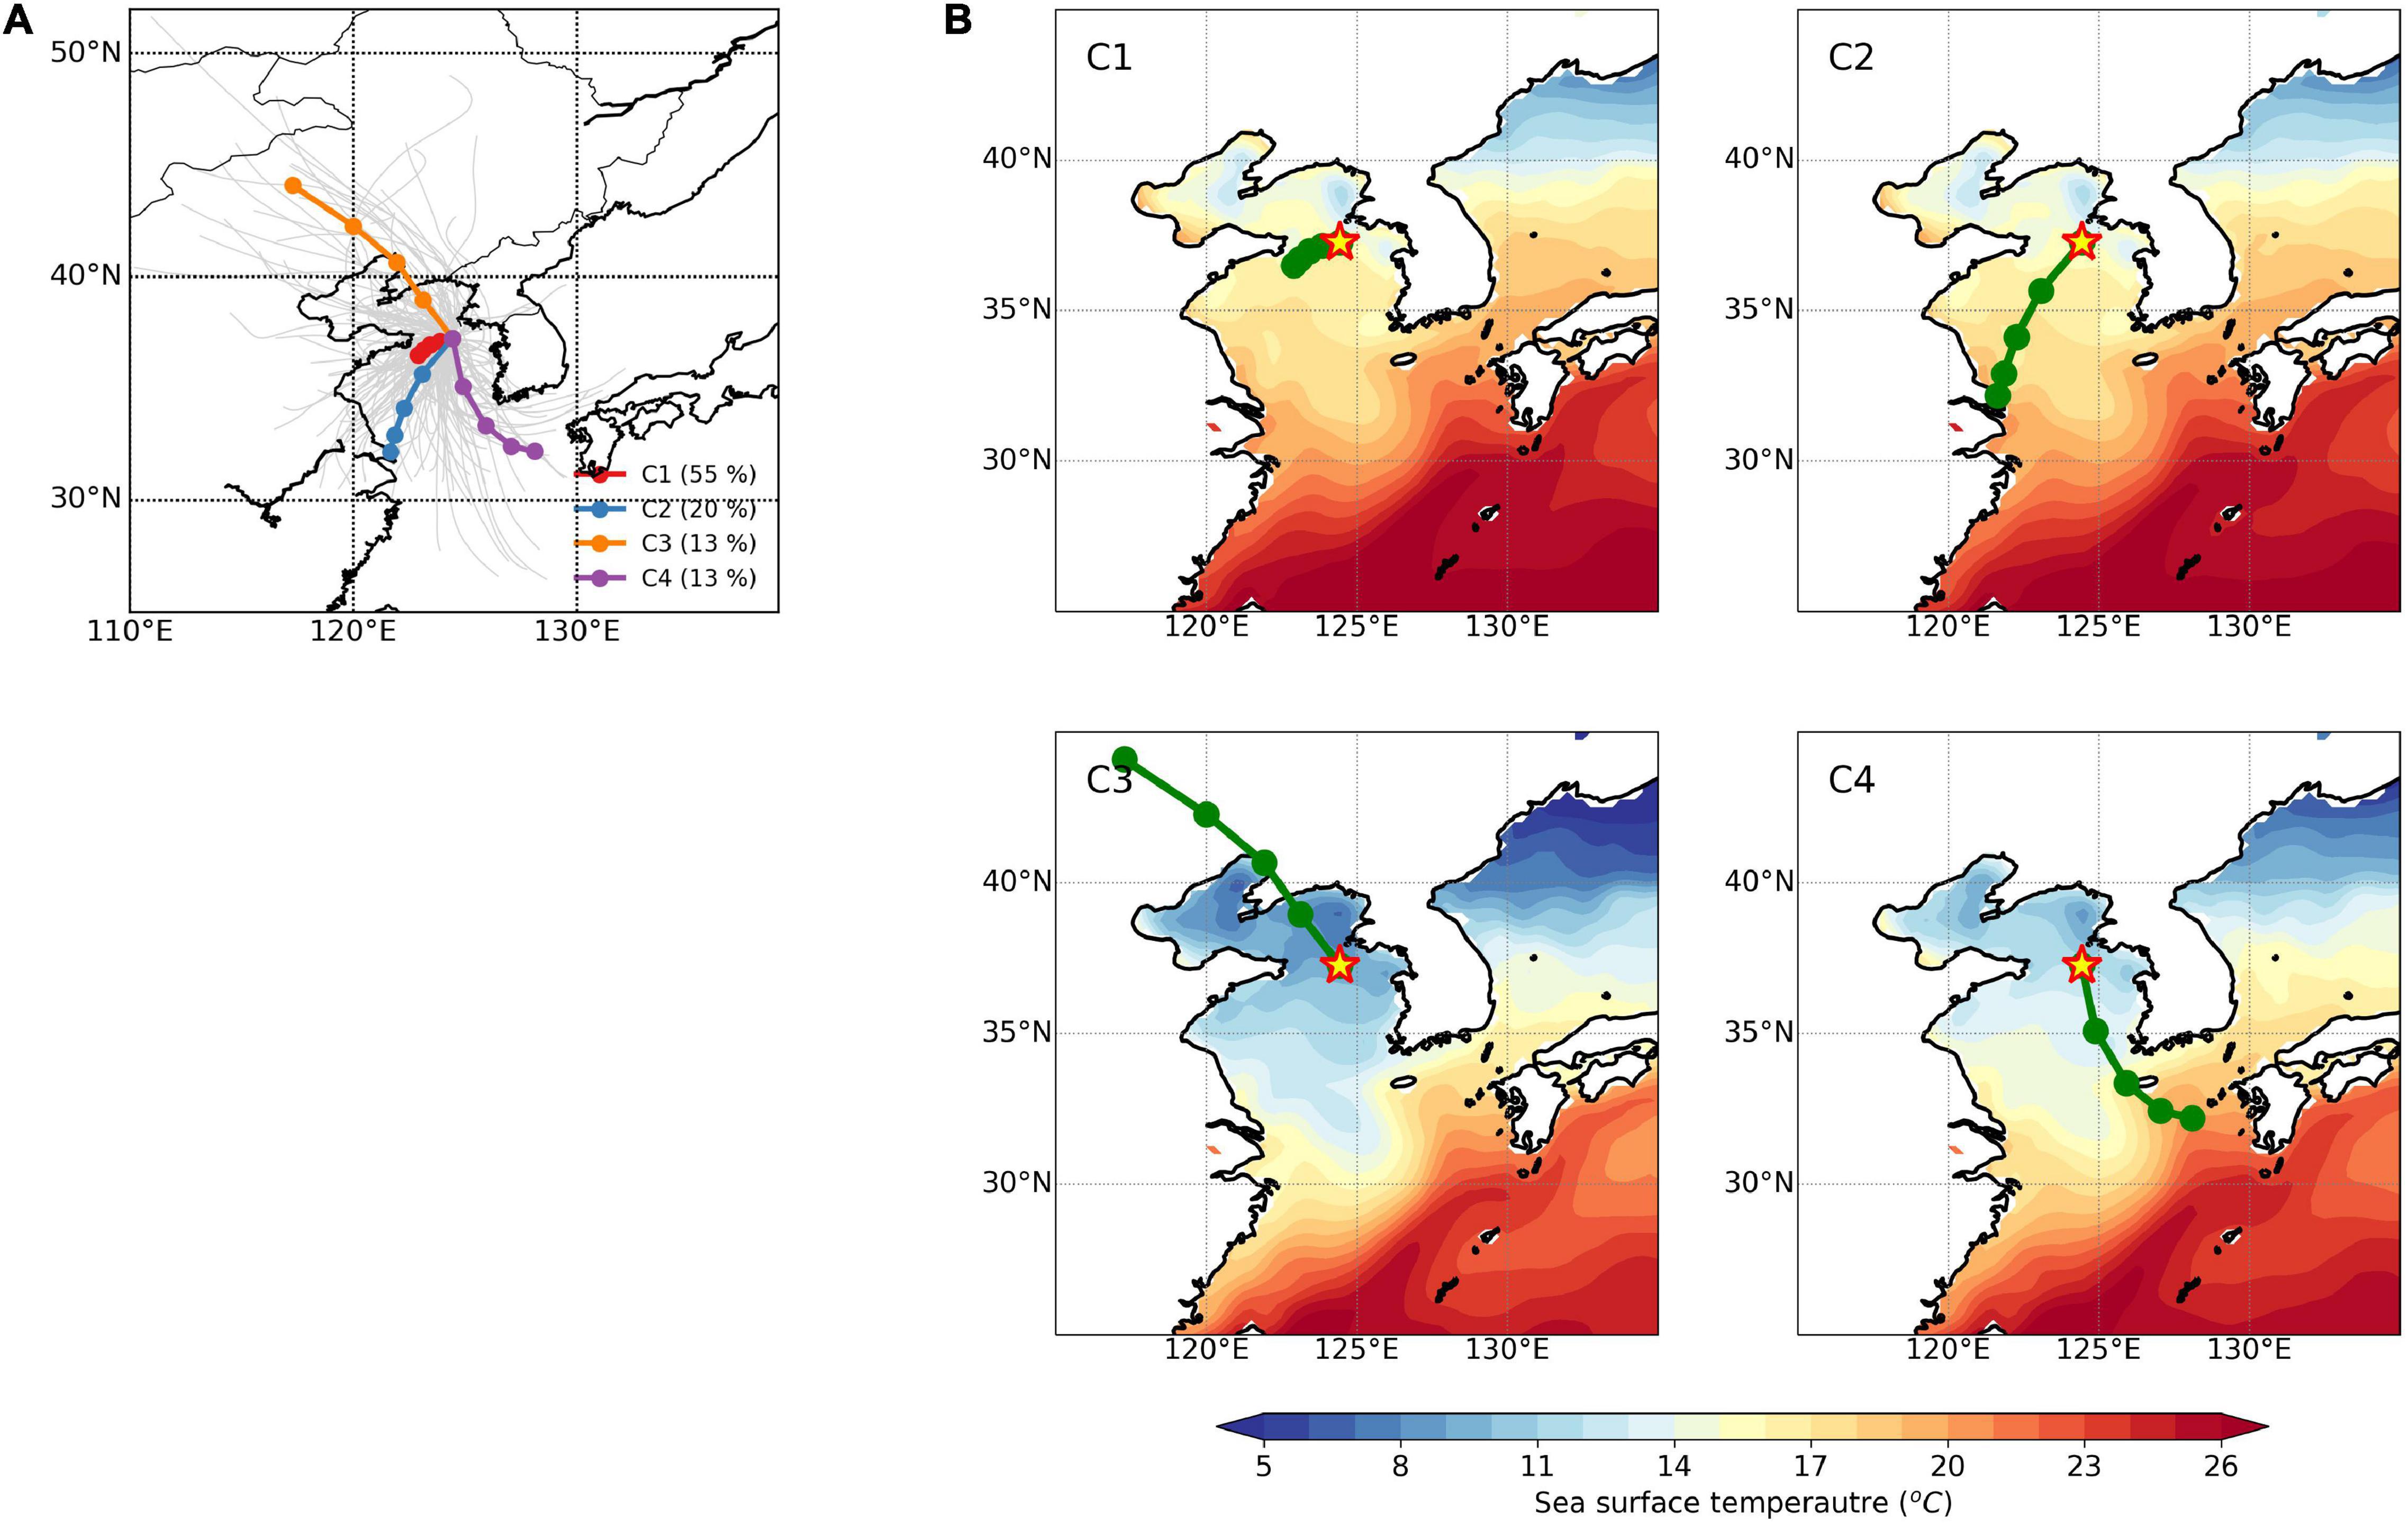
Figure 5. (A) Four cluster paths (bold lines) and their member trajectory objects (gray lines) at SORS, based on NOAA HYSPLIT model 24-h back trajectories related to fog events from April to June 2016. (B) Distributions of sea surface temperatures (°C) and mean trajectory pathways for the C1–C4 clusters. Dots denote displacements at 6-h intervals. The location of S-ORS is marked with a yellow star.
The origin of air masses is closely associated with atmospheric circulations (Huang et al., 2010, 2018; Kim and Yum, 2010; Zhang et al., 2011; Yang et al., 2018). Therefore, to investigate various atmospheric spatial patterns and their related physical processes over the Yellow Sea, we measured the composite anomalies of geopotential height and horizontal wind vectors at 1,000 hPa, vertical cross-section of air temperature and specific humidity from 1,000 to 700 hPa, and temperature differences for the four primary airflow paths (Figure 6). For C1, the anomalous cyclonic circulation is present, representing a slight weakening of the anticyclonic circulation that affects the Yellow Sea in the spring, while temperature and specific humidity anomalies increase by 0.5–1 K and 0–0.5 g kg–1, respectively, in the low-level atmosphere over the Yellow Sea (35°–40°N). Compared to other clusters, these changes are very subtle, in part because the air mass was advected slowly and modified by the underlying ocean. Secondly, C2 shows a significant anomalous circulation pattern characterized by low-pressure circulation in the west and high-pressure circulation in the east, which strengthens the southerly winds. The southerly wind anomalies increase the inflow of moisture and heat transport from the low latitude, resulting in positive temperature and specific humidity anomalies over the Yellow Sea. C2 exhibits negative temperature difference anomalies. C3 features the anomalous anticyclonic circulation in the west and anomalous cyclonic circulation in the northeast, leading to northwesterly wind anomalies that move the dry and cold air to the Yellow Sea. Lastly, C4 shows the atmospheric circulation pattern that looks remarkably similar to C2 but features a greater east-west gradient in geopotential height at 1,000 hPa and dominant southeasterly wind anomalies over the Yellow Sea. However, unlike C2, where stronger westerly winds from the warmer continent to the Yellow Sea form a relatively thicker thermal inversion layer than the mean state, C4 is characterized by the weaker surface temperature inversion, resulting from the weak inflow of warm air by the weaker westerly winds in the low-level atmosphere.
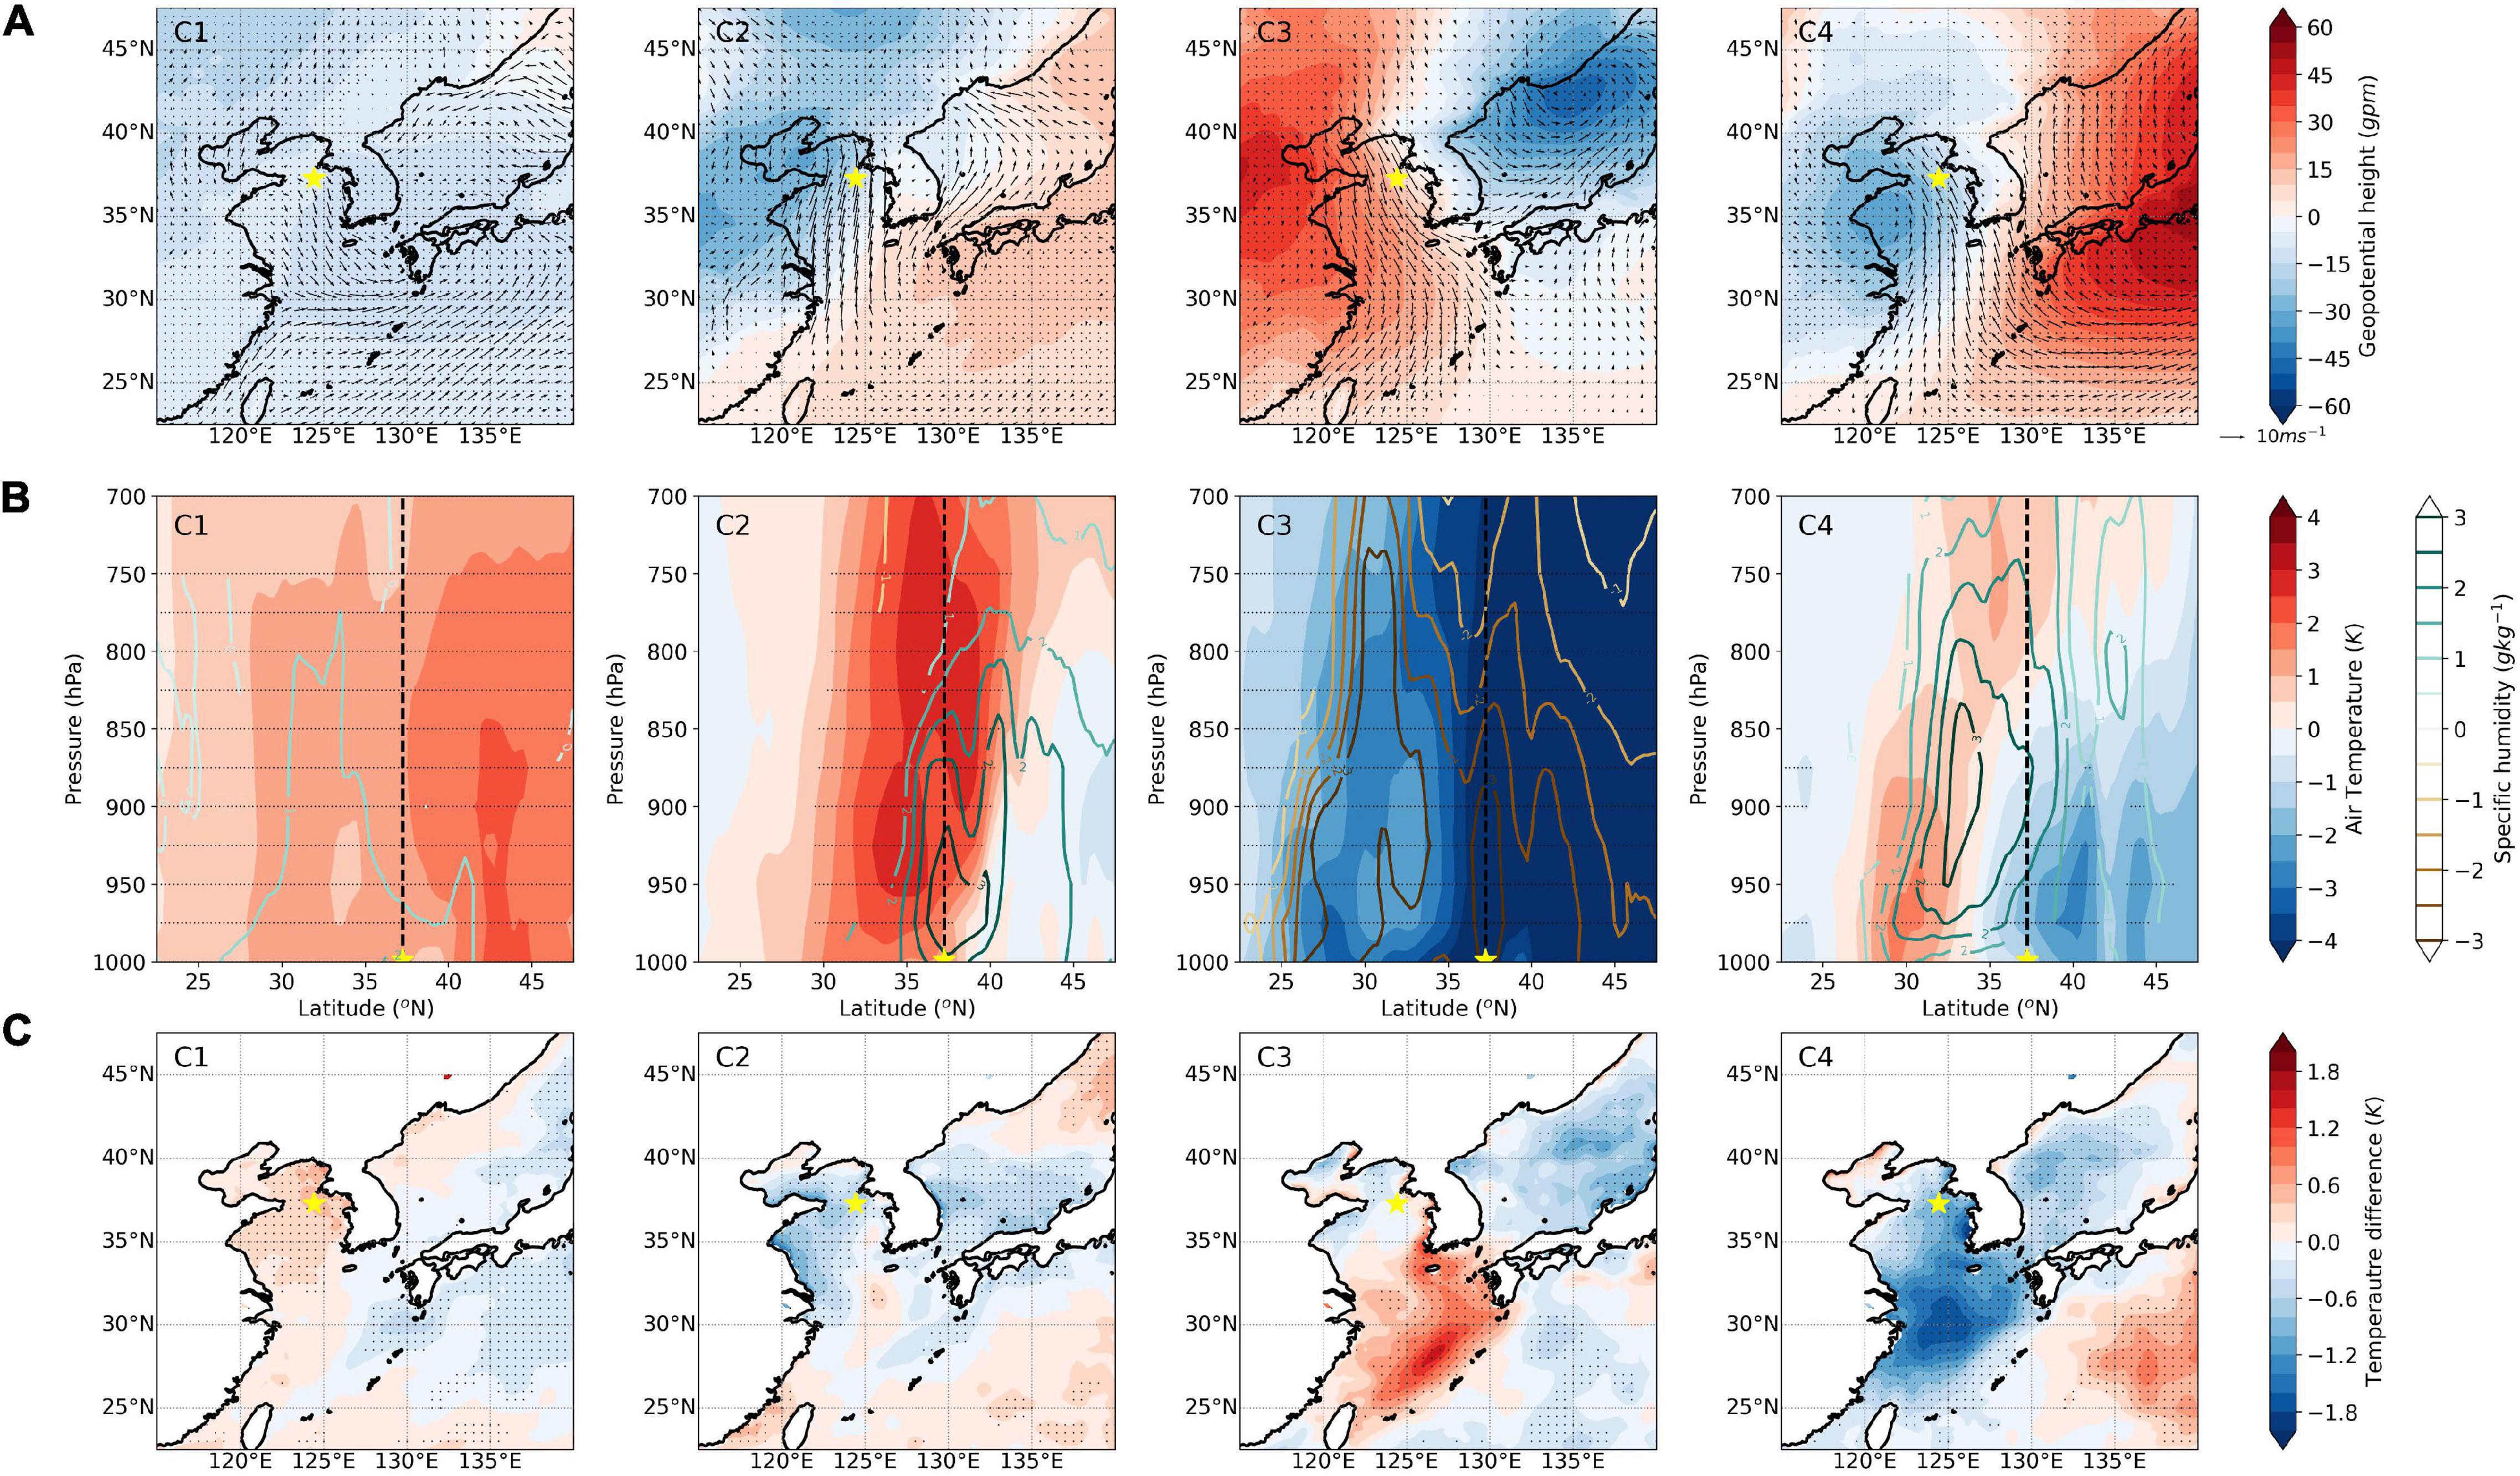
Figure 6. Composite anomalies of (A) geopotential height (gpm) and horizontal wind vectors (m s–1) at 1,000 hPa, (B) latitude-height cross-sections of air temperature (K) and specific humidity (g kg–1) from 1,000 to 700 hPa, and (C) air-sea temperature difference (K) for the four primary airflow paths (C1–C4). Dotted areas are significant at the 90% confidence level. The location of S-ORS is marked with a yellow star.
To better understand the thermodynamic processes, we analyzed the horizontal temperature advection and vertically integrated moisture divergence for the four primary airflow paths, as shown in Figure 7. Positive values of the vertically integrated moisture divergence indicate diverging moisture (decreases in atmospheric motion), and negative values indicate converging moisture (increases in atmospheric motion). C1 is characterized by weak cold advection and positive anomalies of moisture flux divergence, while C2 has the opposite characteristics. C3 is characterized by relatively weak or negative heat advection and strong positive anomalies of moisture flux divergence. It means that when fogging, despite the reduced heat and moisture advection, the overlying drier air enhances the longwave radiative cooling at the fog top and the water evaporation at the sea surface. In contrast, C4 presents strong positive heat transport and moisture convergence over the Yellow Sea. The result supports the physical mechanism of warm and cold fog formation (Taylor, 1917; Lamb, 1943; Yang et al., 2018).
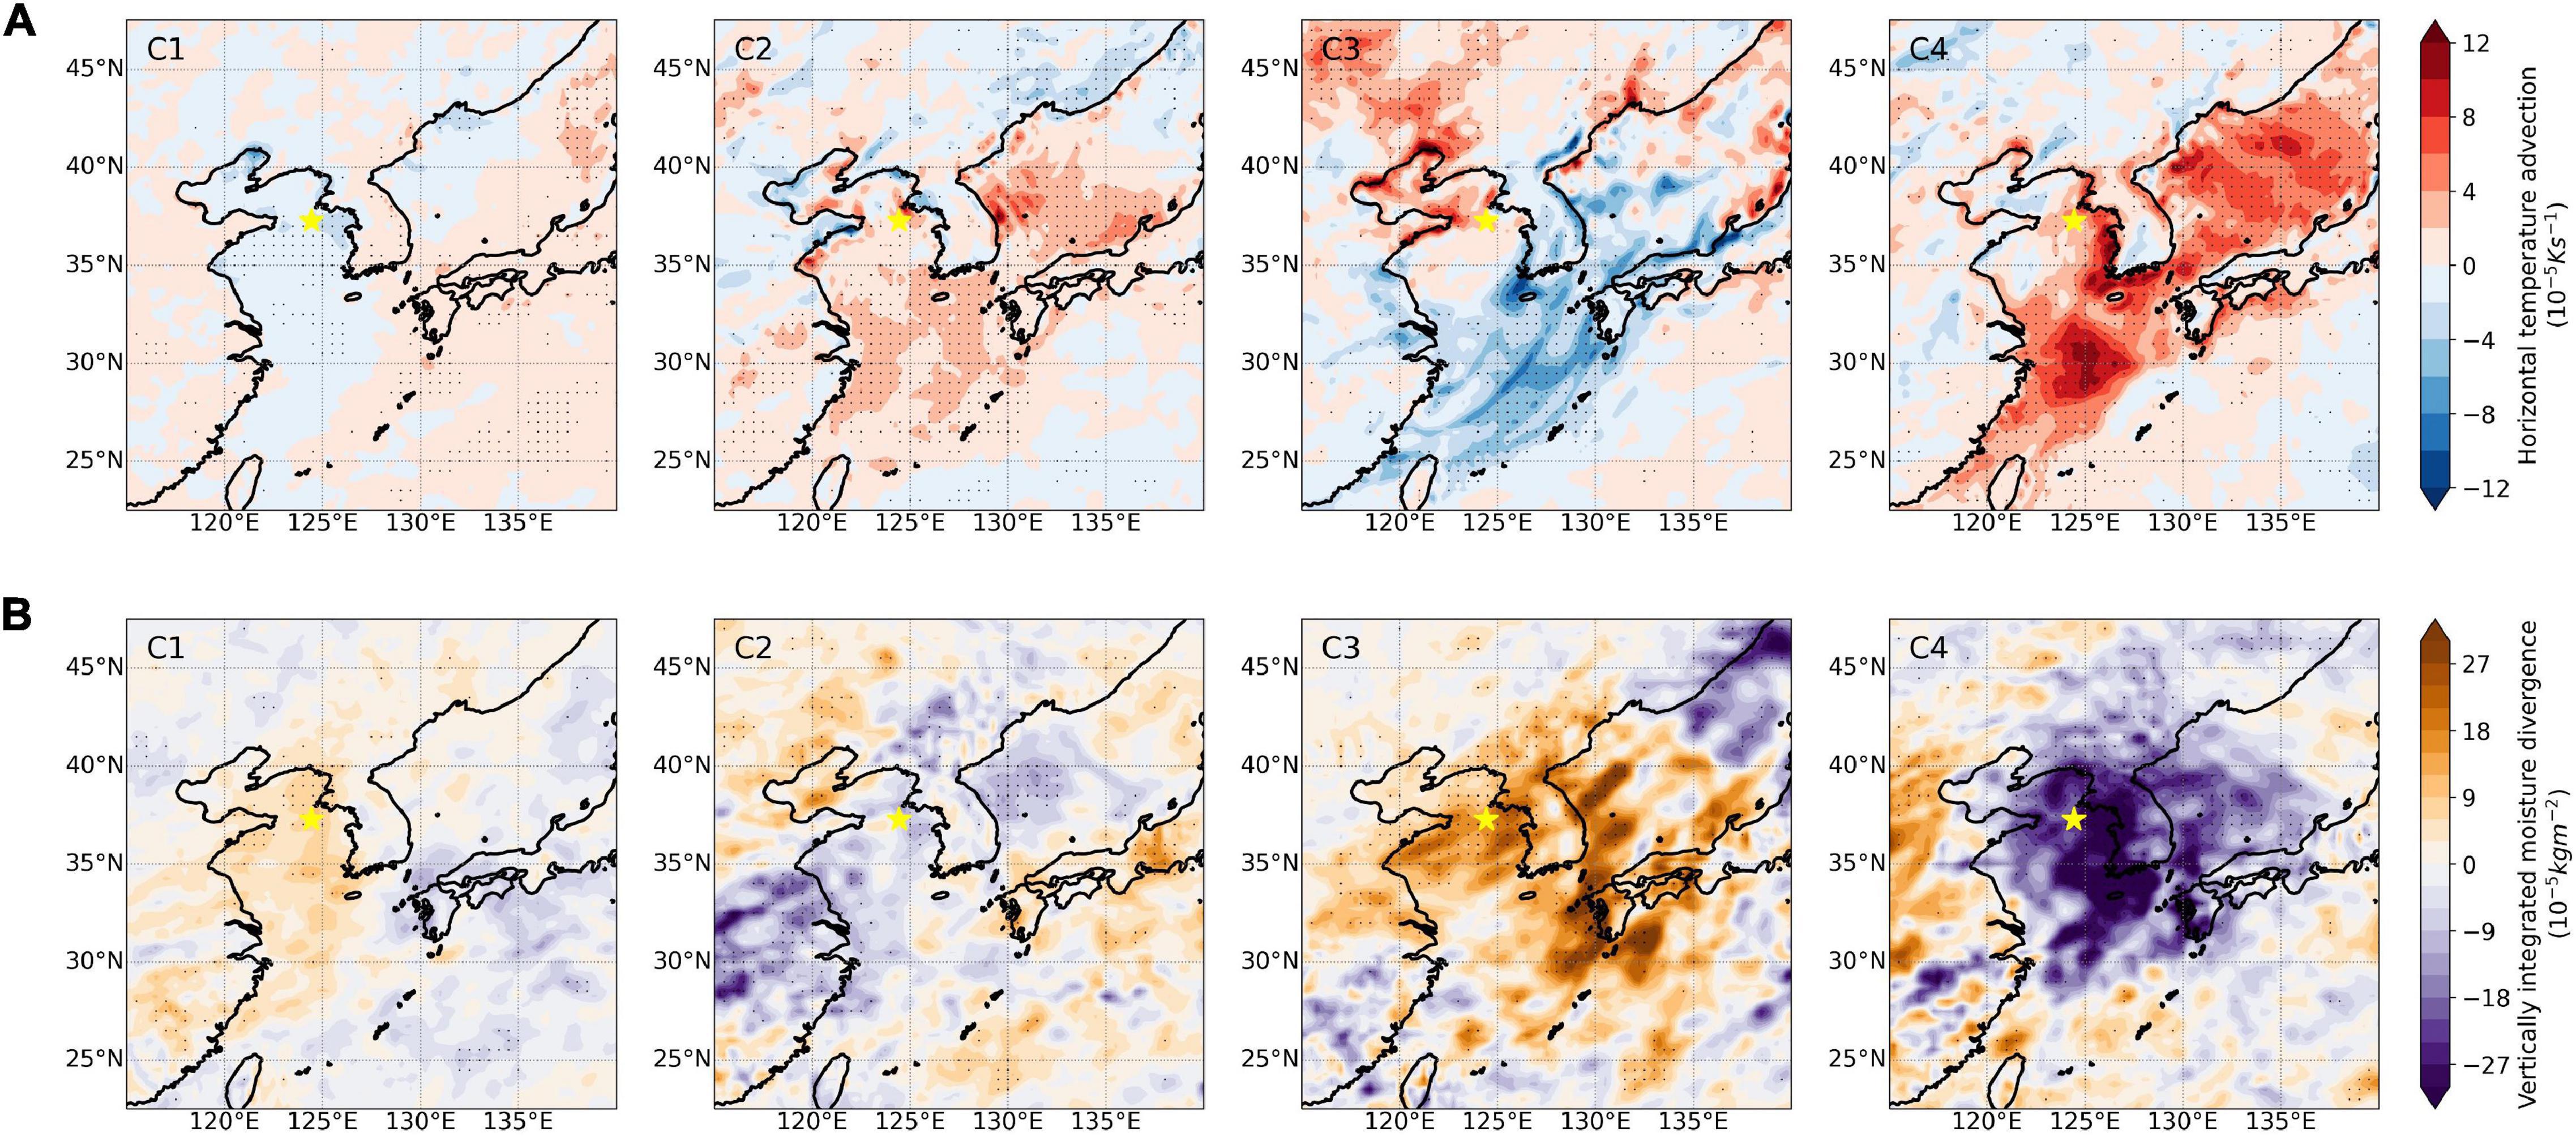
Figure 7. Same as Figure 6 but for (A) horizontal temperature advection (10–5 K s–1) at 1,000 hPa and (B) vertically integrated moisture divergence (10–5 kg m–2).
Among the four clusters, C3 and C4 showed distinct characteristics of cold and warm fog formation, respectively. Therefore, we chose to evaluate representative cases for each cluster using observational data from S-ORS. Figure 8 shows the time series of S-ORS atmospheric data and turbulent heat fluxes for the two case studies. The first case is from 06:00 to 13:00 UTC on April 28, 2016 (Figure 8A). The northwest wind prevailed before the fog and started to subside from 00:00 UTC on April 28. As the horizontal wind speed decreased sharply, condensation occurred. When fogging, the air temperature became close to the water temperature. Changes in latent and sensible heat fluxes became negligible as the atmospheric stability increased. As strong northwest winds dissipated the fog, the latent heat flux increased. During the fog formation, development, and dissipation, the sensible heat flux was less than about −20 Wm–2 because the air temperature was higher than the water temperature. The second case lasted for 12 h from 10:00 to 22:00 UTC on May 12, 2016 (Figure 8B). As the warm and humid air from the southwest wind came over the cool Yellow Sea, the fog started to be formed at 10:00 UTC and dissipated at 22:00 UTC when the northwest wind began to blow. As in Case 1, changes in latent and sensible heat fluxes were small between −20 and 30 Wm–2 during fog generation and development.
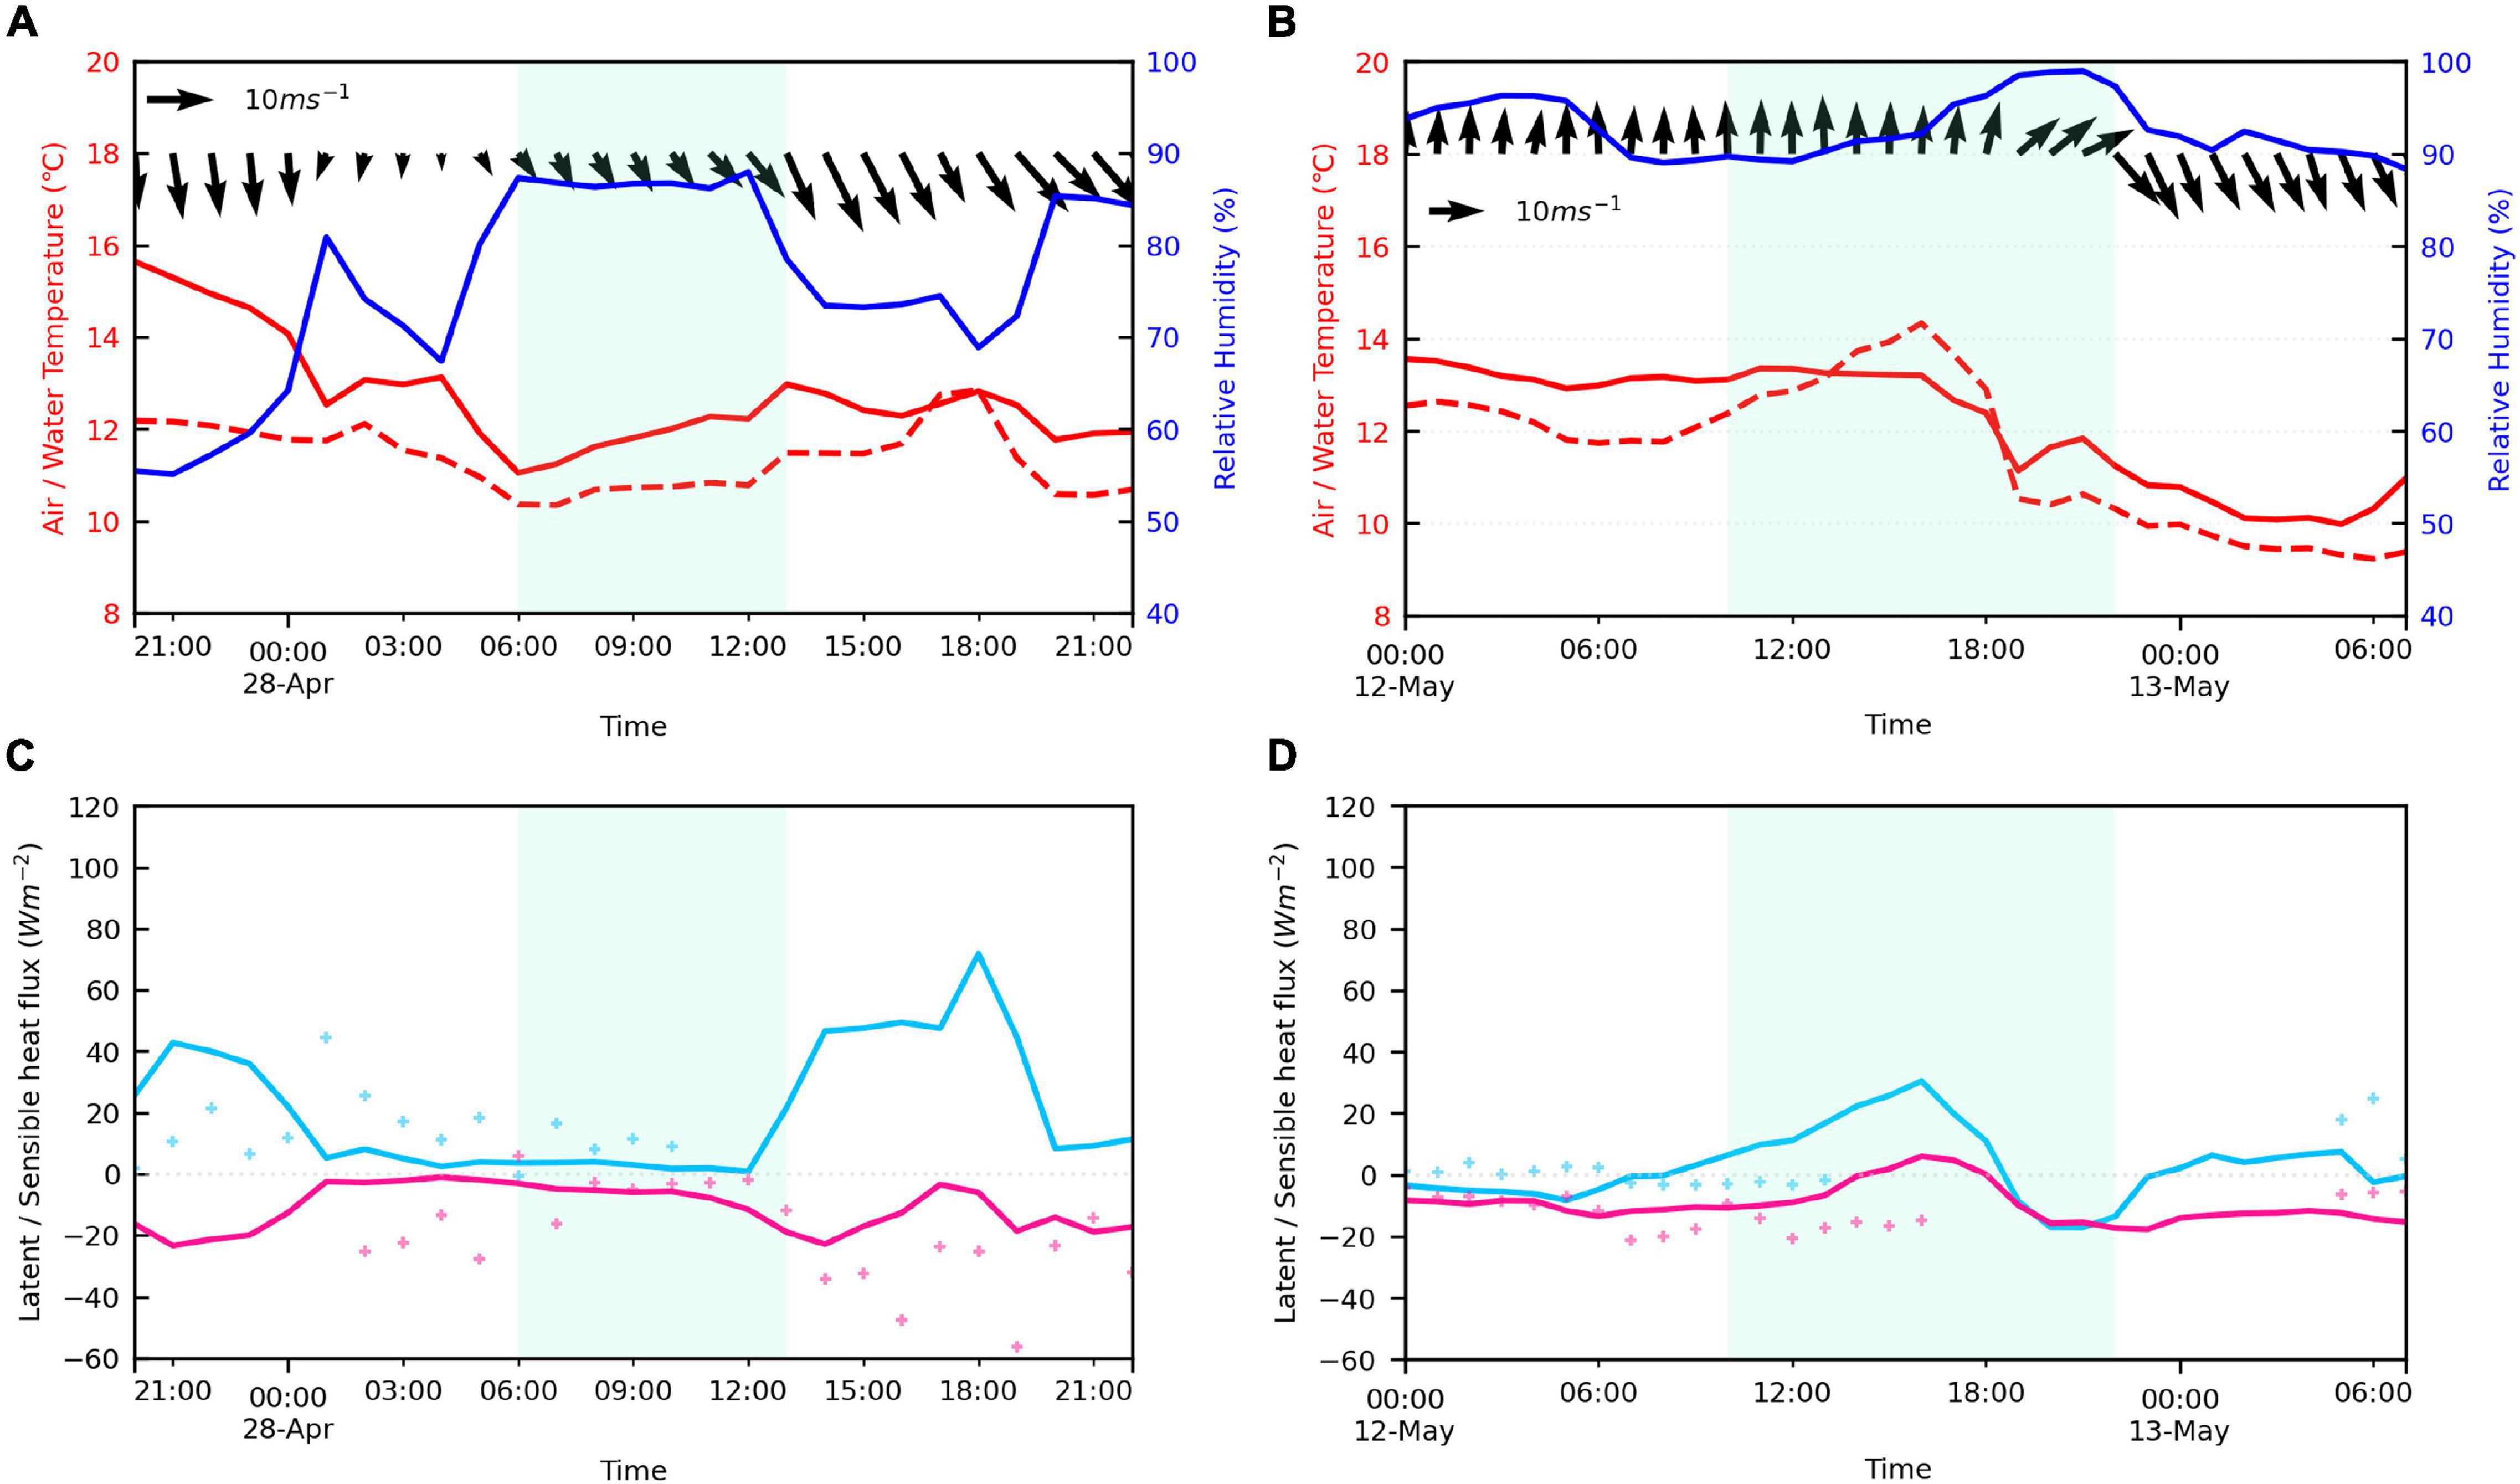
Figure 8. Time series of (A) air temperature (°C, red lines), water temperature (°C, dotted red lines), relative humidity (%, blue lines), horizontal wind vectors (m–1, black arrows), (C) latent heat flux (W m–2, light blue lines) and sensible heat flux (W m–2, pink lines) from S-ORS on April 28, 2016. The heat fluxes were calculated using the COARE 3.5 flux algorithm. The plus markers indicate them directly observed at the northeastern directions of S-ORS. Shaded areas mark when visibility is less than 1 km. (B,D) are the same as (A,C) but for on May 12, 2016.
This study focused on evaluating the conditions favorable for fog generation and the underlying physical processes using a suite of reanalysis datasets and observations and turbulent heat flux data from S-ORS. From April to June 2016, the Yellow Sea was under the influence of the anticyclonic circulation, which increased the inflow of moisture and heat transport from the low latitude near the sea surface. The specific humidity was high near the sea surface and was low in the overlying layer. The air-sea temperature difference was mainly negative over the Yellow Sea. The westerly winds in the low-level atmosphere, which inflows the warm and dry air, led to shallow temperature inversions in the cooler Yellow Sea. Also, to understand the origin and characteristics of air mass associated with fog events, we explored the different dynamic and thermodynamic properties of the low-level atmosphere over the Yellow Sea depending on the dominant clusters. First, we classified the four major airflow paths using the HYSPLIT model. Among the four clusters, the third and fourth had distinct physical properties characteristic of cold and warm fog, respectively. The third was characterized by relatively weak or negative heat advection and weak moisture flux convergence, while the fourth was featured with strong positive heat and moisture transport over the Yellow Sea. After choosing representative cases related to these two clusters observed at S-ORS, we evaluated the atmospheric conditions driving sea fog formation and associated physical processes using S-ORS’s observational and turbulent heat flux data. The two cases clearly showed the characteristics of cold and warm fog, respectively. However, there is a large difference between the calculated and observed fluxes before and after the fog events (Figure 8). This is because directly observed fast-response data have a short-term discrepancy under certain environments. For the long-term periods, the observed and calculated fluxes show similar PDF distributions (not shown). But, for the short-term periods, the difference between the two fluxes increased under atmospheric and oceanic conditions with high humidity, high significant wave height, or strong wind speeds. This is partly because water drops are likely to accumulate on the transducers of sonic anemometers under strong wind conditions, which can cause the recorded signals to remain contaminated. Although previous studies tried to find the cause of unusual and unphysical observation errors in atmospheric and oceanic conditions such as wind speed, relative humidity, and significant wave height (Oh et al., 2011; Burns et al., 2012), the sources of these errors remain unclear. In particular, the accurate measurement and quality control of water vapor are still challenging and demanding. Therefore, to improve the data quality, we should put more effort and resources toward obtaining accurate data.
On one hand, recent papers have isolated the mixed type of cold sea fog and warm sea fog (Yang et al., 2018; Lee et al., 2021). Yang et al. (2018) examined the atmospheric conditions of warm advection fogs with sea surface heating. Under the sea surface heating conditions, the stronger sinking motion strengthens the thermal and moist stratifications. Enhanced longwave radiative cooling at the fog top that facilitates the vertical mixing within the boundary layer can help sustain the sea fogs. Lee et al. (2021) concretized the physical process for transitioning a cold sea fog to a warm sea fog using a high-resolution numerical model simulation. Among sea fog events recorded at S-ORS, the advection fog with phase transition could be easily found. From 19 to 22 UTC on May 10, 2016, there was a cold advection by the north winds, but a higher air temperature than sea surface temperature (Figure 9). This might be related to the fact that a warm air advection at night with persistent cooling by longwave radiation helps enhance the turbulent mixing and the turbulent mixing moistens the lower atmosphere, as seen in Lee et al. (2021). Therefore, further research will be needed to understand the characteristics and physical processes of different sea fog events observed at S-ORS.
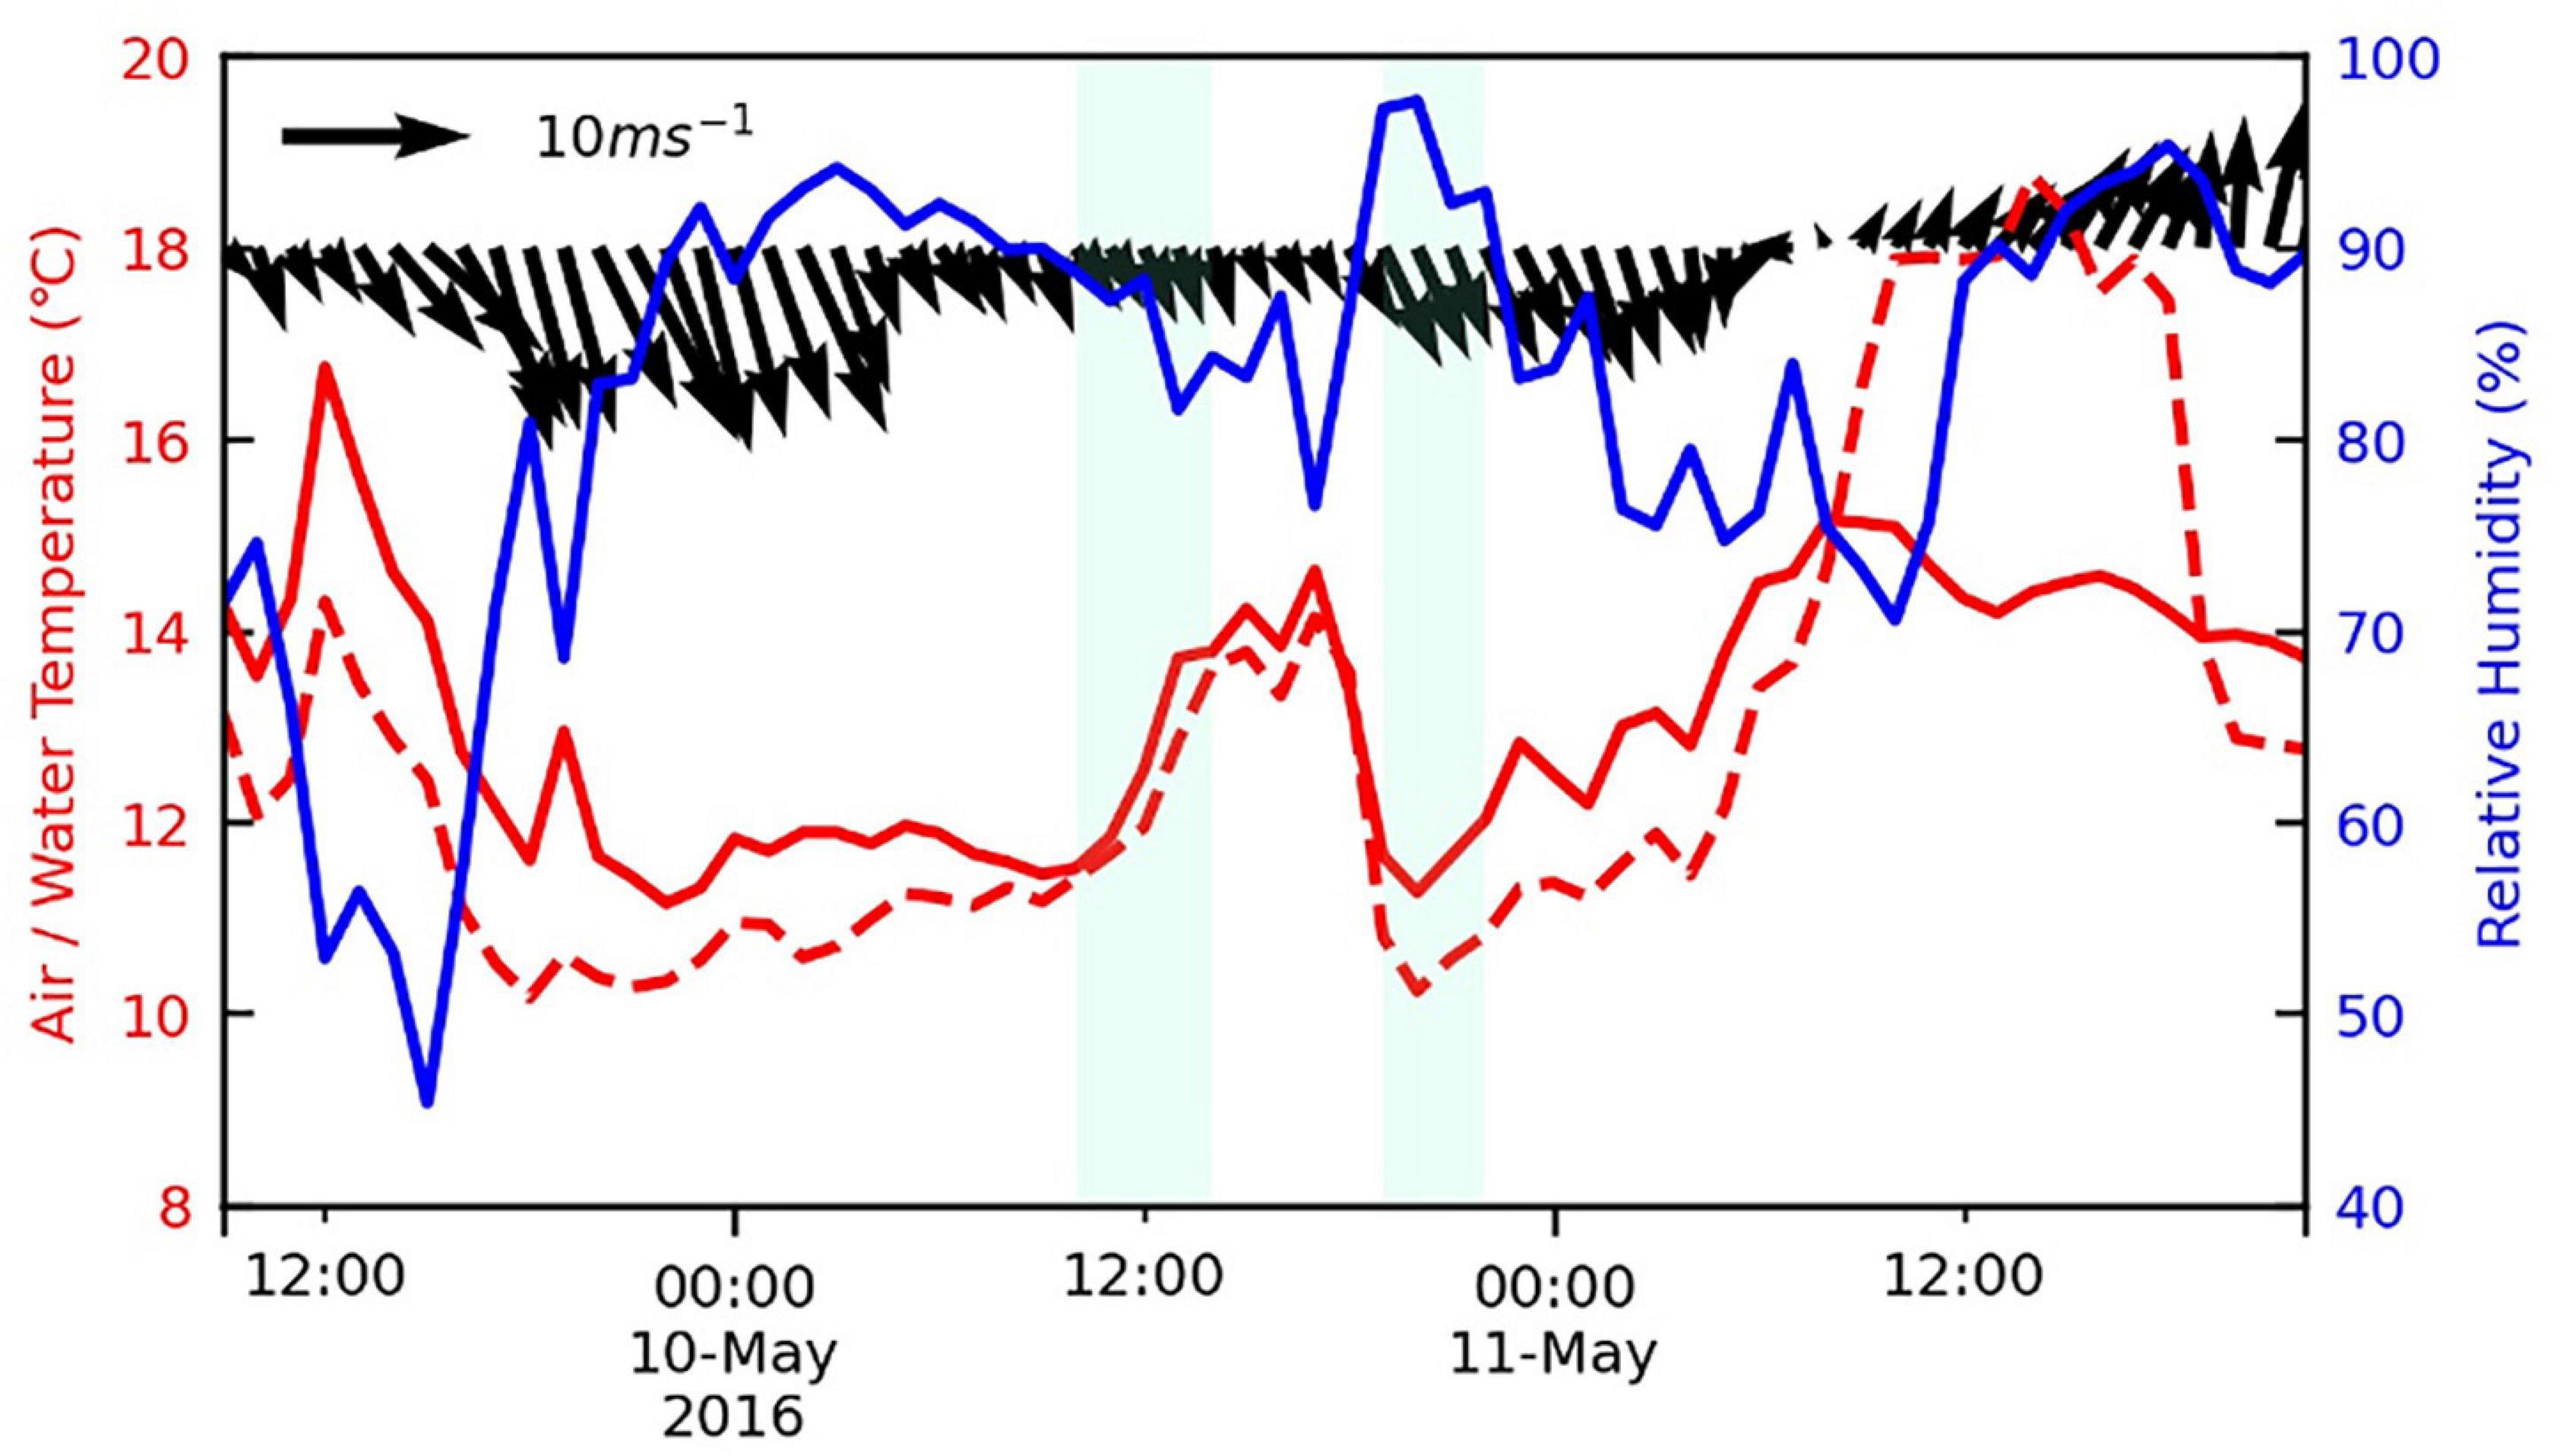
Figure 9. Same as Figure 8A but for from 9 to 11 May 2016.
Sea fog is the most critical forecasting factor in the Yellow Sea because of its industrial impacts on fishing and ocean traffic (Heo et al., 2014; Sun et al., 2018). These findings suggest that forecasters should incorporate local meteorological and oceanic conditions under such a synoptic background. Importantly, S-ORS is one of the monitoring sites for air pollution and fine dust-based aerosols from China. A recent study found that aerosols have a direct effect on enhancing temperature inversion over the Yellow Sea (Jung et al., 2021). Therefore, the effects of aerosols should also be considered when studying sea fog dynamics in the Yellow Sea.
The S-ORS meteorological and oceanic data are provided through the websites: http://kors.kiost.ac.kr/en/ and http://www.khoa.go.kr/oceangrid/khoa/koofs.do, and the turbulent fluxes data are available on request from the Korea Ocean Research Station (KORS) project. The image of S-ORS in Figure 1 was obtained from the KORS project website (http://kors.kiost.ac.kr/en/). The ERA5 dataset can be found at https://cds.climate.copernicus.eu/. The NCEP/FNL dataset can be found at https://rda.ucar.edu/datasets/ds084.4/. PySPLIT, a python package for generating HYSPLIT air parcel trajectories, is available on GitHub (https://github.com/mscross/pysplit).
K-JH and JY designed the study and wrote the manuscript. JY interpreted the data. Both authors contributed to the article and approved the submitted version.
This work was funded by the project titled “Establishment of the Ocean Research Stations in the Jurisdiction Zone and Convergence Research” from the Ministry of Oceans and Fisheries, South Korea.
The authors declare that the research was conducted in the absence of any commercial or financial relationships that could be construed as a potential conflict of interest.
All claims expressed in this article are solely those of the authors and do not necessarily represent those of their affiliated organizations, or those of the publisher, the editors and the reviewers. Any product that may be evaluated in this article, or claim that may be made by its manufacturer, is not guaranteed or endorsed by the publisher.
Belkin, I. M. (2009). Rapid warming of large marine ecosystems. Prog. Oceanogr. 81, 207–213. doi: 10.1016/j.pocean.2009.04.0119
Burns, S. P., Horst, T. W., Blanken, P. D., and Monson, R. K. (2012). Using sonic anemometer temperature to measure sensible heat flux in strong winds. Atmos. Meas. Tech. Discuss. 5, 447–469. doi: 10.5194/amtd-5-447-2012
Chu, P., Chen, Y., and Kuninaka, A. (2005). Seasonal variability of the yellow sea/east china sea surface fluxes and thermohaline structure. Adv. Atmos. Sci. 22, 1–20. doi: 10.1007/BF02930865
Cross, M. (2015). “PySPLIT: a package for the generation, analysis, and visualizations of HYSPLIT air parcel trajectories,” in Proceedings of the 14th Annual Scientific Computing with Python Conference (SciPy 15) (Minneapolis, MN: University of Minnesota). doi: 10.25080/Majora-7b98e3ed-014
Edson, J. B., Jampana, V., Weller, R. A., Bigorre, S., Plueddemann, A. J., Fairall, C. W., et al. (2013). On the exchange of momentum over the open ocean. J. Phys. Oceanogr. 43, 1589–1610. doi: 10.1175/jpo-d-12-0173.1
Ha, K.-J., Hyun, Y.-K., Oh, H.-M., Kim, K.-E., and Mahrt, L. (2007). Evaluation of boundary layer similarity theory for stable conditions in CASES-99. Mon. Weather Rev. 135, 3473–3483. doi: 10.1175/MWR3488.1
Ha, K.-J., Nam, S., Jeong, J.-Y., Moon, I.-J., Lee, M., Yun, J., et al. (2019). Observations utilizing Korean ocean research stations and their applications for process studies. Bull. Am. Meteorol. Soc. 100, 2061–2075. doi: 10.1175/BAMS-D-18-0305.1
Han, L., Long, J., Xu, F., and Xu, J. (2022). Decadal shift in sea fog frequency over the northern South China Sea in spring: interdecadal variation and impact of the Pacific Decadal Oscillation. Atmos. Res. 265:105905. doi: 10.1016/j.atmosres.2021.105905
Heo, K.-Y., and Ha, K.-J. (2010). A coupled model study on the formation and dissipation of sea fogs. Mon. Weather Rev. 138, 1186–1205. doi: 10.1175/2009MWR3100.1
Heo, K.-Y., Ha, K.-J., and Lee, S.-S. (2012). Warming of western north pacific ocean and energetics of transient eddy activity. Mon. Weather Rev. 140, 2860–2873. doi: 10.1175/mwr-d-11-00256.1
Heo, K.-Y., Ha, K.-J., Mahrt, L., and Shim, J. S. (2010). Comparison of advection and steam fogs: from direct observation over the sea. Atmos. Res. 98, 426–437. doi: 10.1016/j.atmosres.2010.08.004
Heo, K.-Y., Park, S., Ha, K.-J., and Shim, J. S. (2014). Algorithm for sea fog monitoring with the use of information technologies. Meteorol. Appl. 21, 350–359. doi: 10.1002/met.1344
Hersbach, H., Bell, B., Berrisford, P., Hirahara, S., Horányi, A., Muñoz-Sabater, J., et al. (2020). The ERA5 global reanalysis. Q. J. R. Meteorol. Soc. 146, 1999–2049. doi: 10.1002/qj.3803
Huang, H., Liu, H., Huang, J., Mao, W., and Bi, X. (2015). Atmospheric boundary layer structure and turbulence during sea fog on the southern China coast. Mon. Weather Rev. 143, 1907–1923. doi: 10.1175/MWR-D-14-00207.1
Huang, J., Wang, B., Wang, X., Huang, F., Lü, W., and Tu, J. (2018). The spring yellow sea fog: synoptic and air-sea characteristics associated with different airflow paths. Acta Oceanol. Sin. 37, 20–29. doi: 10.1007/s13131-018-1155-y
Huang, J., Wang, X., Zhou, W., Huang, H., Wang, D., and Zhou, F. (2010). The characteristics of sea fog with different airflow over the Huanghai Sea in boreal spring. Acta Oceanol. Sin. 29, 3–12. doi: 10.1007/s13131-010-0045-8
Jung, J., Choi, Y., Wong, D. C., Nelson, D., and Lee, S. (2021). Role of sea fog over the yellow sea on air quality with the direct effect of aerosols. J. Geophys. Res 126:e2020JG033498. doi: 10.1029/2020JD033498
Katz, J., and Zhu, P. (2017). Evaluation of surface layer flux parameterizations using in-situ observations. Atmos. Res. 194, 150–163. doi: 10.1016/j.atmosres.2017.04.025
Kim, C. K., and Yum, S. S. (2010). Local meteorological and synoptic characteristics of fogs formed over Incheon international airport in the west coast of Korea. Adv. Atmos. Sci. 27, 761–776. doi: 10.1007/s00376-009-9090-7
Kim, S., Moon, J.-H., and Kim, T. (2021). A coupled numerical modeling study of a sea fog case after the passage of typhoon muifa over the yellow sea in 2011. J. Geophys. Res. 126:e2020JD033875. doi: 10.1029/2020jd033875
Kim, T., Choo, S.-H., Moon, J.-H., and Chang, P.-H. (2017). Contribution of tropical cyclones to abnormal sea surface temperature warming in the Yellow Sea in December 2004. Dyn. Atm. Oceans 80, 97–109. doi: 10.1016/j.dynatmoce.2017.10.002
Kim, Y. S., Jang, C. J., Noh, J. H., Kim, K.-T., Kwon, J.-I., Min, Y., et al. (2019). A yellow sea monitoring platform and its scientific applications. Front. Mar. Sci. 6:601. doi: 10.3389/fmars.2019.00601
Kim, Y. S., Jang, C. J., and Yeh, S. W. (2018). Recent surface cooling in the Yellow and East China Seas and the associated North Pacific climate regime shift. Cont. Shelf Res. 156, 43–54. doi: 10.1016/j.csr.2018.01.009
Lamb, H. (1943). Haars or North Sea fogs on the Coasts of Great Britain. London: Meteorology Office Publication.
Lee, E., Kim, J.-H., Heo, K.-Y., and Cho, Y.-K. (2021). Advection fog over the eastern yellow sea: WRF simulation and its verification by satellite and in situ observations. Remote Sens. 13:1480. doi: 10.3390/rs13081480
Li, P., Fu, G., Lu, C., Fu, D., and Wang, S. (2012). The formation mechanism of a spring sea fog event over the Yellow Sea associated with a low-level jet. Weather Forecast. 27, 1538–1553. doi: 10.1175/WAF-D-11-00152.1
Ma, J., Qiao, F., Xia, C., and Kim, C. S. (2006). Effects of the Yellow Sea Warm Current on the winter temperature distribution in a numerical model. J. Geophys. Res. 111:C11S04. doi: 10.1029/2005JC003171
Naimie, C. E., Blain, C. A., and Lynch, D. R. (2001). Seasonal mean circulation in the Yellow Sea – a model-generated climatology. Cont. Shelf. Res. 21, 667–695. doi: 10.1016/S0278-4343(00)00102-3
National Centers for Environmental Prediction/National Weather Service/NOAA/U.S. Department of Commerce. (2015). NCEP GDAS/FNL Global Surface Flux Grids, Research Data Archive at the National Center for Atmospheric Research, Computational and Information Systems Laboratory, Boulder, Colo. Available online at: https://doi.org/10.5065/D61N7Z6Q (Accessed November 30, 2021).
Oh, H.-M., Ha, K.-J., Heo, K.-Y., Kim, K.-E., Park, S.-J., Shim, J.-S., et al. (2010). On drag coefficient parameterization with post processed direct fluxes measurements over the ocean. Asia Pac. J. Atmos. Sci. 46, 513–523. doi: 10.1007/s13143-010-0030-3
Oh, H.-M., Kim, K.-E., Ha, K.-J., Mahrt, L., and Shim, J.-S. (2011). Quality control and tilt correction effects on the turbulent fluxes observed at an ocean platform. J. Appl. Meteorol. Climatol. 50, 700–712. doi: 10.1175/2010JAMC2367.1
Pak, G., Yeh, S.-W., Nam, S.-H., Park, Y.-H., and Kim, Y. H. (2019). Major driver leading to winter sst variability in the kuroshio recirculation gyre region and its decadal changes: refreshening versus spring-initiated reemergence processes. Geophys. Res. Lett. 46, 272–280. doi: 10.1029/2018GL081232
Park, K. A., Lee, E. Y., Chang, E., and Hong, S. (2015). Spatial and temporal variability of sea surface temperature and warming trends in the Yellow Sea. J. Marine Syst. 143, 24–38. doi: 10.1016/j.jmarsys.2014.10.013
Paw, U. K. T., Baldocchi, D. D., Meyers, T. P., and Wilson, K. B. (2000). Correction of eddy- covariance measurements incorporating both advective effects and density fluxes. Bound. Layer Meteorol. 97, 487–511. doi: 10.1023/A:1002786702909
Rolph, G., Stein, A., and Stunder, B. (2017). Real-time environmental applications and display sYstem: ready. Environ. Model. Softw. 95, 210–228. doi: 10.1016/j.envsoft.2017.06.025
Sim, J. E., Shin, H. R., and Hirose, N. (2018). Comparative analysis of surface heat fluxes in the east asian marginal seas and its acquired combination data. J. Korean Earth Sci. Soc. 39, 1–22. doi: 10.5467/JKESS.2018.39.1.1
Stein, A., Draxler, R. R., Rolph, G. D., Stunder, B. J., Cohen, M., and Ngan, F. (2015). NOAA’s HYSPLIT atmospheric transport and dispersion modeling system. Bull. Am. Meteorol. Soc. 96, 2059–2077. doi: 10.1175/BAMS-D-14-00110.1
Subrahamanyam, D. B., Radhika, R., Rani, S. I., and Kumar, B. P. (2007). Air-sea interaction processes over the East-Asian marginal seas surrounding the Korean Peninsula. Ann. Geophys. 25, 1477–1486. doi: 10.5194/angeo-25-1477-2007
Subrahamanyam, D. B., Rani, S. I., Ramachandran, R., Kunhikrishnan, P. K., and Kumar, B. P. (2009). Impact of wind speed and atmospheric stability on air-sea interface fluxes over the East Asian Marginal Seas. Atmos. Res. 94, 81–90.
Sun, J., Huang, H., Zhang, S., and Mao, W. (2018). How sea fog influences inland visibility on the Southern China Coast. Atmosphere 9:344. doi: 10.3390/atmos9090344
Taylor, G. I. (1917). The formation of fog and mist. Quart. J. Roy. Meteorol. Soc. 43, 241–268. doi: 10.1002/qj.49704318302
Wang, X., and Chen, J. (2014). Fog formation in cold season in Ji’nan, China: case analyses with application of HYSPLIT model. Adv. Meteorol. 2014, 1–9. doi: 10.1155/2014/940956
Warner, M. S. C. (2018). Introduction to PySPLIT: a python toolkit for NOAA ARL’s HYSPLIT model. Comput. Sci. Eng. 20, 47–62. doi: 10.1109/MCSE.2017.3301549
Xie, S.-P., Hafner, J., Tanimoto, Y., Liu, W. T., Tokinaga, H., and Xu, H. (2002). Bathymetric effect on the winter sea surface temperature and climate of the Yellow and East China Seas. Geophys. Res. Lett. 29:2228. doi: 10.1029/2002GL015884
Yang, L., Liu, J.-W., Ren, Z.-P., Xie, S.-P., Zhang, S.-P., and Gao, S.-H. (2018). Atmospheric conditions for advection-radiation fog over the western Yellow Sea. J. Geophys. Res. 123, 5455–5468. doi: 10.1029/2017jd028088
Yang, Y., Li, K., Du, J., Liu, Y., Liu, L., Wang, H., et al. (2019). Revealing the subsurface yellow sea cold water mass from satellite data associated with typhoon muifa. J. Geophys. Res. 124, 7135–7152. doi: 10.1029/2018JC014727
Ye, X., Wu, B., and Zhang, H. (2015). The turbulent structure and transport in fog layers observed over the Tianjin area. Atmos. Res. 153, 217–234. doi: 10.1016/j.atmosres.2014.08.003
Yelland, M. J., Pascal, R. W., Taylor, P. K., and Moat, B. I. (2009). AutoFlux: an autonomous system for the direct measurement of the air-sea fluxes of CO2, heat and momentum. J. Oper. Oceanogr. 2, 15–23. doi: 10.1080/1755876X.2009.11020105
Yun, J., Ha, K.-J., and Jo, Y.-H. (2018). Interdecadal changes in winter surface air temperature over East Asia and their possible causes. Clim. Dyn. 51, 1375–1390. doi: 10.1007/s00382-017-3960-y
Yun, J., Oh, H., and Ha, K. J. (2015). Observation and analysis of turbulent fluxes observed at ieodo ocean research station in autumn 2014. Atmosphere 25, 707–718. doi: 10.14191/atmos.2015.25.4.707
Zhang, S., Li, M., Meng, X., Fu, G., Ren, Z., and Gao, S. (2012). A comparison study between spring and summer fogs in the yellow sea-observations and mechanisms. Pure Appl. Geophys. 169, 1001–1017. doi: 10.1007/s00024-011-0358-3
Zhang, S.-P., Liu, J.-W., Xie, S.-P., and Meng, X.-G. (2011). The formation of a surface anticyclone over the yellow and east china seas in spring. J. Meteorol. Soc. Jpn. 89, 119–131. doi: 10.2151/jmsj.2011-202
Keywords: Yellow Sea, air-sea interaction, turbulent air-sea fluxes, sea fog, ocean observations, Socheongcho Ocean Research Station (S-ORS)
Citation: Yun J and Ha K-J (2022) Physical Processes in Sea Fog Formation and Characteristics of Turbulent Air-Sea Fluxes at Socheongcho Ocean Research Station in the Yellow Sea. Front. Mar. Sci. 9:825973. doi: 10.3389/fmars.2022.825973
Received: 30 November 2021; Accepted: 31 January 2022;
Published: 04 March 2022.
Edited by:
Ryan Rykaczewski, Pacific Islands Fisheries Science Center (NOAA), United StatesReviewed by:
Jing Ma, Nanjing University of Information Science and Technology, ChinaCopyright © 2022 Yun and Ha. This is an open-access article distributed under the terms of the Creative Commons Attribution License (CC BY). The use, distribution or reproduction in other forums is permitted, provided the original author(s) and the copyright owner(s) are credited and that the original publication in this journal is cited, in accordance with accepted academic practice. No use, distribution or reproduction is permitted which does not comply with these terms.
*Correspondence: Kyung-Ja Ha, a2poYUBwdXNhbi5hYy5rcg==
Disclaimer: All claims expressed in this article are solely those of the authors and do not necessarily represent those of their affiliated organizations, or those of the publisher, the editors and the reviewers. Any product that may be evaluated in this article or claim that may be made by its manufacturer is not guaranteed or endorsed by the publisher.
Research integrity at Frontiers

Learn more about the work of our research integrity team to safeguard the quality of each article we publish.