- 1School of Earth and Environmental Sciences/Research Institute of Oceanography, Seoul National University, Seoul, South Korea
- 2Department of Atmospheric Sciences, Yonsei University, Seoul, South Korea
Sparse observations in the East/Japan Sea (EJS) suggested that open-ocean deep convection occurs south of Vladivostok; however, more recent observations suggest that deep convection occurs along the continental slope, resulting in bottom water formation in the EJS. We investigated the process of deep convection along the EJS continental slope using large-eddy simulation (LES), which demonstrated that dense water, formed by strong wintertime cooling in the shelf, flows down along the slope as a bottom Ekman current. The characteristics of the initial dense water were relatively well conserved on the continental slope during convection, but they changed rapidly by mixing with the surrounding waters in the open ocean. Accordingly, slope convection penetrated deeper compared to open-ocean convection under the same surface heat flux. Our numerical experiments showed that, under typical surface cooling during winter (i.e., 200 W m–2), slope convection reaches depths greater than 2,700 m, generating a potential ventilation process for deep- and bottom-water formations, whereas open-ocean convection reaches approximately 700 m depth, contributing to the intermediate- and central-water formations in the EJS. Various topography experiments revealed that downward speed was proportional to the continental-slope inclination; the initial characteristics remained relatively well conserved at a small continental-slope inclination. Increased salinity due to brine rejection in the shelf could accelerate the slope convection.
Introduction
The East/Japan Sea (EJS) is a typical semi-enclosed marginal sea, albeit with oceanic characteristics regarding the temperature, salinity, and dissolved oxygen vertical profiles (Gamo and Horibe, 1983; Kim and Kim, 1996; Kim et al., 1996).
Deep water formation is crucial to the meridional circulation in the EJS (Han et al., 2020) and the oceans (Alley et al., 2003; Rahmstorf et al., 2015; Bellomo et al., 2021). It has been suggested that deep water formation occurs south of Vladivostok (Senjyu and Sudo, 1993; Kawamura and Wu, 1998).
The Tsushima warm water (TWW), which occupies the surface layer, flows into the EJS through the Korea Strait and flows out through the Tsugaru and Soya Straits (Cho et al., 2009). The East Sea intermediate water (ESIW), characterized by a vertical salinity minimum, is situated below the TWW, mainly in the western EJS (Kim and Chung, 1984; Cho and Kim, 1994; Kim and Kim, 1999; Kim et al., 2004; Talley et al., 2006; Chang et al., 2016; Nam et al., 2016). Three deep water masses have been identified below the ESIW (Kim et al., 2004). A deep salinity minimum at approximately 1,500 m depth separates the upper central water (CW) and the lower deep water (DW). The vertically homogeneous bottom water (BW) occupies the abyssal layer, and its upper boundary is at approximately 2,500–2,700 m depth (Kim et al., 2004; Talley et al., 2006; Chang et al., 2016; Yoon et al., 2018).
Clayson and Luneva (2004), based on simulations, suggested that the subtropical front south of Vladivostok, where confluence of warm- and cold-water masses occurs, is the preferred location of deep convection events in the EJS, as the confluence-induced downwelling favors deeper penetration of the convective turbulence generated by strong wintertime cooling. However, the maximum convection depth simulated by their model was approximately 1,000 m, which corresponds to the CW layer in the EJS.
In the EJS, wintertime sea surface temperatures in the coastal region above the continental shelf are lower than those in the region off the coast (Figure 1). A recent study, based on direct observations, reported cold and oxygen-rich water at the continental slope and suggested brine rejection as the primary cause of deepest water ventilation (Talley et al., 2003); however, a high salinity of the renewal water, implying brine rejection, was not observed despite its high oxygen content.
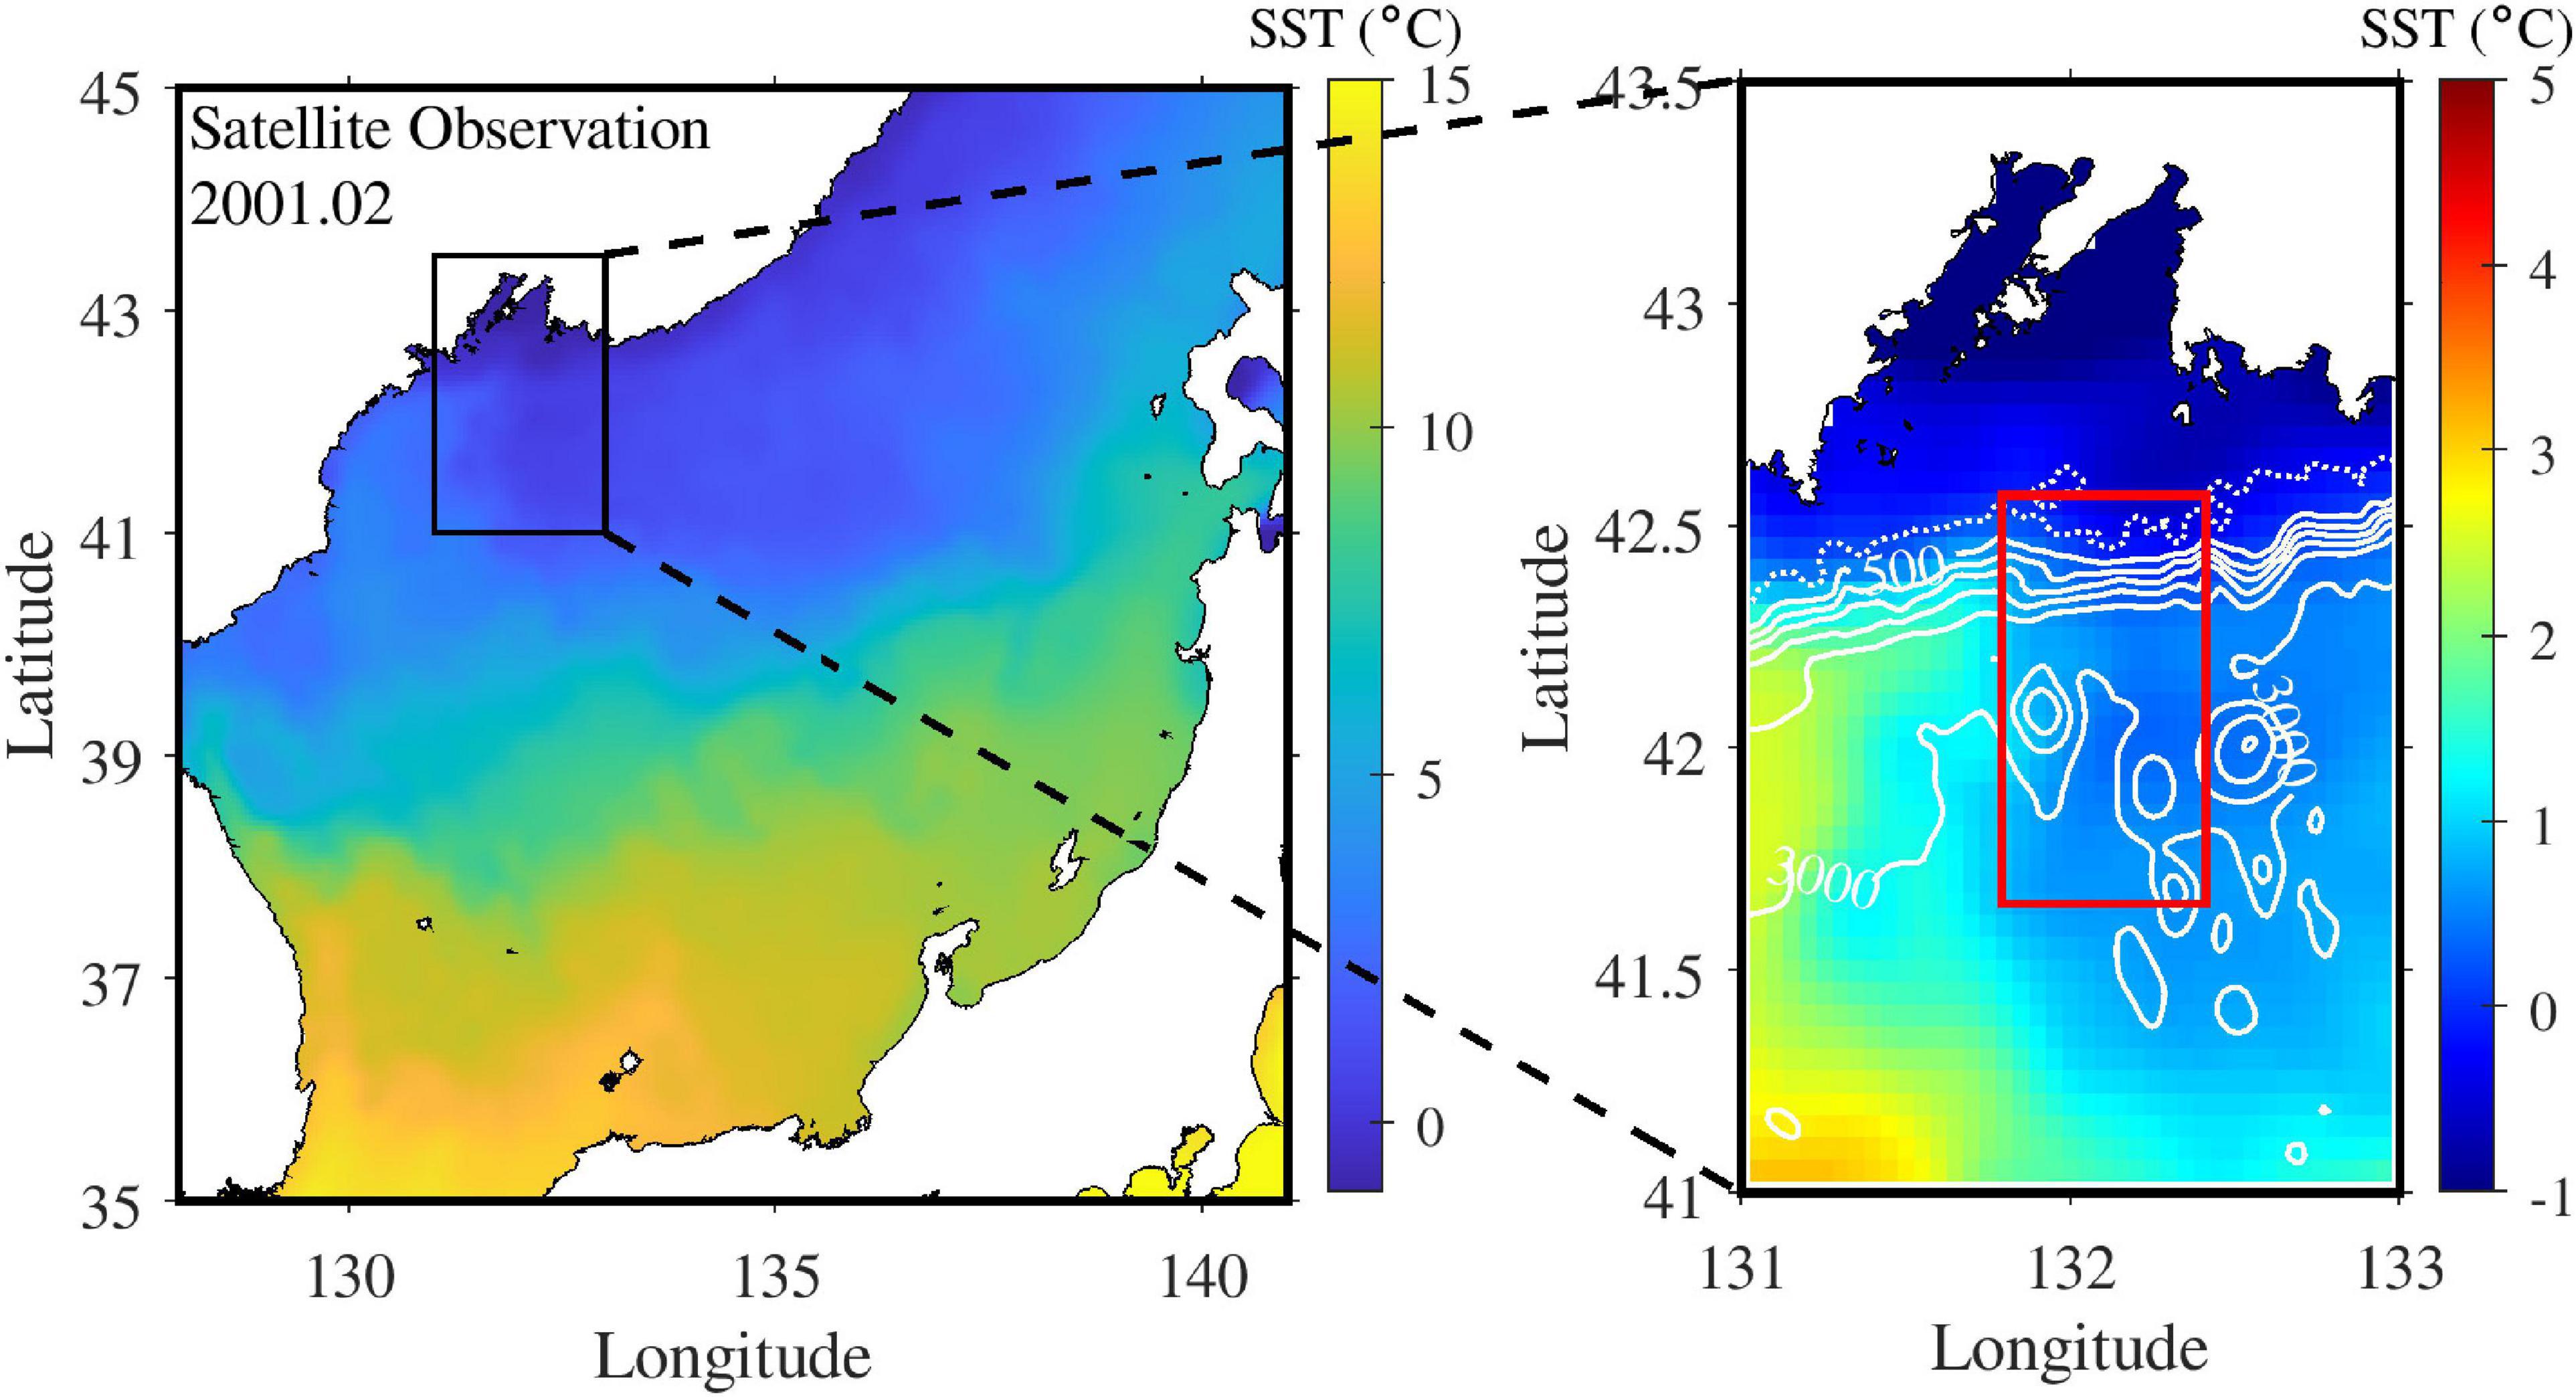
Figure 1. (Left panel) Sea surface temperature from satellite observation (OSTIA) in February 2001. (Right panel) Study area, including the continental shelf and slope south of Vladivostok. White solid lines represent isobaths. The model was idealized to mimic the actual topography inside the red rectangle in the right panel.
Tanaka and Akitomo (2000), based on two-dimensional numerical experiments assuming an idealized continental slope, suggested that the downslope flow of convected waters in the shelf is the bottom Ekman current; however, in actual ocean conditions, more complicated motions and processes, including baroclinic instability, can play important roles in slope convection (Whitehead, 1993; Gawarkiewicz and Chapman, 1995; Jiang and Garwood, 1995; Kikuchi et al., 1999). A streamtube model was utilized to investigate the deep water formation in the EJS (Tanaka, 2014).
A large-eddy simulation (LES) study with a fine three-dimensional grid can enhance our understanding of the actual deep water formation along the continental slope.
In this study, we used LES experiments for investigating the potential contributions of open-ocean and slope convections to water mass formation in the EJS. We quantitatively evaluated changes in slope convection according to the diverse topographies. We also examined the effects of brine rejection on the slope convection.
Materials and Methods
We performed numerical experiments using a parallelized large-eddy simulation model (PALM), first developed by Raasch and Schröter (2001). PALM solves filtered, non-hydrostatic, incompressible Navier–Stokes equations involving the Boussinesq approximation. The subgrid-scale terms in the governing equations are parameterized using a 1.5-order closure according to Deardorff (1980), albeit with minor changes (Moeng and Wyngaard, 1988; Saiki et al., 2000). The closure includes an additional prognostic quantity, i.e., the subgrid-scale turbulent kinetic energy. The parameterization of subgrid-scale turbulence is essential for a wide range of turbulent diffusion intensities around the deep convection region. PALM has been applied by studies investigating the oceanic deep convection (Raasch and Etling, 1998; Noh et al., 2003). For more details on PALM, we refer to Maronga et al. (2015).
For the simulation, we considered the simplified topography consisting of the continental shelf and slope south of Vladivostok (Figure 1, red rectangle). The model domain was 51.2 × 102.4 × 3.868 km, while the horizontal grid size was 100 × 100 m. The vertical grid size was 5 m in the upper 100 m from the sea surface; it was subsequently stretched by equal proportions for each of the following three depth segments: 100–200 and 200–1,000 m, and from 1,000 m to the bottom, where the vertical grid size reached 118.6 m. The x-, y-, and z-axis were directed eastward, northward, and upward, respectively, from the southwestern surface of the model domain. The horizontal boundary condition was periodic in the east and west but closed in the north and south. Potential temperature and salinity initializations were based on the respective observed average vertical profiles below 500 m depth (Talley et al., 2003, 2006). Temperature and salinity of the densest water observed near the sea surface during the CREAMS winter cruises from 1993 to 2015 were adopted regarding the mixed layer profile from the surface to 150 m depth (Figure 2; Kim et al., 2004). Temperature and salinity were interpolated between the 150 and 500 m depth, while their initial fields were assumed to be horizontally homogeneous at each depth. The tracer concentration was initially set to one within the first 100 m depth; its evolution was determined by the advection and diffusion process.
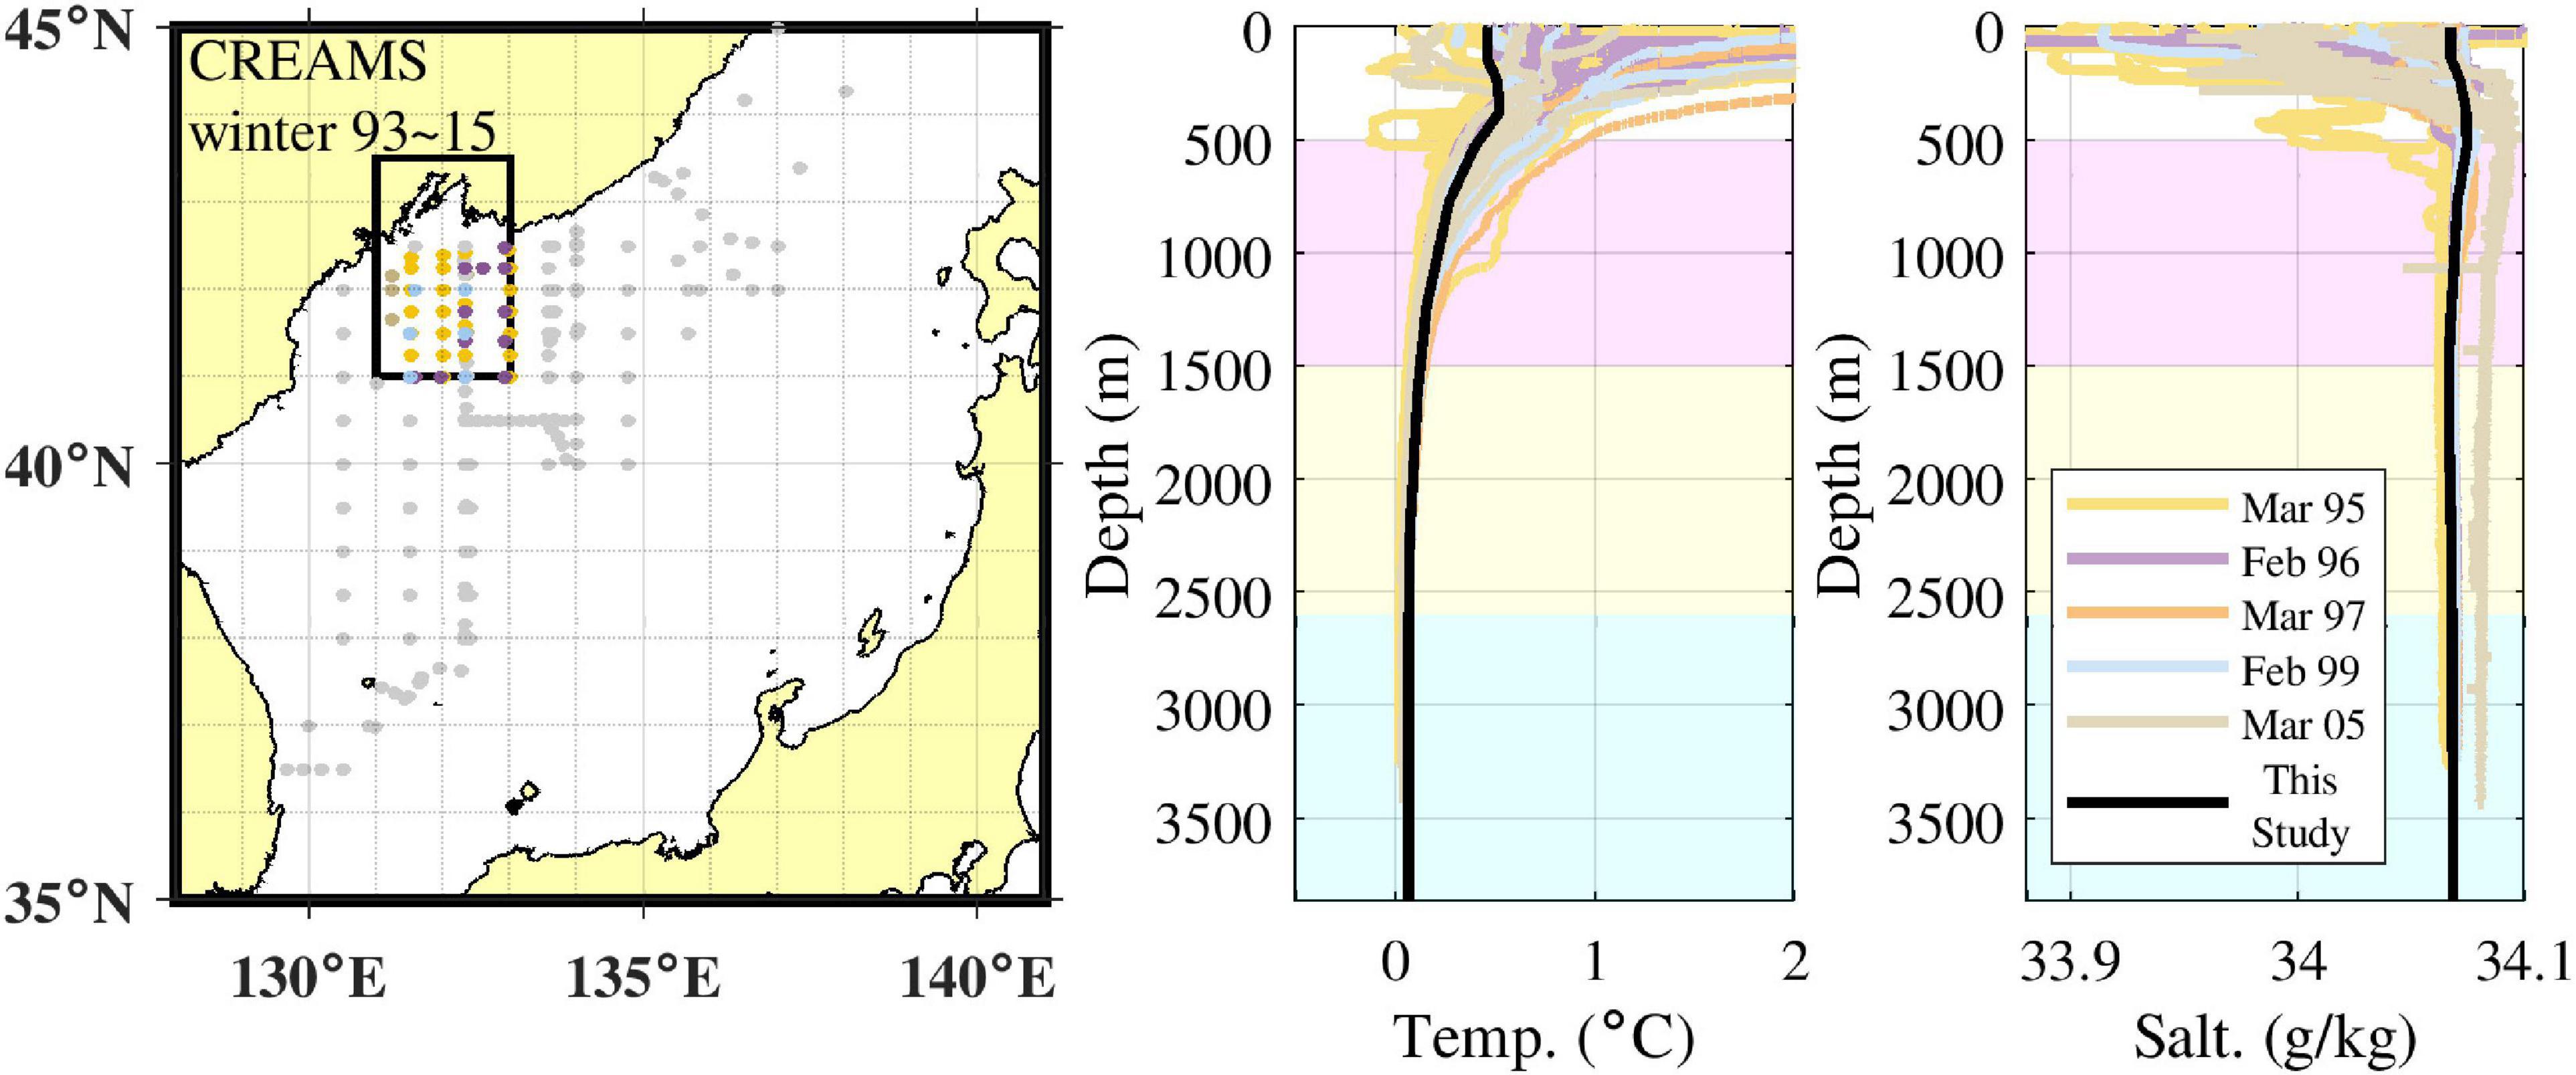
Figure 2. (Left panel) CTD stations south of Vladivostok during the CREAMS winter cruises from 1993 to 2015 (colored dots). (Right panels) Colored lines represent vertical potential temperature and salinity profiles during each CREAMS cruise. Black solid lines are potential temperature and salinity profiles selected for numerical experiment initialization. Background colors represent the water masses in the EJS based on Kim et al. (2004) (magenta: CW, yellow: DW, cyan: BW).
The net surface heat flux imposed for the cooling was 200 W m–2 for 20 days and was based on the winter 2001 average net heat flux of the ECMWF reanalysis data (Hersbach et al., 2020), although some studies reported increased surface heat loss (400–750 W m–2; Kawamura and Wu, 1998; Talley et al., 2003). The net surface heat flux was uniform and constant throughout the experimental period. In our simulation, surface cooling generated distributed convection, similar to the convective boundary layer, rather than localized convection (Noh et al., 2003). The wind stress and salinity flux were set to zero at the surface. Bottom-boundary conditions included zero heat and salinity fluxes and no-slip condition for horizontal velocities.
In general, open-ocean deep convection refers to localized convection, where strong cooling occurs at the surface of the preconditioned ocean. Slope convection refers to the sinking of dense salty water along the continental shelf-slope. These two types of deep convection occur in distinct places driven by different physical processes (Killworth, 1983). The primary purpose of this study was to compare the convection of the continental shelf and slope area and the open-ocean area under the conditions corresponding to the deep convection south of Vladivostok.
We investigated the effect of topographical features on the evolution of deep convection by assuming diverse topographies in the simulation: The deep flat-bottom (i.e., open ocean; OO) topography was used for simulating the open-ocean convection (Figure 3A). The shelf and control slope (SCS) topography, which was used for simulating slope convection, approximated the topography of the sea south of Vladivostok, and had a continental shelf 100 m deep at the north, which was connected to the seafloor at 3,868 m depth by a continental slope of 0.2 inclination (Figure 3B); the continental slope was inclined in the north–south direction. The no-shelf (NS) topography had a continental slope of 0.2 inclination, but no continental shelf (Figure 3C). The gentle slope (SGS), steep slope (SSS), and cliff (SC) with shelf topographies were used for investigating the effect of the continental-slope inclination (i.e., 0.1, 0.4, and 9.4, respectively) on slope convection (Figures 3D–F).
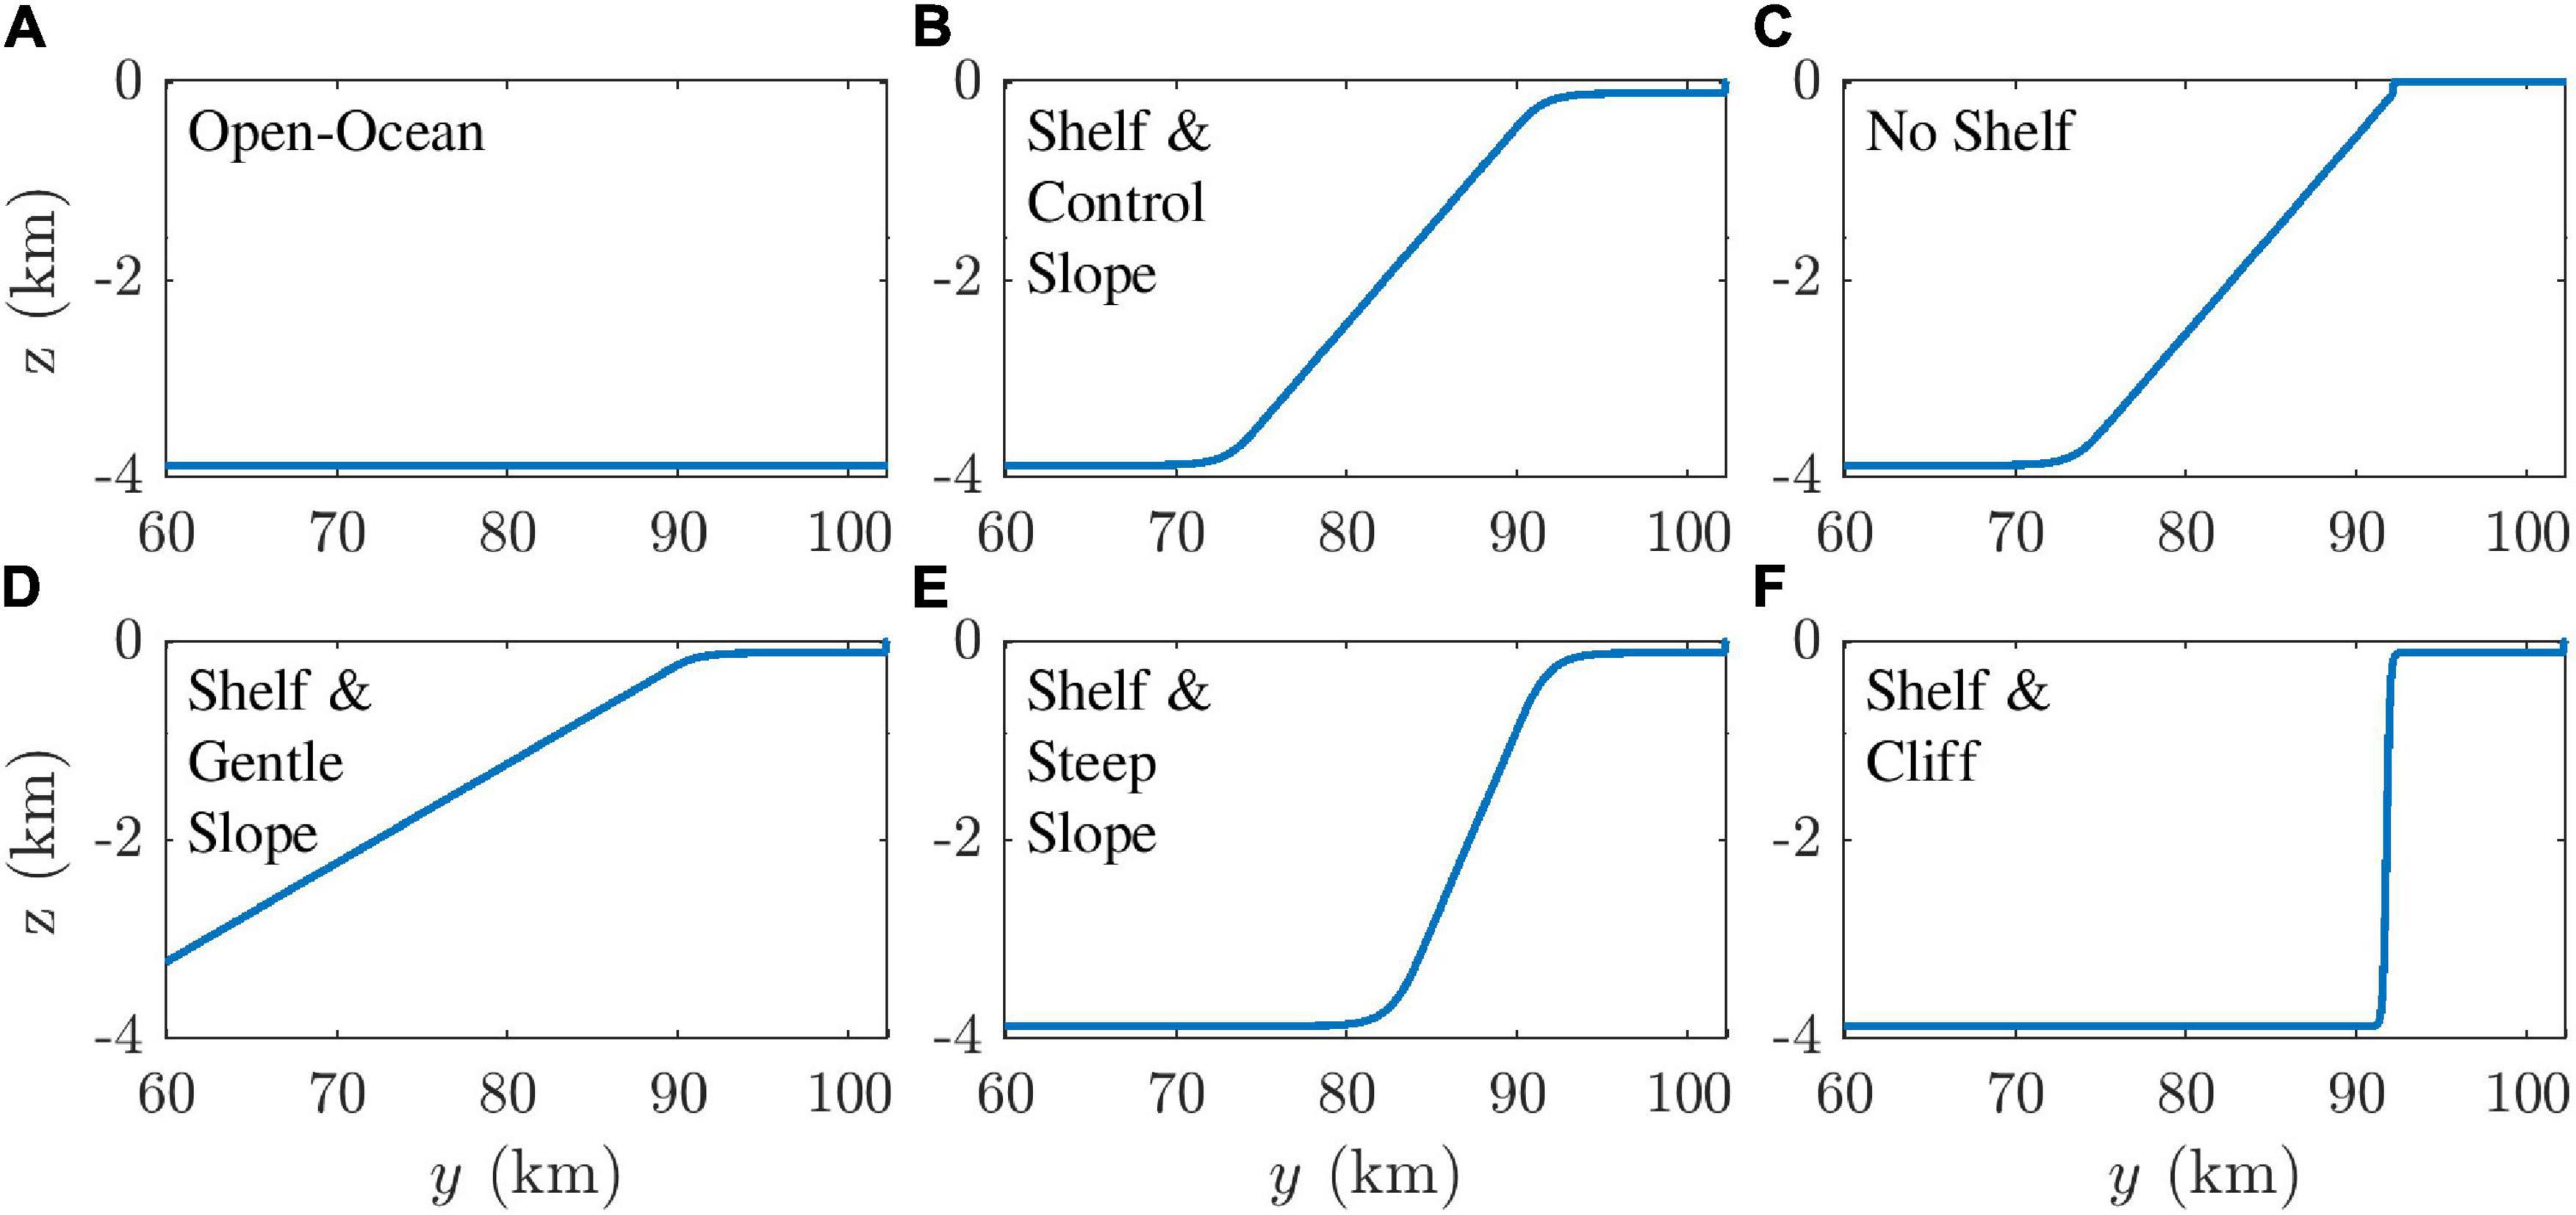
Figure 3. Side view of model topographies: (A) open ocean (OO), (B) shelf and control slope (SCS), (C) no shelf (NS), and shelf with (D) gentle slope (SGS), (E) steep slope (SSS), and (F) cliff (SC). Plots are confined to y ≥ 60 km.
We conducted the brine rejection (BR) experiment, in which only the brine-rejection condition was added to the SCS experiment. The surface salinity flux was set to 4.318 × 10⁻³ g s–1 m–2 in the inner half of the shelf area, assuming a 1.3 cm daily ice growth (Cox and Weeks, 1974), which is 10% of the observed ice growth in the Okhotsk Sea, i.e., more than 500 km north of our study area (Shcherbina et al., 2003). The ice-growth rate in the Okhotsk Sea was estimated from the steep salinity increase over 35 days from January to February 2000.
Open-Ocean and Slope Convections
Convection Evolution
Vertical cross sections and zonal-mean sections of potential temperature and tracer concentration from the OO experiment (Figures 4A–D) revealed a typical open-ocean convection pattern with mixed-layer deepening, which is similar to the convection depth in earlier studies (Denbo and Skyllingstad, 1996; Marshall and Schott, 1999; Noh et al., 1999). The depth of the mixed layer was estimated from the tracer distribution. After 20 days, the thickness of the mixed layer increased from 150 to 700 m, while the potential temperature of the mixed layer was less than 0.325°C as a result of cooling and mixing. Convective eddies were generated over the entire model domain until they were blocked by stably stratified water at the mixed layer base. This convection causes the mixed layer depth (MLD) to increase with the entrainment of lower cold water (Figure 4A).
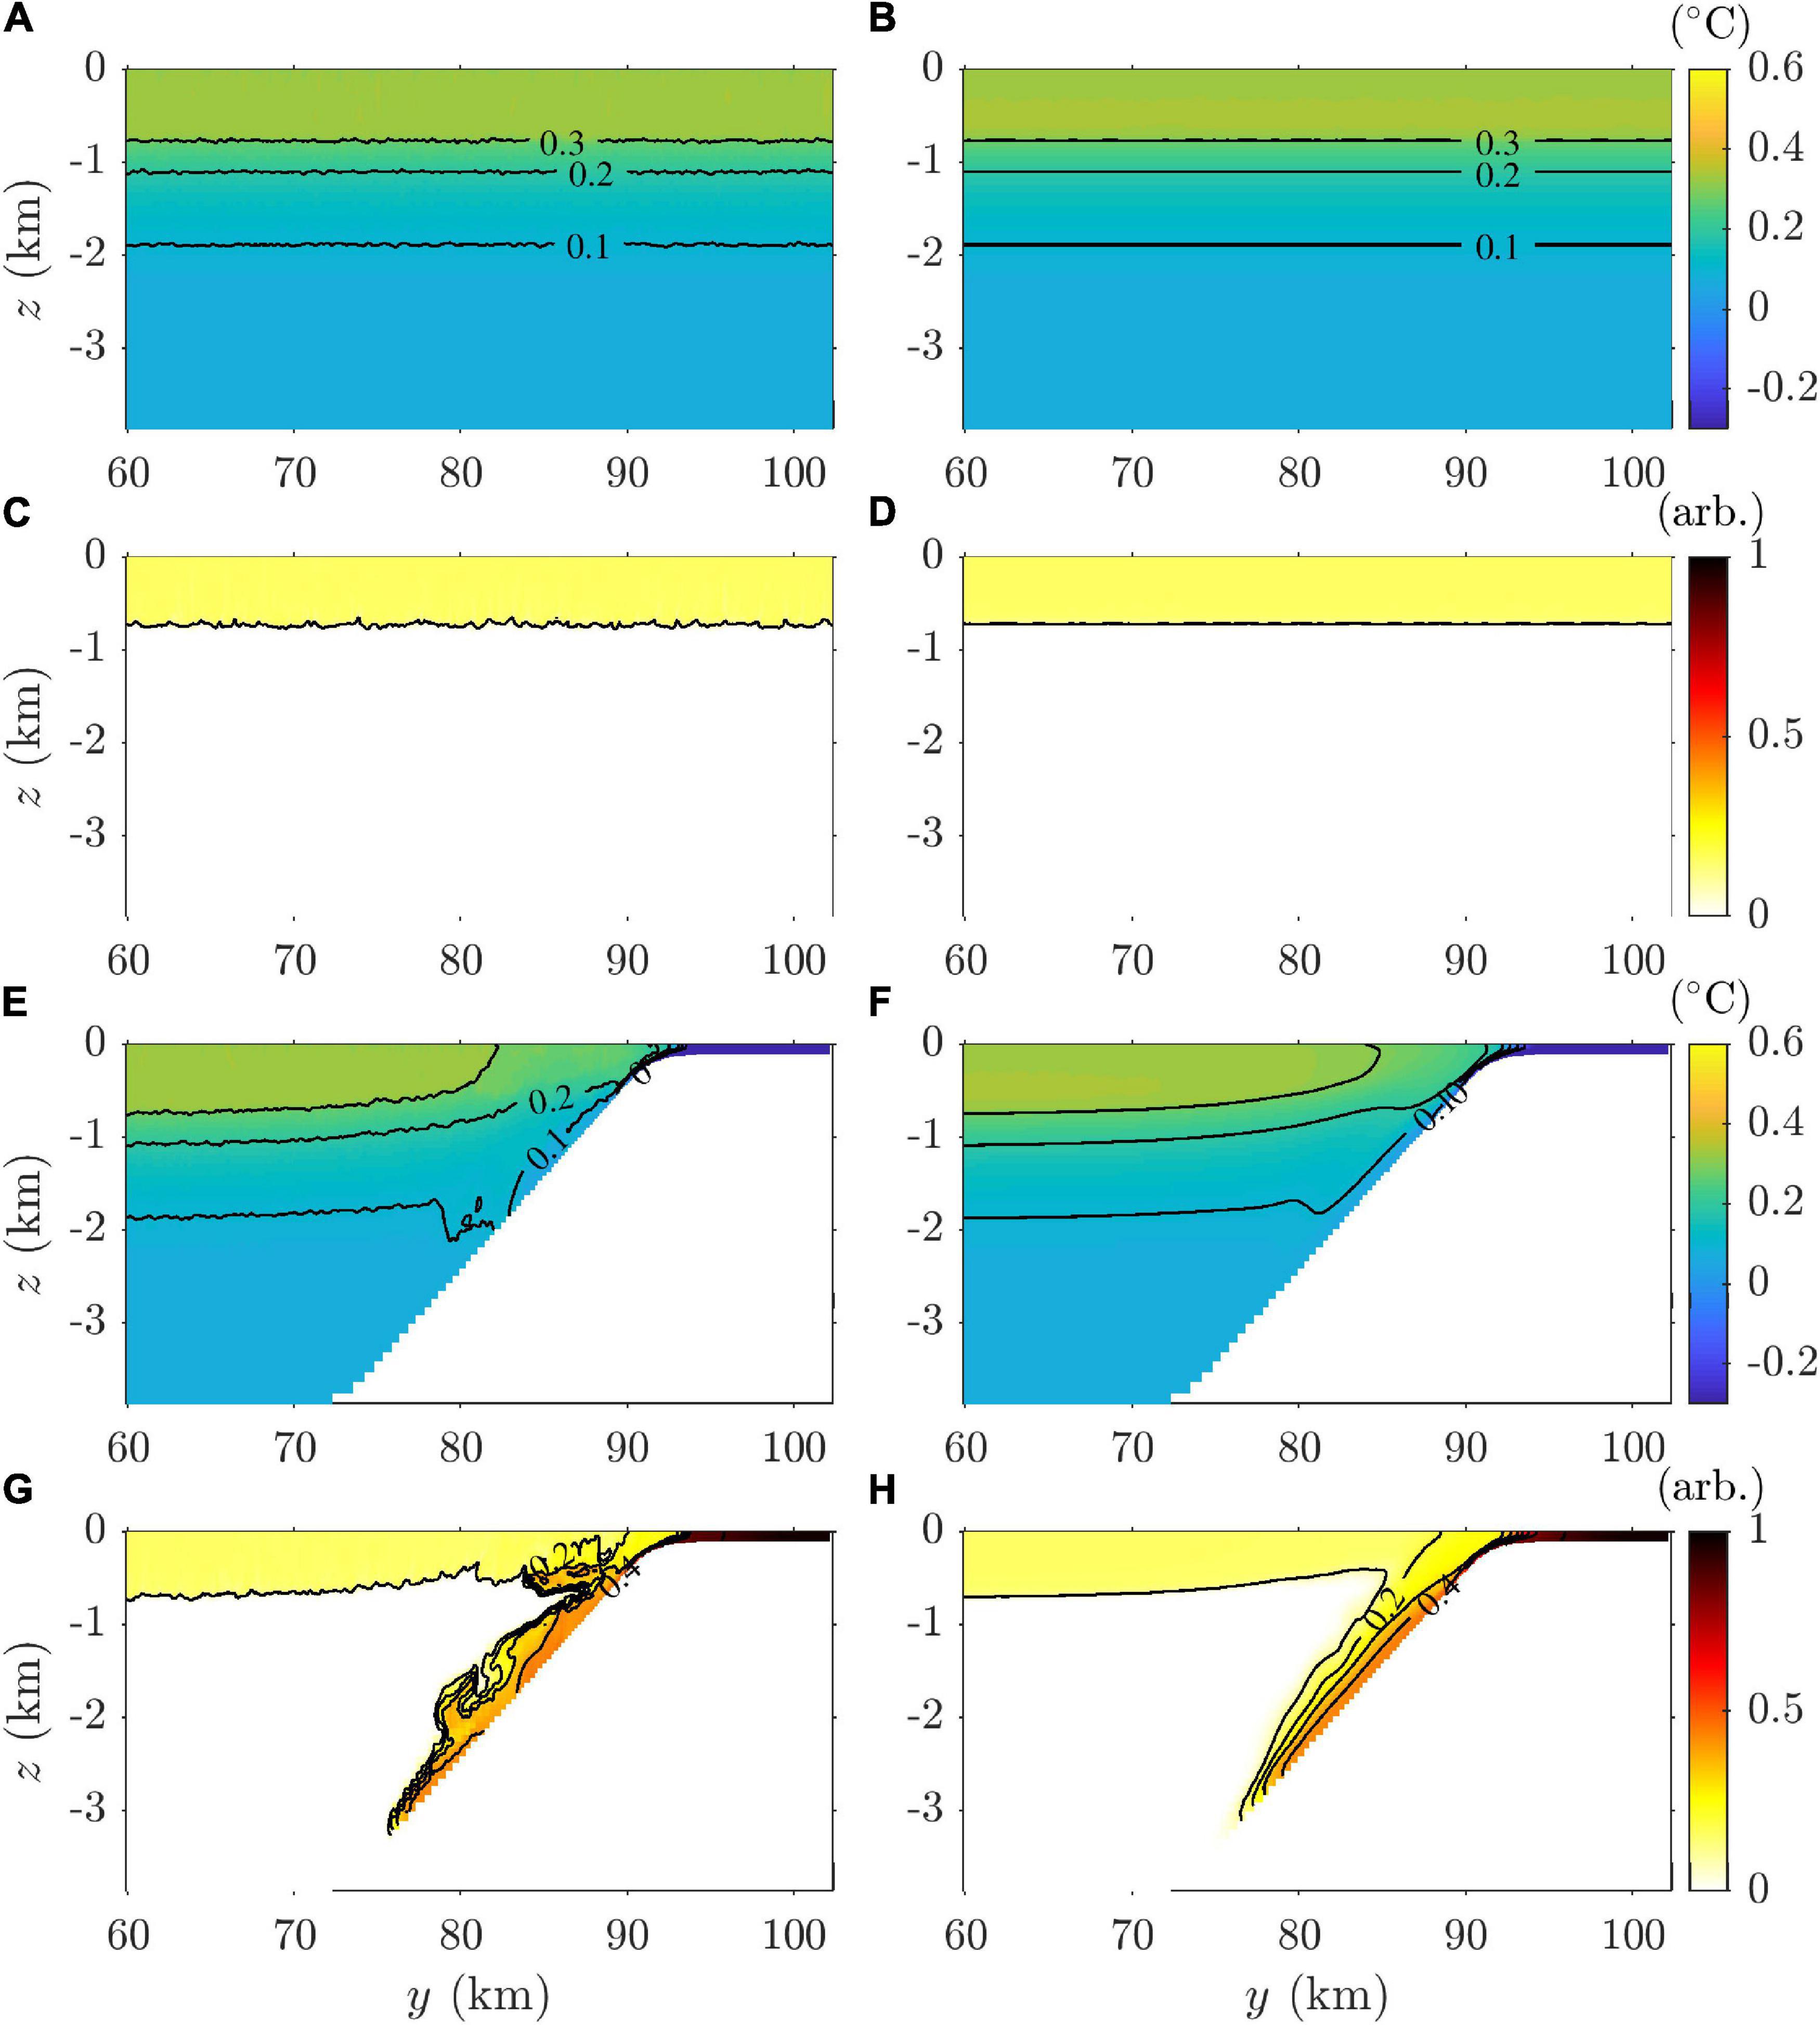
Figure 4. Meridional sections of the (A,B,E,F) potential temperature and (C,D,G,H) tracer concentration from the (A–D) OO and (E–H) SCS experiments. Left panels (A,C,E,G) are cross-sections at x = 25.6 km at the end step of day 20, and right panels (B,D,F,H) are zonally and temporally averaged values on day 20.
In the SCS experiment (Figures 4E–H), compared to the OO experiment, the water temperature on the shallow continental shelf decreased rapidly due to cooling, which is consistent with the observations (Figure 1). The rapid cooling on the shelf was due to the smaller volume affected by surface cooling. After 3 days, a downslope flow was initiated from the shelf break because of the density gradient. Along the continental slope, the tracer reached 3,200 m depth on day 20 and was spread by the large-scale turbulent structure in the middle (Figure 4G). A certain amount of surface water was supplied to the homogeneous bottom layer below 2,700 m after 20 days (Figure 4H).
The convection depths of the OO and SCS experiments were compared over time (Figure 5). We defined convection depth as the maximum depth with tracer concentrations higher than 0.1 and convective-plume head as the water volume at the convection depth. In the OO experiment, the convection depth was equivalent to the MLD.
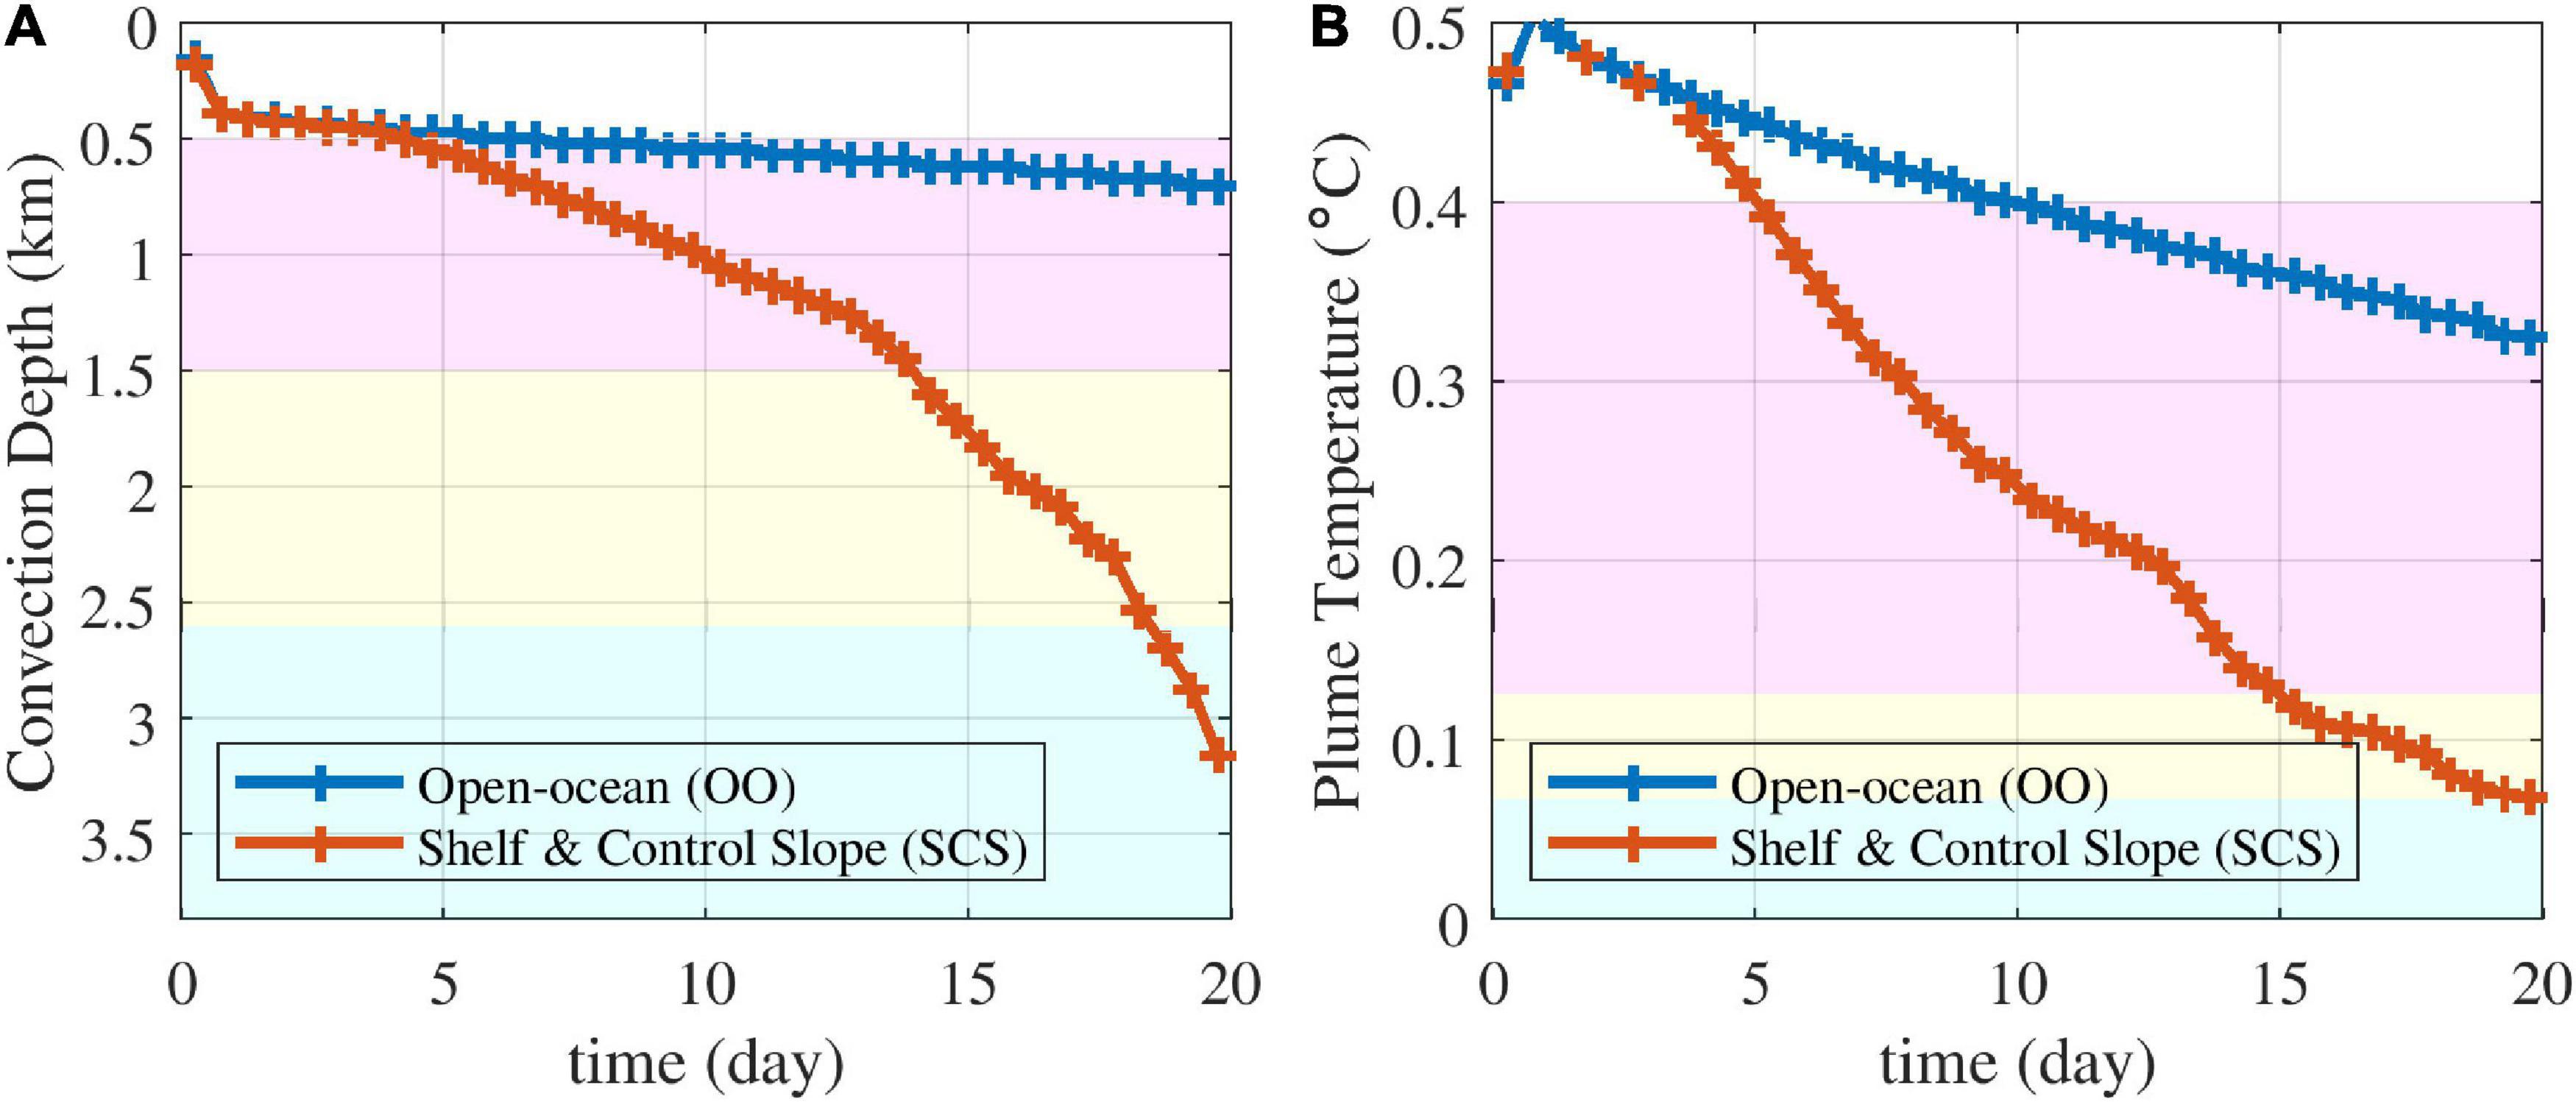
Figure 5. (A) Depth and (B) potential temperature of the convective-plume head with time in the OO and SCS experiments. Background colors represent the range of water masses in the EJS based on Kim et al. (2004) (magenta: CW, yellow: DW, cyan: BW).
In the OO experiment, the convection depths were 540, 620, and 700 m on days 10, 15, and 20, respectively (Figure 5A). Noh et al. (1999) reported that open-ocean convection with 250 W m–2 cooling leads to approximately 500 and 800 m penetration depth after 2 and 8 days, respectively. Denbo and Skyllingstad (1996) showed that 300 W m–2 cooling resulted in approximately 500 and 730 m convection depth after 1 and 5 days, respectively. Given the different initial stratification in our OO experiment, these earlier results of deepening rates are comparable to ours.
In the SCS experiment, a convective plume penetrated as the density of the plume was greater than that of the background water. The density stratification of the background water decreased with depth and was homogeneous below 2,700 m depth, i.e., the boundary between the DW and BW. The deepening rate of convection increased with depth because of the stratification weakening in the DW layer. Convective plume entering the BW layer could easily reach the bottom because of the homogeneous BW density.
In the OO experiment, the potential temperature of the convective mixed layer base was 0.401 and 0.325°C on day 10 and 20, respectively. The depth and properties of the convected water were within the CW range after 10 days (Figure 5). In the SCS experiment, the properties of the convected water were the same as those of the DW and BW after 15 and 19 days, respectively (Figure 5B).
Although it has been suggested that brine rejection plays an important role regarding the ventilation at the continental slope (Talley et al., 2003), our results suggest that the density increase due to cooling without brine rejection allows the BW formation. Two types of convective water at the continental slope observed by Lobanov et al. (2002) showed lower and higher salinity than that of the BW, respectively (Figure 2). The increasing and decreasing salinity caused by brine rejection and ice melting might accelerate or decelerate deep convection, respectively.
Horizontal Distributions of Vertical Velocity
The horizontal distributions of vertical velocity at 60 m depth at the end of day 20 in the OO and SCS experiments are presented in Figure 6. In the OO experiment, the size of convective plumes did not vary with the distance from the coast, but in the SCS experiment, the size of the plumes increased near the shelf break (i.e., 82.2 < y < 92.2 km).
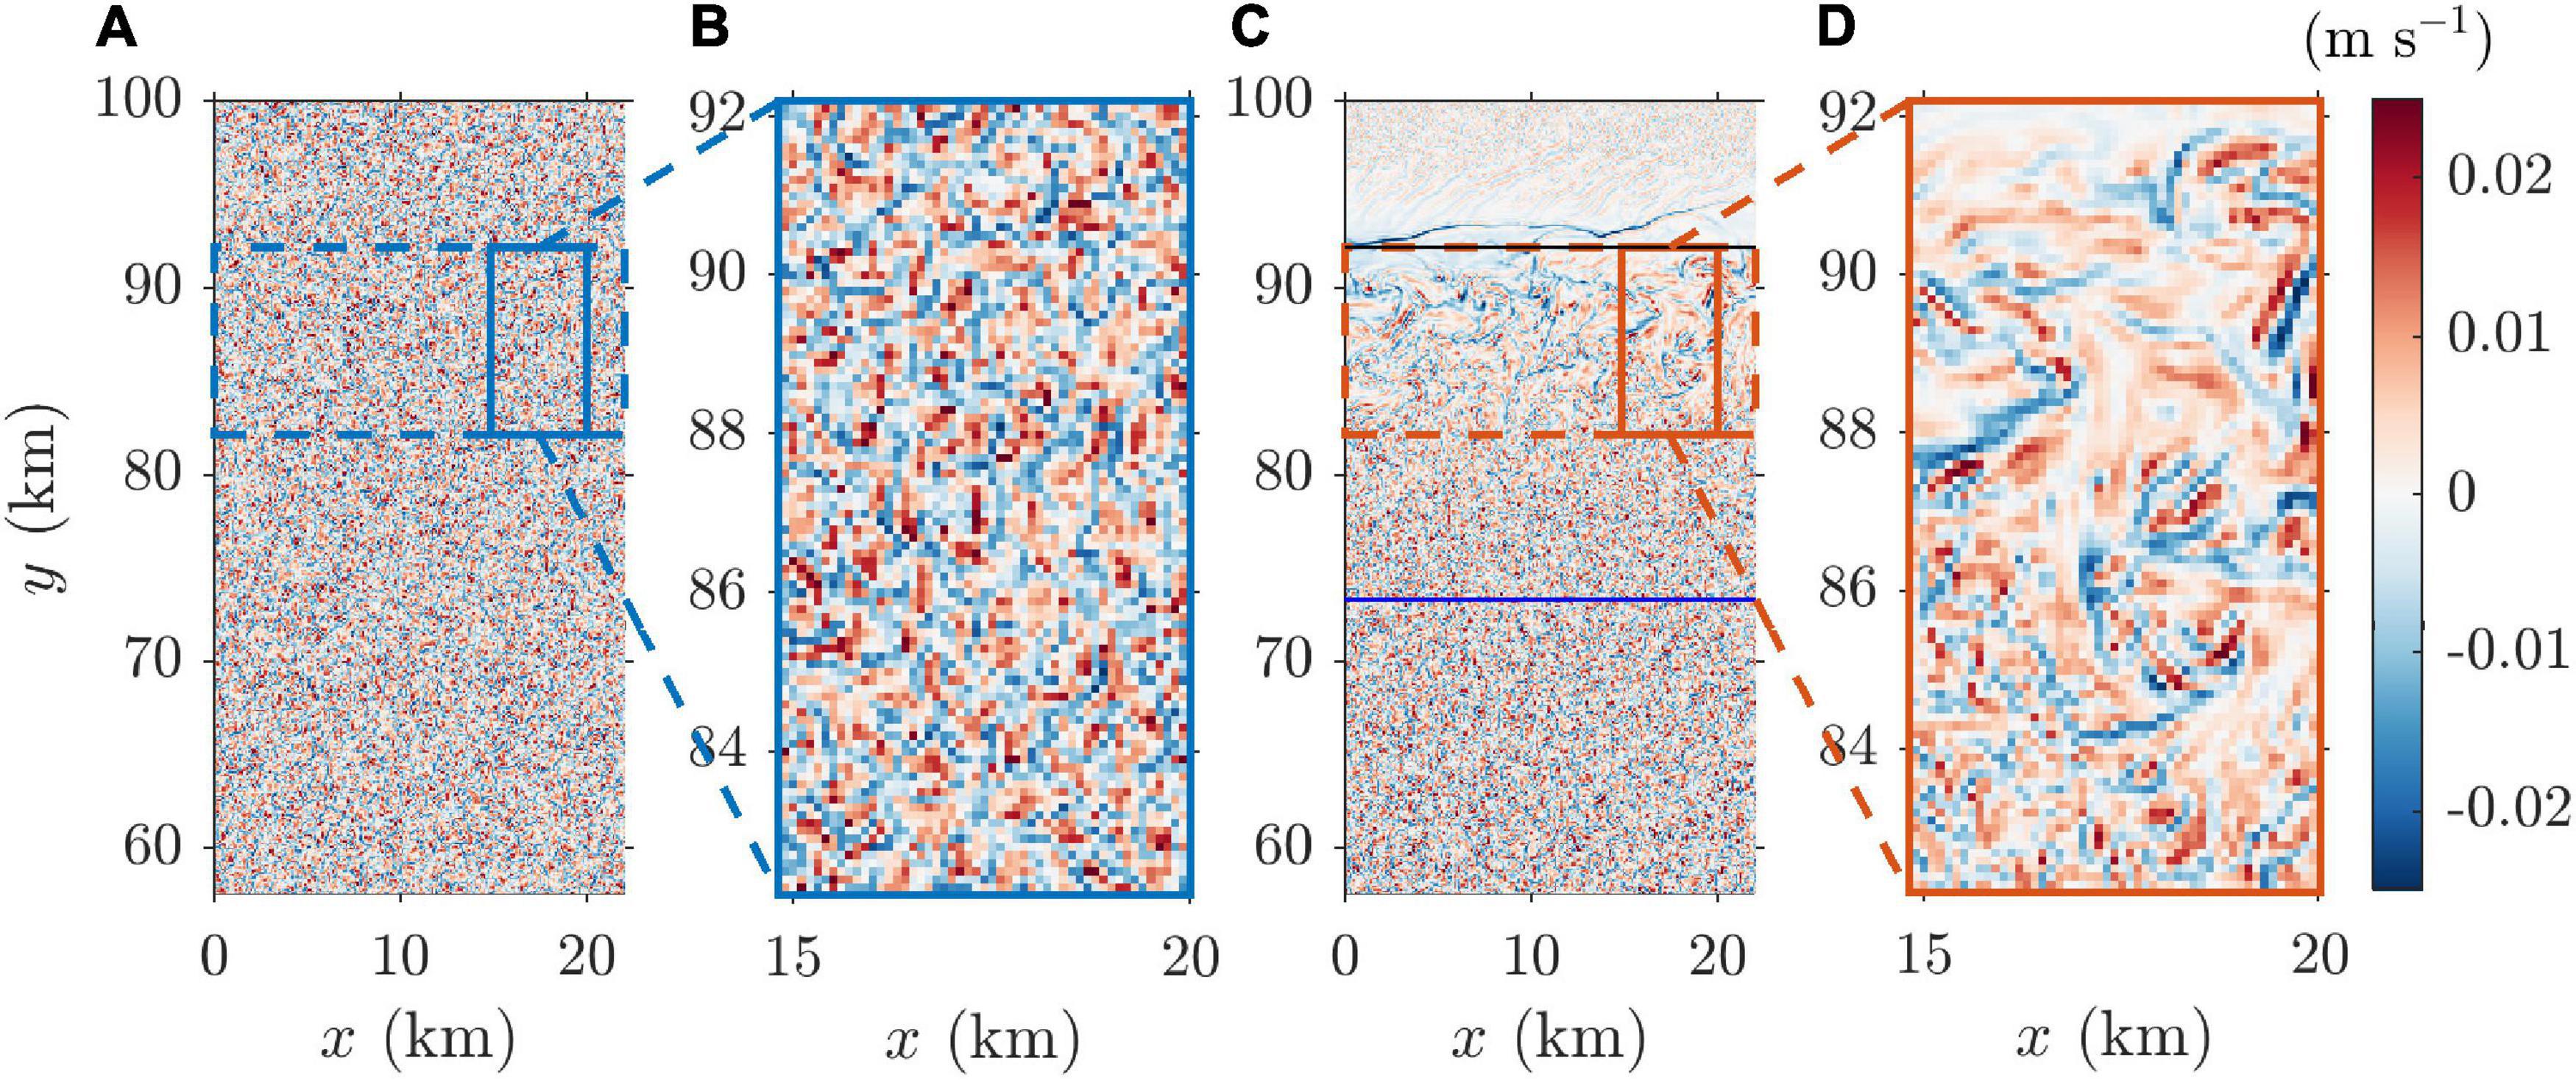
Figure 6. Horizontal distribution of vertical velocity at z = −60 m after 20 days of cooling in the (A,B) OO and (C,D) SCS experiments. The blue and black solid lines in (C) are the lower and upper boundaries of the continental slope, respectively.
The vertical velocity spectra were compared in the region indicated by the dashed box in Figure 6, which corresponds to the upper region of the slope in the SCS experiment (Figure 7). In the OO experiment, the power spectrum of the vertical velocity was concentrated in the 500–700 m horizontal wavelength range, which is consistent with earlier studies on open-ocean convection (Denbo and Skyllingstad, 1996; Pal and Chalamalla, 2020).
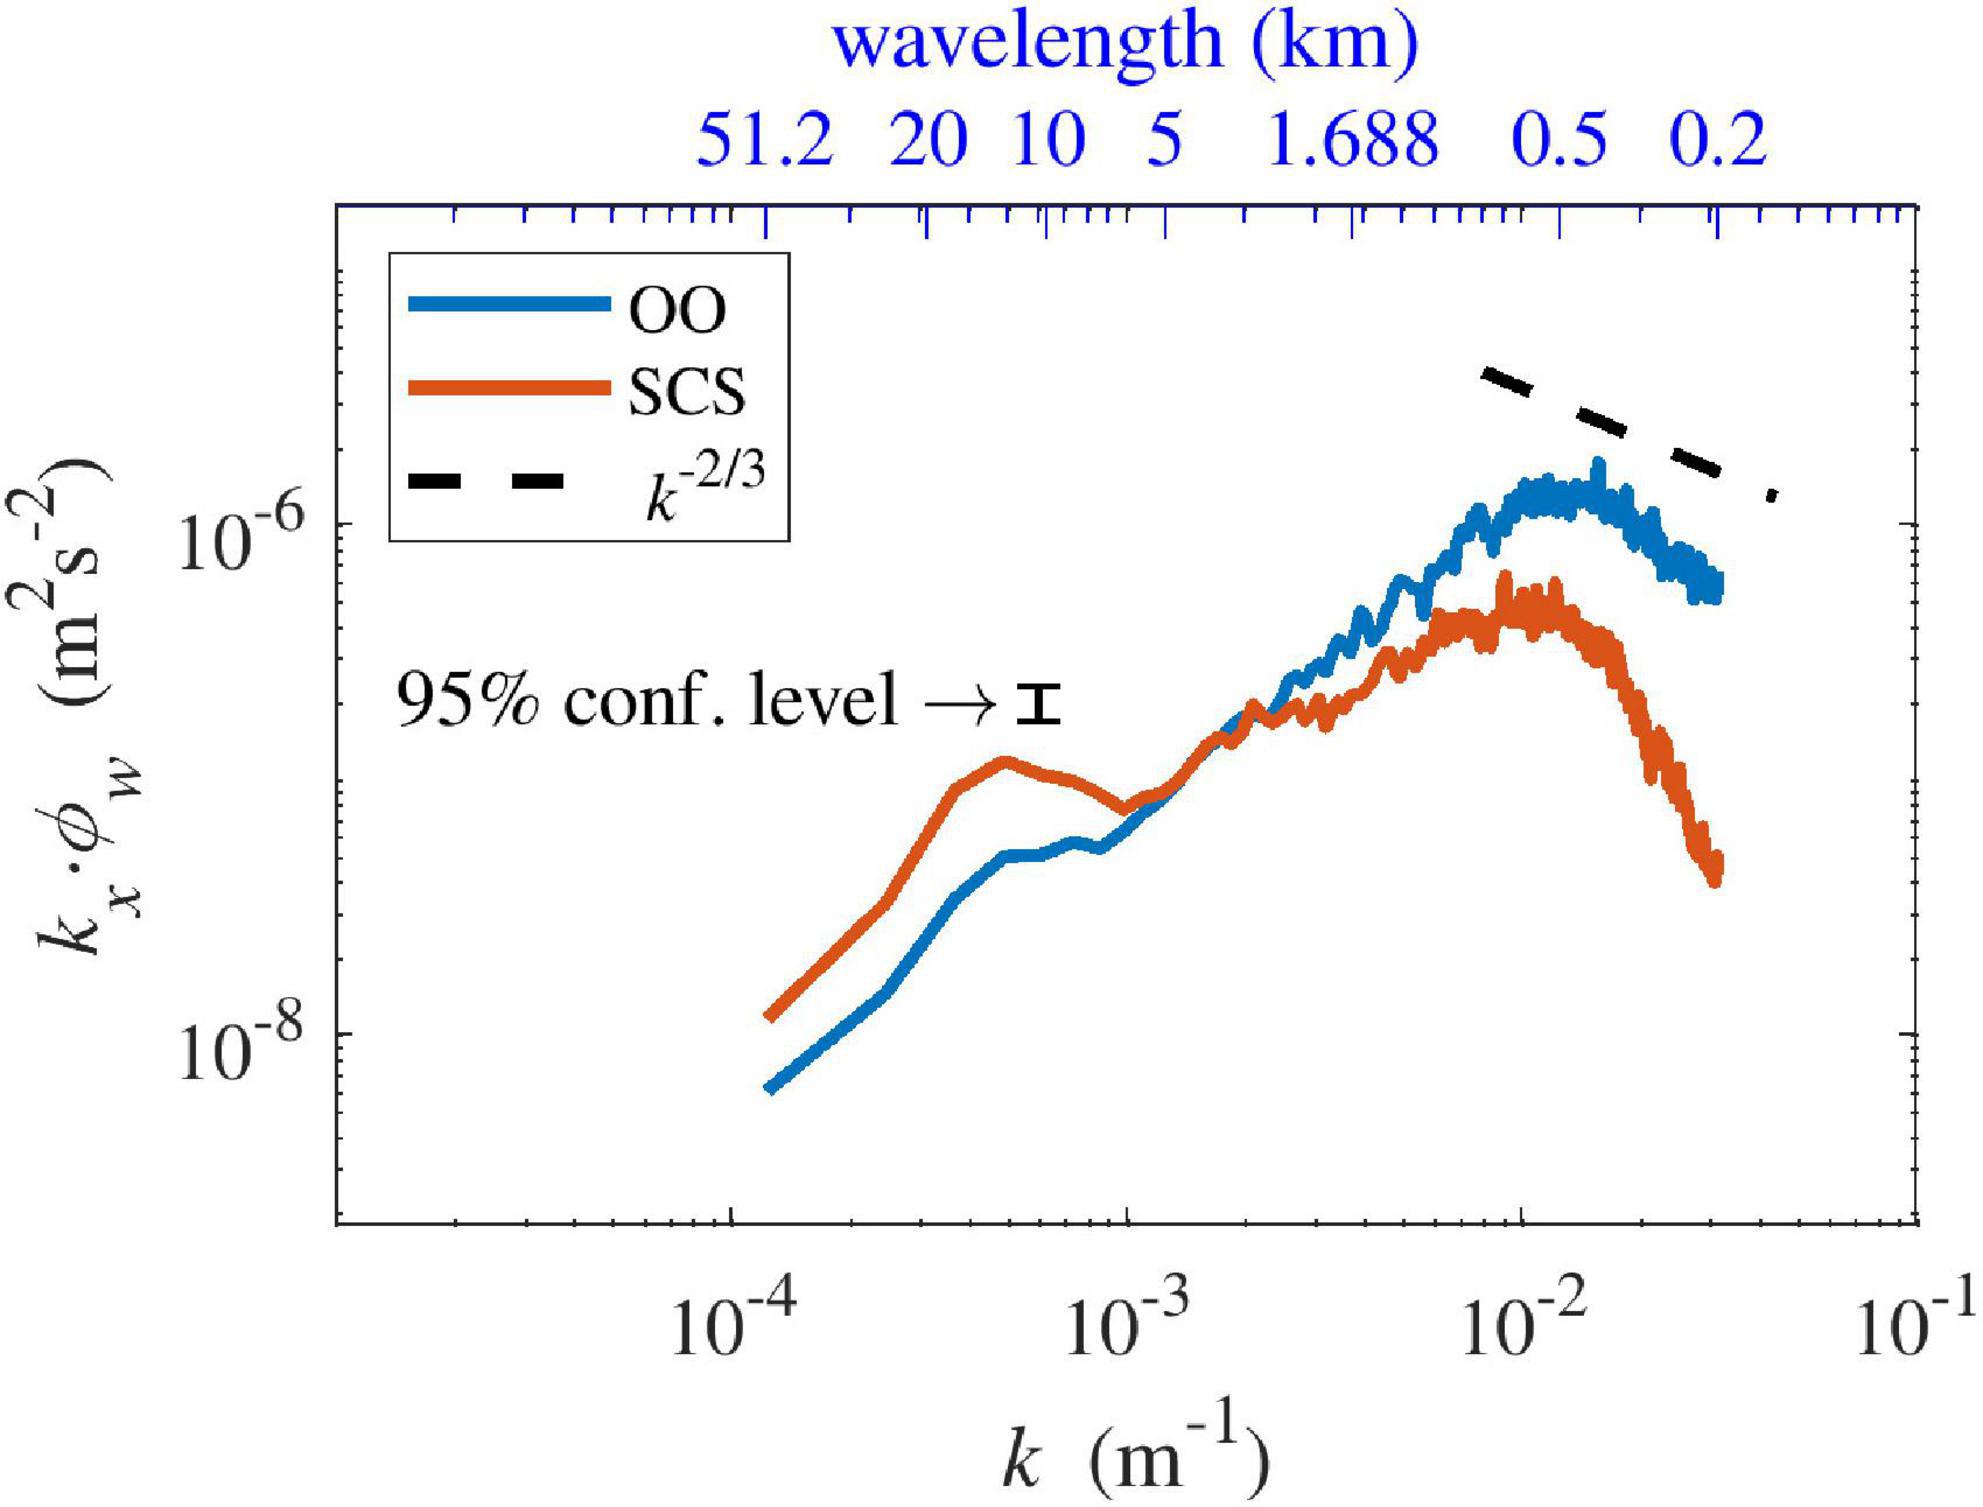
Figure 7. Horizontal wavenumber spectra of vertical velocity at z = −60 m in the OO (blue) and SCS (orange) experiments in the dashed blue and orange boxes of Figure 6, respectively.
According to Pal and Chalamalla (2020), the wavelength can be estimated using the plume diameter formula of Rayleigh–Bénard convection as follows:
where C is an empirical constant equal to 73.7, κt is the thermal diffusivity, and B0 is the surface buoyancy flux. The estimated wavelength using our simulation parameters was approximately 844 m, which is comparable to that of the spectral analysis.
According to Denbo and Skyllingstad (1996), open-ocean convection spectra have a peak at a wavelength of about 0.7–1.0 times the mixed layer depth. In the OO experiment, the ratio between the wavelength and the mixed layer depth was also approximately 0.7–1.0.
In the SCS experiment, the length scale of the convective eddies in the open ocean was the same as that in the OO experiment, but increased in the upper region of the slope (i.e., 82.2 < y < 92.2 km), where the vertical velocity power spectrum revealed a significant second peak, approximately 2.5 times larger than that in the open ocean, at about 4 km (Figure 7). The large-scale convective plumes might result from the baroclinic instability between the cold shelf water and warm open-ocean water over the upper area of the continental slope, where a strong geostrophic current exists (Whitehead, 1993; Gawarkiewicz and Chapman, 1995; Jiang and Garwood, 1995; Kikuchi et al., 1999).
Meridional Sections of Zonal-Mean Velocity
The mean vertical velocities in the OO experiment were zero. In contrast, in the SCS experiment, the plume on the continental slope exhibited a mean current. The dense water from the shelf flowed downward along the slope because of the density difference on day 10 (Figure 8A); the slope current became faster than 10 cm s–1 on day 20. A compensating flow over the slope current was formed simultaneously (Figure 8B). The overall flow structure and magnitude of the slope current were consistent with those in earlier studies (Tanaka and Akitomo, 2000).

Figure 8. Meridional sections of zonally averaged velocity vectors (A) after 10 and (B) 20 days in the SCS experiment. Vertical exaggeration of the velocity vector is 5.57.
The downward slope current can be regarded as an inclined plume in a rotating frame, which occurs at the bottom boundary layer where the bottom friction, buoyancy, and Coriolis forces balance (Ellison and Turner, 1959; Turner, 1973). The meridional and vertical velocities (v, w) were transformed into tangential and normal velocities to the slope (vt, vn). The mean meridional velocity down the slope (Vt) and the plume thickness (h) were estimated using the following integrals:
where xn is the independent variable in the direction normal to the slope. We also calculated the mean zonal velocity U and reduced gravity g′ by averaging the values within the inclined plume as follows:
where u is the zonal velocity, ρa is the ambient water density, and ρ is the density of the plume.
The estimated plume thicknesses from the model results on day 20 were 84, 112, and 74 m at the upper, middle, and lower parts of the convective plume, respectively (i.e., at y = 90, 85, and 80 km, respectively; Figure 9). Based on the plume thicknesses, calculated U was 8.2, 13.2, and 7.4 cm s–1, Vt was 8.6, 7.7, and 7.5 cm s–1, and g′ was 8.8 × 10⁻³, 2.4 × 10⁻³, and 4.6 × 10⁻⁴ m s–2 at y = 90, 85, and 80 km, respectively.
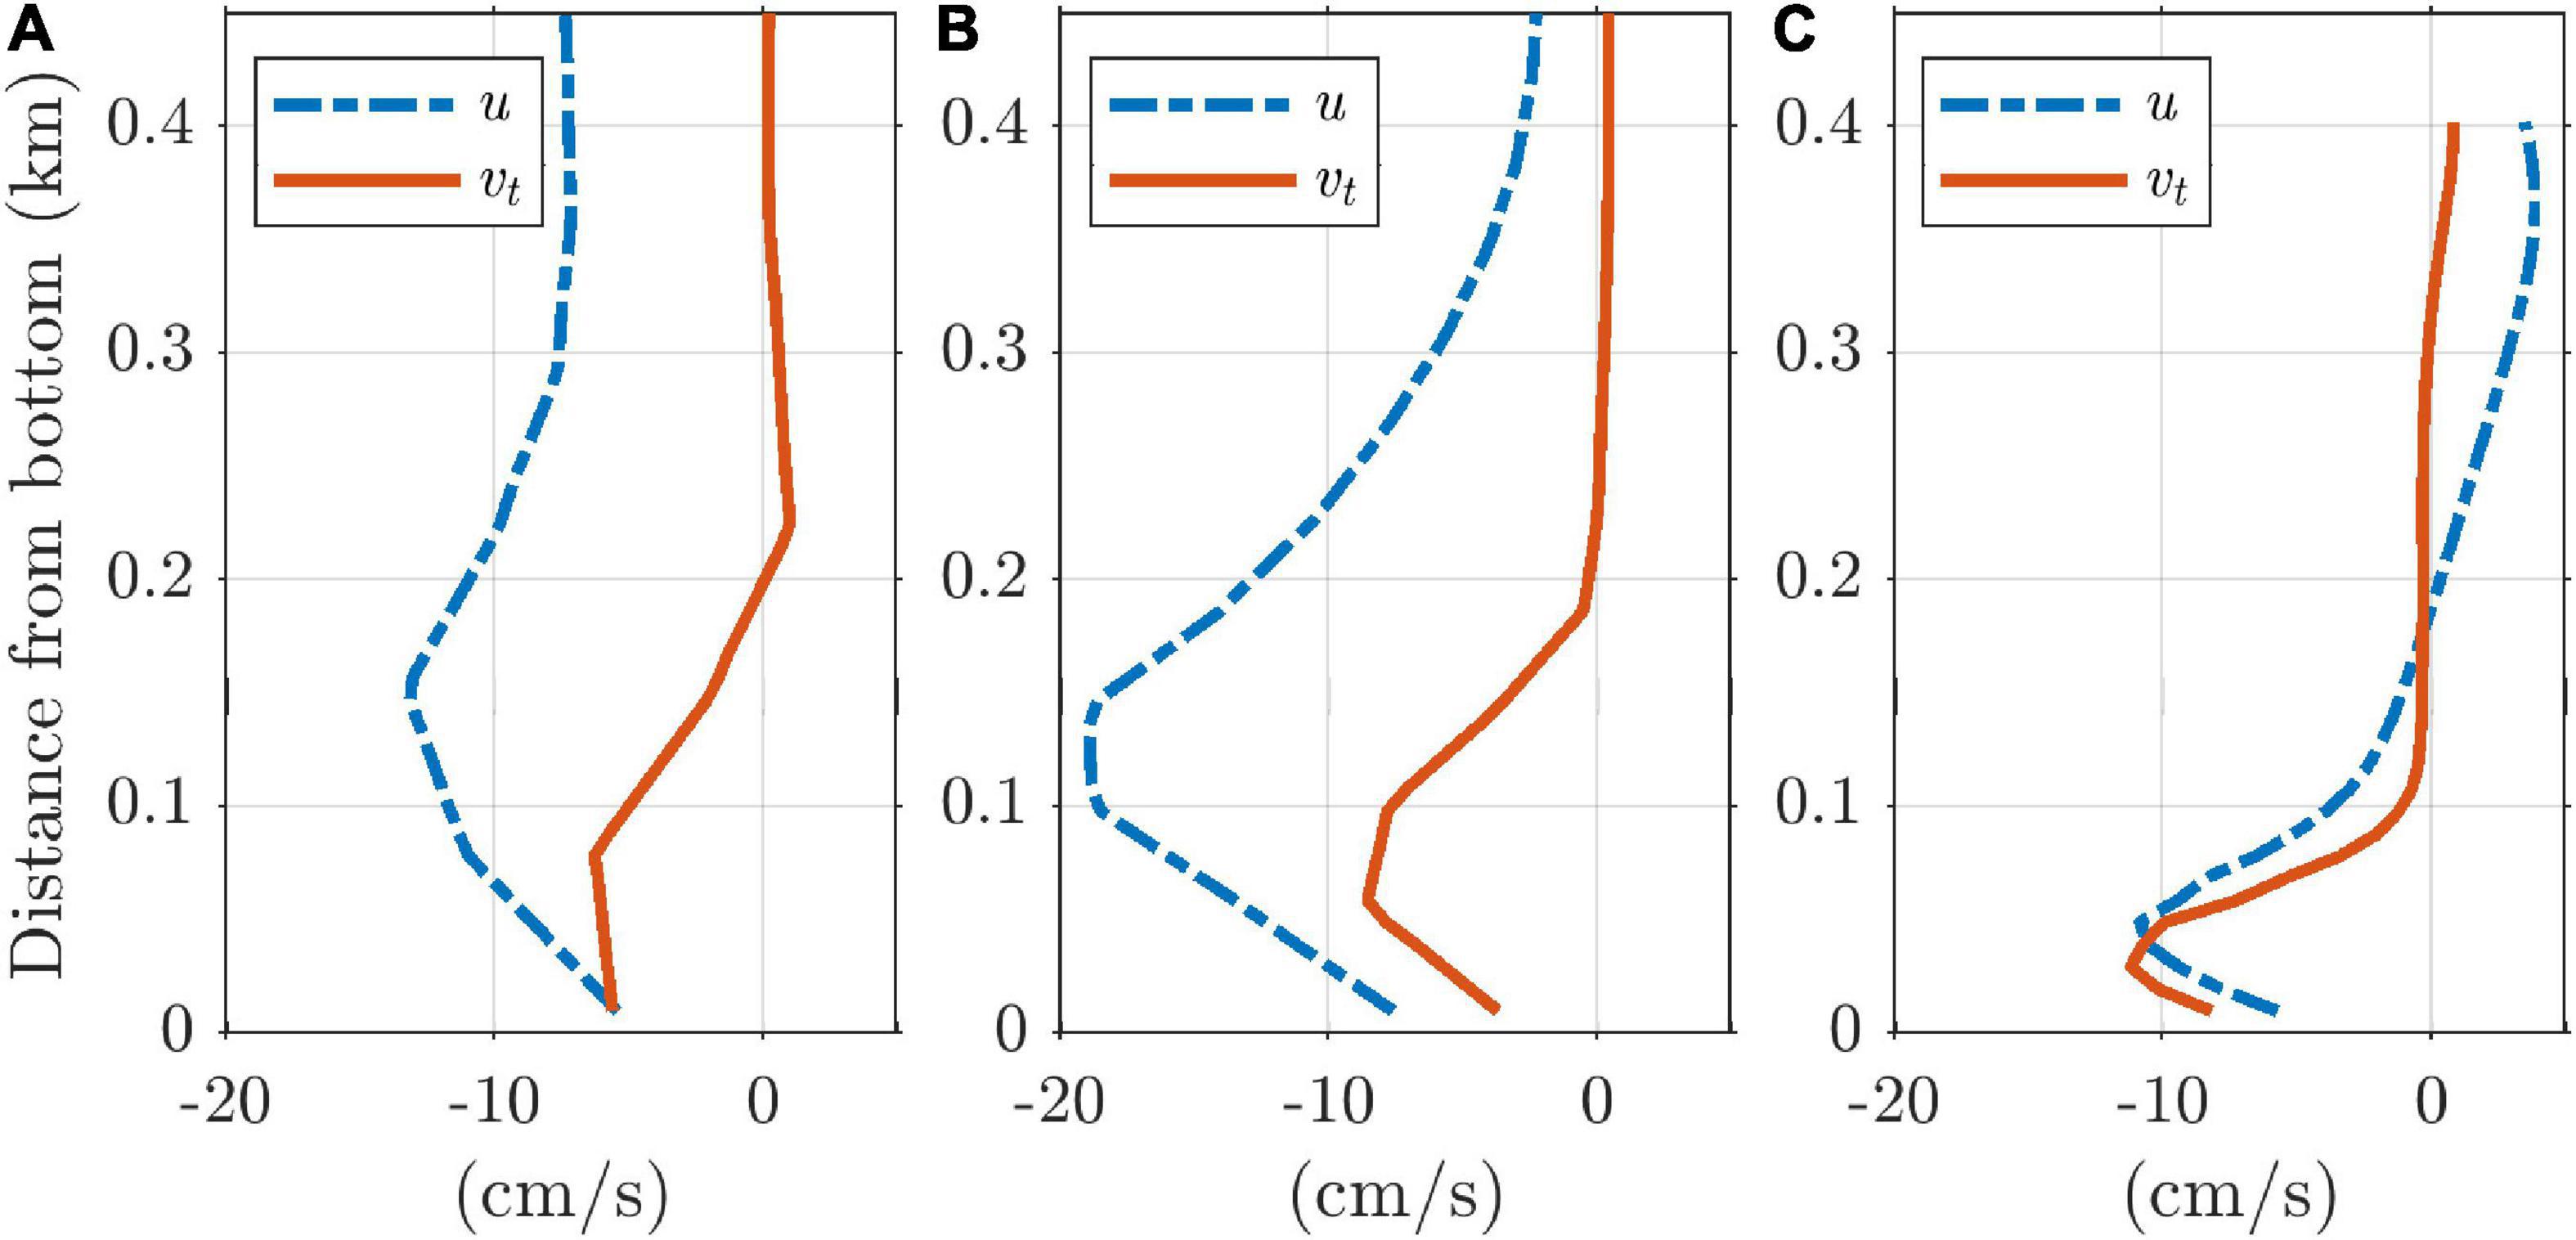
Figure 9. Profiles of zonal and downslope velocities near the slope bottom in the SCS experiment on day 20. (A) y = 80 km, (B) y = 85 km, (C) y = 90 km.
The plume was thin and driven by gravity at the upper slope, while it was thickest at the middle of the slope, where the Coriolis force was strong and the buoyancy force was weaker than that at the upper part. Because of the weak density gradient due to entrainment during convection, all force terms at the lower part were smaller than those at the middle part.
The surface-layer water near the thermal front on the shelf break became colder than the interior water of the open ocean because of the strong horizontal mixing with the cold water on the shelf by the large-scale convective eddies due to baroclinic instability, as shown in section “Horizontal Distributions of Vertical Velocity” (Figures 4E,F). Part of this cool water was entrained in the slope convection (Foster and Carmack, 1976; Muench and Gordon, 1995; Tanaka and Akitomo, 2000).
Discussion
Role of the Continental Shelf on Slope Convection
To examine the sensitivity of slope convection to the continental shelf, we compared the results of the SCS experiment with those of the NS experiment. In the SCS experiment, most of the cold water on the continental shelf persisted and continued to lose heat (Figure 10A). Even after the slope-convection onset, the temperature of the slope current continued to decrease because cold water was supplied from the continental shelf (Figure 10C).
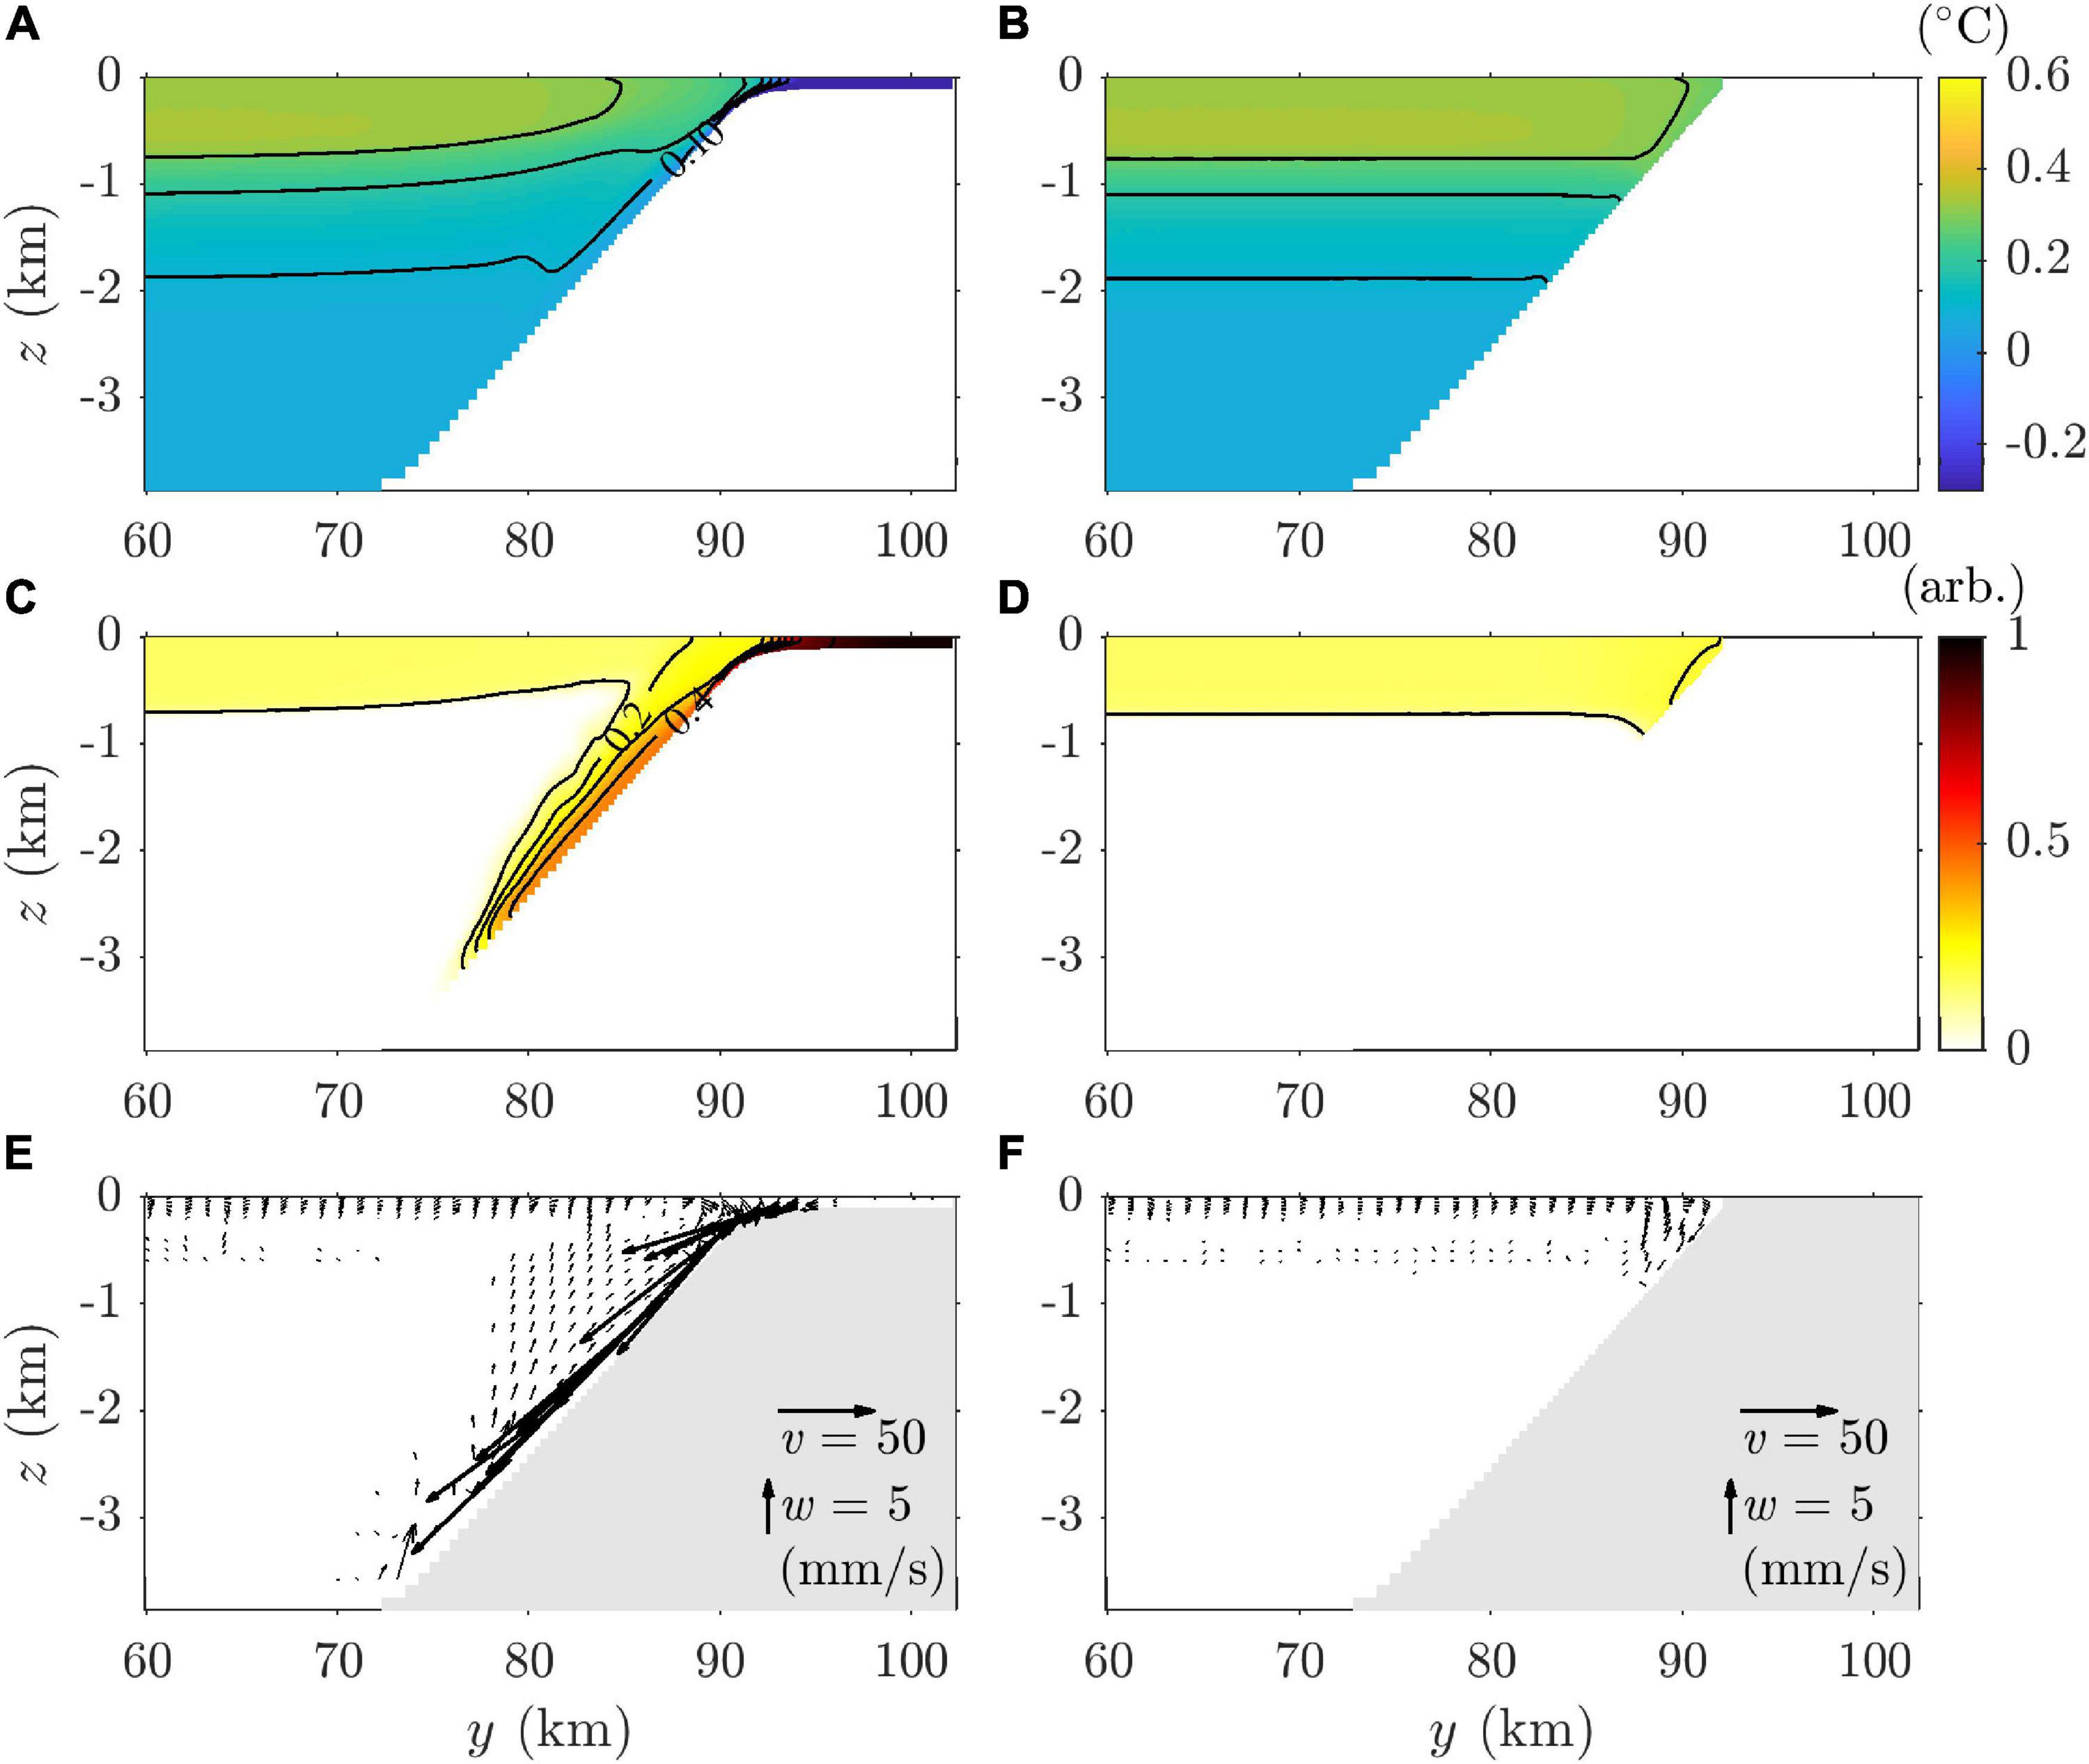
Figure 10. Meridional sections of zonally averaged (A,B) potential temperature, (C,D) tracer concentration, and (E,F) velocity on day 20. Left panels (A,C,E) are results from the SCS experiment, reprinted for comparison with the right panels (B,D,F), which are results from the NS experiment.
In the NS experiment, the coastal area still cooled faster than the open ocean. After the onset of convection, coastal water was mixed with offshore water by large convective eddies owing to the baroclinic instability near the coast. The horizontal temperature gradient in the NS experiment was smaller than that near the shelf break in the SCS experiment (Figure 10B), thereby confirming that the continental shelf acts as a dense water reservoir in slope convection (Killworth, 1983). The slope current from the continental shelf also disappeared in the NS experiment (Figures 10C–F).
Nevertheless, the cooler coastal water in the NS experiment convected deeper than the mixed layer of the open ocean along the continental slope. The potential temperature of the convective-plume head, which reached 640 and 880 m on days 10 and 20 was 0.363 and 0.277°C, respectively (Figure 11).
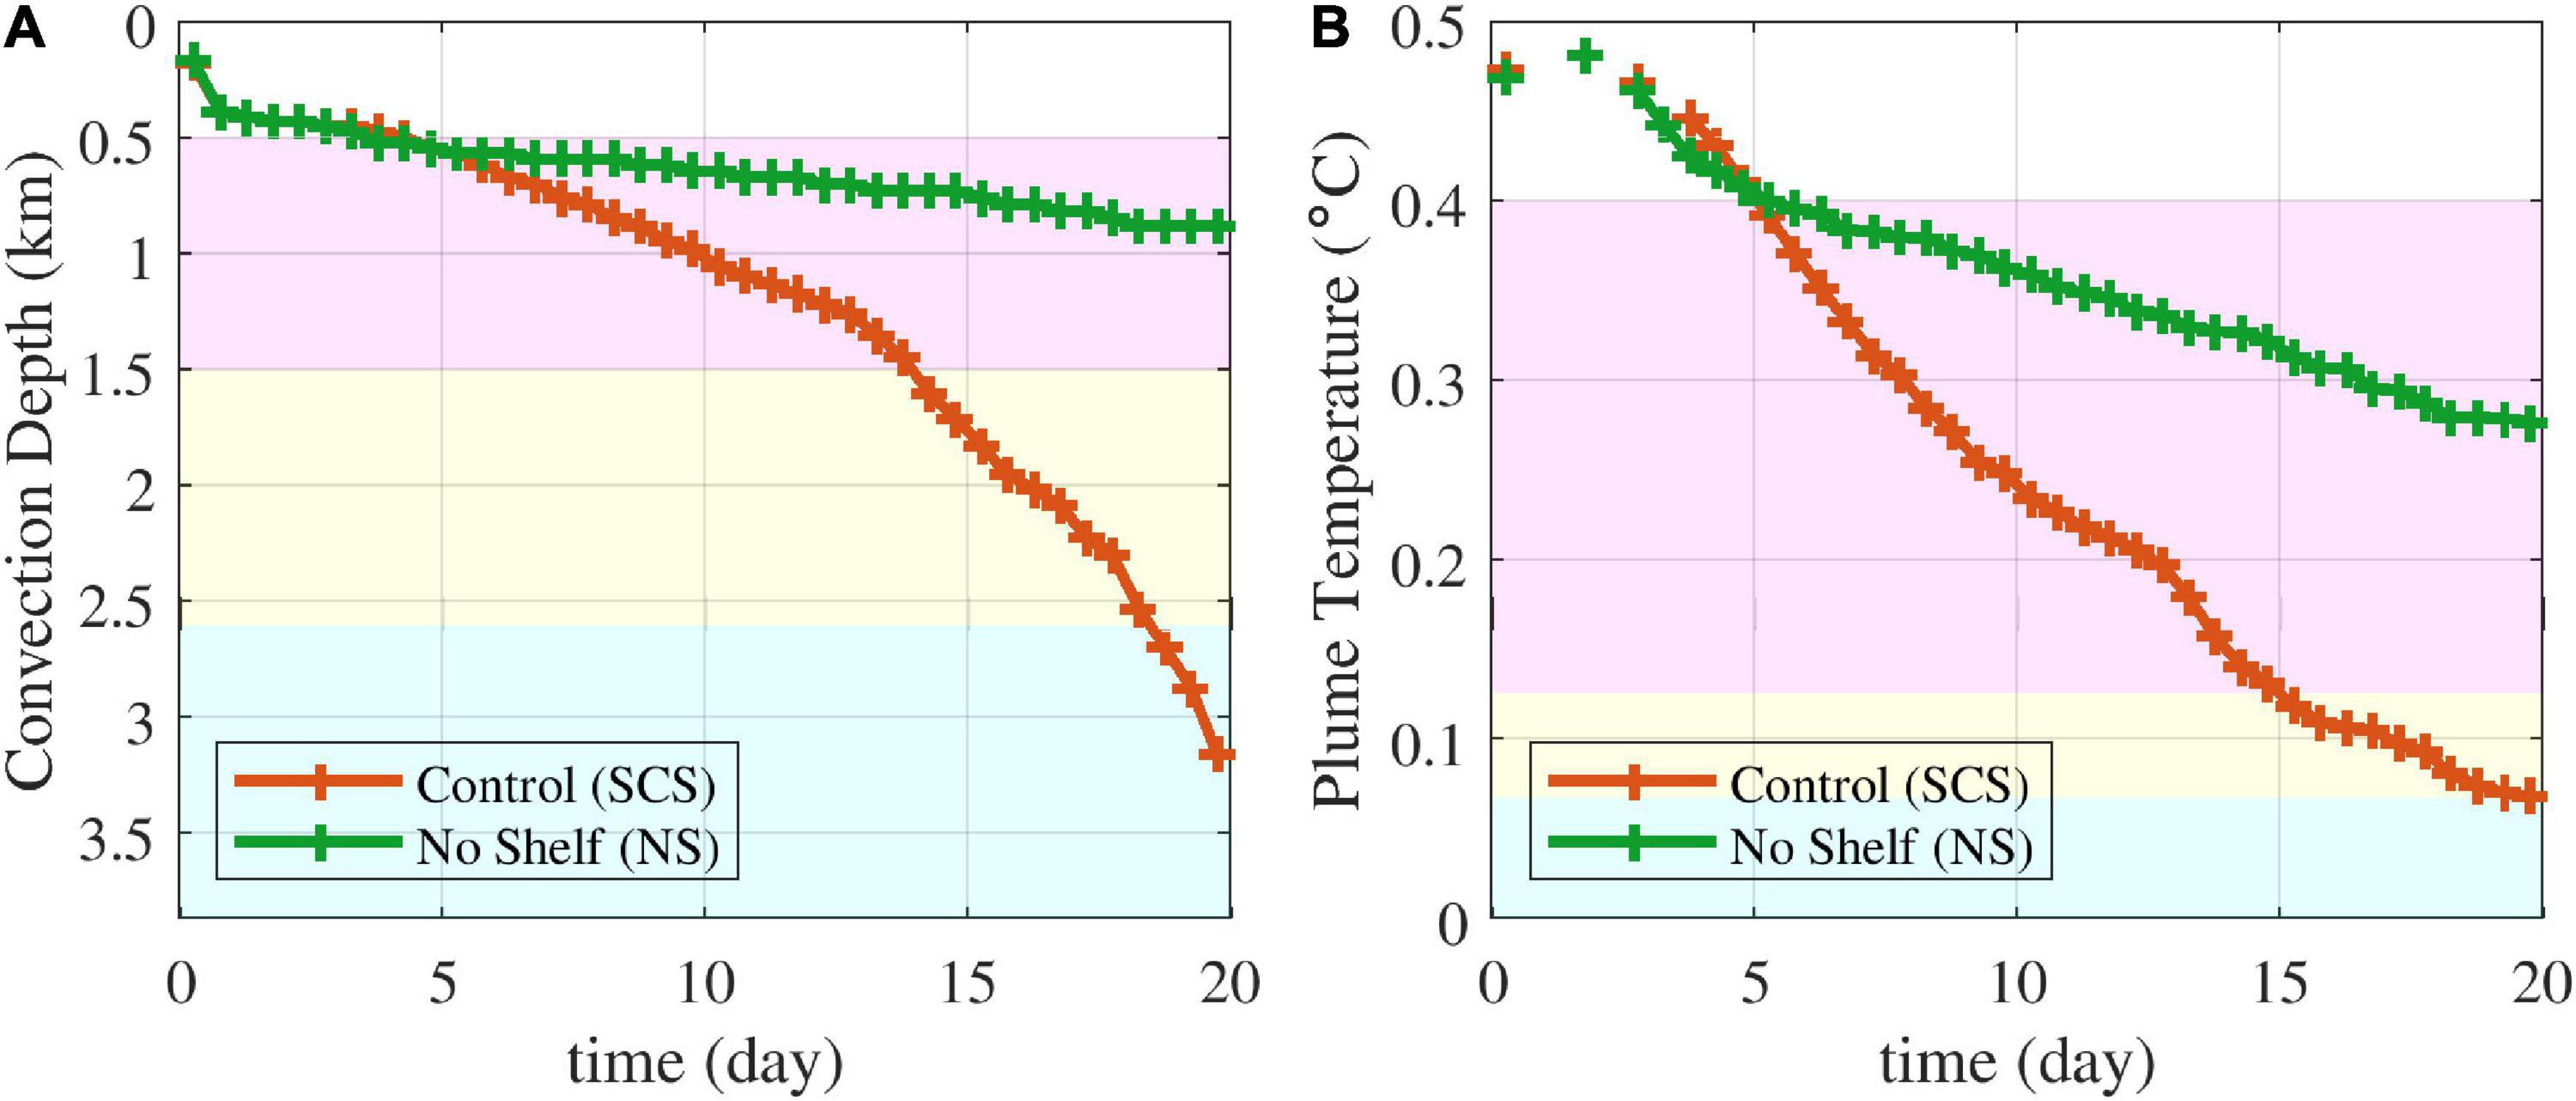
Figure 11. (A) Depth and (B) potential temperature of the convective-plume head with time in the SCS and NS experiments.
Effect of the Continental-Slope Inclination on Slope Convection
The effects of continental-slope inclination on slope convection were investigated by comparing the results of the experiments according to various slope inclinations. The temperature at the continental shelf, i.e., a dense-water reservoir, was the same in all the experiments (Figures 12A–D). The temperature in the open ocean also exhibited the same characteristics in all the experiments. Dense water from the continental shelf flowed downward in all experiments. In the SGS, SSS, and SC experiments, the tracer volume transferred to more than 1,000 m depth was approximately 0.47, 0.97, and 0.49 times that of the SCS experiment, respectively (Figures 12E–H).
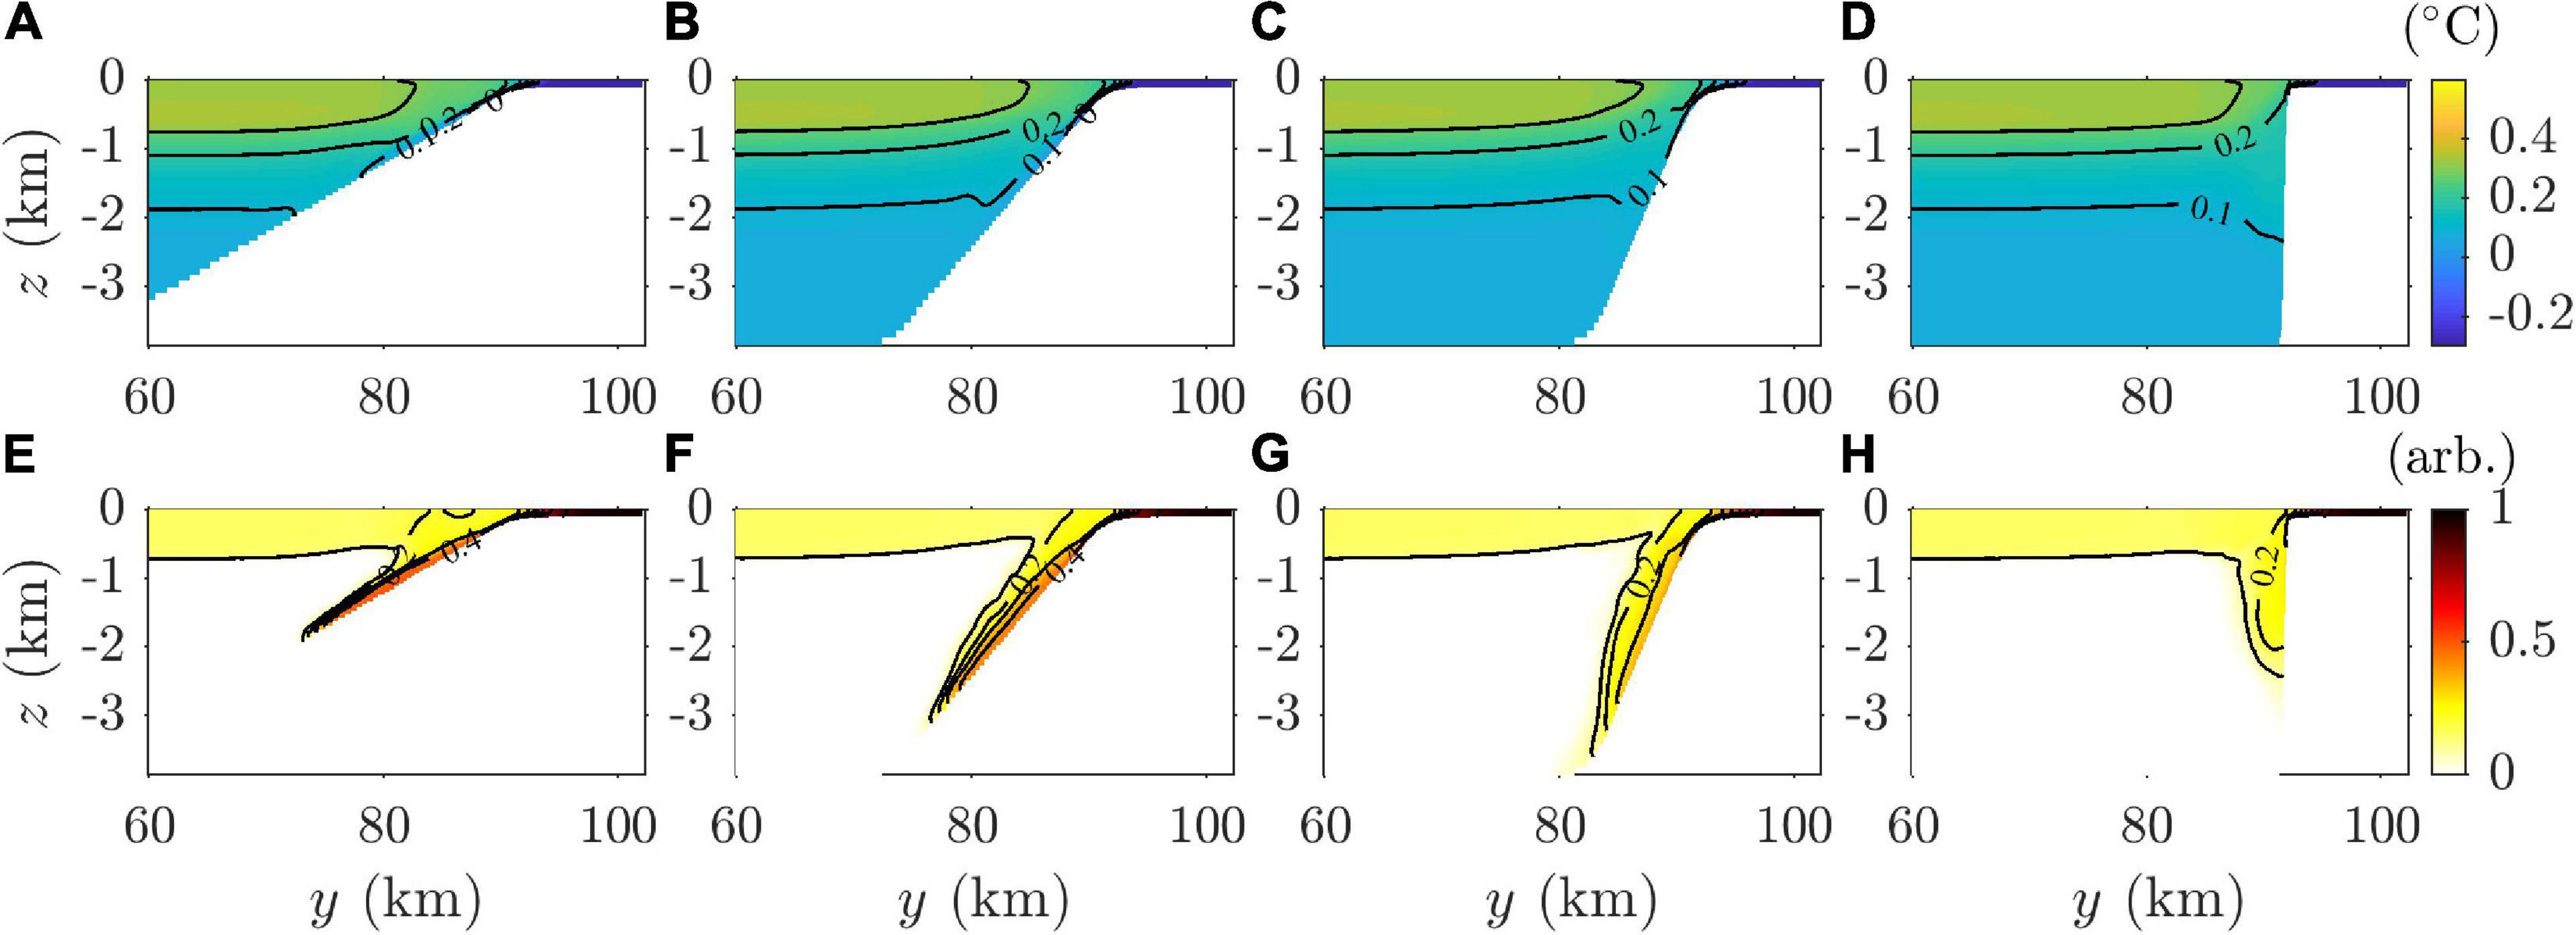
Figure 12. Meridional sections of zonally averaged (A–D) potential temperature, (E–H) tracer concentration in the (A,E) SGS, (B,F) SCS, (C,G) SSS, and (D,H) SC experiments. The results of the SCS experiment were reprinted for comparing the differences according to the slope inclination.
The convection depths were different among the experiments despite similar density differences between the shelf and open-ocean waters. In the SSS, SCS, and SGS experiments, based on the tracer concentration, the convection depths on day 20 were 3.69, 3.16, and 1.89 km, respectively (Figure 13A). The velocity of the slope current, determined by the convection depth over time, was proportional to the slope steepness and increased with time in all the experiments. However, the acceleration depended on the slope inclination. The convection depth in the SC experiment was deepest until day 7, but shallower than in the SSS and SCS experiments after 15 days.
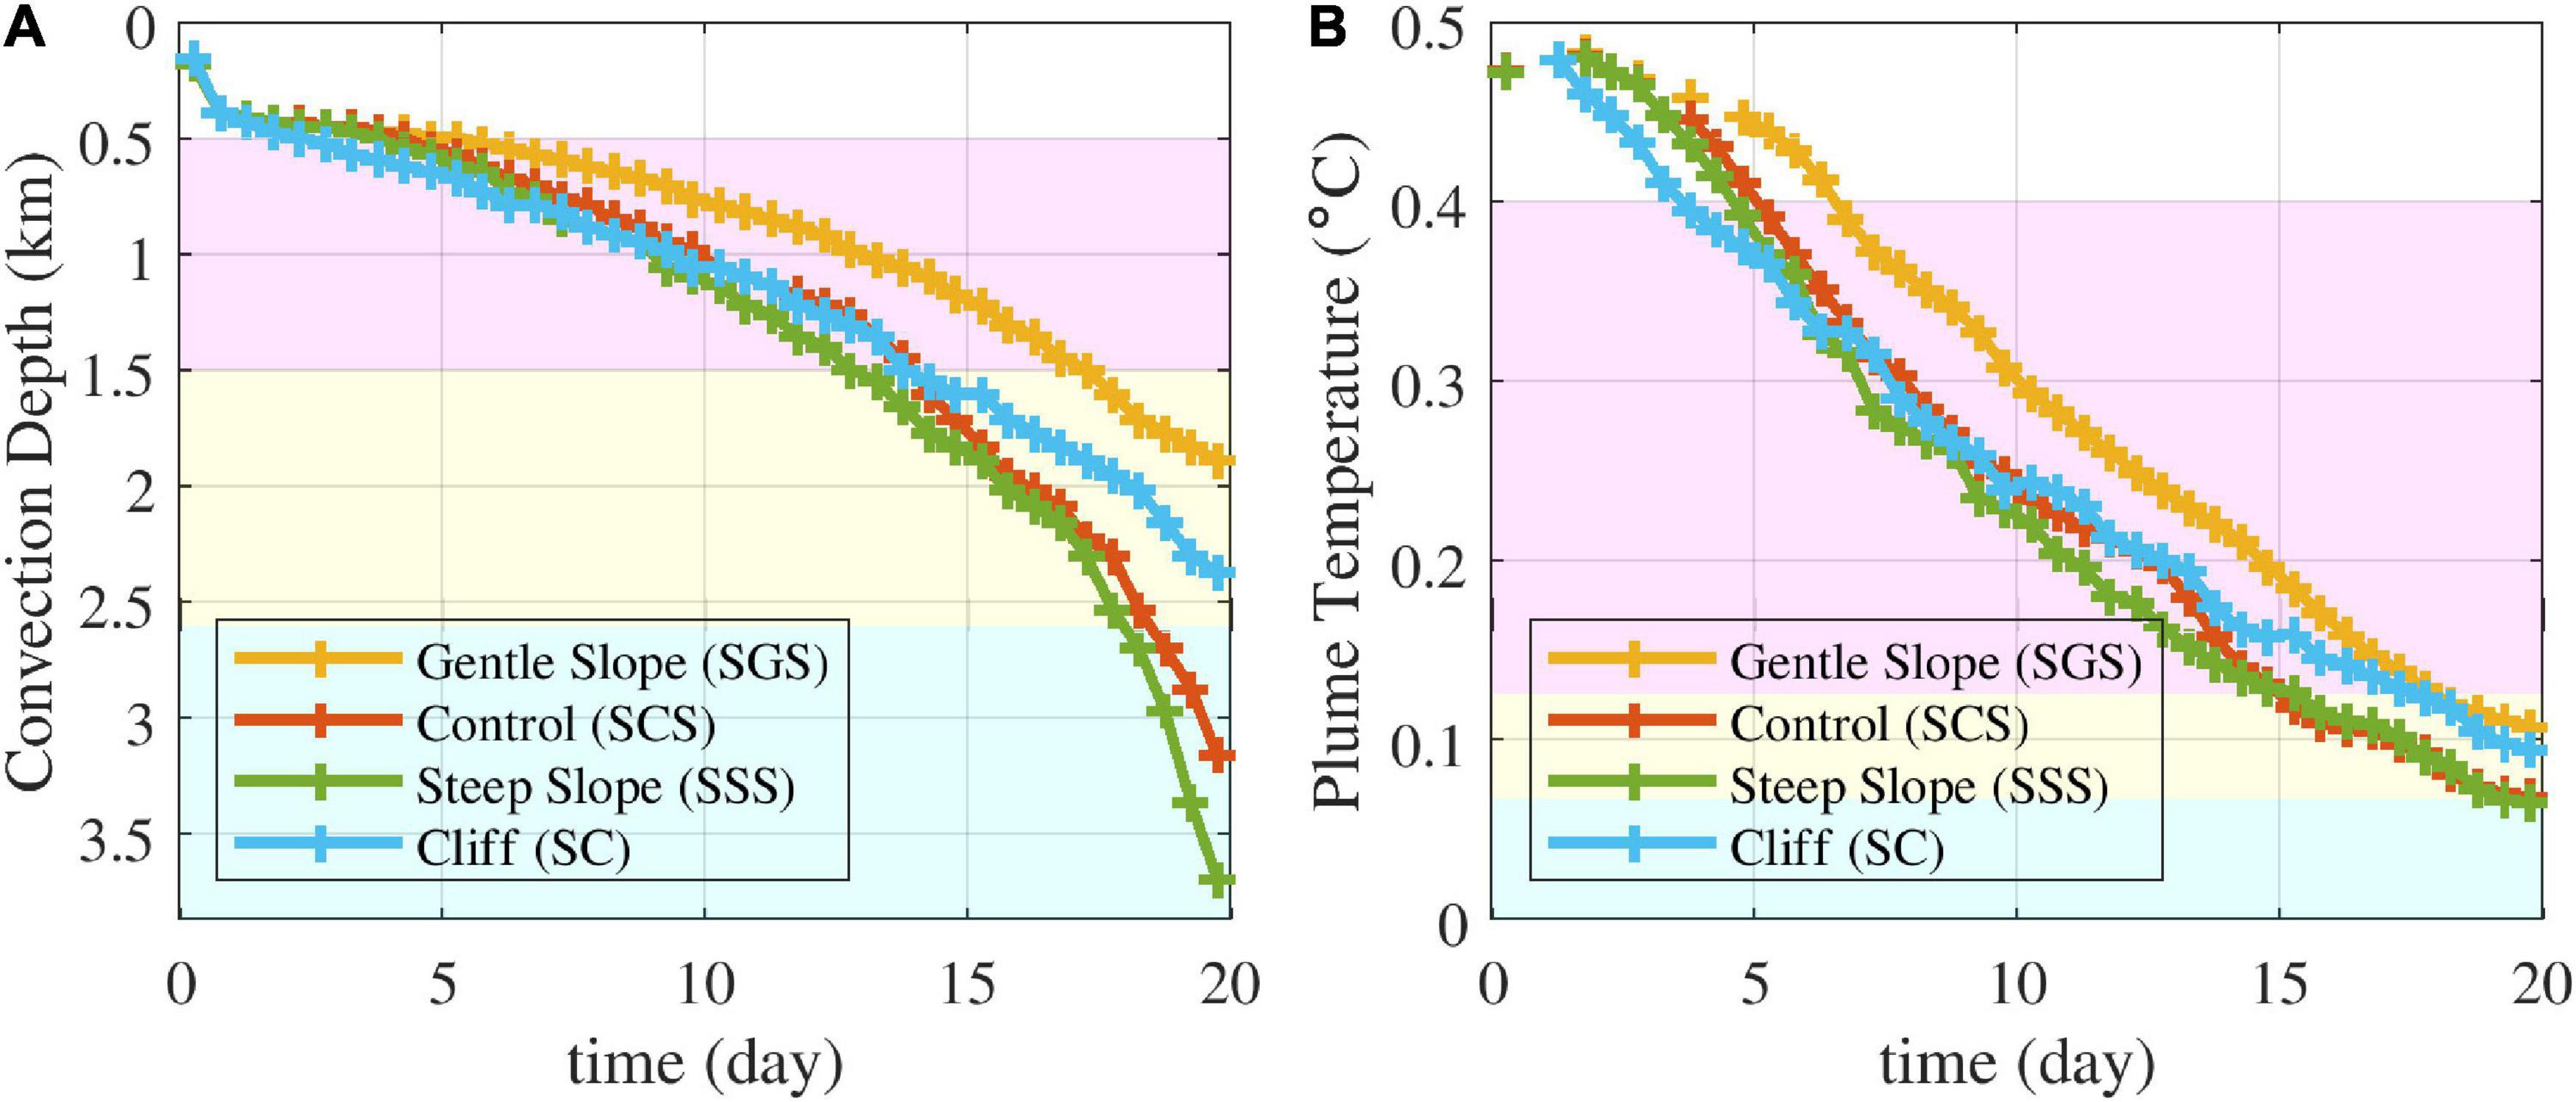
Figure 13. (A) Depth and (B) potential temperature of the convective-plume head with time in several experiments (i.e., SGS, SCS, SSS, and SC) with various slope inclinations.
The temperature of the convective-plume head was closely related to the velocity of the slope current, which determined the entrainment. The temperature was lowest and highest in the SSS and SGS experiments for the entire period, respectively (Figure 13B). The temperature in the SC experiment was lowest until day 7, but higher than that of the SSS and SCS experiments after 15 days (Figure 13B). The dense-water dumping from the shelf due to the absence of slope friction in the SC experiment might have resulted in deep and cold convection during the initial period. However, the strong mixing of the convective plume with surrounding water degraded the high-density plume core, which decreased the relative convection speed and cooling rate of the plume in the SC experiment.
Because the plume flows down the slope forced by gravity (Ellison and Turner, 1959), the slope inclination is the main factor affecting the current speed. The temperature was similar in the SCS and SSS experiments, but the convection reached deeper in the SSS experiment after 15 days (Figure 13), suggesting that the amount of entrained background water was similar over the same period.
In the SSS experiment, although the velocity of the slope current was weakened by strong entrainment, it still reached the bottom layer because of larger downslope gravitational acceleration. Conversely, in the SCS experiment, entrainment was weaker and the downslope gravitational acceleration was smaller. These conflicting inclination effects might result in similar deep-convection volume transports in the SCS and SSS experiments. The velocity of the slope current was lowest in the SGS experiment because of the small downslope gravity acceleration.
Effect of Brine Rejection on the Slope Convection
The results of the BR experiment were compared with those of the SCS experiment for examining the effects of brine rejection. A plume with low temperature and high salinity formed along the bottom of the continental slope. High-density water from the shelf in the BR experiment flowed downward along the slope, as in the SCS experiment. The surface tracer concentration in the BR experiment was lower than that in the SCS experiment (Figure 14A); however, the tracer volume transferred to more than 1,000 m depth in the BR experiment was approximately 2.29 times that in the SCS experiment.
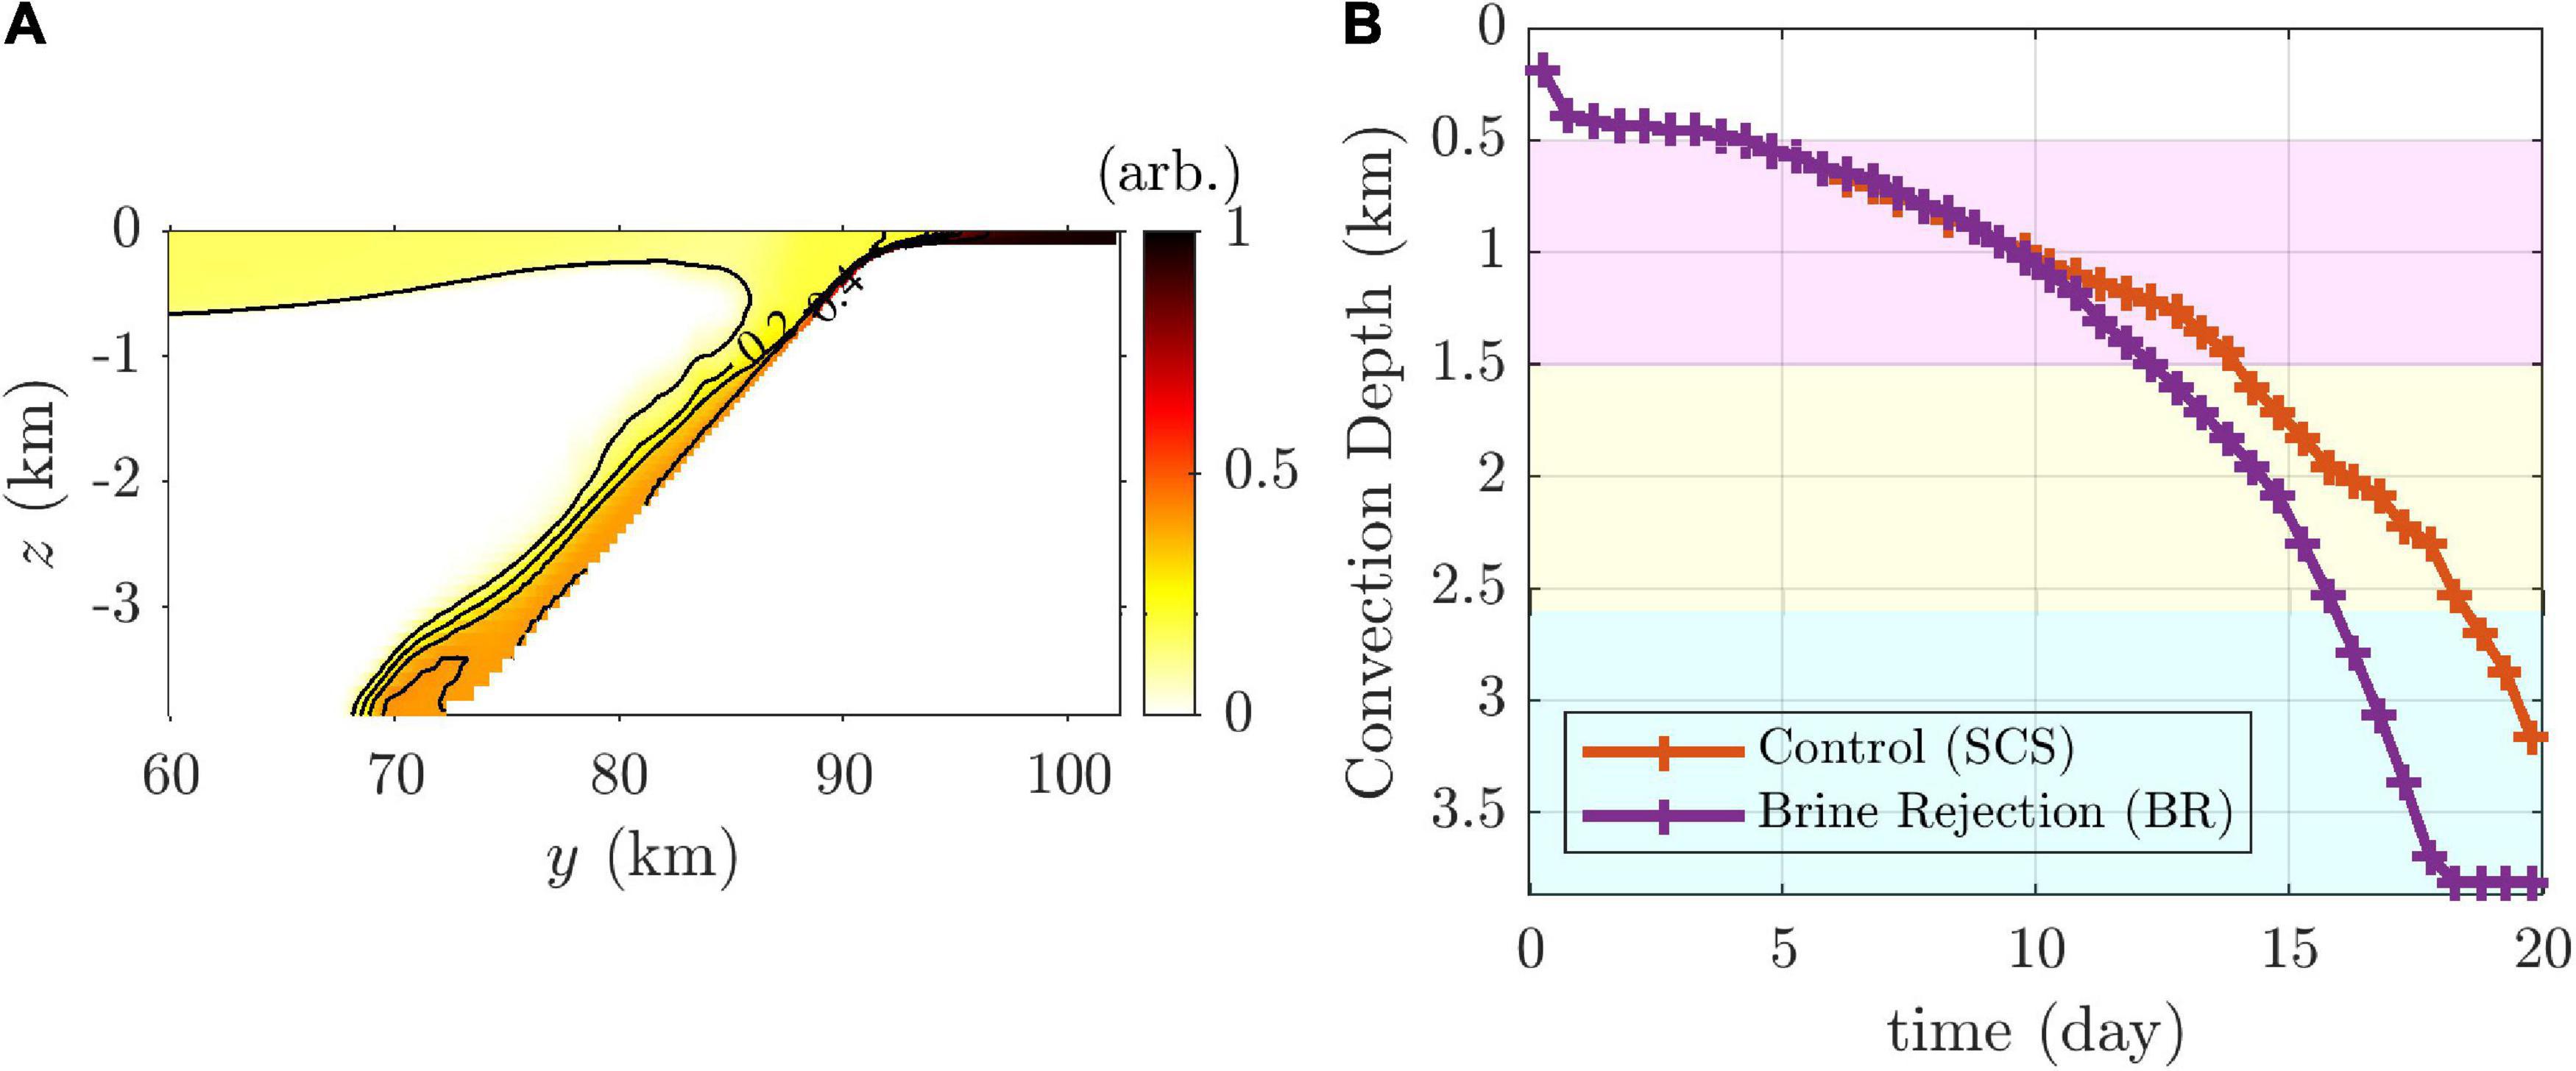
Figure 14. (A) Meridional sections of zonally averaged tracer concentration on day 20 in the BR experiment. (B) Comparison of the convection depths of the convective-plume heads with time in the SCS and BR experiments.
The speed of the plume in the BR experiment was faster than that in the SCS after 10 days. The convective plume in the BR experiment reached the bottom on day 18, whereas it reached 2,300 m depth in the SCS experiment (Figure 14B).
The salinity at the shelf was higher than 34.1 g kg–1 on day 20, and the salinity of the water arriving at the bottom by slope convection was diluted to 34.070–34.073 g kg–1. The SCS experiment showed that slope convection can be generated by surface cooling, but Figure 14 also suggests that deep convection along the slope can be accelerated by brine rejection (Talley et al., 2003, 2006; Yoon et al., 2018). Brine rejection alone might also induce deep slope convection (Kikuchi et al., 1999), although sea-ice production occurs simultaneously with cooling in the real ocean. Sea-ice production might vary substantially over time depending on the region. The effect of brine rejection might be large if the ice production is large. It is necessary to estimate the effect of ice-production rate through further investigations.
Conclusion
We investigated deep convection along the continental slope in the East/Japan Sea (EJS) using a LES. Convection, driven by 200 W m–2 surface heat flux (i.e., the winter 2001 average net heat flux; when deep convection was evident), occurred at approximately 700 m depth in the open ocean, but below 2,700 m depth along the slope after 20 days. The potential temperature of the convected water reached the central-water (CW) range after 10 days in the open-ocean (OO) experiment, but that in the SCS experiment reached the deep-water (DW) range after 15 days and the bottom-water (BW) range after 19 days. These results suggest that slope convection is a potential ventilation process for the DW and BW formations in the JES, whereas open-ocean convection occurs for the intermediate-water (IW) and CW formations.
Surface heat loss results in more cooling in the shallow than in the open ocean. The dense water formed by strong cooling flows down along the slope as a bottom Ekman current. The dense characteristics of the initial water were well conserved along the continental slope during convection, whereas they changed by vigorous mixing with the surrounding waters in the open ocean.
The vertical velocity spectrum of the convection plume revealed a peak at approximately 500–700 m wavelength in the open ocean, which was consistent with earlier studies; a second peak was also revealed at approximately 4 km due to baroclinic instability in the upper-slope region, where the thermal front was generated by cold shelf water and warm open-ocean water. The mixed water near the thermal front joined the slope current.
The no-shelf (NS) experiment exhibited tiny convection along the slope due to the absence of a dense-water reservoir for slope convection. Additional experiments regarding diverse topographies suggested that the downward speed and mixing change according to the inclination of the continental slope. The downward speed was proportional to the slope inclination. The downslope gravity acceleration resulted in a fast downward flow to the bottom of the steep slope. The temperature of the convective-plume head was inversely proportional to the continental-slope inclination, except in the case of the cliff, where excessive mixing impeded the progression of the plume. The salinity increase due to brine rejection in the shelf accelerated the slope convection.
To the best of our knowledge, deep water formation along a slope has not yet been thoroughly explored. Although our LES model assumed a simple condition and the model domain was small, we could find the significant impact of slope convection on deep water formation. Our results suggest a strong potential slope-convection contribution to deep water formation and will be available for parameterizations in ocean general circulation models, which can more effectively simulate large-scale ocean circulation.
Data Availability Statement
The raw data supporting the conclusions of this article will be made available by the authors, without undue reservation.
Author Contributions
B-GK and Y-KC: conceptualization. B-GK and YN: methodology. B-GK: draft writing and visualization. Y-KC and YN: review, editing, and supervision. All authors contributed to the article and approved the submitted version.
Funding
This research was a part of the project titled “Deep Water Circulation and Material Cycling in the East Sea (20160400),” funded by the Ministry of Oceans and Fisheries, Korea.
Conflict of Interest
The authors declare that the research was conducted in the absence of any commercial or financial relationships that could be construed as a potential conflict of interest.
Publisher’s Note
All claims expressed in this article are solely those of the authors and do not necessarily represent those of their affiliated organizations, or those of the publisher, the editors and the reviewers. Any product that may be evaluated in this article, or claim that may be made by its manufacturer, is not guaranteed or endorsed by the publisher.
References
Alley, R. B., Marotzke, J., Nordhaus, W. D., Overpeck, J. T., Peteet, D. M., Pielke, R. A., et al. (2003). Abrupt climate change. Science 299, 2005–2010. doi: 10.1126/science.1081056
Bellomo, K., Angeloni, M., Corti, S., and von Hardenberg, J. (2021). Future climate change shaped by inter-model differences in Atlantic meridional overturning circulation response. Nat. Commun. 12:3659. doi: 10.1038/s41467-021-24015-w
Chang, K.-I., Zhang, C.-I., Park, C., Kang, D.-J., Ju, S.-J., Lee, S.-H., et al. (2016). Oceanography of the East Sea (Japan Sea). Heidelberg: Springer.
Cho, Y. K., and Kim, K. (1994). Two modes of the salinity-minimum layer water in the Ulleung Basin. La Mer 32, 271–278.
Cho, Y.-K., Seo, G.-H., Choi, B.-J., Kim, S., Kim, Y.-G., Youn, Y.-H., et al. (2009). Connectivity among straits of the northwest Pacific marginal seas. J. Geophys. Res. 114:C06018. doi: 10.1029/2008JC005218
Clayson, C. A., and Luneva, M. (2004). Deep convection in the Japan (East) sea: a modeling perspective. Geophys. Res. Lett. 31:L17303. doi: 10.1029/2004GL020497
Cox, G. F. N., and Weeks, W. F. (1974). Salinity variations in sea ice. J. Glaciol. 13, 109–120. doi: 10.3189/S0022143000023418
Deardorff, J. W. (1980). Stratocumulus-capped mixed layers derived from a three-dimensional model. Boundary Layer Meteorol. 18, 495–527. doi: 10.1007/BF00119502
Denbo, D. W., and Skyllingstad, E. D. (1996). An ocean large-eddy simulation model with application to deep convection in the Greenland sea. J. Geophys. Res. 101, 1095–1110. doi: 10.1029/95JC02828
Ellison, T. H., and Turner, J. S. (1959). Turbulent entrainment in stratified flows. J. Fluid Mech. 6, 423–448. doi: 10.1017/S0022112059000738
Foster, T. D., and Carmack, E. C. (1976). Frontal zone mixing and Antarctic bottom water formation in the southern Weddell sea. Deep Sea Res. Oceanogr. Abstr. 23, 301–317. doi: 10.1016/0011-7471(76)90872-X
Gamo, T., and Horibe, Y. (1983). Abyssal circulation in the Japan sea. J. Oceanogr. Soc. Jpn. 39, 220–230. doi: 10.1007/BF02070392
Gawarkiewicz, G., and Chapman, D. C. (1995). A numerical study of dense water formation and transport on a shallow, sloping continental shelf. J. Geophys. Res. 100, 4489–4507. doi: 10.1029/94JC01742
Han, M., Cho, Y.-K., Kang, H.-W., and Nam, S. (2020). Decadal changes in meridional overturning circulation in the East sea (sea of Japan). J. Phys. Oceanogr. 50, 1773–1791. doi: 10.1175/JPO-D-19-0248.1
Hersbach, H., Bell, B., Berrisford, P., Hirahara, S., Horányi, A., Muñoz-Sabater, J., et al. (2020). The ERA5 global reanalysis. Q. J. R. Meteorol. Soc. 146, 1999–2049. doi: 10.1002/qj.3803
Jiang, L., and Garwood, R. W. Jr. (1995). A numerical study of three-dimensional dense bottom plumes on a Southern ocean continental slope. J. Geophys. Res. 100, 18471–18488. doi: 10.1029/95JC01512
Kawamura, H., and Wu, P. (1998). Formation mechanism of Japan sea proper water in the flux center off Vladivostok. J. Geophys. Res. 103, 21611–21622. doi: 10.1029/98JC01948
Kikuchi, T., Wakatsuchi, M., and Ikeda, M. (1999). A numerical investigation of the transport process of dense shelf water from a continental shelf to a slope. J. Geophys. Res. 104, 1197–1210. doi: 10.1029/98JC02585
Killworth, P. D. (1983). Deep convection in the world ocean. Rev. Geophys. 21, 1–26. doi: 10.1029/RG021i001p00001
Kim, K., and Chung, J. Y. (1984). “On the salinity-minimum and dissolved oxygen-maximum layer in the East sea (Sea Of Japan),” in Ocean Hydrodynamics of the Japan and East China Seas, ed. T. Ichiye (Amsterdam: Elsevier), 55–65.
Kim, K., Kim, K.-R., Kim, Y.-G., Cho, Y.-K., Chung, J.-Y., Choi, B.-H., et al. (1996). New findings from CREAMS observations: water masses and eddies in the East sea. J. Korean. Soc. Oceanogr. 31, 155–163.
Kim, K., Kim, K.-R., Kim, Y.-G., Cho, Y.-K., Kang, D.-J., Takematsu, M., et al. (2004). Water masses and decadal variability in the East sea (sea of Japan). Prog. Oceanogr. 61, 157–174. doi: 10.1016/j.pocean.2004.06.003
Kim, K.-R., and Kim, K. (1996). What is happening in the East sea (Japan sea): recent chemical observations during CREAMS 93-96. J. Kor. Soc. Oceanogr. 31, 164–172.
Kim, Y.-G., and Kim, K. (1999). Intermediate waters in the East/Japan sea. J. Oceanogr. 55, 123–132. doi: 10.1023/A:1007877610531
Lobanov, V., Salyuk, A., Ponomarev, V., Talley, L., Kim, K., Kim, k.-r., et al. (2002). “Renewal of bottom water in the Japan/East sea,” in Proceedings of the 17th International Symposium on Okhotsk Sea & Sea Ice, Mombetsu, 31–36.
Maronga, B., Gryschka, M., Heinze, R., Hoffmann, F., Kanani-Sühring, F., Keck, M., et al. (2015). The parallelized large-eddy simulation model (PALM) version 4.0 for atmospheric and oceanic flows: model formulation, recent developments, and future perspectives. Geosci. Model Dev. 8, 2515–2551. doi: 10.5194/gmd-8-2515-2015
Marshall, J., and Schott, F. (1999). Open-ocean convection: observations, theory, and models. Rev. Geophys. 37, 1–64. doi: 10.1029/98RG02739
Moeng, C.-H., and Wyngaard, J. C. (1988). Spectral analysis of large-eddy simulations of the convective boundary layer. J. Atmos. Sci. 45, 3573–3587. doi: 10.1175/1520-04691988045<3573:SAOLES<2.0.CO;2
Muench, R. D., and Gordon, A. L. (1995). Circulation and transport of water along the western Weddell sea margin. J. Geophys. Res. 100, 18503–18515. doi: 10.1029/95JC00965
Nam, S., Yoon, S.-T., Park, J.-H., Kim, Y. H., and Chang, K.-I. (2016). Distinct characteristics of the intermediate water observed off the east coast of Korea during two contrasting years. J. Geophys. Res. 121, 5050–5068. doi: 10.1002/2015JC011593
Noh, Y., Cheon, W. G., and Raasch, S. (2003). The role of preconditioning in the evolution of open-ocean deep convection. J. Phys. Oceanogr. 33, 1145–1166. doi: 10.1175/1520-04852003033<1145:TROPIT<2.0.CO;2
Noh, Y., Jang, C. J., and Kim, J.-W. (1999). Large eddy simulation of open ocean deep convection with application to the deep water formation in the East sea (Japan sea). J. Oceanogr. 55, 347–367. doi: 10.1023/A:1007889229058
Pal, A., and Chalamalla, V. K. (2020). Evolution of plumes and turbulent dynamics in deep-ocean convection. J. Fluid Mech. 889:A35. doi: 10.1017/jfm.2020.94
Raasch, S., and Etling, D. (1998). Modeling deep ocean convection: large eddy simulation in comparison with laboratory experiments. J. Phys. Oceanogr. 28, 1786–1802. doi: 10.1175/1520-04851998028<1786:MDOCLE<2.0.CO;2
Raasch, S., and Schröter, M. (2001). PALM – a large-eddy simulation model performing on massively parallel computers. Meteorol. Z. 10, 363–372. doi: 10.1127/0941-2948/2001/0010-0363
Rahmstorf, S., Box, J. E., Feulner, G., Mann, M. E., Robinson, A., Rutherford, S., et al. (2015). Exceptional twentieth-century slowdown in Atlantic ocean overturning circulation. Nat. Clim. Change 5, 475–480. doi: 10.1038/nclimate2554
Saiki, E. M., Moeng, C.-H., and Sullivan, P. P. (2000). Large-eddy simulation of the stably stratified planetary boundary layer. Boundary Layer Meteor. 95, 1–30. doi: 10.1023/A:1002428223156
Senjyu, T., and Sudo, H. (1993). Water characteristics and circulation of the upper portion of the Japan sea proper water. J. Mar. Syst. 4, 349–362. doi: 10.1016/0924-7963(93)90029-L
Shcherbina, A. Y., Talley, L. D., and Rudnick, D. L. (2003). Direct observations of North pacific ventilation: brine rejection in the Okhotsk sea. Science 302, 1952–1955. doi: 10.1126/science.1088692
Talley, L. D., Lobanov, V., Ponomarev, V., Salyuk, A., Tishchenko, P., Zhabin, I., et al. (2003). Deep convection and brine rejection in the Japan sea. Geophys. Res. Lett. 30:1159. doi: 10.1029/2002GL016451
Talley, L. D., Luchin, V. A., Ponomarev, V. I., Salyuk, A. N., Shcherbina, A. Y., Tishchenko, P. Y., et al. (2006). Japan/East sea water masses and their relation to the sea’s circulation. Oceanography 19, 32–49. doi: 10.5670/oceanog.2006.42
Tanaka, K. (2014). Formation of bottom water and its variability in the northwestern part of the sea of Japan. J. Geophys. Res. Oceans 119, 2081–2094. doi: 10.1002/2013JC009456
Tanaka, K., and Akitomo, K. (2000). Density current descending along continental slope and the associated deep water formation: two-dimensional numerical experiments with a nonhydrostatic model. J. Oceanogr. 56, 117–130. doi: 10.1023/A:1011174827192
Whitehead, J. A. (1993). A laboratory model of cooling over the continental shelf. J. Phys. Oceanogr. 23, 2412–2427. doi: 10.1175/1520-04851993023<2412:ALMOCO<2.0.CO;2
Keywords: deep convection, slope convection, large-eddy simulation, East/Japan Sea, bottom water formation
Citation: Kim B-G, Cho Y-K and Noh Y (2022) Deep Convection Along the Continental Slope in the East/Japan Sea: A Large-Eddy Simulation Study. Front. Mar. Sci. 9:824256. doi: 10.3389/fmars.2022.824256
Received: 29 November 2021; Accepted: 08 February 2022;
Published: 28 February 2022.
Edited by:
Ryan Rykaczewski, Pacific Islands Fisheries Science Center (NOAA), United StatesReviewed by:
Vyacheslav Lobanov, V.I. Il’ichev Pacific Oceanological Institute (RAS), RussiaWilton Aguiar, University of Miami, United States
Copyright © 2022 Kim, Cho and Noh. This is an open-access article distributed under the terms of the Creative Commons Attribution License (CC BY). The use, distribution or reproduction in other forums is permitted, provided the original author(s) and the copyright owner(s) are credited and that the original publication in this journal is cited, in accordance with accepted academic practice. No use, distribution or reproduction is permitted which does not comply with these terms.
*Correspondence: Yang-Ki Cho, Y2hveWtAc251LmFjLmty
 Bong-Gwan Kim
 Yang-Ki Cho
 Yign Noh