 Una Matras
 Ian Salter
 Karin Margretha H. Larsen
 Eilif Gaard
 Petur Steingrund
- 1Faroe Marine Research Institute, Tórshavn, Faroe Islands
- 2Glasir, Tórshavn College, Tórshavn, Faroe Islands
Marine ecosystem dynamics can vary on timescales ranging from months to centuries, but many observational data are limited to just a few decades. The bivalve Arctica islandica may live up to five centuries depositing annual growth increments in its shells which can serve as an indicator for ecosystem productivity. In the present study, 154 specimens of A. islandica were collected on the Faroe Shelf and standardised annual growth increments for 143 of them – 44 from coastal stations and 99 from shelf stations – were compared with climatic, oceanographic and biological variables. A. islandica growth from coastal and shelf stations was not correlated with basin-scale climate indices (the AMO index, the NAO index, the AO index or the subpolar gyre index) or, more locally, with windspeed or sea surface temperature on the Faroe Shelf. For the shelf stations there was a significant negative correlation between A. islandica growth and the volume transport of the Faroe Current flowing just north of Faroe Islands (r = -0.62). There was a weak nonsignificant positive correlation with an index of primary production on the Faroe Shelf (r = 0.31) and a strong negative correlation with a zooplankton biomass index in mid-summer (r = -0.76). There was also a strong positive correlation between A. islandica growth and the biomass of the bottom-feeding fish species Melanogrammus aeglefinus two years later (r = 0.62). These results seem to suggest that A. islandica growth may represent the amount of fresh phytoplankton that reaches the near-bottom water layers and could probably be regarded as a proxy for the strength of pelagic-benthic coupling that is modulated through phytoplankton-zooplankton interactions in the overlying water. Our results highlight the potential for A. islandica to serve as a long-term proxy for linking variability in pelagic ecosystem dynamics to demersal fish stocks.
Introduction
Indications from fish stock dynamics demonstrate centennial-scale variations in marine ecosystem dynamics and highlight that statistical correlations based on short time-series may be an artefact of the observational period e.g. Myers (1998). The Norwegian spring spawning herring (Clupea harengus) (Nakken, 2008; Sætersdal, 2008), along with the Bohuslän herring, have been observed for several centuries and demonstrate transitions between warm periods with good herring catches and cool periods with virtually no catches (Alheit and Hagen, 1997; Toresen and Østvedt, 2000; Nakken, 2008), although stock collapse in the 1960’s has been partially attributed to intense fishing pressure (Dragesund et al., 2008). Atlantic cod (Gadus morhua) (Kurlansky, 1998; see also Nakken, 2008) is another example. One of the largest cod stocks was the Northern cod off Newfoundland, Canada (Robichaud and Rose, 2004) and was fished for over 500 years until it collapsed in the beginning of the 1990s, following intensive fishing since the 1950s (Drinkwater, 2002; Rose, 2005). Although regarded as a classical example of overfishing long-term variability in environmental factors (e.g. low temperatures) were also responsible (Drinkwater, 2002). There are also indications of ecosystem variability of the Faroe shelf with evidence of long-term variations in cod stock size since 1860s (ICES, 2016), haddock (Melanogrammus aeglefinus) stock size since 1920s (ICES, 2016) and catches of pilot whales (Globicephala melas) since 1709 (Hátún et al., 2009). Cod and haddock biomasses were exceptionally low since 2006 (ICES, 2021) and seabirds declined much in abundance in the 1970-1980s (Gaard et al., 2002). Although fish catch statistics are available from 1903 (www.ices.dk), and stock assessments of a select fish species extend back to the first half of the 20th century, most stock assessments and survey data only extend back to the 1980’s. Therefore methods that can serve as indicators over longer timescales are warranted. Investigating the growth dynamics of the long-lived clam, Arctica islandica, represents one such possibility. A. islandica feeds on phytoplankton and deposits annual growth rings that can serve as an indicator for marine producitivity (Witbaard et al., 2003). Phytoplankton are at the base of the marine foodweb and temporal and spatial variability in plankton characteristics is a useful framework to address larger-scale ecosystem dynamics.
Previous studies on the Faroese shelf have observed positive correlations between phytoplankton production and higher trophic levels, including cod production (Steingrund and Gaard, 2005). It is likely such connections are mediated through the abundance of key prey items, such as sandeels, an important food for cod (Rae, 1967; Sørensen, 2021), which are also positively correlated with phytoplankton production (Eliasen et al., 2011). However, after 2005 cod production on the Faroe Shelf decreased in relation to phytoplankton production (ICES, 2021), corresponding to higher summer zooplankton abundances (ICES, 2021). It has been hypothesised previously (Witbaard et al., 2003) that zooplankton dynamics can mediate demersal fish production through enhanced grazing activity, which reduces the downward flux of phytoplankton to the sediments. The surface export of certain phytoplankton functional types, e.g. diatom resting spores, can transport significant amounts of labile carbon to the sediments (Salter et al., 2007; Salter et al., 2012; Rembauville et al., 2016) and influence the growth of benthic organisms through the provision of energy rich compounds (Wolff et al., 2011; Rembauville et al., 2018). Hence, bottom feeding fish like cod and haddock (Sørensen, 2021) may be expected to be negatively affected by high zooplankton concentrations, but this needs to be substantiated further.
The ocean quahog (Arctica islandica L.) is a long-lived (up to 500 years, Butler et al., 2013) bivalve mollusc, which inhabits the continental shelves in the North Atlantic Ocean including the Faroe Shelf (Bonitz et al., 2018). It feeds on phytoplankton (Ballesta-Artero et al., 2017) in the vicinity of the seafloor (Witbaard et al., 2003) and grows continuously throughout its life depositing annual growth increments (see e.g. Scourse et al., 2006). The width of these annual growth rings represents an archive of the feeding conditions of the animal during its life. Similar features can be seen in other bivalves as well (Witbaard et al., 2005; Reynolds et al., 2017). The rings are normally very distinct because the animal only feeds during the spring/summer (April to August) and presumably rests buried in the sediment during the rest of the year. There tends to be a high degree of synchronization in growth between individuals on specific sites (Schöne et al., 2003a), but there might be large differences in growth between adjacent sites (Witbaard, 1996) although a common signal may be discernible for distances up to at least 80 km (Butler et al., 2009). Large differences between individual shells may be observed in changing environments and complex hydrography (Epplé et al., 2006).
Several studies show such growth chronologies for various locations in the North Atlantic, e.g., Witbaard et al. (2003) and Bonitz et al. (2018). The A. islandica growth chronologies from different sites in the NE Atlantic are apparently weakly correlated and do not necessarily correlate with the same local or regional drivers. The A. islandica growth near the Isle of Man correlated positively with seawater temperature, but was also influenced by stratification (Butler et al., 2010). The A. islandica growth in northern Norway also correlated positively with sea surface temperature (Mette et al., 2016). A positive correlation between A. islandica growth and the winter NAO index (high temperature, high NAO index), was observed at sites in the North Sea and on the Norwegian coast (Schöne et al., 2003a). A positive relationship between phytoplankton production and A. islandica growth was reported for the Faroe Shelf (Bonitz et al., 2018). At a site on the north coast of Iceland, no single environmental driver was discernible (Butler et al., 2013). On the other hand, negative correlations between A. islandica growth and temperature was observed in the North Sea, since cold winters reflected nutrient enrichment (Schöne et al., 2003b). A negative relationship between A. islandica growth and sediment suspension was observed in the North Sea (Witbaard et al., 2005). Also, a negative correlation was found between A. islandica growth and the abundance of zooplankton, although no relationship was found for phytoplankton (Witbaard et al., 2003).
The above studies indicate that local conditions may affect the A. islandica growth, but such shortcomings may be overcome by increasing the sampling area. A study compiled growth time series of A. islandica and G. glycymeris from eight locations west of Scotland/England to construct a composite index of bivalve growth that reflected a common environmental driver, in this case anomalies in sea surface temperature (Reynolds et al., 2017). Results can also be improved by taking other variables into account. Another study in northern Norway combined A. islandica growth with an oxygen isotope record and in this way obtained a closer relationship with large-scale North Atlantic sea surface temperatures (Mette et al., 2016).
The Faroe Plateau is located approximately mid-way between Iceland and Scotland (Figure 1). Deep Norwegian Sea Water dominates below 500 m, whereas the shallower water masses are dominated by Atlantic water from the North Atlantic Current, which basically flows in a north-easterly direction past the Faroes (Hansen and Østerhus, 2000). The Faroe Shelf is a much smaller area inside the 100-130 m contour that is characterised by strong tidal currents, which make the water column nearly homogeneous with regards to temperature and salinity (Hansen and Meincke, 1984; Gaard et al., 1998; Hansen et al., 1998; Larsen et al., 2008). The tidal currents also induce a clockwise residual circulation around the islands (Gaard and Hansen, 2000; Larsen et al., 2008) that contributes in maintaining a persistent tidal front (Gaard et al., 1998; Larsen et al., 2009) separating the Faroe Shelf from the outer offshore surroundings. The annual variability in the magnitude of the primary production on the Faroe Shelf is not fully understood, but the primary production tends to be higher in cold years (Gaard, 2003) and the onset of the spring bloom depends on hydrographic conditions (Eliasen et al., 2016; Eliasen et al., 2019), see also Eliasen et al. (2017a); Eliasen et al. (2017b). The shelf ecosystem has its own planktonic community that in terms of species composition and production is different from the surrounding oceanic environment (Gaard, 1996; Gaard et al., 1998; Gaard, 1999; Gaard, 2000). A rich benthic fauna and forage fish, such as sandeels, Norway pout and blue whiting support the local cod, haddock and saithe stocks (Steingrund and Gaard, 2005; Steingrund et al., 2009; ICES, 2021), which are vital to the local economy.
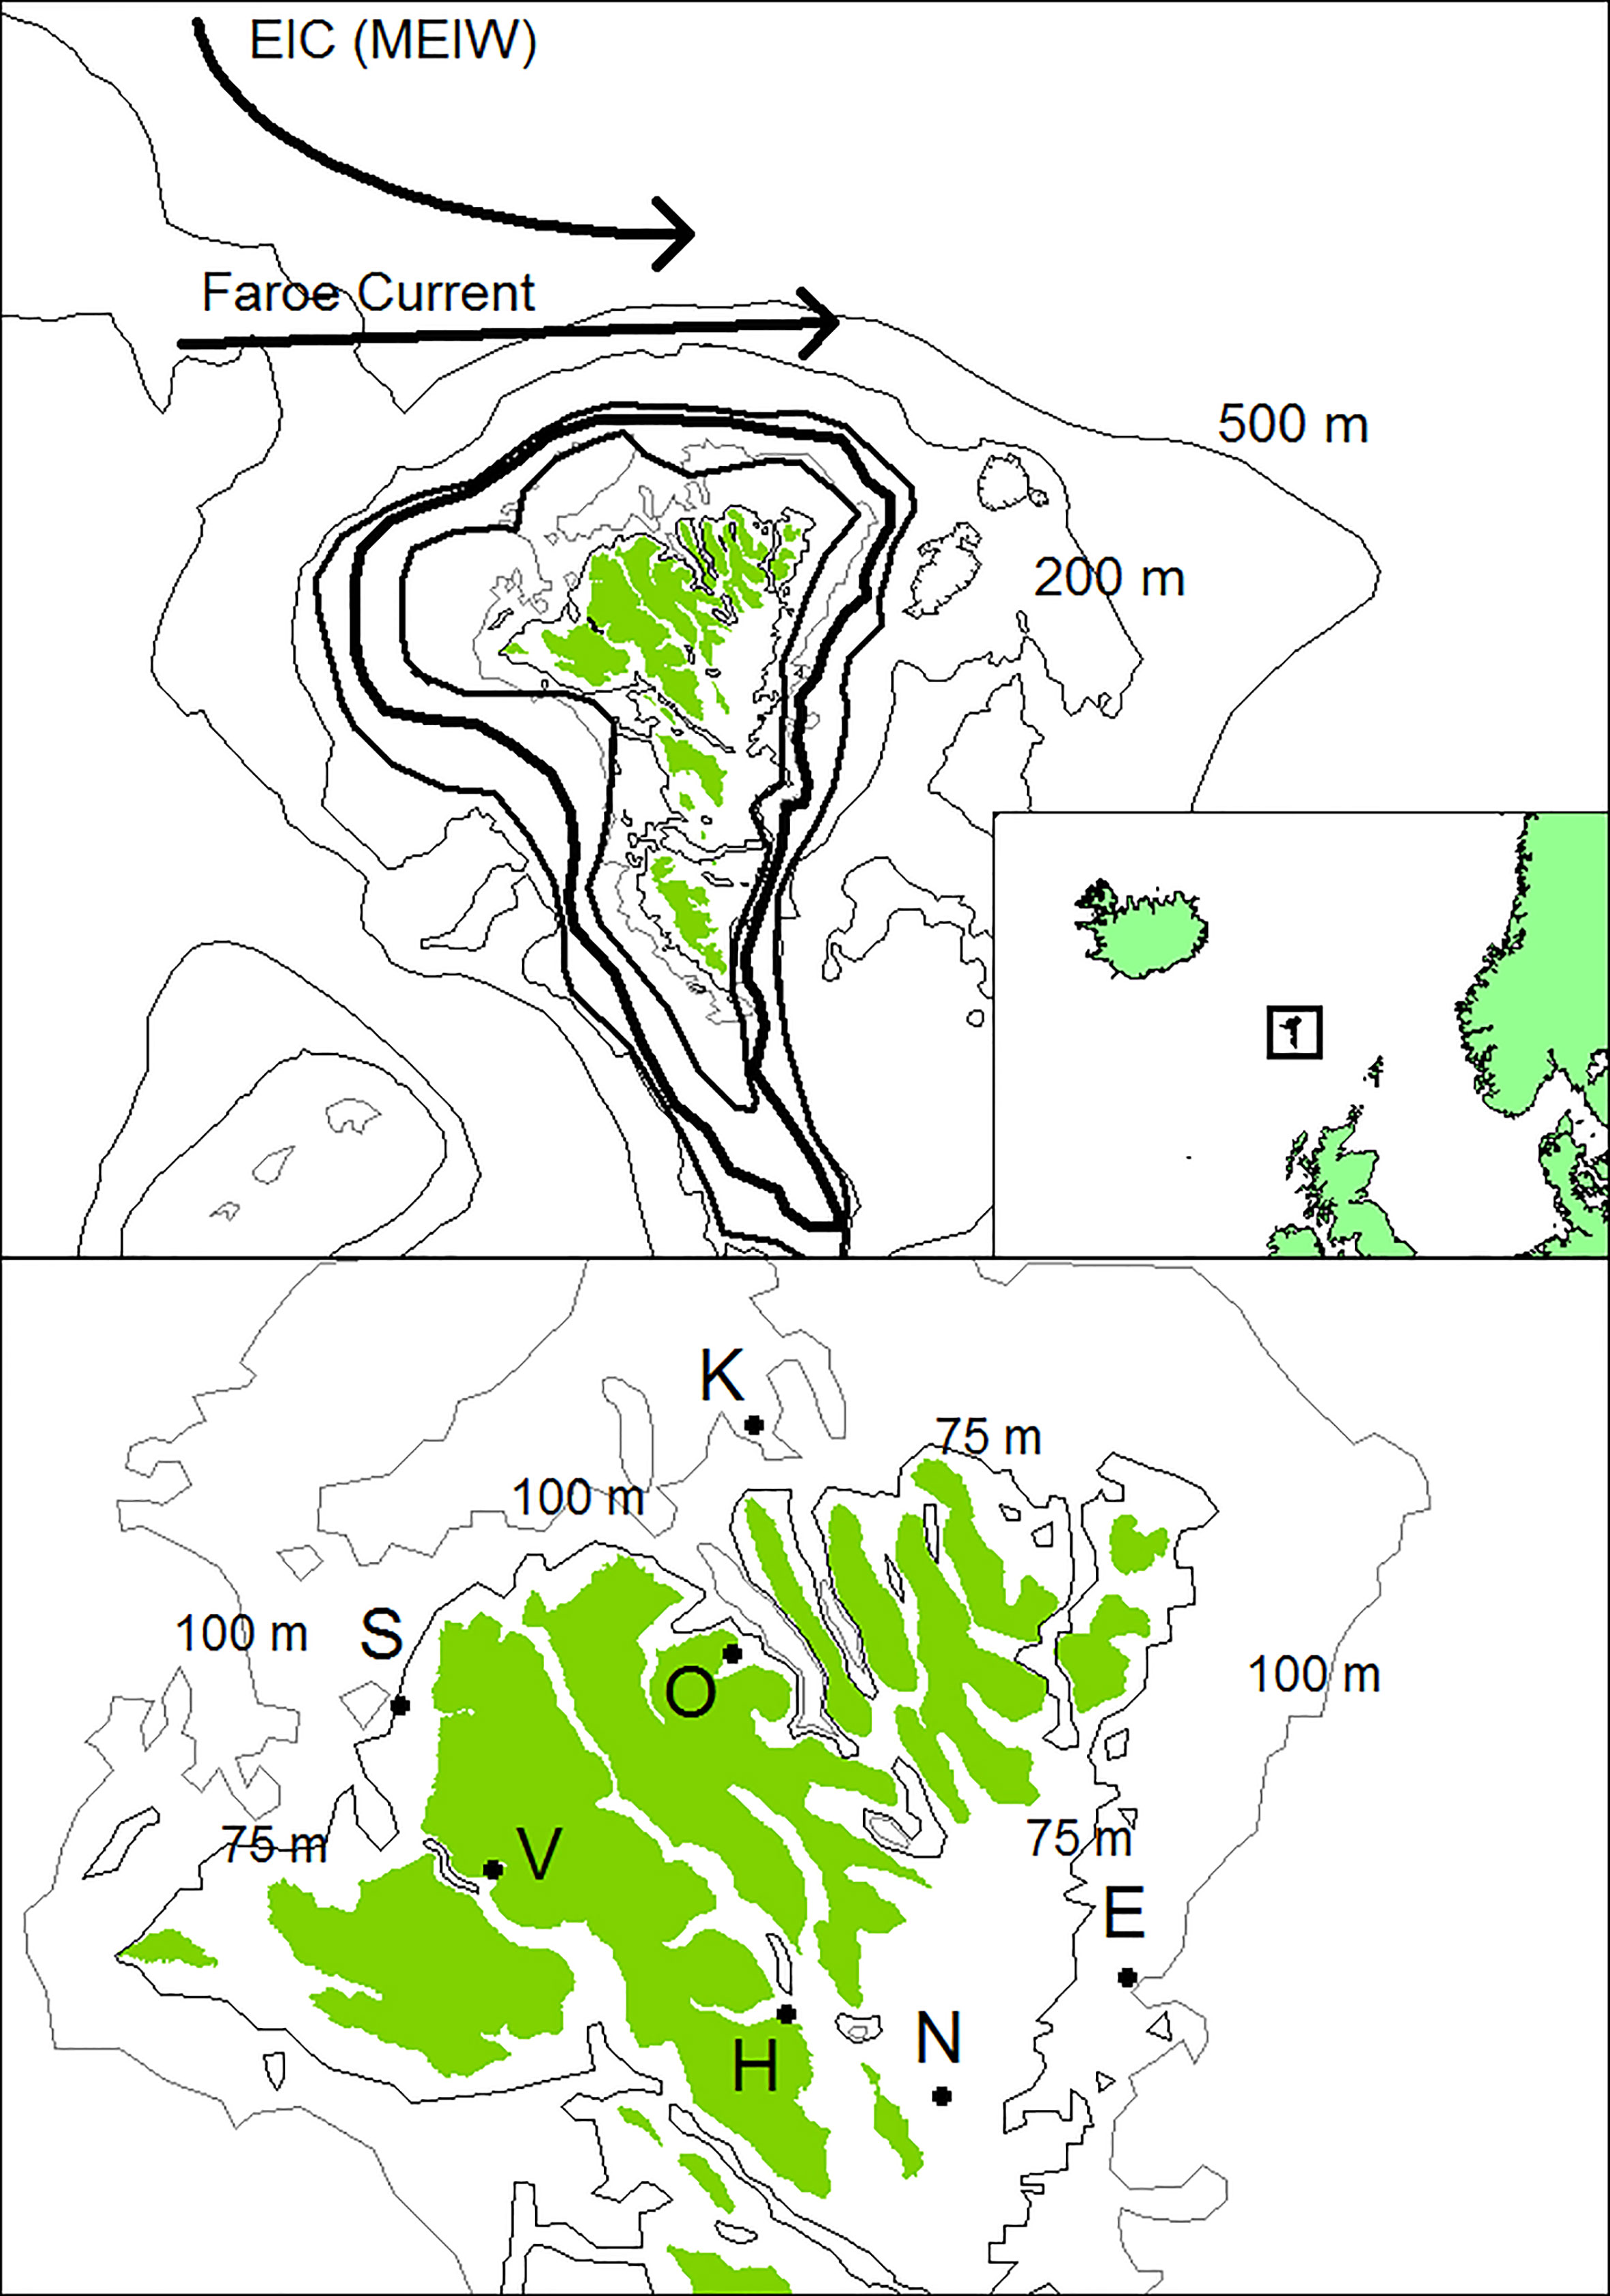
Figure 1 Locations of the sites where the A. islandica specimens were collected. The position of the tidal front (+/- 1 SD) is indicated by thick lines (based on Larsen et al., 2009). The location of the Faroe Current and the East Icelandic Current (EIC) or Modified East Icelandic Water (MEIW) is also shown. Thin lines show 75, 100, 200 and 500 m depth contours.
There has already been conducted a study of A. islandica growth on the Faroe Shelf (Bonitz et al., 2018) that was based on results from two locations. In the present study a large number of A. islandica specimens (154) have been sampled from seven sites on the Faroe Shelf and in coastal waters. The objective of the present study is to explore the potential to use A. islandica growth as a long-term ecosystem indicator by comparing with various atmospheric and oceanographic features and, more locally, with the plankton characteristics on the Faroe Shelf as well as biomass metrics of selected fish species. We hypothesize that the A. islandica growth will be negatively correlated with zooplankton biomass and positively correlated with bottom-feeding fish like flatfish and haddock (Melanogrammus aeglefinus) (Sørensen, 2021).
Materials and methods
Sampling of Arctica islandica
The specimens of Arctica islandica from the sites V, O, H (Figure 1) were collected by divers during spring 2010 (Table 1). The shells from site K were caught as bycatch on longlines in June 2011 by Faroese fishermen, just north of the island of Kalsoy. The shells from sites N and S were caught on longlines during the summer 2014 and 2015, respectively. The shells from site E (east) were collected as bycatch in a dredge fishery for Aequipecten opercularis in December 2012 and they were dead specimens unlike the specimens from the other sites that were alive when sampled. Since they were not overgrown with organisms and both shells were attached it was assumed that they had died during late summer or autumn 2012 due to the dredging activity. This growth ring was disregarded because it might not have been complete and the last valid growth ring was therefore for 2011. A. islandica siphons are sometimes observed in the dredged catch (U. Matras, personal observation) and the shells might have died because they could no longer feed without siphons and/or avoid predation by starfish. It is unlikely that the shells had been buried in the sediments for years (and therefore had avoided biofouling) because the dredge was designed to capture Aequipecten opercularis that are epibenthic. Also the shells showed no signs of black coloration due to iron sulfides that would be expected if they had been buried deeply in the sediments. Since most A. islandica shells in the dredged catch were either overgrown or detached we believe that setting the terminal year for site E to 2011 is the best we can do.
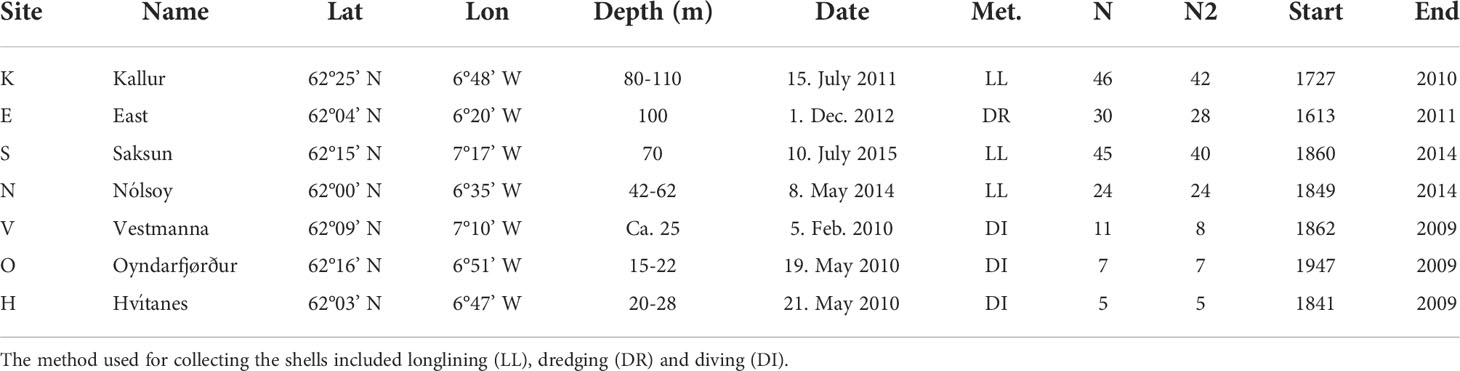
Table 1 Description of the Arctica islandica sample locations (sites) as well as number of shells sampled (N) and used in the study (N2) and time span in years of the oldest individual for each site. The true age is 15 years older than the depicted age.
Samples were frozen and later thawed to determine the biometric characteristics of the individuals. Shell length (longest anterior-posterior dimension), height (deepest dorsoventral dimension) and width (widest lateral dimension) were measured with vernier callipers to the nearest 0.1 mm, and the wet meat weight was determined to the nearest 0.1 g. Dry shell weights were measured to the nearest 0.1 g.
Age determination
The procedure used for age determination was the “Acetate Peel Method” as developed by Ropes (1987). The left valve of a pair was selected for sectioning since it has a single prominent tooth in the hinge. The tooth contains annuli useful in confirming counts made in the valve portion. Each valve was marked on the ventral margin at a point from the posterior end equal to one-third of the valve length. This oriented sectioning through the umbo and parallel to the broadest tooth surface (Figure 2). The valve was oriented with the tooth toward the front of the saw machine and was positioned to cut from the mark on the ventral margin through the middle of the tooth, or immediately beside the posterior edge of the tooth.
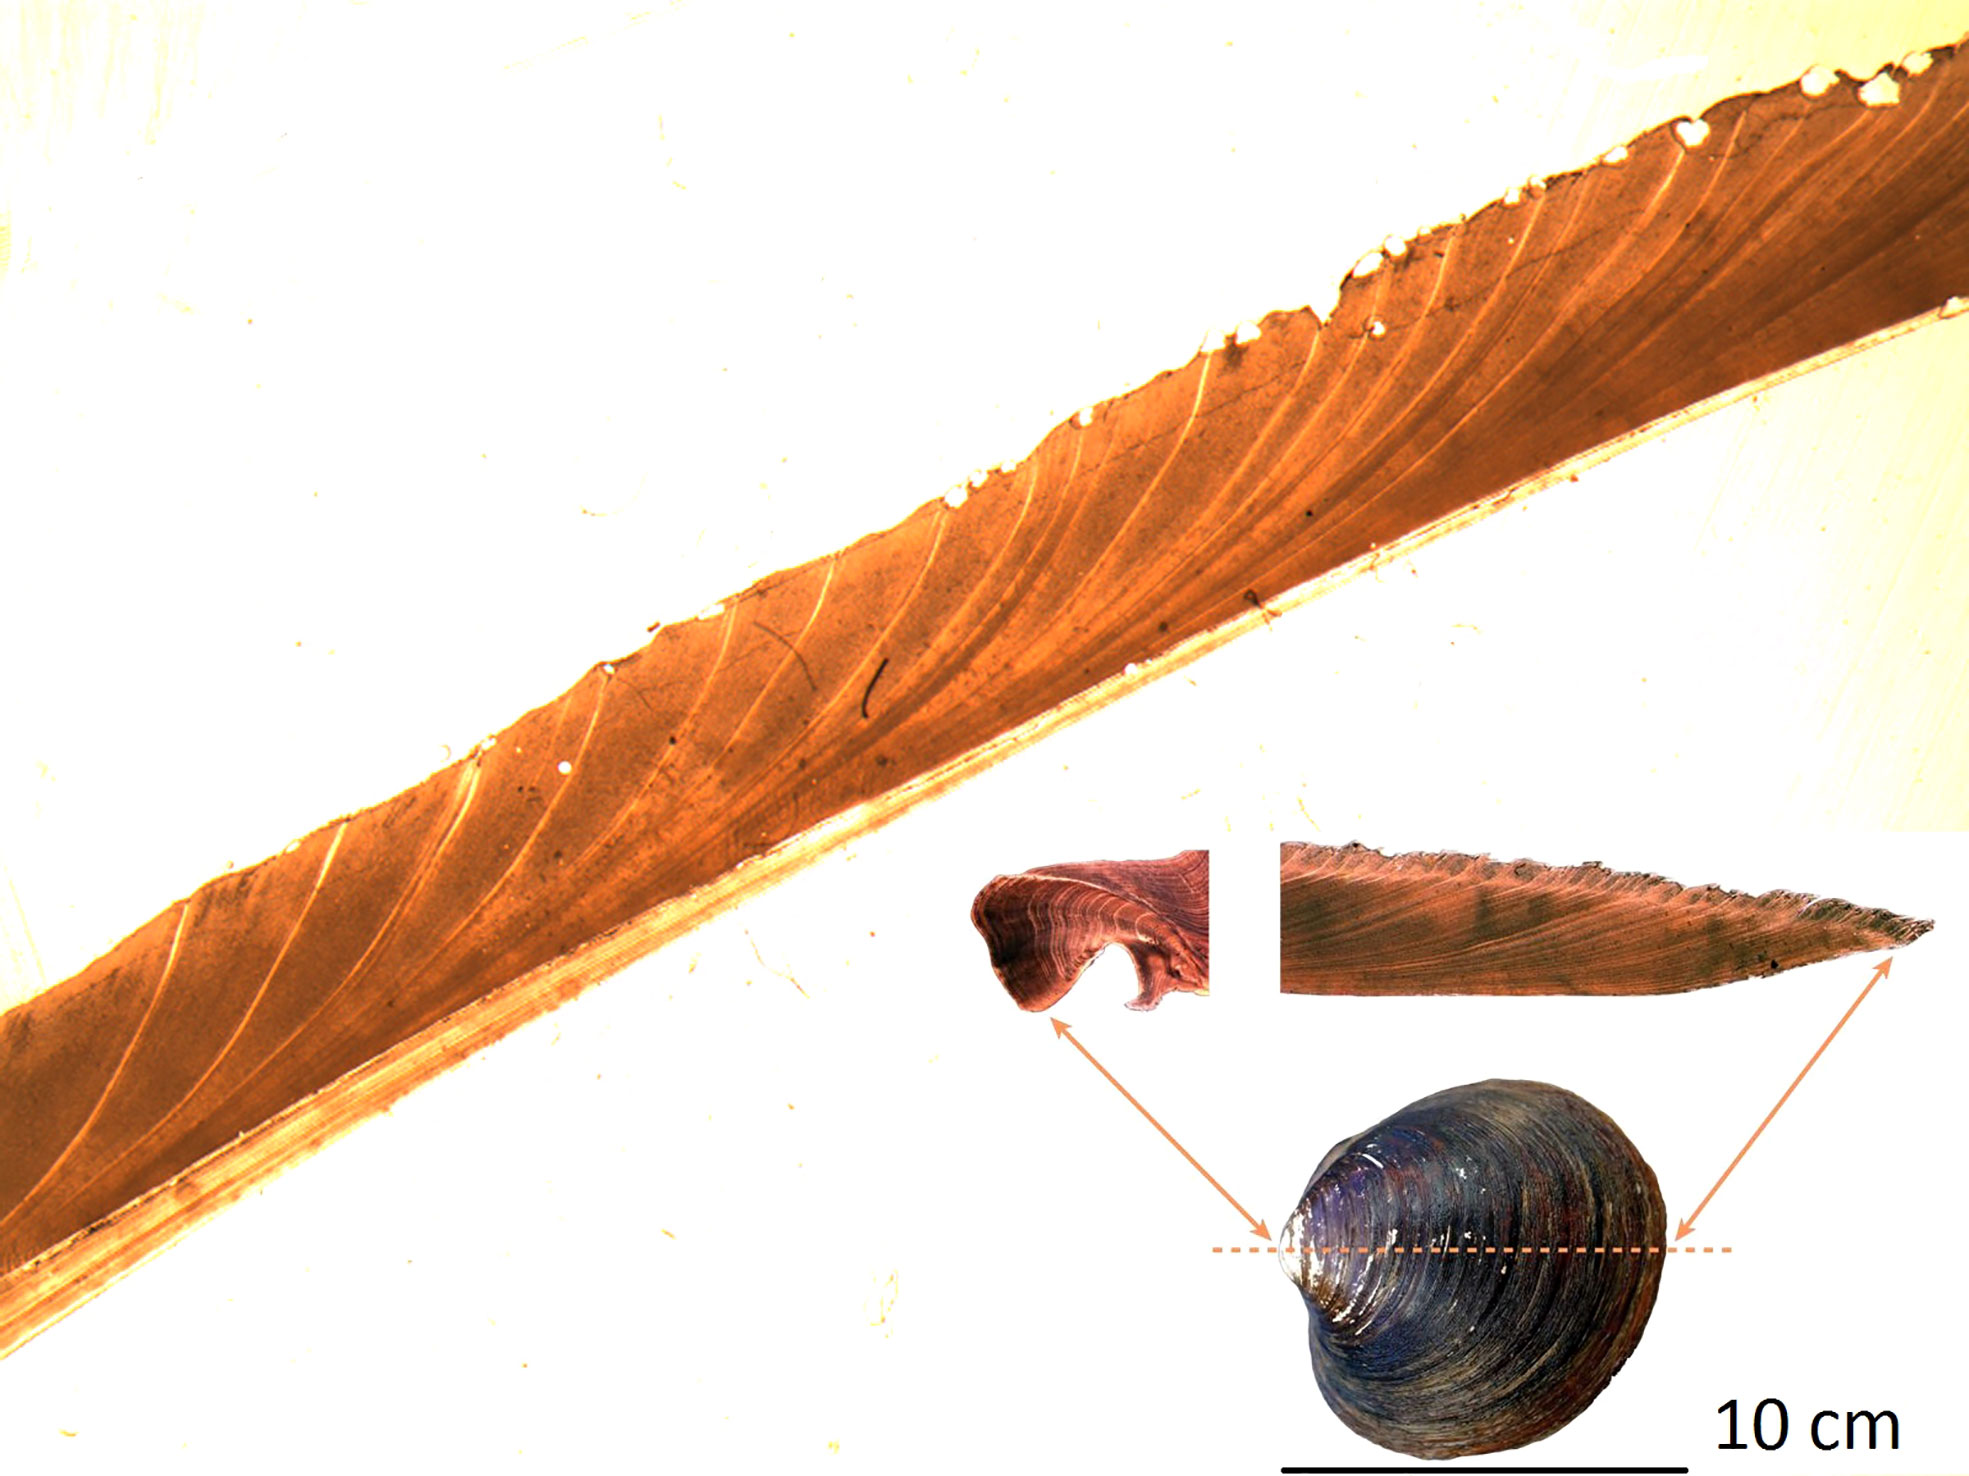
Figure 2 Photograph of the growth rings of a part of a typical A. islandica shell on the Faroe Shelf.
The cut valves that included the hinge tooth were embedded in an epoxy resin. The mixed epoxy was poured into folio moulds to a depth of about half to one cm. When lowering the valve into the epoxy, the cut surface was pressed down onto the mould bottom to force out bubbles. After an overnight hardening period, the embedded valves were removed from the moulds.
A grinding machine was used to obtain a flat, smooth surface on the embedded cut surfaces of the valves. Five successively finer grits (180, 500, 600, 800 and 1200) of carbide paper were used for grinding and polishing the surface. Most of the grinding was done with the coarse grit paper to remove epoxy and to expose the broadest area of the tooth; the finer grits were used to minimize scratches from the coarser grit papers.
After polishing the code numbers for each valve were engraved into the epoxy. These numbers were automatically transcribed onto the acetate peel during the next step. The polished block face was then placed in or flooded with a solution of citric acid and hydrochloric acid (in the proportion 0.625% and 0.75%) for one to two minutes, depending on the size of the shell, to etch the valve surfaces and subsequently rinsed in distilled water, taking care not to damage the etched surfaces. The block was left to dry for at least an hour or until the next day.
Acetate peels of type TACPHAN N 882 GL 50 MICRON were made by supporting the etched block with the surfaces uppermost and level. Acetone was pipetted onto the specimen and had to flood completely without bubbles for a successful peel. An acetate sheet was laid over the surface. After at least a one-hour drying period, the acetate sheet was peeled off and put between two object glasses for examination. Examination of the acetate peel was carried out under a light stereomicroscope Leica M80 and the image was digitized with the Camera Q Imaging, Retiga 2000R, FAST 1394. Annual growth increment widths were measured with the software Image-Pro Plus, Version 7.0 for Windows™.
Detrending
A detrending procedure was applied to the raw growth data. The width of the growth rings of A. islandica increases over the first five-ten years of life and decreases thereafter with increasing age (Stott et al., 2010). In order to extract year-to-year variations in growth rate it is necessary to remove the ontogenetic growth trend. This can either be done by fitting growth curves to each individual or estimating a common growth curve for all shells in a particular area, i.e., a regional curve (RCS: regional curve standardization). This latter approach has the advantage to better reflect long-term changes in growth and is used in this study. The large number of shells makes such an approach feasible. It may be difficult to fit growth curves to the whole life of the shells and the first 15 rings were therefore excluded, i.e., all shells were 15 years older than the number of rings presented in the results. We used the program ARSTAN (Cook and Krusic, 2007), version 44h2 for Windows XP™ to estimate the regional growth curves and the residuals (measurements divided by the regional curve), see also Cook (1985). This program was originally developed for tree-ring analyses and commonly used for A. islandica, e.g. Bonitz et al. (2018). In the individual detrending procedure we used option 1, i.e., a negative exponential function: growth index = a*exp(-b(t))+k, where a, b, and k (positive) were fitted constants and t denoted growth ring number. For shells where this function did not work, the Hugershoff growth function was used, see below. In the regional detrending we used the Hugershoff growth equation, i.e., growth index = a(t+p)b*exp(-c(t+p))+k, where a, b, c, p and k were fitted constants and t denoted growth ring number with a potential offset with the integer p.
Cross-dating
In cases when a few tens of shells are evaluated a cross-dating procedure is normally performed where false or missing rings are identified by comparing with other shells. Also, starting with live-caught shells (with known end year) and matching dead shells (with unknown end year) to the growth pattern of live-caught shells, long term growth chronologies are constructed (see Bonitz et al., 2018). In this study the end year was known for all shells because they were either collected alive or assumed to be dead the previous year. Although other published studies have reported high correlations between the growth of individual shells (Schöne et al., 2003a) this appeared to be much more diffuse in our material leaving it difficult to identify years with unusually wide or narrow bands (marker years) (Butler et al., 2009). Preliminary results from the COFECHA program (Cook and Holmes, 1986) suggested that there was no simple way to match the growth of individual shells to each other without excluding many shells from the material and/or deleting or adding a number of growth rings for individual shells. This selection process may be difficult to perform based on growth rings alone in the absence of absolutely dated growth years. However, the high number of shells was considered to represent an alternative way to detect a common signal even though the correlation between individual shells was low and this procedure was followed in this study. The technique of increasing the number of observations in order to get higher representativeness and higher precision is a fundamental principle in statistics (e.g. Motulsky, 2018).
Construction and validation of growth indices
In order to take potential effects of seawater depth into account the material was split up into coastal sites (NVOH) and shelf sites (KES). The pooled data for the shelf sites and coastal sites were treated by the ARSTAN program. The program estimated the regional curves for these two sites and the Hugershoff growth equation was used because initial analyses suggested that this growth function never became negative or showed erroneous results. We did not use data adaptive growth functions such as splines, since these functions may just follow the data and not detect important signals, in this case deviations from the general trend. The ratio of the individual growth increments in relation to the expected ontogenetic growth (from the RCS curve) was used as the growth index. The robust (bi-weight) procedure was used in order to avoid the unwanted effects of potential outliers and the program also provided bootstrapped confidence intervals for the growth indices. The standard (std) growth index was used with no variance stabilization. We also quantified the differences in growth between the individual A. islandica sites in an eastward (clockwise) direction. This could be done by averaging sites E and N and subtracting the average of sites S and K. However, this procedure would require the existence of all four data points in order to be calculated and the time series would end in 2010. Instead we assigned the S-K-E-N sites the x-values of 1, 2, 3 and 4, respectively, and the y-values of the A. islandica growth and calculated the slope of the regression line (y versus x). This was done for each year separately. For example, a positive slope showed that sites E and N grew faster than sites S and K. The benefit of this approach was that the time series could be extended to 2013 although the last three data points were associated with higher uncertainty.
When evaluating the robustness of the A. islandica growth indices we used the method presented by Stott et al. (2010), which is based on references presented in the paper. Stott et al. (2010) used the Expressed Population Signal (EPS), which is a signal-to-total variance ratio: EPS = nr/(nr+(1-r)), where r is the average correlation coefficient of all combinations of growth series for individual shells and n is the number of shells covering a specified time interval. The ARSTAN program also provided the EPS values.
The regional curve standardization (RCS) procedure is normally regarded to preserve the long term, decadal or centennial, variability in the growth time series of A. islandica (e.g., Butler et al., 2013). However, in cases where slowly growing individuals attain the oldest ages the growth time series may show an increasing growth trend over time as confirmed by preliminary investigations of the material. The problem was partly avoided by excluding the 11 oldest individuals (born prior to 1825).
Environmental data
Sea surface temperature and the tidal front
A data series of sea surface temperature, extending from 1914 to 1969 and 1991 to 2014 was obtained from two coastal stations as presented in Larsen et al., 2008 (their Figure 8A). For the analysis herein, only the April to August seasonal mean was selected since the growth of A. islandica in Faroese waters is restricted to this period (Bonitz et al., 2018).
To determine the hydrographic environment at the A. islandica sites, we estimated location and variance of the tidal front based on Larsen et al. (2009). They used seven years of underway SST data from R/V Magnus Heinason, 65 Towed Temperature Wire sections and available CTD data from several years on the Faroe Shelf (including standard hydrographic sections crossing the shelf) to determine the typical location and variation of the front. The findings of Larsen et al. (2009) compared well with a more recent analysis by Eliasen et al. (2017a) using near-surface satellite chlorophyll data.
NAO index
North Atlantic Oscillation (NAO) Index Data were obtained from the Climate Analysis Section, NCAR, Boulder, USA, Hurrel and Deser (2009) (updated regularly). Accessed 22 November 2021.
AO index
The Arctic Oscillation index was obtained as an ncep analysis product and obtained from the website:
https://www.cpc.ncep.noaa.gov/products/precip/CWlink/daily_ao_index/monthly.ao.index.b50.current.ascii.table on 14. February 2022. The average of all twelve months was used.
AMO index
The Atlantic Multidecadal Oscillation index (Trenberth et al., 2021), unsmoothed from the Kaplan SST V2, calculated at NOAA PSL1, http://www.psl.noaa.gov/data/timeseries/AMO/, was downloaded 9. March 2022. The average of all twelve months was used.
Subpolar gyre index
The subpolar gyre index, based on satellite altimetry, was taken from Hátún and Chafik (2018) with updates and extended back to 1960 with a linear regression 1994-2003 against the data in Hátún et al. (2005).
Windspeed data
Windspeed data for the Faroe Shelf (lon = -7.5 dec. deg. lat = 61.9033 dec. deg) was obtained from ‘http://www.esrl.noaa.gov/psd/data/gridded/data.ncep.reanalysis.html’. Dataset_title = ‘NCEP-NCAR Reanalysis 1’. Title = ‘mean daily NMC reanalysis (1948)’. Description = ‘Data is from NMC initialized reanalysis (4x/day). It consists of T62 variables interpolated to pressure surfaces from model (sigma) surfaces.’ The average of all twelve months was used.
Faroe current volume transport
As an indicator of the strength of the North Atlantic drift, we use data for the Faroe Current volume transport. The Faroe Current is the largest of three Atlantic inflow branches towards the Nordic seas and volume transport is monitored just north of the Faroe Shelf (Hansen et al., 2015; Østerhus et al., 2019). The volume transport estimate is based on a combination of in situ Acoustic Doppler Current Profiler measurements (initiated in 1997), hydrographic observations and satellite altimetry sea level anomaly (since 1993) as described in Hansen et al. (2015).
Phytoplankton
An annual index of accumulated new primary production was based on nitrate drawdown in Faroese shelf waters from winter level to late June 1990-2014 plus a calculated mean net influx of nutrients into the shelf water (Gaard and Hansen, 2000; Gaard, 2003; Steingrund and Gaard, 2005).
Zooplankton
Zooplankton was collected annually during the second half of June 1990-2014 as part of monitoring activity at FAMRI. The sampling was conducted on vertical hauls from 50 m depth to the surface using WP-2 nets with a mesh size of 200 µm. The towing speed was 0.3–0.5 m s-1. Zooplankton biomass was determined by drying at ~60°C until a constant weight was attained. The time series for zooplankton biomass represents an average over 20-25 stations that were distributed throughout the shelf inside the 100 m bottom depth contour (Jacobsen et al., 2019).
Fish data
Long term fish data for fish feeding on bottom organisms were obtained from commercial biomass and landings data. A long-term, 1914-2017, biomass time series of haddock (Melanogrammus aeglefinus L) was obtained from ICES (2016) with updates in ICES (2021). Landing data for European plaice (Pleuronectes platessa, L) and lemon sole (Microstomus kitt, L) was obtained from ICES catch statistics (www.ices.dk). Taking the geometric mean of these catches was assumed to preserve the time development for each species better than adding the catches. The years associated with war periods plus some years after were removed in order to avoid effects of extremely low fishing pressure and its effect on catch and stock size.
Statistics
We used simple linear regression to analyze the relationship between A. islandica growth (y) and various variables (x). In one case we used multiple regression since we had two x-variables. When analyzing whether two variables, which themselves are time series, are correlated, autocorrelation could be taken into account. We used the “modified Chelton method” proposed by Pyper and Peterman (1998) that has a procedure to calculate the “effective” number of degrees of freedom as outlined in equations 1-3.
where rXX(j) is the autocorrelation coefficient of time series X at lag j, N is the sample size (number of years), and Xarit is the aritmetric mean of time series X. The same formula was used to calculate rYY(j).
where N* is the “effective” number of degrees of freedom and N/5 is rounded down to the nearest integer.
The effect of autocorrelation on the statistics is a matter of which assumptions are made. If it is assumed that the values for the years are independent of each other traditional regressions can be made. If it is assumed that the high (low) values of adjacent years are somehow connected the regression needs to take autocorrelation into account and reduce the effective number of data points and increase the corresponding p-values. Potential biological or oceanographic mechanisms may still be valid even though they cannot be demonstrated statistically due to a high autocorrelation, see discussion about cod recruitment in Canadian waters (Drinkwater, 2002).
Results
Construction of A. islandica growth indices
Growth bands were easily identified in most of the shells (Figure 2). The shells generally grew slower with increasing age (Figure S1) and removing this ontogenetic trend (Figure S2) provides a relative annual growth index, herafter termed ‘A. islandica growth’ or just ‘growth’ for each of the sites (Figure 1). Annual growth at sites in closest proximity correlated weakly positively with each other (R = 0.20-0.45) and distant sites weakly negatively (R = -0.14) in a clockwise direction around Faroe Islands: S-K-E-VOH-N (Tables S1–S4, Figure S3). Importantly, there was a systematic pattern in the differences between sites (see procedure in methods). The eastern sites (E and N) grew faster than the western sites (S and K) when the volume transport of the Faroe Current was larger than normal (Figure 3). In order to account for this spatial signal and also to take water depth into account we pooled coastal sites (NVOH) and shelf sites (KES) (Table 1). The shelf sites were mostly located inside the tidal front, although site E was close to the boundary of the tidal front and therefore may have experienced variable hydrographic conditions as the tidal front moves closer to (away from) the shore on a range of time scales (fortnightly to annual) (Figure 1).
Figure 3 The difference in growth of A. islandica between eastern (E, N) and western sites (S, K). The sites were arranged in an eastward direction as the sequence S-K-E-N with x-coordinates 1 to 4 and y-coordinates equal to the A.islandica growth. The difference in growth between eastern and western sites was, for each year separately, quantified as the slope of the regression line between y and x. Upper: compared with the shelf A. islandica growth index (sites KES). Lower: compared with the Faroe Current volume transport.
There was a low correlation between the growth of individuals as measured by an average coefficient of correlation (R-bar) of 0.02 to 0.12 (Figures 4; S4, S5). However, the large number of shells gave sufficiently high EPS values for the shelf sites from c. 1935 to 2014 as judged by the (default) 50 year moving window of EPS in Figure 4. Removing the 11 oldest shells increased the EPS values prior to 1898 and this might have been related to the revision of the regional curve standardization (RCS), see Figures S6–S8. If the E series was omitted due to the slightly uncertain end point of the series (it was assumed to be one year prior to year of capture based on the appearance of the shells) the EPS values became negative prior to 1906 (not shown) indicating the E series could not be removed from the material.
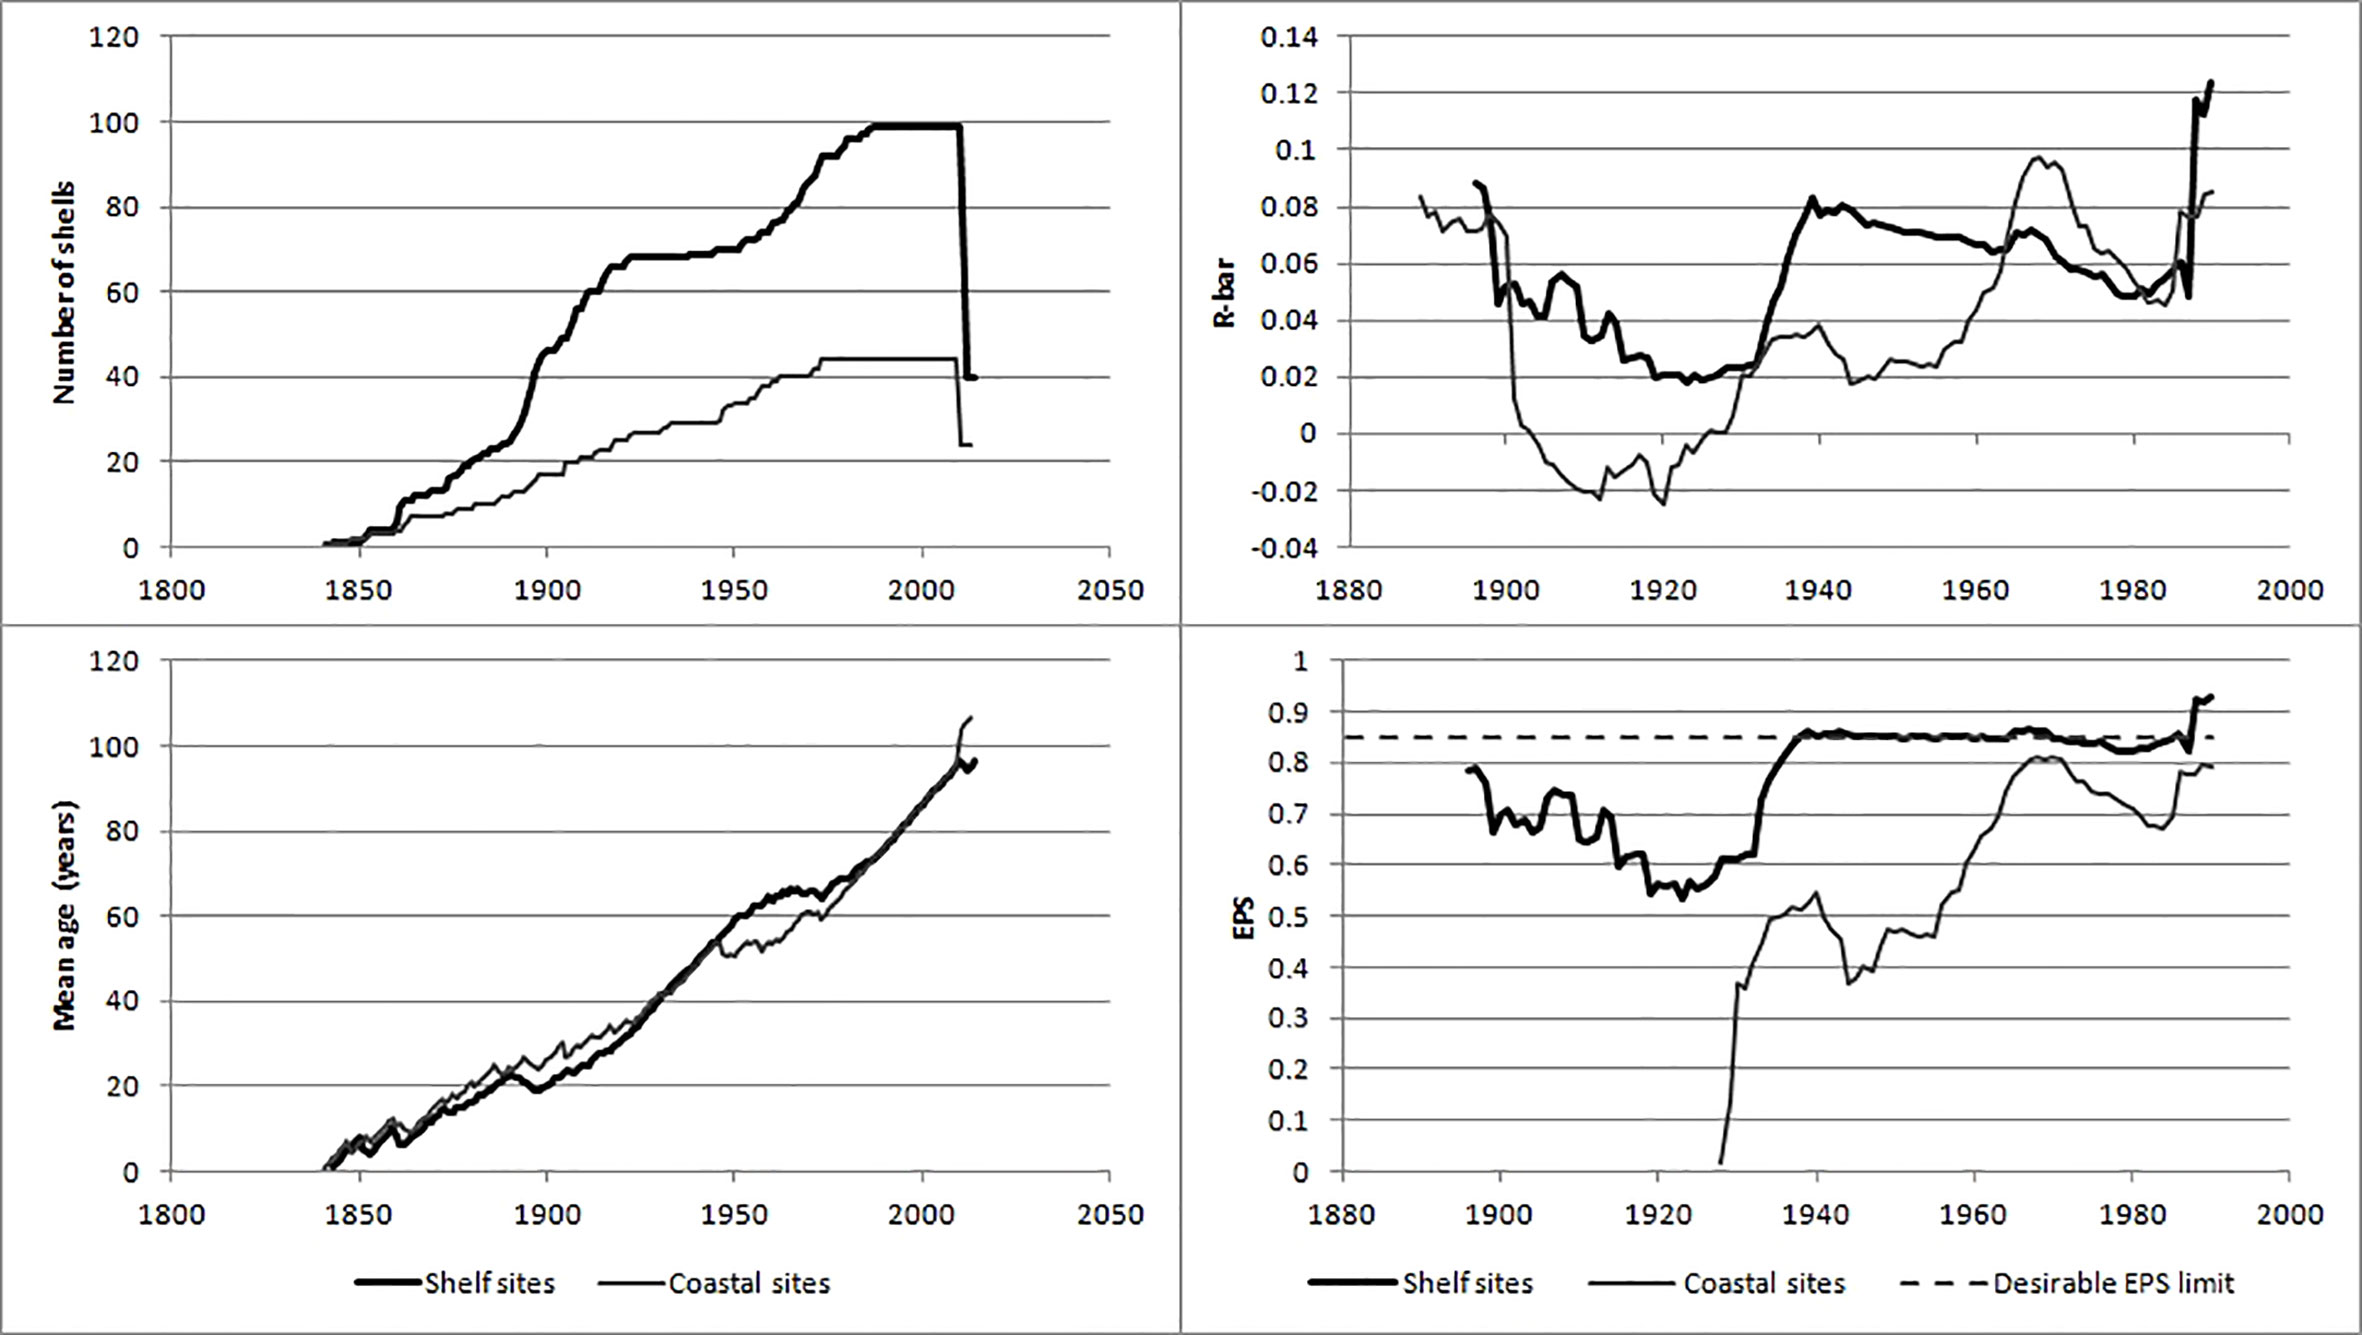
Figure 4 Statistics associated with the shelf and coastal A. islandica growth indices. Upper left: the number of shells as basis for the indices, lower left: the corresponding mean age for the shells, upper right: the average correlation coefficients for moving 50-year windows, lower right: the corresponding Expressed Population Signal, EPS. The true age is 15 years older than the ‘mean age’.
Based on the EPS values, the shelf A. islandica growth index was sufficiently accurate from c. 1873 (25 years before 1898) to 2014 although the EPS values were lower and varied between 0.55 and 0.75 from 1899 to 1933. The coastal A. islandica growth index had a nearly sufficiently high EPS value back to c. 1959 and consequently a reliable growth index from c. 1934 (25 years before 1959). These conclusions seem to be justified by considering the 95% confidence intervals of the two growth indices (Figure 5). The shelf and coastal A. islandica growth indices were also weakly positively correlated with each other (Figure 6). Accepting lower EPS values for the coastal A. islandica growth index and extending it back to 1873 increased the R-squared from 0.17 to 0.23. Omitting the years from 2010 to 2013 increased it to 0.28 (Figure 5). Applying two different detrending methods, a negative exponential function applied on each individual versus a common regional growth curve, gave very similar results for the shelf A. islandica growth index, see Figure S9, indicating a robustness to detrending methods. In summary, both the coastal and shelf A. islandica growth indices show similar overall trends: slow growth periods in 1870-90s, 1930s, 1980s and rapid growth periods in 1900-10s, 1950-60s and 2000s.
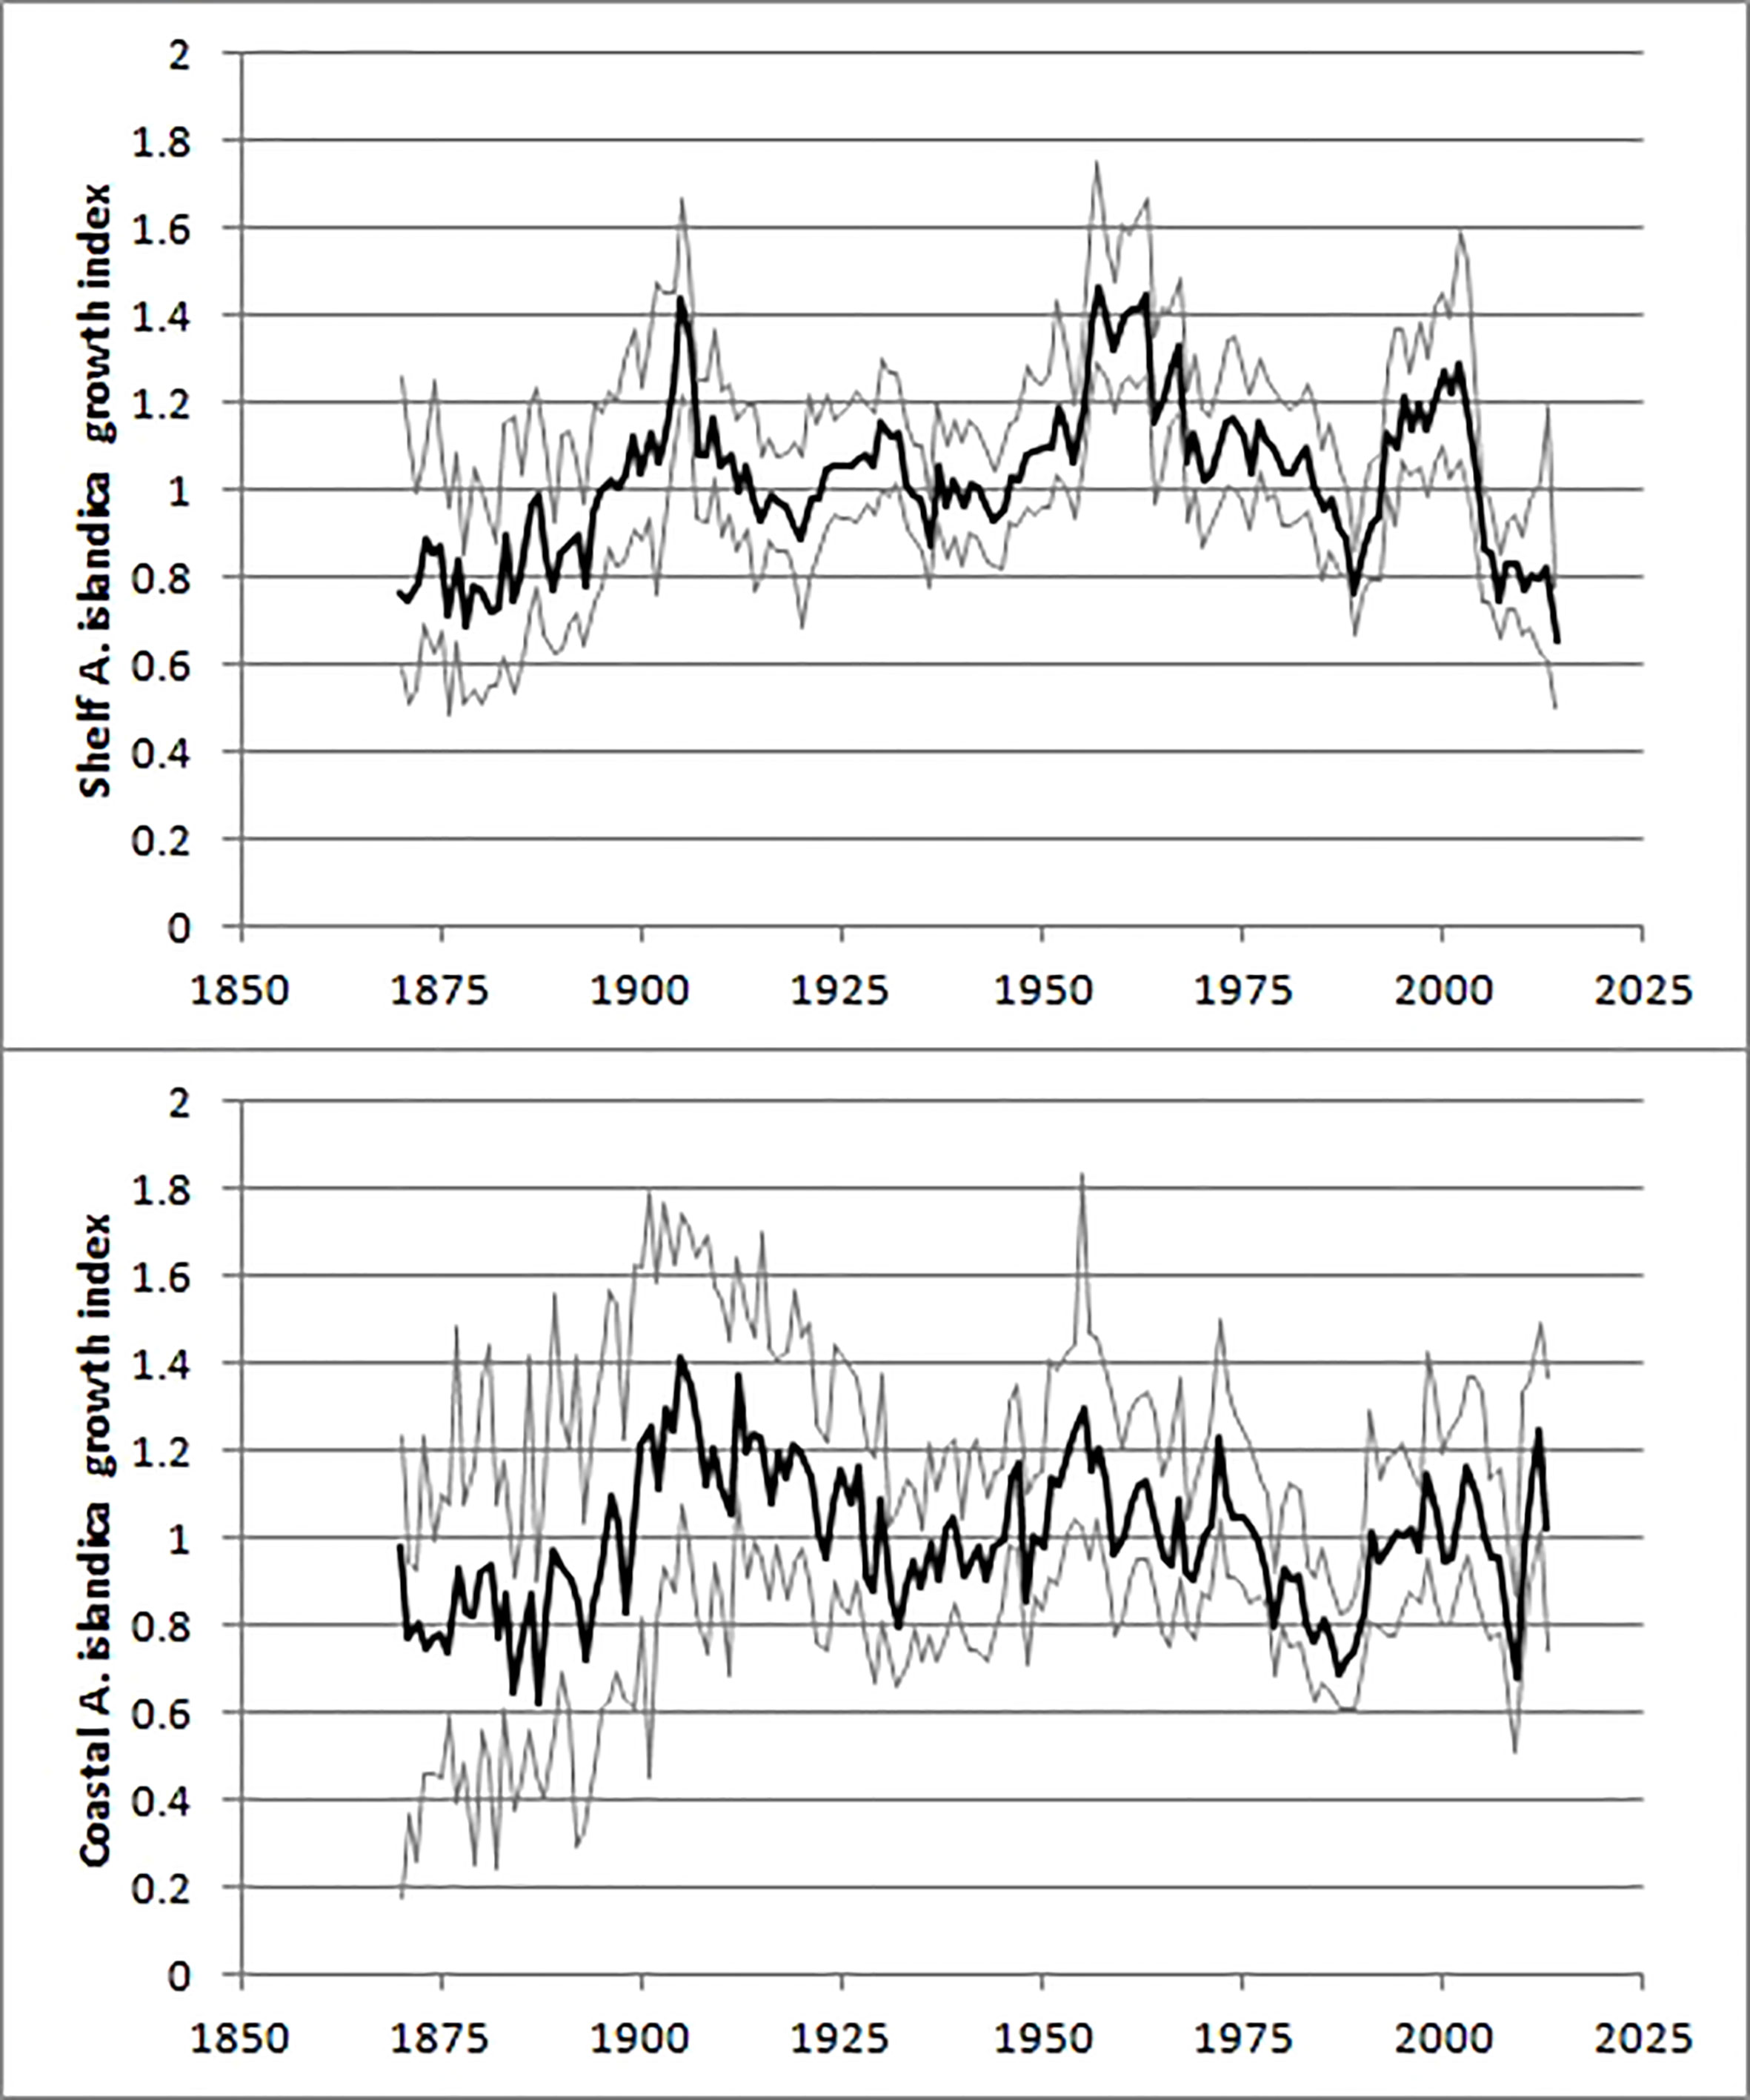
Figure 5 The shelf (upper) and coastal (lower) A. islandica growth index. Thin lines indicate the bootstrapped 95% confidence intervals.
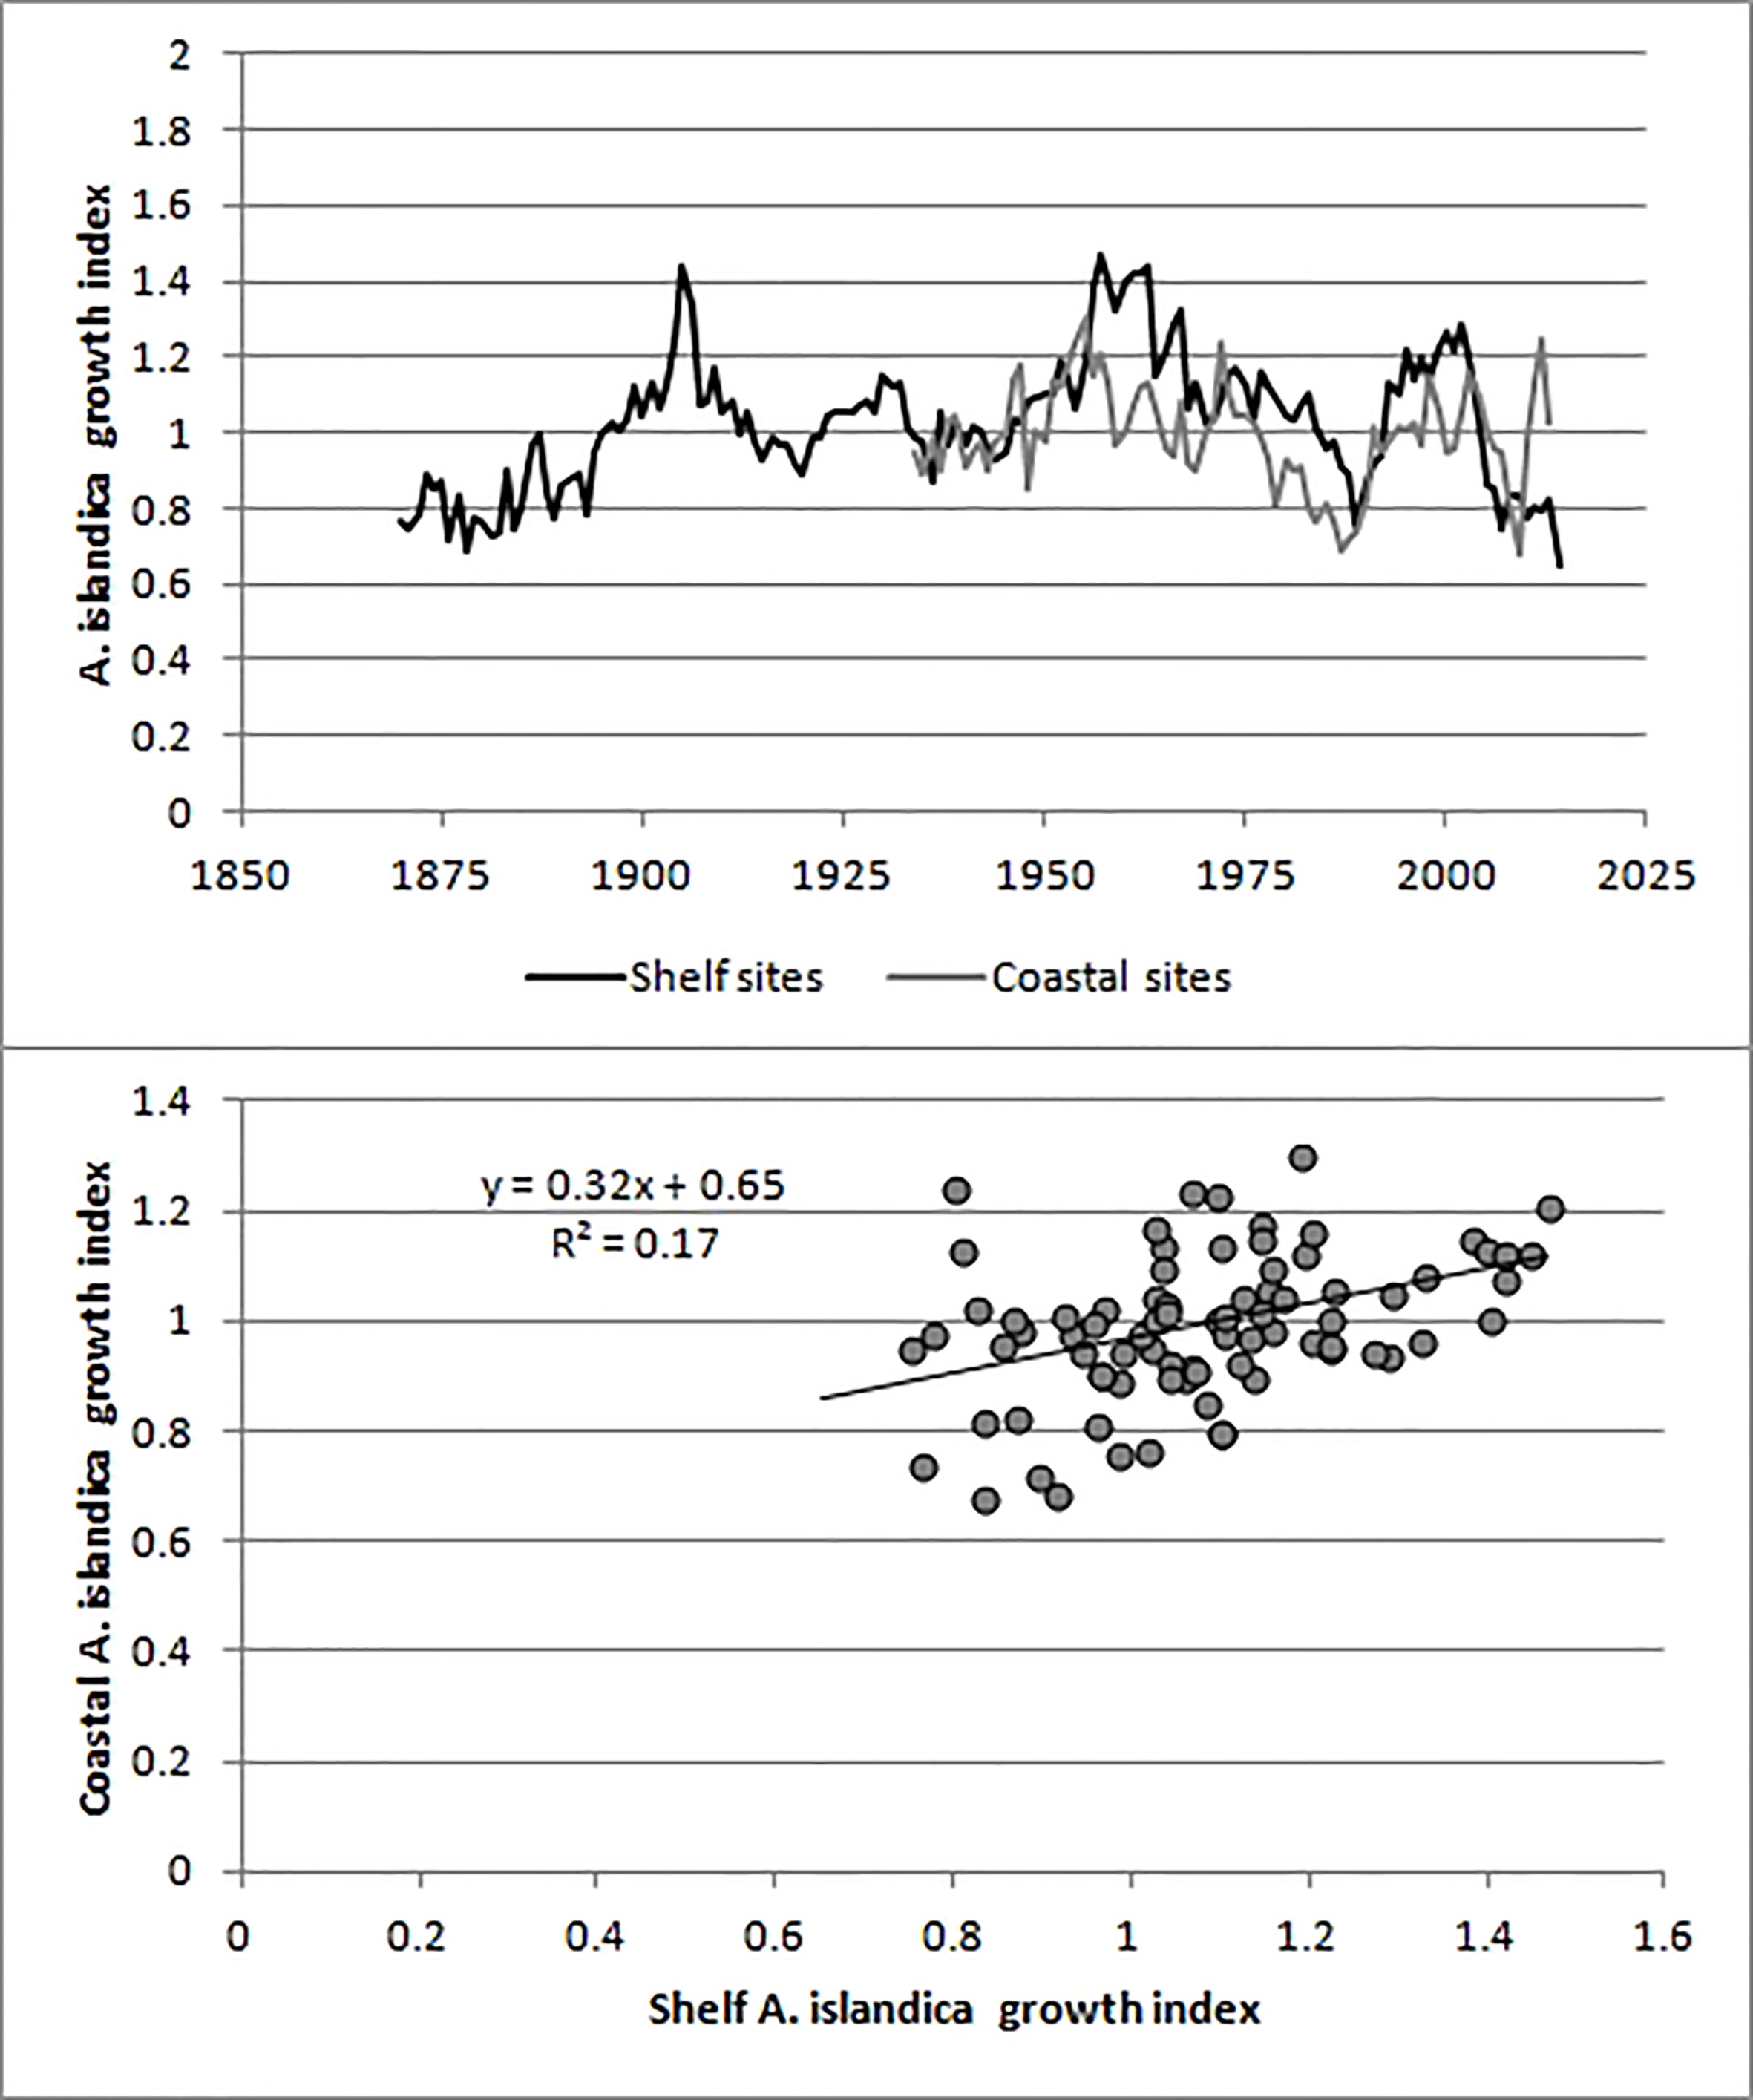
Figure 6 Comparison of the shelf and coastal A. islandica growth indices.
Since the shells were live collected the end year in the time series was known and the construction of the A. islandica growth indices could be done without the traditional cross-dating procedure. Identifying and correcting potential age reading errors on the basis of years with unusual rapid or slow growth was not feasible in this study since such years occurred in a non-systematic way (Figures S4, S5). For the site E, where the shells were collected dead and assumed to have had the last valid growth ring the previous year (2011), we checked this assumption by shifting the whole series back in time and got the highest correlation with other shells when the end year was set to 2011 (assuming that 2012 was not an option because that growth ring was probably not complete), see Table S7. Investigating series E in more detail we applied the program COFECHA. Results suggested that there were only two shells that consistently over a more than 100 year time period showed a shift (of -4 and -2 years, respectively) in the growth compared with the growth of the other shells in the KES series. Both these shells were among the eleven old shells that were excluded from the material for other reasons.
We compared our shelf A. islandica growth index with the growth chronology presented in Bonitz et al. (2018) that was based on shells sampled from partly the same area and where the cross-dating technique was applied. The latter chronology was based on the negative exponential detrending method that was applied for each individual shell (option 4 in the ARSTAN program) and was consequently compared with a version of KES that was detrended in the same way. There was a positive correlation between the shelf A. islandica growth index and the chronology presented in Bonitz et al. (2018), see Figure S10.
Comparison of A. islandica growth indices with other variables
There was no significant correlation between neither the shelf nor coastal A. islandica growth indices and large scale climatic indices such as NAO, AMO, AO or the gyre index (Table 2). This also applied to some of the more local variables such as sea-surface temperature on the Faroe Shelf as well as windspeed (Table 2). However, a negative correlation between the volume transport of the Faroe Current, that flows eastwards just north of Faroe Islands, and the shelf A. islandica growth index was observed (Table 2). There was a weak positive correlation between the shelf A. islandica growth index and an index of primary production on the Faroe Shelf although the statistical test (the Modified Chelton Method) showed the unexpected feature by having a higher N and lower p-value when autocorrelation was taken into account (Table 2; Figure 7). There was a strong negative correlation between the shelf A. islandica growth index and an index of zooplankton biomass/concentration in June/July on the Faroe Shelf (Table 2; Figure 7) although this relationship became insignificant when the strong autocorrelation was taken into account.
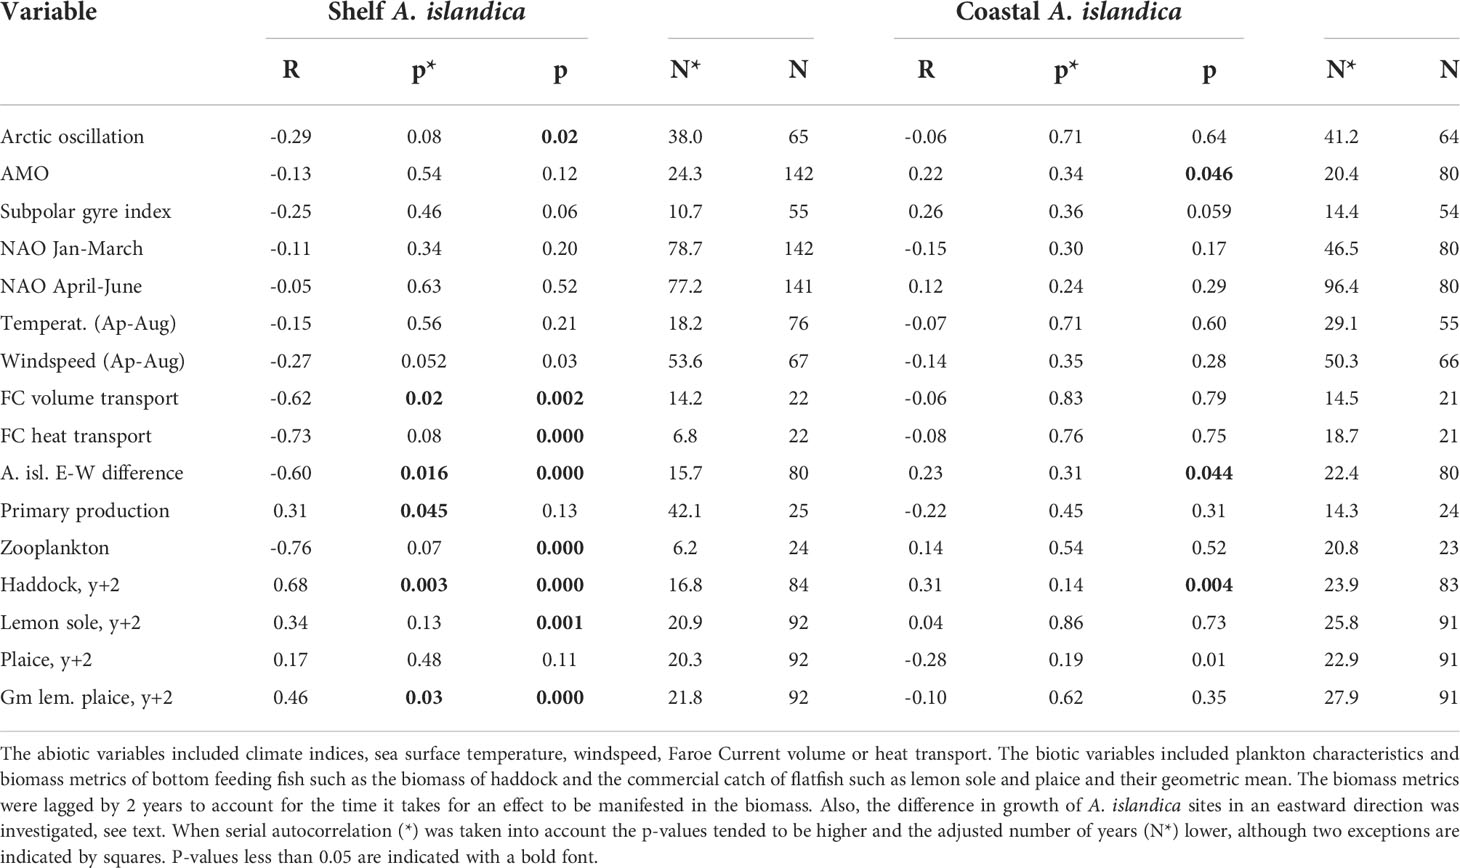
Table 2 Results from regression analyses between A. islandica growth indices from shelf sites (KES) or coastal sites (NVOH) and a variety of variables.
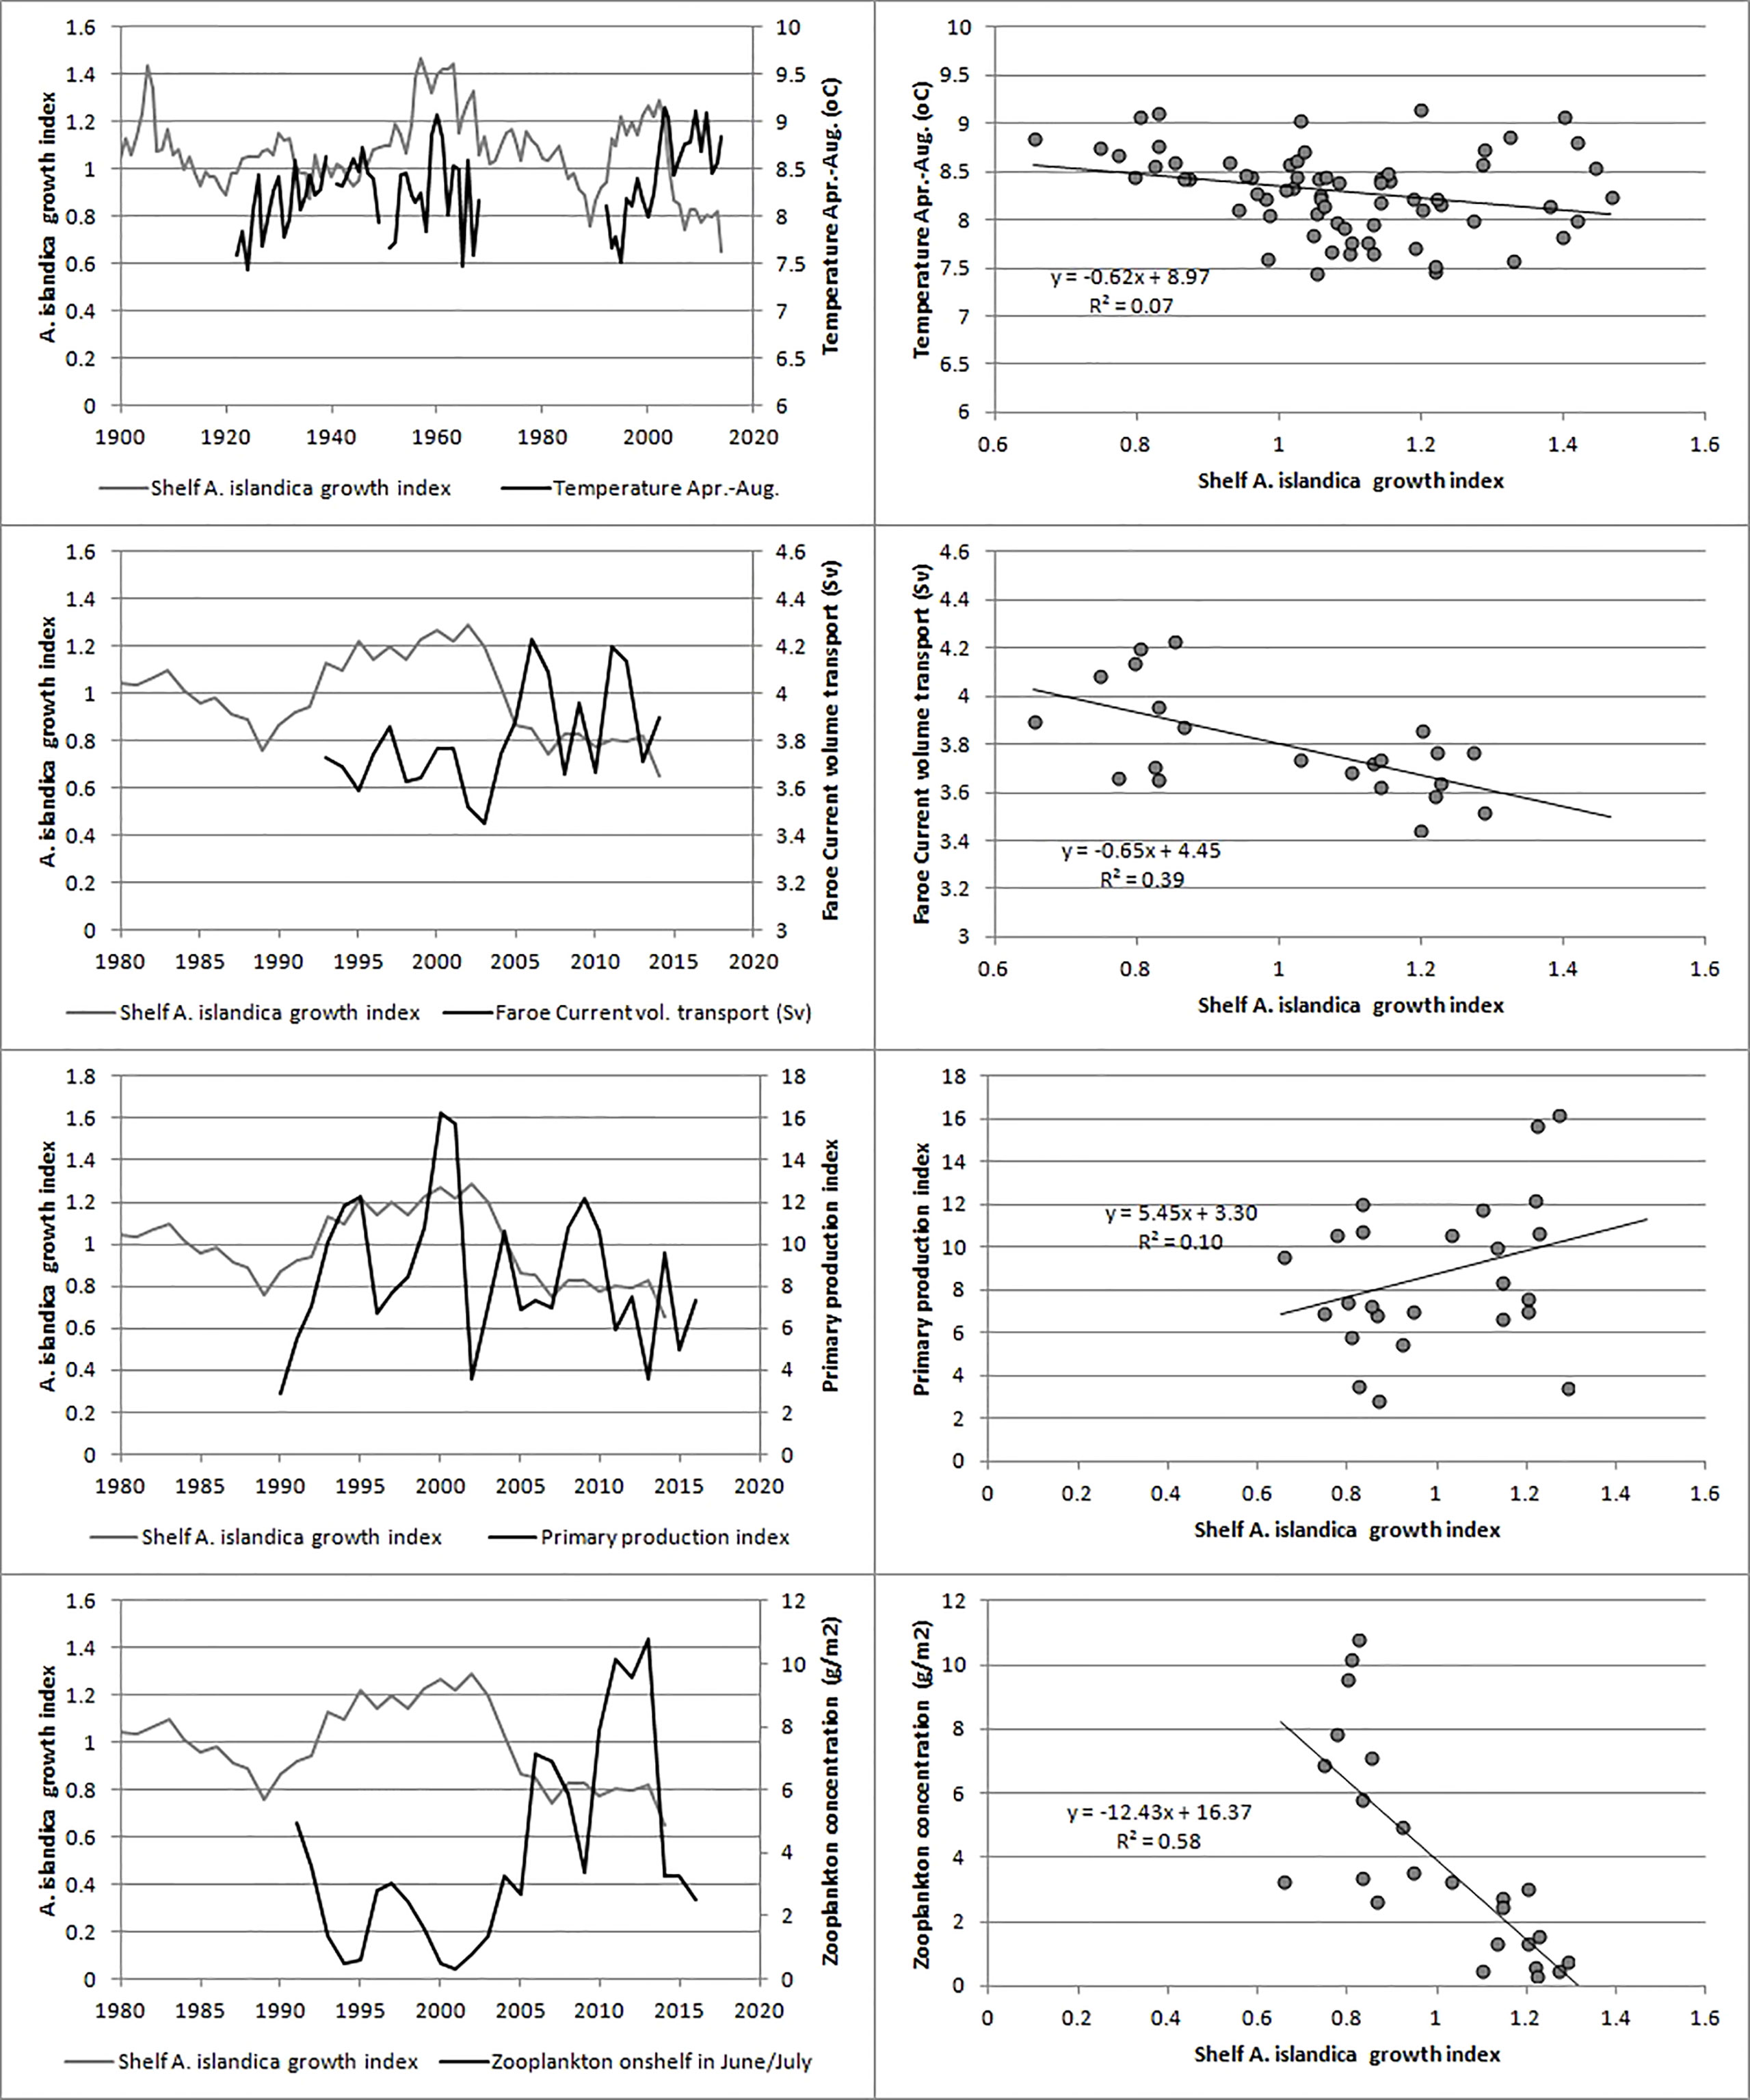
Figure 7 Relationship between the shelf A. islandica growth index and environmental factors shown as time series and as scatterplots. Top: sea surface temperature during April to August, upper middle: Faroe Current volume transport, lower middle: index of primary production on the Faroe Shelf, bottom: index of zooplankton biomass on the Faroe Shelf.
There was a strong positive correlation between the shelf A. islandica growth index and the biomass of haddock lagged by two years (Table 2; Figure 8) and this also applied to the coastal A. islandica growth index (Table 2). There was a positive, but insignificant correlation between the shelf A. islandica growth index and catch of lemon sole or plaice, but a much stronger correlation for a combination of them (Table 2; Figure 8). This correlation was weaker for the coastal A. islandica growth index (Table 2).
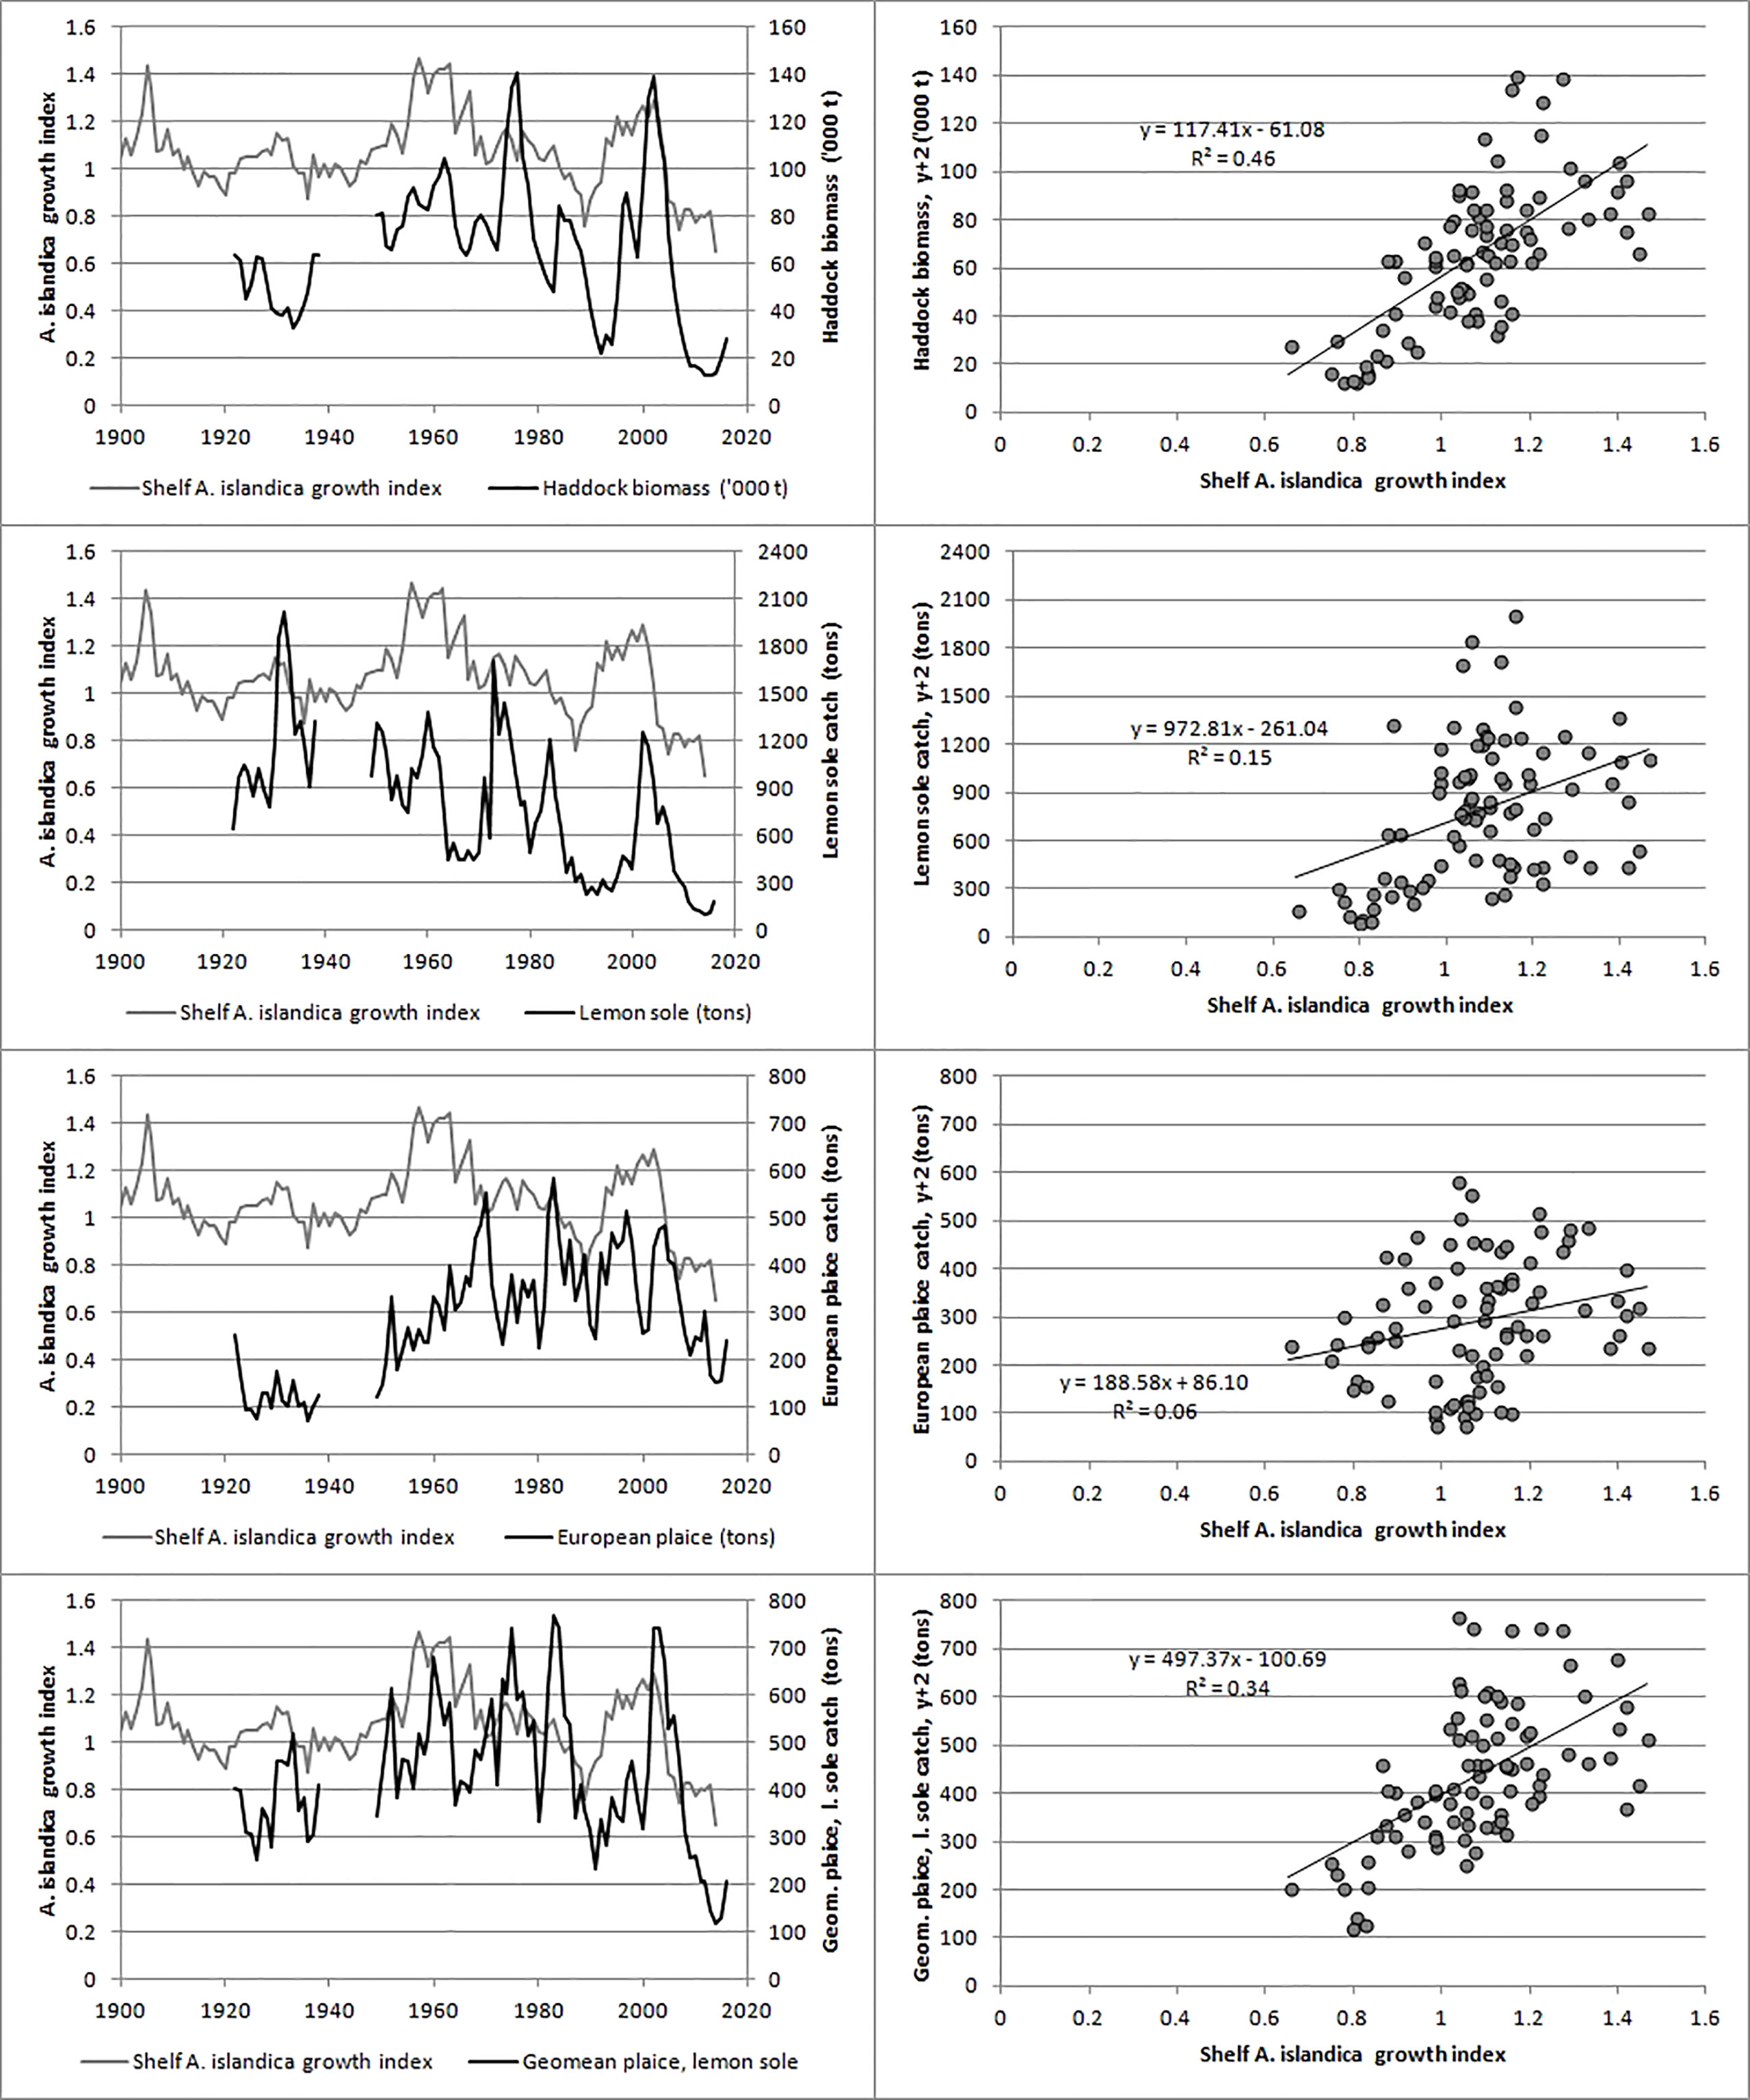
Figure 8 Relationship between the shelf A. islandica growth index and measures of bottom feeding fish on Faroe Plateau shown as time series and as scatterplots with a lag of two years (y+2). Top: haddock biomass, upper middle: catch of lemon sole, lower middle: catch of European plaice, bottom: geometric mean of the catches of lemon sole and plaice.
Discussion
The main finding of the present study is a long-term A. islandica growth index for the Faroe Shelf that may reflect the amount of fresh phytoplankton that reaches the near-bottom water layers and could probably be regarded as a proxy for the strength of pelagic-benthic coupling that is modulated through phytoplankton-zooplankton interactions in the overlying water. The A. islandica growth index appears to capture vital aspects of benthic production on the Faroe Shelf as represented by biomasses or catches of commercial bottom-feeding fish species. Through a detailed comparison with oceanographic and biological variables we propose potential mechanisms linking pelagic and benthic productivity on the Faroe Shelf.
The potential of A. islandica as an ecosystem indicator
A. islandica growth indices were not correlated with basin-scale climate indices (NAO, AO, AMO, SPG, Table 2). The strength of the North Atlantic subpolar gyre has been linked to a primary productivity index on the Faroe Shelf ecosystem (Jacobsen et al., 2019), but was not correlated with A. islandica growth indices (Table 2). On the other hand, we found a negative correlation between the volume transport of the Faroe Current (used as a proxy for the North Atlantic drift) and the shelf A. islandica growth index (Table 2). Relationships between ocean currents and A. islandica growth have been found for the North Sea (Witbaard, 1996). Looking even more locally, the Faroe Shelf sea surface temperature, which is representative for the water mass inside the tidal front (excluding local anomalies within fjords), exhibited a weak negative relationship with the shelf A. islandica growth index (Table 2; Figure 7).
No correlation was observed between the shelf A. islandica growth index and the primary production index on the Faroe Shelf (Table 2; Figure 7) even though the statistical test (the modified Chelton method) apparently provided a spurious positive relationship when autocorrelation was taken into account. The lack of correlation between primary production and A. islandica growth is in line with some studies (Witbaard, 1996), but in contrast with other studies linking primary productivity to growth of A. islandica (Bonitz et al., 2018) and knowing that A. islandica feeds on fresh phytoplankton (Witbaard et al., 2003). Recalling the negative relationship with temperature, this might appear somewhat counter-intuitive since there are examples of observed positive relationships with temperature (Butler et al. (2010); Reynolds et al. (2017); Poitevin et al. (2019)), but it may partially be caused by a negative relationship between temperature and primary production on the Faroe Shelf (Gaard, 2003). The effect of primary production may not be absent, however. There was a strong negative correlation between zooplankton biomass in June/July and the shelf A. islandica growth index (Table 2; Figure 7) although insignificant when autocorrelation was taken into account. A similar inverse relationship between A. islandica growth and zooplankton biomass has been observed in the North Sea (Witbaard et al., 2003). As mentioned earlier, Witbaard et al. (2003) suggested that zooplankton can reduce the downward flux of phytoplankton to the sediments and hinder shell growth. On the shallow and well-mixed Faroese shelf the preferential feeding of zooplankton on energy rich plankton functional types may modulate the relationship between primary production indices and growth indices of A. islandica. Analysis of long-term plankton datasets could address these links.
If, as suggested above, A. islandica growth integrates the amount of primary production and degree of pelagic-benthic coupling on the Faroese shelf, then it is possible to hypothesize that population dynamics of bottom-feeding fish display some temporal coherence with A. islandica growth. Haddock and flatfish, in this case lemon sole and plaice, have been fished for more than a century in Faroese waters and commercial catch records and/or biomass estimates are available. We observed a positive correlation between the shelf A. islandica growth index and the biomass or catch of these bottom-feeding fish species on the Faroe Plateau, although not statistically significant in all cases (Table 2). There appeared to be a time lag of this effect of two years indicating that food availability acted on year class strength and/or individual growth of young fish as observed for the relationship between primary production and cod production (Steingrund and Gaard, 2005). Overall the findings from the present study suggest that the growth of A. islandica from well mixed areas inside the tidal front reflects the amount of productivity reaching the benthic environment. This appears to be influenced by zooplankton biomass in addition to total phytoplankton production in the upper layers. Although the coastal A. islandica growth index was positively correlated with the shelf A. islandica growth index, the relationships with temperature, plankton or bottom-feeding fish were less clear. This discrepancy may be explained by enhanced local variability characterising the near-shore areas or that other processes were involved. The combined evidence of having a mechanism that is backed up by phytoplankton, zooplankton and fish data, although not significant in all cases or for all settings, leads us to conclude that the shelf A. islandica growth index may be regarded as a long-term proxy for the phytoplankton productivity that specifically fuels the benthic environment on the Faroe Shelf.
Long-term changes in the ecosystem
Both A. islandica growth indices (Figure 5) show that the benthic productivity of the Faroe Shelf ecosystem has fluctuated in periods with a periodicity of around 50 years. There were peaks around years 1900, 1960 and 2000 and lows in 1880, 1930, 1990 and 2010. The exceptionally low biomass of haddock during 1990-1994 and 2006-2016 was associated with exceptionally poor shell growth c. two years before (Figure 8) strongly indicating that environmental factors, here most likely the amount of fresh phytoplankton that reaches the benthic environment, were involved in the near-collapse of the Faroe haddock stock. This may also be the case for Faroe Plateau cod that has shown a very similar variation in stock size since the 1960s (ICES, 2021). Similar arguments apply to flatfish, although catches without information about fishing effort may not necessarily reflect productivity of fish. Our study underpins the importance of long-term ecosystem studies and also provides a starting point for future studies to separate the effects of overfishing from the effects of environmental variability in Faroese waters.
Ecological processes on the Faroe Shelf
The A. islandica growth may add an important piece of information to the understanding of ecological processes on the Faroe Shelf as depicted tentatively in Figure 9 and is the result of former and current research. The ecosystem on the Faroe Shelf is fuelled by the local primary production as well as input of zooplankton from abroad. Briefly, ocean currents advect adult Calanus spp. onto Faroe Shelf in March-April and, boosted by the primary production, Calanus eggs and nauplii form the diet and determine the abundance of fish larvae on the Shelf (Eliasen et al., 2011; Jacobsen et al., 2019). The fish larvae grow in size and shift to prey on adult zooplankton (Calanus spp. and neritic zooplankton) to such a degree that there is a negative correlation between fish juveniles and zooplankton in summer (late June) (Jacobsen et al., 2019), which in turn may reduce the amount of fresh phytoplankton that reaches the near-bottom water and therefore hamper the A. islandica growth. The relationships depicted in Figure 9 might not apply to all time periods back in time or into the future. If, for example, the amount of Calanus that is advected from the SW Norwegian Sea or elsewhere was or becomes substantially higher than currently observed, or if the amount of fish juveniles was or becomes much lower (e.g., reduced by some predators), fish juveniles (and adult sandeels) might not be able to graze down zooplankton in summer and this would reduce or even flip the correlations between A. islandica and many of the variables in Figure 9.
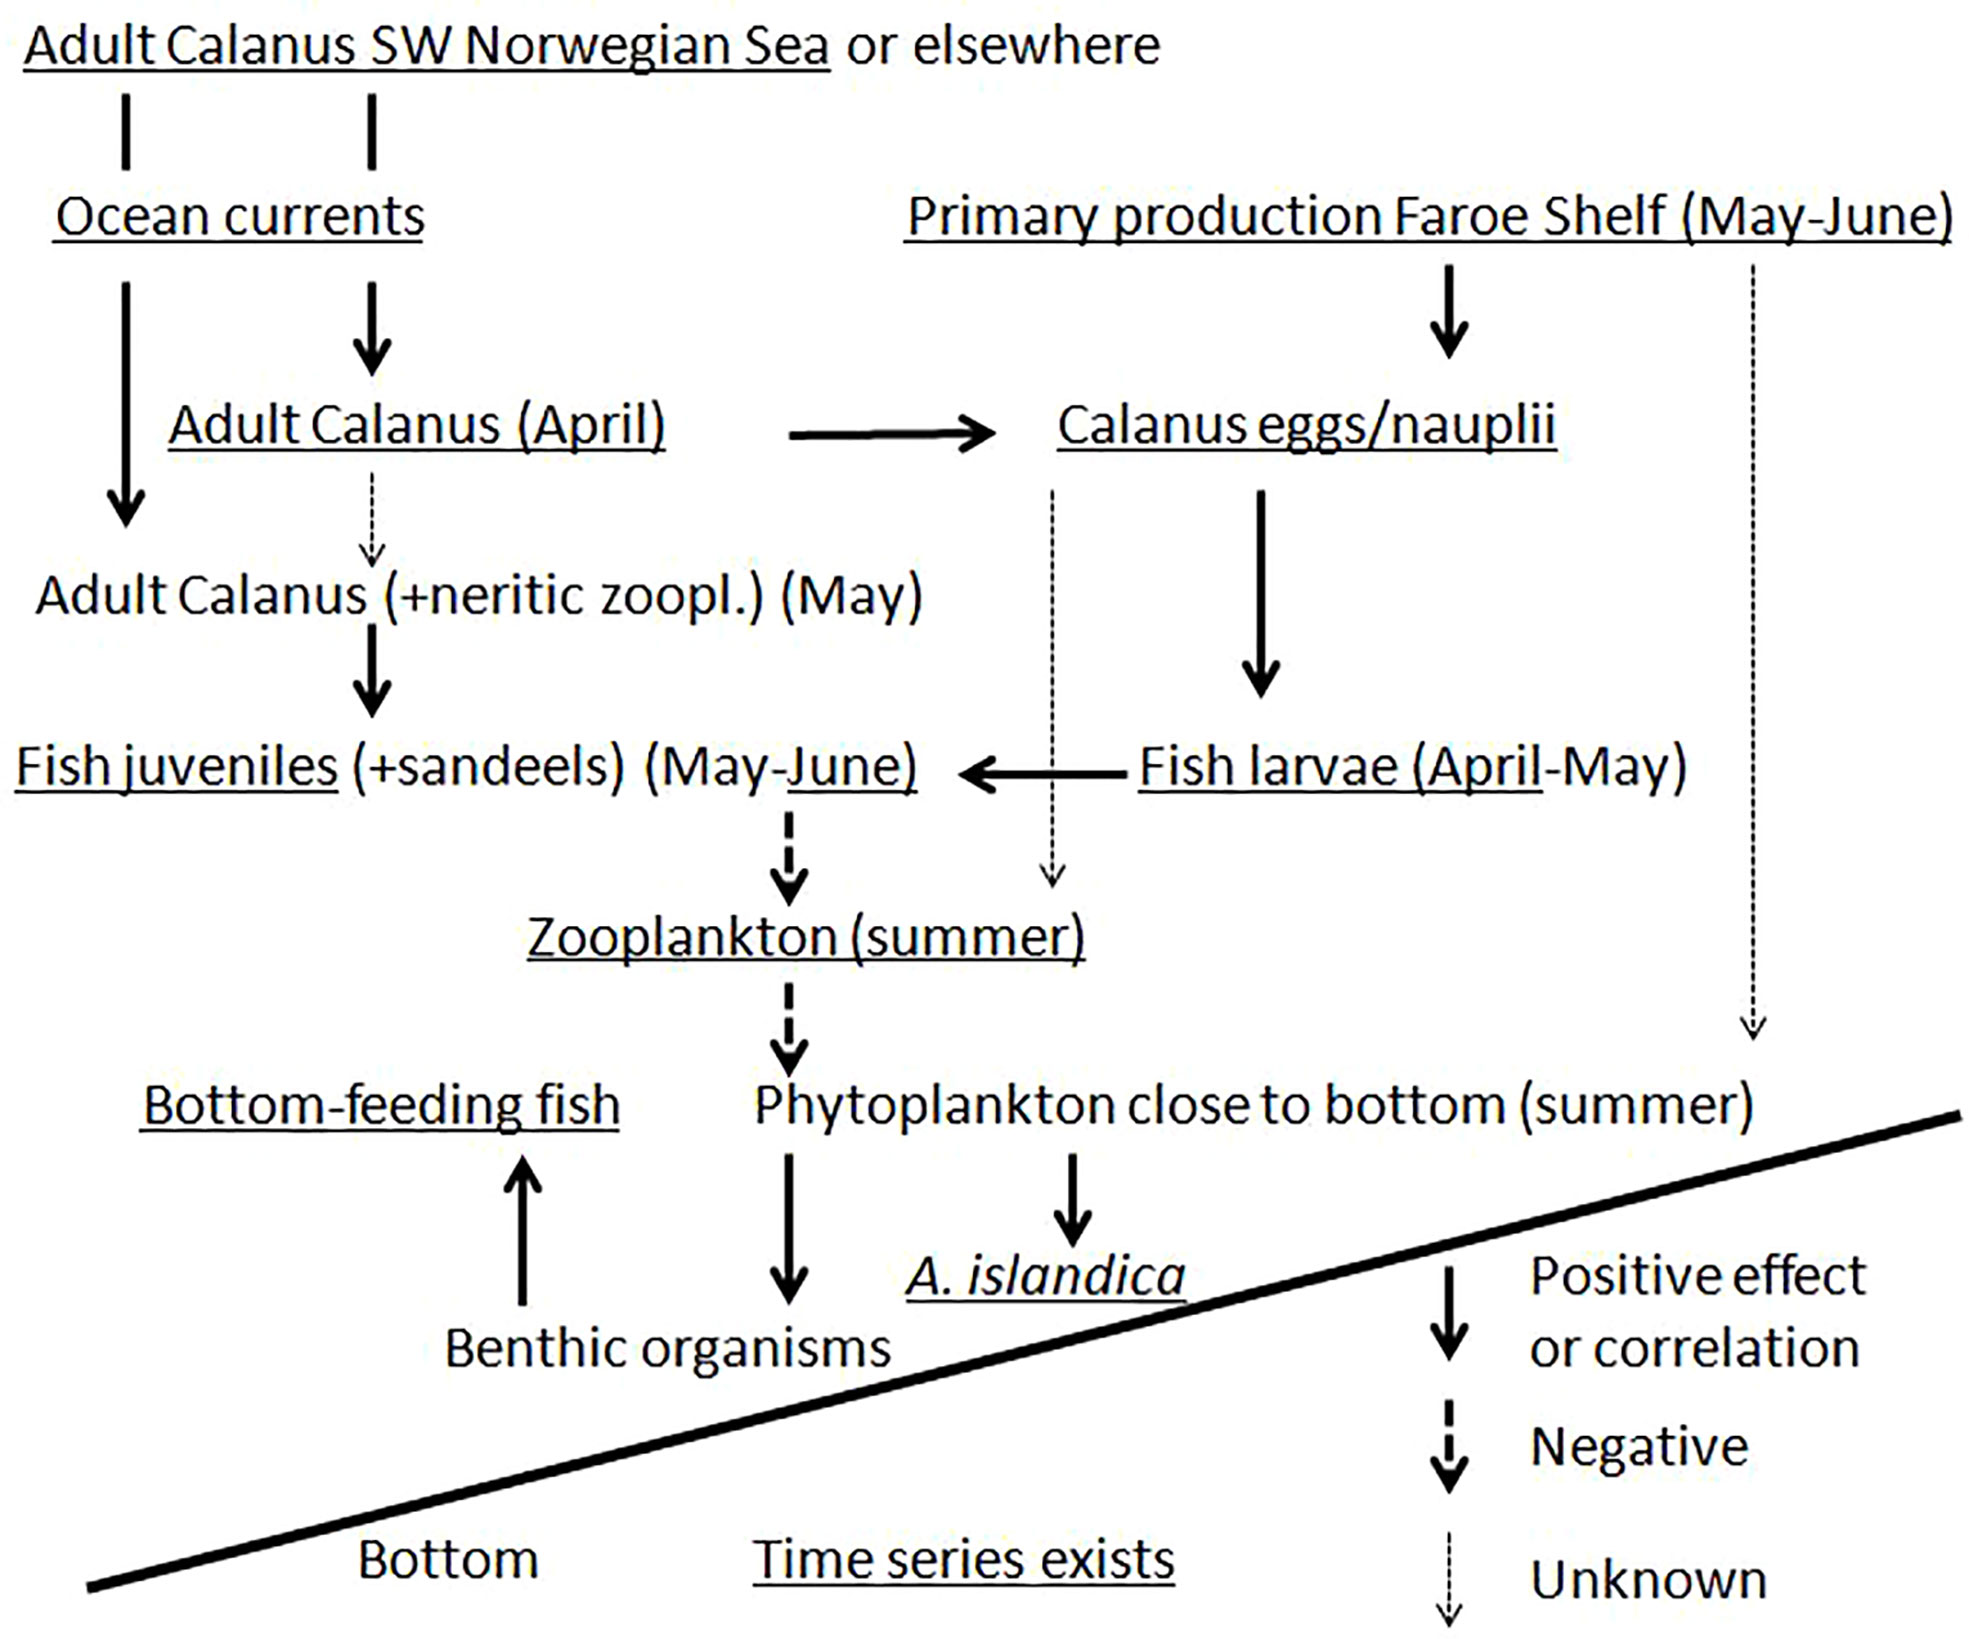
Figure 9 Simplified schematic presentation of ecological processes on the Faroe Shelf. Note that this is not a complete description of all ecological linkages but is meant to clarify the ecological processes discussed in the current study.
Returning to the negative correlation between shelf A. islandica growth and the strength of the Faroe Current, we here want to add a possible effect of the East Icelandic Current, which advects large amounts of zooplankton and runs adjacent and beneath the Faroe Current. Including a measure of Modified East Icelandic Water, MEIW (observed on the same monitoring section as the Faroe Current; Kristiansen et al., 2019, with updates for 2018-19) as an additional variable to the Faroe Current model, improved the model considerably and left both variables highly significant (R = 0.81, both p-values < 0.001, N = 22). The model indicated that a strong East Icelandic Current, as measured by MEIW north of Faroe Islands, had a positive effect on the shelf A. islandica growth index while the strength of the Faroe Current had a negative effect. This can be interpreted according to Figure 9: zooplankton is advected with the East Icelandic Current (Kristiansen et al., 2019) close to the Faroe Shelf but the Faroe Current may sweep the zooplankton eastwards so that it to a lesser extent enters the Faroe Shelf or in a more easterly location. If this zooplankton influx occurs in April-May and consists of adult or subadult Calanus species it would represent an important food source for fish juveniles (Jacobsen et al., 2019) and boost the fish juveniles in the down-grazing of zooplankton during mid-summer and increase the amount of fresh phytoplankton that reaches the benthic environment. The low (high) A. islandica growth on the shelf and the relatively more rapid (slow) growth in the easterly locations (Table 2; Figure 3) when the Faroe Current is strong (weak) is consistent with this hypothesis.
Many aspects in Figure 9 as well as alternative aspects could be addressed in the future, for example that nutrients are advected with the currents onto the Faroe Shelf. Also, the A. islandica age reading could be compared or calibrated with analyses of elements in the shells (Marali et al., 2017). The effect of salmon aquaculture or other human activities on shell growth could also be investigated.
Construction of A. islandica growth indices
Here we return to the methodical part of the construction of the A. islandica growth indices. After removing the ontogenetic trend, see next paragraph, narrow and wide growth rings (‘marker years’) were observed to occur frequently, but usually not the same years, see Figure S5. There was an extremely low inter-correlation between the growth of individual shells (Table S5; Figure 4), as in Epplé et al. (2006). One reason could be variable local conditions induced by strong tidal currents. This made it impossible to correct for potential age reading errors on the basis of the growth pattern of other shells. In order to detect the faint signal among the large noise in the data, we maximised the number of observations by including all shells as basis for the growth index – for shallow and deep areas, respectively. In this way we got sufficiently high precision (high EPS values) due to the statistical principle of gaining precision and representativeness by letting the number of observations be large (Motulsky, 2018). This approach may in principle include random or irrelevant variation and it may be argued that it is better to work with few shells that are strongly correlated (e.g. Schöne et al., 2003a). There were clusters of shells that correlated positively with each other (see Table S7) and could potentially represent a starting point when constructing the growth index. Problem was that the same applied to other clusters of shells that showed different growth patterns. In the absence of absolutely dated growth rings it was unknown which cluster represented the variability of potential environmental drivers. Our only option at this point was to include as many shells as possible where random noise is cancelled out. The shelf A. islandica growth index was correlated with various environmental drivers indicating that this approach was successful, but there is certainly scope for improvements in future studies.
To remove the ontogenetic trend in growth various growth functions can be fitted to these data that are either applied on an individual basis or to all shells in a region (RCS standardization) where it is assumed that the shells have the same expected growth with increasing age. Fitting growth curves to individual shells has the advantage to take individual variation into account but the disadvantage that long term variability, i.e, on the same scale as the age of the individuals, may not be adequately quantified (Butler et al., 2013). In this study we used the RCS standardization. However, since very old shells may also be those with the slowest growth they may cause the A. islandica growth index to show an increasing growth over time. Therefore, the eleven oldest shells were not used in this study.
Even though EPS values are widely used to evaluate the quality and length of the A. islandica growth indices our results show that confidence intervals should also be used. The EPS values for the shelf A. islandica growth were around the desired limit of 0.85 after 1940. However, the confidence intervals were as wide as 0.3 (Figures 5; S11) showing that many years were not statistically different from each other. Hence, for our material more weight should be put on the overall and long-term time development rather than individual years.
Given these considerations the shelf A. islandica growth index appears to be of high quality and robust with regards to settings of the detrending method. Applying growth functions on individual shells gave a very similar result compared with the RCS method, see Figure S9. The positive correlation between the shelf A. islandica growth index and the growth chronology presented in Bonitz et al. (2018), see Figure S10, lends further support. It also suggests that the two methods of either applying a cross-dating procedure on few live caught and fossil shells or omitting the cross-dating procedure on many live caught shells may complement each other. Hence, the labour demanding process of cross-dating may be omitted by just examining a large enough number of live-caught shells.
Data availability statement
The data supporting the conclusions of this article will be made available by the authors, without undue reservation.
Ethics statement
Specific ethical review and approval were not needed for this monitoring because the samples were taken from scientific research trips and from commercial catches, which do not fall under the national or EU legislation regarding animal welfare.
Author contributions
UM and PS developed the main idea. UM undertook the Arctica preparations and age readings while PS performed the other data preparations and analyses. PS wrote the manuscript with feedback from UM, EG, KL, and IS. All authors approved the submitted version.
Funding
The research was funded by the Faroe Marine Research Institute, Faroese Research Council, and Faroese Fisheries Research Fund. The Faroe Current data collection received support from the European Framework Programs under grant agreement numbers GA212643 (THOR), and 308299 (NACLIM) and from the Danish Ministry of Climate, Energy and Utilities through its climate support program to the Arctic (FARMON projects).
Acknowledgments
We want to thank the divers and fishermen that kindly provided the ocean quahog shells. Without their help and efforts this work would not be possible. We also want to thank three anonymous referees for comments and suggested improvements on earlier versions of the manuscript.
Conflict of interest
The authors declare that the research was conducted in the absence of any commercial or financial relationships that could be construed as a potential conflict of interest.
Publisher’s note
All claims expressed in this article are solely those of the authors and do not necessarily represent those of their affiliated organizations, or those of the publisher, the editors and the reviewers. Any product that may be evaluated in this article, or claim that may be made by its manufacturer, is not guaranteed or endorsed by the publisher.
Supplementary material
The Supplementary Material for this article can be found online at: https://www.frontiersin.org/articles/10.3389/fmars.2022.822343/full#supplementary-material
References
Alheit J., Hagen E. (1997). Long-term climate forcing of European herring and sardine populations. Fish. Oceanogr. 6 (2), 130–139. doi: 10.1046/j.1365-2419.1997.00035.x
Ballesta-Artero I., Witbaard R., Carroll M. L., van der Meer J. (2017). 2017 Environmental factors regulating gaping activity of the bivalve arctica islandica in northern Norway. Mar. Biol. 164, 116. doi: 10.1007/s00227-017-3144-7
Bonitz F. G. W., Andersson C., Trofimora T., Hátún H. (2018). Links between phytoplankton dynamics and shell growth of arctica islandica on the faroe shelf. J. Mar. Syst. 179, 72–87. doi: 10.1016/j.jmarsys.2017.11.005
Butler P. G., Richardson C. A., Scourse J. D., Wanamaker A. D. Jr., Shammon T. M., Bennell J. D. (2010). Marine climate in the Irish Sea: Analysis of a 489-year marine master chronology derived from growth increments in the shell of the clam arctica islandica. Quaternary Sci. Rev. 29 (2010), 1614–1632. doi: 10.1016/j.quascirev.2009.07.010
Butler P. G., Richardson C. A., Scourse J. D., Witbaard R., Schöne B. R., Fraser N. M., et al. (2009). Accurate increment identification and the spatial extent of the common signal in five arctica islandica chronologies from the fladen ground, northern north Sea. Paleoceanography 24, PA2210. doi: 10.1029/2008PA001715
Butler P. G., Wanamaker A. D. Jr., Scourse J. D., Richardson C. A., Reynolds D. J. (2013). Variability of marine climate on the north icelandic shelf in a 1357-year proxy archive based on growth increments in the bivalve arctica islandica. Palaeogeogr. Palaeocl. 373, 141–151. doi: 10.1016/j.palaeo.2012.01.016
Cook E. R. (1985). A time series analysis approach to tree ring standardization. Dissertation thesis (University of Arizona, Tucson), 171 pp.
Cook E. R., Holmes R. L. (1986). “User manual for program ARSTAN,” in Tree-ring chronologies of Western north America: California, Eastern Oregon and northern great basin with procedures used in the chronology development work including users man- uals for computer programs COFECHA and ARSTAN. Eds. Holmes R. L., Adams R. K., Fritts H. C. (Tucson, AZ: Laboratory of Tree-Ring Research, University of Arizona), 50–65.
Cook E. R., Krusic P. J. (2007). ARSTAN — a tree-ring standardization program based on detrending and autoregressive time series modeling, with interactive graphics (Palisades, NY: Tree-Ring Laboratory, Lamont Doherty Earth Observatory of Columbia University).
Dragesund O., Østvedt O. J., Toresen R. (2008). “Norwegian Spring-spawning herring: history of fisheries, biology and stock assessment,” in Norwegian Spring-spawning herring and northeast Arctic cod, 100 years of research and management. Ed. Nakken O. (Trondheim: Tapir Academic Press), 177 p, ISBNISBN 978-82-519-2367-5
Drinkwater K. F. (2002). A review of the role of climate variability in the decline of northern cod. American Fisheries Society Symposium, Vol. 32, 113–130.
Eliasen S. K., Hansen B., Larsen K. M. H., Hátún H. (2016). The exchange of water between the faroe shelf and the surrounding waters and its effect on the primary production. J. Mar. Syst. 153, 1–9. doi: 10.1016/j.jmarsys.2015.08.004
Eliasen S. K., Hátún H., Larsen K. M. H., Hansen B., Rasmussen T. A. S. (2017a). Phenologically distinct phytoplankton regions on the faroe shelf - identified by satellite data, in-situ observations and model. J. Mar. Sys. 169, 99–110. doi: 10.1016/j.jmarsys.2017.01.015
Eliasen S. K., Hátún H., Larsen K. M. H., Jacobsen S. (2017b). Faroe shelf bloom phenology – the importance of ocean-to-shelf silicate fluxes. Cont. Shelf Res. 143, 43–53. doi: 10.1016/j.csr.2017.06.004
Eliasen S. K., Hátún H., Larsen K. M. H., Vang H. B. M., Rasmussen T. A. S. (2019). The faroe shelf spring bloom onset explained by a ‘Critical volume hypothesis’. J. Mar. Syst. 194, 91–101. doi: 10.1016/j.jmarsys.2019.02.005
Eliasen K., Reinert J., Gaard E., Hansen B., Jacobsen J. A., Grønkjær P., et al. (2011). Sandeel as a link between primary production and higher trophic levels on the faroe shelf. Mar. Ecol. Prog. Ser. 438, 185–194. doi: 10.3354/meps09301
Epplé V. M., Brey T., Witbaard R., Kuhnert H., Pätzold J. (2006). Sclerochronological records of arctica islandica from the inner German bight. Holocene 16 (5), 763–769. doi: 10.1191/0959683606hl970rr
Gaard E. (1999). The zooplankton community structure in relation to its biological and physical environment on the faroe shelf 1989-1997. J. Plankton Res. 21, 1133–1152. doi: 10.1093/plankt/21.6.1133
Gaard E. (2000). Seasonal abundance and development of calanus finmarchicus in relation to phytoplankton and hydrography on the faroe shelf. ICES J. Mar. Sci. 57, 1605–1611. doi: 10.1006/jmsc.2000.0963
Gaard E. (2003). Plankton variability on the faroe shelf during the 1990s. ICES marine science symposia. ICES J. Mar. Sci. 219, 182–189.
Gaard E., Hansen B. (2000). Variations in the advection of calanus finmarchicus onto the faroe shelf. ICES J. Mar. Sci. 57, 1612–1618. doi: 10.1006/jmsc.2000.0962
Gaard E., Hansen B., Heinesen S. P. (1998). Phytoplankton variability on the faroe shelf. ICES J. Mar. Sci. 55, 688–696. doi: 10.1006/jmsc.1998.0373
Gaard E., Hansen B., Olsen B., Reinert J. (2002). Ecological features and recent trends in physical environment, plankton, fish and sea birds in the faroe plateau ecosystem. In Sherman K, Skjoldal H-R Eds. Large Marine Ecosystems of the North Atlantic.Elsevier, pp. 245–265. doi: 10.1016/S1570-0461(02)80060-X
Hansen B., Østerhus S. (2000). North Atlantic - Nordic seas exchanges. Prog. Oceanography 45, 109–208. doi: 10.1016/S0079-6611(99)00052-X
Hansen B., Larsen K. M. H., Hátún H., Kristiansen R., Mortensen E., Østerhus S. (2015). Transport of volume, heat, and salt towards the Arctic in the faroe current 1993–2013. Ocean Sci. 11, 743–757. doi: 10.5194/os-11-743-2015
Hansen B., Meincke J. (1984). Long-term coastal sea surface temperature observations at the faroe islands. Rapports et procès-verbaux des réunions, vol. 185. (du Conseil International pour l’Exploration de la Mer), 162–169.
Hansen B., Steffánsson U., Svendsen E. (1998). Iceland, Faroe and Norwegian coasts. Sea 11, 733–758.
Hátún H., Chafik L. (2018). On the recent ambiguity of the north Atlantic subpolar gyre index. J. Geophys. Res. Oceans 123, 5072–5076. doi: 10.1029/2018JC014101
Hátún H., Payne M. R., Beaugrand P. C., Reid P. C., Sandø A. B., Drange H., et al. (2009). Large Bio-geographical shifts in the north-eastern Atlantic ocean: From the subpolar gyre, via plankton, to blue whiting and pilot whales. Prog. Oceanography 80 (2009), 149–162. doi: 10.1016/j.pocean.2009.03.001
Hátún H., Sandø A. B., Drange H., Hansen B., Valdimarsson H. (2005). Influence of the Atlantic subpolar gyre on the thermohaline circulation. Science 309, 1841–1844. doi: 10.1126/science.1114777
Hurrel J. W., Deser C. (2009). North Atlantic climate variability: The role of the north Atlantic oscillation. J. Mar. Syst. 78 (2009), 28–41. doi: 10.1016/j.jmarsys.2008.11.026
ICES (2016). Report of the north-Western working group (NWWG), 27 April–4 ma (Copenhagen: ICES Headquarters).
ICES (2021). ICES scientific reports Vol. 3 (Copenhagen: Northwestern Working Group NWWG), 556 p. doi: 10.17895/ices.pub.8186
Jacobsen S., Gaard E., Hátún H., Steingrund P., Larsen K.M.H. Reinert J., Ólavsdóttir S. R., et al. (2019). Environmentally driven ecological fluctuations on the faroe shelf revealed by fish juvenile surveys. Front. Mar. Sci. 6. doi: 10.3389/fmars.2019.00559
Kristiansen I., Hátún H., Petursdottir H., Gislason A., Broms C., Melle W., et al. (2019). Decreased influx of calanus spp. into the south-western Norwegian Sea since 2003. Deep-Sea Res. Part I 149, 103048. doi: 10.1016/j.dsr.2019.05.008
Kurlansky M. (1998). Cod, a biography of the fish that changed the world. (Jonathan Cape, Random House: 20 Vauxhall Bridge Road, London SW1V 2SA), 294 p, ISBN: ISBN: 0-224-05104-0.
Larsen K. M. L., Hansen B., Svendsen H. (2008). Faroe shelf water. Continental shelf Res. 28, 1754–1768. doi: 10.1016/j.csr.2008.04.006
Larsen K. M. L., Hansen B., Svendsen H. (2009). Faroe shelf front: properties and exchange. J. Mar. Syst. 78 (2009), 9–17. doi: 10.1016/j.jmarsys.2009.02.003
Marali S., Schöne B. R., Merz-Kraus R., Griffin S. M., Wanamaker A., Matras U., et al. (2017). Ba/Ca ratios in shells of arctica islandica-potential environmental proxy and crossdating tool. Palaeogeography Palaeoclimatology Palaeoecol. 465 (2017), 347–361. doi: 10.1016/j.palaeo.2015.12.018
Mette M. J., Wanamaker A. D. Jr., Carroll M. L., Ambrose W. G. Jr., Retelle M. J. (2016). Linking large-scale climate variability with arctica islandica shell growth and geochemistry in northern Norway. Limnol. Oceanogr 61, 748–764. doi: 10.1002/lno.10252
Motulsky H. (2018). Intuitive biostatistics: A nonmatematical guide to statistical thinking. 4th ed. (New York: Oxford University Press)ISBN: 9780190643591.
Myers R. A. (1998). When do recruitment – environmental correlations work? Rev. Fish Biol. Fisheries 8, 285–305. doi: 10.1023/A:1008828730759
Nakken O. (2008). Norwegian Spring-spawning herring and northeast Arctic cod, 100 years of research and management. Ed. Nakken O. (Trondheim: Tapir Academic Press), 177 p, ISBN: ISBN 978-82-519-2367-5.
Poitevin P., Thébault J., Siebert V., Donnet S., Archambault P., Doré J., et al. (2019). Growth response of arctica islandica to north Atlantic oceanographic conditions since 1850. Front. Mar. Sci. 6. doi: 10.3389/fmars.2019.00483
Pyper B. J., Peterman R. M. (1998). Comparison of methods to account for autocorrelation in correlation analyses of fish data. Canadien J. Fisheries Aquat. Sci. 55, 2127–2140. doi: 10.1139/f98-104
Rembauville M., Blain S., Manno C., Tarling G., Thompson A., Wolff G. A., et al. (2018). The role of diatom resting spores for pelagic-benthic coupling in the southern ocean. Biogeosciences. 15, 3071–3084. doi: 10.5194/bg-15-3071-2018
Rembauville M., Manno C., Tarling G. A., Blain S., Salter I. (2016). Strong contribution of diatom resting spores to deep sea carbon export fluxes in the naturally iron-fertilized waters downstream of south Georgia. Deep-Sea Res. Part I 115, 22–35. doi: 10.1016/j.dsr.2016.05.002
Reynolds D. J., Richardson C. A., Scourse J. D., Butler P. G., Hollyman P., Román-González A., et al. (2017). Reconstructing north Atlantic marine climate variability using an absolutely-dated sclerochronological network. Palaeogeography Palaeoclimatology Palaeoecol. 465 (2017), 347–361. doi: 10.1016/j.palaeo.2016.08.006
Robichaud D., Rose G. A. (2004). Stock structure and range in Atlantic cod (Gadus morhua): inference from 100 years of tagging. Fish Fish. 5, 185–214. doi: 10.1111/j.1467-2679.2004.00141.x
Ropes J. W. (1987). Preparation of acetate peels of valves from the ocean quahog, arctica islandica, for age determinations Vol. 50 (Woods Hole: NOAA/National Marine Fisheries Service).
Rose G. A. (2004). Reconciling overfishing and climate change with stock dynamics of Atlantic cod (Gadus morhua) over 500 years. Can. J. Fish. Aquat. Sci. 61, 1553–1557. doi: 10.1139/F04-173
Sørensen B. L. (2021). Growth and spatial distribution of cod and haddock on the Faroe Plateau and relationship with the amount of forage fish. Biology thesis (University of Copenhagen, Faculty of Science, Department of Biology, Copenhagen), 74 p.
Sætersdal G. (2008). “From fisheries research to fisheries science 1900-1940: tracing the footsteps of Johan hjort in Bergen and ICES,” in Norwegian Spring-spawning herring and northeast Arctic cod, 100 years of research and management. Ed. Nakken O. (Trondheim: Tapir Academic Press), 177 p.
Salter I., Kemp A. E. S., Moore C. M., Lampitt R., Wolff G. A., Holtvoeth J. (2012). Diatom resting spore ecology drives enhanced carbon export from a naturally iron fertilized bloom in the southern ocean. Global Biogeochemical Cycles 26, GB1014. doi: 10.1029/2010GB003977
Salter I., Lampitt R., Sanders R., Poulton A., Kemp A., Boorman B., et al. (2007). Estimating carbon, silica, and diatom export from a naturally fertilised phytoplankton bloom in the southern ocean using PELAGRA: A novel drifting sediment trap. Deep-Sea Res. Part II 54 (18-20), 2233–2259. doi: 10.1016/j.dsr2.2007.06.008
Schöne B. R., Kröncke I., Houk S. D., Castro A. D. F. (2003b). The cornucopia of chilly winters: ocean quahog (Arctica islandica l., Mollusca) master chronology reveals bottom water nutrient enrichment during colder winters (North Sea). Senckenbergiana maritima 32, 1–13. doi: 10.1007/BF03043092
Schöne B. R., Oschmann W., Rössler J., Castro A. D. F., Houk S. D., Kröncke I., et al. (2003a). North Atlantic oscillation dynamics recorded in shells of a long-lived bivalve mollusk. Geology 31 (12), 1037–1040. doi: 10.1130/G20013.1
Scourse J. D., Richardson C. A., Forsythe G., Harris I., Heinemeier J., Fraser N., et al. (2006). First cross-matched floating chronology from the marine fossil record: data from growth lines of the long-lived bivalve mollusc arctica islandica. Holocene 16, 967–974. doi: 10.1177/0959683606hl987rp
Steingrund P., Clementsen D. H., Mouritsen R. (2009). Higher food abundance reduces the catchability of cod (Gadus morhua) to longlines on the faroe plateau. Fisheries Res. 100, 230–239. doi: 10.1016/j.fishres.2009.08.002
Steingrund P., Gaard E. (2005). Relationship between phytoplankton production and cod production on the faroe shelf. ICES J. Mar. Sci. 62, 163–176. doi: 10.1016/j.icesjms.2004.08.019
Stott K. J., Austin W. E. N., Sayer M. D. J., Weidman C. R., Cage A. G., Wilson R. J. S. (2010). The potential of arctica islandica growth records to reconstruct coastal climate in north west Scotland,UK. Quaternary Sci. Rev. 29, 1602–1613. doi: 10.1016/j.quascirev.2009.06.016
Toresen R., Østvedt O. J. (2000). Variation in abundance of Norwegian spring-spawning herring(Clupea harengus, clupeidae) throughout the 20th century and the influence of climatic fluctuations. Fish Fisheries 1, 231–256. doi: 10.1046/j.1467-2979.2000.00022.x
Trenberth K., Zhang R., National Center for Atmospheric Research Staff (2021) "The climate data guide: Atlantic multi-decadal oscillation (AMO).". Available at: https://climatedataguide.ucar.edu/climate-data/atlantic-multi-decadal-oscillation-amo.
Witbaard R. (1996). Growth variations in arctica islandica l. (Mollusca): a reflection of hydrography-related food supply. ICES J. Mar. Sci. 53, 981–987. doi: 10.1006/jmsc.1996.0122
Witbaard R., Duineveld G. C. A., Amaro T., Bergman M. J. N. (2005). Growth trends in three bivalve species indicate climate forcing on the benthic ecosystem in the southeastern north Sea. Climate Res. 30, 29–38. doi: 10.3354/cr030029
Witbaard R., Jansma E., Sass Klaassen U. (2003). Copepods link quahog growth to climate. J. Sea Res. 50, 77–83. doi: 10.1016/S1385-1101(03)00040-6
Wolff G., Billet D., Holtvoeth J., Bett B., Fitzgeorge-Balfour T., Fisher E., et al. (2011). Natural iron fertilisation and the impact of enhanced carbon export on deep-sea ecosystems. PLoS One 6 (6), e20697. doi: 10.1371/journal.pone.0020697
Keywords: Calanus finmarchicus, faroe shelf, bottom feeding fish, phytoplankton, zooplankton, Arctica islandica growth, ocean currents
Citation: Matras U, Salter I, Larsen KMH, Gaard E and Steingrund P (2022) Relationship between plankton dynamics and growth of the long-lived clam Arctica islandica on the Faroe shelf. Front. Mar. Sci. 9:822343. doi: 10.3389/fmars.2022.822343
Received: 25 November 2021; Accepted: 08 August 2022;
Published: 29 August 2022.
Edited by:
Peter Grønkjær, Aarhus University, DenmarkReviewed by:
Jens Tang Christensen, Aarhus University, DenmarkWilliam Gerald Ambrose Jr., Coastal Carolina University, United States
Copyright © 2022 Matras, Salter, Larsen, Gaard and Steingrund. This is an open-access article distributed under the terms of the Creative Commons Attribution License (CC BY). The use, distribution or reproduction in other forums is permitted, provided the original author(s) and the copyright owner(s) are credited and that the original publication in this journal is cited, in accordance with accepted academic practice. No use, distribution or reproduction is permitted which does not comply with these terms.
*Correspondence: Petur Steingrund, cGV0dXJzQGhhdi5mbw==