
95% of researchers rate our articles as excellent or good
Learn more about the work of our research integrity team to safeguard the quality of each article we publish.
Find out more
ORIGINAL RESEARCH article
Front. Mar. Sci. , 11 February 2022
Sec. Marine Fisheries, Aquaculture and Living Resources
Volume 9 - 2022 | https://doi.org/10.3389/fmars.2022.817868
This article is part of the Research Topic Nutrition, Disease, Environmental Stress, and Microorganisms in Crustacean Aquaculture View all 16 articles
 Zhongkai Wang*
 Yigeng Chen
 Cong WangNannan ZhaoZhihao ZhangZhitong DengYanting CuiRenjie WangYuquan Li*
Aquaporins (AQPs) are integral membrane proteins that facilitate the transport of water and small solutes across cell membranes. These proteins are vital for maintaining water homeostasis in living organisms. In mammals, thirteen aquaporins have been characterized, but in crustaceans, especially penaeid shrimp, the diversity, structure, and substrate specificity of these membrane channel proteins are largely unknown. We here presented the three types of AQPs from Litopenaeus vannamei based on genome and transcriptome sequencing. Phylogenetic analysis showed that each AQP separately represented members of aquaglyceroporins, classical aquaporins, and unorthodox aquaporins, thus they were named as LvAQP3, LvAQP4, and LvAQP11. The LvAqp4 was mostly expressed in hepatopancreas, stomach, and gill, meanwhile LvAqp3 and LvAqp11 were separately predominantly expressed in intestine and muscle, respectively. To investigate possible roles of aquaporins in osmoregulation, mRNA expression changes in mainly expressed tissues were analyzed after acute exposure or long-term acclimation to different salinities. The results revealed that the expression levels of aquaporins genes were significantly decreased in most tissues (except hepatopancreas) under salinity stress, though the expression patterns were variable among isoforms and tissues. Moreover, comparative transcriptome analysis indicated the combination roles of aquaglyceroporin and amino acid metabolism related genes and pathways in response to acute salinity changes in the intestine. This study opened new windows for future investigations and provided new insights into the role of aquaporins in osmoregulation in L. vannamei.
Aquaporins (AQPs), also referred to as Major Intrinsic Proteins (MIPs), are small transmembrane channel proteins that mainly facilitate water and solute permeation across cellular membranes and have been identified in organisms spanning all kingdoms of life (Abascal et al., 2014; Finn and Cerdà, 2015). AQPs present as tetramers in cell membranes, and each monomer forms a pore composed of six transmembrane domains (TMDs) connected by five loops (two intracellular and three extracellular), with the N- and C-termini facing the cytoplasm (Bienert et al., 2012). The pore is regulated by two conserved selectivity filters. One is formed by two asparagine-proline-alanine (NPA) motifs that establish hydrogen bonds with the water molecule and create an electrostatic repulsion of protons (Murata et al., 2000; Sui et al., 2001). The other selectivity filter is aromatic/arginine (Ar/R) domain, which usually consists of four amino acids including an aromatic amino acid and an arginine, creating the narrowest section of the pore and recognize diverse substrates (Fu et al., 2000). Extensive studies have reported the involvement of AQPs in various physiological processes in animals. To date, 12–15 mammalian AQPs have been identified to cluster into 13 subfamilies (AQP0–12) and divide into three groups according to their selective permeability and tertiary structure: the classical AQPs (AQP0, 1, 2, 4, 5, 6, and 8) that are considered primarily selective to water, the aquaglyceroporins (AQP3, 7, 9, and 10), which mediate the transport of glycerol, urea, and other small non-charged solutes beside water due to their larger pore size, and the unorthodox AQPs (also called superaquaporins) (AQP11 and 12), the pore selectivity and function of which are still under investigation (Benga, 2012; Ishibashi et al., 2017). Crustaceans represent another excellent animal models for investigating the regulation of AQPs expression due to their wide distribution in waters of different salinities, including freshwater, marine, estuarine, and intertidal habitats with some decapod species able to move among ecotypes within their own life times (Zhang et al., 2019; Cui et al., 2021). Therefore, efficient osmoregulation is the main physiological mechanism that maintains the hydromineral homeostasis of these animals. In decapods, the roles of ion transporters and ion channels in coping with environmental stressors are heavily studied, such as V-type H+ ATPase, Na+/K+-ATPase, Na+ channel, Na+-K+-2Cl– cotransporter, and Cl–/HCO3– exchanger (McNamara and Faria, 2012; Thabet et al., 2017). Nevertheless, studies focusing on the function of AQPs in responses to osmotic challenge were only carried out in limited crustacean species (Gao, 2009; Chung et al., 2012; Boyle et al., 2013; Foguesatto et al., 2017, 2019; Moshtaghi et al., 2018).
The Pacific white shrimp (Litopenaeus vannamei) is one of the most important farmed penaeid shrimps in the world. As a typical euryhaline penaeid species with strong osmoregulatory capacity, L. vannamei can inhabit waters of salinity around 0.5–78 (Zhang et al., 2019; Li et al., 2020). Nowadays, it has become not only an emerging aquaculture species in low-salinity water in inland but also a popular cultivar in high-salinity water (40–70‰) along the coast of Shandong province in China (Cheng et al., 2006; Shen et al., 2020). Thus, it can serve as a good model to investigate salinity adaptation mechanisms of euryhaline crustaceans. However, extensive studies on the salinity adaptation of L. vannamei also mainly focusing on the function of ion transporters and ion channels in osmoregulation (Pan et al., 2014; Liu M. et al., 2015). Therefore, many aspects regarding the functions and osmoregulation of aquaporins remain to be elucidated in L. vannamei. In addition, several studies have used transcriptomic and proteomic approaches to reveal the involvement of genes and pathways during the osmoregulation in the gill, hepatopancreas, and muscle of L. vannamei (Chen et al., 2015; Hu et al., 2015; Wang et al., 2015; Xu et al., 2017; Li et al., 2020). Beyond that, the intestine of crustaceans is also an osmoregulatory organ responsible for regulating the flow of water and ions (Croghan, 1958; McGaw and Curtis, 2013). Nonetheless, few studies have explored the pathways and genes that are required for the osmoregulation in the intestine of L. vannamei under salinity stress.
The current study is aimed at investigating the putative roles of AQPs in the salinity adaption of L. vannamei. We first screened putative Aqp genes based on genome and transcriptome data and provided the expression profiles of Aqp mRNAs in different tissues. To further clarify the responses of AQPs to salinity stress, their expression changes under salinity stress were detected in tissues with higher Aqp expression levels. Moreover, we employed high-throughput RNA sequencing (RNA-seq) technology to examine transcriptomic responses of the intestine from shrimp exposed to acute salinity stress. This study provided valuable information for understanding the mechanism of AQPs in osmoregulation in decapod shrimps and highlighted the genes and pathways related to salinity stress in the intestine of L. vannamei.
Juvenile shrimp (3.0 ± 0.5 g; 8.6 ± 0.3 cm) were obtained from a farm in Binzhou, China. They were transported to the School of Marine Science and Engineering, Qingdao Agricultural University. The shrimp were acclimated to laboratory culture conditions in plastic tanks (200 L) containing aerated natural seawater (salinity 30‰, pH 8.0) at 28 ± 0.5°C for 10 days. They were fed four times a day (8:30, 13:00, 18:00, and 22:30) with dry pellets. Dissolved oxygen was maintained above 6.0 mg/L. The culture water was exchanged at a daily rate of 1/3 tank volume. The feces and uneaten feed were removed daily with a siphon tube. All treatments in this study were strictly in accordance with the guidelines of the Animal Experiment Ethics Committee of Qingdao Agriculture University, which also approved the protocol.
Before the salinity exposure experiment, six individuals acclimated at 30‰ salinity were randomly selected as the control group (CTR) and different tissues (intestine, hepatopancreas, muscle, epidermis, gill, and stomach) were dissected, flash frozen in liquid nitrogen, and kept in -80°C for further analysis.
For the acute salinity exposure experiment, 180 shrimps were divided into two groups (90 shrimp per group) and each group had three replicates (30 shrimp per replicate). Then, the two groups were directed transferred from natural seawater of 30‰ salinity to artificial seawater of 10 or 50‰ salinity. The pH (pH 8.0) and water temperature (28 ± 0.5°C) of the artificial seawater was set consistently with the natural seawater during the experimental period. Six shrimp (2 shrimp/replicate × 3 replicates) per group were randomly selected and the tissues described above were sampled at 2, 4, 8, 12, and 24 h (hours) after salinity challenge, respectively.
For the long-term salinity stress experiment, 480 shrimp were also randomly divided into two groups, which were separately acclimated from natural seawater of 30 to 50‰ through daily four increments in salinity by the addition of artificial high-salinity seawater and from 30 to 10‰ through daily four decrements in salinity by the addition of freshwater. Each group had 240 shrimp with three biological replicates (each replicate having 80 individuals). All treatment groups reached the experimental salinity on the fifth day (5 d) after salinity challenge. The pH and water temperature of the high- or low-salinity seawater were kept constant as described above. Six shrimp (2 shrimp/replicate × 3 replicates) per treatment were sampled at 5, 15, 25, and 35 days after salinity challenge, respectively.
Total RNA was extracted from the sampled tissues by using TRIzol Reagent (Vazyme, China). The purity and concentration of the extracted RNA were determined by OD260/OD280 value obtained with a NanoDrop 2000 spectrophotometer (Thermo Fisher Scientific, United States). RNA integrity was checked on a 1% agarose gel. RNA samples of the two individuals per replicate were pooled together in equal amounts to generate one mixed sample for each replicate and three mixed samples for each group. Then, first-strand cDNA was generated from 1 μg mixed RNA of each replicate with PrimeScript™ RT Reagent Kit with gDNA Eraser (Vazyme, China).
Unigenes annotated as AQPs were first identified by screening the previously generated Illumina transcriptome (SRA accession No. PRJNA649598) from our laboratory using human and Drosophila AQPs as the query sequences. Then, amplification primers were designed to verify the open reading frames (ORFs) (Supplementary Table 1). The complete coding regions of the LvAqp genes were amplified and Sanger-sequenced. The gene structures of LvAqp were further analyzed based on the genome of L. vannamei database using the BLASTX and BLASTN program1 and illustrated by IBS software (Liu W. et al., 2015).
For the naming process of the L. vannamei AQPs (LvAQPs), phylogenetic trees were generated by the maximum likelihood method with 1,000 bootstrap replications in MEGA X software (Kumar et al., 2018). We used ModelGenerator (Keane et al., 2006) to choose the best model for generating phylogenetic tree. The conserved motifs of protein sequences were analyzed with the program Multiple Em for Motif Elicitation (MEME; version 5.3.3) at http://meme-suite.org/tools/meme. Then, the phylogenetic tree and conserved MEME domains were visualized using Interactive Tree of Life (iTOL) version 6 (Letunic and Bork, 2021). Additionally, multiple alignment of crustacean AQPs sequences was built using MUSCLE method in MEGA X software and visualized through Jalview software (Waterhouse et al., 2009). Transmembrane regions were predicted with TMHMM 2.0.2 Protein structures were simulated by Phyre23 and visually edited by Chimera 1.15 software (Pettersen et al., 2004).
The specific primer sequences of the target and reference genes were designed using Primer Premier 5.0, and were listed in Supplementary Table 1. The tissue distribution of LvAqp mRNAs was first examined, and then their expression changes under salinity stress were detected in tissues with high LvAqp expression levels. qPCR was performed in a 96-well plate, and the reaction mixture (10 μL volume) consisted of 5.0 μL of 2 × ChamQ Universal SYBR qPCR Master Mix (Vazyme, China), 1.0 μL of cDNA (10 ng/μL), 0.2 μL each of 10 μM forward and reverse primers, and 3.6 μL of RNase-free water. qPCR was carried out on a CFX96 Touch Real-Time PCR Detection System (Bio-Rad, United States) as follows: 95°C (30 s) for pre-incubation, followed by 40 cycles at 95°C (10 s) and 60°C (30 s). Finally, the melting curve was analyzed to verify amplification specificity. The accumulation of fluorescence signals from the SYBR Green dye was recorded in the 60°C (30 s) phase during each cycle. A negative control (no-template reaction) was included throughout. Each sample was analyzed in triplicate, along with the two reference genes ubiquitin (Ub) and ribosomal protein S12 (S12) according to previous studies (Li et al., 2022), and the expression level was normalized to the geometric mean of the two reference genes (Vandesompele et al., 2002). The relative gene expression levels were calculated by the comparative Ct method using the formula 2–△△Ct (Livak and Schmittgen, 2001). qPCR data were statistically evaluated by one-way analysis of variance (ANOVA), followed by Tukey’s post-hoc test in SPSS 21.0 (SPSS, IL, United States), wherein p < 0.05 denoted a statistically significant difference.
The RNA integrity of intestine tissues sampled at 2 h after salinity exposure was assessed using the RNA Nano 6000 Assay Kit and the Agilent Bioanalyzer 2100 system (Agilent Technologies, United States) and was expressed as an RNA Integrity Number (RIN). According to the results, RNA samples with high quality (OD260/OD280 = 2.0–2.2, OD260/OD230 ≥ 2.0, RIN ≥ 8.0, and 28S:18S ≥ 1.0) were used for library construction. For the RNA sample preparation, 3 μg of RNA per sample was used as input material (3 replicates per group at salinity 10, 30, and 50‰, named S10, S30, and S50 group). Sequencing libraries were generated using NEBNext® Ultra™ RNA Library Prep Kit (NEB, United States), and were then sequenced on an Illumina HiSeq 2500 platform.
Raw reads in fastq format were initially processed using Perl scripts. Clean reads were obtained by the removal of reads containing adapters, reads containing poly-N, and low-quality reads from the raw data. At the same time, Q20, Q30, and GC contents of the clean data were calculated. Reference genome and gene model annotation files for L. vannamei were downloaded from genome website.4 An index of the reference genome was built and clean reads were mapped to the reference genome using Hisat2 v2.2.4 (Kim et al., 2015). The mapped reads of each sample were assembled by StringTie v1.3.1 (Pertea et al., 2015, 2016). Then, the fragment per kilobase of transcript per million mapped reads (FPKM) of each gene was calculated to quantify its expression abundance and variations.
Differential expression analysis of genes was performed between the two groups by DESeq2 R package (1.16.1) (Love et al., 2014). The resulting p-values were adjusted by the Benjamini–Hochberg procedure. Genes with an adjusted p-value < 0.05 and | log2 (Fold Change)| > 1.0 were regarded as differentially expressed. To assess changes in gene expression patterns upon two types of salinity stress, expression pattern analysis was performed using Short Time-series Expression Miner (STEM, version 1.3.8) (Ernst and Bar-Joseph, 2006) based on all Differentially Expressed Genes (DEGs). Gene Ontology (GO) and Kyoto Encyclopedia of Genes and Genomes (KEGG) enrichment analyses of DEGs were implemented by means of the clusterProfiler R package, in which gene length bias was corrected (Yu et al., 2012). GO terms or KEGG pathways with corrected p-value less than 0.05 were considered significantly enriched in a set of DEGs. To validate the Illumina sequencing data, twelve DEGs were chosen for qPCR analysis by using the same RNA samples for transcriptome sequencing.
Three L. vannamei aquaporins (LvAqps) with complete ORFs were identified and further confirmed by PCR, cloning, and sequencing. Those mRNA sequences were submitted to GenBank with the accession numbers MW915485, MW915486, and MW915487. The complete ORFs and derived amino acid sequences were shown in Supplementary Figure 1. Phylogenetic tree analysis based on the amino acid sequences of vertebrate and invertebrate AQPs illustrated that one belonged to the water specific AQPs within the classical aquaporins subfamily (named LvAQP4), one belonged to the aquaglyceroporins (named LvAQP3), and the last one belonged to the unorthodox aquaporins (named LvAQP11) (Figure 1). A total of six conserved motifs were predicted in those AQPs protein sequences via MEME with a length of 6–50 amino acid residues. The classical aquaporins had three motifs (motif 1, 3, and 4), the aquaglyceroporins harbored four motifs (motif 1, 3, 4, and 6), and the unorthodox aquaporins shared three motifs (motif 1, 2, and 5). Therefore, the classification of AQPs by conserved motifs was consistent with phylogenetic tree clustering (Figure 1).
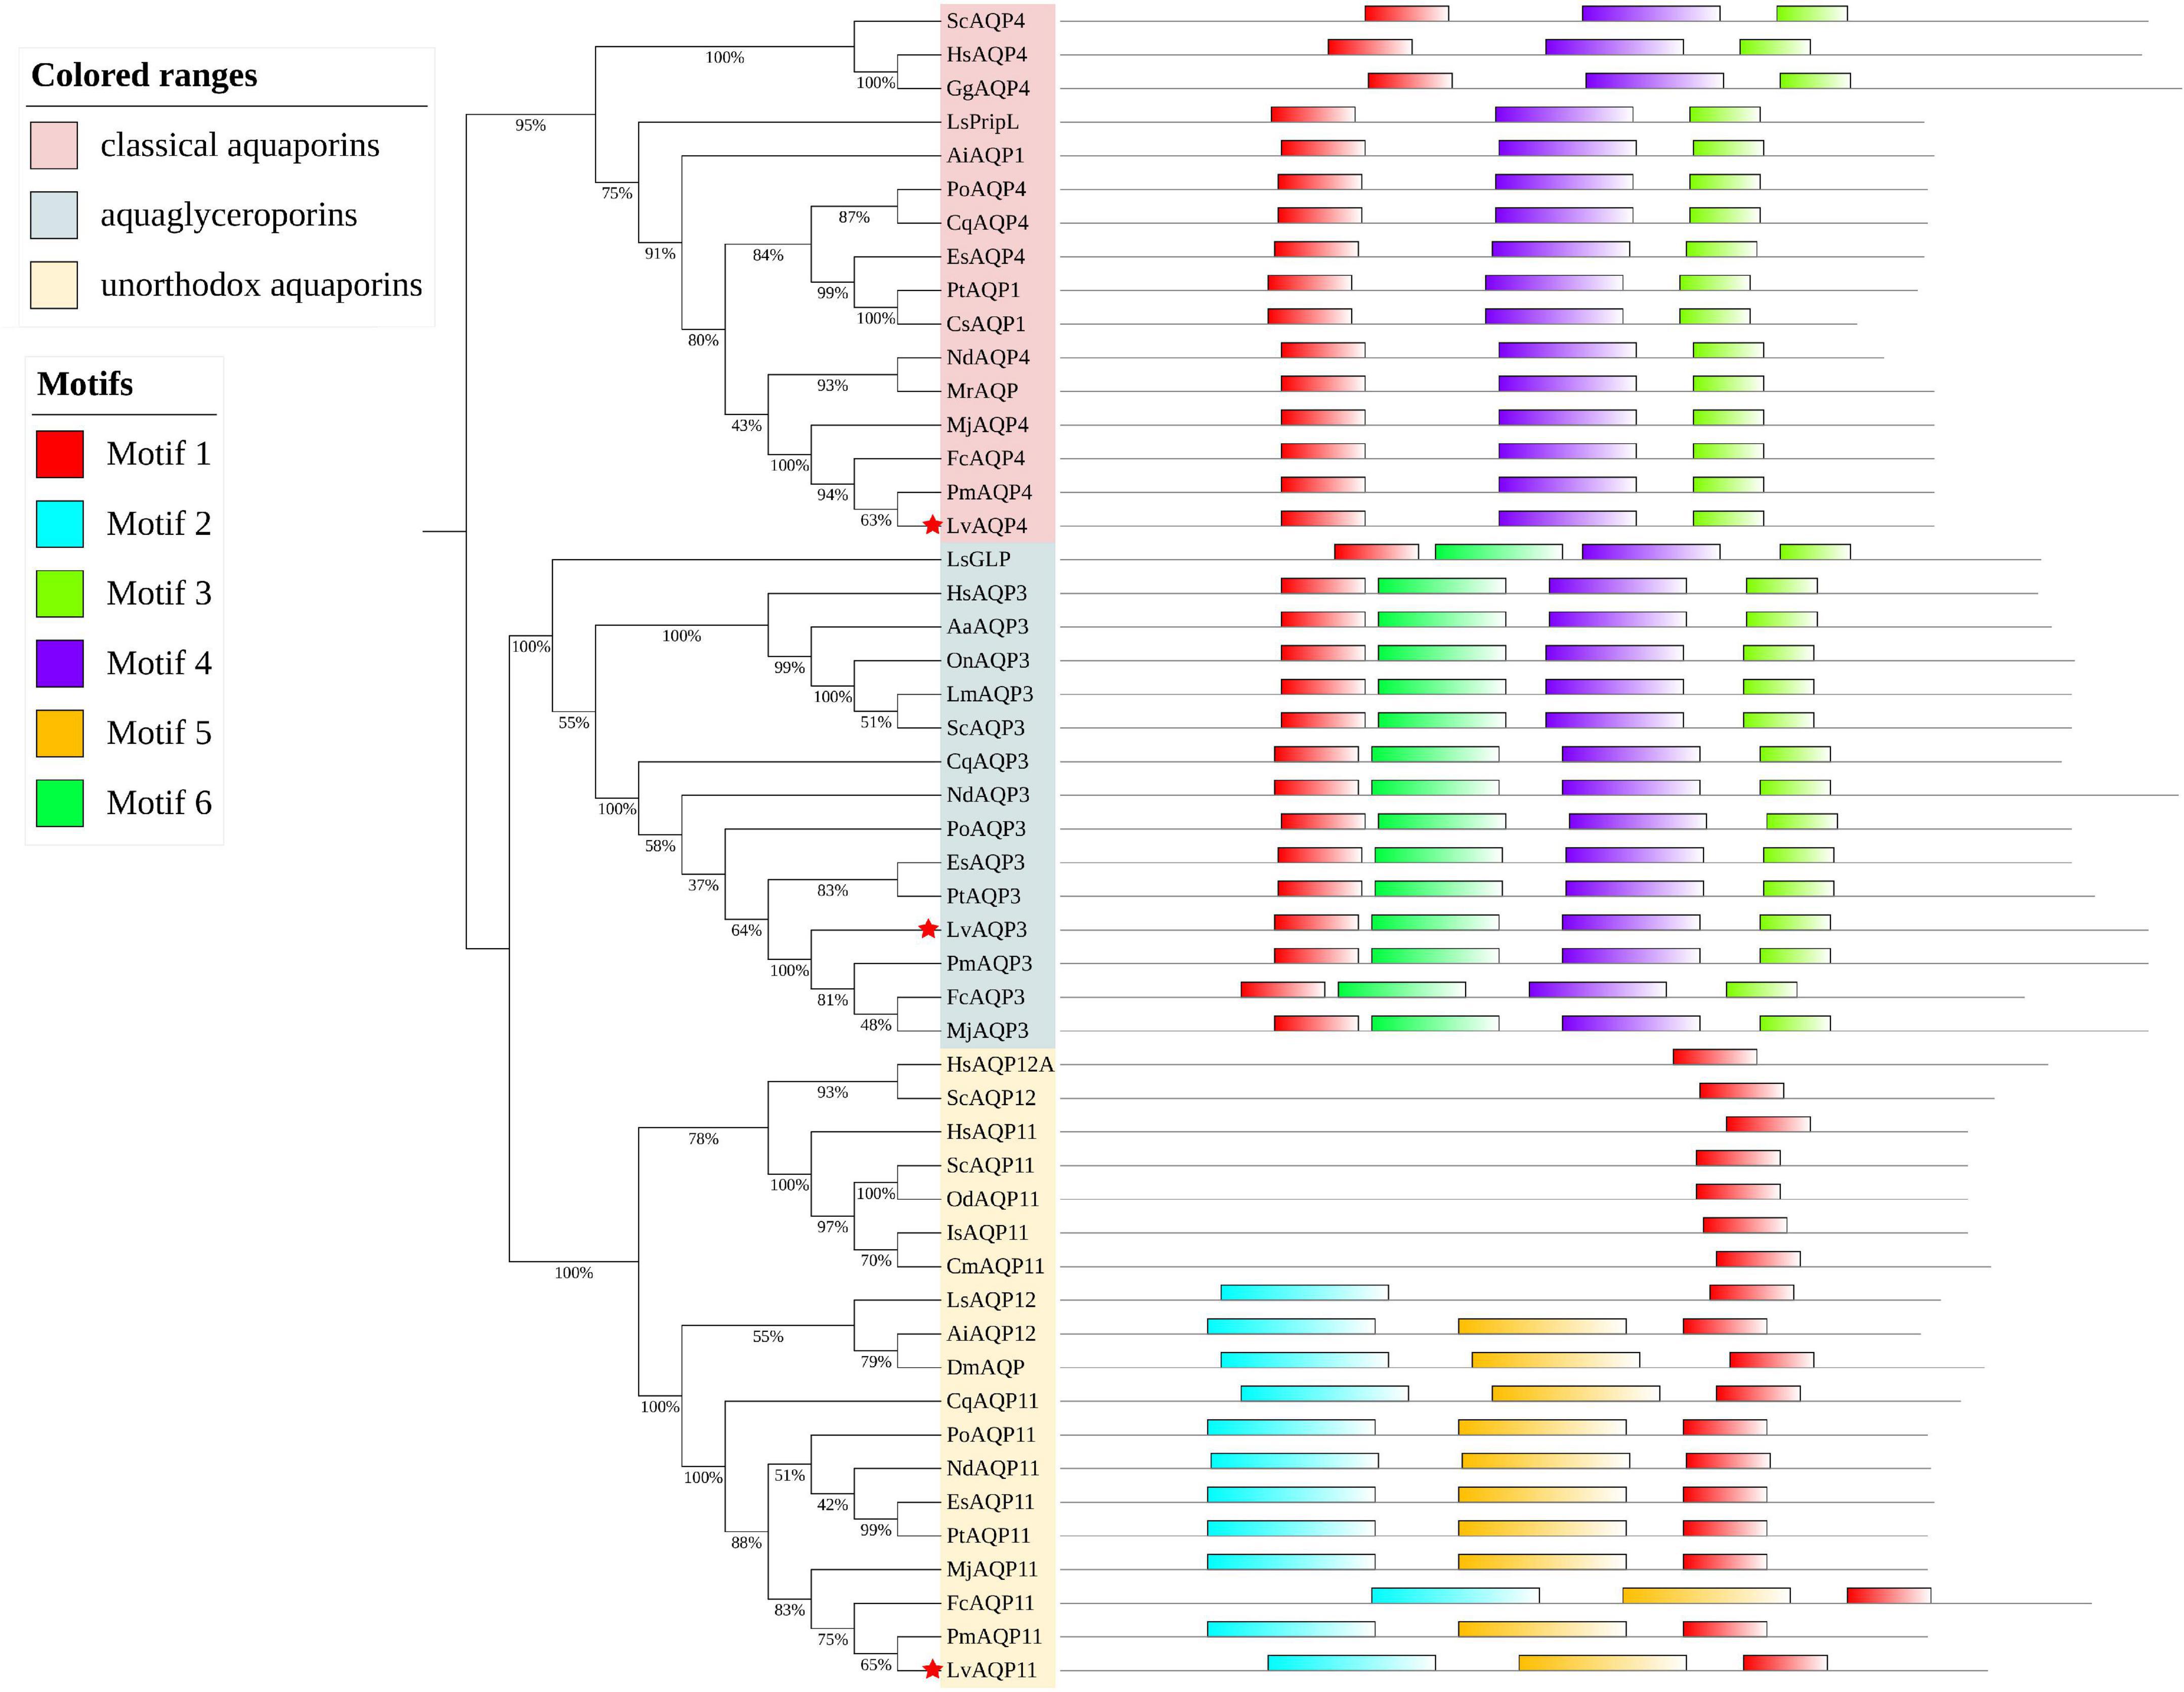
Figure 1. Molecular phylogenetic classification of the aquaporins and MEME motif distribution of each protein. A phylogenetic tree based on the amino acid sequences of the AQPs from multiple vertebrates and invertebrates was constructed by using MUSCLE and the maximum likelihood method of MEGA X. The node value indicates the percentage of 1,000 bootstrap replicates. Red stars indicate the LvAQP3, LvAQP4, and LvAQP11. Other AQPs used in the phylogenetic analysis were obtained by blast against the genome and transcriptome assemblies at NCBI database or CAT Database. The sources and accession numbers of the AQPs were listed in Supplementary Table 2.
The genomic organization of the aquaporins genes revealed that LvAqp3 and LvAqp4 genes were separately located at two independent scaffolds and both were single copy gene in the genome, whereas two LvAqp11 genes were found to be arranged in a tandem array locate at one scaffold (Figure 2). Online BLAST of the mRNA sequences against the scaffolds showed that LvAqp3 gene consisted of eight exons with the first exon mapped into scaffold604 and other exons mapped into scaffold3120 (Figure 2A). Besides the LvAqp3 transcript identified above, alternative splicing of partial sequence of exon 1 and whole exon 7 resulted in another LvAqp3 transcript, which had been presented in the annotated genome database (named LvAqp3-2). Nevertheless, the ORFs of LvAqp3-1 and LvAqp3-2 mRNA are still the same (Figure 2A). Similar alternative splicing was also found for LvAqp11 gene. Both LvAqp11 genes identified from the genome had the same coding regions with seven exons and are transcribed as three splice variants. In both cases the variation occurs at the N-terminus whereby only one exon of the first three exons was retained. We therefore named these isoforms LvAqp11-1, LvAqp11-2, and LvAqp11-3, respectively. The sequence of LvAqp11-2 was the same as the obtained transcript in this study. Nevertheless, the ORFs of the three LvAqp11 transcripts were located at the last four exons and encoding the same protein (Figure 2C). In contrast with the LvAqp3 and LvAqp11 genes, alternative splicing was not found in LvAqp4 gene. The LvAqp4 gene was composed of seven exons with the first exon mapped into scaffold3009 and other exons mapped into scaffold1754, and the ORFs was located at the first five exons (Figure 2B).
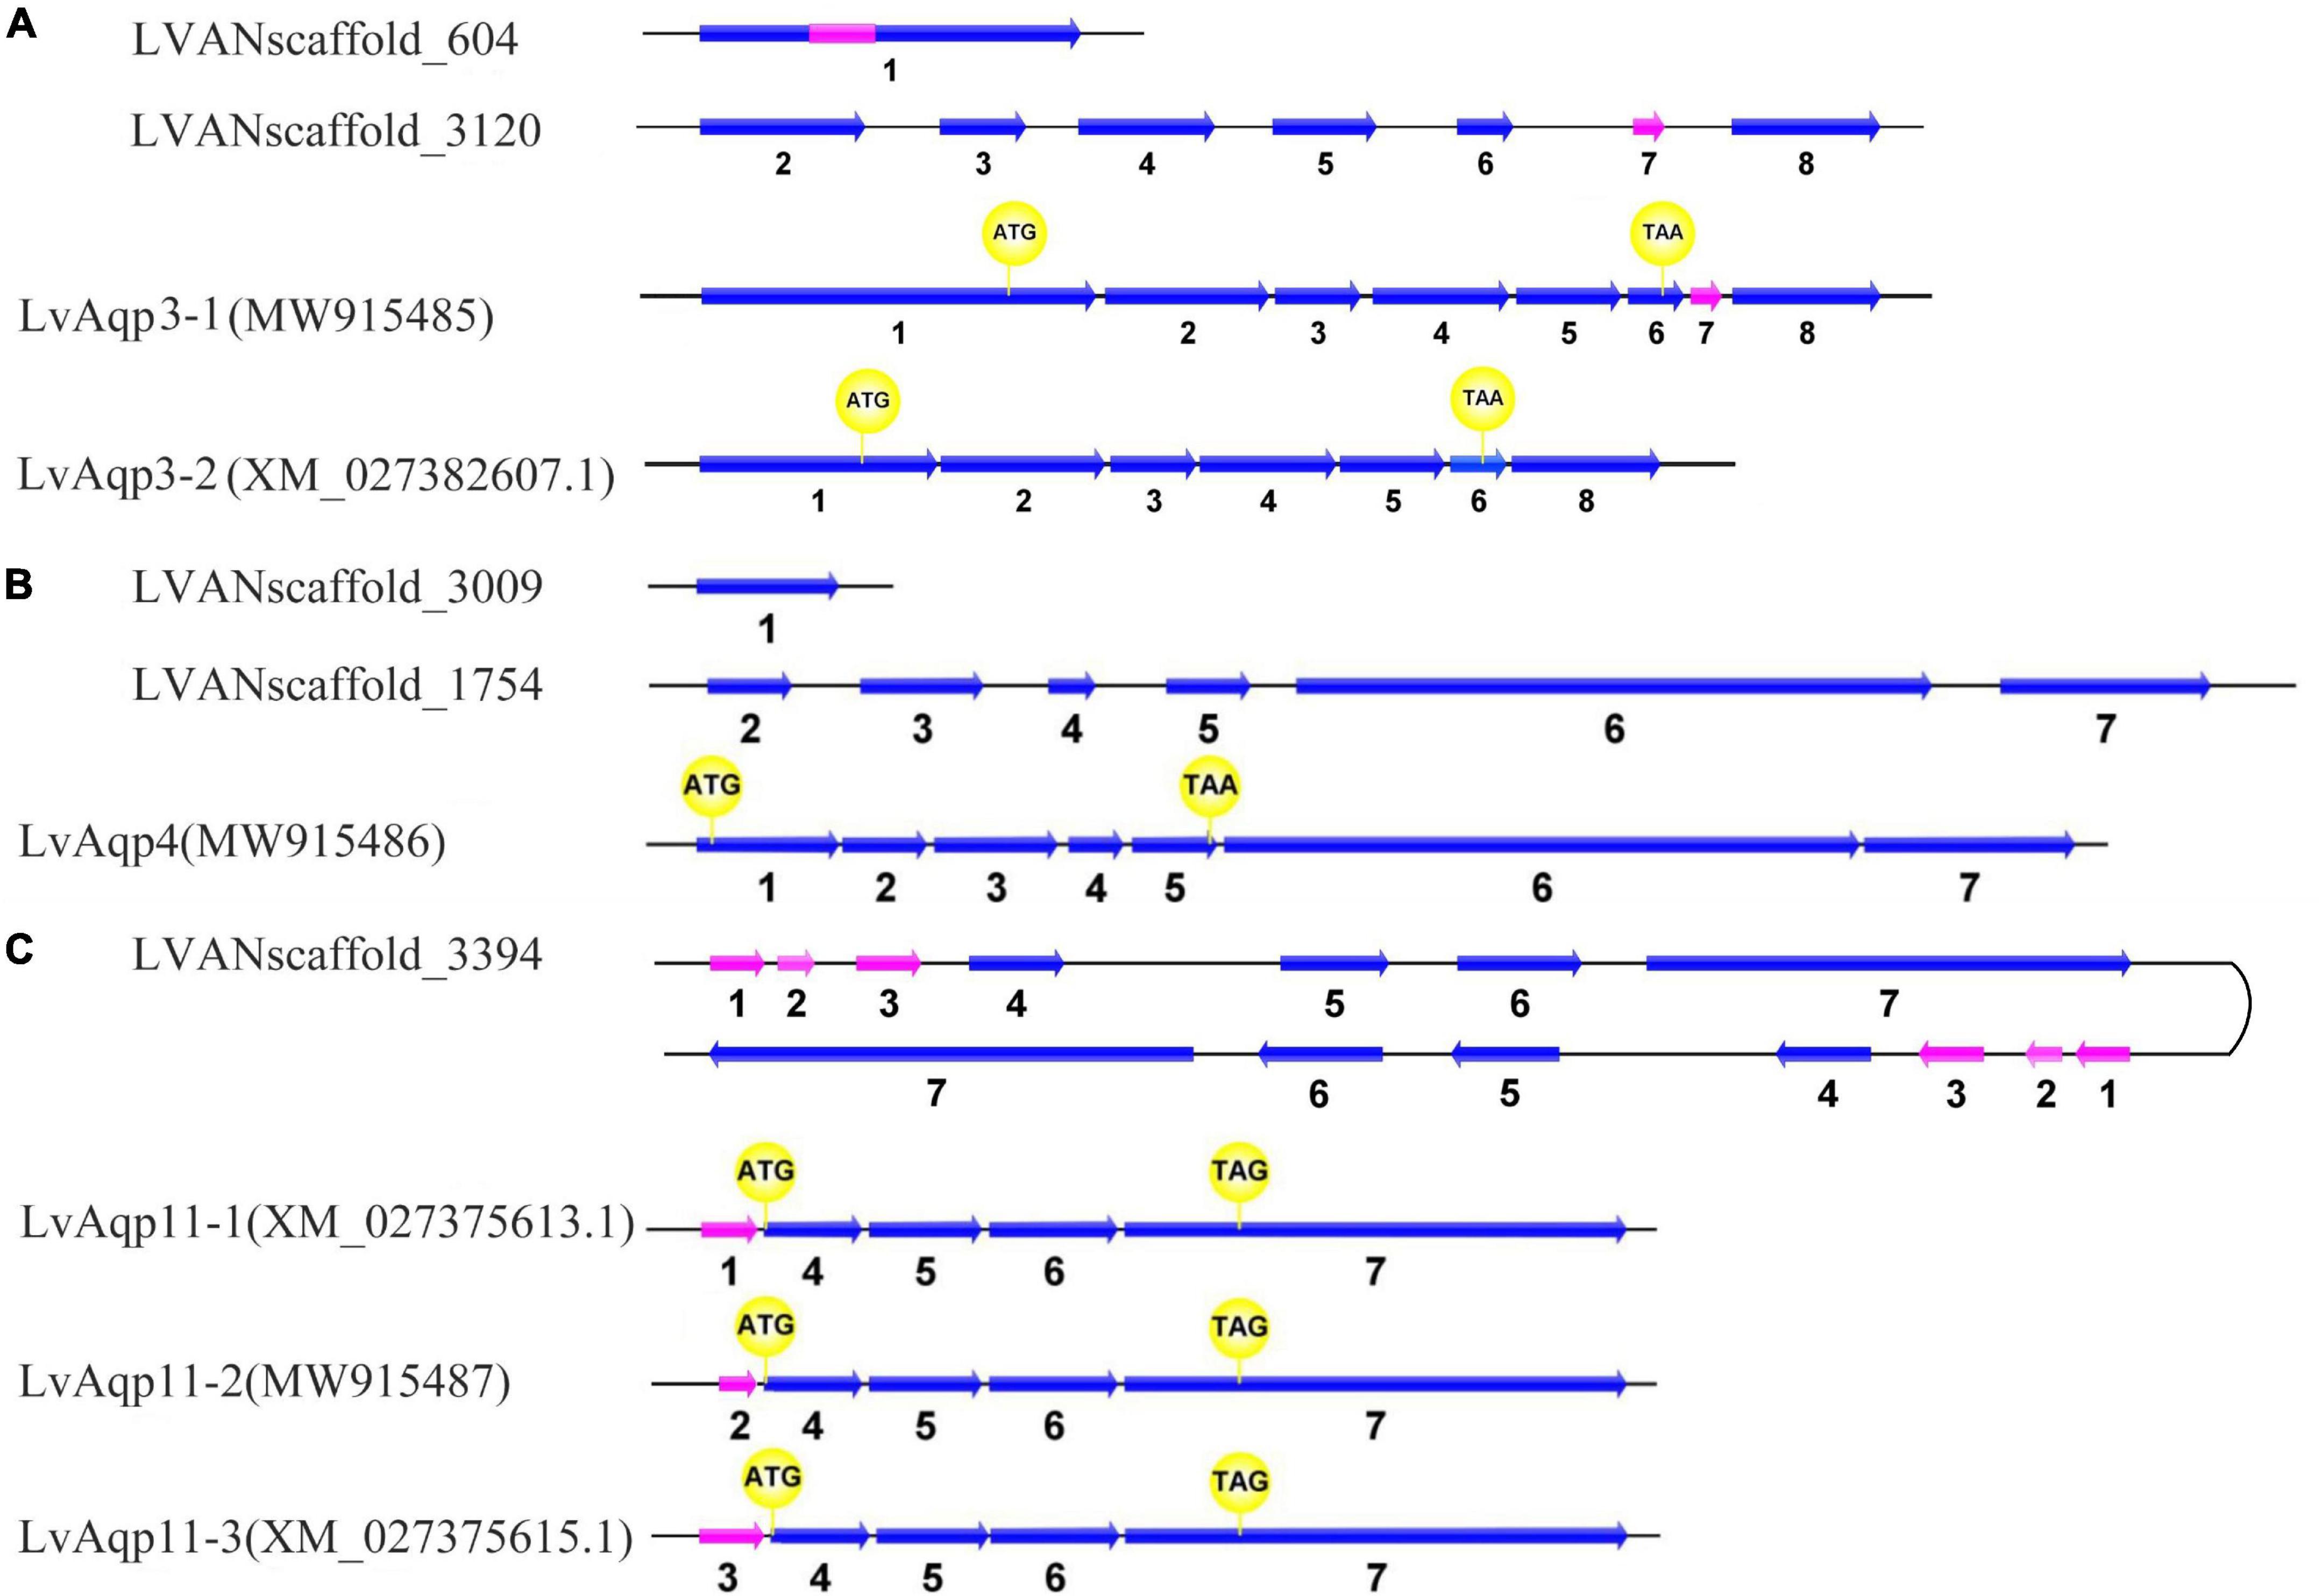
Figure 2. Gene structures of the LvAqp3 (A), LvAqp4 (B), and LvAqp11 (C). Exons were indicated in arrows and introns by thin lines. The alternative spliced exons were indicated by pink arrows. The start and stop codons were marked in yellow circles.
Multiple sequence alignments among the decapod AQPs showed that their sequences, especially for the NPA motifs, were conserved. In contrast to other subtypes of AQPs, the unorthodox aquaporins had non-canonical NPA motifs, with the N-terminal cysteine-proline-tyrosine (CPY) and C-terminal asparagine-proline-valine (NPV) motifs (Figure 3A). Positions for the four amino acids in the Ar/R constriction motif in the crustacean AQPs were identified based on protein alignments. The fourth amino acid residue of constriction motif is considered as the most highly conserved position, while all decapod AQPs, except AQP11 subfamily, is an arginine at this site. All decapod AQPs have an aromatic amino acid at the first position of constrict motif, except in some AQP4 proteins where it was a valine. The amino acid residues at the second and third positions varied among three decapod AQPs subfamilies. In the second position, the AQP3 subfamily had a glycine, the AQP4 subfamily had a histidine, and the AQP11 subfamily had a valine. The amino acid at the third position was a tyrosine, serine or alanine, and glycine for the AQP3, AQP4, and AQP11 subfamily, respectively (Figure 3A).
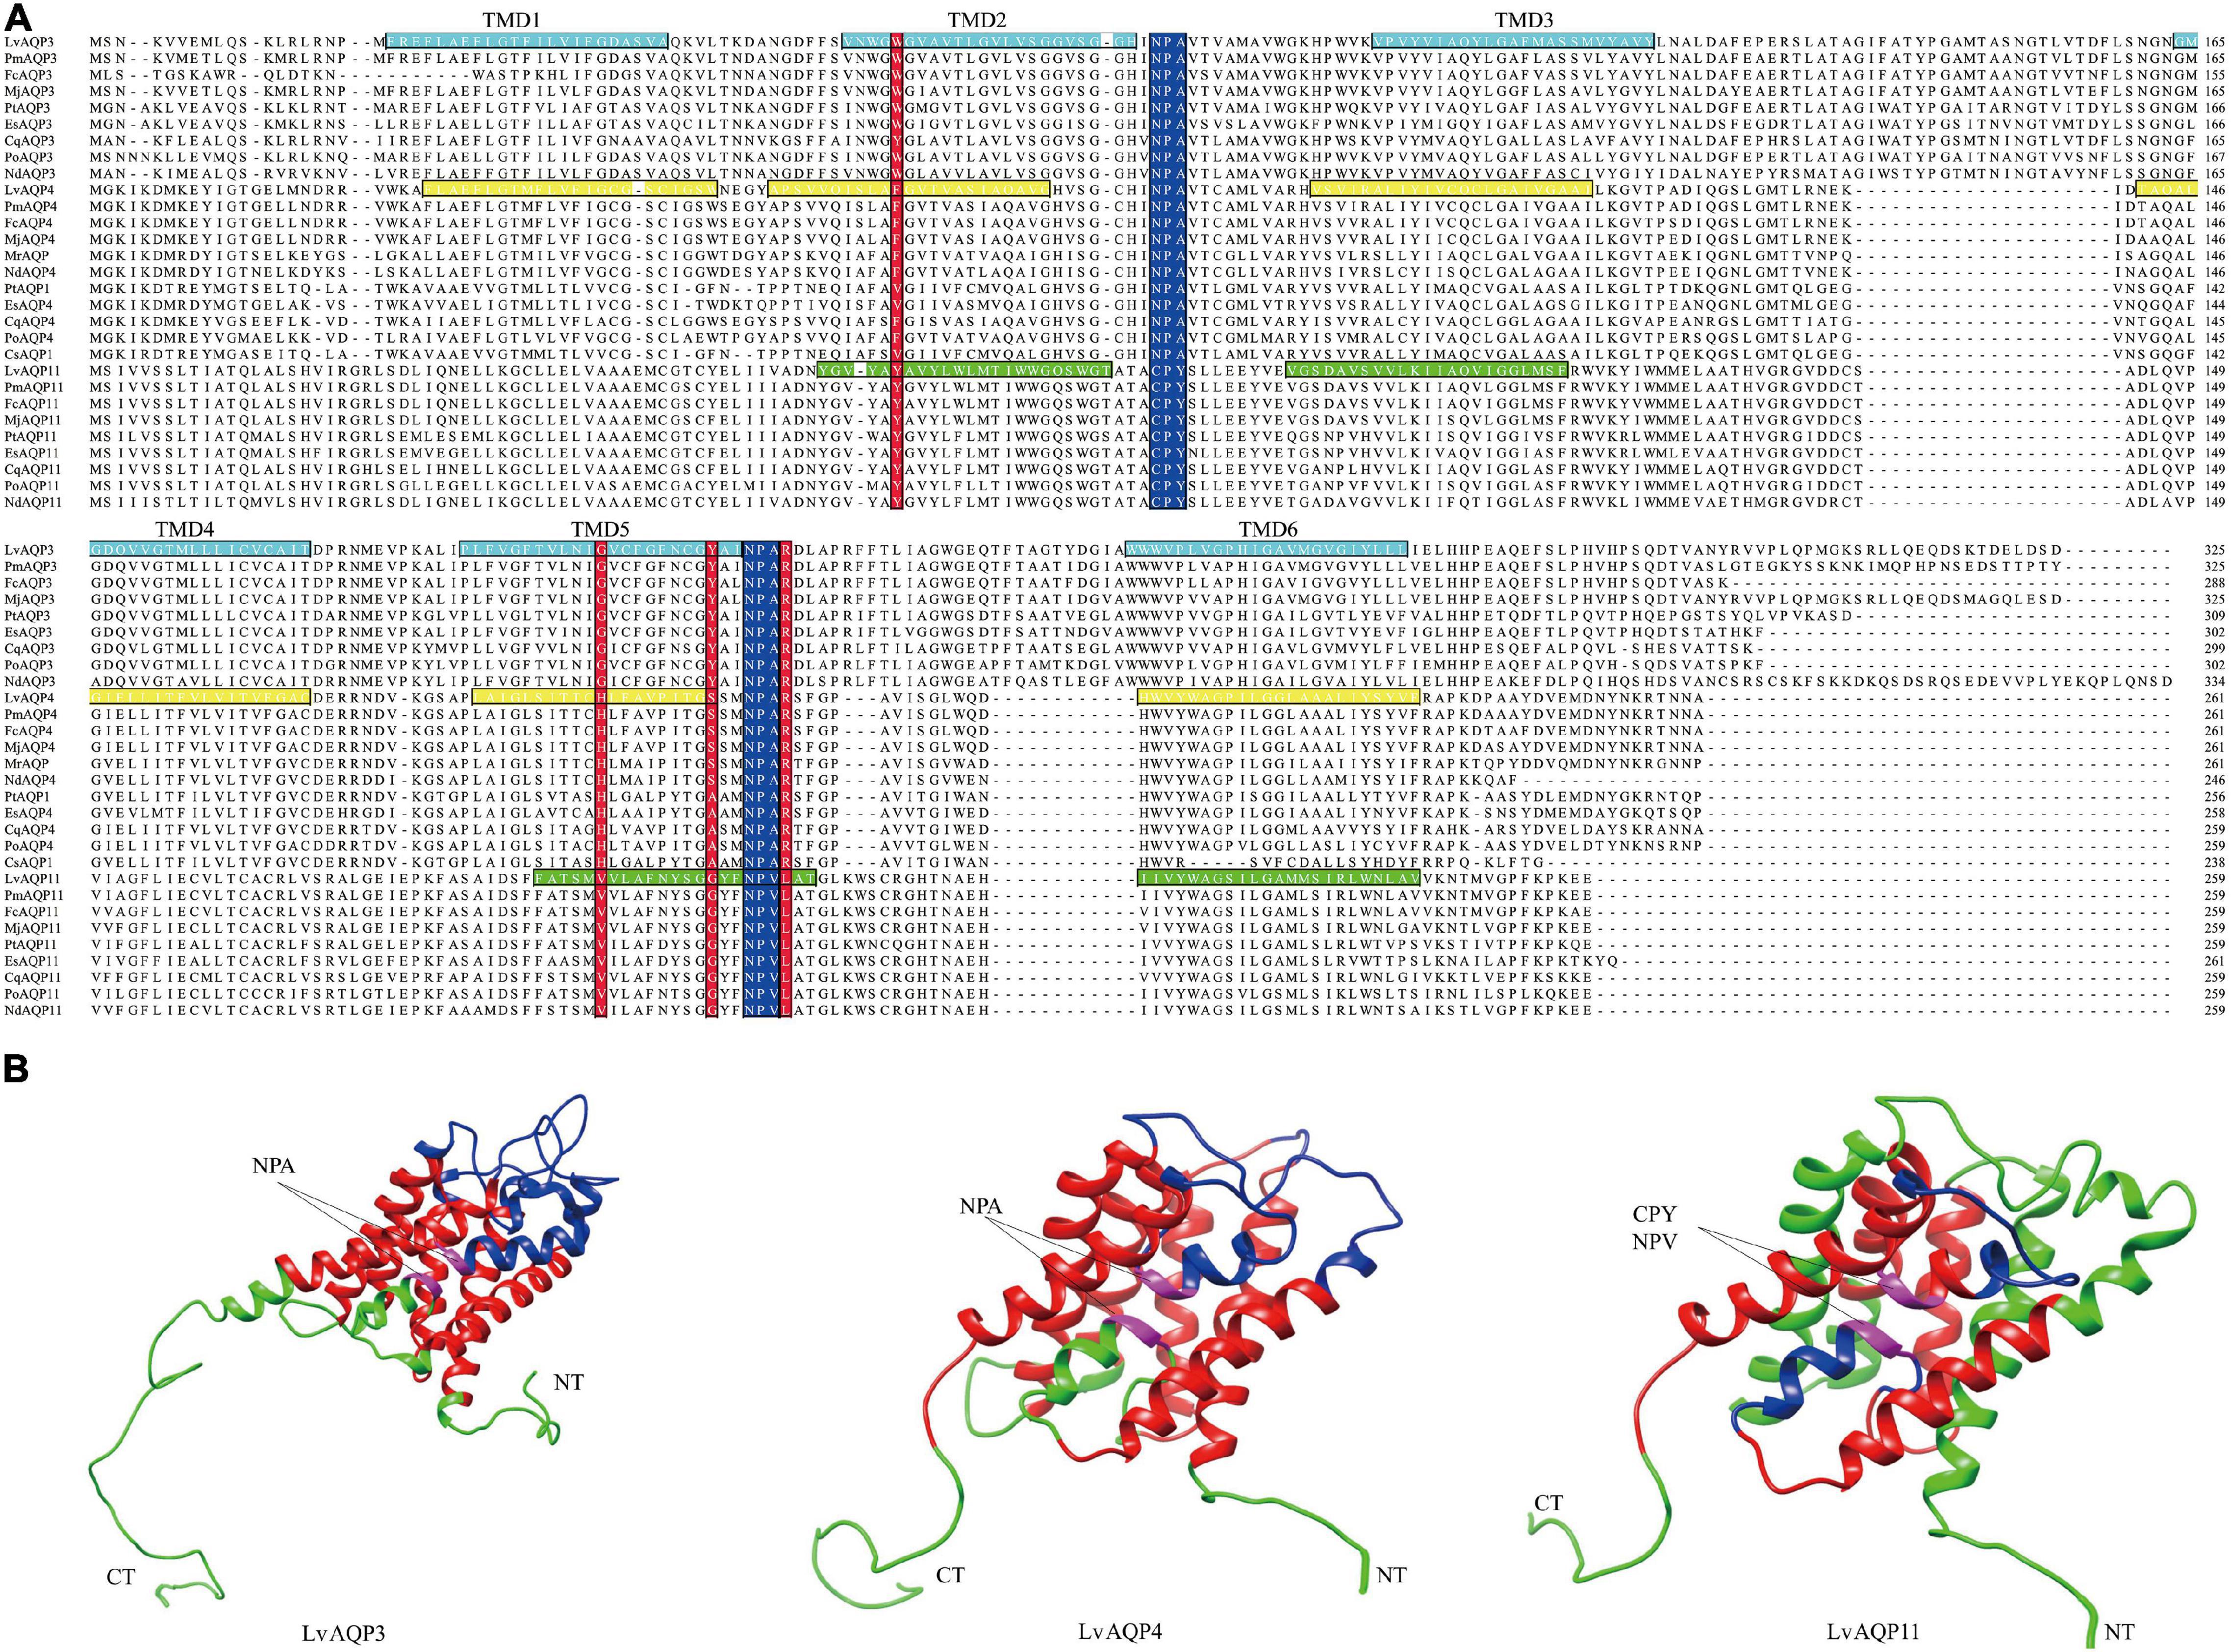
Figure 3. The conserved structural features of LvAQPs. (A) Protein alignments of the aquaporins in crustaceans. The two NPA motifs (or the variants thereof) were indicated with blue boxes, and the four amino acids in the constriction site were indicated with red boxes. The sequences of the transmembrane spanning regions (TMDs), based on TMHMM predictions of LvAQP3, LvAQP4, andLvAQP11, were indicated with indigo, yellow, and green boxes, respectively. (B) Analysis of the tertiary structural features of LvAQP3, LvAQP4, and LvAQP11. Blue region: outside of the membrane. Green region: inside of the membrane. Red region: transmembrane helix. CT: carboxyl terminal. NT: amino terminal. Pink region: NPA/CPY/NPV motifs. The sequence features of the proteins were illustrated based on the prediction results from TMHMM. Thus, the two predicted weak helices of LvAQP11 formed as transmembrane helices were still painted as green.
Results from TMHMM prediction indicated that LvAQP3 and LvAQP4 contained six potential transmembrane helices and five connecting loops. However, in the case of LvAQP11, the probability scores for some of the helices were weak. Thus, four potential transmembrane helices and three connecting loops were found in LvAQP11 (Figure 3A). In order to obtain tertiary structures of LvAQPs, in silico homology models were built for each protein. All LvAQPs showed structural features that are typical of known AQP pore channels (Figure 3B). The highly conserved dual NPA motifs were symmetrically distributed in LvAQP3 and LvAQP4 for pore structure formation (Figure 3B). Besides, the two predicted weak helices still formed transmembrane helices in the tertiary structure for LvAQP11, with the non-canonical CPY and NPV motifs similar to the pore structure formation function of the NPA motifs (Figure 3B).
qPCR analyses characterized the tissue specific expression patterns of LvAqp3, LvAqp4, and LvAqp11 mRNAs in juvenile L. vannamei at intermolt stage. The expression patterns of LvAqp3-1 and LvAqp3-2 mRNAs were first examined together with a pair of primers because the ORFs of both mRNAs were identical. Therefore, the total expression levels of LvAqp3-1 and LvAqp3-2 were regarded as the expression of LvAqp3 gene, and significantly higher levels of expression was observed in intestine (Figure 4A). Further analysis showed that the LvAqp3-1 mRNA was the predominant isoform expressed in intestine (Supplementary Figure 2A). The LvAqp4 could be detected in all examined tissues with varied expression levels in different tissues, and significantly higher levels of expression were observed in hepatopancreas, stomach, and gill (Figure 4B). In the case of LvAqp11, the three alternative spliced transcripts were quantified together and showed the extremely high expression level in muscle (Figure 4C). In addition, the LvAqp11-2 mRNA was the predominant isoform expressed in muscle (Supplementary Figure 2B). The total levels of two LvAqp3 mRNAs and three LvAqp11 mRNAs was used to represent the expression of LvAqp3 and LvAqp11 genes in the following studies, respectively.
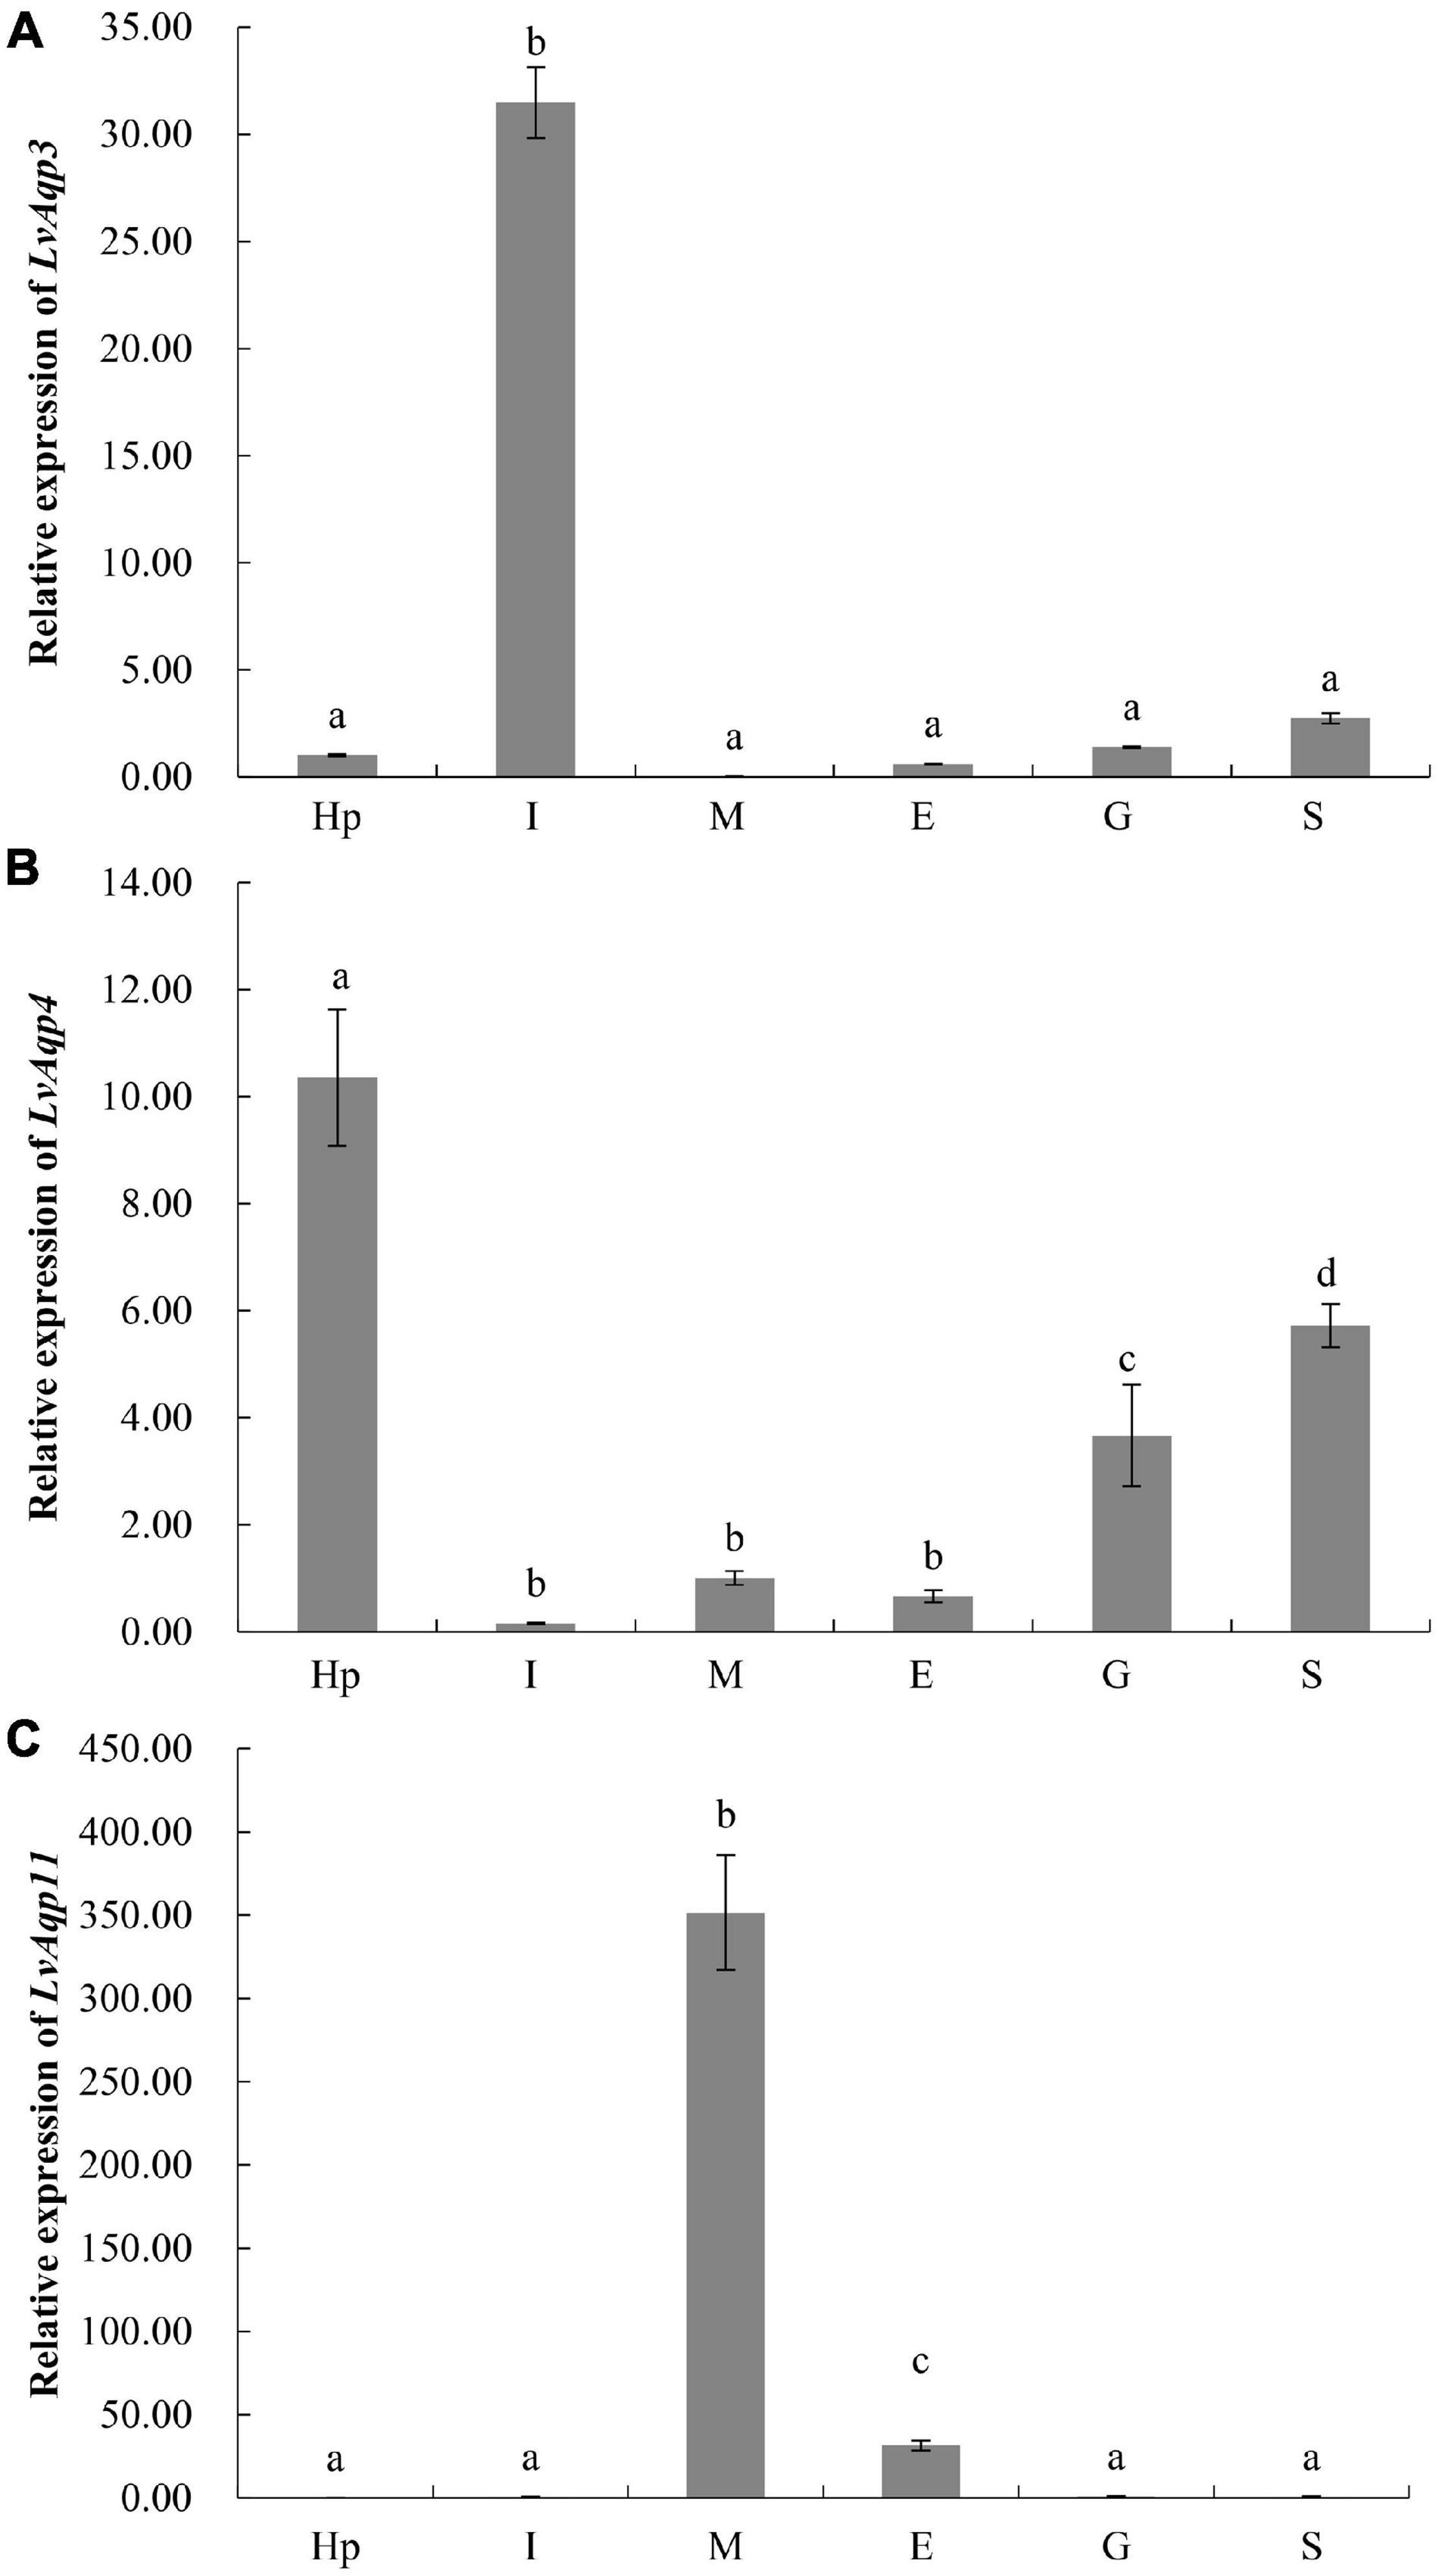
Figure 4. Tissue distribution of LvAqp3 (A), LvAqp4 (B), and LvAqp11 (C) in different tissues. Hp, hepatopancreas; I, intestine; M, muscle; E, epidermis; G, gill; S, stomach. The data are presented as mean ± SD (n = 3). Means labeled with different letters are significantly different (p < 0.05).
As the LvAqp3 and LvAqp11 were separately predominantly expressed in intestine and muscle, suggesting that the two genes primarily function in intestine and muscle, respectively. Thus, we selected intestine and muscle to separately detect the expression profiles of LvAqp3 and LvAqp11 under salinity stress. In addition, the expression of LvAqp4 was mostly expressed in hepatopancreas, stomach, and gill. Thus, the hepatopancreas was first chosen to detect the expression of LvAqp4 under salinity stress and the gill was also selected because it is an important osmoregulatory tissue. Compared with the shrimp of control group at salinity 30‰, qPCR analysis showed that in the intestine, the expression level of LvAqp3 significantly decreased at 2 h and remained at low levels from 2 to 24 h, regardless of whether they were under acute low- or high-salinity stress (Figure 5A). The significantly lower expression of LvAqp3 was also detected in the intestine when the shrimp were exposed to long-term low- or high-salinity stress (Figure 5B). On the contrary, the expression levels of LvAqp4 in the hepatopancreas were significantly up-regulated after acute salinity stress. It was significantly increased at 4 h, then consistently elevated and reached the peak at 24 h under acute low-salinity stress (Figure 5C). Meanwhile, the expression was significantly higher at 2 h, and no significant changes were found in the following time points at acute high-salinity stress (Figure 5C). However, the elevated expression of LvAqp4 in the hepatopancreas was not observed under long-term salinity stress. It was not significantly altered after 15 days of low salinity stress, while it decreased and stayed at a lower level compared to control under high salinity stress (Figure 5D). The expression profiles of LvAqp4 in the gill showed a similar expression pattern compared to LvAqp3 (Figures 5E,F). Yet, two major differences were noted. First, no significant changes in the expression of LvAqp4 in the gill were observed since the initial decrease at 2 h after acute salinity stress (Figure 5E). Second, the reduction was larger in the expression levels of LvAqp3 than that observed in LvAqp4 in the gill after long-term salinity stress (Figure 5F). Moreover, the acute salinity stress caused a gradual decrease in the expression level of LvAqp11 in muscle (Figure 5G). The expression of LvAqp11 was also down-regulated during the long-term salinity stress (Figure 5H).
Figure 5. Differential expression of LvAqps after salinity challenge. Expression profiles of LvAqp3 in intestine (A,B), LvAqp4 in hepatopancreas and gill (C–F), and LvAqp11 in muscle (G,H) under acute and long-term salinity stress, respectively. The data are presented as mean ± SD (n = 3). Means labeled with different lower case letters are significantly different (p < 0.05).
Nine intestine RNA samples of high quality (three replicates in each group) were used for the creation of cDNA libraries, followed by sequencing. The details were listed in Supplementary Table 3. A total of 440,033,298 paired-end reads with 150-bp read length were generated and 437,955,694 clean reads were selected after removing the reads containing adapters and/or poly-N, and low-quality reads. The average Q20, Q30, and GC% were 97.45, 93.16, and 44.63%, respectively. Next, clean reads were aligned to the L. vannamei genome using Hisat2 and the average mapping rate was 82.65% among the samples. Raw reads were archived in the NCBI SRA (accession No. PRJNA772775). In total, 1,964 DEGs between different groups were chosen by means of the following criteria: an adjusted p-value < 0.05 and | log2 Fold Change| > 1.0. A number of genes were found to be significantly up-regulated in S30 compared to S50 (711) and in S30 compared to S10 (213). The corresponding numbers of down-regulated genes were 661 and 614, respectively. The qPCR analysis of nine selected DEGs were compared with the results of the differential expression analysis. Overall, the differential expression of these genes was confirmed by the qPCR analysis, indicating the reliability and accuracy of our differential expression analysis (Supplementary Figure 3). In addition, to get expression patterns of DEGs upon different salinity stresses, STEM was performed to classify all the DEGs according to their abundance changes. The DEGs were classified into eight clusters according to their expression patterns, while only three gene expression profiles were significant (p < 0.05) (Figure 6). Down-regulated profile and up-regulated profile under both salinity stresses contained 596 and 435 DEGs, while 331 DEGs in another profile were elevated at the high salinity stress and not significant changed at low salinity stress. The results were in accordance with the patterns shown in the heatmap (Figure 6). Moreover, for the purpose of the study, we checked the expression of osmoregulatory genes. The results showed that the 10 highest expressed genes were hardly significantly changed under acute salinity stresses (Supplementary Table 4).
Figure 6. Hierarchical clustering of DEGs in the intestine. The heatmap of all DEGs was drawn by TBtools (Chen et al., 2020). Colors represent relative mRNA expression as indicated in the color key. The red color shows high expression, and the blue color represents lower levels of expression. The color from red to blue represents the log2 (FPKM + 1) from large to small. The clustering indicates similar expression patterns among the groups. The DEGs were grouped into three main clusters according to their expression patterns. The p-value and numbers of DEGs are shown at the bottom of the square. For each cluster, several enriched genes in each profile are listed.
In total, 31 and 21 GO terms were significantly enriched in the intestine of the two comparisons (S30 vs. S10 and S30 vs. S50), respectively (corrected p < 0.05; Supplementary Tables 5, 6). The top significantly enriched GO terms were shown in Figure 7A. Among the significantly enriched terms, half were belonged to biological processes, including alpha-amino acid metabolic process (GO: 1901605), cellular amino acid metabolic process (GO: 0006520), aromatic amino acid family metabolic process (GO: 0009072), L-phenylalanine metabolic process (GO: 0006558), and erythrose 4-phosphate/phosphoenolpyruvate family amino acid metabolic process (GO: 1902221) enriched in both comparisons. In addition, similar results were also found for the enriched terms of cellular component, such as Golgi stack (GO: 0005975), Golgi cisterna (GO: 0031985), Golgi subcompartment (GO: 0098791), and extracellular region (GO: 0005576); molecular function, such as catalytic activity (GO: 0003824), sulfotransferase activity (GO: 0008146), transferase activity, transferring sulfur-containing groups (GO: 0016782), and prenol kinase activity (GO: 0052673).
Figure 7. Functional enrichment of DEGs. (A) Circular map of the top enriched GO terms in S30 vs. S10 and S30 vs. S50. (B) Comparison of enriched pathways that were predicted by DEGs with different comparisons.
Thirteen and 11 KEGG pathways were significantly enriched in the intestine of the two comparisons, respectively (corrected p < 0.05; Supplementary Tables 7, 8) and were shown in Figure 7B. Most of the significantly enriched pathways belonged to the metabolism pathway class. Moreover, the results demonstrated that there were seven pathways enriched in both comparisons: amino acid metabolism (Tyrosine metabolism, Phenylalanine metabolism, and Phenylalanine, tyrosine and tryptophan biosynthesis), carbohydrate metabolism (Amino sugar and nucleotide sugar metabolism), global and overview maps (Metabolic pathways), and glycan biosynthesis and metabolism (Glycosaminoglycan biosynthesis-keratan sulfate and Mucin type O-glycan biosynthesis) (Figure 7B).
Based on biological characteristics, molecular phylogeny, and permeation selectivity to water, glycerol, or other substance, 13 members of human AQP family are divided into three subfamilies: classical aquaporins, aquaglyceroporins, and unorthodox aquaporins (Benga, 2012; Ishibashi et al., 2017). Although only three types of AQPs were identified in L. vannamei, phylogenetic analysis revealed that the categorization of LvAQPs is consistent with the previous classification of human AQPs, with each LvAQP corresponding to a subfamily. Moreover, as we obtained more decapod AQPs by blast against the NCBI or CAT Database (Nong et al., 2020), it seems that this classification is common for decapod species. Apart from the above subfamilies, the classical aquaporins still includes an arthropod specific subfamily, big brain (BIB) protein (Finn and Cerdà, 2015), which is not characterized in this study. Thus, further elucidation and verification of other subgroups are warranted.
In this study, the three splice variants of LvAqp11 encoded proteins with identical sequences. This is also the case for LvAqp3. Alternative splicing of aquaporins has been reported in crustacean salmon louse (Lepeophtheirus salmonis) (Stavang et al., 2015) and barnacle (Balanus improvise) (Lind et al., 2017). Furthermore, we analyzed the available genomes of three crustacean species, and found that transcripts of aquaporin-11-like genes from the Penaeus monodon (Gene ID: 119593716), Penaeus japonicus (Gene ID: 122256039), and Homarus americanus (Gene ID: 121855104) also have N-terminal splice variants with identical ORFs sequences, created by a similar splicing mechanism as occurs for the LvAqp11 transcripts. Such conserved splicing mechanism indicate that the splice variants might have some important function. Nevertheless, only LvAqp3-1 and LvAqp11-2 were predominantly expressed in the intestine and muscle, respectively. Aquaporins variants are expressed sex-specifically in a copepod, Caligus rogercresseyi (Farlora et al., 2014) and in an insect Anopheles gambiae (Tsujimoto et al., 2013). As we do not detect the expression of splice variants in gonads, it is possible that they might have functions in sex-related organs.
The NPA motifs are the most common conserved signature of AQPs and play a critical role in the formation of a pore structure (Ishibashi et al., 2017). Sequence analysis showed that the identified decapod AQP3 and APQ4 proteins all have the two conserved NPA motifs. Instead, the AQP11 proteins contain CPY and NPV motifs. The variations of the NPA motifs in the decapod unorthodox AQPs are not unusual in comparison to unorthodox AQPs from other species. The same substitutions are found in AQP12L1 and AQP12L2 from L. salmonis (Stavang et al., 2015). Moreover, the CPY substitution has been reported in AQP12 from B. improvise (Lind et al., 2017), while the NPV substitution in AQP of Rhodnius prolixus has been shown to be functional in in vitro assays (Staniscuaski et al., 2013).
The regulation of AQPs under salinity stress has been well-reported in fish, where it has also been shown that the expression patterns and levels of AQPs in different species, tissues, and environments vary (Madsen et al., 2015). Nevertheless, the osmoregulatory role of AQPs is little known in crustaceans. Earlier investigation of the osmoregulatory function of AQPs is mainly dependent on the findings of transcriptome study in crustaceans, especially in decapods. The expression of Aqps decreased in the gills of Portunus trituberculatus during 3 days of acute low salinity stress (Gao et al., 2019) and after 10 days of hypo-osmotic and hyper-osmotic stress (Lv et al., 2013). The results were in accordance with the expression patterns of LvAqp4, which was down-regulated in the gill under acute and long-term salinity challenges. Similar expression patterns of Aqps were also reported in Crassostrea gigas (Meng et al., 2013) and B. improvise (Lind et al., 2017) under long-term salinity stress. These results indicate that salinity stresses could induce a reduction of AQPs activities to avoid cell swelling or shrinkage as a consequence of water influx or efflux. In contrast, opposite changes in the expressions of LvAqp4 were found in the hepatopancreas under acute salinity stresses. Gao et al. (2017) has reported the up-regulation of LvAqp4 in the hepatopancreas under acute high salinity stress, whereas its expression was not significantly changed under acute low salinity stress. It was not completely consistent with our results. Instead, we observed no significant changes of LvAqp4 in the hepatopancreas under long-term low salinity stress. This deviation is probably due to the developmental stage of the shrimp. Juvenile shrimp are used in this study, which are much smaller than the sub-adult shrimp in their study. It is widely accepted that larval or juvenile shrimp are more tolerable to salinity stresses in aquaculture practices. In blue crab C. sapidus, the expression of Aqp1-like gene was shown to be related to developmental stages, and it was transcriptionally up-regulated at early larval stages in the exposure of hypo-salinity (Chung et al., 2012).
The unorthodox aquaporin of LvAqp11 is mostly expressed in the muscle, whereas its orthologs are mainly expressed in the mammalian kidney and pancreas (Li and Wang, 2017). As unorthodox aquaporins are most recently identified, still less is known about this subfamily than other AQP subfamilies. Its unique intracellular localization, specifically in the ER of mammalian cells has made its functional studies challenging (Ishibashi et al., 2021). To date, functional studies on unorthodox aquaporins in crustacean has been only reported in salmon louse, the unorthodox aquaporins of which are localized intracellularly and difficult to be expressed in Xenopus oocytes as is the case with mammalian unorthodox aquaporins (Stavang et al., 2015). In addition, the few studies on unorthodox aquaporins in fish have reported that these molecules significantly induce water or glycerol permeability in medaka and zebrafish oocytes (Tingaud-Sequeira et al., 2010; Kim et al., 2014). The significantly reduced levels of LvAqp11 indicate that it is sensitive to relative salinity changes. Further immunohistochemistry studies would be needed to investigate the spatial expression of LvAQP11 in order to better understand their biological functions on osmoregulation.
Four members of aquaglyceroporins subgroup (AQP3, 7, 9, and 10) have been identified in vertebrate (Ishibashi et al., 2017, 2020). Nevertheless, we only obtained one aquaglyceroporin from L. vannamei and other decapod species. In addition, the number of members in aquaglyceroporins subfamily differs in crustaceans. The barnacle has two, while salmon louse has three and Daphnia has six (Lind et al., 2017). In L. vannamei, the LvAqp3 is predominantly expressed in the intestine. Such expression pattern of aquaglyceroporins have been observed in its human counterpart AQP10, which is mainly expressed in the gastrointestinal tract (Li and Wang, 2017). The AQP10 isoform is also dominantly detected in the intestine of teleost zebrafish (Hamdi et al., 2009) and medaka (Kim et al., 2014). Moreover, the lower intestinal mRNA level of LvAqp3 under high salinity stress is consistent with the trend shown by the Aqp10 ortholog in medaka (Kim et al., 2014) and mandarin fish (Shen et al., 2021). The results suggest the possible osmoregulatory roles of aquaglyceroporins in the intestinal organoids.
Taken together, the presences of LvAqps are quite ubiquitously and sometimes are predominantly expressed at specific tissues. Our study further showed the effects of acute exposure and long-term acclimation to different salinities on the expression levels of LvAqp3, LvAqp4, and LvAq11 in the predominantly or mainly expressed osmoregulatory tissues. The results revealed that although the influences of environmental salinities on LvAqps expression varied among isoforms and tissues, their expression levels were significantly decreased in most cases. As to the salinity-dependent patterns of LvAqp4 in hepatopancreas not in accordance with that observed in gill, we hypothesized that the function of LvAqp4 may be tissue-specific during the osmoregulation. Moreover, the synthesis of these findings suggest that all the LvAQP isoforms collaborate to maintain water balance within the shrimp and reduce cellular damage resulted from water shifts.
It is considered that knock-down or overexpression experiment is required to verify the function of genes. However, it is difficult to overexpress LvAQPs in mRNA level or protein level in shrimp due to the lack of suitable shrimp cell line. Nevertheless, the sharply decreased levels of LvAqp3 mRNA in intestine under acute salinity stress provided a good model to perform gene expression assays with LvAqp3 gene, comparable to the effect of knock-down. Therefore, transcriptome analysis of intestine under acute salinity stress was conducted to reveal the role of LvAqp3 during the osmoregulation in intestine. Osmoregulation requires not only permeation of water but also the transport of ions. However, although several ion transporters and ion channels are significantly changed under salinity stresses, the 10 highest expressed osmoregulatory genes were hardly changed, including Na+/K+-ATPase (NKA), carbonic anhydrase (CA), and Ca2+ activated Cl– channel regulator 2/4. NKA and CA have been shown to play crucial roles during salinity adaptation in L. vannamei (Pan et al., 2014; Liu M. et al., 2015). It is possible that as they are important regulatory molecules for maintaining ion balance, their expression will not dramatically change in the intestine at the initial stage during the acute salinity stress. On the contrary, qPCR analysis has revealed the sharply decreased expression of LvAqp3 at the initial stages during the acute salinity stress. This result suggested a possible role of LvAQP3 as a coordinator of water and ion transport in the cell membrane. As described above, the down-regulated LvAqp3 may be related to the reduced activities of LvAQP3 to protect against cell swelling or shrinkage caused by water influx or efflux. The above results suggest the relative stable of intracellular ion concentration and water volume. However, this raises the question which osmolytes are used in the intestine cell for maintaining osmotic balance. Further enrichment analysis indicates similar GO terms and KEGG pathways related to amino acid metabolism in the intestine under acute low- and high-salinity stresses, which is similar to the previous findings in crustaceans (Li et al., 2014; Wang et al., 2015; Yuan et al., 2021). The finding in this study further corroborates the notion that free amino acids are important intracellular osmotic effectors in crustaceans (Cobb et al., 1975; McNamara et al., 2004; Augusto et al., 2007, 2009). Nevertheless, the enriched DEGs are quite different in those terms and pathways under acute low- or high-salinity stress. Most of the enriched DEGs are down-regulated at low salinity, whereas more enriched DEGs are up-regulated at high salinity (Supplementary Tables 5–8). It is possible that changes in the gene expression may lead to changes in free amino acid concentration. The concentrations of arginine, proline, and alanine were elevated significantly with increasing salinity in Eriocheir sinensis (Wang et al., 2012). We speculate that the down-regulated gene expression levels may result in the decreased concentrations of free amino acid and then reduce the intracellular osmotic pressure under acute low-salinity stress. In turn, the concentrations of free amino acid would be elevated to increase the intracellular osmotic pressure under acute high-salinity stress. Further metabolome study is needed to confirm the changes in free amino acid concentration under low- or high-salinity stress. Thus, based on transcriptomic results, we establish a hypothetical model of the components involved in salinity responses in the intestine of L. vannamei. When exposed to salinity stress, the activities of LvAQP3 will first be inhibited to stabilize the cell morphology, and then the free amino acid concentrations are adjusted by regulating the expression of amino acid metabolism related genes and pathways to maintain osmotic balance between intracellular region and external environment in the intestine (Figure 8). Furthermore, transcriptome analysis would supply new references and benefit future studies on the function of other LvAqp genes for better understanding their involvements in salinity adaptation of this euryhaline species.
Figure 8. The hypothetical model based on the expression changes of genes and pathways from the intestine transcriptome challenged with acute low- or high-salinity stress. NKA stands for the ion transporters and ion channels, the expression of which are not significantly changed.
Our analyses first reported three types of aquaporins in L. vannamei, where two of them, LvAqp3 and LvAqp11, have splice variants with identical ORFs. The relative gene expression profiles of three aquaporins revealed remarkable differences and some consistent expression patterns of those genes over an experimental time frame under different salinity stresses. On the whole, the expression of LvAqps was decreased and may probably contribute to protect cell by preventing the water shifts that lead to cellular damage in intestine, gill, and muscle upon salinity challenge. Moreover, we proposed the combination roles of aquaglyceroporin and amino acid metabolism in responses to acute salinity changes in the intestine based on the comparative transcriptome analysis. These findings shed new insights into the investigation regarding the osmoregulation of AQPs in the decapod species.
The datasets presented in this study can be found in online repositories. The names of the repository/repositories and accession number(s) can be found below: SRA, PRJNA772775; GenBank, MW915485, MW915486, MW915487.
ZW: conceptualization, methodology, investigation, funding acquisition, formal analysis, and writing—review and editing. YGC: investigation, formal analysis, resources, and data curation. CW, ZZ, NZ, and RW: investigation and resources. ZD: investigation. YTC: funding acquisition, investigation, and methodology YL: conceptualization, supervision, project administration, funding acquisition, and writing—review and editing. All authors contributed to the article and approved the submitted version.
This work was supported by the National Science Foundation of China (31802269), the Shrimp and Crab Innovation Team of Shandong Agriculture Research System (SDAIT-15-011), the Major Applied Technology Innovation Project of agriculture in Shandong Province (SD2019YY001), the High-level Talents Research Fund of Qingdao Agricultural University (663/1119054 and 663/1120027), and the “First Class Fishery Discipline” program in Shandong Province.
The authors declare that the research was conducted in the absence of any commercial or financial relationships that could be construed as a potential conflict of interest.
All claims expressed in this article are solely those of the authors and do not necessarily represent those of their affiliated organizations, or those of the publisher, the editors and the reviewers. Any product that may be evaluated in this article, or claim that may be made by its manufacturer, is not guaranteed or endorsed by the publisher.
We thank Gene Denovo corporation in assistance with sequencing analysis.
The Supplementary Material for this article can be found online at: https://www.frontiersin.org/articles/10.3389/fmars.2022.817868/full#supplementary-material
Abascal, F., Irisarri, I., and Zardoya, R. (2014). Diversity and evolution of membrane intrinsic proteins. BBA Gen. Sub. 1840, 1468–1481. doi: 10.1016/j.bbagen.2013.12.001
Augusto, A., Greene, L. J., Laure, H. J., and McNamara, J. C. (2007). Adaptive shifts in osmoregulatory strategy and the invasion of freshwater by brachyuran crabs: evidence from Dilocarcinus pagei (Trichodactylidae). J. Exp. Zoo. Part A 307A, 688–698. doi: 10.1002/jez.a.422
Augusto, A., Silva Pinheiro, A., Greene, L., Laure, H., and McNamara, J. C. (2009). Evolutionary transition to freshwater by ancestral marine palaemonids: evidence from osmoregulation in a tide pool shrimp. Aquat. Biol. 7, 113–122. doi: 10.3354/ab00183
Benga, G. (2012). On the definition, nomenclature and classification of water channel proteins (aquaporins and relatives). Mol. Aspects Med. 33, 514–517. doi: 10.1016/j.mam.2012.04.003
Bienert, G. P., Cavez, D., Besserer, A., Berny, M. C., Gilis, D., Rooman, M., et al. (2012). A conserved cysteine residue is involved in disulfide bond formation between plant plasma membrane aquaporin monomers. Biochem. J. 445, 101–111. doi: 10.1042/BJ20111704
Boyle, R. T., Oliveira, L. F., Bianchini, A., and Souza, M. M. (2013). The effects of copper on Na+/K+-ATPase and aquaporin expression in two euryhaline invertebrates. Bull. Environ. Contam. Toxicol. 90, 387–390. doi: 10.1007/s00128-012-0949-4
Chen, C., Chen, H., Zhang, Y., Thomas, H. R., Frank, M. H., He, Y., et al. (2020). TBtools: an integrative toolkit developed for interactive analyses of big biological data. Mol. Plant 13, 1194–1202. doi: 10.1016/j.molp.2020.06.009
Chen, K., Li, E., Li, T., Xu, C., Wang, X., Lin, H., et al. (2015). Transcriptome and molecular pathway analysis of the hepatopancreas in the Pacific white shrimp Litopenaeus vannamei under chronic low-salinity stress. PLoS One 10:e0131503. doi: 10.1371/journal.pone.0131503
Cheng, K., Hu, C., Liu, Y., Zheng, S., and Qi, X. (2006). Effects of dietary calcium, phosphorus and calcium/phosphorus ratio on the growth and tissue mineralization of Litopenaeus vannamei reared in low-salinity water. Aquaculture 251, 472–483. doi: 10.1016/j.aquaculture.2005.06.022
Chung, J. S., Maurer, L., Bratcher, M., Pitula, J. S., and Ogburn, M. B. (2012). Cloning of aquaporin-1 of the blue crab, Callinectes sapidus: its expression during the larval development in hyposalinity. Aquat. Biosyst. 8:21. doi: 10.1186/2046-9063-8-21
Cobb, B. F., Conte, F. S., and Edwards, M. A. (1975). Free amino acids and osmoregulation in penaeid shrimp. J. Agric. Food Chem. 23, 1172–1174. doi: 10.1021/jf60202a015
Croghan, P. C. (1958). The mechanism of osmotic regulation in Artemia Salina (L.): the physiology of the gut. J. Exp. Biol. 35, 243–249. doi: 10.1242/jeb.35.1.243
Cui, Z., Liu, Y., Yuan, J., Zhang, X., Ventura, T., Ma, K. Y., et al. (2021). The Chinese mitten crab genome provides insights into adaptive plasticity and developmental regulation. Nat. Commun. 12, 2395. doi: 10.1038/s41467-021-22604-3
Ernst, J., and Bar-Joseph, Z. (2006). STEM: a tool for the analysis of short time series gene expression data. BMC Bioinform. 7:191. doi: 10.1186/1471-2105-7-191
Farlora, R., Araya-Garay, J., and Gallardo-Escárate, C. (2014). Discovery of sex-related genes through high-throughput transcriptome sequencing from the salmon louse Caligus rogercresseyi. Mar. Genom. 15, 85–93. doi: 10.1016/j.margen.2014.02.005
Finn, R. N., and Cerdà, J. (2015). Evolution and functional diversity of aquaporins. Biol. Bull. 229, 6–23. doi: 10.1086/BBLv229n1p6
Foguesatto, K., Bastos, C. L. Q., Boyle, R. T., Nery, L. E. M., and Souza, M. M. (2019). Participation of Na+/K+-ATPase and aquaporins in the uptake of water during moult processes in the shrimp Palaemon argentinus (Nobili, 1901). J. Comp. Physiol. B 189, 523–535. doi: 10.1007/s00360-019-01232-w
Foguesatto, K., Boyle, R. T., Rovani, M. T., Freire, C. A., and Souza, M. M. (2017). Aquaporin in different moult stages of a freshwater decapod crustacean: expression and participation in muscle hydration control. Comp. Biochem. Phys. A 208, 61–69. doi: 10.1016/j.cbpa.2017.03.003
Fu, D., Libson, A., Miercke, L. J., Weitzman, C., Nollert, P., Krucinski, J., et al. (2000). Structure of a glycerol-conducting channel and the basis for its selectivity. Science 290, 481–486. doi: 10.1126/science.290.5491.481
Gao, B., Sun, D., Lv, J., Ren, X., Liu, P., and Li, J. (2019). Transcriptomic analysis provides insight into the mechanism of salinity adjustment in swimming crab Portunus trituberculatus. Genes Genom. 41, 961–971. doi: 10.1007/s13258-019-00828-4
Gao, Y. (2009). Cloning and Expression of Aquaporin in the Antennal Gland of Crayfish, Procambarus Clarkii. Dayton: Wright State University.
Gao, Y., Hu, C., Ren, C., Qian, J., He, X., Jiang, X., et al. (2017). Molecular cloning of aquaporin-4 (AQP4) gene in the Pacific white shrimp (Litopenaeus vannamei) and the effect of salinity stress on its expression in hepatopancreas. Mar. Sci. 41, 61–70.
Hamdi, M., Sanchez, M. A., Beene, L. C., Liu, Q., Landfear, S. M., Rosen, B. P., et al. (2009). Arsenic transport by zebrafish aquaglyceroporins. BMC Mol. Biol. 10:104. doi: 10.1186/1471-2199-10-104
Hu, D., Pan, L., Zhao, Q., and Ren, Q. (2015). Transcriptomic response to low salinity stress in gills of the Pacific white shrimp, Litopenaeus vannamei. Mar. Genom. 24, 297–304. doi: 10.1016/j.margen.2015.07.003
Ishibashi, K., Morishita, Y., and Tanaka, Y. (2017). The evolutionary aspects of aquaporin family. Adv. Exp. Med. Biol. 969, 35–50. doi: 10.1007/978-94-024-1057-0_2
Ishibashi, K., Tanaka, Y., and Morishita, Y. (2020). “Chapter One - Perspectives on the evolution of aquaporin superfamily” in Vitamins and Hormones. ed. G. Litwack (United States: Academic Press). 1–27. doi: 10.1016/bs.vh.2019.08.001
Ishibashi, K., Tanaka, Y., and Morishita, Y. (2021). The role of mammalian superaquaporins inside the cell: an update. BBA Biomembranes 1863:183617. doi: 10.1016/j.bbamem.2021.183617
Keane, T. M., Creevey, C. J., Pentony, M. M., Naughton, T. J., and McLnerney, J. O. (2006). Assessment of methods for amino acid matrix selection and their use on empirical data shows that ad hoc assumptions for choice of matrix are not justified. BMC Evol. Biol. 6:29. doi: 10.1186/1471-2148-6-29
Kim, D., Langmead, B., and Salzberg, S. L. (2015). HISAT: a fast spliced aligner with low memory requirements. Nat. Methods 12, 357–360. doi: 10.1038/nmeth.3317
Kim, Y. K., Lee, S. Y., Kim, B. S., Kim, D. S., and Nam, Y. K. (2014). Isolation and mRNA expression analysis of aquaporin isoforms in marine medaka Oryzias dancena, a euryhaline teleost. Comp. Biochem. Phys. A 171, 1–8. doi: 10.1016/j.cbpa.2014.01.012
Kumar, S., Stecher, G., Li, M., Knyaz, C., and Tamura, K. (2018). MEGA X: molecular evolutionary genetics analysis across computing platforms. Mol. Biol. Evol. 35, 1547–1549. doi: 10.1093/molbev/msy096
Letunic, I., and Bork, P. (2021). Interactive Tree Of Life (iTOL) v5: an online tool for phylogenetic tree display and annotation. Nucleic. Acids. Res. 49, W293–W296. doi: 10.1093/nar/gkab301
Li, C., Li, N., Dong, T., Fu, Q., Cui, Y., and Li, Y. (2020). Analysis of differential gene expression in Litopenaeus vannamei under high salinity stress. Aquacult. Rep. 18:100423. doi: 10.1016/j.aqrep.2020.100423
Li, C., and Wang, W. (2017). “Molecular Biology of Aquaporins” in Aquaporins. ed. B. Yang (Dordrecht: Springer). 1–34. doi: 10.1007/978-94-024-1057-0_1
Li, E., Wang, S., Li, C., Wang, X., Chen, K., and Chen, L. (2014). Transcriptome sequencing revealed the genes and pathways involved in salinity stress of Chinese mitten crab, Eriocheir sinensis. Physiol. Genomics 46, 177–190. doi: 10.1152/physiolgenomics.00191.2013
Li, Y., Chen, Y., Cui, Y., Shen, M., Wang, R., and Wang, Z. (2022). Transcriptome analysis of Pacific white shrimp (Litopenaeus vannamei) under prolonged high-salinity stress. J. Ocean Univ. China 21, 1–15. doi: 10.1007/s11802-022-4882-9
Lind, U., Järvå, M., Alm Rosenblad, M., Pingitore, P., Karlsson, E., Wrange, A.-L., et al. (2017). Analysis of aquaporins from the euryhaline barnacle Balanus improvisus reveals differential expression in response to changes in salinity. PLoS One 12:e0181192. doi: 10.1371/journal.pone.0181192
Liu, M., Liu, S., Hu, Y., and Pan, L. (2015). Cloning and expression analysis of two carbonic anhydrase genes in white shrimp Litopenaeus vannamei, induced by pH and salinity stresses. Aquaculture 448, 391–400. doi: 10.1016/j.aquaculture.2015.04.038
Liu, W., Xie, Y., Ma, J., Luo, X., Nie, P., Zuo, Z., et al. (2015). IBS: an illustrator for the presentation and visualization of biological sequences. Bioinformatics 31, 3359–3361. doi: 10.1093/bioinformatics/btv362
Livak, K. J., and Schmittgen, T. D. (2001). Analysis of relative gene expression data using real-time quantitative PCR and the 2-ΔΔCT method. Methods 25, 402–408. doi: 10.1006/meth.2001.1262
Love, M. I., Huber, W., and Anders, S. (2014). Moderated estimation of fold change and dispersion for RNA-seq data with DESeq2. Genome Biol. 15, 550. doi: 10.1186/s13059-014-0550-8
Lv, J., Liu, P., Wang, Y., Gao, B., Chen, P., and Li, J. (2013). Transcriptome analysis of Portunus trituberculatus in response to salinity stress provides insights into the molecular basis of osmoregulation. PLoS One 8:e82155. doi: 10.1371/journal.pone.0082155
Madsen, S. S., Engelund, M. B., and Cutler, C. P. (2015). Water transport and functional dynamics of aquaporins in osmoregulatory organs of fishes. Biol. Bull. 229, 70–92. doi: 10.1086/BBLv229n1p70
McGaw, I. J., and Curtis, D. L. (2013). A review of gastric processing in decapod crustaceans. J. Comp. Physiol. B 183, 443–465. doi: 10.1007/s00360-012-0730-3
McNamara, J. C., and Faria, S. C. (2012). Evolution of osmoregulatory patterns and gill ion transport mechanisms in the decapod Crustacea: a review. J. Comp. Physiol. B 182, 997–1014. doi: 10.1007/s00360-012-0665-8
McNamara, J. C., Rosa, J. C., Greene, L. J., and Augusto, A. (2004). Free amino acid pools as effectors of osmostic adjustment in different tissues of the freshwater shrimp Macrobrachium olfersii (Crustacea, Decapoda) during long-term salinity acclimation. Mar. Freshw. Behav. Phy. 37, 193–208. doi: 10.1080/10236240400006208
Meng, J., Zhu, Q., Zhang, L., Li, C., Li, L., She, Z., et al. (2013). Genome and transcriptome analyses provide insight into the euryhaline adaptation mechanism of Crassostrea gigas. PLoS One 8:e58563. doi: 10.1371/journal.pone.0058563
Moshtaghi, A., Rahi, M. L., Mather, P. B., and Hurwood, D. A. (2018). An investigation of gene expression patterns that contribute to osmoregulation in Macrobrachium australiense: assessment of adaptive responses to different osmotic niches. Gene Rep. 13, 76–83. doi: 10.1016/j.genrep.2018.09.002
Murata, K., Mitsuoka, K., Hirai, T., Walz, T., Agre, P., Heymann, J. B., et al. (2000). Structural determinants of water permeation through aquaporin-1. Nature 407, 599–605. doi: 10.1038/35036519
Nong, W., Chai, Z. Y. H., Jiang, X., Qin, J., Ma, K. Y., Chan, K. M., et al. (2020). A crustacean annotated transcriptome (CAT) database. BMC Genomics 21:32. doi: 10.1186/s12864-019-6433-3
Pan, L., Liu, H., and Zhao, Q. (2014). Effect of salinity on the biosynthesis of amines in Litopenaeus vannamei and the expression of gill related ion transporter genes. J. Ocean Univ. China 13, 453–459. doi: 10.1007/s11802-014-2013-y
Pertea, M., Kim, D., Pertea, G. M., Leek, J. T., and Salzberg, S. L. (2016). Transcript-level expression analysis of RNA-seq experiments with HISAT, StringTie and Ballgown. Nat. Protoc. 11, 1650–1667. doi: 10.1038/nprot.2016.095
Pertea, M., Pertea, G. M., Antonescu, C. M., Chang, T.-C., Mendell, J. T., and Salzberg, S. L. (2015). StringTie enables improved reconstruction of a transcriptome from RNA-seq reads. Nat. Biotechnol. 33, 290–295. doi: 10.1038/nbt.3122
Pettersen, E. F., Goddard, T. D., Huang, C. C., Couch, G. S., Greenblatt, D. M., Meng, E. C., et al. (2004). UCSF Chimera—A visualization system for exploratory research and analysis. J. Comput. Chem. 25, 1605–1612. doi: 10.1002/jcc.20084
Shen, M., Cui, Y., Wang, R., Dong, T., Ye, H., Wang, S., et al. (2020). Acute response of Pacific white shrimp Litopenaeus vannamei to high-salinity reductions in osmosis-, metabolism-, and immune-related enzyme activities. Aquacult. Int. 28, 31–39. doi: 10.1007/s10499-019-00441-y
Shen, Y., Li, H., Zhao, J., Tang, S., Zhao, Y., Gu, Y., et al. (2021). Genomic and expression characterization of aquaporin genes from Siniperca chuatsi. Comp. Biochem. Phys. D 38:100819. doi: 10.1016/j.cbd.2021.100819
Staniscuaski, F., Paluzzi, J.-P., Real-Guerra, R., Carlini, C. R., and Orchard, I. (2013). Expression analysis and molecular characterization of aquaporins in Rhodnius prolixus. J. Insect Physiol. 59, 1140–1150. doi: 10.1016/j.jinsphys.2013.08.013
Stavang, J. A., Chauvigné, F., Kongshaug, H., Cerdà, J., Nilsen, F., and Finn, R. N. (2015). Phylogenomic and functional analyses of salmon lice aquaporins uncover the molecular diversity of the superfamily in Arthropoda. BMC Genomics 16:618. doi: 10.1186/s12864-015-1814-8
Sui, H., Han, B.-G., Lee, J. K., Walian, P., and Jap, B. K. (2001). Structural basis of water-specific transport through the AQP1 water channel. Nature 414, 872–878. doi: 10.1038/414872a
Thabet, R., Ayadi, H., Koken, M., and Leignel, V. (2017). Homeostatic responses of crustaceans to salinity changes. Hydrobiologia 799, 1–20. doi: 10.1007/s10750-017-3232-1
Tingaud-Sequeira, A., Calusinska, M., Finn, R. N., Chauvigné, F., Lozano, J., and Cerdà, J. (2010). The zebrafish genome encodes the largest vertebrate repertoire of functional aquaporins with dual paralogy and substrate specificities similar to mammals. BMC Evol. Biol. 10:38. doi: 10.1186/1471-2148-10-38
Tsujimoto, H., Liu, K., Linser, P. J., Agre, P., and Rasgon, J. L. (2013). Organ-specific splice variants of aquaporin water channel AgAQP1 in the malaria vector Anopheles gambiae. PLoS One 8:e75888. doi: 10.1371/journal.pone.0075888
Vandesompele, J., De Preter, K., Pattyn, F., Poppe, B., Van Roy, N., De Paepe, A., et al. (2002). Accurate normalization of real-time quantitative RT-PCR data by geometric averaging of multiple internal control genes. Genome Biol. 3:research0034.1. doi: 10.1186/gb-2002-3-7-research0034
Wang, X., Wang, S., Li, C., Chen, K., Qin, J. G., Chen, L., et al. (2015). Molecular pathway and gene responses of the Pacific white shrimp Litopenaeus vannamei to acute low salinity stress. J. Shellfish Res. 34, 1037–1048. doi: 10.2983/035.034.0330
Wang, Y., Li, E., Yu, N., Wang, X., Cai, C., Tang, B., et al. (2012). Characterization and expression of glutamate dehydrogenase in response to acute salinity stress in the Chinese mitten crab. Eriocheir sinensis. PLoS One 7:e37316. doi: 10.1371/journal.pone.0037316
Waterhouse, A. M., Procter, J. B., Martin, D. M. A., Clamp, M., and Barton, G. J. (2009). Jalview Version 2–a multiple sequence alignment editor and analysis workbench. Bioinformatics 25, 1189–1191. doi: 10.1093/bioinformatics/btp033
Xu, C., Li, E., Liu, Y., Wang, X., Qin, J. G., and Chen, L. (2017). Comparative proteome analysis of the hepatopancreas from the Pacific white shrimp Litopenaeus vannamei under long-term low salinity stress. J. Proteomics 162, 1–10. doi: 10.1016/j.jprot.2017.04.013
Yu, G., Wang, L.-G., Han, Y., and He, Q.-Y. (2012). clusterProfiler: an R package for comparing biological themes among gene clusters. OMICS 16, 284–287. doi: 10.1089/omi.2011.0118
Yuan, J., Zhang, X., Wang, M., Sun, Y., Liu, C., Li, S., et al. (2021). Simple sequence repeats drive genome plasticity and promote adaptive evolution in penaeid shrimp. Commun. Biol. 4:186. doi: 10.1038/s42003-021-01716-y
Keywords: aquaporin, aquaglyceroporin, salinity, osmoregulation, shrimp
Citation: Wang Z, Chen Y, Wang C, Zhao N, Zhang Z, Deng Z, Cui Y, Wang R and Li Y (2022) Aquaporins in Pacific White Shrimp (Litopenaeus vannamei): Molecular Characterization, Expression Patterns, and Transcriptome Analysis in Response to Salinity Stress. Front. Mar. Sci. 9:817868. doi: 10.3389/fmars.2022.817868
Received: 18 November 2021; Accepted: 24 January 2022;
Published: 11 February 2022.
Edited by:
Yangfang Ye, Ningbo University, ChinaReviewed by:
Mengqiang Wang, Ocean University of China, ChinaCopyright © 2022 Wang, Chen, Wang, Zhao, Zhang, Deng, Cui, Wang and Li. This is an open-access article distributed under the terms of the Creative Commons Attribution License (CC BY). The use, distribution or reproduction in other forums is permitted, provided the original author(s) and the copyright owner(s) are credited and that the original publication in this journal is cited, in accordance with accepted academic practice. No use, distribution or reproduction is permitted which does not comply with these terms.
*Correspondence: Zhongkai Wang, emt3YW5nQHFhdS5lZHUuY24=; Yuquan Li, amlhbmdmYW5ncWlhbkAxNjMuY29t
Disclaimer: All claims expressed in this article are solely those of the authors and do not necessarily represent those of their affiliated organizations, or those of the publisher, the editors and the reviewers. Any product that may be evaluated in this article or claim that may be made by its manufacturer is not guaranteed or endorsed by the publisher.
Research integrity at Frontiers
Learn more about the work of our research integrity team to safeguard the quality of each article we publish.