 Ginger A. Rebstock
 Pablo García Borboroglu
 P. Dee Boersma
- 1Center for Ecosystem Sentinels, Department of Biology, University of Washington, Seattle, WA, United States
- 2Global Penguin Society, Puerto Madryn, Argentina
- 3Centro Para el Estudio de Sistemas Marinos (CESIMAR), Centro Científico Tecnológico (CCT)— El Centro Nacional Patagónico (CENPAT)—Consejo Nacional de Investigaciones Científicas y Técnicas (CONICET), Puerto Madryn, Argentina
- 4Wildlife Conservation Society, Bronx, NY, United States
Most seabirds forage far from land, making them hard to observe when foraging. Satellite tracking of seabirds shows where they come into conflict with human uses of the ocean, and whether they use protected areas. Because tracking data are expensive, data from one colony and/or year are sometimes used to design marine protection for a species across its range. Two assumptions commonly made are that foraging distance increases with colony size and individuals are uniformly distributed around colonies. We tested these assumptions using Magellanic penguins Spheniscus magellanicus as an example. We used a large tracking dataset of 338 penguins foraging for chicks at 10 colonies in Argentina from 1996 to 2019. Foraging distance increased with population size among colonies, but predicted distances would not cover foraging areas for all colonies. There was no relationship between population size and foraging distance within colony among years for colonies with ten and 23 years of data. Penguins were not uniformly distributed around colonies. Penguins used ~24% (12-40%) of the ocean available within the colony’s maximum foraging distance. We also show that overlap between penguin foraging areas and marine protected areas (MPA) and hydrocarbon concessions varied among colonies partly because of variation in how far offshore penguins forage. Overlap with MPAs was low (0% – 20%) for seven of the ten colonies and high (23% – 100%) for the other three. Overlap with a large area permitted for hydrocarbon exploration (seismic surveys) was relatively high (23% – 81%) for seven colonies where penguins forage offshore. Data from one colony are unlikely to indicate the most effective marine spatial planning for all colonies. Our data show that to be effective, marine planning should consider the temporal and spatial dynamics of ocean conditions and the response of marine wildlife to these changes. Climate variability is predicted to increase, making knowledge of foraging-location variation among colonies and years critical to conservation planning.
Introduction
Penguins are important components of marine food webs in the Southern Hemisphere (Brooke 2004), and economically important as a basis for wildlife tourism (Lewis et al., 2013; Raya Rey et al., 2017; Wagner et al., 2020). Penguins are also among the most threatened groups of species (Trathan et al., 2014; Ropert-Coudert et al., 2019). Nine of eighteen species of penguins are vulnerable or endangered (IUCN, 2021), facing a variety of threats at sea, especially pollution, prey depletion by overfishing, bycatch in fishing gear, and climate change (Trathan et al., 2014; Dias et al., 2019). Effective conservation requires protection of penguins and their prey at sea, requiring knowledge of their seasonal use of areas and habitats.
Most penguin species breed in multiple, widely distributed colonies. Colony size varies over orders of magnitude within species (García Borboroglu and Boersma, 2013). Some species breed over wide ranges of latitude, and some occur in more than one ocean basin. Oceanographic conditions and prey fields vary among colony foraging areas (Lescroël and Bost, 2005; Boersma et al., 2009; Ratcliffe and Trathan, 2011; Santora et al., 2020), and foraging distance often varies among colonies of the same species (Boersma et al., 2009; Santora et al., 2020). Spatial use of the ocean by penguins also varies among seasons and years (Boersma and Rebstock, 2009; Bost et al., 2015; Horswill et al., 2017).
Identification of priority areas for protection of penguins requires data on the locations or habitats they use at sea. Data on overlap between foraging areas and the locations of threats, as well as existing and proposed marine protected areas (MPAs), are pressing needs for conservation of penguins (Critchley et al., 2018; Baylis et al., 2021; Yorio et al., 2021). Tracking data and at-sea surveys are the two typical sources of at-sea distribution data, but many species have not been tracked at all colonies or in all regions. These data are expensive and logistically challenging to obtain.
When data do not exist for colonies, space use is often modeled using tracking data from other colonies (Soanes et al., 2016). Models range from simply using the maximum foraging distance for one colony, to complex models including population size of each colony and habitat preferences (Grecian et al., 2012; Handley et al., 2020). The ‘Foraging Radius Approach’ (Soanes et al., 2016) is frequently used when tracking and survey data are not available (Grecian et al., 2012; Handley et al., 2020). In this method, circles or arcs are drawn around colonies with no at-sea data using a foraging distance from available data for the species. Soanes et al. (2016) recommend using the mean maximum distance (mean of the maximum distance for each individual). Population size of colonies and habitat preferences can be included, when known (Soanes et al., 2016).
A common assumption of the models is that foraging distance increases with population size (Grecian et al., 2012; Soanes et al., 2016). Colonial central-place foragers, including most seabirds, may deplete prey near the colony, with larger populations depleting prey more than smaller populations. This forces individuals from larger colonies to forage farther from breeding sites than those from smaller colonies (Ashmole, 1963; Lewis et al., 2001; Weber et al., 2021).
A second common assumption is that foraging individuals spread out uniformly around the colony (Grecian et al., 2012; Soanes et al., 2016), as it is assumed that this behavior reduces competition for prey (Bolton et al., 2018). Individuals from each colony should forage closer to their colony than to other colonies, resulting in no overlap among colony foraging areas (Cairns, 1989). Birds from smaller colonies may avoid the foraging areas of larger colonies, modifying the uniform distribution (Bolton et al., 2018). A uniform distribution is the null hypothesis, and may be the only reasonable hypothesis in the absence of knowledge of foraging areas and foraging habitats.
Variation in foraging distances among families, species, and colonies of seabirds makes spatial scales of MPAs an important consideration (Oppel et al., 2018). Variation among colonies also makes predicting interactions between foraging seabirds and spatially explicit threats at sea difficult (Bolton et al., 2018). In addition, including data on threats and resources along with tracking data makes tracking studies more useful for conservation (Hays et al., 2019).
The goals of the study were to 1) test the two common assumptions of the Foraging Radius Approach, colony-size-dependent foraging distance and uniform distribution, and 2) determine how variation in foraging behavior among colonies affects penguins’ overlap with MPAs and threats at sea. Our goal was to show the effects of variation in foraging behavior among colonies, not to determine optimal boundaries for marine protection. We used a large dataset for Magellanic Penguins Spheniscus magellanicus tracked at ten colonies in Argentina to test the assumptions, and used hydrocarbon industry concessions as an example of a spatially explicit threat.
Specifically, we tested whether colony size predicted foraging distance among colonies and whether interannual variation in colony size predicted interannual variation in foraging distance within colonies. We tested three predictions of the uniform-distribution assumption. First, a histogram of bearings to foraging locations (trip endpoints) should be uniformly distributed. Second, penguin locations should occupy most of the area within the foraging range for each colony. Third, if penguins deplete prey around large colonies more than around small colonies, penguins from large colonies should spread out more (increase the range of bearings) than penguins from small colonies, resulting in a positive relationship between colony size and the percentage of available foraging area that penguins used. Alternatively, if penguins from large colonies swim farther, but do not spread out more than penguins from small colonies, there should be no relationship between colony size and the percentage of available foraging area used. Finally, to help policy makers and stakeholders understand the effects of variation in foraging behavior among colonies, we compared penguins’ spatial use of the continental shelf of Argentina with the locations of MPAs and hydrocarbon industry concessions and seismic survey areas.
Materials and Methods
Magellanic penguins breed in colonies along the coasts of Argentina and Chile, and dispersed along the coasts of the Falkland/Malvinas Islands. The Atlantic population winters at sea off northern Argentina, Uruguay, and southern Brazil (Boersma et al., 2013). They lay two eggs in October or November, which hatch in November or December. Chicks are brooded for about a month and fledge in January or February (Boersma et al., 2013). Magellanic penguins are offshore foragers (Croxall and Davis, 1999; García Borboroglu and Boersma, 2013), especially during incubation and the post-brood stage of breeding (Boersma and Rebstock, 2009). Their primary prey is small pelagic fish, especially anchovy Engraulis anchoita in northern colonies in Argentina and sprat Sprattus fuegensis farther south. They also eat juvenile hake Merluccius hubbsi, squid, and crustaceans (Wilson et al., 2005; Boersma et al., 2013).
Tracking Data
We tracked Magellanic penguins at ten colonies, spread along 1240 km of coastline, most of their latitudinal range in Argentina, between 1996 and 2019 (Table 1; Figure 1). We used data for penguins rearing chicks > 30 days of age (post-brood), when they forage at intermediate distances from the colony compared to incubation and when chicks are younger (Boersma and Rebstock, 2009). We tracked one member of each pair except in 2019 at Punta Tombo, when we tracked mated pairs. Most (92%) of tracked penguins were males. We combined the data for males and females as their foraging distances were similar during the breeding season (Boersma and Rebstock, 2009; Blanco et al., 2022). We left tags on for multiple trips by each penguin. We tracked two penguins in more than one breeding season at El Pedral, five at Cabo Dos Bahías, and 40 at Punta Tombo. We used three models of Argos satellite transmitters (PTTs) and three models of GPS archival tags (Table S1). Tag type did not affect foraging-trip duration or distance (Boersma et al., 2009).
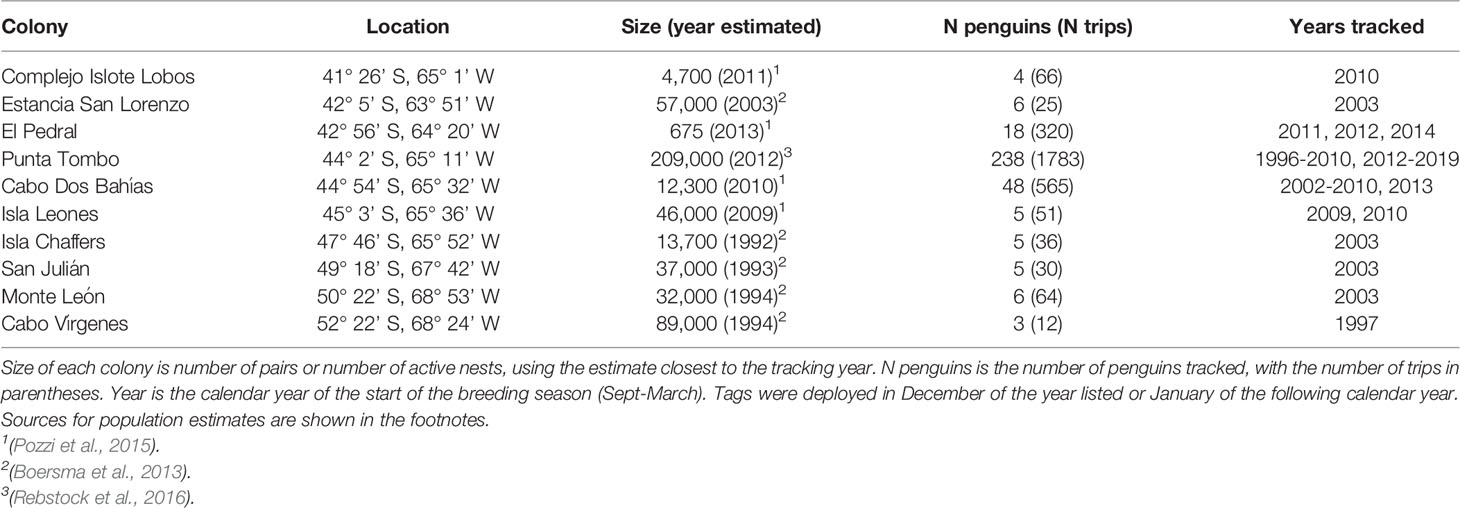
Table 1 Colony and tracking details for Magellanic penguins at 10 colonies in Argentina.
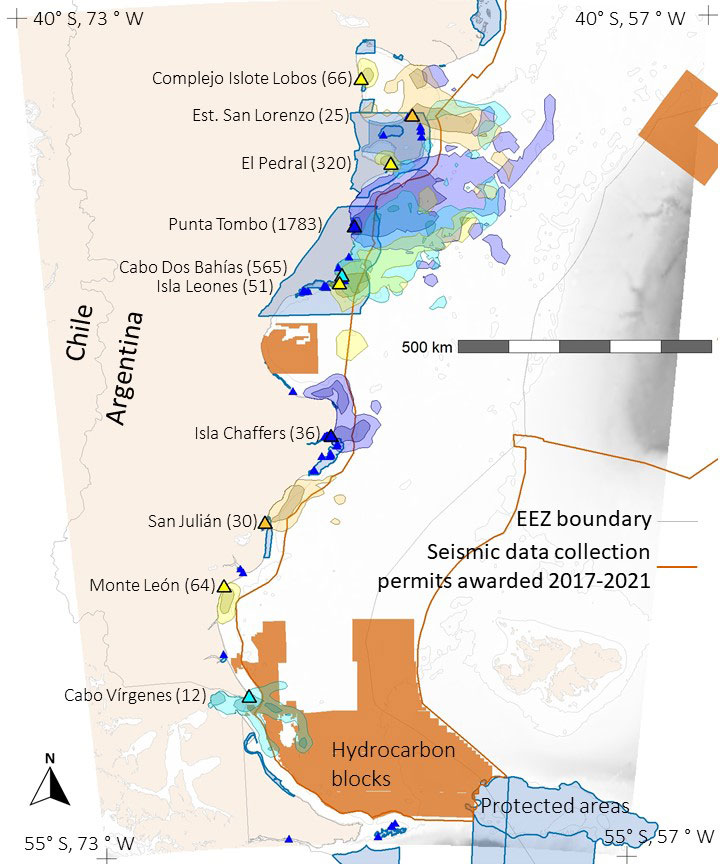
Figure 1 Foraging areas (colored polygons) of Magellanic penguins breeding at 10 colonies in Argentina. Dark colors represent 50% UD kernel contours, light colors 90% UD kernel contours. Blue areas show marine protected areas and orange areas show hydrocarbon concessions. Large triangles mark colonies with tracking data; color matches color of foraging area polygons. Number of foraging trips are in parentheses following colony names. Small dark blue triangles mark penguin colonies where we did not have tracking data. The tan color is land. Shades of gray indicate ocean depth, with white indicating the continental shelf (< 120 m). The thin gray line marks boundaries of Argentina’s exclusive economic zone (EEZ). The orange line encloses the area where Argentina awarded seismic-data collection permits in 2017-2021.
We smoothed the tracking data and estimated locations every 30 minutes using the state-space model crawl (Johnson et al., 2008) (Table S1). We chose 30 minutes as a compromise between location intervals for GPS tags (23 ± 94 minutes, mean ± SD) and Argos satellite transmitters (62 ± 151 minutes). Foraging trips averaged 2 ± 2 days, giving us 96 locations per trip on average. Prior to running the models, we removed duplicate locations, locations on land more than 5 km from the colony, and locations that represented a large movement away from the track line followed by an immediate return. We retained locations on land near the colony as they helped the model predict a location at the colony, which we used to define a trip. We added sightings of the tracked individual in the colony or on the beach for the same reason, and set the error estimates to the lowest values for each tag type, so the model would treat the locations as highly accurate.
We defined a trip as at least eight consecutive locations away from the colony, with at least one location at the colony before and after the trip. Eight locations was the minimum needed for a track in the shape of a trip (2-3 locations in each part of the trip, outbound, foraging, and inbound). Additionally, fewer locations likely represented trips to the beach for bathing. For each trip, we defined trip distance as the straight-line distance between the colony and the location farthest from the colony. For each colony and breeding season, we calculated the mean trip distance (mean distance of all trips of all penguins), the mean maximum distance (the mean of the longest trip distance for each penguin), and the maximum distance (the distance of the longest trip for any penguin). We calculated the bearing to each penguin location as the angle between the colony and the location, where north = 0°.
We have published some of the tracking data (Boersma and Rebstock, 2009; Boersma et al., 2009; Rebstock et al., 2022). We present some unpublished data and new analyses in this paper.
Kernel Analysis
We projected the tracking data using the Lambert Azimuthal Equal-Area projection prior to conducting a kernel analysis (Baylis et al., 2021). We calculated the 50% and 90% UD kernel areas from penguin locations at sea (at least 5 km from the nest) using the adehabitatHR package in R. We calculated one kernel for each breeding season for each colony, and combined (st_union, sf R package) the kernel contours for each colony where we tracked penguins in more than one year. The 50% UD kernel area represents the core area that penguins swim through and forage in (Soanes et al., 2013). The 90% UD kernel area represents most of the area penguins use. We chose a percentage less than 100 so that the total area would not be influenced by a few penguins that made abnormally long trips. We compared the kernel polygons to coastline polygons and removed land area using the sf package. We downloaded coastlines as country shapefiles from www.diva-gis.org/gdata.
Kernel polygon sizes depend on the smoothing parameter (h) selected (Kie, 2013). Dias et al. (2018) recommended setting h = 7 for penguin tracking data. We compared kernel polygons created with ad-hoc h and with h = 7, and selected h = 7 (Appendix 1; Table S2; Figure S1).
Colony Population Estimates
For all colonies except Punta Tombo and Cabo Dos Bahías, we used the population estimates in Pozzi et al. (2015) or Boersma et al. (2013) (Table 1). We used the estimate closest to the tracking year if multiple estimates were available (e.g., Estancia San Lorenzo). We tracked penguins in 2009 and 2010 at Isla Leones, but only had a population estimate from 2009 (Pozzi et al., 2015). We tracked penguins in 2011, 2012, and 2014 at El Pedral, and had population estimates for 2011, 2012, and 2013 (Pozzi et al., 2015). El Pedral grew exponentially from 2009 through 2013 (Pozzi et al., 2015), and was presumably larger in 2014. Foraging distance did not increase over the three years of tracking (see Results), so we selected the 2013 estimate to represent the population.
We tracked penguins at Punta Tombo for 23 years and at Cabo Dos Bahías for 10 years. We conducted population surveys at Punta Tombo (Rebstock et al., 2016) from 1987 through 2019 and at Cabo Dos Bahías from 1992 through 2019, estimating nest density in 100-m2 circles around 22 fixed locations 100 m apart at Punta Tombo and 24 fixed locations 33 m apart at Cabo Dos Bahías. To convert from nest density to a population estimate at Punta Tombo for each year that we tracked penguins, we used the population estimate from a stratified-random survey in 2012 (Rebstock et al., 2016). We divided the 2012 population estimate by the nest density from our 22-circle survey in 2012. We multiplied the result by the nest density from each year’s 22-circle survey to obtain a population estimate for each year, rounding to the nearest 50. Similarly, for Cabo Dos Bahías, we used our nest density estimates and the population estimate for 2010 from Pozzi et al. (2015).
Testing Assumptions of Foraging Distance and Uniform Distribution
To compare foraging distance and population size among colonies, we used each colony once. We tracked penguins at six colonies in only a single year. Therefore, for this analysis, we used one population estimate and one foraging distance for each colony. If we tracked penguins in more than one year at a colony, we combined all trips for all years at that colony to calculate the mean, mean maximum, and maximum distances. We used ordinary least squares (OLS) regression with log-transformed foraging distance as the response and log-transformed population size as the predictor (n = 10 colonies), and found predicted foraging distances and 95% confidence intervals for each colony. We back-transformed the predicted distances and 95% confidence intervals to express them in kilometers. We report the results for the mean maximum distance for each year. Conclusions were the same using mean distance and maximum distance.
For Punta Tombo and Cabo Dos Bahías, we estimated population size for each year of tracking, as described above. We regressed (OLS) log-transformed foraging distance on log-transformed population size (n = 23 years for Punta Tombo and 10 years for Cabo Dos Bahías).
We used the 90% UD polygons to determine if colony foraging areas overlapped (Cairns, 1989; Bolton et al., 2018). We did not quantify the overlap, but determined its presence visually (Figure 1). We also determined visually whether penguins always foraged closer to their own colonies than to other colonies, as predicted by the hinterland model (Cairns, 1989).
We tested for uniform distributions of penguin locations around colonies using the G-test (log-likelihood ratio test) on a histogram of the bearings to the endpoints of trips for each colony. The G-test is more reliable than χ2 when some cells contain small or zero counts. Most colonies had gaps in bearings because land to the west prevents foraging, and histograms were bimodal. To eliminate the bimodal distributions, we subtracted 360 from bearings between 200 and 360, essentially shifting the axes so that the gap fell beyond the tails rather than in the center of the distribution. We estimated the range of bearings available for foraging around each colony as the range of bearings covered by water at the maximum foraging distance from the colony. To make the histograms, we used the range of foraging bearings available at each colony (excluding bearings to land) and a bin width of 15°. The G-test compares the distribution of counts in each bin with the expected count under a uniform distribution (the same count in each bin). We used the same number of trips for each penguin at a colony (the minimum number of trips for any penguin at the colony; Table 2), to prevent a penguin with more trips than others from influencing the outcome. At San Julián, we excluded one penguin with one trip and used the first five trips for the remaining four penguins. We did not have enough trips at Cabo Vírgenes to test the distribution (three penguins with one, three, and eight trips).
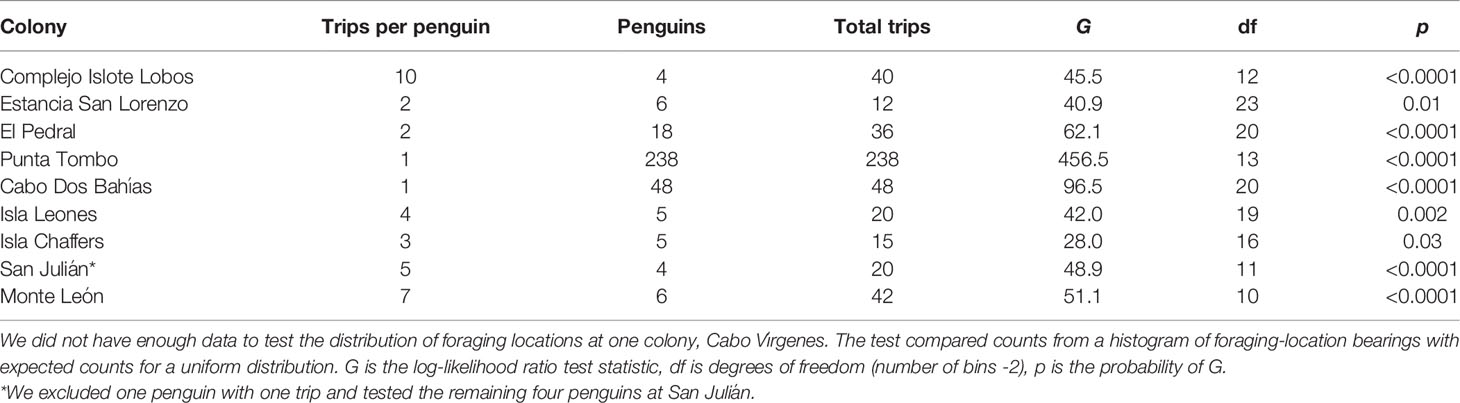
Table 2 Foraging locations of Magellanic penguins breeding at 9 colonies in Argentina were not uniformly distributed around colonies.
In addition, we estimated the available foraging area for each colony as the area covered by ocean with a radius around each colony equal to the maximum foraging distance by any penguin from that colony. We used the maximum rather than the mean maximum to define the available area because many penguins foraged beyond the mean maximum distance (37.8% of penguins at Punta Tombo and 43.8% of penguins at Cabo Dos Bahías), and UD kernel polygons extended beyond the mean maximum distance for some colonies. We estimated the area used by penguins from each colony as the area enclosed within the 90% UD kernel polygons. We compared the area used by penguins from each colony with the available area for that colony. To test whether penguins from larger colonies fanned out more than penguins from smaller colonies, we regressed (OLS) the percentage of area used on log-transformed colony size. We expected a positive relationship if penguins spread out more around larger colonies than around smaller colonies. We also considered no relationship to be likely because the area of a circle or arc increases with distance from the colony but the percentage of a circle covered by an arc of a given range of angles is constant for circles of any radius.
Overlap With Marine Protected Areas and Hydrocarbon Concessions
We downloaded marine protected area polygons from protectedplanet.net (UNEP-WCMC and IUCN) and projected them to match the tracking data. We calculated the percentage of the 50% and 90% UD kernel polygons that are within one or more MPAs for each colony.
Argentina is currently offering tax incentives and 30-year concessions for developing its offshore oil and gas basins (Nievas El Makte et al., 2021). We obtained shapefiles for the Argentine hydrocarbon concessions and permit areas from the Secretaría de Energía of Argentina (see https://sig.se.gob.ar/visor/visorsig.php?t=4 for data visualization), and projected them to match the tracking data. Permits were awarded for seismic data collection over most of the continental shelf of Argentina and beyond in 2017-2021. We calculated the percentage of the 50% and 90% UD kernel polygons that overlap this area for each colony. Penguins from one colony, Cabo Vírgenes, used areas within other concessions, including areas with current extraction activities. We calculated the percentage of the 50% and 90% UD kernel polygons for Cabo Vírgenes that are within these concessions.
Statistics and GIS Analyses
For the maps, we downloaded exclusive economic zone (EEZ) polygons from MarineRegions.org (Flanders Marine Institute, 2021) and bathymetric data from the U.S. National Oceanic and Atmospheric Administration’s ETOPO1 database (Amante and Eakins, 2009; NOAA National Geophysical Data Center, 2009). We made all maps and conducted GIS analyses in R 3.6.3 (R Development Core Team, 2020). We ran statistical tests in Stata/IC 11.2 (StataCorp LP, College Station, TX) or R. We wrote custom queries in Microsoft SQL Server Management Studio for all filters and pre-model processing and ran the crawl state-space models in R.
Results
Assumption That Colony Size Predicts Foraging Distance
Foraging distance was positively related to colony size (Table 3; Figure 2 Top; F1,8 = 22.4, p = 0.002, R2 = 0.70, n = 10). Confidence intervals were large relative to foraging distances, however. Predicted mean maximum foraging distance differed from measured distance by 11%-72% (Figure 2 Top). Predicted mean foraging distance differed from measured distance by up to 43% and predicted maximum foraging distance differed from measured distance by as much as 100% (not shown). The spread between upper and lower 95% confidence intervals around predicted foraging distances ranged from 40 km to 175 km. The smallest colony had a predicted foraging distance of 30 km with confidence intervals of 17 km and 56 km. The largest colony had a predicted foraging distance of 198 km with confidence intervals of 128 km and 305 km.
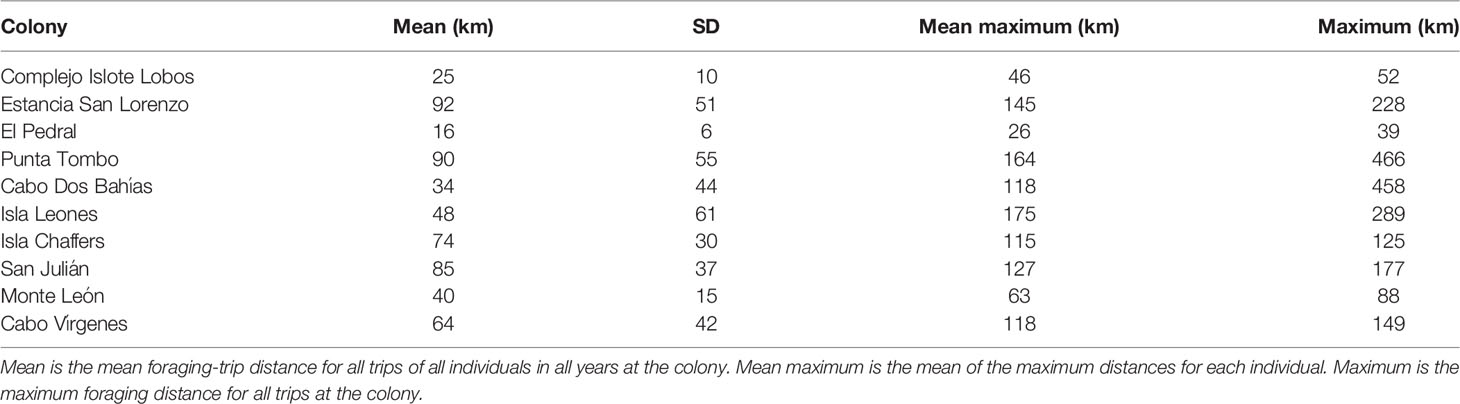
Table 3 Foraging distances for Magellanic penguins breeding at 10 colonies in Argentina.
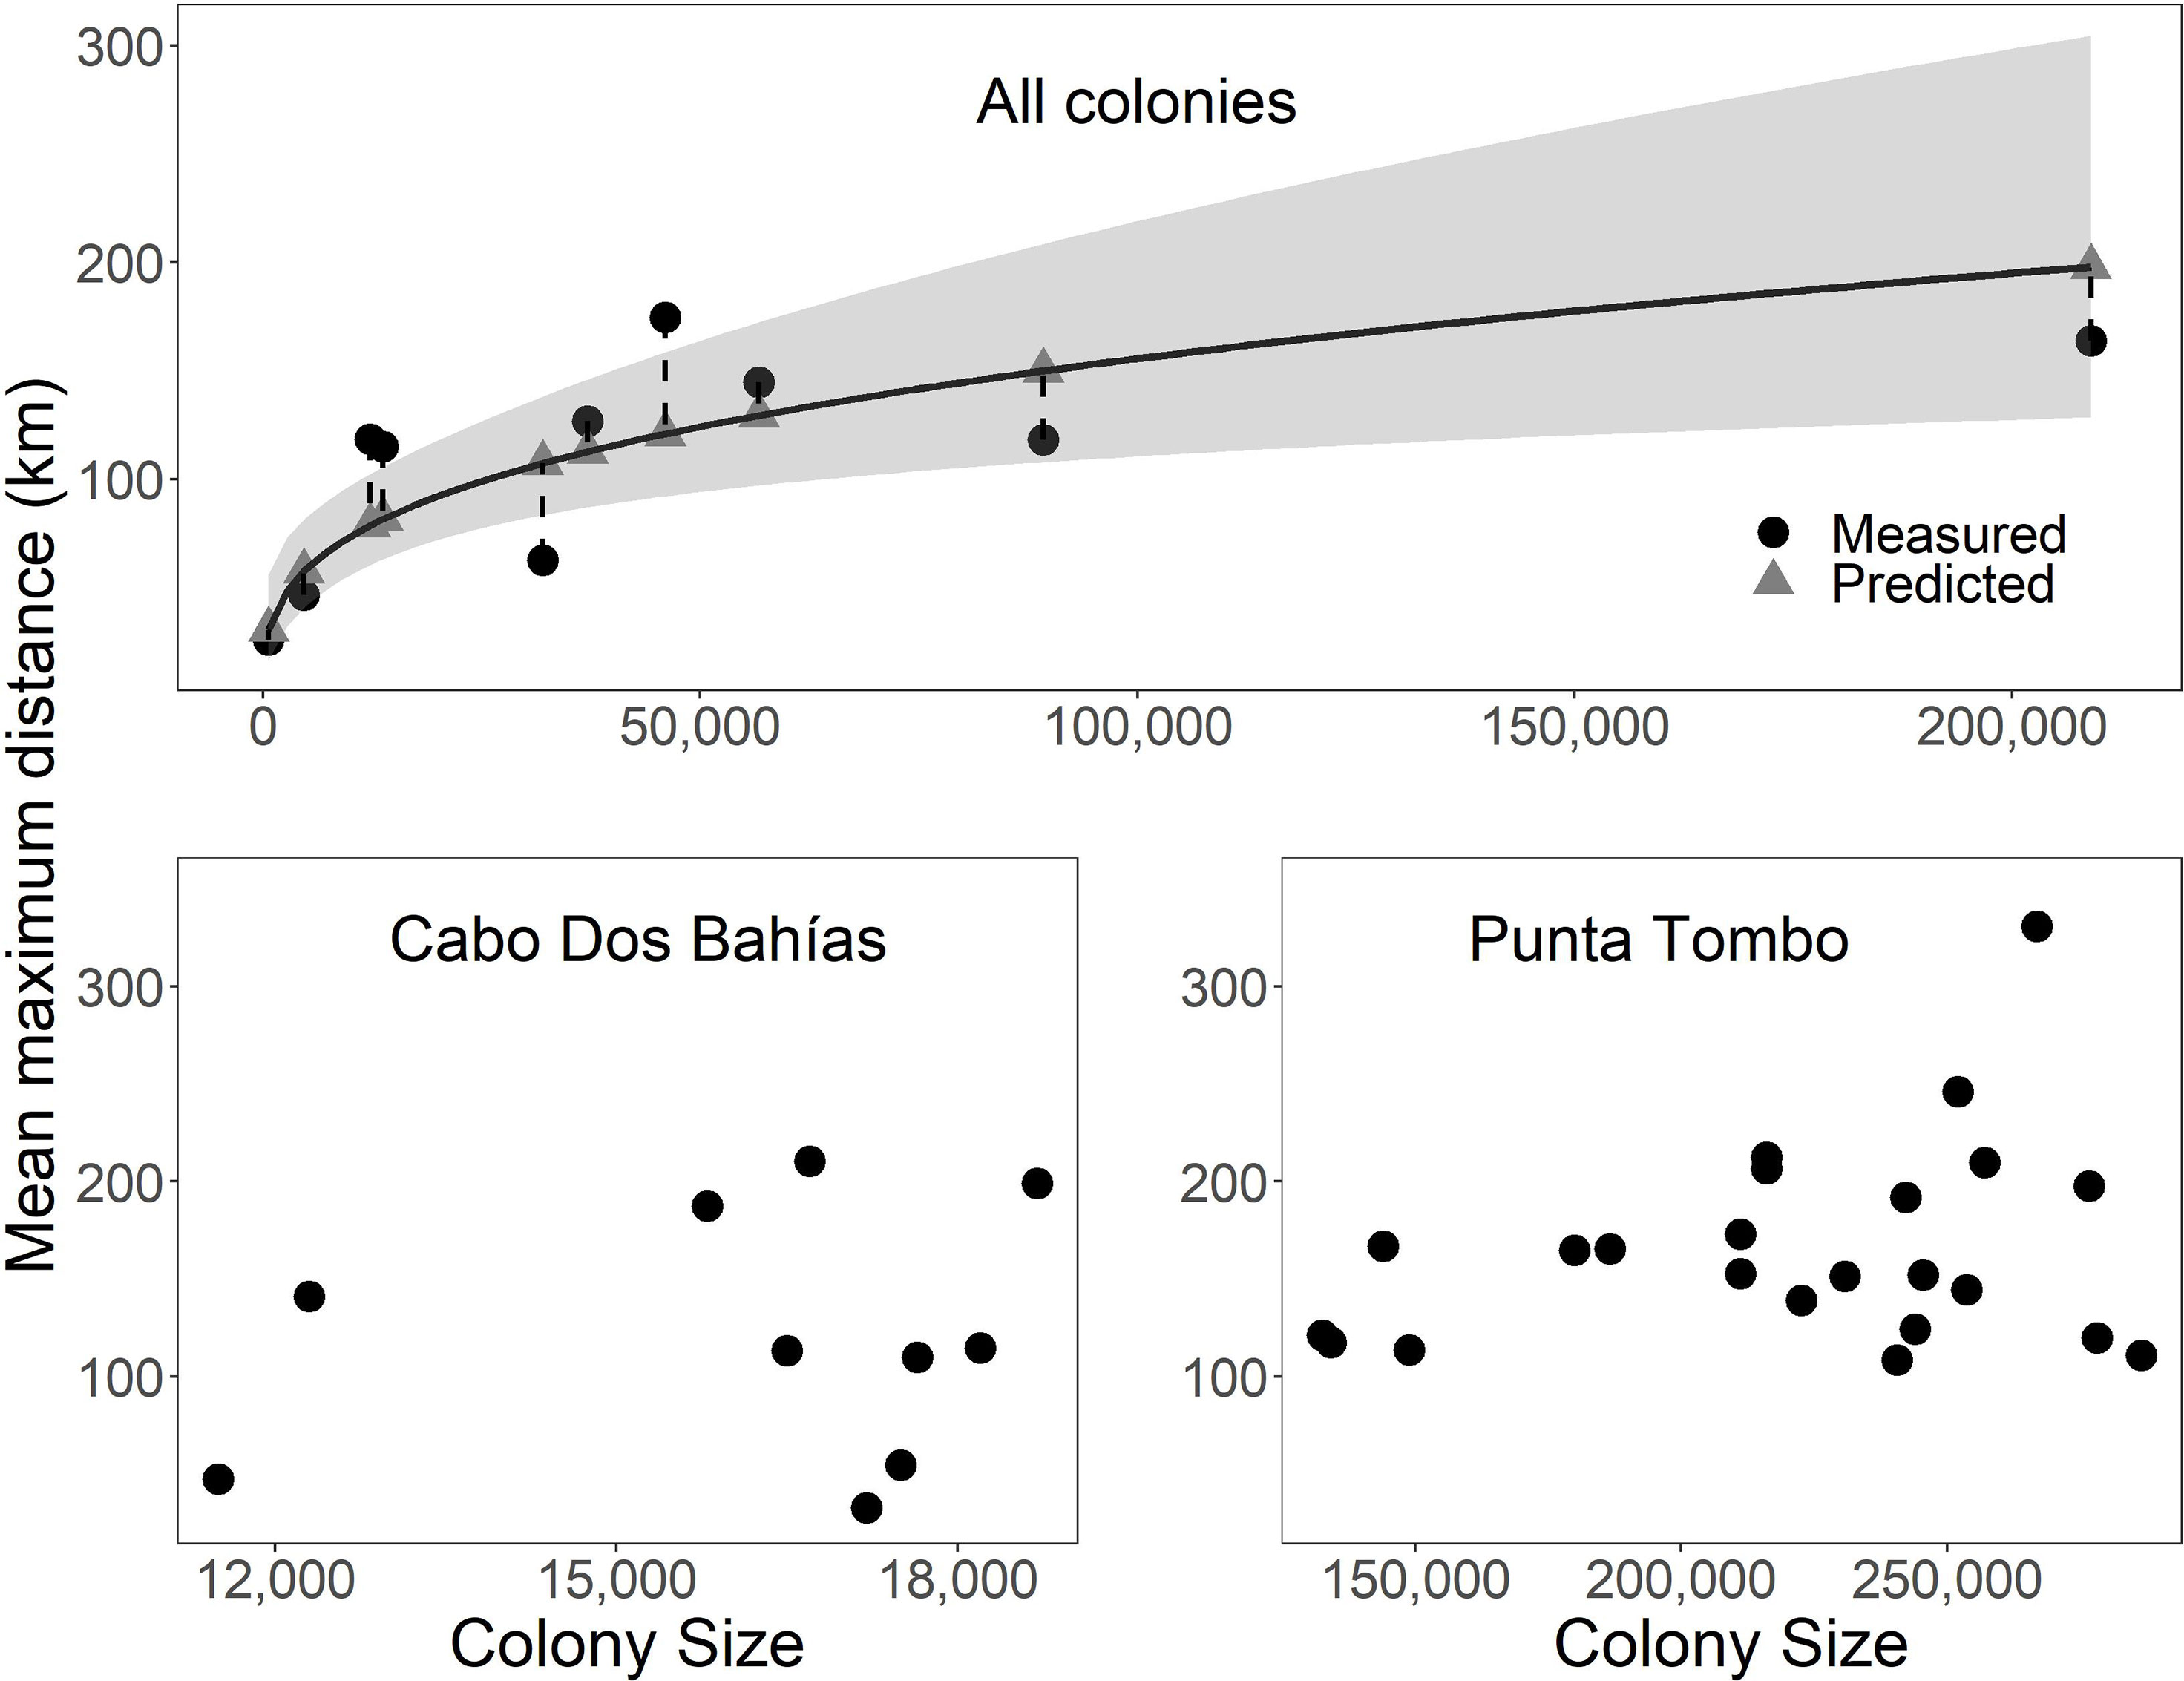
Figure 2 The relationship between colony size (pairs or active nests) and foraging distance in Magellanic penguins at 10 breeding colonies in Argentina was significant (curved solid line, p = 0.002, R2 = 0.70), but not predictive for several colonies (vertical dashed lines connect predicted and measured distances; gray ribbon represents 95% confidence intervals) (Top). Colony size was not significantly related to foraging distance within colony among years for Cabo Dos Bahías (p = 0.60, R2 < 0.01; Bottom left) or Punta Tombo (p = 0.39, R2 < 0.01; Bottom right). Mean maximum distance is the mean of the maximum distances for each individual.
Contrary to the assumptions that each colony has a distinct foraging area, and birds forage closer to their own colony than to other colonies, we found overlap among colonies. Foraging areas for penguins from four colonies, Estancia San Lorenzo, Punta Tombo, Cabo Dos Bahías, and Isla Leones overlapped (Figure 1). Penguins from smaller colonies (e.g., Cabo Dos Bahías) did not always avoid foraging areas of larger colonies (e.g., Punta Tombo). Among these four colonies, penguins from colonies farther south often foraged closer to colonies farther north than to their own colonies.
Within colonies among years, there were no significant relationships between foraging distance and population size. The population at Cabo Dos Bahías ranged from 11,500 active nests in 2013 to 18,700 in 2002 (Figure 2 Bottom left; F1,8 = 0.3, p = 0.60, R2 < 0.01, n = 10). Mean maximum foraging distance ranged from 33 km in 2009 to 210 km in 2003. The population at Punta Tombo ranged from 132,600 active nests in 2016 to 286,400 in 2012 (Figure 2 Bottom right; F1,21 = 0.8, p = 0.39, R2 < 0.01, n = 23). Mean maximum foraging distance ranged from 109 km in 2015 to 331 km in 1997. We had too few years (n = 3) to test interannual variation at El Pedral, but mean maximum foraging distance was least in 2014 when the colony size was largest (Table 4).
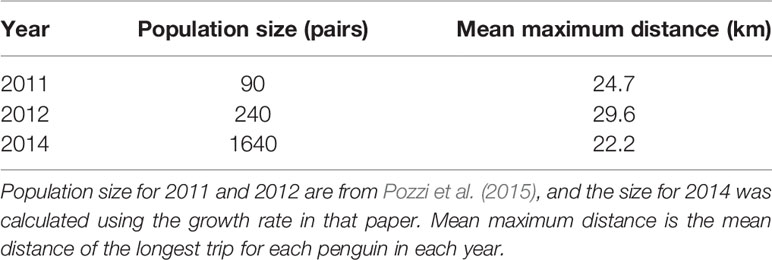
Table 4 Foraging distance of Magellanic penguins tracked at El Pedral, Argentina, did not increase monotonically with an exponentially growing population.
Assumption of Uniform Distributions
Penguin foraging areas (trip endpoints) at sea were not uniformly distributed around colonies (Table 2; Figure S2; p ≤ 0.03). Penguins used a quarter of the available ocean area around their colonies, on average, based on 90% kernel UD contours (23.9 ± 10.1%, Table 5; Figure 1). The maximum amount of available area used was 39.6%, at Complejo Islote Lobos. In colonies with limited tracking data, these numbers may be underestimates, but at Punta Tombo, with 23 years of data and almost 1800 trips, the penguins used only 15.6% of the area at sea where they could forage.
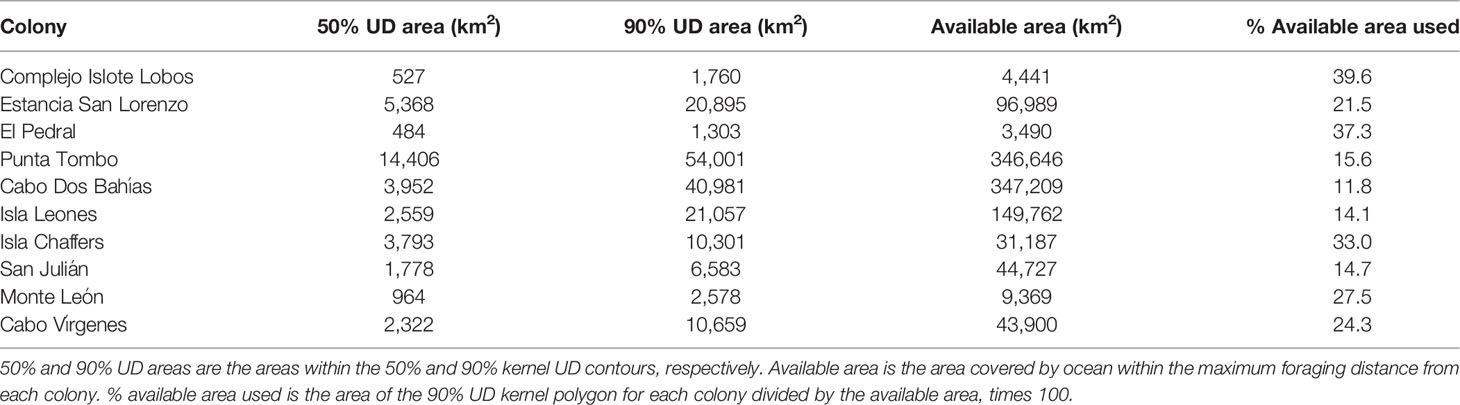
Table 5 Foraging area used by Magellanic penguins from 10 colonies in Argentina.
Colony size and the percentage of available foraging area that penguins used were correlated (F1,8 = 6.4, p = 0.03, R2 = 0.38, log-scale estimate = -4.1 ± 1.6). The relationship was negative, however, opposite the direction predicted if penguins from larger colonies spread out more than penguins from smaller colonies. This result also contradicts the prediction that penguins from larger colonies have a similar range of bearings but still fan out more than penguins from smaller colonies (because the available area of a section of circle increases with the radius of the circle).
The amount of available space used by penguins also varied among years (Figure S3). At Cabo Dos Bahías, penguins used between 0.4% and 6.7% of available ocean, depending on year (n = 10 years). At Punta Tombo, they used 2.0%-7.4% of the area at sea (n = 23 years).
Overlap With MPAs
Penguin foraging areas overlapped with 12 marine protected areas in Argentine waters, but for most colonies, especially southern colonies, overlap was minimal (Figures 1, 3). The two southernmost colonies reported here (Monte León and Cabo Vírgenes) have no marine protection for the penguins’ foraging areas. The two large biosphere reserves, Peninsula Valdés and Patagonia Azul (Table S3; Figure 4), accounted for most of the overlap. For Cabo Dos Bahías and Isla Leones, 50% UD kernel contours overlapped with MPAs much more than 90% UD kernel contours did, because most of the MPA areas are close to shore and most of the 90% UD kernel contours are farther from shore (Figures 1, 3).
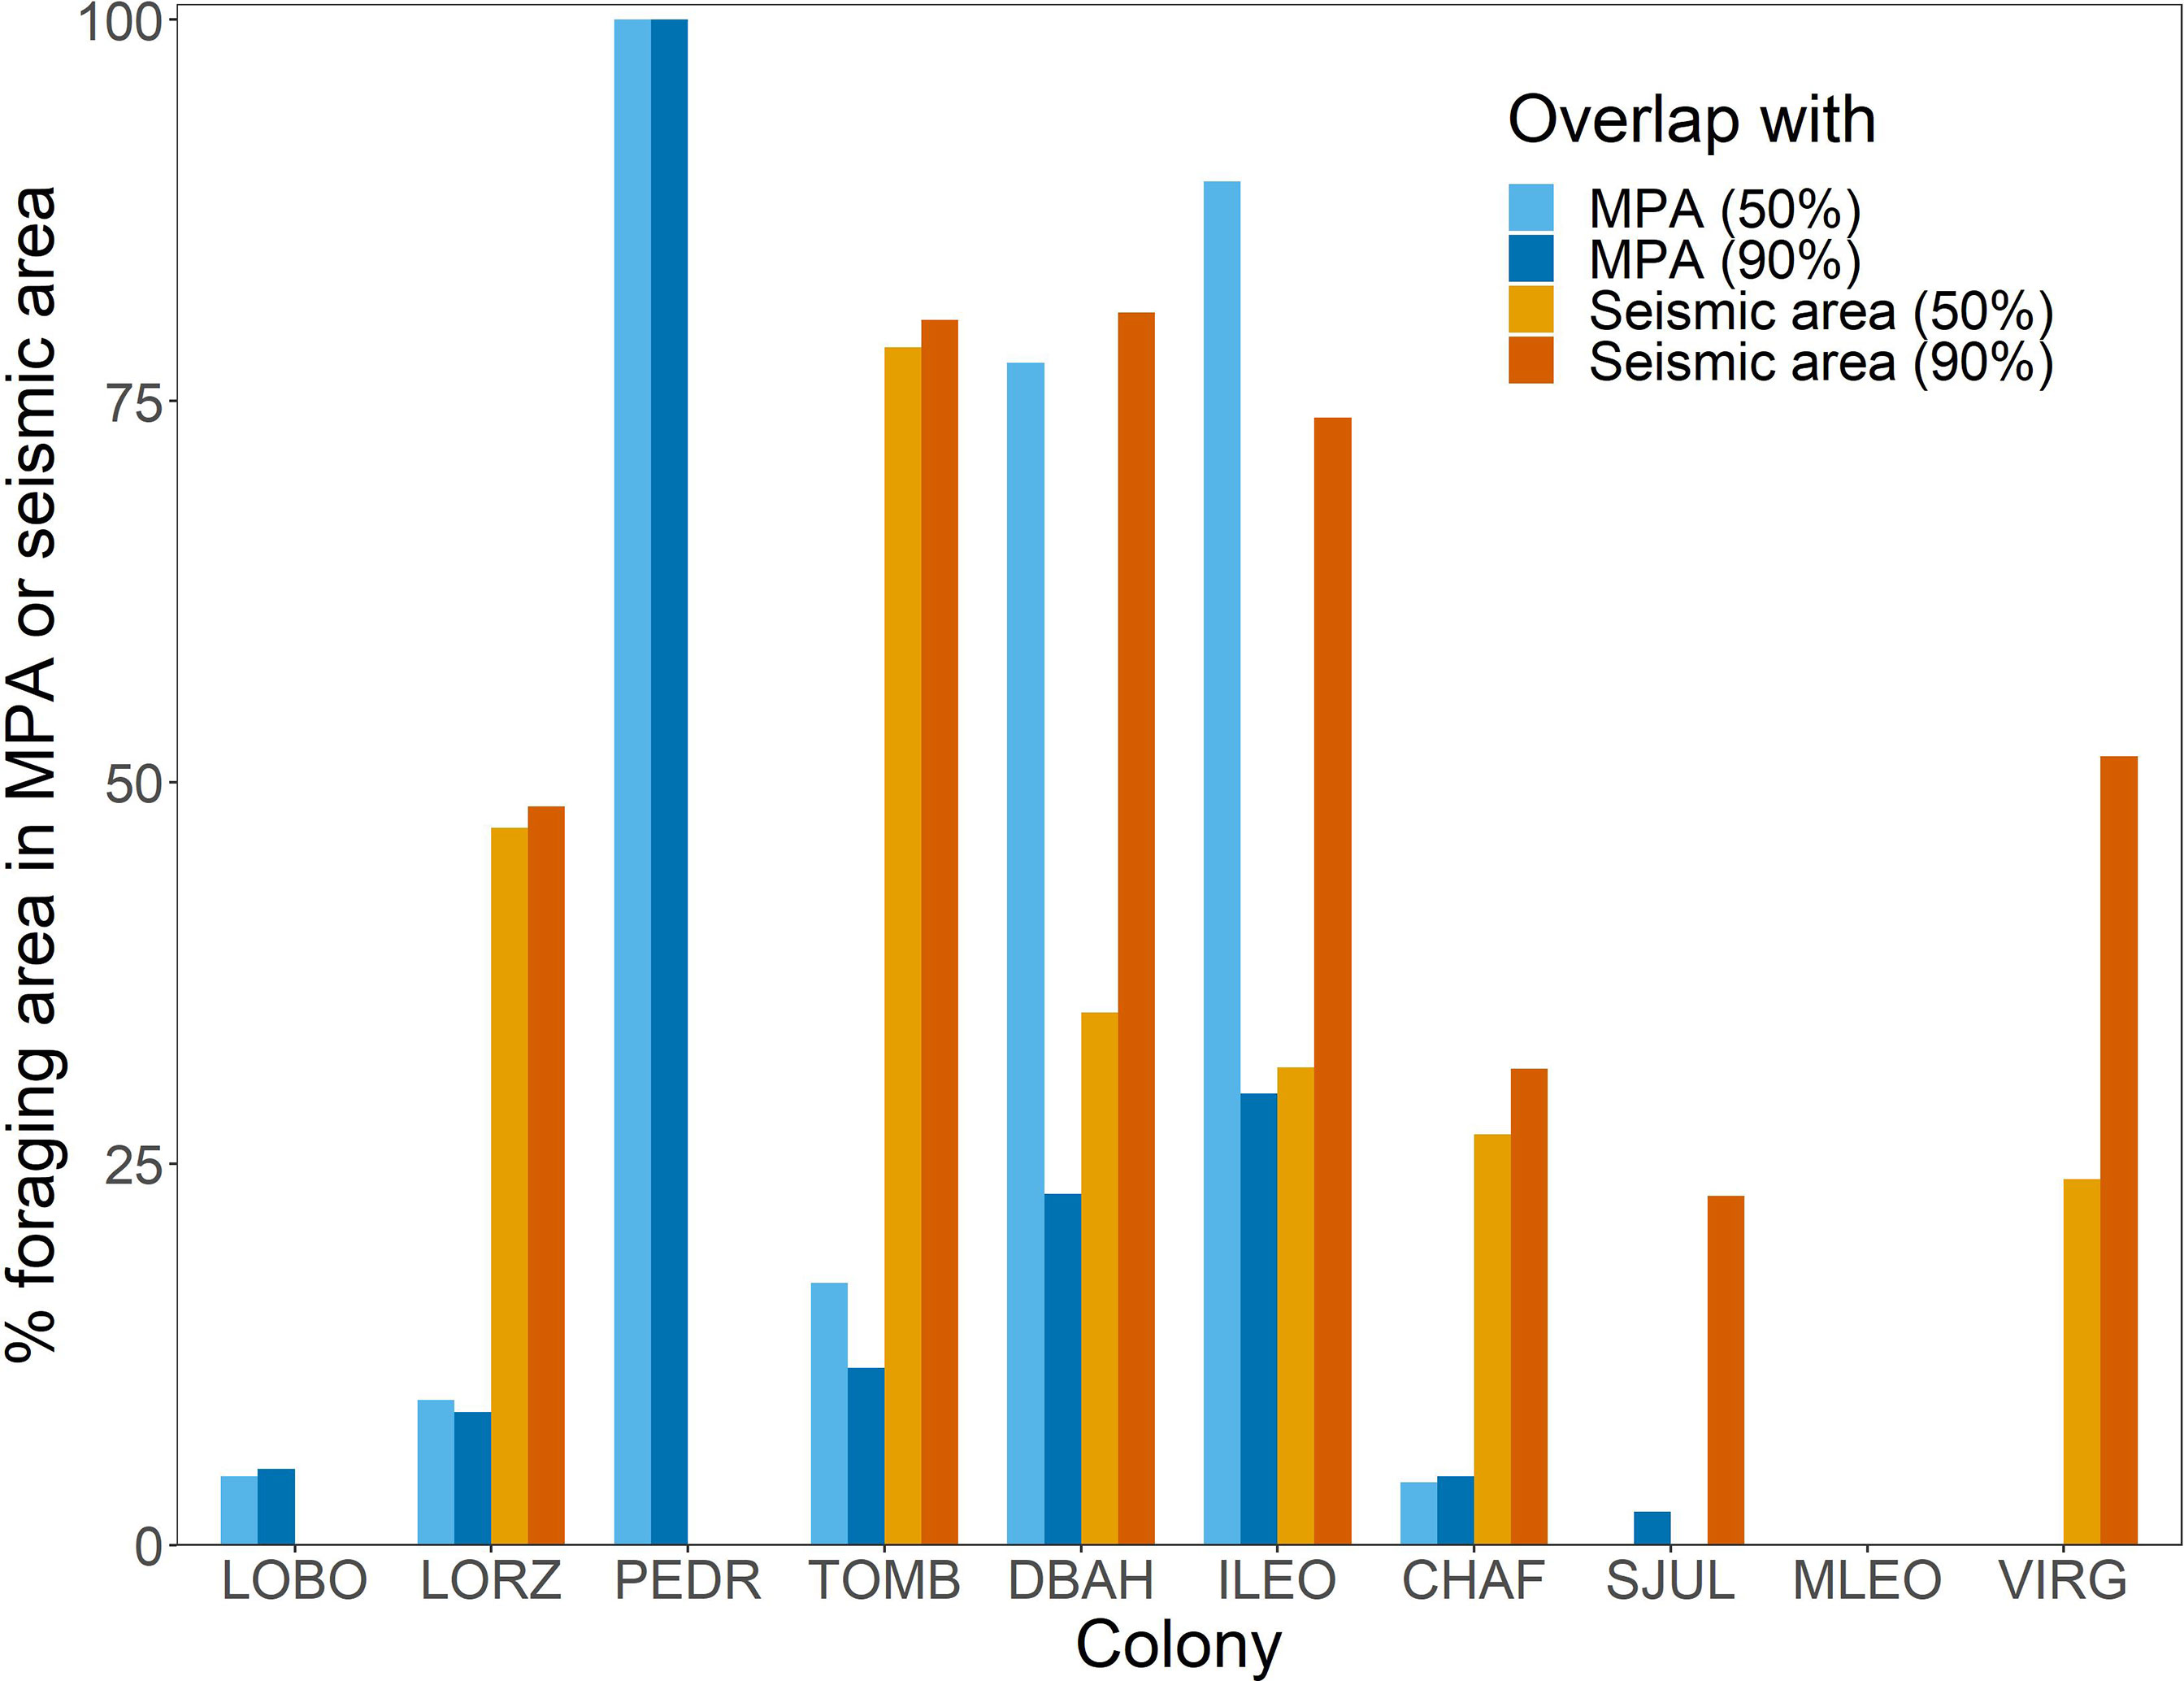
Figure 3 The percentage of Magellanic penguin foraging area contained within marine protected areas (MPA) or seismic-survey areas (Seismic area) varied among colonies in Argentina. 50% = overlap of 50% UD kernel contours with MPAs or seismic-survey areas; 90% = overlap of 90% UD kernel contours with MPAs or seismic-survey areas. LOBO, Complejo Islote Lobos; LORZ, Estancia San Lorenzo; PEDR, El Pedral; TOMB, Punta Tombo; DBAH, Cabo Dos Bahías; ILEO, Isla Leones; CHAF, Isla Chaffers; SJUL, San Julián; MLEO, Monte León; VIRG, Cabo Vírgenes. See Table S3 for MPAs that overlap each colony’s foraging area and Figure 4 for locations of MPAs.
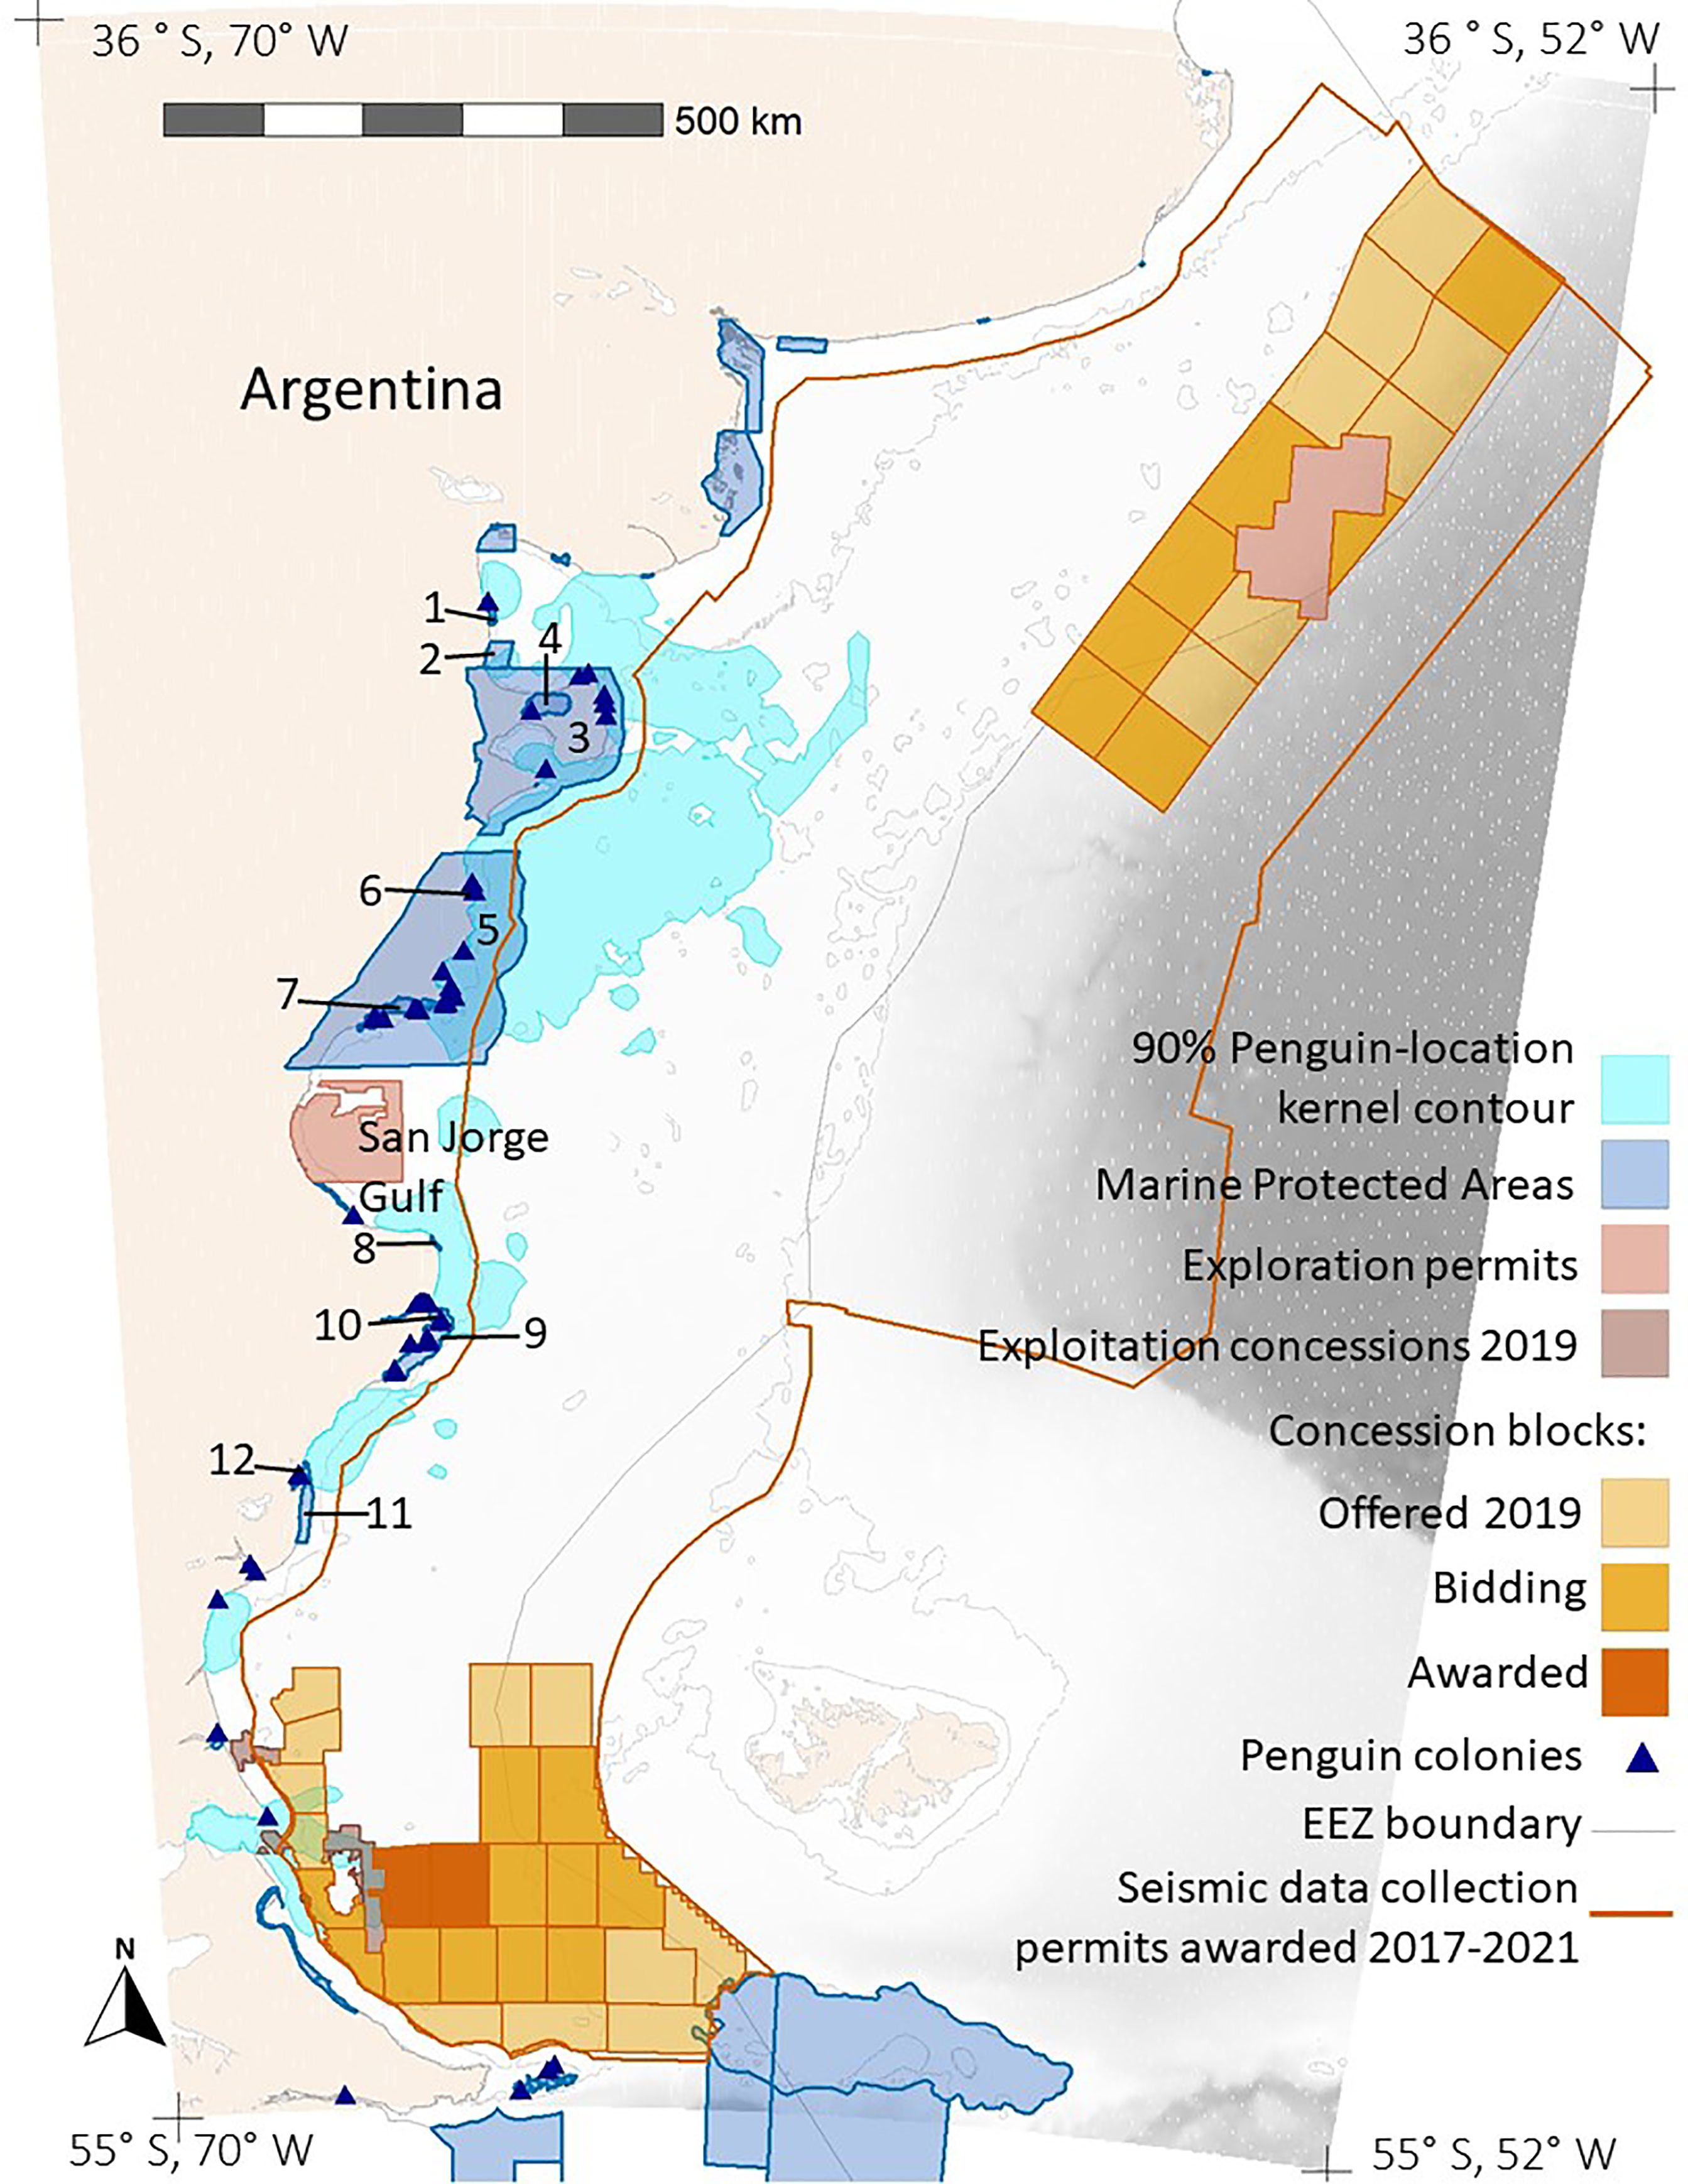
Figure 4 Overlap between foraging areas of Magellanic penguins breeding at 10 colonies in Argentina (90% Penguin-location kernel contour; all colonies combined) and hydrocarbon concessions in Argentina (Exploration permits, Exploitation concessions 2019, and Concession blocks). The tan color is land. Shades of gray indicate ocean depth, with white indicating the continental shelf (< 120 m). The thin gray line marks boundaries of Argentina’s exclusive economic zone (EEZ boundary). The dark orange line encloses the area where Argentina awarded seismic-data collection permits in 2017-2021 (Seismic data collection permits awarded). The numbers label the MPAs. See Table S3 for the MPA names.
Overlap With Hydrocarbon Concessions
The area permitted for seismic data collection covers most of the Argentine continental shelf, offshore of provincial waters, and extends over deeper waters north of the Falkland/Malvinas Islands, covering 1,090,454 km2 (Figure 4). Seismic surveys have already been carried out over extensive areas (Figure S4). The area where seismic surveys are permitted overlaps areas used by penguins from all except three of the 10 colonies (Figures 3, 4). Penguins at Complejo Islote Lobos and El Pedral foraged within gulfs that are not included in the seismic-data-collection area, and penguins at Monte León foraged closer to shore than the area extends. The 90% UD kernel contours extend farther offshore than the 50% UD kernel contours for Cabo Dos Bahías, Isla Leones, and Cabo Vírgenes, accounting for the higher overlap with 90% UD kernel contours than for the 50% UD kernel contours.
Penguins from Cabo Vírgenes also overlapped with other hydrocarbon concessions, with 18% of the 50% kernel UD contour and 22.2% of the 90% kernel UD contour being inside currently exploited concessions. In addition, 13% of the 50% kernel UD contour and 26.2% of the 90% kernel UD contour are inside concession blocks that are offered, in bidding, or awarded (Figure 4).
Discussion
Although foraging distance of Magellanic penguins increased with colony size among ten colonies, variation not explained by colony size meant that MPAs based on the predicted distances would not protect foraging areas adequately at several colonies. In addition, there was no relationship between breeding population size and foraging distance within colony among years. We found no support for the assumption that penguins spread out uniformly around colonies to forage. Foraging habitats depend on oceanographic features that occur in specific locations on the Patagonian Shelf (Acha et al., 2004; Boersma et al., 2009). Overlap between penguin locations and MPAs in Argentina was low for most colonies, as penguins forage farther offshore than coastal MPAs extend, and some colonies do not benefit from any currently implemented marine protection. The foraging area of only one colony overlapped with an area of current hydrocarbon extraction. Based on areas designated for seismic exploration, however, the potential future overlap between penguins foraging at sea and hydrocarbon activities is high. Most of the continental shelf is now open for seismic surveys. The low-frequency sounds produced likely impact the nearshore waters where surveys are not permitted, and can cause avoidance behavior and lower breeding success in penguins (Pichegru et al., 2017).
Assumption That Colony Size Predicts Foraging Distance
Habitat and foraging behavior can vary across small spatial scales (10s to 100s of km), leading habitat use to vary among colonies in marine central-place foragers (Baylis et al., 2019). Gentoo penguins Pygoscelis papua at three colonies of similar small size, 20-55 km apart, in the Kerguelen Archipelago had almost as much variation in foraging distance as the species showed across its entire range (Lescroël and Bost, 2005). Oceanographic features that concentrate prey (Weimerskirch, 2007; Scales et al., 2014) influence penguin foraging locations in Argentina (Boersma et al., 2009), accounting for much residual variation in the population size-foraging distance relationship we found.
In addition to competing with individuals from their own and nearby colonies, seabirds may compete for prey with other species (Ainley et al., 2006) and with fisheries (Gandini et al., 1999; Bertrand et al., 2012). This competition could lead to depletion of prey beyond that caused by one species, and complicate the relationship between colony size and foraging distance. For example, Magellanic penguins breeding in northern Patagonia likely compete with other seabirds, marine mammals, and fish such as hake for anchovy (Koen-Alonso and Yodzis, 2005).
The relationship we found between colony size and foraging distance indicates that there may be a threshold effect between small (< 5000 pairs) and large (> 10,000 pairs) colonies, but we would need more small colonies to test this. We used back-transformed confidence intervals to account for uncertainty. Measured mean foraging distance for four of the ten colonies fell outside the 95% confidence intervals of the predicted distances. Furthermore, interannual variation in colony size was not related to interannual variation in foraging distance.
There is a relationship between colony size and foraging distance for populations of some species (Lewis et al., 2001), but it is not universal. The foraging-radius approach has been used to design effective protection for a species (Ludynia et al., 2012). Whenever foraging behavior varies among colonies or years, however, the effectiveness of the foraging-radius approach will depend on the representativeness of the available data.
The interannual variation in foraging distance within a colony argues for caution in assuming tracking data from one year are representative of all years. Population size varies among years at colonies because Magellanic penguins that skip breeding frequently stay at sea (Boersma and Rebstock, 2010; Gownaris and Boersma, 2019). Egg and chick mortality vary among years (Boersma et al., 1990; Boersma and Rebstock, 2014). The number of chicks remaining by January varied, sometimes due to density-independent factors such as rainstorms (Boersma and Rebstock, 2014) or heat (Holt and Boersma, 2022), as well as starvation and predation (Boersma et al., 1990; Boersma and Rebstock, 2014). In addition, marine productivity and strength of the fronts that concentrate penguin prey (Hansen et al., 2001; Alemany et al., 2009) vary over time scales of tidal cycles to years (Hansen et al., 2001; Marrari et al., 2013; Pisoni et al., 2015), affecting the foraging locations of penguins within and among years (Rebstock et al., 2022).
Assumption of Uniform Distributions
Marine central-place foragers have often been assumed to spread out uniformly around colonies to minimize competition with other individuals from the colony (Cairns, 1989), but our data did not support this assumption. The assumption was not supported by several other studies as well (Grecian et al., 2012; Soanes et al., 2016). The expectation of uniform distribution is based on the assumption of uniform, or at least unpredictable, prey or prey patches (Cairns, 1989; Bolton et al., 2018). This assumption of prey distribution is seldom tested and not always even stated. When prey is concentrated at oceanographic features (Hansen et al., 2001), those features attract individuals from multiple colonies (Weimerskirch, 2007; Bolton et al., 2018), as we found (Boersma et al., 2009; this study, Figure 1).
The uniform distribution is expected to be modified when a colony’s foraging area overlaps with that of a larger colony, as individuals from the smaller colony should avoid the larger colony’s foraging area (Bolton et al., 2018). In our study, penguins from two smaller colonies (Cabo Dos Bahías and Isla Leones) south of Punta Tombo swam north to overlap with penguins from the larger colony (Figure 1), because productive fronts are closer to Punta Tombo than to Cabo Dos Bahías and Isla Leones. The negative relationship we found between colony size and the percentage of available area used may result from penguins at a few colonies concentrating effort at productive fronts, and hence using a smaller range of directions than penguins at some smaller colonies. The distances penguins swim depend on the relative locations of the colonies and fronts.
Shorter foraging distances and more spread-out distributions at the two smallest colonies may indicate that unconcentrated prey is sufficient for penguins from small colonies, whereas penguins from larger colonies do deplete prey unless it is concentrated at oceanographic features. Complejo Islote Lobos and El Pedral, the two smallest and newest colonies, are also the only colonies in our study where penguins forage within the northern Patagonian gulfs, which may have foraging habitats unlike those of the open shelf.
Assuming that central-place foragers spread out to reduce competition ignores the benefits of group foraging. Penguins are sometimes more successful when foraging in groups (McInnes et al., 2017). Multispecies foraging aggregations are common at sea, including both seabirds and marine mammals (Veit and Harrison, 2017). Seabird flocks often serve as attractors to individuals looking for prey (Silverman et al., 2004). Groups of penguins from a large colony may need to spread out if other foraging groups deplete prey, but the assumption that seabirds forage independently and individuals spread out uniformly is too simplistic.
Nonuniform space use is not restricted to mainland colonies. Magellanic penguins tracked on New Island, in the western Falkland/Malvinas Islands did not use space uniformly in spite of having potential foraging areas available 360° around the island (Boersma et al., 2002; Masello et al., 2010). Gentoo and southern rockhopper Eudyptes chrysocome penguins tracked from the same location also showed nonuniform space use (Boersma et al., 2002; Masello et al., 2010). African penguins Spheniscus demersus breeding on islands in Namibia foraged exclusively northwest of their colonies (Ludynia et al., 2012), again suggesting the importance of prey distribution in determining penguins’ foraging distances and distributions at sea
Overlap With MPAs
Overlap with MPAs depended on the locations of the MPAs, how far offshore penguins foraged, and what direction they tended to go from the colony. We did not attempt here to delineate priority areas for protection of Magellanic penguins. We intended to show how variation among foraging areas among colonies affects planning for marine protection.
Data from colonies with few tracks are unlikely to be highly representative of the population of that colony (Soanes et al., 2013). We have sufficient data to show that penguins from Punta Tombo and Cabo Dos Bahías often forage far beyond provincial jurisdictions and cannot be protected by coastal MPAs. The mean foraging distance from El Pedral (16 km), however, is within provincial jurisdiction (12 nm = 22.2 km).
Penguins from Isla Chaffers and San Julián foraged north of the colonies, but protected areas are south of the colonies. Our sample sizes at those colonies are low. We would underestimate foraging area of the colony if individual penguins are faithful to foraging sites (Carroll et al., 2018) and directions to foraging sites vary by penguin. However, we show that Magellanic penguins do not spread out evenly from the colony. Furthermore, penguins tracked with GPS tags at Puerto Deseado (near Isla Chaffers) in 2006, and San Julián in 2007 (Sala et al., 2012) generally foraged in similar areas to penguins we tracked in our study.
Marine protected areas in Argentina include provincial protected areas, national parks, interjurisdictional areas (joint national and provincial management), and UNESCO Biosphere Reserves. Most MPAs in Argentina are coastal (Gil et al., 2019) and provincial reserves cannot protect waters beyond 12 nm. The reasons for establishing the protected areas vary. In a few cases, MPAs were designed to protect penguins and other seabirds or pinnipeds (especially on land), but in general, protecting penguin foraging areas was not a focus.
Overlap With Hydrocarbon Concessions
Argentina currently has limited offshore hydrocarbon production (Nievas El Makte et al., 2021), overlapping the foraging area of only one of the colonies where we tracked penguins. Given the current leasing plans and seismic surveys, however, foraging areas of other colonies are likely to overlap with hydrocarbon extraction activities in the near future. Increasing offshore production increases the risk of pollution at sea (García Borboroglu et al., 2006; Etkin and Nedwed, 2021; Nievas El Makte et al., 2021). In addition, the northward flowing currents on and off the continental shelf of Argentina (Palma et al., 2008) make spatial connectivity high (Afán et al., 2018; Gil et al., 2019) and pollution in one region likely to affect penguins in other regions. In spite of limited offshore production, Argentina experienced large spills and chronic oil pollution that have affected penguins (Jenkins, 1978; Gandini et al., 1994; García Borboroglu et al., 2006; Boersma, 2008; Boersma, 2012; Nievas El Makte et al., 2021).
Most of the continental shelf of Argentina offshore of provincial waters (12 nautical miles) is now open for seismic exploration, potentially affecting foraging areas of Magellanic penguins at all colonies. Penguins that forage in gulfs or within provincial waters that do not overlap with the seismic permit area can still be affected by seismic surveys because attenuation of low-frequency sounds in water is low (Hildebrand, 2009). Seismic surveys produce loud sounds that affect many species of marine animals, from invertebrates to whales (Gordon et al., 2003; Hildebrand, 2009; Carroll et al., 2017). Penguins avoid seismic survey activities (Pichegru et al., 2017; Seco Pon et al., 2019) and loud experimental sounds in the water (Sørensen et al., 2020). African penguins avoided their usual foraging areas and increased their foraging effort up to 100 km from seismic activities (Pichegru et al., 2017).
Recommendations for Protecting Penguins and Other Seabirds at Sea When Colony-Specific Data Are Lacking
1) Do not wait for more data to take action; implement conservation measures that can be modified in light of new information.
We should use the best information we have even if it is incomplete. Penguins and other seabirds need protection now from a variety of human-caused problems, including fisheries, pollution, climate change, introduced predators, and harvest (Croxall et al., 2012; García Borboroglu and Boersma, 2013; Trathan et al., 2014). Information and threats will change. Protection measures need to be flexible enough to be adapted to new information and situations (Boersma et al., 2002).
2) Secure minimum protection in nearshore waters around colonies.
Penguins have to swim through nearshore waters around the colony twice on each foraging trip, regardless of how far away they forage. Seabirds, including penguins, often form rafts in the water near their colonies (Weimerskirch et al., 2010; Berlincourt and Arnould, 2014). Nearshore waters have high conservation value for Magellanic penguins, other seabirds, and pinnipeds (Pichegru et al., 2010; Boersma et al., 2015; Sherley et al., 2015; Sherley et al., 2018; Baylis et al., 2021). Keeping nearshore waters free of pollution and fishing pressure is essential (Boersma et al., 2002), and can be done without addition data, but protection of offshore foraging areas is also critical.
3) Manage economic activities to reduce threats in all regions of the ocean.
All fisheries should be managed so that prey is not depleted and bycatch is minimized (Trathan et al., 2014; Handley et al., 2020). Hydrocarbon activities should be drastically reduced as hydrocarbons are replaced by clean energy sources. In the meanwhile, hydrocarbon activities should be managed to minimize marine pollution (Trathan et al., 2014; Handley et al., 2020). Argentina’s development of offshore hydrocarbon reserves will increase greenhouse-gas emissions and pollution risks, and is insupportable in light of climate change. Climate change threatens penguins and biodiversity directly and indirectly (Boersma and Rebstock, 2014; Trathan et al., 2014; Orgeret et al., 2021; Holt and Boersma, 2022). One of the most effective ways to slow climate change is to leave fossil fuels in the ground (Johnsson et al., 2019).
4) Collect data needed to identify critical foraging areas and timing.
The creation of a protected area is a political challenge that involves sociopolitical, economic, and cultural variables (Grorud-Colvert et al., 2021). Science is fundamental to inform, help justify, and design protected areas. Research can inform protection while reducing unnecessary restrictions that may prevent any protection. The time has passed where penguins should be paying for pollution, climate change, and resource extraction that harms not only penguins, but other wildlife and people.
Data Availability Statement
The raw data supporting the conclusions of this article will be made available by the authors, without undue reservation.
Ethics Statement
The animal study was reviewed and approved by University of Washington Institutional Animal Care and Use Committee.
Author Contributions
PDB conceived and initiated the tracking project; all authors conducted fieldwork to track penguins. All authors contributed to the conceptual framing of the study. GR analyzed the data and led the writing of the manuscript. All authors contributed critically to the drafts and gave final approval for publication.
Funding
This work was supported by the Wildlife Conservation Society (WCS); Exxonmobil Foundation; the Pew Fellows Program in Marine Conservation; the Disney Worldwide Conservation Fund; the National Geographic Society; the Chase, Cunningham, MKCG, Offield, Peach, Thorne, Tortuga, and Kellogg Foundations; the Wadsworth Endowed Chair in Conservation Science; and Friends of the Penguins. Trimble provided field computers and Canon provided two pairs of binoculars. No funder had any role in the design, data collection, analysis, or publication of the research.
Conflict of Interest
The authors declare that the research was conducted in the absence of any commercial or financial relationships that could be construed as a potential conflict of interest.
Publisher’s Note
All claims expressed in this article are solely those of the authors and do not necessarily represent those of their affiliated organizations, or those of the publisher, the editors and the reviewers. Any product that may be evaluated in this article, or claim that may be made by its manufacturer, is not guaranteed or endorsed by the publisher.
Acknowledgments
We thank the Province of Chubut and particularly the Offices of Tourism and of Flora and Fauna, and the National Scientific and Technical Research Council of Argentina for permits and/or logistical support. We thank the La Regina family, Carlos García, William Conway, Graham Harris, Patricia Harris, Carol Passera, Carlos Passera, Centro Nacional Patagónico (CENPAT), and key wardens for logistical support and help over the 24 years of study. We are grateful to the many students and field volunteers who collected data over the years, including volunteers through the WCS and students from Puerto Madryn and Trelew, Argentina. The Argos Data Collection and Location System, operated by CLS (http://www.argos-system.org/), was used for this project. Argos is an international program that relies on instruments provided by the French Space Agency (CNES) flown on polar-orbiting satellites operated by NOAA, EUMETSAT, and the Indian Space Research Organization (ISRO). A. Baylis shared R code. V. Falabella supplied shapefiles for hydrocarbon concession maps. Four anonymous reviewers helped improve the manuscript.
Supplementary Material
The Supplementary Material for this article can be found online at: https://www.frontiersin.org/articles/10.3389/fmars.2022.815706/full#supplementary-material
References
Acha E. M., Mianzan H. W., Guerrero R. A., Favero M., Bava J. (2004). Marine Fronts at the Continental Shelves of Austral South America: Physical and Ecological Processes. J. Mar. Syst. 44, 83–105. doi: 10.1016/j.jmarsys.2003.09.005
Afán I., Giménez J., Forero M. G., Ramírez F. (2018). An Adaptive Method for Identifying Marine Areas of High Conservation Priority. Conserv. Biol. 32, 1436–1447. doi: 10.1111/cobi.13154
Ainley D. G., Ballard G., Dugger K. M. (2006). Competition Among Penguins and Cetaceans Reveals Trophic Cascades in the Western Ross Sea, Antarctica. Ecology 87, 2080–2093. doi: 10.1890/0012-9658(2006)87[2080:CAPACR]2.0.CO;2
Alemany D., Acha E. M., Iribarne O. (2009). The Relationship Between Marine Fronts and Fish Diversity in the Patagonian Shelf Large Marine Ecosystem. J. Biogeogr. 36, 2111–2124. doi: 10.1111/j.1365-2699.2009.02148.x
Amante C., Eakins B. W. (2009). ETOPO1 1 Arc-Minute Global Relief Model: Procedures, Data Sources and Analysis. Natl. Geophys. Data Center NOAA. doi: 10.7289/V5C8276M
Ashmole N. P. (1963). The Regulation of Numbers of Tropical Oceanic Birds. Ibis 103b, 458–473. doi: 10.1111/j.1474-919X.1963.tb06766.x
Baylis A. M. M., de Lecea A. M., Tierney M., Orben R. A., Ratcliffe N., Wakefield E., et al. (2021). Overlap Between Marine Predators and Proposed Marine Managed Areas on the Patagonian Shelf. Ecol. Appl. 31, e02426. doi: 10.1002/eap.2426
Baylis A. M. M., Tierney M., Orben R. A., Warwick-Evans V., Wakefield E., Grecian W. J., et al. (2019). Important at-Sea Areas of Colonial Breeding Marine Predators on the Southern Patagonian Shelf. Sci. Rep. 9, 8517. doi: 10.1038/s41598-019-44695-1
Berlincourt M., Arnould J. P. Y. (2014). At-Sea Associations in Foraging Little Penguins. PloS One 9, e105065. doi: 10.1371/journal.pone.0105065
Bertrand S., Joo R., Smet C. A., Tremblay Y., Barbraud C., Weimerskirch H. (2012). Local Depletion by a Fishery can Affect Seabird Foraging. J. Appl. Ecol. 49, 1168–1177. doi: 10.1111/j.1365-2664.2012.02190.x
Blanco G. S., Gallo L., Pisoni J. P., Dell’Omo G., Gerez N. A., Molina G., et al. (2022). At-Sea Distribution, Movements and Diving Behavior of Magellanic Penguins Reflect Small-Scale Changes in Oceanographic Conditions Around the Colony. Mar. Biol. 169, 29. doi: 10.1007/s00227-021-04016-5
Boersma P. D. (2012). Penguins and Petroleum: Lessons in Conservation Ecology. Front. Ecol. Environ. 10, 218–219. doi: 10.1890/154-9295-10.4.218
Boersma P. D., Frere E., Kane O., Pozzi L. M., Pütz K., Raya Rey A., et al. (2013). “Magellanic Penguin (Spheniscus magellanicus),” in Penguins: Natural History and Conservation. Eds. García Borboroglu P., Boersma P. D. (Seattle, WA: University of Washington Press), 233–263.
Boersma P. D., Rebstock G. A. (2009). Foraging Distance Affects Reproductive Success in Magellanic Penguins. Mar. Ecol. Prog. Ser. 375, 263–275. doi: 10.3354/meps07753
Boersma P. D., Rebstock G. A. (2010). Effects of Double Bands on Magellanic Penguins. J. Field Ornithol. 81, 195–205. doi: 10.1111/j.1557-9263.2010.00277.x
Boersma P. D., Rebstock G. A. (2014). Climate Change Increases Reproductive Failure in Magellanic Penguins. PloS One 9, e85602. doi: 10.1371/journal.pone.0085602
Boersma P. D., Rebstock G. A., Frere E., Moore S. E. (2009). Following the Fish: Penguins and Productivity in the South Atlantic. Ecol. Monogr. 79, 59–76. doi: 10.1890/06-0419.1
Boersma P. D., Rebstock G. A., García Borboroglu P. (2015). Marine Protection is Needed for Magellanic Penguins in Argentina Based on Long-Term Data. Biol. Conserv. 182, 197–204. doi: 10.1016/j.biocon.2014.12.005
Boersma P. D., Stokes D. L., Strange I. J. (2002). Applying Ecology to Conservation: Tracking Breeding Penguins at New Island South Reserve, Falkland Islands. Aquat. Conserv. Mar. Freshw. Ecosyst. 12, 63–74. doi: 10.1002/aqc.477
Boersma P. D., Stokes D. L., Yorio P. M. (1990). “Reproductive Variability and Historical Change of Magellanic Penguins (Spheniscus magellanicus) at Punta Tombo, Argentina,” in Penguin Biology. Eds. Davis L., Darby J. (San Diego, CA: Academic Press), 15–43.
Bolton M., Conolly G., Carroll M., Wakefield E. D., Caldow R. (2018). A Review of the Occurrence of Inter-Colony Segregation of Seabird Foraging Areas and the Implications for Marine Environmental Impact Assessment. Ibis 161, 241–259. doi: 10.1111/ibi.12677
Bost C. A., Cotte C., Terray P., Barbraud C., Bon C., Delord K., et al. (2015). Large-Scale Climatic Anomalies Affect Marine Predator Foraging Behaviour and Demography. Nat. Commun. 6, 8220. doi: 10.1038/ncomms9220
Brooke M. de L. (2004). The Food Consumption of the World’s Seabirds. Biol. Lett. 271, S246–S248. doi: 10.1098/rsbl.2003.0153
Cairns D. K. (1989). The Regulation of Seabird Colony Size: A Hinterland Model. Am. Nat. 134, 141–146. doi: 10.1086/284970
Carroll G., Harcourt R., Pitcher B. J., Slip D., Jonsen I. (2018). Recent Prey Capture Experience and Dynamic Habitat Quality Mediate Short-Term Foraging Site Fidelity in a Seabird. Proc. R. Soc. B. Biol. Sci. 285, 20180788. doi: 10.1098/rspb.2018.0788
Carroll A. G., Przeslawski R., Duncan A., Gunning M., Bruce B. (2017). A Critical Review of the Potential Impacts of Marine Seismic Surveys on Fish & Invertebrates. Mar. Pollut. Bull. 114, 9–24. doi: 10.1016/j.marpolbul.2016.11.038
Critchley E. J., Grecian W. J., Kane A., Jessopp M. J., Quinn J. L. (2018). Marine Protected Areas Show Low Overlap With Projected Distributions of Seabird Populations in Britain and Ireland. Biol. Conserv. 224, 309–317. doi: 10.1016/j.biocon.2018.06.007
Croxall J. P., Butchart S. H. M., Lascelles B., Stattersfield A. J., Sullivan B., Symes A., et al. (2012). Seabird Conservation Status, Threats and Priority Actions: A Global Assessment. Bird Conserv. Int. 22, 1–34. doi: 10.1017/S0959270912000020
Dias M. P., Carneiro A. P. B., Warwick-Evans V., Harris C., Lorenz K., Lascelles B., et al. (2018). Identification of Marine Important Bird and Biodiversity Areas for Penguins Around the South Shetland Islands and South Orkney Islands. Ecol. Evol. 8, 10520–10529. doi: 10.1002/ece3.4519
Dias M. P., Martin R., Pearmain E. J., Burfield I. J., Small C., Phillips R. A., et al. (2019). Threats to Seabirds: A Global Assessment. Biol. Conserv. 237, 525–537. doi: 10.1016/j.biocon.2019.06.033
Etkin D. S., Nedwed T. J. (2021). Effectiveness of Mechanical Recovery for Large Offshore Oil Spills. Mar. Pollut. Bull. 163, 111848. doi: 10.1016/j.marpolbul.2020.111848
Flanders Marine Institute (2021) MarineRegions.Org. Available at: www.marineregions.org (Accessed September 15, 2021).
Gandini P., Boersma P. D., Frere E., Gandini M., Holik T., Lichtschein V. (1994). Magellanic Penguins (Spheniscus magellanicus) Affected by Chronic Petroleum Pollution Along Coast of Chubut, Argentina. Auk 111, 20–27. doi: 10.2307/4088501
Gandini P. A., Frere E., Pettovello A. D., Cedrola P. V. (1999). Interaction Between Magellanic Penguins and Shrimp Fisheries in Patagonia, Argentina. Condor 101, 783–789. doi: 10.2307/1370065
García Borboroglu P., Boersma P. D., Ruoppolo V., Reyes L., Rebstock G. A., Griot K., et al. (2006). Chronic Oil Pollution Harms Magellanic Penguins in the Southwest Atlantic. Mar. Pollut. Bull. 52, 193–198. doi: 10.1016/j.marpolbul.2005.11.004
García Borboroglu P., Boersma P. D. (Eds.) (2013). Penguins: Natural History and Conservation (Seattle: University of Washington Press).
Gil M. N., Giarratano E., Barros V., Bortolus A., Codignotto J. O., Schenke R. D., et al. (2019). “Chapter 34 - Southern Argentina: The Patagonian Continental Shelf,” in World Seas: An Environmental Evaluation. Ed. Sheppard C. (London: Academic Press), 783–811. doi: 10.1016/B978-0-12-805068-2.00040-1
Gordon J., Gillespie D., Potter J., Frantzis A., Simmonds M. P., Swift R., et al. (2003). A Review of the Effects of Seismic Surveys on Marine Mammals. Mar. Technol. Soc J. 37, 16–34. doi: 10.4031/002533203787536998
Gownaris N. J., Boersma P. D. (2019). Sex-Biased Survival Contributes to Population Decline in a Long-Lived Seabird, the Magellanic Penguin. Ecol. Appl. 29, e01826. doi: 10.1002/eap.1826
Grecian W. J., Witt M. J., Attrill M. J., Bearhop S., Godley B. J., Grémillet D., et al. (2012). A Novel Projection Technique to Identify Important at-Sea Areas for Seabird Conservation: An Example Using Northern Gannets Breeding in the North East Atlantic. Biol. Conserv. 156, 43–52. doi: 10.1016/j.biocon.2011.12.010
Grorud-Colvert K., Sullivan-Stack J., Roberts C., Constant V., Horta e Costa B., Pike E. P., et al. (2021). The MPA Guide: A Framework to Achieve Global Goals for the Ocean. Science 373, eabf0861. doi: 10.1126/science.abf0861
Handley J. M., Pearmain E. J., Oppel S., Carneiro A. P. B., Hazin C., Phillips R. A., et al. (2020). Evaluating the Effectiveness of a Large Multi-Use MPA in Protecting Key Biodiversity Areas for Marine Predators. Divers. Distrib. 26, 715–729. doi: 10.1111/ddi.13041
Hansen J. E., Martos P., Madirolas A. (2001). Relationship Between Spatial Distribution of the Patagonian Stock of Argentine Anchovy, Engraulis anchoita, and Sea Temperatures During Late Spring to Early Summer. Fish. Oceanogr. 10, 193–206. doi: 10.1046/j.1365-2419.2001.00166.x
Hays G. C., Bailey H., Bograd S. J., Bowen W. D., Campagna C., Carmichael R. H., et al. (2019). Translating Marine Animal Tracking Data Into Conservation Policy and Management. Trends Ecol. Evol. 34, 459–473. doi: 10.1016/j.tree.2019.01.009
Hildebrand J. A. (2009). Anthropogenic and Natural Sources of Ambient Noise in the Ocean. Mar. Ecol. Prog. Ser. 395, 5–20. doi: 10.3354/meps08353
Holt K. A., Boersma P. D. (2022). Unprecedented Heat Mortality of Magellanic Penguins. Ornithol. Appl. 124, 1–12. doi: 10.1093/ornithapp/duab052
Horswill C., Trathan P. N., Ratcliffe N. (2017). Linking Extreme Interannual Changes in Prey Availability to Foraging Behaviour and Breeding Investment in a Marine Predator, the Macaroni Penguin. PloS One 12, e0184114. doi: 10.1371/journal.pone.0184114
IUCN. (2021). IUCN Red List of Threatened Species. Available at: www.iucnredlist.org (Accessed October 30, 2021).
Jenkins S. H. (1978). Oil Pollution in Argentina. Mar. Pollut. Bull. 9, 146–147. doi: 10.1016/0025-326X(78)90389-2
Johnson D. S., London J. M., Lea M.-A., Durban J. W. (2008). Continuous-Time Correlated Random Walk Model for Animal Telemetry Data. Ecology 89, 1208–1215. doi: 10.1890/07-1032.1
Johnsson F., Kjärstad J., Rootzén J. (2019). The Threat to Climate Change Mitigation Posed by the Abundance of Fossil Fuels. Clim. Policy 19, 258–274. doi: 10.1080/14693062.2018.1483885
Kie J. G. (2013). A Rule-Based Ad Hoc Method for Selecting a Bandwidth in Kernel Home-Range Analyses. Anim. Biotelemetry 1, 13. doi: 10.1186/2050-3385-1-13
Koen-Alonso M., Yodzis P. (2005). Multispecies Modelling of Some Components of the Marine Community of Northern and Central Patagonia, Argentina. Can. J. Fish. Aquat. Sci. 62, 1490–1512. doi: 10.1139/f05-087
Lescroël A., Bost C.-A. (2005). Foraging Under Contrasting Oceanographic Conditions: The Gentoo Penguin at Kerguelen Archipelago. Mar. Ecol. Prog. Ser. 302, 245–261. doi: 10.3354/meps302245
Lewis S., Sherratt T. N., Hamer K. C., Wanless S. (2001). Evidence of Intra-Specific Competition for Food in a Pelagic Seabird. Nature 412, 816–819. doi: 10.1038/35090566
Lewis S. E. F., Turpie J. K., Ryan P. G. (2013). Are African Penguins Worth Saving? The Ecotourism Value of the Boulders Beach Colony. Afr. J. Mar. Sci. 34, 497–504. doi: 10.2989/1814232X.2012.716008
Ludynia K., Kemper J., Roux J.-P. (2012). The Namibian Islands’ Marine Protected Area: Using Seabird Tracking Data to Define Boundaries and Assess Their Adequacy. Biol. Conserv. 156, 136–145. doi: 10.1016/j.biocon.2011.11.014
Marrari M., Signorini S. R., McClain C. R., Pájaro M., Martos P., Viñas M. D., et al. (2013). Reproductive Success of the Argentine Anchovy, Engraulis anchoita, in Relation to Environmental Variability at a Mid-Shelf Front (Southwestern Atlantic Ocean). Fish. Oceanogr. 22, 247–261. doi: 10.1111/fog.12019
Masello J. F., Mundry R., Poisbleau M., Demongin L., Voigt C. C., Wikelski M., et al. (2010). Diving Seabirds Share Foraging Space and Time Within and Among Species. Ecosphere 1, art19. doi: 10.1890/ES10-00103.1
McInnes A. M., McGeorge C., Ginsberg S., Pichegru L., Pistorius P. A. (2017). Group Foraging Increases Foraging Efficiency in a Piscivorous Diver, the African Penguin. R. Soc Open Sci. 4, 170918. doi: 10.1098/rsos.170918
Nievas El Makte M. L., Polifroni R., Sepúlveda M. A., Fazio A. (2021). “Petroleum Hydrocarbons in Atlantic Coastal Patagonia,” in Anthropogenic Pollution of Aquatic Ecosystems. Eds. Häder D.-P., Helbling E. W., Villafañe V. E. (Cham, Switzerland: Springer), 325–352. doi: 10.1007/978-3-030-75602-4_15
NOAA National Geophysical Data Center (2009) ETOPO1 1 Arc-Minute Global Relief Model. Available at: https://www.ngdc.noaa.gov/mgg/global/ (Accessed September 15, 2021).
Oppel S., Bolton M., Carneiro A. P. B., Dias M. P., Green J. A., Masello J. F., et al. (2018). Spatial Scales of Marine Conservation Management for Breeding Seabirds. Mar. Policy 98, 37–46. doi: 10.1016/j.marpol.2018.08.024
Orgeret F., Thiebault A., Kovacs K. M., Lydersen C., Hindell M. A., Thompson S. A., et al. (2021). Climate Change Impacts on Seabirds and Marine Mammals: The Importance of Study Duration, Thermal Tolerance and Generation Time. Ecol. Lett. 24, 218–239. doi: 10.1111/ele.13920
Palma E. D., Matano R. P., Piola A. R. (2008). A Numerical Study of the Southwestern Atlantic Shelf Circulation: Stratified Ocean Response to Local and Offshore Forcing. J. Geophys. Res. Oceans 113, C11010. doi: 10.1029/2007jc004720
Pichegru L., Grémillet D., Crawford R. J. M., Ryan P. G. (2010). Marine No-Take Zone Rapidly Benefits Endangered Penguin. Biol. Lett. 6, 498–501. doi: 10.1098/rsbl.2009.0913
Pichegru L., Nyengera R., McInnes A. M., Pistorius P. (2017). Avoidance of Seismic Survey Activities by Penguins. Sci. Rep. 7, 16305. doi: 10.1038/s41598-017-16569-x
Pisoni J. P., Rivas A. L., Piola A. R. (2015). On the Variability of Tidal Fronts on a Macrotidal Continental Shelf, Northern Patagonia, Argentina. Deep Sea Res. Part II Top. Stud. Oceanogr. 119, 61–68. doi: 10.1016/j.dsr2.2014.01.019
Pozzi L. M., García Borboroglu P., Boersma P. D., Pascual M. A. (2015). Population Regulation in Magellanic Penguins: What Determines Changes in Colony Size? PloS One 10, e0119002. doi: 10.1371/journal.pone.0119002
R Core Development Team (2020). R: A Language and Environment for Statistical Computing (Vienna, Austria: R Foundation for Statistical Computing). Available at: http://www.R-project.org.
Ratcliffe N., Trathan P. N. (2011). A Review of the Diet and at-Sea Distribution of Penguins Breeding Within the CAMLR Convention Area. CCAMLR Sci. 18, 75–114.
Raya Rey A. N., Pizarro J. C., Anderson C. B., Huettmann F. (2017). Even at the Uttermost Ends of the Earth: How Seabirds Telecouple the Beagle Channel With Regional and Global Processes That Affect Environmental Conservation and Social-Ecological Sustainability. Ecol. Soc 22, 31. doi: 10.5751/ES-09771-220431
Rebstock G. A., Abrahms B., Boersma P. D. (2022). Site Fidelity Increases Reproductive Success by Increasing Foraging Efficiency in a Marine Predator Behav. Ecol. In Press doi: 10.1093/beheco/arac052
Rebstock G. A., Boersma P. D., García Borboroglu P. (2016). Changes in Habitat Use and Nesting Density in a Declining Seabird Colony. Popul. Ecol. 58, 105–119. doi: 10.1007/s10144-015-0523-0
Ropert-Coudert Y., Chiaradia A., Ainley D., Barbosa A., Boersma P. D., Brasso R., et al. (2019). Happy Feet in a Hostile World? The Future of Penguins Depends on Proactive Management of Current and Expected Threats. Front. Mar. Sci. 6, 248. doi: 10.3389/fmars.2019.00248
Sørensen K., Neumann C., Dähne M., Hansen K. A., Wahlberg M. (2020). Gentoo Penguins (Pygoscelis papua) React to Underwater Sounds. R. Soc. Open Sci. 7, 191988. doi: 10.1098/rsos.191988
Sala J. E., Wilson R. P., Frere E., Quintana F. (2012). Foraging Effort in Magellanic Penguins in Coastal Patagonia, Argentina. Mar. Ecol. Prog. Ser. 464, 273–287. doi: 10.3354/meps09887
Santora J. A., LaRue M. A., Ainley D. G. (2020). Geographic Structuring of Antarctic Penguin Populations. Glob. Ecol. Biogeogr. 29, 1716–1728. doi: 10.1111/geb.13144
Scales K. L., Miller P. I., Embling C. B., Ingram S. N., Pirotta E., Votier S. C. (2014). Mesoscale Fronts as Foraging Habitats: Composite Front Mapping Reveals Oceanographic Drivers of Habitat Use for a Pelagic Seabird. J. R. Soc. Interf. 11, 20140679. doi: 10.1098/rsif.2014.0679
Seco Pon J. P., Bastida J., Giardino G., Favero M., Copello S. (2019). Seabirds East of Tierra Del Fuego, Argentina During a 3D Seismic Survey. Ornitol. Neotrop. 30, 103–111.
Sherley R. B., Barham B. J., Barham P. J., Campbell K. J., Crawford R. J. M., Grigg J., et al. (2018). Bayesian Inference Reveals Positive But Subtle Effects of Experimental Fishery Closures on Marine Predator Demographics. Proc. R. Soc. B. Biol. Sci. 285, 20172443. doi: 10.1098/rspb.2017.2443
Sherley R. B., Winker H., Altwegg R., van der Lingen C. D., Votier S. C., Crawford R. J. M. (2015). Bottom-Up Effects of a No-Take Zone on Endangered Penguin Demographics. Biol. Lett. 11, 20150237. doi: 10.1098/rsbl.2015.0237
Silverman E. D., Veit R. R., Nevitt G. A. (2004). Nearest Neighbors as Foraging Cues: Information Transfer in a Patchy Environment. Mar. Ecol. Prog. Ser. 277, 25–35. doi: 10.3354/meps277025
Soanes L. M., Arnould J. P. Y., Dodd S. G., Sumner M. D., Green J. A. (2013). How Many Seabirds do We Need to Track to Define Home-Range Area? J. Appl. Ecol. 50, 671–679. doi: 10.1111/1365-2664.12069
Soanes L. M., Bright J. A., Angel L. P., Arnould J. P. Y., Bolton M., Berlincourt M., et al. (2016). Defining Marine Important Bird Areas: Testing the Foraging Radius Approach. Biol. Conserv. 196, 69–79. doi: 10.1016/j.biocon.2016.02.007
Trathan P. N., García Borboroglu P., Boersma P. D., Bost C.-A., Crawford R. J. M., Crossin G. T., et al. (2014). Pollution, Habitat Loss, Fishing, and Climate Change as Critical Threats to Penguins. Conserv. Biol. 29, 31–41. doi: 10.1111/cobi.12349
UNEP-WCMC and IUCN Protected Planet Marine Protected Areas; The World Database on Protected Areas (WDPA). Available at: https://www.protectedplanet.net (Accessed September 16, 2021).
Veit R. R., Harrison N. M. (2017). Positive Interactions Among Foraging Seabirds, Marine Mammals and Fishes and Implications for Their Conservation. Front. Ecol. Evol. 5, 121. doi: 10.3389/fevo.2017.00121
Wagner E. L., García Borboroglu P., Boersma P. D. (2020). The Power of Penguins: Where Tourists Travel to See Penguins in the Wild. Ocean Coast. Manage. 201, 105429. doi: 10.1016/j.ocecoaman.2020.105429
Weber S. B., Richardson A. J., Brown J., Bolton M., Clark B. L., Godley B. J., et al. (2021). Direct Evidence of a Prey Depletion “Halo” Surrounding a Pelagic Predator Colony. Proc. Natl. Acad. Sci. 118, e2101325118. doi: 10.1073/pnas.2101325118
Weimerskirch H. (2007). Are Seabirds Foraging for Unpredictable Resources? Deep-Sea Res. II 54, 211–223. doi: 10.1016/j.dsr2.2006.11.013
Weimerskirch H., Bertrand S., Silva J., Marques J. C., Goya E. (2010). Use of Social Information in Seabirds: Compass Rafts Indicate the Heading of Food Patches. PloS One 5, e9928. doi: 10.1371/journal.pone.0009928
Wilson R. P., Scolaro J. A., Grémillet D., Kierspel M. A. M., Laurenti S., Upton J., et al. (2005). How do Magellanic Penguins Cope With Variability in Their Access to Prey? Ecol. Monogr. 75, 379–401. doi: 10.1890/04-1238
Yorio P., Suárez N., Dell’Arciprete P., Marinao C., Góngora M. E., Pichegru L., et al. (2021). Spatial Use of Multiple Jurisdictions by Magellanic Penguins and Assessment of Potential Conflicts in the Face of Changing Trawl Fisheries Scenarios. Mar. Ecol. Prog. Ser. 2021, 219–236. doi: 10.3354/meps13562
Keywords: Spheniscus magellanicus, marine protected area, MPA, hydrocarbon exploitation, colony size, at-sea distribution, foraging radius, seismic survey
Citation: Rebstock GA, García Borboroglu P and Boersma PD (2022) Variability in Foraging Range and Direction Among Colonies in a Widespread Seabird, the Magellanic Penguin. Front. Mar. Sci. 9:815706. doi: 10.3389/fmars.2022.815706
Received: 15 November 2021; Accepted: 19 April 2022;
Published: 16 May 2022.
Edited by:
Jorge M. Pereira, University of Coimbra, PortugalReviewed by:
Katta Ludynia, Southern African Foundation for the Conservation of Coastal Birds (SANCCOB), South AfricaMartin Beal, University Institute of Psychological, Social and Life Sciences (ISPA), Portugal
Gwendoline Traisnel, Nelson Mandela University, South Africa
Candice Michelot, Laval University, Canada
Copyright © 2022 Rebstock, García Borboroglu and Boersma. This is an open-access article distributed under the terms of the Creative Commons Attribution License (CC BY). The use, distribution or reproduction in other forums is permitted, provided the original author(s) and the copyright owner(s) are credited and that the original publication in this journal is cited, in accordance with accepted academic practice. No use, distribution or reproduction is permitted which does not comply with these terms.
*Correspondence: Ginger A. Rebstock, Z2FyQHV3LmVkdQ==