 Torstein Pedersen
- Department of Arctic and Marine Biology, Faculty of Biosciences, Fisheries and Economy, UiT The Arctic University of Norway, Tromsø, Norway
The trophic position concept is central in system ecology, and in this study, trophic position (TP) estimates from stable-isotopes and an Ecopath mass-balance food web model for the Barents Sea were compared. Two alternative models for estimating TP from stable isotopes, with fixed or scaled trophic fractionation were applied. The mass-balance model was parametrized and balanced for year 2000, was comprised of 108 functional groups (Gs), and was based on biomass and diet data largely based on predator stomach data. Literature search for the Barents Sea Large Marine Ecosystem revealed 93 sources with stable isotope data (δ15N values) for 83 FGs, and 25 of the publications had trophic position estimated from nitrogen stable isotopes. Trophic positions estimated from the mass-balance model ranged to 5.1 TP and were highly correlated with group mean δ15N values, and also highly correlated with the original literature estimates of trophic positions from stable isotopes. On average, TP from the mass-balance model was 0.1 TP higher than the original literature TP estimates (TPSIR) from stable isotopes. A trophic enrichment factor (TEF) was estimated assuming fixed fractionation and minimizing differences between trophic positions from Ecopath and TP predicted from δ15N values assuming a baseline value for δ15N calculated for pelagic particulate organic matter at a baseline TP of 1.0. The estimated TEF of 3.0‰ was lower than the most commonly used TEF of 3.4 and 3.8‰ in the literature. The pelagic whales and pelagic invertebrates functional groups tended to have higher trophic positions from Ecopath than from stable isotopes while benthic invertebrate functional groups tended to show an opposite pattern. Trophic positions calculated using the scaled trophic fractionation approach resulted in lower TP than from Ecopath for intermediate TPs and also a larger TP range in the BS. It is concluded that TPs estimated from δ15N values using a linear model compared better to the Ecopath model than the TPs from scaled fractionation approach.
Introduction
Following the introduction of integer trophic levels by Lindeman (1942) and fractional trophic levels by Odum and Heald (1975), the use of trophic levels has developed and it has become a conceptual pillar in ecosystem analysis. Fractional trophic levels have also been termed trophic positions (TP) in the literature (Odum and Heald, 1975; Vander Zanden and Rasmussen, 2001; Hussey et al., 2014a). TP is included in the theoretical basis and calculation of many ecosystem metrics and indicators such as trophic efficiency, transfer efficiency and omnivory index (Shannon et al., 2014). Furthermore, TP is an important predictor of trophic enrichment of pollutants in food webs (Hop et al., 2002; Jæger et al., 2009). TP estimates have been used in analysis of ecosystem structure, effects of harvesting, trophic control mechanisms, and how trophic cascades propagate within an ecosystem (Pauly et al., 1998; Frank et al., 2007). Trophic position estimates may be useful for evaluation of fisheries exploitation and management strategies, and it is important to evaluate methods used to estimate trophic positions and factors affecting uncertainty in these estimates.
Trophic position has been estimated from methods based on body size (Basedow et al., 2010), stomach content (Odum and Heald, 1975), stable isotopes (Hobson and Welch, 1992; Hobson et al., 2002), combination of stable-isotope and body size (Jennings et al., 2008), binary diet matrices (Blanchet et al., 2019) and mass-balance food web models (Polovina, 1985; Christensen, 1995). There are relatively few studies comparing results from different methods, but a common approach to evaluate the parametrization of mass-balance models has been to compare the TPs from the mass-balance models with independent TP estimates from stable isotopes (Kline et al., 1998; Nilsen et al., 2008; Navarro et al., 2011; Du et al., 2020). McCormack et al. (2019) reviewed comparisons of TP estimates from stable isotope (SI) and mass-balance models and suggested that comparison of food web model attributes with measures of stable isotopes composition of taxa, has a potential for improving ecosystem model parameterization.
The use of stable isotopes for estimating TP is based on the assumption of an enrichment (increase) in the heavier 15N isotope relative to the lighter 14N isotope between consumer and food source (Post, 2002). The ratio of stable isotopes of nitrogen (δ15N) may be enriched by about 2 to 4‰ per trophic level and this increase has been termed trophic fractionation, diet–tissue discrimination factor or trophic enrichment factor (TEF) (Post, 2002; Hussey et al., 2014a; Linnebjerg et al., 2016).
Two alternative methods for estimating TP from SIR, fixed fractionation and scaled fractionation, have been applied (Post, 2002; Hussey et al., 2014a). In the fixed fractionation approach, TP can be estimated from stable isotope values (δ15N) from a δ15N baseline value (δ15Nbase) of a group at baseline TP (TPbase) (Table 1). The baseline organism is typically a primary producer, a copepod, or an invertebrate suspension feeder, and a constant trophic enrichment factor (TEF) describes the increase in δ15N per trophic level (Post, 2002) (Eq. 1). This is termed the linear model in this study.
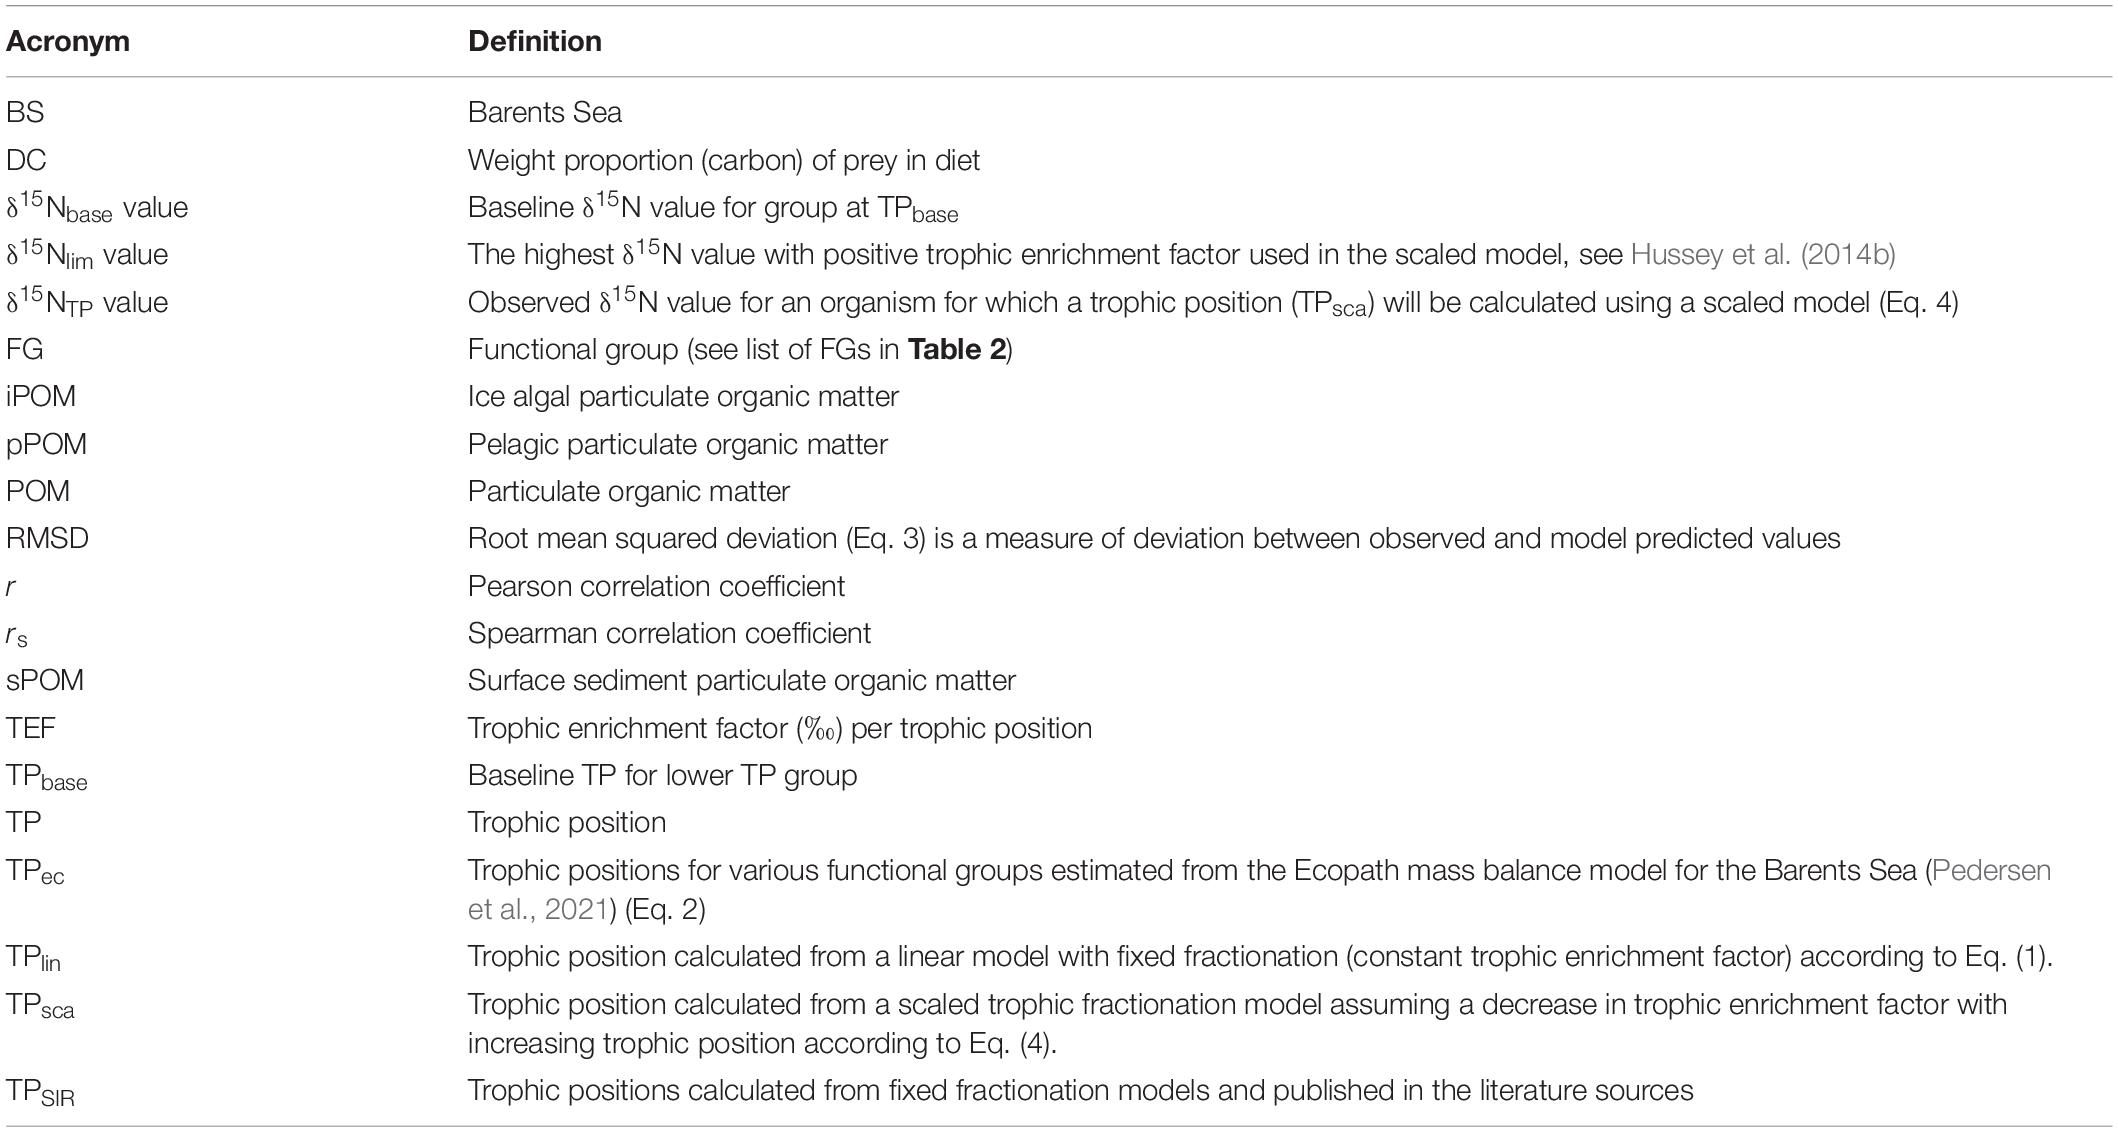
Table 1. Overview of definition of acronyms in alphabetical order.
The choice of baseline organism and baseline trophic position vary between studies (Casey and Post, 2011). In the Barents Sea, several baseline groups and organisms have been selected; pelagic particulate organic matter (pPOM) at TP = 1 and copepods and bivalves at TP = 2 (Hop et al., 2002; Hallanger et al., 2011a; Fuhrmann et al., 2017). Consistent strong spatial gradients in δ15N values of lower trophic level organisms and δ15N baseline values have been observed within the West-Greenland and in the North Sea ecosystems (Jennings et al., 2008; Hansen et al., 2012; MacKenzie et al., 2014). Such spatial gradients in δ15N baseline values (isoscapes) have been used when inferring trophodynamics from stable isotopes (Jennings et al., 2008; MacKenzie et al., 2014), but isoscapes have so far not been established for the Barents Sea. The Barents Sea Large Marine Ecosystem comprise both open water habitat and numerous fjords and these habitats differ with regard to environmental conditions which may influence stable isotope patterns of organisms (Figure 1; Fuhrmann et al., 2017; McGovern et al., 2020).
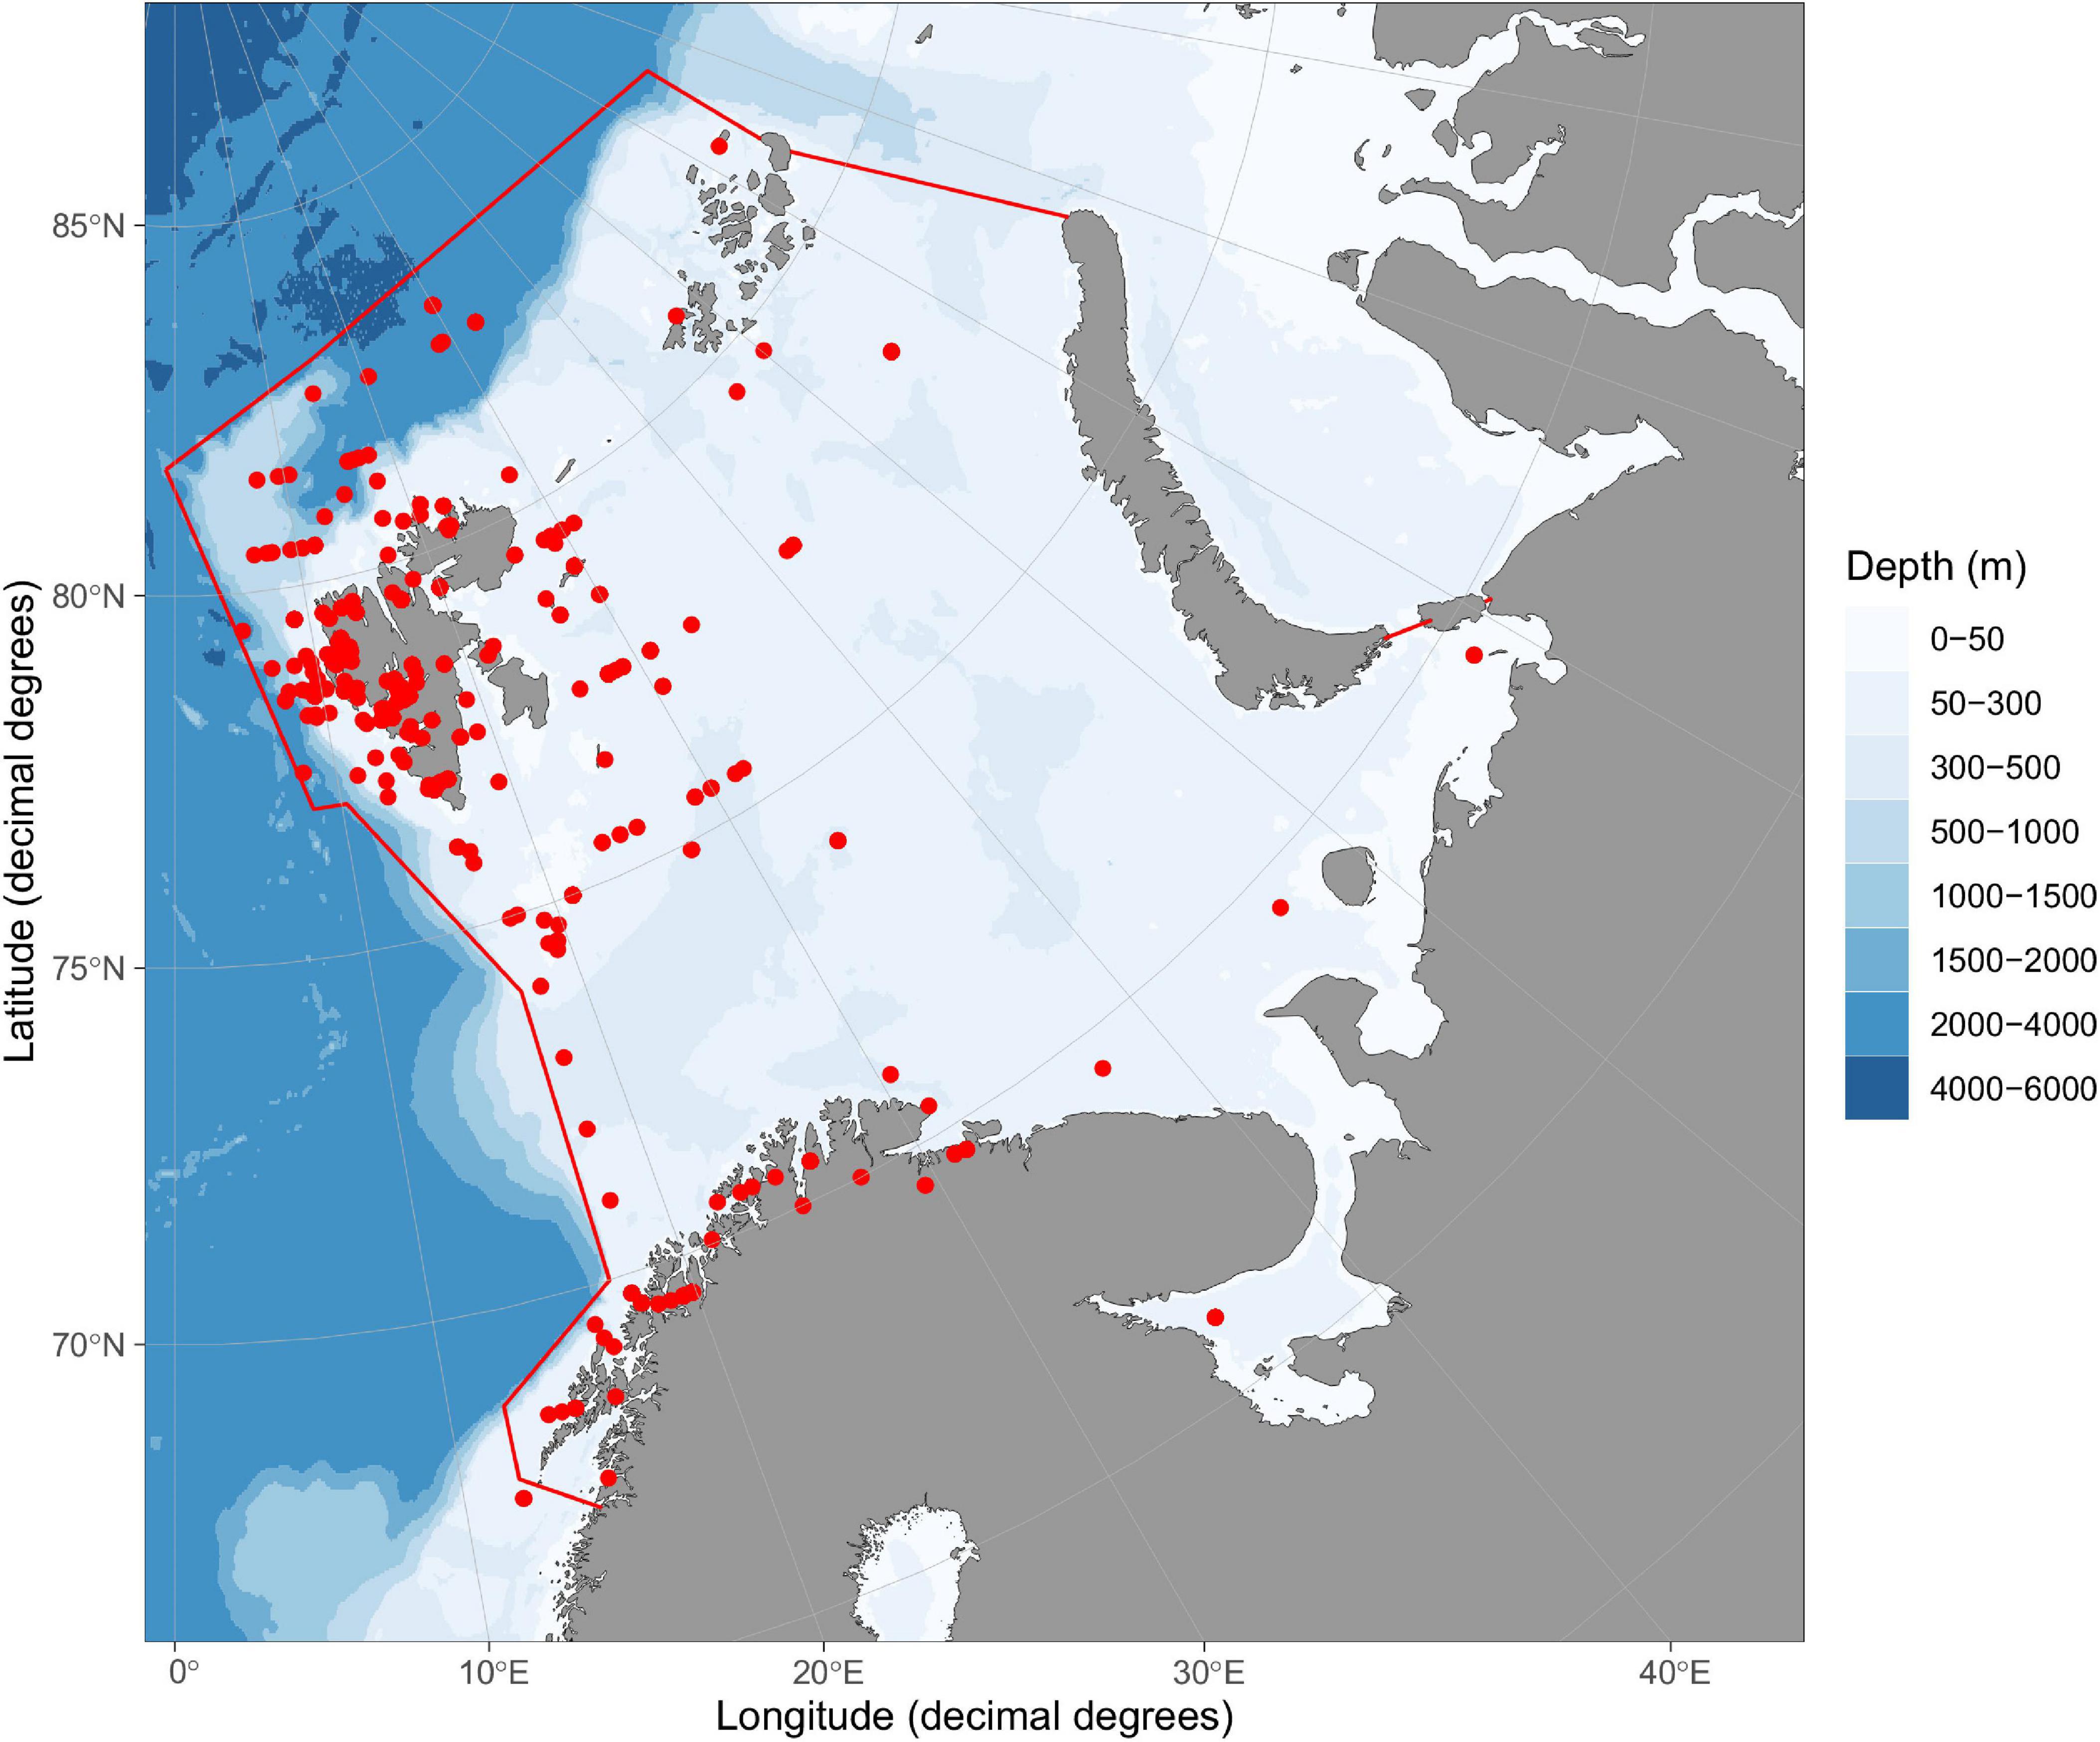
Figure 1. Map of Barents Sea large marine ecosystem. Borders of the ecosystem are shown by red lines based on https://www.pame.is/projects/ecosystem-approach/arctic-large-marine-ecosystems-lme-s. Positions for sampling of data entries are shown by red dots. Map was created using R-package ggOceanMaps (Vihtakari, 2021).
In Arctic marine ecosystems, a TEF in the range 3.4–3.8‰ has been commonly applied to most ecological groups (Hobson et al., 2002; Søreide et al., 2006), but a lower TEF (e.g., 2.4‰) has been applied to some areas and to birds in some studies (Hobson and Clark, 1992; Hop et al., 2002; Hoondert et al., 2021). Experimental studies indicate that TEF may depend on taxonomic class (Caut et al., 2009) and on diet quality, and thus vary between trophic groups such as herbivores, carnivores, and detritivores (McCutchan et al, 2003; Vanderklift and Ponsard, 2003; Martínez del Rio et al., 2009; McMahon et al., 2015). For the BS, it is uncertain if a common TEF for all FGs would be applicable given that there are many taxonomic and functional groups.
The fixed fractionation model (Eq. 1) has been questioned and an alternative scaled fractionation suggested (Hussey et al., 2014a). In the scaled fractionation approach (Hussey et al., 2014a), alternative TP values are calculated assuming that TEF decreases with increasing diet δ15N values resulting in lower δ15N value increments per TP at high δ15N values. Application of the scaled model results in a larger range of TP than assuming a constant TEF (Hussey et al., 2014a). The scaled model has been applied to a cephalopod species in the Barents Sea (Golikov et al., 2019), but it is uncertain how it will perform for other FGs.
Mass-balance models, such as Ecopath, estimate trophic positions of functional groups based on input data on biomass, production per biomass, consumption per biomass, assimilation efficiency, diet, and fisheries catches (Christensen et al., 2005). Ecopath models usually represent an annual average of mass flows in an ecosystem (Christensen et al., 2005). When comparing TPs from mass-balance models and SI, there is a need to match season, space, and ontogeny for the data input for two methods (McCormack et al., 2019). Ontogenetic changes in δ15N values of organisms may coincide with seasonal food-pulses and δ15N values have been found to change with stage or body size in a number of taxa (Jennings et al., 2008; Ramsvatn and Pedersen, 2012; Jennings and Van Der Molen, 2015). When structuring mass-balance models (e.g., Ecopath models) it is common to use size and age structured multi-stanza groups to represent ontogenetic changes in diet composition, TP, growth and mortality rates (Ahrens et al., 2012).
Several mass-balance models with varying functional group resolution has been parametrized for the Barents Sea and Norwegian Sea (Blanchard et al., 2002; Dommasnes et al., 2002; Skaret and Pitcher, 2016; Bentley et al., 2017; Berdnikov et al., 2019; Pedersen et al., 2021), but so far no TP-comparisons between model and stable-isotope data have been performed for the area. For other ecosystems, comparisons between TP estimated from SI and mass-balance models generally show positive correlations between TPs estimated by the two methods (Kline et al., 1998; Milessi et al., 2010; Navarro et al., 2011; McCormack et al., 2019; Hoover et al., 2021). For Ullsfjord, a fjord area at 70°N within the Barents Sea Large Marine Ecosystem (LME), TPs from a mass-balance model and SI have been compared and correlated well (Nilsen et al., 2008). Previous estimates of trophic positions of organisms in the Barents Sea from stable isotopes have been based on various baseline organisms and values for δ15N baseline and trophic enrichment factors. In this study, TPs from a recently developed mass-balance model (Ecopath) for the Barents Sea with high trophic resolution (Pedersen et al., 2021), will be compared with published data on stable isotopes and TP.
The specific aims of this study were to investigate:
(i) If δ15N values for functional groups differ between open water and fjords and change with latitude within the Barents Sea.
(ii) If TPs from the Ecopath model and published TPs from SI correspond.
(iii) If TPs estimated from stable isotope using a fixed fractionation model or a scaled fractionation model show better correspondence to TPs from Ecopath.
(iv) The range of trophic positions in the Barents Sea ecosystem.
Materials and Methods
Study Area
The study area included the Barents Sea Large Marine Ecosystem (BS) and only data sampled from within this area were included (Figure 1). The Barents Sea Large Marine Ecosystem is a shelf-ecosystem (area 2,010,000 km) with an average depth of 230 m and is characterized by inflow of warm nutrient-rich Atlantic water from the southwest (Loeng, 1991; Loeng and Drinkwater, 2007; Skjoldal and Mundy, 2013). In the north and northeast BS, cold Arctic water dominates and BS is partially ice-covered with a seasonal change in ice coverage. Phytoplankton is the dominant primary producer but ice algae are also important in ice-covered waters (Sakshaug et al., 1994). Primary production is highest in the warmer Atlantic ice-free part of the BS. Copepods and krill are major grazers on phytoplankton, and there is a rich and diverse fauna of benthic invertebrates (Jørgensen et al., 2017). Both pelagic and demersal fishes, sea birds, seals, and whales are abundant, and polar bears is present in the northern part of the BS (Sakshaug et al., 1994). There are several distinct carbon flow pathways from lower to higher trophic FGs; the copepod pathway, the krill pathway, the microbial food web pathway, and the benthic invertebrate pathway (Pedersen et al., 2021). The large stocks of planktivorous fishes, e.g., capelin, polar cod, and small herring are major prey sources for whales, seals, birds, and large demersal and benthic fish FGs (Bogstad et al., 2015; Pedersen et al., 2021).
A few studies have reported average SI values, from locations both within and outside BS, and these values were included if there were no statistical significant differences between values within and outside BS. Data from fjord areas within the BS were included.
Mass-Balance Model for the Barents Sea
A trophically highly resolved mass-balance model for the Barents Sea for year 2000 has been developed (Pedersen et al., 2021) and was used to provide model based estimates of TPs. The model comprises 108 functional groups (FGs) (Table 2). Nineteen FGs were multi-stanza FGs, i.e., groups were divided into adult/large and juvenile/small groups with separate input values, diet compositions, and TPs (Table 2). When parametrizing Ecopath mass-balance models, the major input to the mass-balance model are biomass (g C m–2), production/biomass (year–1) and consumption/biomass ratios (year–1), ecotrophic efficiency, proportion of unassimilated food, catches, and diet compositions (Christensen et al., 2005). Ecotrophic efficiency is the proportion of the production of a group that is consumed within the model. Data on biomass were taken from stock assessments for exploited fish and mammal FGs and from literature for other FGs (Pedersen et al., 2021). The Ecopath model is balanced to assure that the production of each FG is sufficient to match the demands from predation, fishery, and other losses. During the balancing process, the initial values of the diet matrix may be modified.
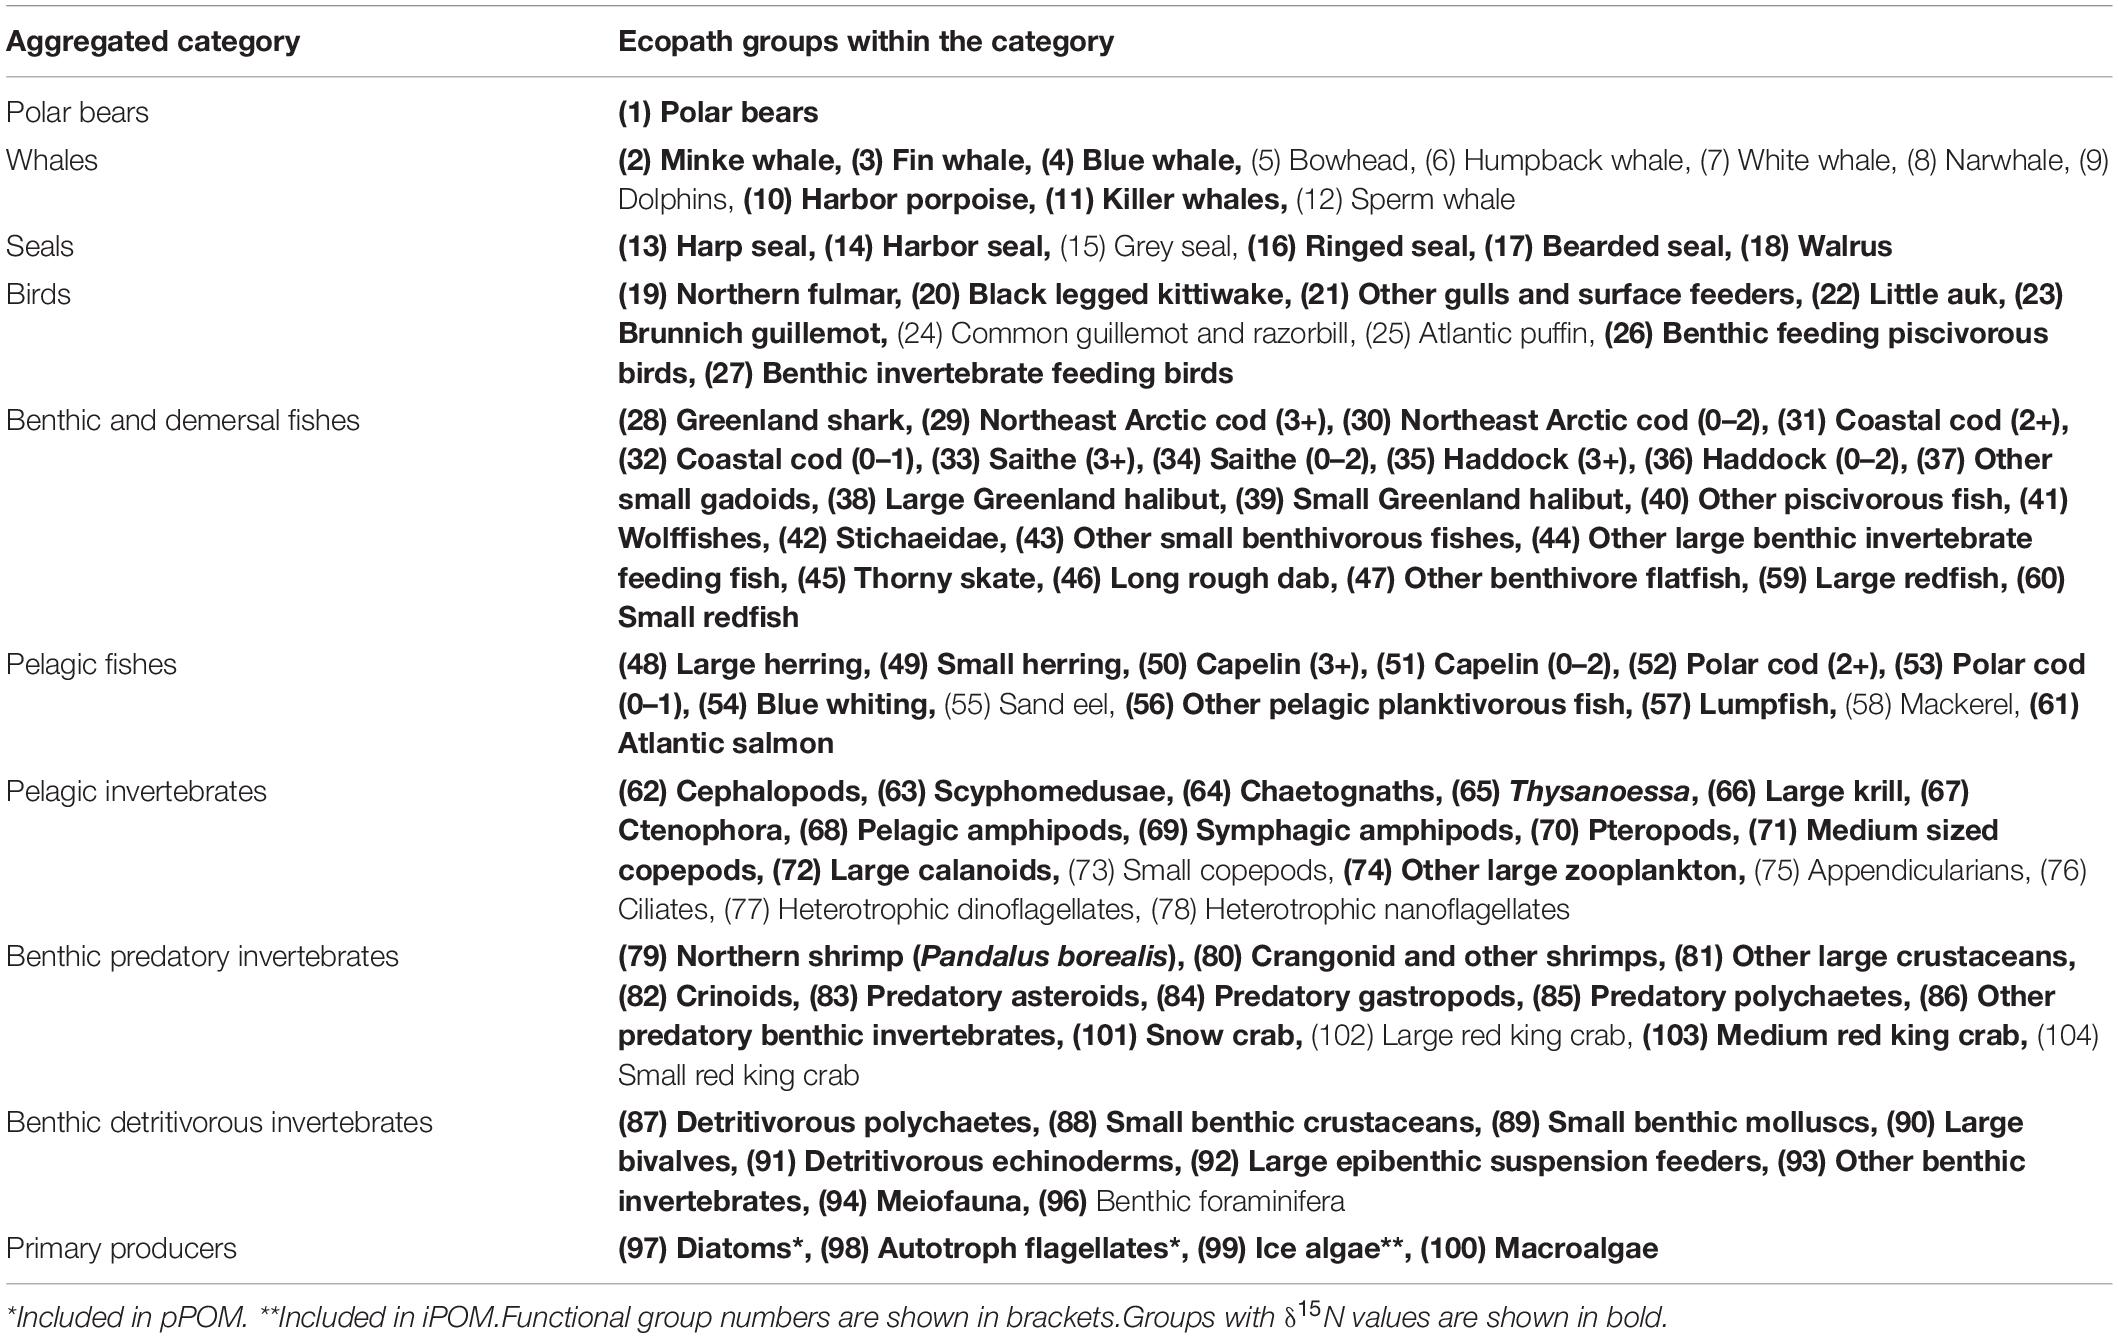
Table 2. Overview of functional groups for which output values from Ecopath were aggregated into major categories.
Ecopath calculates trophic position (TPec) of the FGs and the TPec,j of each predator group j using the equation:
Where DCij is the proportion of prey, i in the diet of predator j, and TPec,i is the trophic position of FG i. In Ecopath it is assumed that all the detritus groups have trophic position 1 (Christensen et al., 2005).
Stable Isotope Data, Sources and Overview
Literature was searched for sources containing δ15N values for organisms and/or trophic position (TPSIR) estimated from δ15N values for the Barents Sea LME area (Figure 1), resulting in a total of 93 sources with data (Supplementary Table 1). The SI-data included values from living groups and on δ15N values from organic matter in surface sediment samples. TP and δ15N values were registered for the lowest taxonomic level reported in the publication and were allocated to FGs that matched the Ecopath functional groups (Table 2).
For each data entry with SI values, the variables registered included: the year or time period and month of sampling, geographical sampling area, location, whether data were sampled in a fjord (binary habitat variable; fjord = 1, open water = 0). Position or geographic range of sampling (latitude and longitude of sampling were registered). The sampling location was registered by entering either the exact latitude and longitude when reported, or the midpoint of the geographical area of sampling represented by the lowest and highest integer latitude and longitude including the sampling area. The species name or higher taxonomic level, or if the sample comprised particulate organic matter (POM) of three categories; pPOM (pelagic particulate organic matter), sPOM (POM from surface sediment), iPOM (ice algal particulate organic matter) was registered. If data on size or stage were available, it was recorded. The entries were allocated to FGs based on the feeding category (i.e., herbivore, detritivorous or predatory), and the number of replicates the δ15N value were based on and the δ15N value were noted (Supplementary Table 2).
To obtain model independent values for TEF that could help to explain deviations from model predicted TPs, literature was searched to obtain estimated values on TEF from experiments and field studies with known diet source for organisms in FGs that are distributed within the BS. It was required that at least the genus of the species is distributed within the BS.
Data Analysis, Trophic Position-Stable Isotope Relationships and Statistical Analysis
Data that were only available in plots were digitized using a digitizer (WebPlotDigitizer1). Data entries represented by average values for δ15N and TPSIR were calculated for given taxa when there were several values for the same taxa, sampling position, and time. Separate data entries were recorded for different sampling positions or sampling times. Values for separate size or stage groups within a taxa, and for various sampling times (seasons), locations, and sampling years were kept in their original format. Data entries were allocated to functional groups (FGs) matching the Ecopath groups based on information from literature (i.e., Kȩdra et al., 2010; Planque et al., 2014; Sokołowski et al., 2014; Jumars et al., 2015; Renaud et al., 2015; Pedersen et al., 2021). Ontogenetic effects are partly included in the Ecopath model by the specification of groups for small and large individuals (multi-stanza FGs) for a number of species; Northeast arctic cod, coastal cod, saithe, haddock, Greenland halibut, redfish, capelin, polar cod and red king crab (Table 2). Data entries were allocated to the multi-stanza FGs based on information about age and body size given in the source. δ15N or TPSIR values reported for broad categories (e.g., “copepods”) that were too broad to match the FGs (e.g., three copepod FGs in the Ecopath model, Table 2) were not included in the further analysis. All taxa names were checked to be in accordance with the accepted names in World Register of Marine Species2 (accessed 20 June 2021) and presently unaccepted names in the original sources were corrected (Supplementary Table 2).
Further analysis of the isotope data were made in several major steps corresponding to the aims (I–IV) given in the introduction. Since the Ecopath mass-balance model give TPs for an average state of the BS ecosystem, the stable isotope data were treated to represent average conditions.
(I) The total data set was unbalanced with regard to geographic position and season of sampling (Figure 1 and Supplementary Table 3). There were few samples from open water in the southern part of the Barents Sea and most samples were taken during the summer months (Figure 1 and Supplementary Table 3). A large proportion (61%) of the total number of δ15N values were from samples taken in fjord habitats. It was considered inappropriate to apply statistical methods that were dependent on balanced designs. For FGs with sufficient number (n > 5) of δ15N values, δ15N values were plotted versus latitude and month-values with different plotting symbols for open water and fjord habitats to assess if there were obvious spatial or seasonal trends. Whether δ15N values were correlated with latitude was examined using the Spearman rank correlation coefficient (rs) applying the cor.test in package stats in R. P-values for multiple tests were adjusted according to Benjamini and Hochberg (1995) using p.adjust in package stats in R. Values deviating more than 3 SD from the mean of the FG were identified as outliers.
The FG mean δ15N values and the difference between the mean-values for fjord and open water habitat for each FG were calculated. Whether the frequency distributions of δ15N values for each habitat (open water or fjord) deviated from normal distributions was examined using Shapiro-Wilks test (shapiro.test in package stats in R), and for distributions not deviating from normality, two-group t-tests with separate variances were applied to test if the mean were equal in fjords and open-water habitats. For groups where δ15N values from at least one habitat deviated from normality, a two-sample non-parametric Mann–Whitney test was applied to test if central tendency differed for δ15N values between habitats.
(II) Average δ15N and TP values were calculated for each FG with values on δ15N and/or trophic position value from stable isotopes given in literature sources (TPSIR), For FGs with only one δ15N and TPSIR value, this value was used to represent the FG. A total of 83 and 65 FGs had δ15N and TPSIR values, respectively. In addition to the living functional groups, values of δ15N measured from sediment sampled particulate organic matter (sPOM) were entered as representative for the FG “detritus from other sources” which is a functional group in Ecopath and a major food source for benthic detritivorous invertebrates and bacteria.
Values of TPec and TPSIR were compared in bi-scatter plots and the Pearson correlation coefficient was estimated. TPec and TPSIR values for each FG were compared and whether there was a significant difference between TPec and TPSIR was examined using a Wilcoxon two-sample paired sample test (Zar, 1999). The significance level was set to 5% in all statistical tests.
The root mean squared deviation (RSMD) (Piñeiro et al., 2008), represent the mean deviation of model predicted TP values (ypi) with respect to the observed ones here taken as TPec (yoi = TPec).
where n is the number of pairs of observed and predicted values. RMSD has unit trophic position and lower RMSD values indicate better fit of model predictions to observations than do higher RMSD values.
(III) Since there is a range of possible TEF values, a linear best-fit model was estimated to represent the average relationship between TP and δ15N values. The model was fitted to two alternative sets of data; (i) from open water and fjord habitat, and (ii) from only open water data. This was chosen because open water represent the majority of the area in the BS and because most of the Ecopath background data is from open water. The model estimated TEF by minimizing the sum of squared differences between values for TPec and TP predicted from δ15N values (TPlin) using Eq. (1). The baseline TP was set to 1.0 and the δ15N baseline value was set to the average δ15N value for pPOM representing phytoplankton which is the dominating primary producer in BS (Sakshaug et al., 1994). The model was fitted to the data (TPec and the average δ15N values for each FG) applying the nls function with least-squares estimation in package stats in R. The values for TPbase and δ15Nbase were kept fixed during the estimation.
Pelagic particulate organic matter-samples may contain heterotrophic organisms such as bacteria and protozoa in addition to phytoplankton (Stowasser et al., 2012), and the effects of choosing an alternative TPbase of 1.2 in the linear best-fit model for data from both open water and fjord habitats were tested.
A scaled model for calculating TP was based on the description by Hussey et al. (2014a,b) (Eq. 4). The scaled model requires that a primary consumer (base) is selected with its δ15N value (δ15Nbase value) and its trophic position (TPbase). The TP (TPsca) of an organism with known δ15N value (δ15NTP) can then be calculated
where
and
The approach adapted to Arctic ecosystems by Linnebjerg et al. (2016) and Golikov et al. (2019) was followed and δ15Nbase was set to the δ15N value of 7.20‰ for Calanus glacialis in the Barents Sea and assuming TPbase to be 2.0. β0 and β1 are coefficients used to calculate δ15Nlim which is the highest δ15N value with positive TEF. The values of β0 (5.92) and β1 (−0.27) were estimated in a meta-analysis by Hussey et al. (2014a). In this study, TPsca values were calculated for individual δ15N values at the data entry level before average TPsca values were calculated for each FG.
The residual TPs (TPec–TPlin) from the linear best-fit model and the deviations (TPec–TPsca) for the scaled model (Eqs 2 and 3) for the 83 FGs were calculated and inspected visually in plots. RMSD (Eq. 3) was calculated taking TPec as observed and TPlin or TPsca as predicted values. The 83 FGs were aggregated into 10 categories (Table 2) based on previous assignment of functional groups into aggregated categories in the Ecopath model (Pedersen et al., 2021) and TP residuals for FGs were plotted in box plots. Whether residuals differed significantly between FGs of these aggregated categories was examined using a Kruskal–Wallis test (Zar, 1999). Polar bears were not included in this test since the test needs more than one value in each category.
(IV) Maximum TP of FGs for the various methods were recorded to indicate range of TP for the BS ecosystem.
Results
Overview
A total of 83 functional groups of organisms had a total of 1,832 δ15N values. The number of δ15N values per FG varied from 1 to 126 (Table 2 and Supplementary Table 4). Many of the δ15N values had not been used to calculate TPSIR values in the original sources and 759 TPSIR values from 65 functional groups were published in the original sources. In addition, the material included a total of 87 δ15N values from samples of sediment organic matter (sPOM) (Supplementary Table 3).
Latitude and Habitat Effects
For δ15N values from both habitats and including pPOM, iPOM and sPOM, δ15N values and latitude were significantly correlated for few (12%) FGs (Supplementary Table 5), with negative correlations for large bivalves (rs = −0.32, n = 113; p = 0.009), large suspension feeders (rs = −0.66, n = 23; p = 0.009) and polar cod (age 2+) (rs = −0.70, n = 15; p = 0.04). For data from only open water, no FGs had significant correlations between δ15N values and latitude (Supplementary Table 5).
A large majority, with 22 of 26 of the living FGs with sufficient number of δ15N values to compare (n for both habitats > 5), had higher mean δ15N values in open water than in fjord habitat (Supplementary Table 5). The proportion of the FGs with higher δ15N values in open water than in fjords was 85% and the median δ15N values of the FGs were higher for open water than for fjord habitat (Wilcoxon two-sample paired-samples test; p = 0.001). Tests for equality between δ15N values in fjord or open water habitat within separate FGs in normally distributed groups (mean) or for groups deviating from normal distributions (central tendency) showed significantly lower δ15N values in fjord habitat for sPOM (Supplementary Table 5). Average sPOM and pPOM δ15N values were 1.1 and 1.5‰ lower in fjords than for open water, respectively (Supplementary Table 5). Both sPOM and pPOM had largest variability in some Svalbard fjords at 77–80°N (Supplementary Figure 1). Detrivorous echinoderms and small benthic mollusks also showed significant habitat differences with δ15N values that were 1.3 to 2.0‰ lower in fjords than in open water (Supplementary Table 5).
Benthic predatory invertebrate FGs, other small benthivorous fishes, and Stichaeidae had δ15N values that were 0.3 to 2.0‰ lower in fjords than in open water, but the differences were not significant for single FGs (Supplementary Table 5). For pelagic invertebrates and fish groups, the δ15N values did not differ significantly between the open water and fjord habitat (Supplementary Table 5).
δ15N values from the methane seep areas in the western part of the BS were included in the material (Åström et al., 2019; Supplementary Table 1) and, among the taxa sampled, the chemosymbiotic polychaetes Siboglinidae had low deviating δ15N values in the range of – 3.7 to 4.5‰ (Åström et al., 2019). Some deviating low δ15N values for pPOM and some benthic invertebrates from a spring bloom situation were observed in the data set (Silberberger et al., 2018; Supplementary Table 1) from the Vesterålen area (68oN) (Silberberger et al., 2018; Supplementary Figure 1). The values above were included in the analysis.
Comparison of Trophic Position From Ecopath and From Isotopes
On average, TPec was slightly higher than the original TPSIR reported in the literature sources with an average pairwise difference of 0.10 TL (Supplementary Table 4), but the difference was not significant (Wilcoxon two-sample paired test, n = 65; p = 0.07). TPec were strongly positively correlated with the original TPSIR values in the papers (r = 0.89; p < 0.0001, n = 65) (Figure 2). RMSD was 0.4 TP (Table 3).
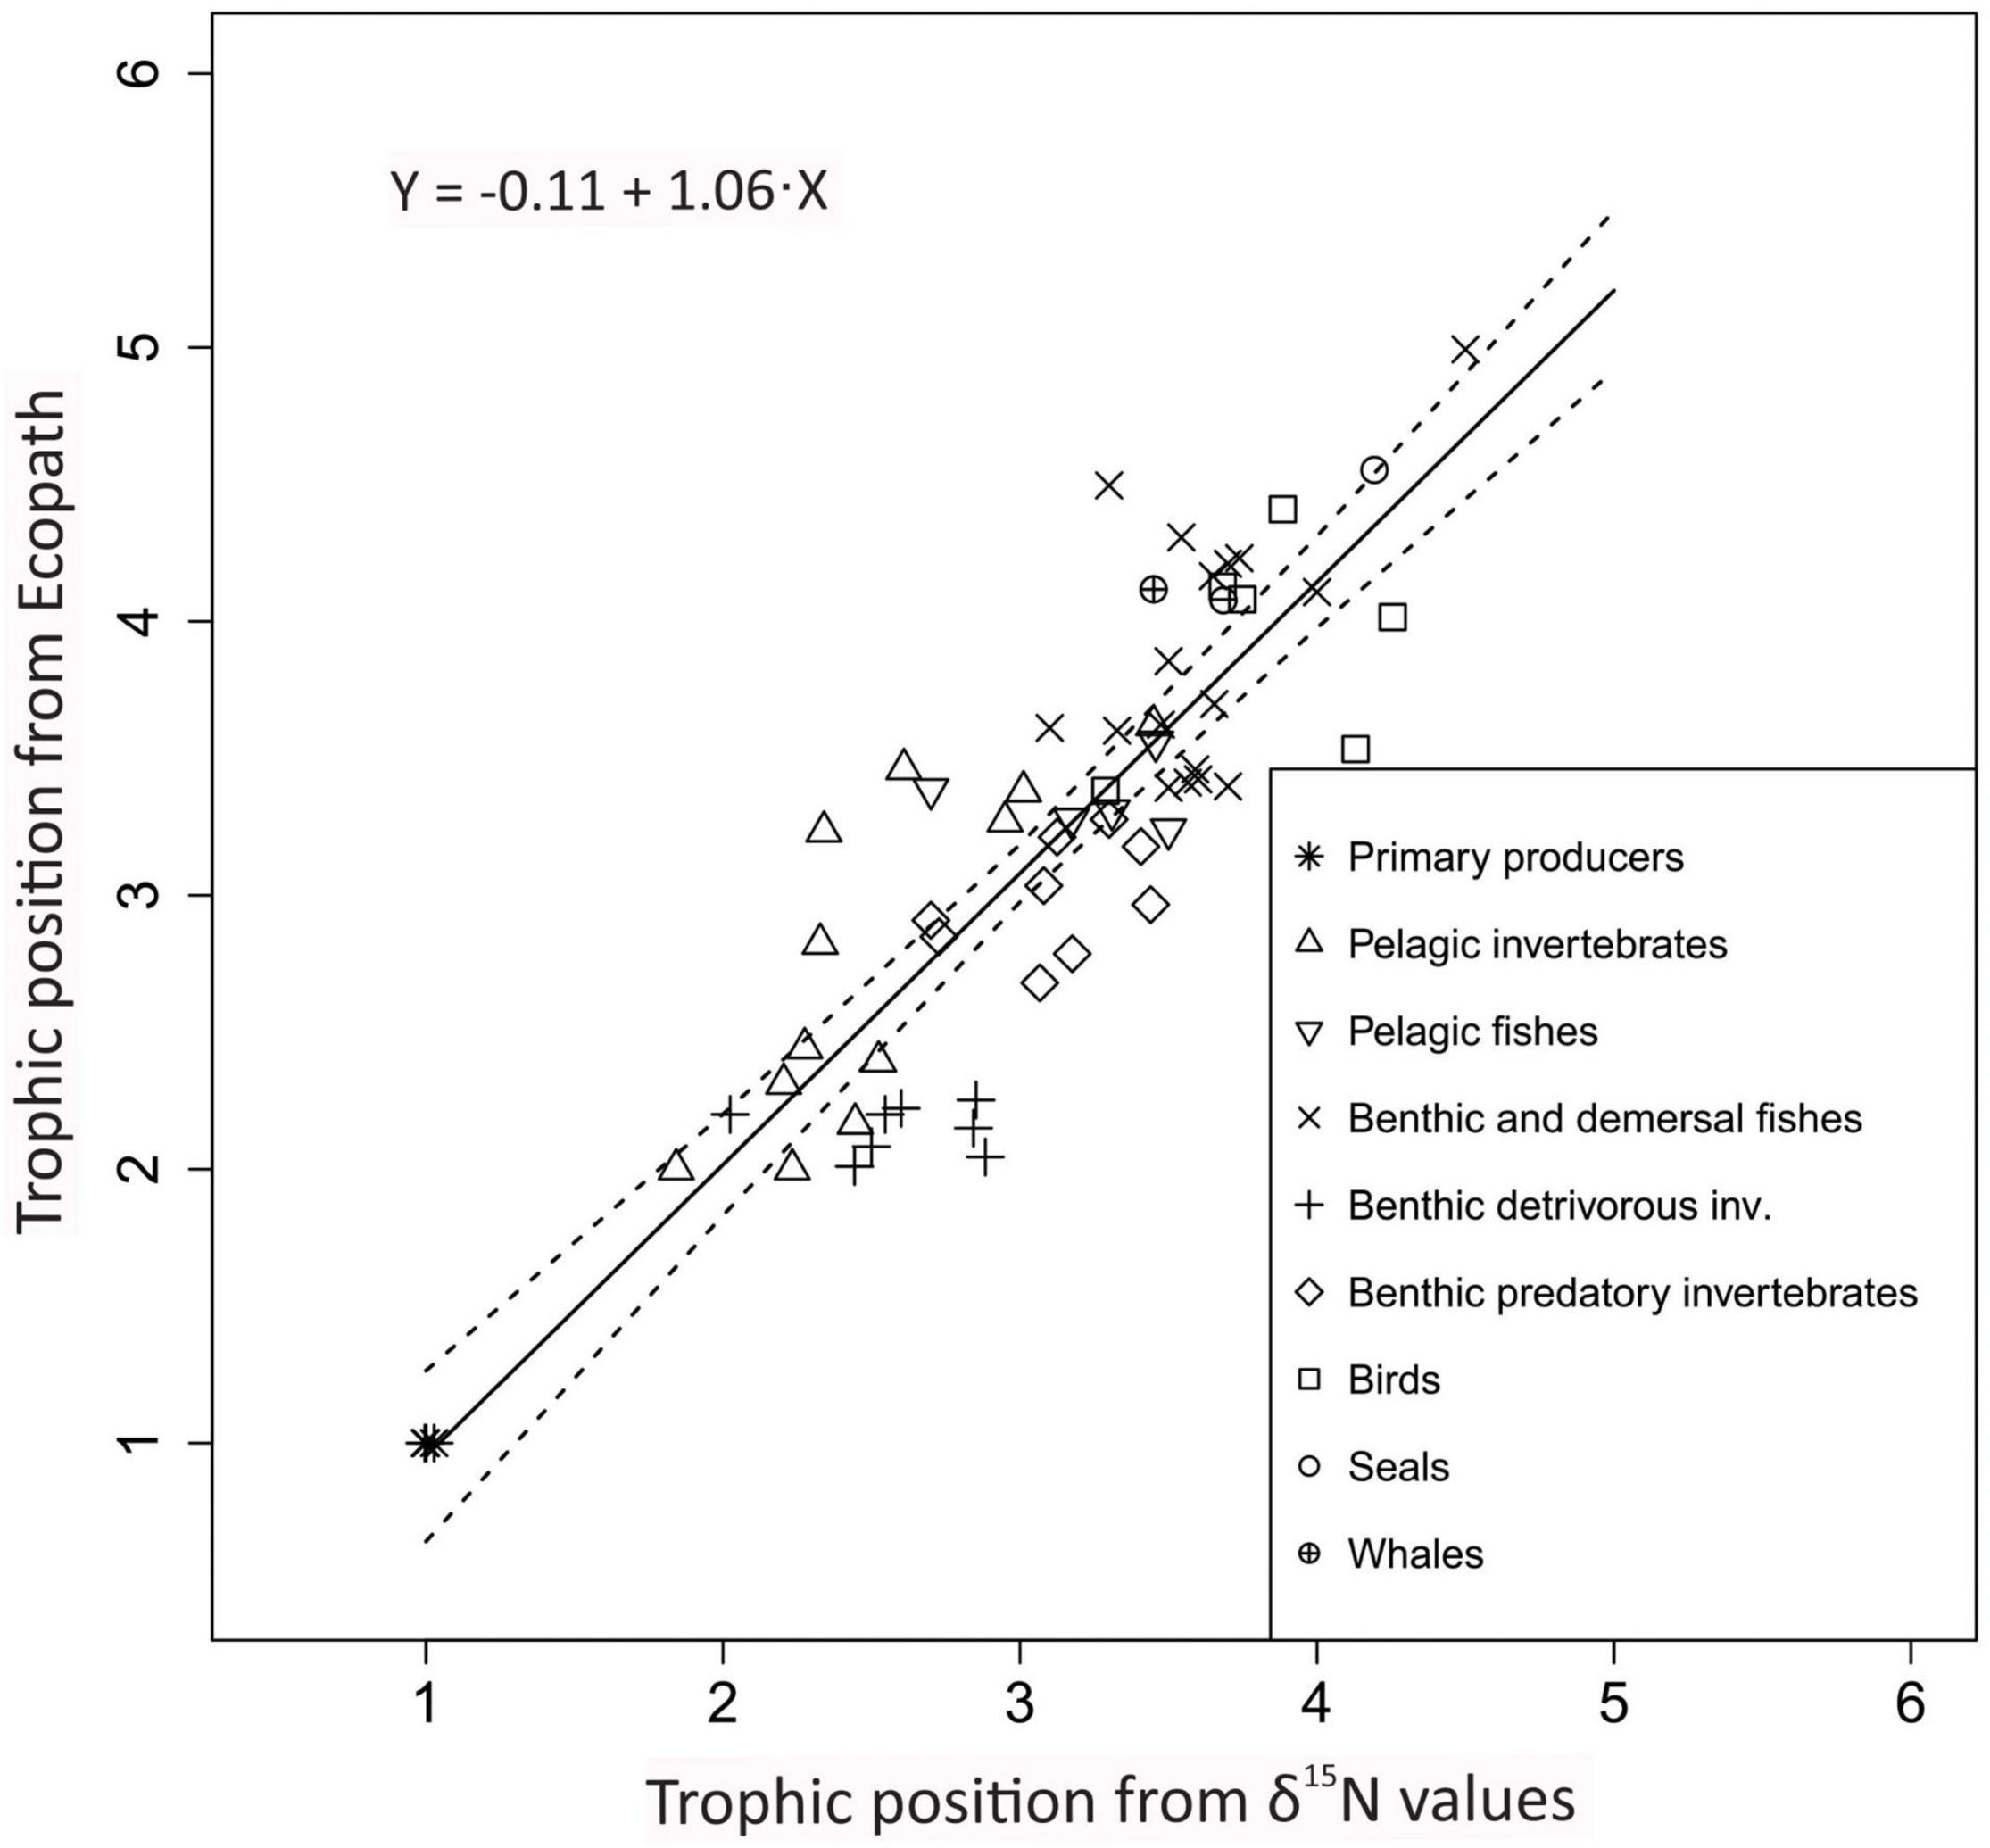
Figure 2. Comparison of trophic positions estimated through Ecopath (y-axis) and average trophic positions for each functional group (x-axis) from stable isotopes (TPSIR) based on TP values reported in the literature sources. Symbols are shown for aggregated categories. Continuous line shows linear regression line and stippled lines show 95% confidence intervals.
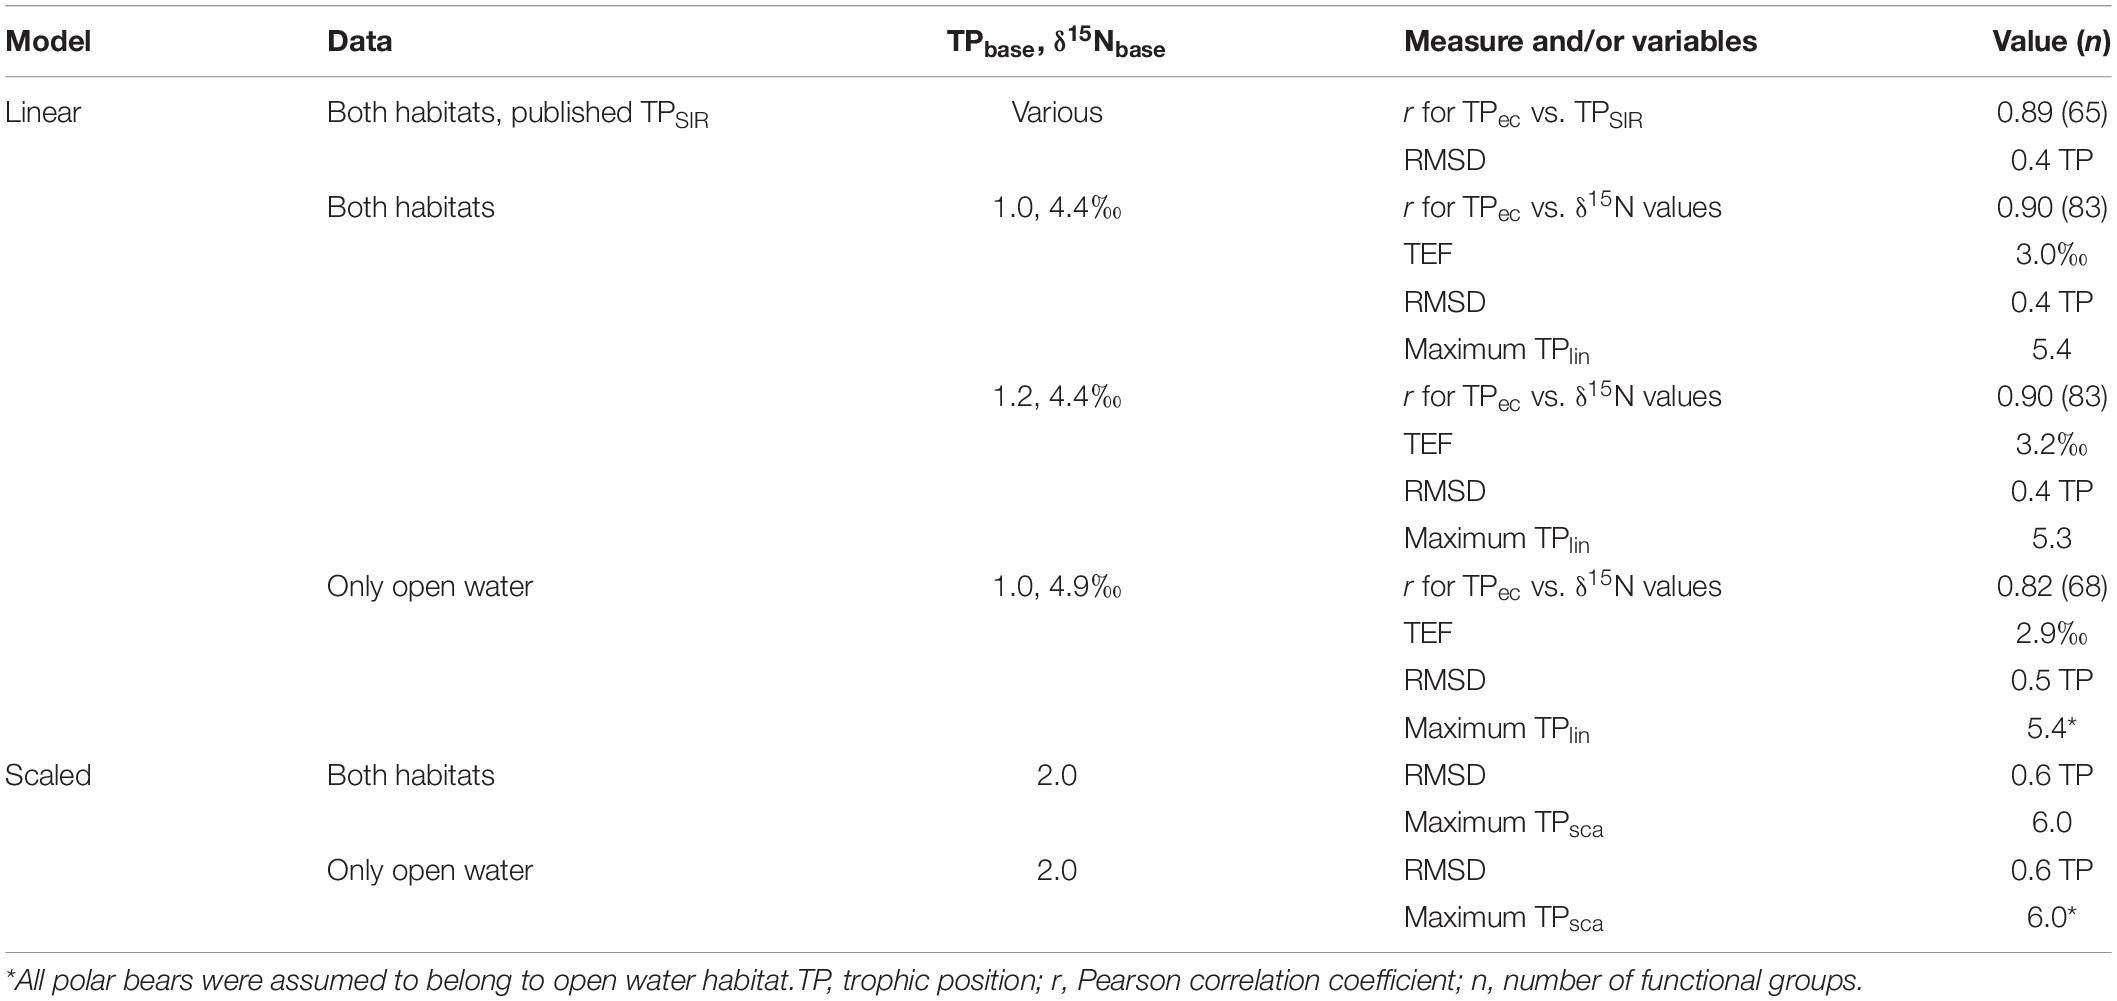
Table 3. Overview of major results from comparison of trophic positions from Ecopath and calculation of trophic positions using fixed fractionation (linear model) and scaled fractionation.
On the FG level and for data pooled from both habitats, TPec was strongly positively correlated with FG mean δ15N values (r = 0.90, n = 83) (Figure 3A and Supplementary Figure 2). The average δ15N values for the three primary producer FGs were similar: phytoplankton (pPOM) (4.4‰, SD = 2.0, n = 78), ice algae (iPOM) (4.2‰, SD = 1.4, n = 24) and macroalgae (4.6‰, SD = 1.2, n = 63) (Supplementary Table 4). The average δ15N value of sPOM (av. 5.0‰, SD = 1.7, n = 87) was also similar to the values for the primary producers.
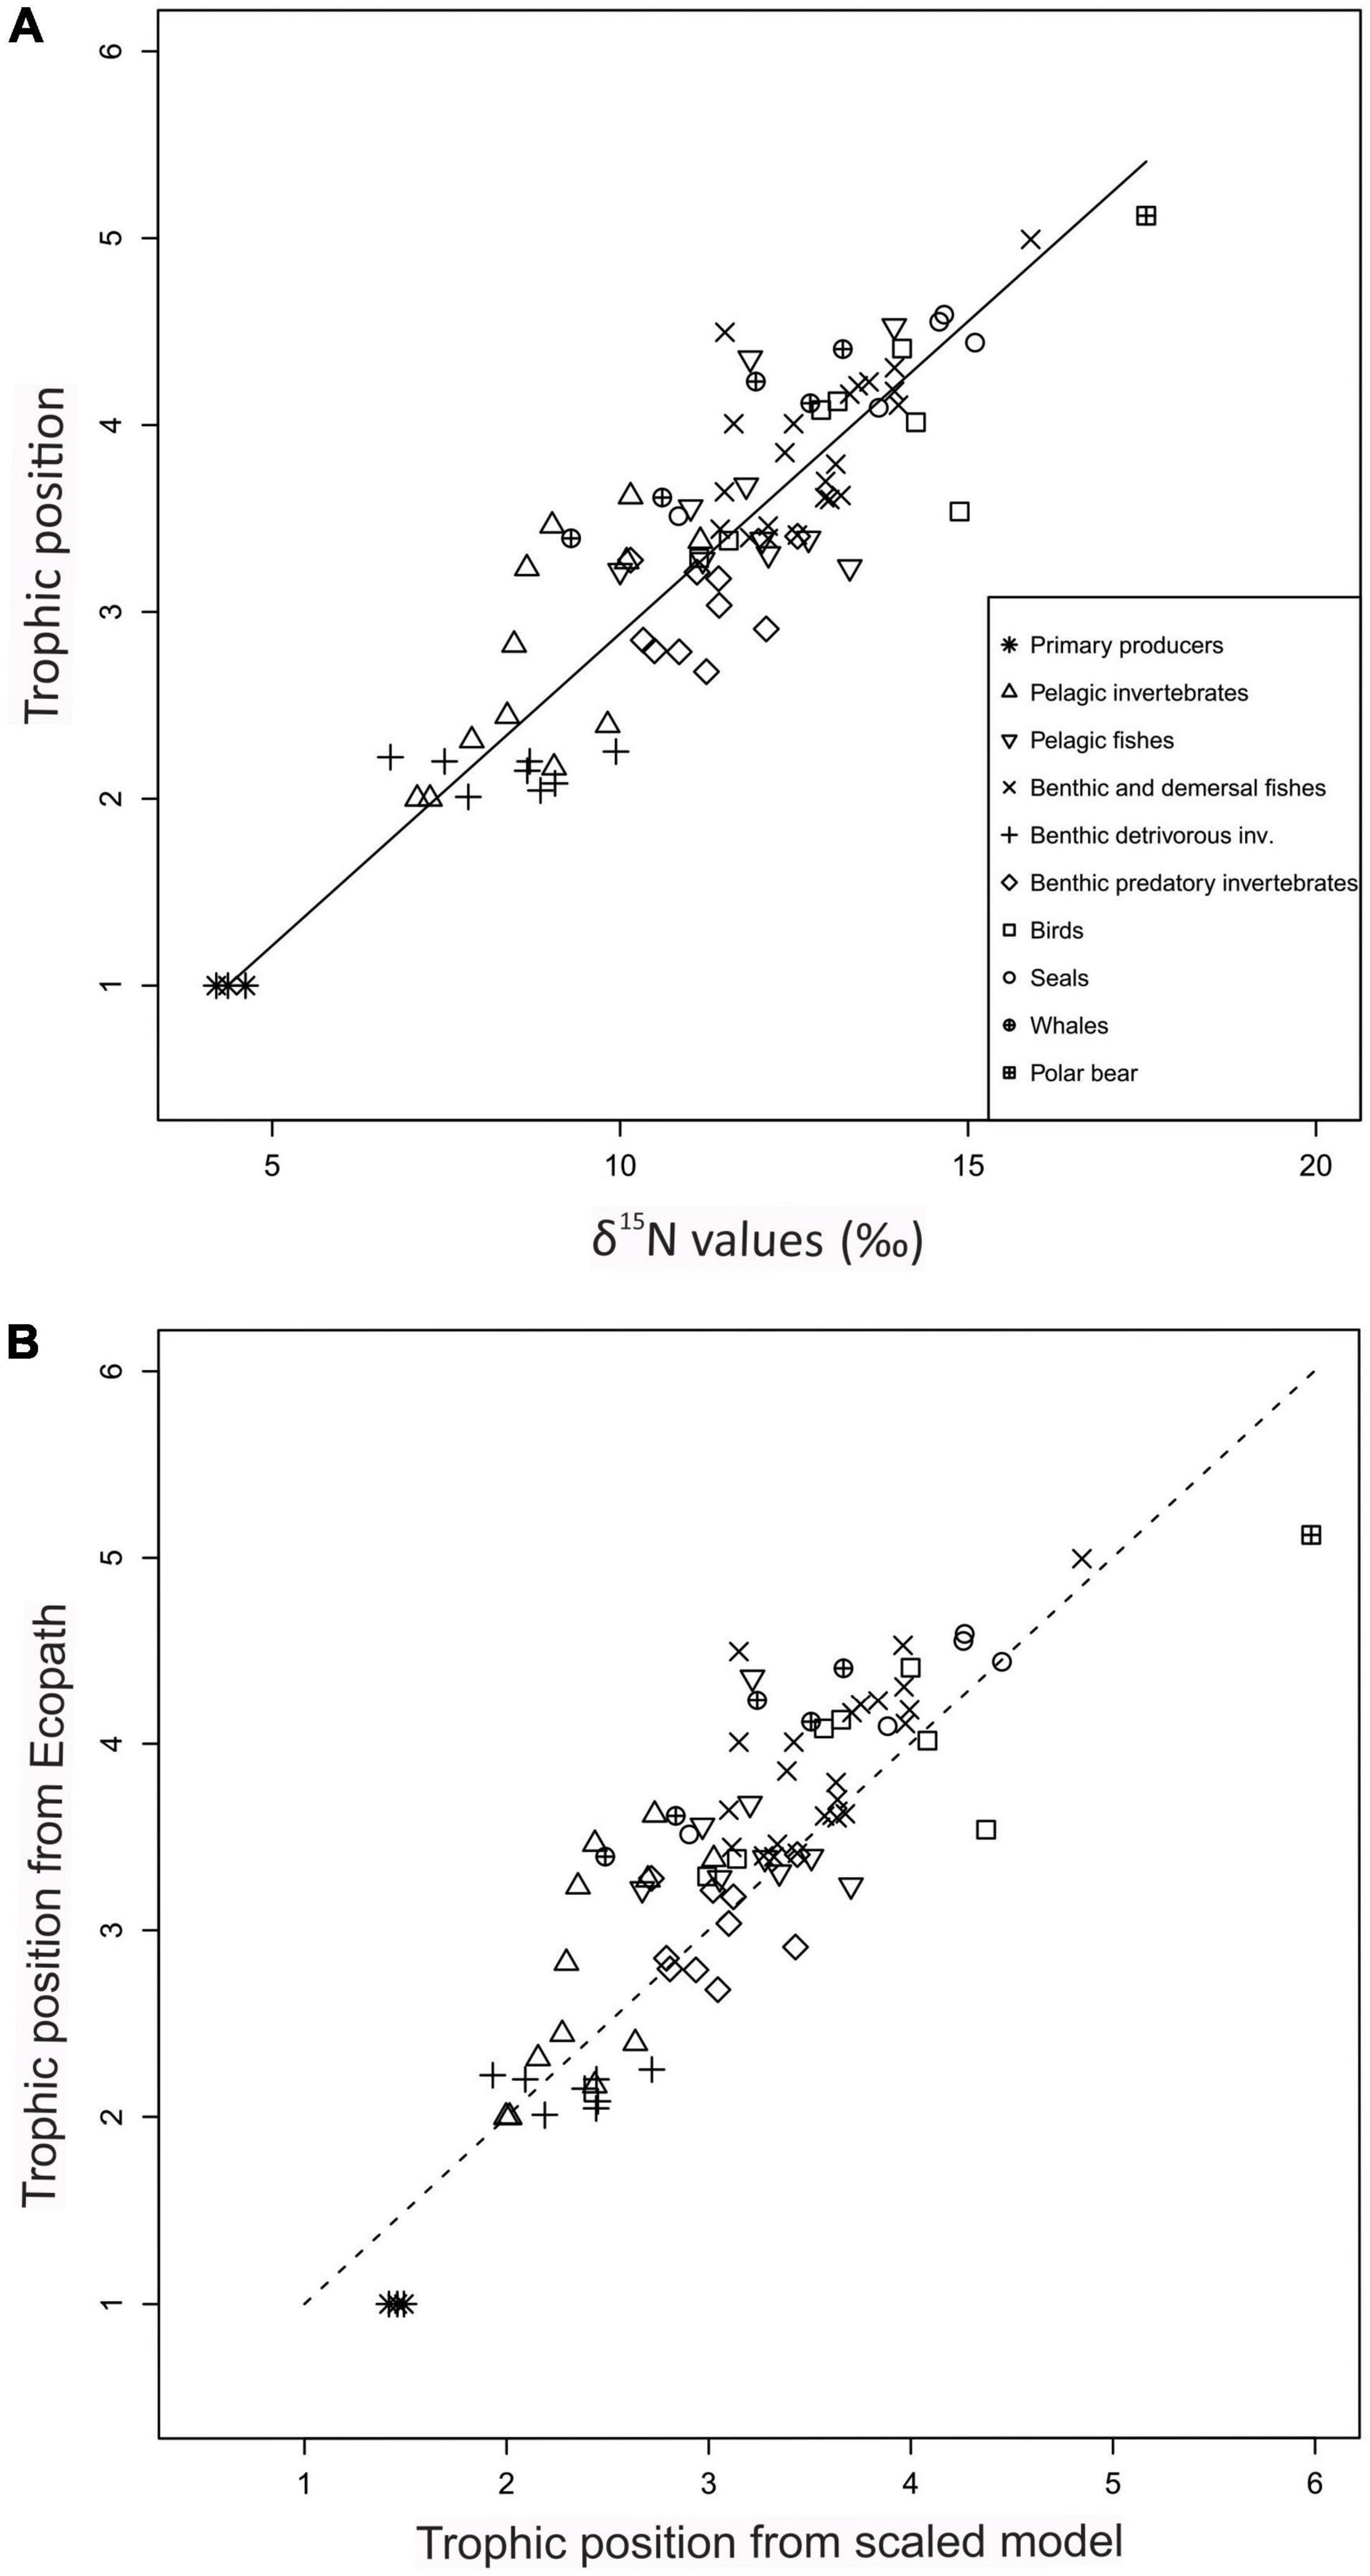
Figure 3. Relationship between trophic positions estimated from Ecopath (y-axis) and from alternative models (linear and scaled) from δ15N values for 83 functional groups (x-axis) for the Barents Sea for both open water and fjord habitats. Symbols show FGs in major categories. (A) Trophic position estimated from Ecopath (y-axis) and line shows trophic positions predicted by linear best-fit model from δ15N values (x-axis) [TPlin = 1 + (δ15N + 4.4)/3.0]. (B) Trophic position from Ecopath (TPec, y-axis) and trophic position estimated by scaled model (TPsca) from δ15N values (Eq. 3, x-axis) for functional groups. Stippled line show (1:1) line. In the scaled model, baseline TP (TPbase) was 2.0 and baseline δ15N value (δ15Nbase) was set to 7.2‰.
The δ15N value of 4.4‰ for pPOM was chosen as δ15N baseline at TP of 1.0 for the linear best-fit model since phytoplankton is the major primary producer FG in the ecosystem (Sakshaug et al., 1994). The fit of the linear model for both open water and fjord data (TPlin = 1 + (δ15N – 4.4)/TEF), resulted in a TEF of 3.0‰ (95% CI 2.9, 3.1). RMSD was 0.4 TP (Table 3). The TEF from the linear best-fit model was within the range of 2.7 to 3.8‰ published for the BS ecosystem (Supplementary Table 6) (Figure 4). The linear best-fit model was intermediate compared to published linear TP-SI models for BS that were based on various values for TPbase (1, 2, or 3), δ15Nbase values, and TEF values (Figure 4).
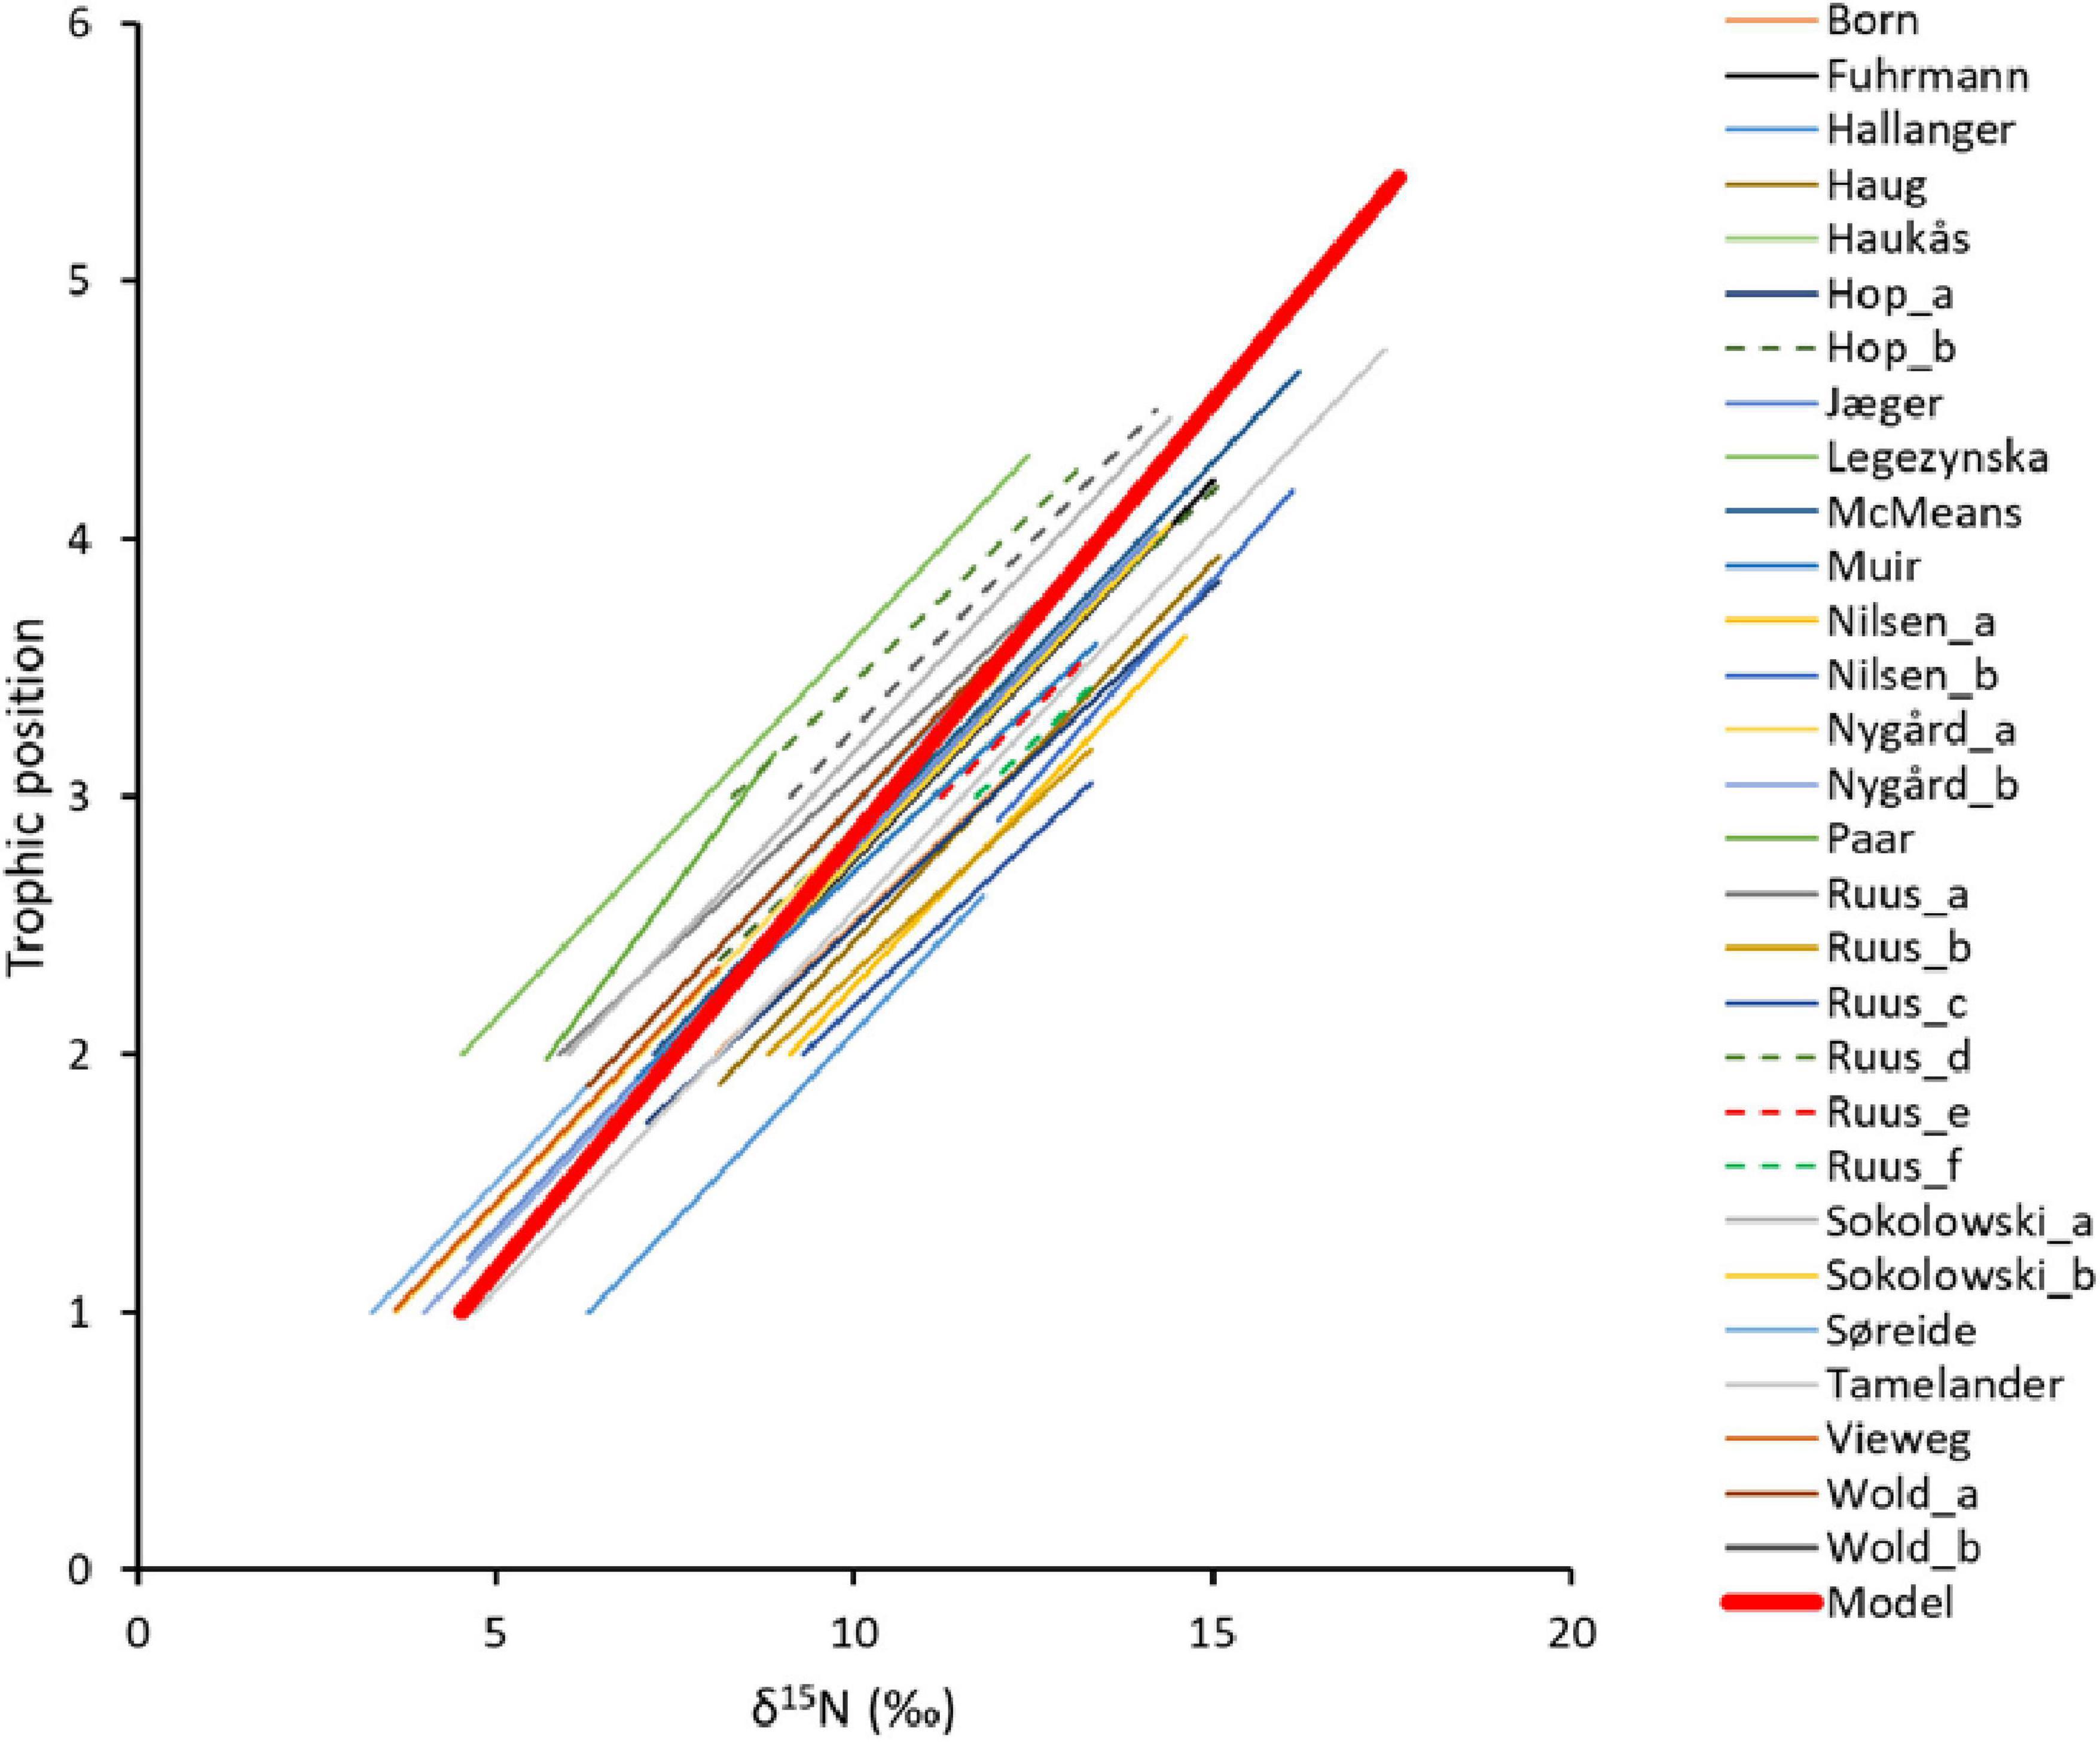
Figure 4. Comparison of 29 published linear relationships between trophic positions (TP) and δ15N values from literature from the Barents Sea Large Marine Ecosystem. Red bold line show the linear best-fit model for the TP- δ15N value relationship estimated in this study for all habitats. The linear best-fit relationship had a δ15Nbase value of 4.4‰ for TPbase = 1 and a TEF of 3.0‰. Values for the published SI-TP relationships are given in Supplementary Table 6. Sources for short-names in the figure legend; Born (Born et al., 2003), Fuhrmann (Fuhrmann et al., 2017), Hallanger (Hallanger et al., 2011b), Haug (Haug et al., 2017), Haukås (Haukås et al., 2007), Hop a and b (Hop et al., 2002), Jæger (Jæger et al., 2009), Legeżyńska (Legeżyńska et al., 2012), McMeans (McMeans et al., 2013), Muir (Muir et al., 2003), Nilsen a and b (Nilsen et al., 2008), Nygård a and b (Nygård et al., 2012), Paar (Paar et al., 2019), Ruus a–f (Ruus et al., 2015), Sokołowski a and b (Sokołowski et al., 2014), Tamelander (Tamelander et al., 2006), Vieweg (Vieweg et al., 2012), Wold a and b (Wold et al., 2011).
For the linear model for both open water and fjord data, the median of the residuals for TP of FGs (Polar bears was not included) differed significantly between aggregated categories (Kruskal–Wallis, χ2 = 21.8, df = 8; p = 0.005) (Figure 5). Whales and the pelagic invertebrate FGs had predominantly positive residuals (TPlin < TPec) while the benthic detritivorous- and predatory invertebrate FGs had predominantly negative residuals (TPlin > TPec) (Figure 5). Seals, birds, benthic, demersal, and pelagic fish FGs had residuals centered approximately around zero (Figure 5).
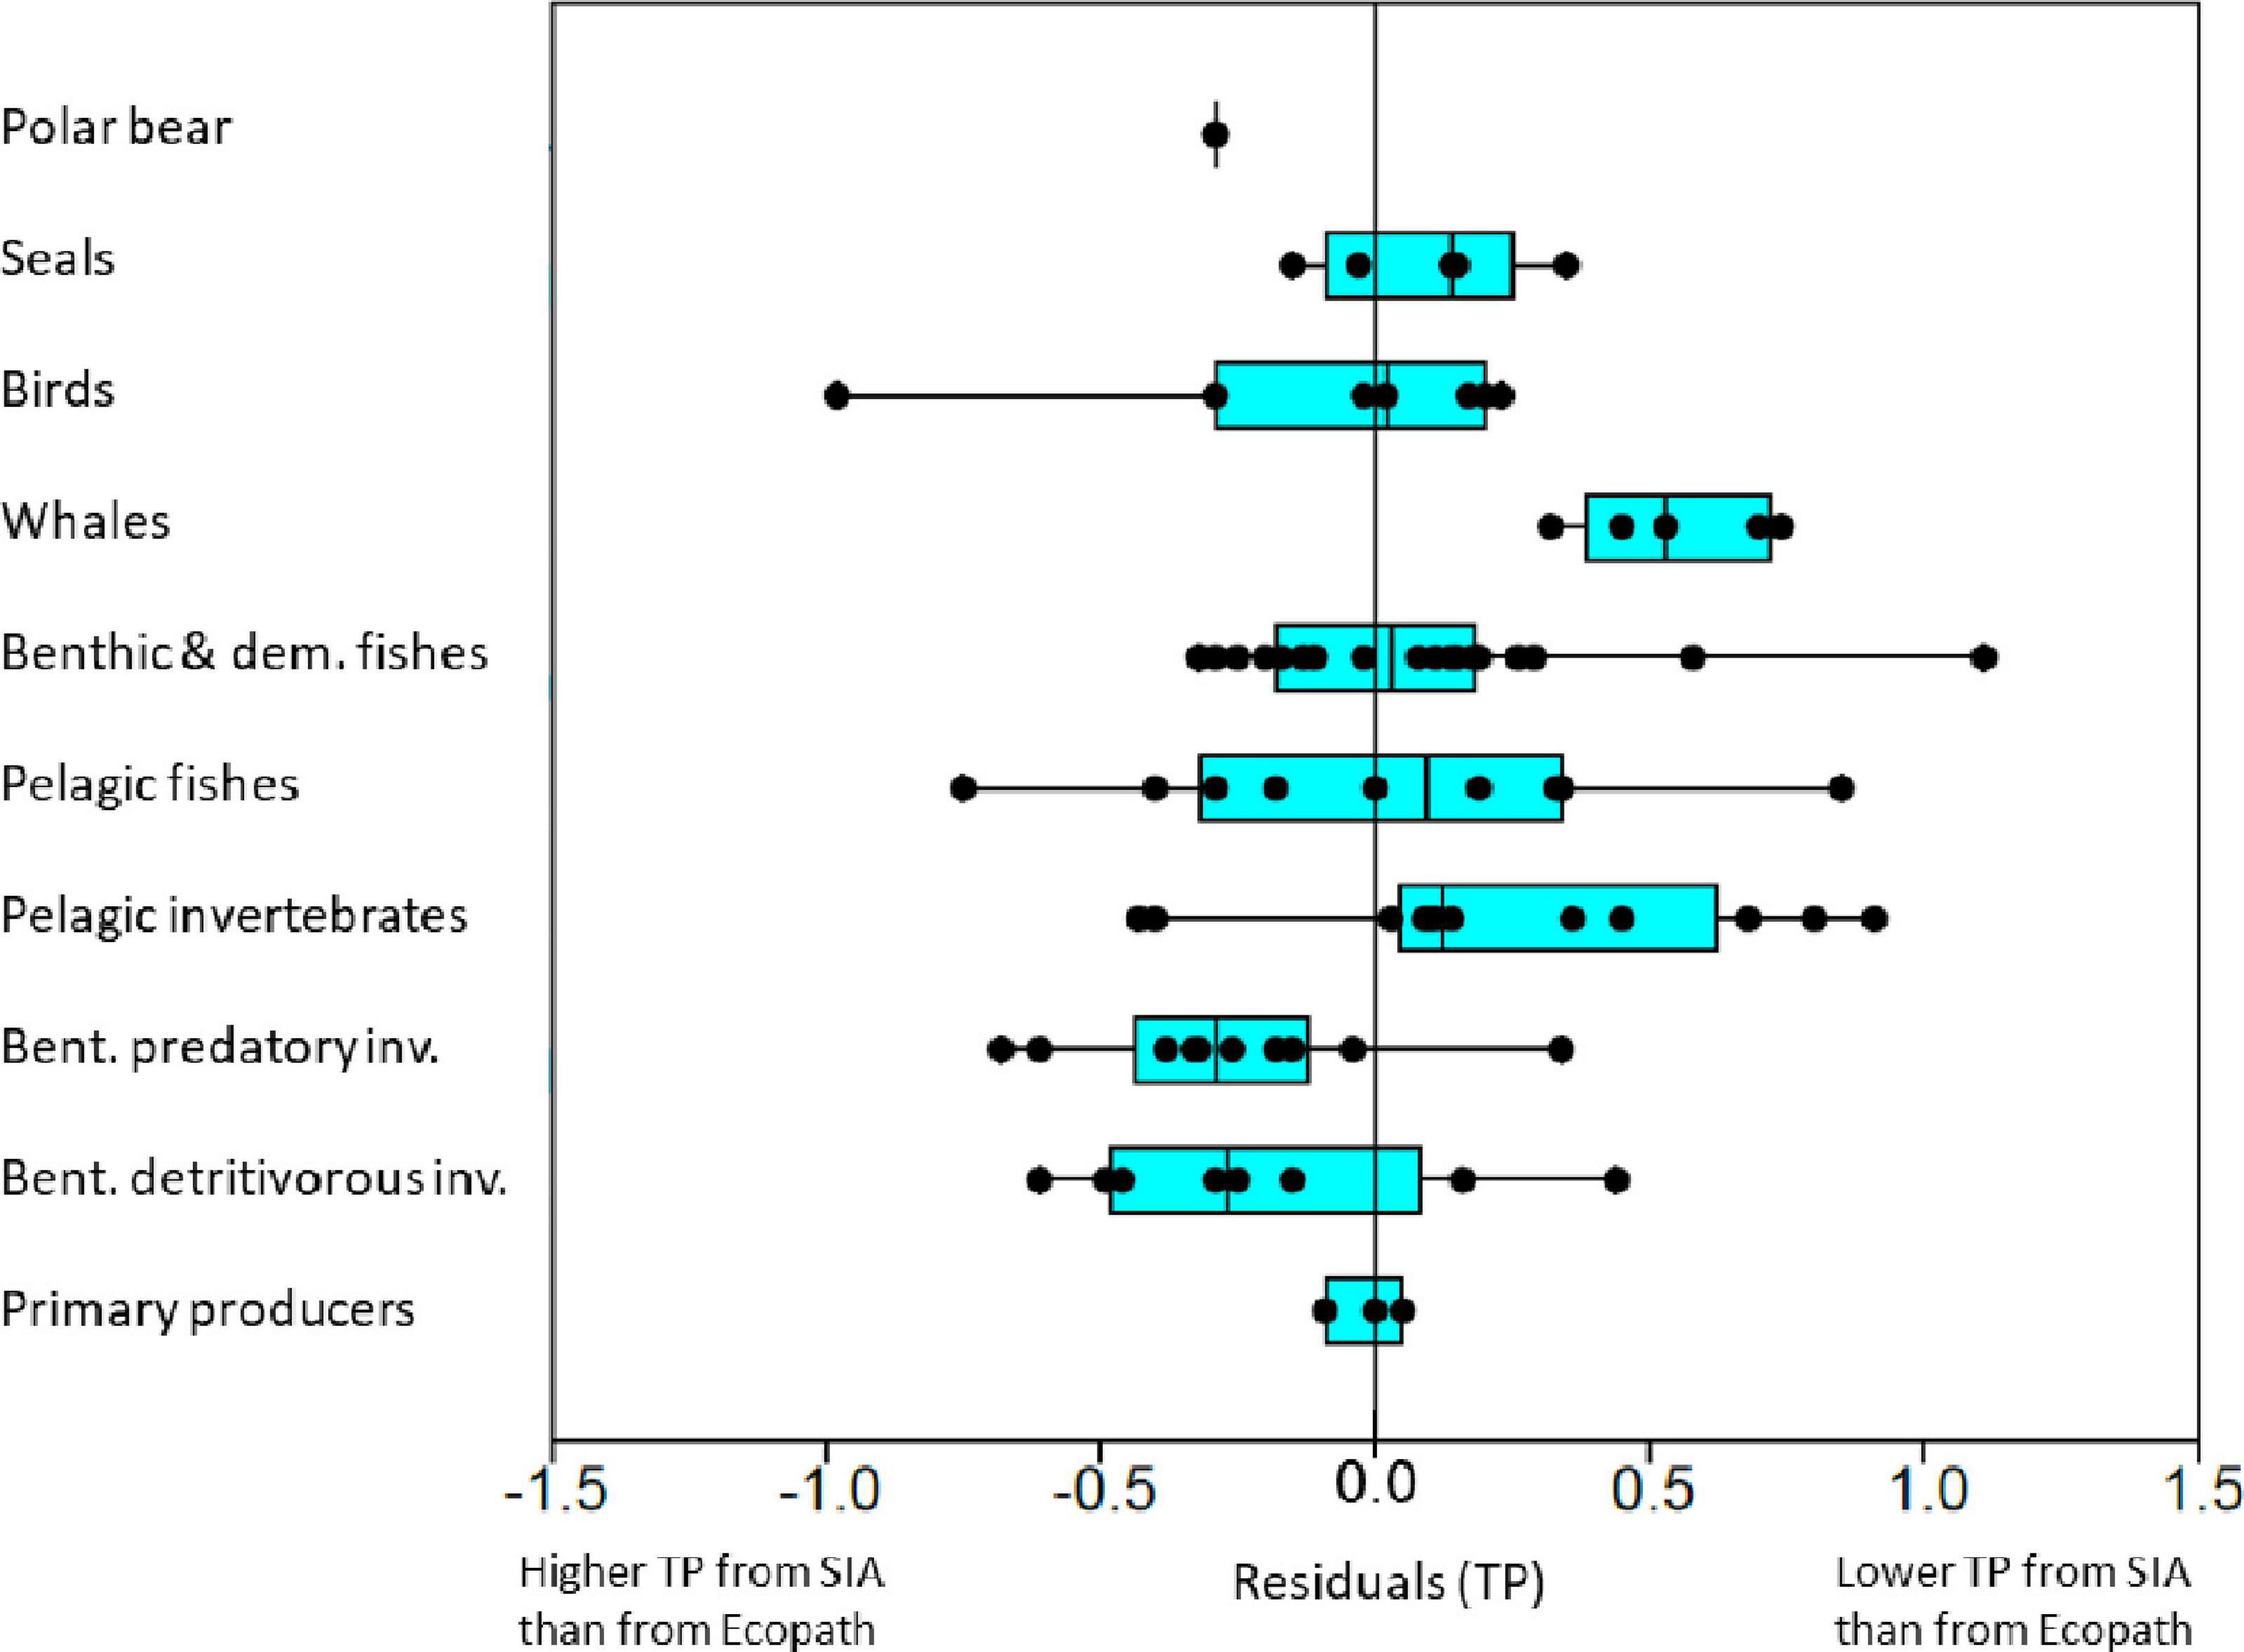
Figure 5. Box-plot of residuals for trophic position values from Ecopath for functional groups predicted by the linear best-fit model for trophic position from δ15N values. The functional groups were grouped into major categories. The linear best-fit relationship had a δ15Nbase value of 4.4‰ for TPbase = 1 and a TEF of 3.0‰ estimated for all habitats (open water and fjord). Positive residuals shows when TP from Ecopath is larger than predicted from δ15N values. Black points show residuals for individual FGs within each major category. Vertical line in boxes show median and boxes show 25–75% quartiles and whiskers show minimal and maximal values.
At the FG-level, the five FGs with the highest positive residuals were: small Greenland halibut (1.1 TP), Ctenophora (0.9 TP), Atlantic salmon (0.9 TP), pelagic amphipods (0.8 TP), and blue whales (0.7 TP). The groups with the five most negative residuals were: other gulls and surface feeders (−1.0 TP), capelin (3+) (−0.8 TP), predatory asteroids (−0.7 TP), predatory gastropods (−0.6 TP), and detrivorous echinoderms (−0.6 TP).
The alternative linear model for all habitats with pPOM as Nbase assuming a TPbase of 1.2 resulted in a TEF of 3.2‰ (95% CI 3.1, 3.4) and a RMSD of 0.4 TP (Table 3). To test if inclusion of the SI data from fjords had a major influence on the results, an analysis with only open water data were undertaken. The data from open water comprised 708 δ15N values from 68 living functional groups and in addition, there was 52 δ15N values from sediment samples. The average δ15N value for pPOM of 4.9‰ (SD = 1.7), based on 39 values for open water, was higher than the value for the total material (4.4‰). At the FG level, δ15N values were strongly correlated to TP from Ecopath (r = 0.82, n = 68). The value for pPOM was used as baseline (Nbase = 4.9‰) and the fit of the linear model for the open water material (TPlin = 1 + (δ15N – 4.9)/TEF) resulted in a TEF of 2.9‰ (95% CI 2.7, 3.0) which was very similar to the TEF estimated for the total material from both habitats. The fit of the linear model to the average FG values and the test for differences in residuals between categories (Kruskal–Wallis, χ2 = 24.8, df = 8; p = 0.002) and the residual patterns for open water data was also very similar to the fit for the data from both habitats (Supplementary Figure 3). RMSD was 0.5 TP (Table 3). This imply that the major patterns in between FG variability of TP were similar for the two data sets (both habitats vs. open water only).
Trophic Positions From Scaled Model and Range of Trophic Position
Trophic positions for FGs calculated by the scaled model with a reference TP of 2.0 for the total material from both habitats showed a curved relationship between TPsca and δ15N values (Figure 6). TPsca were lower than the TPec for most FGs with the largest differences for TPsca between ca. 2.5 to 4.5 (Figure 3B). RMSD was 0.6 TP (Table 3). The results when applying the scaled model on open water δ15N values were very similar to the results from the scaled model for all habitats (Supplementary Figure 4) and RMSD was 0.6 TP (Table 3).
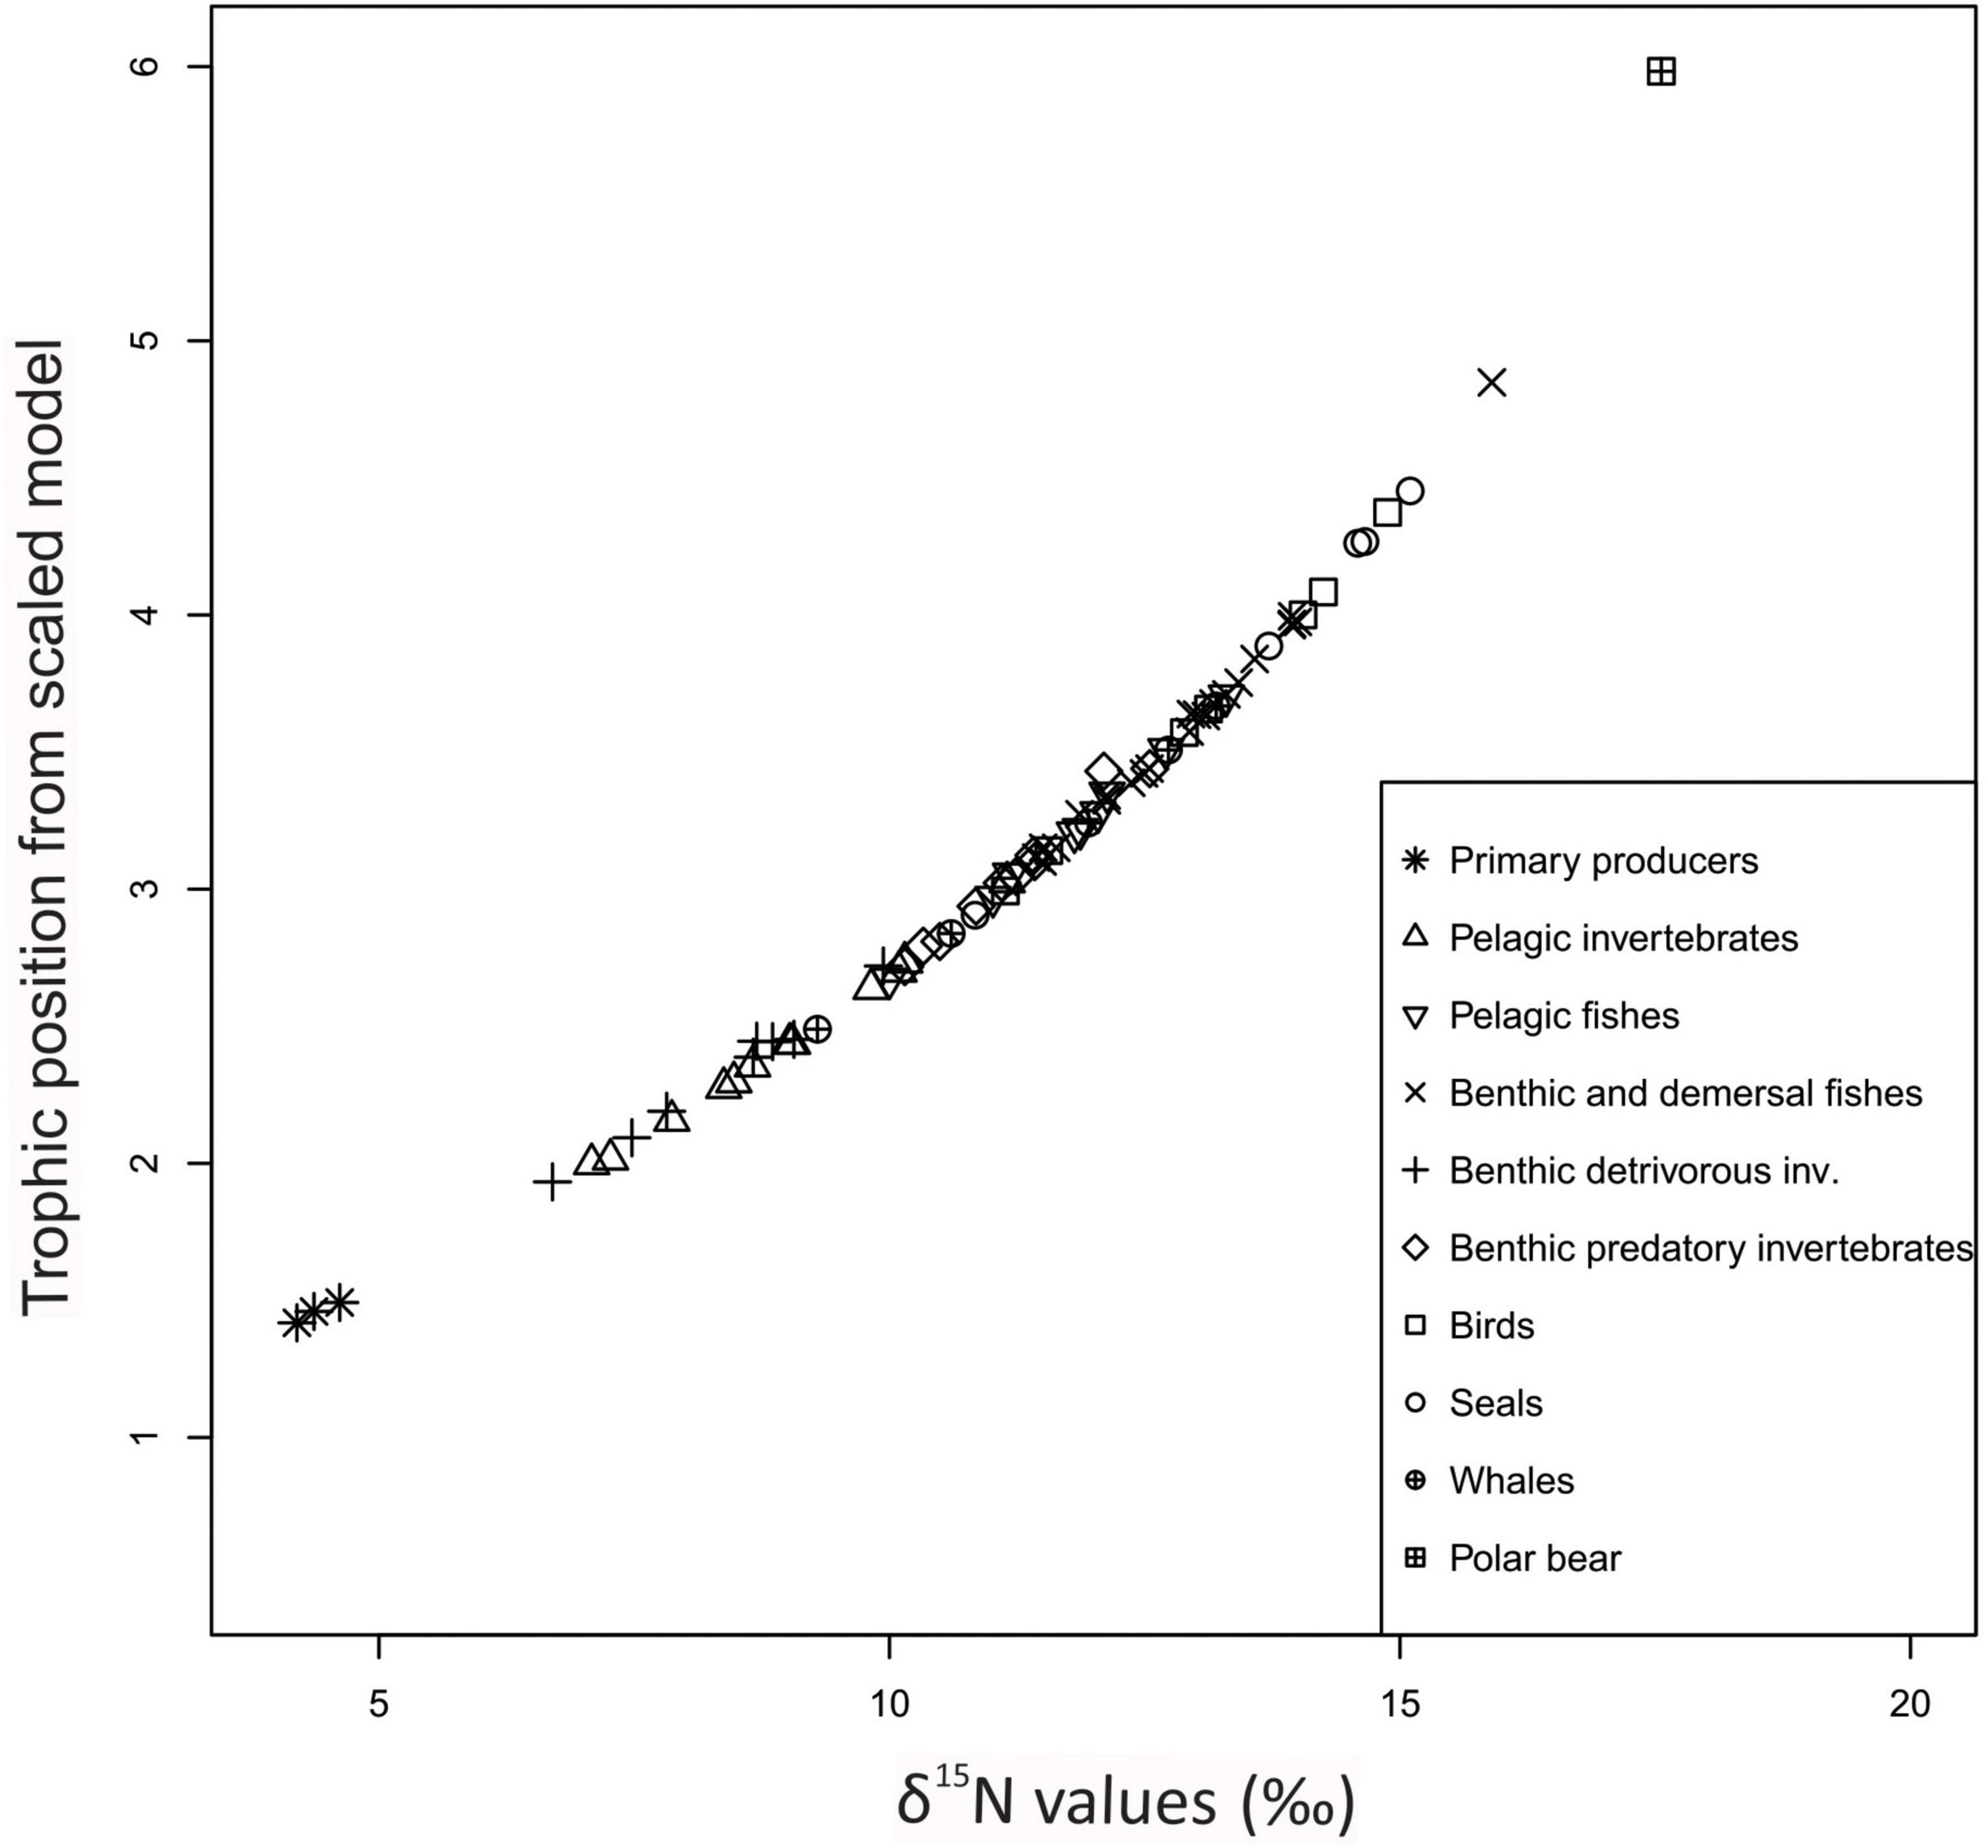
Figure 6. Relationship between trophic position from scaled model (TPsca) and δ15N values for various functional groups (FGs).
Trophic positions from Ecopath ranged from 1.0 for primary producers to 5.1 for polar bears. The maximum TPlin estimated by the linear best-fit model for the total material was 5.4 for polar bears. The TPsca for polar bears from the scaled model TP was 6.0 (SD = 1.6, n = 43) which is 0.9 higher than the TPec for polar bears (Figure 3B and Table 3). Among the original published TPSIR values, Greenland shark had the maximum FG average with a TP of 4.5 but there was no TP estimate for polar bears.
Trophic Enrichment Factors From Published Experiments and Field Studies With Known Diet
Median TEF was 3.5‰ (n = 7) and 2.7‰ (n = 12) for detritivorous invertebrates and for vertebrates, respectively (Supplementary Table 7). The TEF values of detritivorous invertebrate FGs were significantly higher than for vertebrates (whales, seals, polar bear and fish FGs) (Figure 7) (Mann–Whitney, U = 13; p = 0.02). Polar bears had a relatively low TEF of 2.0‰.
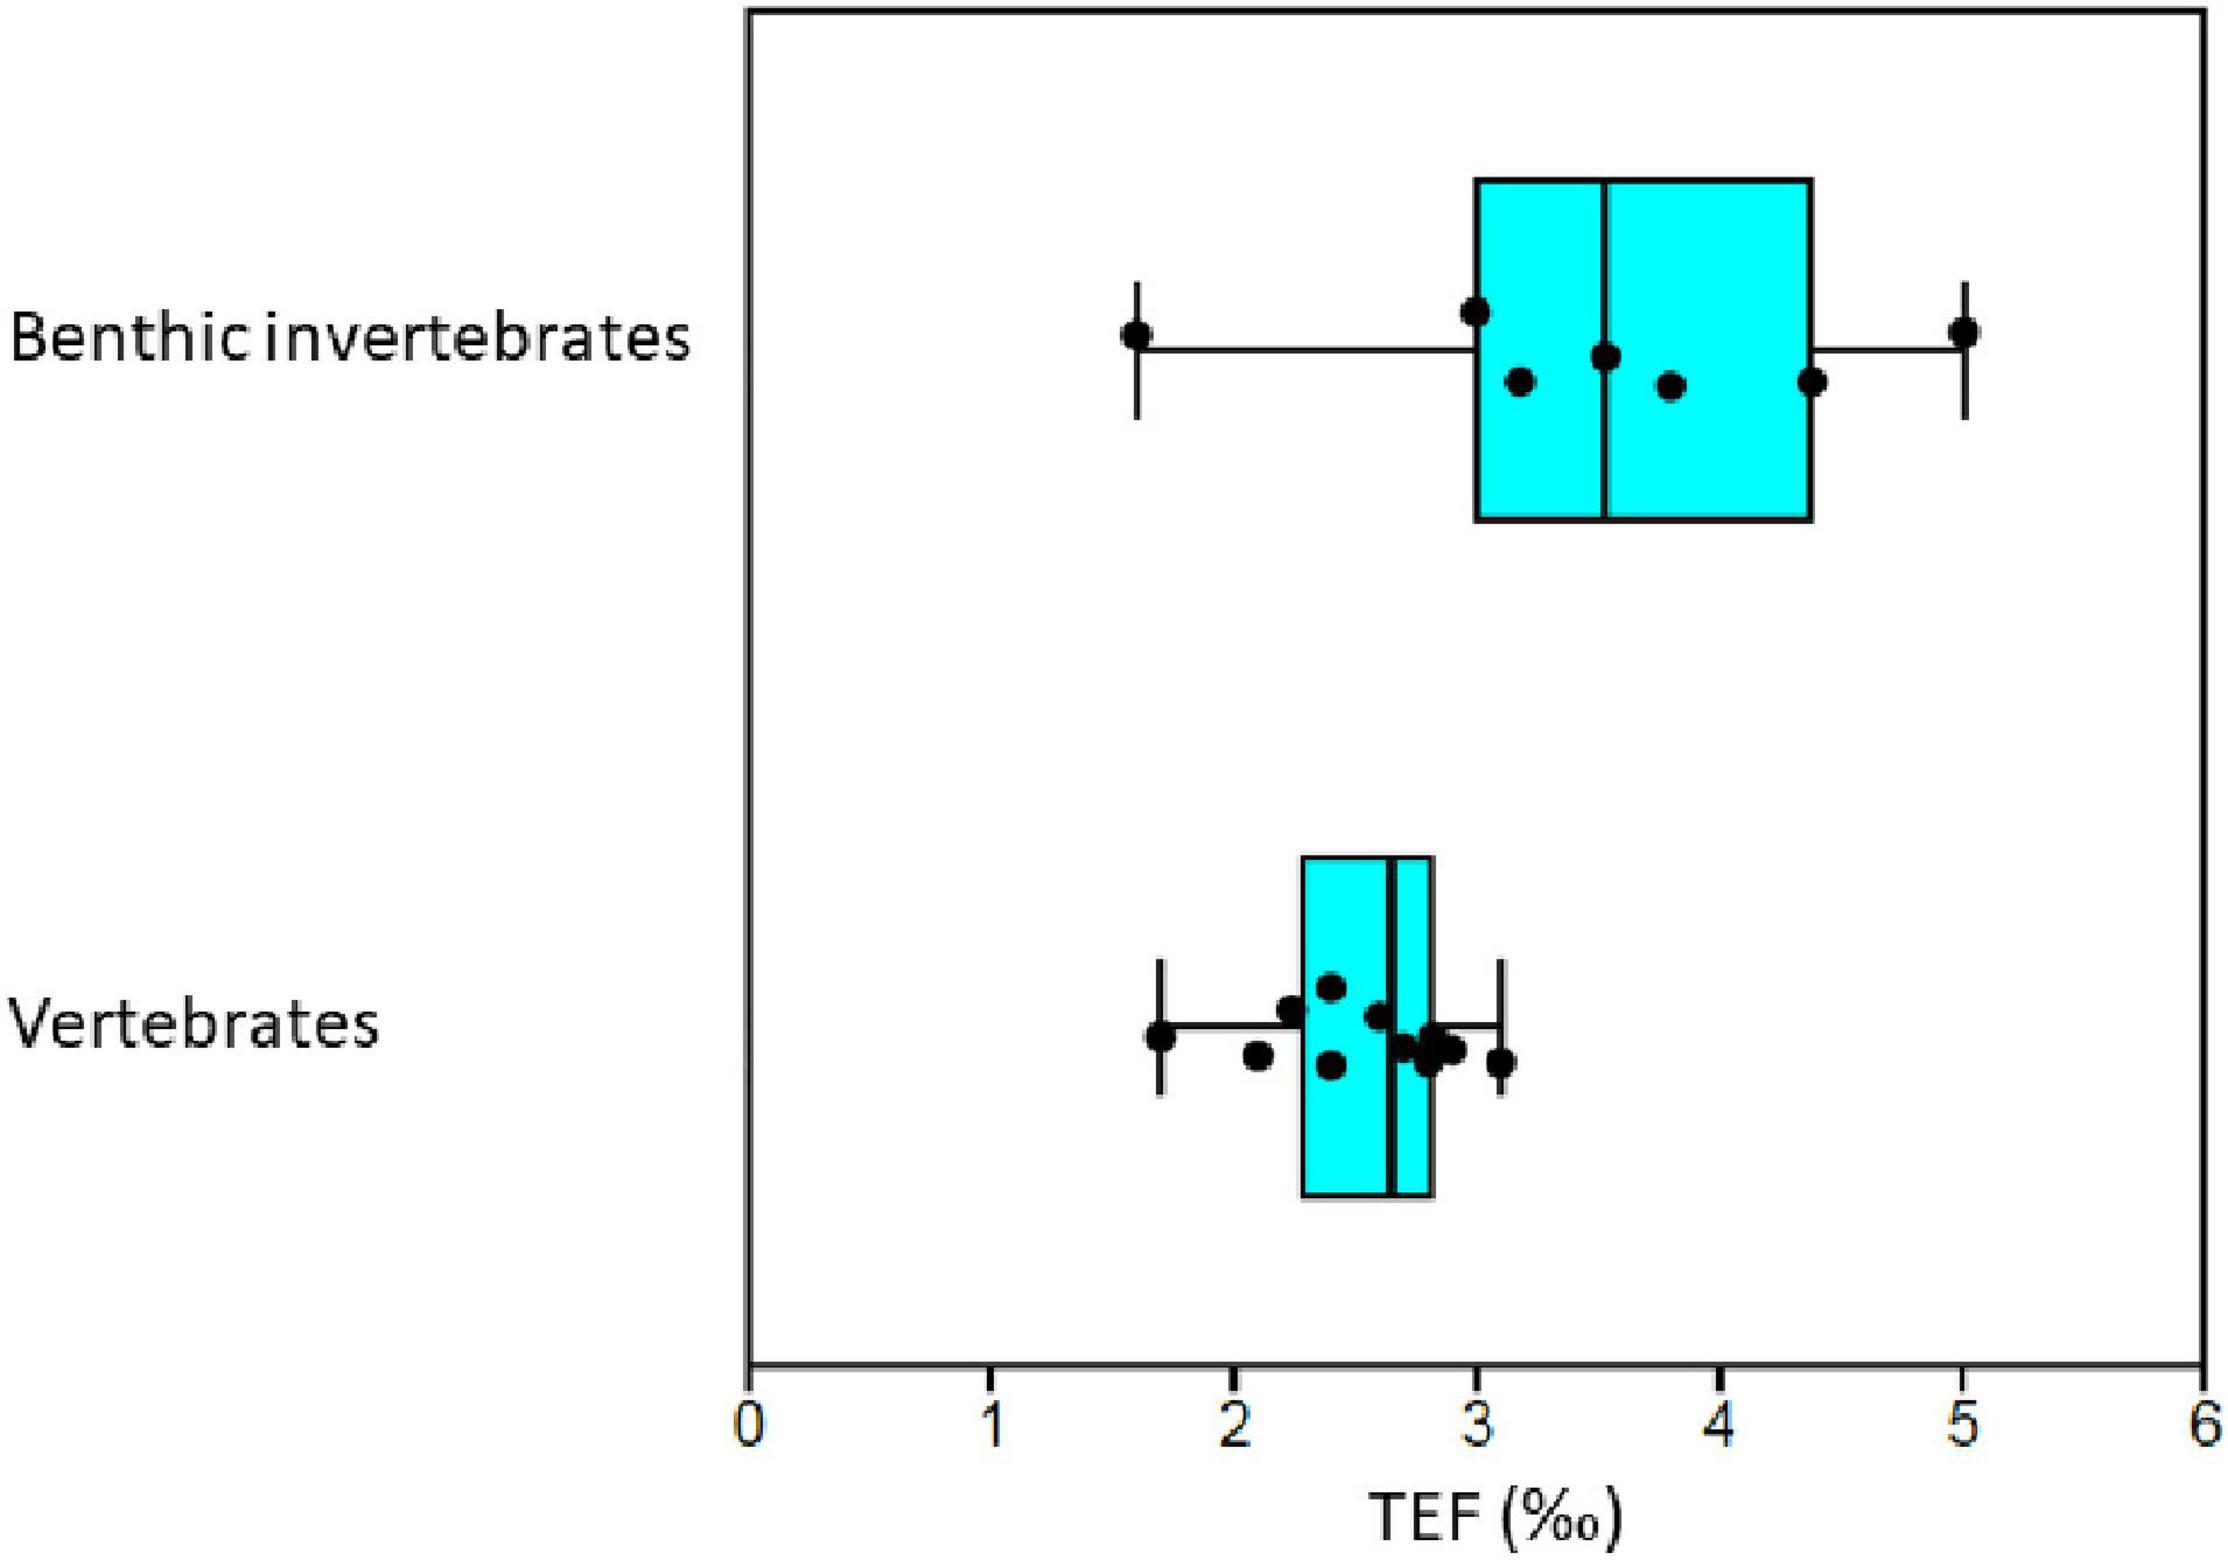
Figure 7. Comparison of trophic enrichment factors (TEF) from published experiments and field studies with known diet for benthic invertebrates and vertebrates (mammals, fish, and birds) that are present in the Barents Sea at least at the genus level. Each black point represent an estimated TEF value. Vertical line in boxes show median and boxes show 25–75% quartiles and whiskers show minimal and maximal values. Supplementary Table 7 gives details on literature sources.
Discussion
Variability in Trophic Positions and δ15N Values Related to Latitude and Habitat
The limited range in δ15N values for both sPOM and pPOM in BS open water habitat along the latitudinal gradient, suggest that there were small changes with latitude for δ15N values at the base of the food web. In a meta-analysis based on δ15N values for a number of species from the Svalbard area, Hoondert et al. (2021) found no latitudinal effect. Phytoplankton is the main primary producer in the BS (Sakshaug et al., 1994), and nitrate is the major source of nitrogen for phytoplankton during the spring/summer bloom in the BS (Tamelander et al., 2009). In support of limited range in baseline δ15N value at both low and high latitudes within the BS, seawater nitrate δ15N had stable values of c. 5.1‰ for both Atlantic and Arctic water in the BS (Tuerena et al., 2020). Tuerena et al. (2020) found no clear trend in δ15N values for nitrate or for particulate nitrogen with increasing latitude in the BS. This apparent stability in BS in lower TP δ15N values is in contrast to persistent latitudinal gradients in δ15N values in the North Sea and at West-Greenland (Jennings et al., 2008; Hansen et al., 2012; MacKenzie et al., 2014).
That only a few FGs showed a change in δ15N values with latitude in the BS may be a result of a relatively stable baseline δ15N value. The decrease in δ15N values with increasing latitude observed in some FGs [large bivalves, large epibenthic suspension feeders, and polar cod (2+)] reflect effects on δ15N values that hypothetically may be caused by changes in temperature or diet composition and quality with latitude. The decreasing trend in δ15N values with latitude in the BS for the three FGs is opposite to the increase in δ15N values with increasing latitude found in open water at West-Greenland for Calanus finmarchicus and the krill species Thysanoessa raschii (Hansen et al., 2012). The latitudinal trend at West-Greenland was explained as a result of high δ15N values in high Arctic blooms due to partial depletion of the nitrate pool and higher renewal by deep nitrate resulting in lower δ15N values further south (Hansen et al., 2012). Carroll et al. (2014) observed that δ15N values of the large bivalve Ciliatocardium ciliatum was lower in Artic than in Atlantic waters in the BS and this is consistent with the trend in the total material in this study. The authors suggested that this difference may be due to higher rates of primary production, recycling in the pelagic and heterotrophy in Atlantic than in Arctic waters (Carroll et al., 2014). When large bivalves are used as baseline organisms for estimation of TP from δ15N, spatial trends in their δ15N values will affect TP estimates for higher TPs.
For polar cod, the decrease in δ15N values with latitude may be caused by a change in diet composition with increasing latitude. Polar cod inhabiting drift ice in the northernmost area of the BS feed, to a large degree, on symphagic fauna (Lønne and Gulliksen, 1989) while the diet of polar cod in open water may be more varied including copepods, pelagic amphipods, krill and fish (Aune et al., 2021). Symphagic fauna in the drift ice may have lower TP than diet sources in open water which may cause the observed trend. In support of this, the symphagic amphipod Apherusa glacialis which is a dominating prey source for polar cod in ice covered habitats had very low mean δ15N values in the study (5.4‰) compared to iPOM (4.8‰) (Kohlbach et al., 2016), and consumption of these amphipods may have contributed to the low δ15N values of polar cod at high latitudes.
The difference between open water and some fjords at Svalbard which had lower δ15N values for sPOM than in open water have also earlier been observed by Knies et al. (2007). There is freshwater supply of particulate terrestrial organic nitrogen with low δ15N values in some high Arctic fjords at Svalbard (Koziorowska et al., 2016; McGovern et al., 2020). Low δ15N values in particles in freshwater runoff to inner fjord areas at Svalbard may contribute to low δ15N values for lower TP benthic invertebrate FGs in fjord areas at Svalbard (McGovern et al., 2020). The very low δ15N values both in sediments (sPOM), pelagic POM (pPOM) and benthic invertebrates from some fjord areas at Svalbard, suggest a bottom-up effect propagating from phytoplankton and detritus to benthic invertebrate detritivores and benthic invertebrate predators. The lack of a clear fjord-effect for major zooplankton FGs (e.g., medium sized copepods and Thysanoessa) may be caused by advection of these FGs into fjord areas from open water areas. The effect of the lower δ15N value for pPOM used as baseline value (4.4‰ for both habitats compared to 4.9‰ for open water habitat) for the linear model results was low since the estimates of TEF (2.9 vs. 3.0‰) for the two data sets were similar (Table 3). This suggest that the overall effect of the terrestrial input of light nitrogen to the fjords on the results for FGs at higher trophic positions is low.
In this study, the fjord areas, especially in the Svalbard area, generally had a high density of samples and data entries per unit area compared to the large open water area (Figure 1). Despite the variability in pPOM, the isotopic baselines for the total material comprising both open water and fjord (4.4‰) and the open water habitat (4.9‰) were similar (Table 3). Thus, the fjord-open water habitat effect did not largely affect the linear best-fit estimates of TEF, RMSD and maximum TP. This suggests that this habitat-difference does not markedly affect the results from the comparison of TPs from SI and Ecopath.
That open water had higher δ15N values than some fjords for sPOM and benthic invertebrates in the Barents Sea is in contrast to the pattern observed along the coast of Greenland, where higher δ15N values were observed in pelagic groups in fjords than offshore (Hansen et al., 2012). The inshore-open water gradient in lower trophic level δ15N values in the Barents Sea are also in contrast to the large gradient in the North Sea with high δ15N values in the southern shallow part with large freshwater input than the lower δ15N values in the deeper northern North Sea (Jennings et al., 2008; MacKenzie et al., 2014). The habitat gradient in δ15N values from the Barents Sea resembles the pattern in the Beaufort Sea with low δ15N values in terrestrial organic material from river input (Bell et al., 2016).
The deviating low δ15N values for some FGs from areas with methane seeps in the western part of the BS have been well described by Åström et al. (2019). The few deviating low δ15N values for pPOM and some benthic invertebrates from the southern part of the BS LME (Silberberger et al., 2018), probably indicate local effects that did not markedly affect the overall results because of the low number of entries identified as outliers (Silberberger et al., 2018).
Comparison of Trophic Positions Estimated From Ecopath and Linear Trophic Position-SI Relationship
The TPec values from Ecopath and the original TPSIR from stable isotopes were similar for most FGs in the BS ecosystem. TPSIR was calculated using linear TP-SI relationships were based on a various baseline organisms, baseline δ15N value and TEF values, and were calculated for different purposes. The strong correlation between TPec and TPlin estimated using the linear best-fit model, also indicates a good correspondence between the two methods.
The deviations from the linear best –fit linear TP- SI relationship estimated in this study may be caused by factors affecting both the TPs from Ecopath and from δ15N values. That most pelagic invertebrate FGs had higher TPec than TPlin (positive residuals), may indicate that these FGs had low TEF values. Microzooplankton FGs are included in the Ecopath model with the FGs heterotrophic nanoflagellates, ciliates, and heterotrophic dinoflagellates, but no SI values were available for these FGs. Experiments indicate that protists may be isotopically “invisible” using bulk stable isotopes due to their very low bulk δ15N value enrichment (Gutiérrez-Rodríguez et al., 2014; Landry and Décima, 2017; Park et al., 2021). The microzooplankton FGs are active and have a large production in the BS, and ciliates and dinoflagellates are important prey groups for a number of pelagic invertebrate FGs (Rat’kova and Wassmann, 2002; De Laender et al., 2010; Pedersen et al., 2021). In the Ecopath model used in this study for the BS, microzooplankton amounted to 7–32% of the diet of the copepods FGs, krill (Thysanoessa) and pelagic amphipods (Pedersen et al., 2021). Thus, a low TEF of the microzooplankton FGs may contribute to low δ15N values for their predator FGs and hence low TPlin values and positive residuals. There are few experimental data on TEF for pelagic invertebrates. That the predominantly herbivorous pelagic FGs (copepod groups and krill groups) had small residuals indicate higher TEF values than for the pelagic planktonic predators such as pelagic amphipods, cephalopods, Ctenophora, and Scyphozoa which had high residuals, and this may fit with the diet-quality hypothesis.
The positive residuals from the linear TP-SI relationship for whales may suggest that this group also had relatively low TEF compared to other groups, and the low values for TEF from literature sources for whales may give support to this explanation. The whale FGs with SI data in this study included baleen and toothed whales and long distance seasonal migrants (blue whales, fin whales, minke whales) and all-year resident whales in the Barents Sea (e.g., harbor porpoise and killer whales). Individual feeding specialization was found for killer whales and polar bears (Blévin et al., 2019; Jourdain et al., 2020). Some killer whales specialize in feeding on coastal seals and show high δ15N values while the majority of the individuals feed on herring (Jourdain et al., 2020), and have relatively low δ15N values and low standard deviation of δ15N value (SD = 0.05) (Supplementary Table 4).
Benthic detritivorous and benthic predatory invertebrate FGs were the other aggregated categories deviating most from the linear average TP- SI model with higher TPlin than TPec. It is possible that the diet composition of benthic detritivorous FGs in Ecopath generally contain too little heterotrophic FGs (e.g., bacteria and other microorganisms) and this may contribute to relative low TPec of these FGs compared to TP from stable isotopes. In Ecopath, all detritus are assigned to TP = 1.0 by convention, while the δ15N values of detritus from organisms at higher TPs are likely to correspond to the TP of the organisms producing detritus. This may contribute to a reduce TPs from Ecopath compared to TPs from SI.
The higher TPlin than TPec of benthic invertebrate FGs could also indicate relatively high values for TEF for these FGs in the BS. This interpretation is supported by the relatively high TEF values from experiments with detritivorous invertebrates. Vanderklift and Ponsard (2003) found that mollusks and crustaceans had lower TEF and related this to the mode of nitrogen excretion. Crustaceans and mollusks excrete ammonia (i.e., are ammonotelic) and had lower TEF than taxonomic groups that were ureotelic or uricotelic. However, in this study, the two other important taxa dominating among benthic detritivorous FGs, polychaetes and echinoderms, also excrete ammonia to a large degree (Davoult et al., 1991; Thiel et al., 2017). Thus, it is more likely that the low TEF values of the benthic detritivorous FGs in this study are related to diet composition than to nitrogen excretion mode.
Fractionation is dependent on diet quality and Adams and Sterner (2000) found that TEF of a zooplankton species (Daphnia magna) increased with increasing carbon:nitrogen ratio in the food. In the marine fish Fundulus heteroclitus, TEF was largest for diets with low δ15N values, i.e., a larger difference between consumer and diet δ15N values (Elsdon et al., 2010). In this study, it seems most likely that the negative residuals for most benthic invertebrate FGs are due to high TEF values for detritivorous FGs feeding on low quality detritus (i.e., high C:N ratio) and that predatory benthic invertebrates get relatively high δ15N values because their benthic detritivorous invertebrate prey have high δ15N values.
Seasonal variation in δ15N values are common in aquatic invertebrates (Woodland et al., 2012), and seasonal variability in baseline δ15N value may potentially affect the usefulness of TP-SI models. The pelagic primary production in Arctic ecosystems is highly seasonal and food pulses propagate to higher trophic levels with time delay (Falk-Petersen et al., 2007). The spring phytoplankton bloom is based on nitrate as its main nutrient, but after the bloom phytoplankton production is, to a large degree, based on regenerated nutrients (Kristiansen et al., 1994; Tamelander et al., 2009). This may contribute to seasonal variations in δ15N values and computed trophic position for species and FGs (Hoondert et al., 2021). Some FGs (e.g., copepod FGs) are omnivorous and change diet seasonally from phytoplankton in spring and summer to protozoa and detritus during summer (De Laender et al., 2010; Kohlbach et al., 2021). Generally, high δ15N values of have been observed in several FGs during winter and spring when feeding at lower trophic levels are reduced (Olive et al., 2003; Hertz et al., 2015). Hertz et al. (2015) found an average increase in δ15N values of fasting of 0.5‰, and in the BS, Carroll et al. (2014) found higher δ15N values (ca. 0.5–1.0‰) in the large bivalve Ciliatocardium ciliatum during spring than in fall. That the majority of stable isotope samples in the material analyzed in this paper were sampled during spring, summer, and autumn suggest that they were representative of the most productive season.
Other factors, such as ontogeny and gender, may also influence δ15N values. Ontogenetic effects are partly included in the Ecopath model by the specification of multi-stanza FGs for a number of fish species with separate groups for small and large fishes. Hoondert et al. (2021) found a clear effect of sex with females having higher δ15N values than males, but it is unlikely that a gender – biased sampling would have affected this study markedly.
The TEF of 3.0‰ estimated by the linear best-fit model with TPbase of 1.0 was lower than the most commonly used TEF of 3.4 and 3.8‰ in the literature, but seems reasonable compared to the TEF values from experiments and field studies with known diet for organisms that occur in BS. The value (3.0‰) is also close to the average TEF of 3.1‰ calculated for four Arctic pelagic food webs including data from Svalbard (Hoondert et al., 2021). The corresponding TEF for benthic food webs was higher (3.4‰) (Hoondert et al., 2021). The TP of the pPOM used as TPbase is uncertain because POM contain heterotrophic organisms, but assuming a TPbase of 1.2 resulted in a TEF of 3.2‰ which is in the middle of the range of 2.7 to 3.8‰ commonly applied for TEF in the BS. The RMSD values were identical for linear models with TPbase of 1.0 and 1.2 but were lower than the RMSD for the scaled model indicating a better correspondence with Ecopath TPs for TPs from the linear model than from the scaled model.
The average pairwise difference of 0.10 TP between TPSIR from stable isotopes and TPec from the Ecopath model in this study is in the same range as differences for FGs in TP between published mass-balance models for the BS. The average pairwise differences between TPs for FGs estimated by the Ecopath model in this study for minke whales, harp seals, fish and pelagic invertebrate FGs and corresponding TPs from four other mass-balance models for the Barents Sea and the Barents Sea and Norwegian Sea area varied from +0.25 to −0.25 TP (Pedersen et al., 2021).
Trophic Positions From the Scaled Model and Range of Trophic Positions
That TPs from the scaled model differed systematically from TP from Ecopath for intermediate TP in the range of 2.5 to c. 4.5 (TPsca < TPec) and above 5 TP (TPsca > TPec), is caused by the assumed decrease in TEF with increasing TP underlying the scaled method. In Ecopath, TPs of specific FGs at intermediate TPs were affected by diet compositions of their food source FGs at lower TPs. Uncertainty in diet composition vary between FGs and this uncertainty may affect uncertainty of TPs for single groups. The maximum TP of 6.0 for the scaled model for the Barents Sea was higher than the maximum TP from the linear model for both habitats (TPlin = 5.4) and TP from Ecopath (TPec = 5.1) and the linear best-fit model, showing that the maximum TP for the BS is sensitive to choice of method.
The values for maximum TP for the BS from the linear model (TPlin = 5.4) and Ecopath (TPec = 5.1) are similar to maximum TP values for most other Arctic ecosystems using linear models (Linnebjerg et al., 2016; Hoondert et al., 2021). Hoondert et al. (2021) found a maximum TP of 4.9 for the Svalbard area within the BS using a linear model with TEF of 3.39 and 3.44‰ for the pelagic and benthic part of the food web, respectively. Maximum TP values of 4.8 to 5.3 were reported for three other Arctic ecosystems (Hoondert et al., 2021). Polar bears has the highest TP value among the FGs in ecosystems where polar bears was present (Hoondert et al., 2021). Earlier published Ecopath models for the BS did not include polar bears as FG. In the Barents Sea, some polar bears also prey on terrestrial prey and birds which have lower δ15N values than seals (Lippold et al., 2019). Blanchet et al. (2019) estimated TP for polar bears to 5.2 in the BS based on a binary diet matrix and this value is close to the value from the Ecopath model (TP = 5.1).
The difference of 0.6 TP between maximum TP from the scaled and the linear method for BS was much less than the corresponding differences for the West-Greenland ecosystem. Here the scaled model resulted in a much larger maximum TPsca value of 8.6 compared to maximum TPs calculated by linear TP-SI models of 5.2 and 5.6 assuming TEFs of 3.4‰ 3.2‰, respectively (Linnebjerg et al., 2016). The fish-based scaling relationship from Hussey et al. (2014a,b) may not capture the TEF patterns for invertebrate and mammal FGs that are important in Arctic ecosystems. This suggests that, for the BS, a linear model may be sufficient to predict TP from δ15N values for most purposes. Further improvement in TP-prediction for specific FGs or categories and ecosystem range in TP may be achieved by conducting experiments with organisms feeding on known diet to estimate both bulk TEF and compound specific (amino acid, fatty acid) SI-analysis.
Limitations of the Study
The data set used in this study was not balanced with regard to environmental factors such as season (month), latitude, bottom depth, and geographic regions within the BS. All these factors may influence δ15N values and hence TP estimates. Furthermore, the sampled tissue and treatment (i.e., lipid extraction, acid treatment) of the samples varied, potentially affecting the δ15N values used in this study (Sotiropoulos et al., 2004; Canseco et al., 2021). It is known that lipid extraction may affect δ15N values but effects seem to vary between studies. Lipid extraction caused a ca. 1‰ increase in δ15N values in fish muscle (Elsdon et al., 2010). Cloyed et al. (2020) found no effect of lipid extraction δ15N values in dolphins and Caut et al. (2009) found that discrimination factors for nitrogen did not differ in samples from many types of organisms with and without lipid extraction. It was not attempted to correct for effects of various treatment and tissues since it was difficult to find relevant conversion factors.
For some FGs, δ15N values were based on few entries, and lower number of entries could have contributed to high residuals for some FGs with few entries (n) such as capelin (3+) (n = 1) and blue whale (n = 1). That the δ15N averages for multi-species FGs were calculated without weighting species-specific δ15N values by the biomass of species will give more influence to species with many entries but with low biomass than less-studied species with higher biomass but less entries. This approach was chosen since biomasses of some species are uncertain.
Conclusion
Few FGs had δ15N values that were correlated with latitude. Sediment POM, pelagic POM and some benthic detritivorous and benthic predatory invertebrate FGs had lower δ15N values in some fjords at Svalbard than in open water. This was likely caused by freshwater supply of POM of terrestrial origin with low δ15N values. TPs from the mass-balance model (Ecopath) corresponded well with published TPs based on δ15N values. TPs from Ecopath and linear best-fit model for TP-SI relationship also corresponded well with an estimate of TEF of 3.0‰. The linear model predicted lower TPs from δ15N values than from Ecopath for pelagic invertebrates and whales and higher TPs for benthic invertebrates, and this was likely a result of lower TEF for pelagic groups and whales than for benthic invertebrates. A scaled model approach resulted in generally lower TPs than from Ecopath for TP in the range from ca. 2.5 to 4.5 The range of TP in the BS ecosystem varied when estimated by Ecopath, linear and scaled models with maximum TPs of 5.1, 5.4 and 6.0, respectively. It is concluded that the TPs from Ecopath and from a linear TP-SI model corresponded better than between TPs from Ecopath and the scaled approach.
Data Availability Statement
The original contributions presented in the study are included in the article Supplementary Material, further inquiries can be directed to the corresponding author.
Ethics Statement
Ethical review and approval was not required for the animal study because the study was done using published information and did not involve new experiments or sampling.
Author Contributions
TP has done all work with the manuscript except the checking of scientific species names which was done by Johanna Hovinen.
Funding
The Research Council of Norway provided partial support through the project “The Nansen Legacy” (RCN#276730). The Norway-Canada collaborative project “A Transatlantic innovation arena for sustainable development in the Arctic” (CoArc) also provided partial support for this work (Project Number 8048 at Akvaplan-niva and QZ-15/0457 at Norwegian Ministry of Foreign Affairs).
Conflict of Interest
The author declares that the research was conducted in the absence of any commercial or financial relationships that could be construed as a potential conflict of interest.
Publisher’s Note
All claims expressed in this article are solely those of the authors and do not necessarily represent those of their affiliated organizations, or those of the publisher, the editors and the reviewers. Any product that may be evaluated in this article, or claim that may be made by its manufacturer, is not guaranteed or endorsed by the publisher.
Acknowledgments
Johanna Hovinen is thanked for checking scientific names of the data entries. Anders Nielsen is thanked for help with language.
Supplementary Material
The Supplementary Material for this article can be found online at: https://www.frontiersin.org/articles/10.3389/fmars.2022.813977/full#supplementary-material
Footnotes
References
Adams, T. S., and Sterner, R. W. (2000). The effect of dietary nitrogen content on trophic level 15N enrichment. Limnol. Oceanogr. 45, 601–607.
Ahrens, R. N. M., Walters, C. J., and Christensen, V. (2012). Foraging arena theory. Fish Fish. 13, 41–59.
Aune, M., Raskhozheva, E., Andrade, H., Augustine, S., Bambulyak, A., Camus, L., et al. (2021). Distribution and ecology of polar cod (Boreogadus saida) in the eastern Barents Sea: a review of historical literature. Mar. Environ. Res. 166:105262. doi: 10.1016/j.marenvres.2021.105262
Basedow, S. L., Tande, K. S., and Zhou, M. (2010). Biovolume spectrum theories applied: spatial patterns of trophic levels within a mesozooplankton community at the polar front. J. Plankton Res. 32, 1105–1119. doi: 10.1093/plankt/fbp110
Bell, L. E., Bluhm, B. A., and Iken, K. (2016). Influence of terrestrial organic matter in marine food webs of the Beaufort Sea shelf and slope. Mar. Ecol. Prog. Ser. 550, 1–24. doi: 10.3354/meps11725
Benjamini, Y., and Hochberg, Y. (1995). Controlling the false discovery rate: a practical and powerful approach to multiple testing. J. R. Stat. Soc. Ser. B 57, 289–300. doi: 10.1111/j.2517-6161.1995.tb02031.x
Bentley, J. W., Serpetti, N., and Heymans, J. J. (2017). Investigating the potential impacts of ocean warming on the Norwegian and Barents Seas ecosystem using a time-dynamic food-web model. Ecol. Model. 360, 94–107.
Berdnikov, S., Kulygin, V., Sorokina, V., Dashkevich, L., and Sheverdyaev, I. (2019). An integrated mathematical model of the large marine ecosystem of the Barents Sea and the White Sea as a tool for assessing natural risks and efficient use of biological resources. Dokl Earth Sci. 487, 963–968.
Blanchard, J., Pinnegar, J., and Mackinson, S. (2002). Exploring marine mammal-fishery interactions using ‘Ecopath with Ecosim’: modelling the Barents Sea ecosystem. Sci. Ser. Tech. Rep. CEFAS Lowestoft 117:52.
Blanchet, M.-A., Primicerio, R., Frainer, A., Kortsch, S., Skern-Mauritzen, M., Dolgov, A. V., et al. (2019). The role of marine mammals in the Barents Sea foodweb. ICES J. Mar. Sci. 76, i37–i53.
Blévin, P., Aars, J., Andersen, M., Blanchet, M.-A., Hanssen, L., Herzke, D., et al. (2019). Pelagic vs coastal—key drivers of pollutant levels in barents sea polar bears with contrasted space-use strategies. Environ. Sci. Technol. 54, 985–995. doi: 10.1021/acs.est.9b04626
Bogstad, B., Gjøsæter, H., Haug, T., and Lindstrøm, U. (2015). A review of the battle for food in the Barents Sea: cod vs. marine mammals. Front. Ecol. Evol. 3, 1–17.
Born, E., Outridge, P., Riget, F., Hobson, K., Dietz, R., Øien, N., et al. (2003). Population substructure of North Atlantic minke whales (Balaenoptera acutorostrata) inferred from regional variation of elemental and stable isotopic signatures in tissues. J. Mar. Syst. 43, 1–17.
Canseco, J., Niklitschek, E., and Harrod, C. (2021). Variability in δ13C and δ15N trophic discrimination factors for teleost fishes: a meta-analysis of temperature and dietary effects. Rev. Fish Biol. Fish. 1–17.
Carroll, M. L., Ambrose, W. G. Jr., Ryan, S. K., and Johnson, B. J. (2014). Bivalve growth rate and isotopic variability across the barents sea polar front. J. Mar. Syst. 130, 167–180. doi: 10.1016/j.jmarsys.2013.10.006
Casey, M. M., and Post, D. M. (2011). The problem of isotopic baseline: reconstructing the diet and trophic position of fossil animals. Earth-Sci. Rev. 106, 131–148. doi: 10.1016/j.earscirev.2011.02.001
Caut, S., Angulo, E., and Courchamp, F. (2009). Variation in discrimination factors (Delta N-15 and Delta C-13): the effect of diet isotopic values and applications for diet reconstruction. J. Appl. Ecol. 46, 443–453.
Christensen, V. (1995). A model of trophic interactions in the North Sea in 1981, the year of the stomach. Dana 11, 1–28.
Christensen, V., Walters, C., and Pauly, D. (2005). Ecopath with Ecosim: a User’s guide. Vancouver, BC: Fisheries Centre of University of British Columbia.
Cloyed, C. S., DaCosta, K. P., Hodanbosi, M. R., and Carmichael, R. H. (2020). The effects of lipid extraction on δ13C and δ15N values and use of lipid-correction models across tissues, taxa and trophic groups. Methods Ecol. Evol. 11, 751–762.
Davoult, D., Gounin, F., and Janquin, M.-A. (1991). Ammonium excretion by the ophiurid Ophiothrix fragilis as a function of season and tide. Mar. Biol. 111, 425–429.
De Laender, F., Oevelen, D. V., Soetaert, K., and Middelburg, J. J. (2010). Carbon transfer in herbivore-and microbial loop-dominated pelagic food webs in the southern Barents Sea during spring and summer. Mar. Ecol. Prog. Ser. 398, 93–107.
Dommasnes, A., Christensen, V., Ellertsen, B., Kvamme, C., Melle, W. Nøttestad, L., et al. (2002). An ecopath model for the Norwegian Sea and Barents Sea. 2001: fisheries impacts on North Atlantic ecosystems. Fish. Cen. Res. Rep. 9, 213–239.
Du, J., Makatipu, P. C., Tao, L. S., Pauly, D., Cheung, W. W., Peristiwady, T., et al. (2020). Comparing trophic levels estimated from a tropical marine food web using an ecosystem model and stable isotopes. Estuar. Coast. Shelf Sci. 233:106518.
Elsdon, T. S., Ayvazian, S., McMahon, K. W., and Thorrold, S. R. (2010). Experimental evaluation of stable isotope fractionation in fish muscle and otoliths. Mar. Ecol. Prog. Ser. 408, 195–205. doi: 10.3354/meps08518
Falk-Petersen, S., Pavlov, V., Timofeev, S., and Sargent, J. R. (2007). Climate Variability and Possible Effects on Arctic Food Chains: the Role of Calanus. Arctic Alpine Ecosystems and People in a Changing Environment. Berlin: Springer.
Frank, K. T., Petrie, B., and Shackell, N. L. (2007). The ups and downs of trophic control in continental shelf ecosystems. Trends Ecol. Evol. 22, 236–237. doi: 10.1016/j.tree.2007.03.002
Fuhrmann, M. M., Pedersen, T., and Nilssen, E. M. (2017). Trophic niche of the invasive red king crab Paralithodes camtschaticus in a benthic food web. Mar. Ecol. Prog. Ser. 565, 113–129.
Golikov, A. V., Ceia, F. R., Sabirov, R. M., Belyaev, A. N., Blicher, M. E., Arboe, N. H., et al. (2019). Food spectrum and trophic position of an Arctic cephalopod, Rossia palpebrosa (Sepiolida), inferred by stomach contents and stable isotope (δ13C and δ15N) analyses. Mar. Ecol. Prog. Ser. 632, 131–144.
Gutiérrez-Rodríguez, A., Décima, M., Popp, B. N., and Landry, M. R. (2014). Isotopic invisibility of protozoan trophic steps in marine food webs. Limnol. Oceanogr. 59, 1590–1598. doi: 10.4319/lo.2014.59.5.1590
Hallanger, I. G., Ruus, A., Warner, N. A., Herzke, D., Evenset, A., Schøyen, M., et al. (2011a). Differences between Arctic and Atlantic fjord systems on bioaccumulation of persistent organic pollutants in zooplankton from Svalbard. Sci. Total Environ. 409, 2783–2795. doi: 10.1016/j.scitotenv.2011.03.015
Hallanger, I. G., Warner, N. A., Ruus, A., Evenset, A., Christensen, G., Herzke, D., et al. (2011b). Seasonality in contaminant accumulation in Arctic marine pelagic food webs using trophic magnification factor as a measure of bioaccumulation. Environ. Toxicol. Chem. 30, 1026–1035. doi: 10.1002/etc.488
Hansen, J. H., Hedeholm, R. B., Sünksen, K., Christensen, J. T., and Grønkjær, P. (2012). Spatial variability of carbon (δ 13 C) and nitrogen (δ 15 N) stable isotope ratios in an Arctic marine food web. Mar. Ecol. Prog. Ser. 467, 47–59. doi: 10.3354/meps09945
Haug, T., Falk-Petersen, S., Greenacre, M., Hop, H., Lindstrøm, U., Meier, S., et al. (2017). Trophic level and fatty acids in harp seals compared with common minke whales in the Barents Sea. Mar. Biol. Res. 13, 1–14.
Haukås, M., Berger, U., Hop, H., Gulliksen, B., and Gabrielsen, G. W. (2007). Bioaccumulation of per-and polyfluorinated alkyl substances (PFAS) in selected species from the Barents Sea food web. Environ. Pollut. 148, 360–371. doi: 10.1016/j.envpol.2006.09.021
Hertz, E., Trudel, M., Cox, M. K., and Mazumder, A. (2015). Effects of fasting and nutritional restriction on the isotopic ratios of nitrogen and carbon: a meta-analysis. Ecol. Evol. 5, 4829–4839. doi: 10.1002/ece3.1738
Hobson, K. A., and Clark, R. G. (1992). Assessing avian diets using stable isotopes II: factors influencing diet-tissue fractionation. Condor 94, 189–197. doi: 10.2307/1368808
Hobson, K. A., Fisk, A., Karnovsky, N., Holst, M., Gagnon, J.-M., and Fortier, M. (2002). A stable isotope (δ13C, δ15N) model for the North Water food web: implications for evaluating trophodynamics and the flow of energy and contaminants. Deep Sea Res. Part II Top. Stud. Oceanogr. 49, 5131–5150. doi: 10.1016/s0967-0645(02)00182-0
Hobson, K. A., and Welch, H. E. (1992). Determination of trophic relationships within a high arctic marine food web using delta-C-13 and delta-n-15 analysis. Mar. Ecol. Prog. Ser. 84, 9–18. doi: 10.3354/meps084009
Hoondert, R. P., van den Brink, N. W., van den Heuvel-Greve, M. J., Ragas, A. M., and Hendriks, A. J. (2021). Variability in nitrogen-derived trophic levels of Arctic marine biota. Polar Biol. 44, 119–131. doi: 10.1007/s00300-020-02782-4
Hoover, C., Giraldo, C., Ehrman, A., Suchy, K. D., MacPhee, S. A., Brewster, J. D., et al. (2021). The Canadian Beaufort Shelf trophic structure: evaluating an ecosystem modelling approach by comparison with observed stable isotopic structure. Arctic Sci. doi: 10.1139/as-2020-0035
Hop, H., Borgå, K., Gabrielsen, G. W., Kleivane, L., and Skaare, J. U. (2002). Food web magnification of persistent organic pollutants in poikilotherms and homeotherms from the Barents Sea. Environ. Sci. Technol. 36, 2589–2597. doi: 10.1021/es010231l
Hussey, N. E., MacNeil, M. A., McMeans, B. C., Olin, J. A., Dudley, S. F., Cliff, G., et al. (2014a). Rescaling the trophic structure of marine food webs. Ecol. Lett. 17, 239–250.
Hussey, N. E., MacNeil, M. A., McMeans, B. C., Olin, J. A., Dudley, S. F., Cliff, G., et al. (2014b). Corrigendum to Hussey et al. (2014). Ecol. Lett. 17:768.
Jennings, S., Barnes, C., Sweeting, C. J., and Polunin, N. V. C. (2008). Application of nitrogen stable isotope analysis in size-based marine food web and macroecological research. Rapid Commun. Mass Spectr. 22, 1673–1680. doi: 10.1002/rcm.3497
Jennings, S., and Van Der Molen, J. (2015). Trophic levels of marine consumers from nitrogen stable isotope analysis: estimation and uncertainty. ICES J. Mar. Sci. 72, 2289–2300. doi: 10.1111/1365-2656.12504
Jourdain, E., Andvik, C., Karoliussen, R., Ruus, A., Vongraven, D., and Borgå, K. (2020). Isotopic niche differs between seal and fish-eating killer whales (Orcinus orca) in northern Norway. Ecol. Evol. 10, 4115–4127. doi: 10.1002/ece3.6182
Jumars, P. A., Dorgan, K. M., and Lindsay, S. M. (2015). Diet of worms emended: An update of Polyhaete feeding guilds. Annu. Rev. Mar. Sci. 7, 497–520. doi: 10.1146/annurev-marine-010814-020007
Jæger, I., Hop, H., and Gabrielsen, G. W. (2009). Biomagnification of mercury in selected species from an Arctic marine food web in Svalbard. Sci. Total Environ. 407, 4744–4751. doi: 10.1016/j.scitotenv.2009.04.004
Jørgensen, L. L., Archambault, P., Blicher, M., Denisenko, N., Guðmundsson, G., Iken, K., et al. (2017). Benthos. State of the Arctic Marine Biodiversity Report. Akureyri: Conservation of Arctic Flora and Fauna (CAFF).
Kȩdra, M., Gromisz, S., Jaskuła, R., Legeżyńska, J., Maciejewska, B., Malec, E., et al. (2010). Soft bottom macrofauna of an all taxa biodiversity site: hornsund (77° N, Svalbard). Pol. Polar Res. 31, 309–326. doi: 10.2478/v10183-010-0008-y
Kline, T. C., Pauly, D., and Quinn, T. J. I. I. (1998). Cross-Validation for Trophic Level Estimates From a Mass-Balance Model of Prince William Sound Using N15/N14 Data. Fishery Stock Assessment Models. Alaska Sea Grant College Program Report No. AK-SG-98-01. Fairbanks: University of Alaska Fairbanks.
Knies, J., Brookes, S., and Schubert, C. J. (2007). Re-assessing the nitrogen signal in continental margin sediments: new insights from the high northern latitudes. Earth Planet. Sci. Lett. 253, 471–484.
Kohlbach, D., Graeve, M., Lange, A., David, C., Peeken, I., and Flores, H. (2016). The importance of ice algae-produced carbon in the central Arctic Ocean ecosystem: food web relationships revealed by lipid and stable isotope analyses. Limnol. Oceanogr. 61, 2027–2044.
Kohlbach, D., Schmidt, K., Hop, H., Wold, A., Keck-Habahbeh, A., Belt, S. T., et al. (2021). Winter carnivory and diapause counteract the reliance of Barents Sea zooplankton on ice algae. Front. Mar. Sci. 8:266.
Koziorowska, K., Kuliński, K., and Pempkowiak, J. (2016). Sedimentary organic matter in two Spitsbergen fjords: terrestrial and marine contributions based on carbon and nitrogen contents and stable isotopes composition. Continental Shelf Res. 113, 38–46.
Kristiansen, S., Farbrot, T., and Wheeler, P. A. (1994). Nitrogen cycling in the barents sea–seasonal dynamics of new and regenerated production in the marginal ice zone. Limnol. Oceanogr. 39, 1630–1642.
Landry, M. R., and Décima, M. R. (2017). Protistan microzooplankton and the trophic position of tuna: quantifying the trophic link between micro-and mesozooplankton in marine foodwebs. ICES J. Mar. Sci. 74, 1885–1892. doi: 10.1093/icesjms/fsx006
Legeżyńska, J., Kȩdra, M., and Walkusz, W. (2012). When season does not matter: summer and winter trophic ecology of Arctic amphipods. Hydrobiologia 684, 189–214. doi: 10.1007/s10750-011-0982-z
Linnebjerg, J. F., Hobson, K. A., Fort, J., Nielsen, T. G., Møller, P., Wieland, K., et al. (2016). Deciphering the structure of the West Greenland marine food web using stable isotopes (δ13C, δ15N). Mar. Biol. 163:230.
Lippold, A., Bourgeon, S., Aars, J., Andersen, M., Polder, A., Lyche, J. L., et al. (2019). Temporal trends of persistent organic pollutants in Barents Sea polar bears (Ursus maritimus) in relation to changes in feeding habits and body condition. Environ. Sci. Technol. 53, 984–995. doi: 10.1021/acs.est.8b05416
Loeng, H. (1991). “Features of the physical oceanographic conditions of the Barents Sea,” in Proceedings of the Pro MAre Symposium on Polar Marine Ecology, Trondheim, 12-16 May 1990, Book 10. Polar Research, Trondheim.
Loeng, H., and Drinkwater, K. (2007). An overview of the ecosystems of the Barents and Norwegian Seas and their response to climate variability. Deep-Sea Res. Part II Top. Stud. Oceanogr. 54, 2478–2500.
Lønne, O., and Gulliksen, B. (1989). Size, age and diet of polar cod, Boreogadus saida (Lepechin 1773), in ice covered waters. Polar Biol. 9, 187–191. doi: 10.1007/bf00297174
MacKenzie, K., Longmore, C., Preece, C., Lucas, C., and Trueman, C. (2014). Testing the long-term stability of marine isoscapes in shelf seas using jellyfish tissues. Biogeochemistry 121, 441–454.
Martínez del Rio, C., Wolf, N., Carleton, S. A., and Gannes, L. Z. (2009). Isotopic ecology ten years after a call for more laboratory experiments. Biol. Rev. 84, 91–111. doi: 10.1111/j.1469-185X.2008.00064.x
McCormack, S. A., Trebilco, R., Melbourne-Thomas, J., Blanchard, J. L., Fulton, E. A., and Constable, A. (2019). Using stable isotope data to advance marine food web modelling. Rev. Fish Biol. Fish. 29, 277–296.
McCutchan, J. H. Jr., Lewis, W. M. Jr., Kendall, C., and McGrath, C. C. (2003). Variation in trophic shift for stable isotope ratios of carbon, nitrogen, and sulfur. Oikos 102, 378–390.
McGovern, M., Pavlov, A. K., Deininger, A., Granskog, M., Leu, E. S., Søreide, J., et al. (2020). Terrestrial inputs drive seasonality in organic matter and nutrient biogeochemistry in a high arctic fjord system (Isfjorden. Svalbard). Front. Mar. Sci. 7:542563.
McMahon, K. W., Thorrold, S. R., Elsdon, T. S., and McCarthy, M. D. (2015). Trophic discrimination of nitrogen stable isotopes in amino acids varies with diet quality in a marine fish. Limnol. Oceanogr. 60, 1076–1087. doi: 10.1002/lno.10081
McMeans, B. C., Arts, M. T., Lydersen, C., Kovacs, K. M., Hop, H., Falk-Petersen, S., et al. (2013). The role of Greenland sharks (Somniosus microcephalus) in an Arctic ecosystem: assessed via stable isotopes and fatty acids. Mar. Biol. 160, 1223–1238.
Milessi, A. C., Danilo, C., Laura, R. G., Daniel, C., Javier, S., and Rodriguez-Gallego, L. (2010). Trophic mass-balance model of a subtropical coastal lagoon, including a comparison with a stable isotope analysis of the food-web. Ecol. Model. 221, 2859–2869.
Muir, D., Savinova, T., Savinov, V., Alexeeva, L., Potelov, V., and Svetochev, V. (2003). Bioaccumulation of PCBs and chlorinated pesticides in seals, fishes and invertebrates from the White Sea, Russia. Sci. Total Environ. 306, 111–131. doi: 10.1016/s0048-9697(02)00488-6
Navarro, J., Coll, M., Louzao, M., Palomera, I., Delgado, A., and Forero, M. G. (2011). Comparison of ecosystem modelling and isotopic approach as ecological tools to investigate food webs in the NW Mediterranean Sea. J. Exp. Mar. Biol. Ecol. 401, 97–104. doi: 10.1016/j.jembe.2011.02.040
Nilsen, M., Pedersen, T., Nilssen, E. M., and Fredriksen, S. (2008). Trophic studies in a high latitude fjord ecosystem - a comparison of stable isotope analyses (delta 13C and delta 15N) and trophic-level estimates from a mass-balance model. Can. J. Fish. Aqua. Sci. 65, 2791–2806. doi: 10.1139/f08-180
Nygård, H., Berge, J., Søreide, J. E., Vihtakari, M., and Falk-Petersen, S. (2012). The amphipod scavenging guild in two Arctic fjords: seasonal variations, abundance and trophic interactions. Aquat. Biol. 14, 247–264. doi: 10.3354/ab00394
Odum, W. E., and Heald, E. J. (1975). “The detritus-based food-web of an estuarine mangrove community,” in Estuarine Research, ed. L. E. Cronin (New York, NY: Acdemic Press).
Olive, P. J., Pinnegar, J. K., Polunin, N. V., Richards, G., and Welch, R. (2003). Isotope trophic-step fractionation: a dynamic equilibrium model. J. Anim. Ecol. 72, 608–617. doi: 10.1046/j.1365-2656.2003.00730.x
Park, J. Y., Jung, J.-H., Kwak, J. H., Park, H. G., Kang, C.-K., and Park, H. J. (2021). Trophic enrichment factors of carbon and nitrogen isotopic ratios (Δ13C and Δ15N) in four marine ciliates. Front. Microbiol. 12:721157. doi: 10.3389/fmicb.2021.721157
Pauly, D., Christensen, J., Dalsgaard, J., Froese, R., and Torres, F. C. (1998). Fishing down marine food webs. Science 279, 860–863.
Pedersen, T., Mikkelsen, N., Lindstrøm, U., Renaud, P. E., Nascimento, M. C., Blanchet, M.-A., et al. (2021). Overexploitation, recovery and warming of the Barents Sea ecosystem during 1950-2013. Front. Mar. Sci. 8:732637.
Piñeiro, G., Perelman, S., Guerschman, J. P., and Paruelo, J. M. (2008). How to evaluate models: observed vs. predicted or predicted vs. observed? Ecol. Model. 216, 316–322.
Planque, B., Primicerio, R., Michalsen, K., Aschan, M., Certain, G., Dalpadado, P., et al. (2014). Who eats whom in the Barents Sea: a food web topology from plankton to whales: Ecological Archives E095-124. Ecology 95, 1430–1430. doi: 10.1890/13-1062.1
Polovina, J. J. (1985). An approach to estimating an ecosystem box model. Fish. Bull. US 83, 457–460.
Post, D. M. (2002). Using stable isotopes to estimate trophic position: models, methods, and assumptions. Ecology 83, 703–718. doi: 10.1111/j.1095-8649.2012.03251.x
Paar, M., Lebreton, B., Graeve, M., Greenacre, M., Asmus, R., and Asmus, H. (2019). Food sources of macrozoobenthos in an Arctic kelp belt: trophic relationships revealed by stable isotope and fatty acid analyses. Mar. Ecol. Prog. Ser. 615, 31–49. doi: 10.3354/meps12923
Ramsvatn, S., and Pedersen, T. (2012). Ontogenetic niche changes in haddock Melanogrammus aeglefinus reflected by stable isotope signatures, delta13C and delta15N. Mar. Ecol. Prog. Ser. 451, 175–185. doi: 10.3354/meps09604
Rat’kova, T. N., and Wassmann, P. (2002). Seasonal variation and spatial distribution of phyto-and protozooplankton in the central Barents Sea. J. Mar. Syst. 38, 47–75. doi: 10.1016/s0924-7963(02)00169-0
Renaud, P. E., Løkken, T. S., Jørgensen, L. L., Berge, J., and Johnson, B. J. (2015). Macroalgal detritus and food-web subsidies along an Arctic fjord depth-gradient. Front. Mar. Sci. 2:31. doi: 10.3389/fmars.2015.00031
Ruus, A., Øverjordet, I. B., Braaten, H. F. V., Evenset, A., Christensen, G., Heimstad, E. S., et al. (2015). Methylmercury biomagnification in an Arctic pelagic food web. Environ. Toxicol. Chem. 34, 2636–2643. doi: 10.1002/etc.3143
Sakshaug, E., Bjørge, A., Gulliksen, B., Loeng, H., and Mehlum, F. (1994). Structure, biomass distribution, and energetics of the pelagic ecosystem in the Barents Sea: a synopsis. Polar Biol. 14, 405–411.
Shannon, L., Coll, M., Bundy, A., Gascuel, D., Heymans, J. J., Kleisner, K., et al. (2014). Trophic level-based indicators to track fishing impacts across marine ecosystems. Mar. Ecol. Prog. Ser. 512, 115–140. doi: 10.3354/meps10821
Silberberger, M. J., Renaud, P. E., Kröncke, I., and Reiss, H. (2018). Food-web structure in four locations along the European shelf indicates spatial differences in ecosystem functioning. Front. Mar. Sci. 5:119.
Skaret, G., and Pitcher, T. J. (2016). An Ecopath With Ecosim Model of the Norwegian Sea and Barents Sea Validated Against Time Series of Abundance. Fisken og Havet nr. 7-2016. Bergen: Institute of Marine Research.
Skjoldal, H., and Mundy, P. (2013). Large Marine Ecosystems (LMEs) of the Arctic Area. Revision of the Arctic LME Map. Tromsø: Arctic Council.
Sokołowski, A., Szczepańska, A., Richard, P., Kȩdra, M., Wołowicz, M., and Wȩsławski, J. (2014). Trophic structure of the macrobenthic community of Hornsund, Spitsbergen, based on the determination of stable carbon and nitrogen isotopic signatures. Polar Biol. 37, 1247–1260. doi: 10.1007/s00300-014-1517-7
Sotiropoulos, M., Tonn, W., and Wassenaar, L. (2004). Effects of lipid extraction on stable carbon and nitrogen isotope analyses of fish tissues: potential consequences for food web studies. Ecol. Freshw. Fish 13, 155–160.
Stowasser, G., Atkinson, A., McGill, R., Phillips, R., Collins, M. A., and Pond, D. (2012). Food web dynamics in the Scotia Sea in summer: a stable isotope study. Deep Sea Res. Part II Top. Stud. Oceanogr. 59, 208–221. doi: 10.1016/j.dsr2.2011.08.004
Søreide, J. E., Hop, H., Carroll, M. L., Falk-Petersen, S., and Hegseth, E. N. (2006). Seasonal food web structures and sympagic–pelagic coupling in the European Arctic revealed by stable isotopes and a two-source food web model. Prog. Oceanogr. 71, 59–87. doi: 10.1016/j.pocean.2006.06.001
Tamelander, T., Kivimäe, C., Bellerby, R. G., Renaud, P. E., and Kristiansen, S. (2009). Base-line variations in stable isotope values in an Arctic marine ecosystem: effects of carbon and nitrogen uptake by phytoplankton. Hydrobiologia 630, 63–73.
Tamelander, T., Renaud, P. E., Hop, H., Carroll, M. L., Ambrose, W. G. Jr., and Hobson, K. A. (2006). Trophic relationships and pelagic–benthic coupling during summer in the Barents Sea Marginal Ice Zone, revealed by stable carbon and nitrogen isotope measurements. Mar. Ecol. Prog. Ser. 310, 33–46.
Thiel, D., Hugenschütt, M., Meyer, H., Paululat, A., Quijada-Rodriguez, A. R., Purschke, G., et al. (2017). Ammonia excretion in the marine polychaete Eurythoe complanata (Annelida). J. Exp. Biol. 220, 425–436.
Tuerena, R. E., Hopkins, J., Ganeshram, R. S., Norman, L., de la Vega, C., Jeffreys, R., et al. (2020). Nitrate assimilation and regeneration in the Barents Sea: insights from nitrogen isotopes. Biogeosciences 18, 637–653.
Vander Zanden, M. J., and Rasmussen, J. B. (2001). Variation in delta N-15 and delta C-13 trophic fractionation: Implications for aquatic food web studies. Limnol. Oceanogr. 46, 2061–2066.
Vanderklift, M. A., and Ponsard, S. (2003). Sources of variation in consumer-diet δ 15 N enrichment: a meta-analysis. Oecologia 136, 169–182. doi: 10.1007/s00442-003-1270-z
Vieweg, I., Hop, H., Brey, T., Huber, S., Ambrose, W. G. Jr., and Gabrielsen, G. W. (2012). Persistent organic pollutants in four bivalve species from Svalbard waters. Environ. Pollut. 161, 134–142. doi: 10.1016/j.envpol.2011.10.018
Vihtakari, M. (2021). ggOceanMaps: Plot Data on Oceanographic Maps Using ‘ggplot2’. R Package Version 1.1. Available online at: https://CRAN.R-project.org/package=ggOceanMaps
Wold, A., Jæger, I., Hop, H., Gabrielsen, G. W., and Falk-Petersen, S. (2011). Arctic seabird food chains explored by fatty acid composition and stable isotopes in Kongsfjorden, Svalbard. Polar Biol. 34, 1147–1155. doi: 10.1007/s00300-011-0975-4
Woodland, R. J., Magnan, P., Glémet, H., Rodríguez, M. A., and Cabana, G. (2012). Variability and directionality of temporal changes in δ 13 C and δ 15 N of aquatic invertebrate primary consumers. Oecologia 169, 199–209. doi: 10.1007/s00442-011-2178-7
Keywords: ecosystem structure, trophic enrichment factor, Arctic ecosystem, ecosystem comparison, polar bear, food web
Citation: Pedersen T (2022) Comparison Between Trophic Positions in the Barents Sea Estimated From Stable Isotope Data and a Mass Balance Model. Front. Mar. Sci. 9:813977. doi: 10.3389/fmars.2022.813977
Received: 12 November 2021; Accepted: 28 January 2022;
Published: 04 March 2022.
Edited by:
Peter Grønkjær, Aarhus University, DenmarkReviewed by:
Sharon Z. Herzka, Center for Scientific Research and Higher Education in Ensenada (CICESE), MexicoAgnes M. L. Karlson, Stockholm University, Sweden
Copyright © 2022 Pedersen. This is an open-access article distributed under the terms of the Creative Commons Attribution License (CC BY). The use, distribution or reproduction in other forums is permitted, provided the original author(s) and the copyright owner(s) are credited and that the original publication in this journal is cited, in accordance with accepted academic practice. No use, distribution or reproduction is permitted which does not comply with these terms.
*Correspondence: Torstein Pedersen, VG9yc3RlaW4uUGVkZXJzZW5AdWl0Lm5v