
95% of researchers rate our articles as excellent or good
Learn more about the work of our research integrity team to safeguard the quality of each article we publish.
Find out more
ORIGINAL RESEARCH article
Front. Mar. Sci. , 15 June 2022
Sec. Ocean Solutions
Volume 9 - 2022 | https://doi.org/10.3389/fmars.2022.813474
This article is part of the Research Topic Coastal Protection Provided by Ecosystems: Observations and Modeling Across Scales View all 7 articles
 Iris Möller1,2*
 Maria Smaranda Ionescu3,4Adriana Maria Constantinescu3Ben Richard Evans2
 Albert Scrieciu3
 Adrian Stanica3Dumitru Grosu3
Coastal wetlands are dynamic bio-physical systems in which vegetation affects the movement of water and sediment, which in turn build and maintain the landform and ecosystem. Wetlands are an effective buffer against coastal erosion and flooding, enhance water quality and human health and wellbeing. Numerous field and laboratory experiments have quantified the reduction of waves by coastal ecosystems. Numerical models, however, are only able to capture observed reduction in wave energy when calibration coefficients are obtained by comparison with measured dissipation rates. A deeper understanding of how wave attenuation varies over time, with local flow conditions and ecosystem properties, is still lacking and should be acquired from a greater range of ecosystem types and geographical settings. Few studies have observed the detailed seasonal variations in how coastal wetlands function as wave buffers and how such seasonal variations might be explained. Equally, few studies have focused on the effect of coastal reed beds on wave dynamics. This study addresses both: i) seasonal variability in wave dissipation through reed vegetation and ii) intricate connections between reed vegetation and the physical context (meteorological and topographical) that might explain such variability. We present observations of wind generated wave transformation through two Phragmites australis reed beds in the Razelm-Sinoe Lagoon System, Danube Delta, Romania. We find that seasonal changes in vegetation density and biomass, as well as meteorological conditions, affect observed wave conditions within the first few meters of the reed beds. Our results also show a preferential reduction of higher frequency waves, irrespective of reed stem diameter or density and suggest the potential importance of seasonal vegetation debris to observed wave dissipation. Such complex and non-linear biogeomorphic effects on wave dissipation are not currently well understood or captured in the parameterisation of vegetation-induced wave dissipation. Our study highlights the importance of an accurate and temporally granular quantification of nearshore bathymetry, wetland topography, and vegetation to fully understand, model, and manage bio-physical interactions in coastal wetlands. More specifically, our results point towards the need for spatially and temporally explicit wave decay functions in emergent reed vegetation. This is particularly critical where the accurate evaluation of the flood and erosion risk contribution of any wetland is required as part of nature-based coastal protection solutions.
Coastal wetlands are uniquely dynamic examples of interconnected bio-physical systems, in which vegetation affects the movement of water and sediment (Yang et al., 2012; Xue et al., 2021), which in turn build and maintain the wetland landform and ecosystem (see e.g. Yang et al., 2020). The benefits of coastal wetlands (such as mangroves, salt marshes, sea grass, or reed beds) in terms of their positive effect on water quality, reduced coastal flood and erosion risk, and enhanced human health and well-being, have become increasingly recognised over the last twenty years or so (Temmerman et al., 2013; van Wesenbeeck et al, 2016; Rendón et al., 2019). The use of coastal wetlands as a nature-based solution to flood and erosion risk reduction is of particular interest at the present time, as coastal protection costs in many countries are likely to escalate in the face of increasing coastal population, sea level rise, and increased storminess (Nicholls et al., 2018; van Zelst et al., 2021).
There is, however, a key remaining challenge with respect to the full application of knowledge to potential coastal wetland inclusive nature-based solutions for the reduction of flood and erosion risk: the full temporal and spatial variability of the ability of coastal wetlands to fulfil this regulatory ecosystem service is currently not fully understood. This remaining challenge can be split into two components:
i) Firstly, there is still uncertainty around the precise process by which vegetation causes waves to be dissipated. We know that the presence of a ‘rough’ bed with vegetation elements protruding into or through the water column significantly and instantaneously attenuates waves (top arrow in Figure 1A). In a true-to-scale experiment in which dense 70 cm tall salt marsh vegetation was submerged to water depths of 2 m, for example, Möller et al. (2014) recorded dissipation rates of 15-20% over only a 20 m distance for storm surge magnitude waves of significant wave height (Hs) 0.2 to 0.9 m, Fully emergent wetland vegetation, such as reed, of a much lower density (434-483 stems m-2 with a diameter of 14-16 mm at 25 cm above the bed) has also been shown to affect wave heights within the first 3-4 m of a reedbed, with both Lövstedt and Larson (2010) and Möller et al. (2011) recording Hs reduction within the range 2.6 – 11.8% m-1 (i.e. at least 40% over a 20 m distance) at separate locations on the shores of the Baltic Sea.
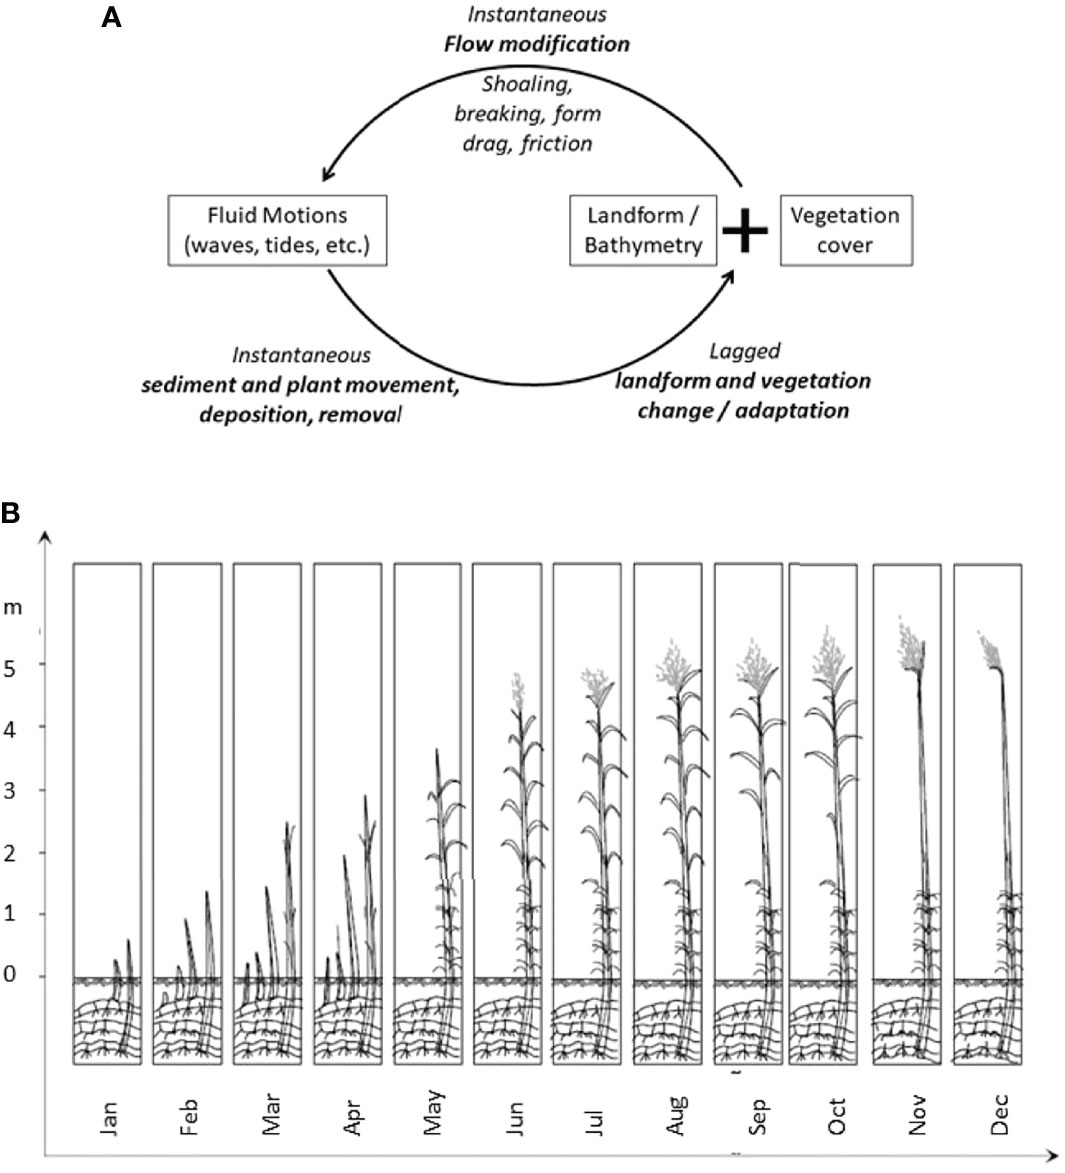
Figure 1 (A) Biomorphodynamic feedback on shallow coasts (adapted from: Cowell and Thom, 1999; and Möller, 2012) and (B) Evolution of a reedbed during the year as represented schematically by Rudescu et al. (1965) and observed at the field sites in this study (see Figure 3 for locations and note reed decay into the winter and re-growth into spring).
Numerical models have been successfully used to calculate observed dissipation rates by representing the effect of vegetation on wave dissipation through a vegetation induced drag (Cd) coefficient, but this has not been possible without direct field calibration. Cd represents the drag resulting from a series of vertical cylinders with a certain width and density (see e.g. Guannel et al., 2015; Mendez and Losada, 2004). Typically, vegetation induced drag varies with hydrodynamic conditions (e.g. captured by the Reynolds number, Re) for an individual vegetation type. However, as Guannel et al. (2015) report from a comprehensive comparison of drag coefficients against observed values of Re, ‘a strong universal relationship between these two dimensionless quantities is unlikely’ (p. 342). Empirical evidence confirms that observed rates of wave dissipation cannot be modelled based on incident hydrodynamic conditions, topography, and vegetation structure alone (Vuik et al., 2016). Consequently, any modelling of wave dissipation rates in a particular setting requires careful calibration before this regulatory ecosystem service can be assessed for present or potential future sea level or wave conditions, and before nature-based flood and erosion-risk solutions can be appropriately valued. Such calibration can be prohibitively expensive where resources for the installation of costly wave sensors are not available and/or physically impossible, or where such installation cannot be achieved in a safe manner due to hazardous terrain or dangerous physical conditions.
ii) Secondly, the fact that wave dissipation benefits fluctuate within an individual setting over time has, thus far, been largely ignored or at least not given the attention it warrants (Bouma et al., 2010; Friess et al., 2012; Schwarz et al., 2018). Such fluctuations over time range from seasonal changes in vegetation characteristics to longer term (annual to decadal) biogeomorphologial feedbacks (the linkage between biota and the physical hydrodynamic and meteorological forces) that can affect trajectories of coastal ecosystem and associated landform changes (Friess et al., 2012; D’Alpaos and Marani, 2015; Möller, 2019). Biogeomorphological feedbacks can operate in a highly non-linear fashion in that the combined effects of the topography and biota on the flow of water over and around the landform, for example, happen instantaneously while the effect of the flow of water on the landform and associated biota may be instantaneous or significantly lagged (Figure 1A).
At an instantaneous time-scale but with decadal consequences, a single extreme storm event or tsunami, while being dissipated by the wetland, can also remove above-ground plant biomass through exerting extreme flow-generated forces on biota (Cahoon, 2006). This, in turn, alters the biological attributes of the ecosystem in a way that has an immediate effect on the landform and its subsequent effect on water flow in a feedback relationship (Figure 1A) (Howes et al., 2010; Leonardi et al., 2018).
The effect of hydrodynamic conditions on the landform and associated biota may, however, also be lagged or cumulative. There is evidence that hydrodynamic exposure of salt marsh species, for example, affects the species physiological and biomechanic properties (Silinski et al., 2018). In brackish to freshwater reeds, water depth and salinity has been suggested as a key control on the biotype of Phragmites australis (Hanganu et al., 1999). Other studies have hypothesized that wave exposure may be an equally contributing factor in determining structural characteristics such as stem diameter of the same species (Coops and Van der Velde, 1996; Möller et al., 2011).
Few studies to date have focused on the precise feedback relationships between coastal vegetation, its structural properties, and its physical resilience to, as well as energy reducing effect on, waves. Given the importance of the protection function provided by such ecosystems against flooding and erosion at a time when coastal population densities, sea level, and storm intensity and magnitude are projected to rise around the world, this is surprising and justifies further research. There is clearly an urgent need for innovative, sustainable, and efficiently integrated coastal zone management strategies that are fully cognizant of biophysical interactions on shallow shores.
The need for such management strategies is, arguably, nowhere more pressing than in the world’s large delta regions. Both mangrove and salt marsh systems have been studied in this context, although our understanding of the full suite of process relationships illustrated in Figure 1A and outlined above is by no means complete (Friess et al., 2012). Fewer studies, still, have focused on deltas fringed by reed beds, such as the Danube Delta.
Unlike mangrove or salt marsh systems, reeds such as Phragmites species, can exhibit extreme seasonality, with notable die-back into the winter months and rapid growth rates in early spring [Rudescu et al., 1965] (Figure 1B). Thus, in the Danube Delta, studies have shown the reed sprout to develop between January and April and, in about 5 months reach a height of between 2 and 5 m depending on the amount of available resources for the rhizomes, the mineral substances from soil and water. In August the growth stops almost completely. The number of leaves begins to diminish (the leaves at the base of the stems begin to fall). The rhizomes continue to grow new underground branches and buds. In September, when the reed reaches physiological maturity, the reed stem has lost around one-third of its leaves, although the rhizomes continue to grow new branches. In October the reeds have leaves on only the uppermost third of the stem. Observations have shown that the giant reed (‘plaur’ reed) loses its leaves sooner than the finer common reed (also referred to as ‘swamp reed’) (Rudescu et al., 1965).
As the structural properties of reed vegetation are inherently seasonally variable and reeds are generally emergent, wave dissipation can be expected to vary seasonally. It is also possible that, over longer (multi-annual/decadal) time-scales, wave exposure itself affects reed plant characteristics.
Here, we report on (i) both seasonal variations in reed wave exposure and wave dissipation, and (ii) potential relationships between reed exposure, morphological reed characteristics, and wave dissipation, within coastal reedbeds fringing the Danube Delta. We explore the importance of considering all the biogeomorphological feedbacks (illustrated in Figure 1) when assessing and developing wetland-inclusive and sustainable nature-based coastal flood and protection measures.
Located in the southern part of the Danube Delta, and as part of the Danube Delta Biosphere Reserve (Figure 2), the Razelm-Sinoe Lagoon System is the largest lagoon in Romania, covering an area of about 1000 km2. The present-day lagoon system was formed after the Halmyris Gulf was isolated from the Black Sea by the accumulation of sand bars in the Late Holocene (Panin, 1996; Ungureanu and Stanica, 2000). In time, due to sedimentation resulting from the continuous interaction between the Danube river system and the Black Sea, the lagoon became divided into two main units: Razelm with an area of 415 km2 and Sinoe with an area of 171 km2. The main water and sediment supply to the lagoon is the Danube river, through its southernmost branch, Sfantu Gheorghe, and through the Dunavat and Dranov channels, which discharge into the north-eastern section of Razelm. Sinoe is still connected to the Black Sea through two inlets, Periboina and Edighiol, regulated during the 1980s but allowed to return to a free-flowing regime over the last 15 years (Ungureanu and Stanica, 2000).
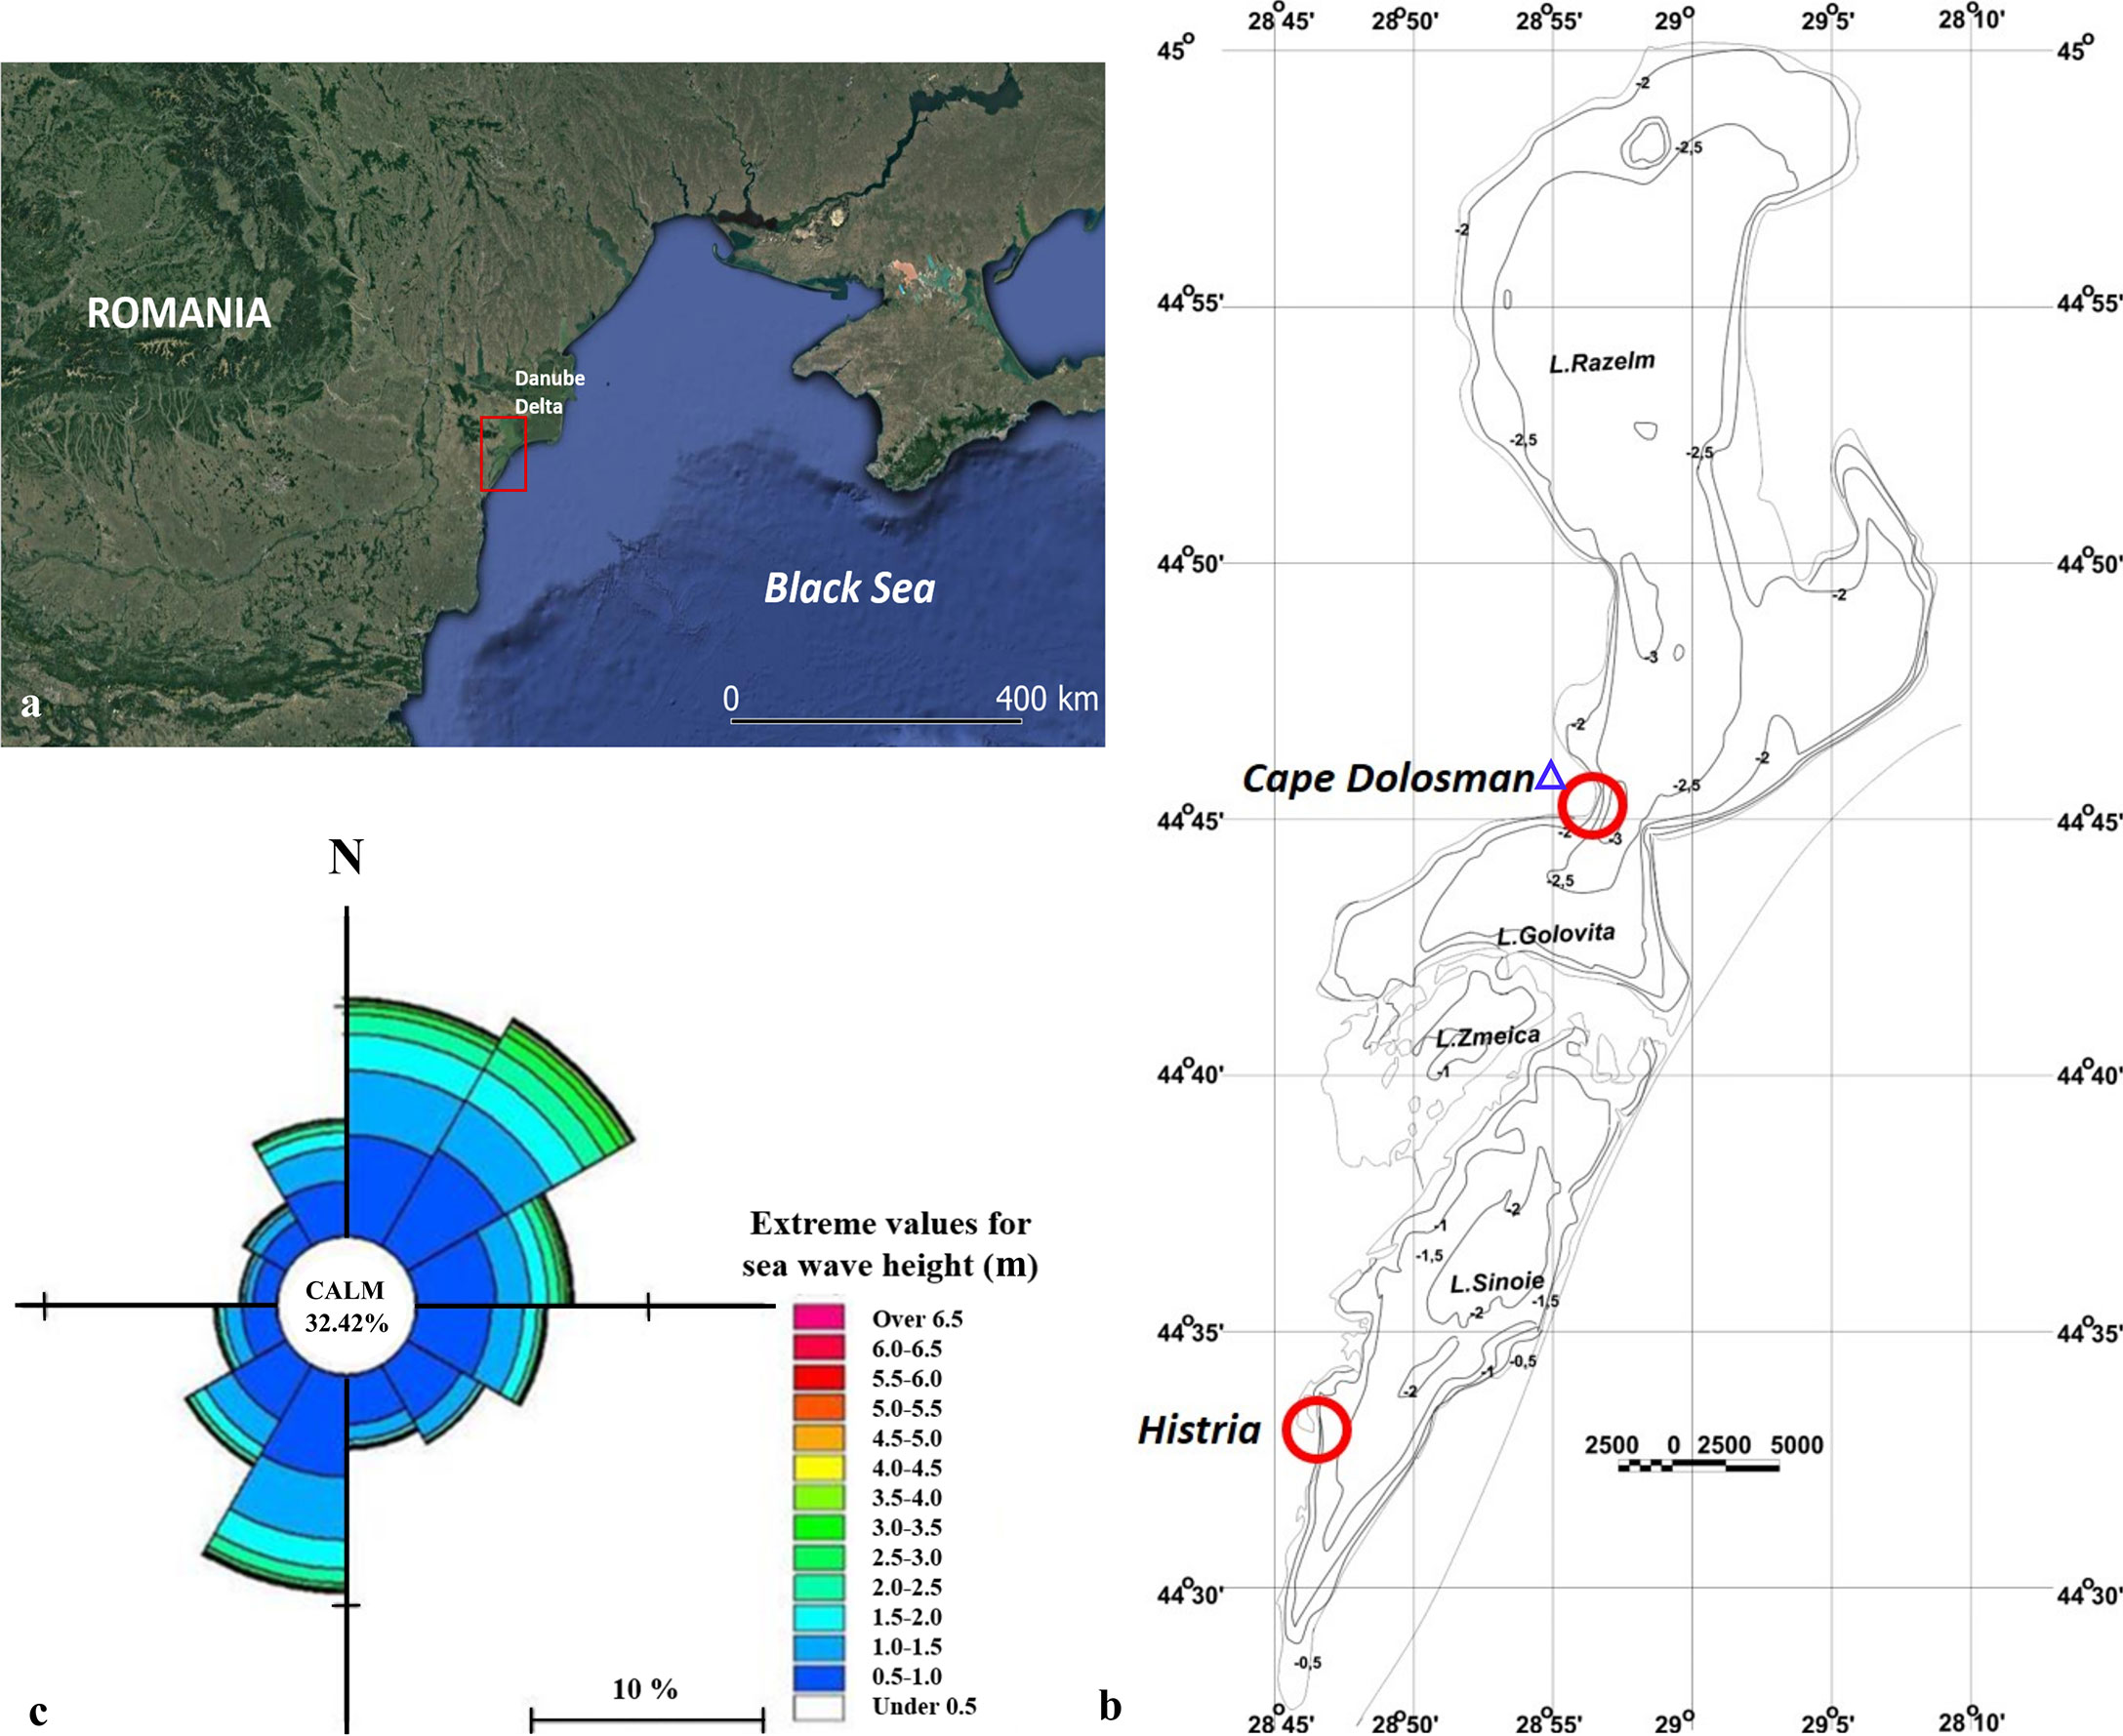
Figure 2 (A) Location of the Razem-Sinoe Lagoon System, in the Danube Delta, Romania; (B) Site 1 (Cape Dolosman) and Site 2 (Histria),shown as red circles in the north and south of the lagoon system, respectively and Jurilovca meteorological station (blue triangle). Detailed bathymetric map of the lagoon system, redrawn from Dimitriu et al., 2008. (C). Wind rose offshore Danube Delta Black Sea Shore (July 1992 – December 2010) (Halcrow, 2012).
Field measurements reported in this paper were conducted between 2014 and 2016 at two sites: (i) Cape Dolosman, situated within the Razelm unit and (ii) Histria, situated within the Sinoe unit (Figure 2). Razelm is under the influence of the Danube waters and thus, salinity is zero. Sinoe is partially connected to the Black Sea and has variable, low salinity, below 10-15 psu (Dinu et al., 2015). During the field measurement period, salinity within the Sinoe lagoon varied from 0.34 psu in spring through to 1.1 psu in summer and 3.5 psu in winter (in-situ measurements taken during the field study).
The climate in the area is temperate continental, with Pontic influences and temperatures typically ranging from -20°C in winter and 36°C in summer (recorded at Jurilovca meteorological station (see Figure 2). Annual rainfall ranges from 350 to 400 mm yr-1, as recorded at the same station.
The two field sites were chosen for their relatively high potential wave fetch and for the different salinities and water depth fluctuations in the Razelm versus Sinoe lagoons and the potentially different reed characteristics that may be associated with these physical differences. The maximum depth of the Razelm lagoon reaches 3 m at approximately 750 m offshore of the Cape Dolosman site, and 1.75 m at approximately 2 km offshore of the Histria site (Figure 2) (Dimitriu et al., 2008). Water depths within the reed bed varied from 0.15 to 1.5 m over the time of this study at the Cape Dolosman site (Razelm lagoon, Figure 2) and 0.1 to 1.0 m at the Histria site (Sinoe lagoon, Figure 2).
Water bodies within the lagoon system are partly or entirely frozen during winter due to long periods with negative temperatures, usually in the months of December – February. Characteristic for the area are strong winds from a N and NE direction that are predominant from September to May and winds from the S and SE that are predominant in the summer months (Halcrow, 2012). Given the orientation of the two sections of the lagoon in a N-S direction, exposed lagoon shores in the West and South can experience considerable waves generated over fetch distances of several kilometers (approximately 20 km for both sites) (see Figure 2).
Phragmites australis reedbeds represent the main type of vegetation within the the Razelm-Sinoe lagoon area, 65-70% of the total vegetation (by mass) present, followed by aquatic and occasionally emergent aquatic vegetation (10-15%), meadow (7%), wood-shrub (5%), saline and psalmophyte vegetation (3%) (Stanica et al., 2013).
Experiments conducted between 1949 and 1953 in the Danube Delta showed that reeds adapt to their living environment and that differences between biotypes appear in different conditions (particularly affected by soil, climate, and water quality) (Rudescu et al., 1965). These studies showed how Phragmites gigantissima (the giant variety of Phragmites australis, also called ‘plaur’ reed) becomes Phragmites communis (swamp or fine reed) and vice versa if transplanted into each-others environment. The two morphologies of common reed (Phragmites australis) were described in detail in Hanganu et al. (1999). Giant reed is characterised by relatively lower stem density (ca 11 ± 5 to 53 ± 37 shoots m-2) but relatively higher stem diameter (5 ± 0.7 to 14.4 ± 2.2 mm) and height (127 ± 28 - 349 ± 33 cm), and it also forms high and thick ‘plaur’ (Romanian, referring to a network of reed rhizomes that retain sediments and organic matter from the water, and develop small islands that can float for long distances). Fine reed, however, grows in very dense stands (142 ± 38 to 174 ± 59 m-2), but is characterised by relatively smaller stem diameters (4.5 ± 1.1 to 6.6 ± 0.9 mm) and heights (163 ± 38 to 237 ± 21) and by rhizomes that are less well developed. It typically grows on firm ground, forming distinct marsh areas (Hanganu et al., 1999).
To capture seasonal ecosystem changes (alongside contextual characteristics, such as topography and sedimentology), vegetation properties, water depths, and wave conditions were measured between the 20th of September 2014 and the 13th of July 2015 at Cape Dolosman and between the 15th of September 2015 and 31st of May 2016 at Histria (for site locations, see Figure 2).
Detailed topographic surveys were conducted at each of the field sites in order to facilitate interpretation of water depth and wave measurements. Dense reed growth precluded detailed surveys within the reed beds themselves for reasons of access, health and safety, but it was possible to acquire detailed surveys of the reed margin and the immediate foreshore with a differential GPS system Trimble R3 L1 [static GPS surveying accuracy: horizontal ± (5 mm + 0.5 ppm)2 RMS, vertical ± (5 mm + 1 ppm)2 RMS]. The topographic profiles of the cross-shore transects along which wave sensors were deployed were obtained with a Trimble M3 DR total station. Figure 3 shows observed bed elevations and the position of the reed margin as recorded during the field survey period.
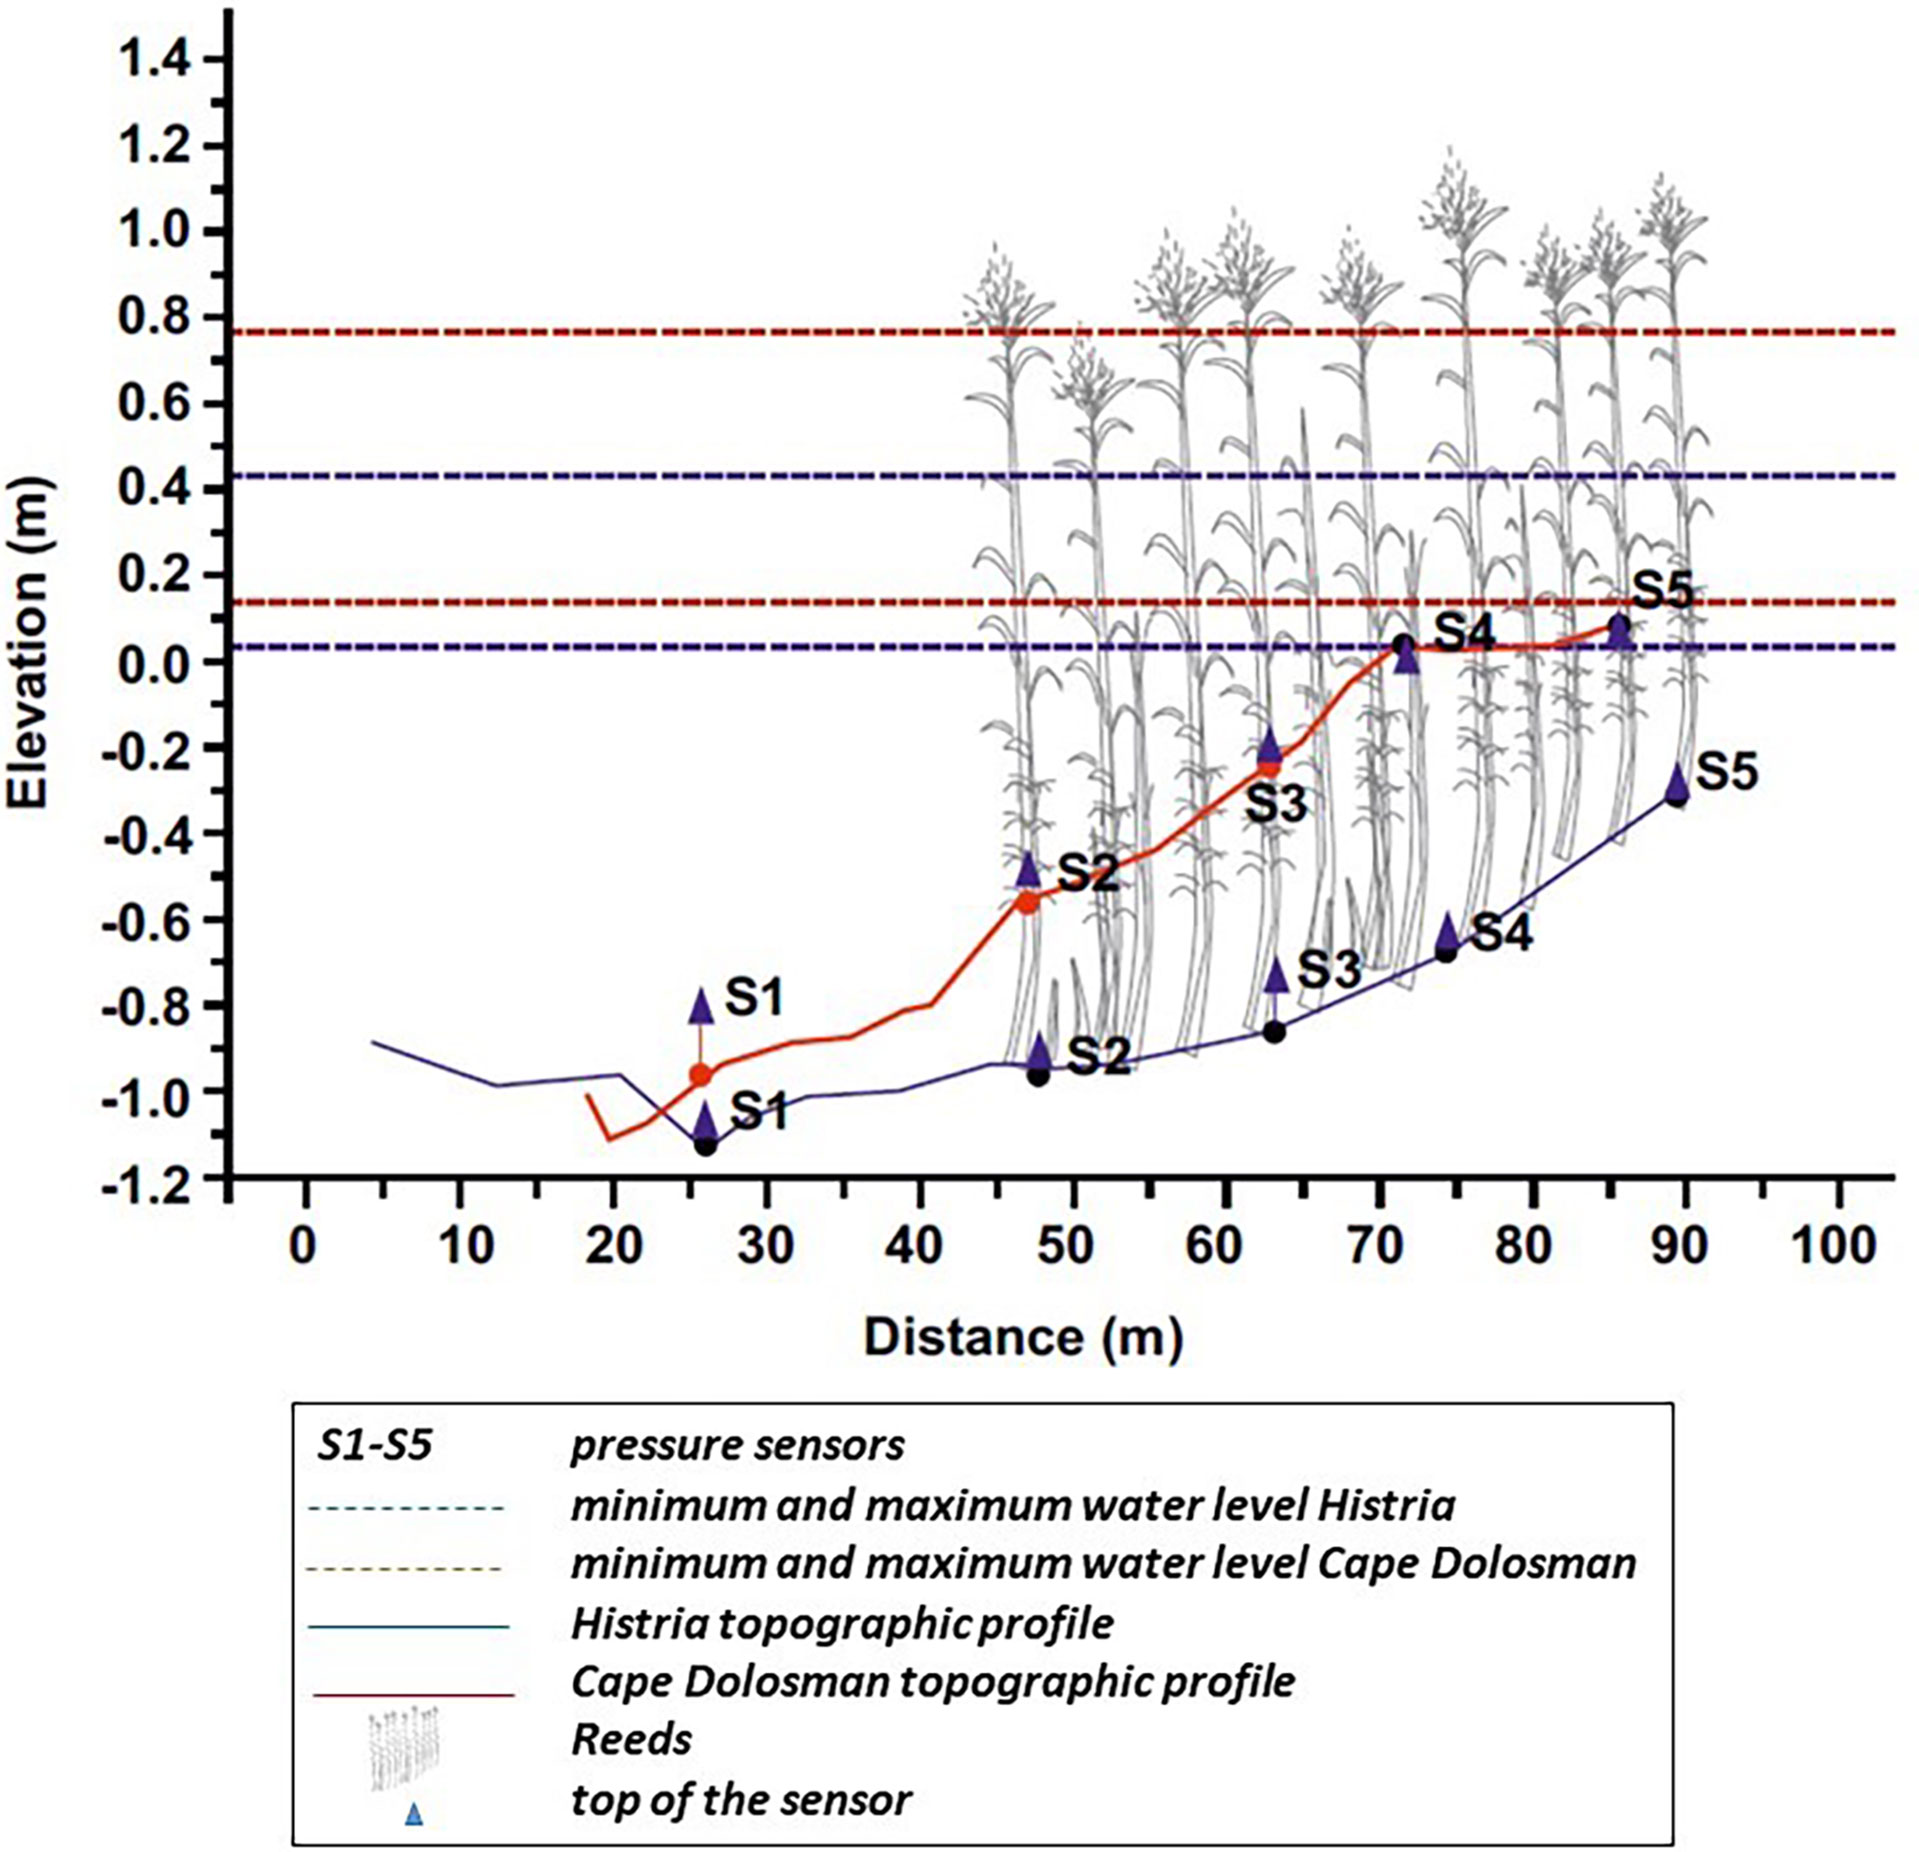
Figure 3 Topographic profiles of the wave transects, showing the position of wave sensors, minimum and maximum water level measured at sensor S2 and the approximate extent of the vegetated area.
For grain size analysis, 15 surface samples were collected, 3 in close proximity (within 40-50 cm) of each sensor, at both field sites. The samples were collected at the time of site installation (August 2014 at Cape Dolosman and July 2015 at Histria). Grain size is not expected to vary seasonally. The main sources of sediment in Razelm are the Danube waters, discharging through the channels in the north-eastern part of the lagoon (Panin et al., 2016). Their influence is restricted to the northern and eastern areas (Stanica, 2013). For Sinoe lagoon, the sources are also very localized, consisting mainly of the exchanges of water and sediment with the Black Sea, in the eastern area (Stanica, 2013).
The samples were analysed in the laboratory of GeoEcoMar, Constanta. The grain-size analyses were performed by dry sieving and, for particles smaller than 63 µm, a laser diffraction particle size analyser (Malvern Mastersizer 2000E Ver.5.20) was used. Results are reported using the Udden-Wentworth scale.
Common reed (Phragmites autralis) is the predominant vegetation at the two studied sites. It covers the shores of both Razelm and Sinoe lakes, with the vegetated zone generally over 60 m wide and reaching more than 150 m in some places. Characteristics of the vegetation were measured at the two study sites, using 10-30 randomly placed 50 x 50 cm quadrats per season. The sampling seasons were chosen to capture the seasons of reed growth and decay in the Danube Delta, as follows: ‘spring’ (April to June), ‘summer’ (July to September) and ‘winter’ (October to March) (Figure 1B). The density, height, stem diameter, biomass and amount of dry (dead) reed vary from season to season (Figure 1B). The quadrats were placed at a minimum distance of 2 m away from the wave transect to avoid damage of the reed beds and interference with the hydrodynamic measurements. This experimental layout was similar to that used by Möller et al. (2011) on the southern shores of the Baltic Sea. In each quadrat, reed density, stem diameter and height were recorded and 10 stems were harvested per quadrat, for determination of biomass and dry (dead) reed matter percentage.
Figure 3 shows the location and bed elevation of all wave measurement positions along the two cross-shore transects at Histria and Cape Dolosman relative to minimum and maximum water levels encountered during the monitoring at both sites. Water level in the Danube Delta varies with the level in the river (Bondar, 1994), with a spring high level (April-June) and a late summer-autumn low level (August-October) (Bondar and Panin, 2001). For the Razelm-Sinoe lagoon, water is also lost through evapotranspiration (Bondar, 1994), but to the authors’ knowledge, no measurements for water level in the lagoon exist.
Following the procedure first used and validated by Moeller et al. (1996), pressure readings were acquired 5-10 cm above the bed in ‘bursts’ of 4096 measurements (17 minutes at 4 Hz) at 8-hourly intervals, i.e. four times per day using bed-mounted cabled ‘Druck’ PDCR1830 pressure transducers. The transducers were centrally controlled via a solar powered Campbell Scientific CR1000 data logging system, allowing for data transmission and remote logger access via the mobile phone network. Initially, at both sites, the most seaward measurement location was located 30 m in front of the reed margin. A further four pressure transducers were placed further landward. Damage due to winter freezing and vandalism reduced the number of locations at which complete records of waves and water levels could be obtained to the three middle locations (S2 to S4 in Figure 3), with the central (S3) and most landward (S4) location at distances of 15 m and 30 m landward of the seaward reed margin sensor (S2) at Cape Dolosman and at 20 m and 35 m landward of the seaward margin (S2) location at Histria, respectively. Upon acquisition of the raw pressure signal, this was processed using previously tested computational routines that (a) remove any low-frequency water level change signal present over the 17 minute period, (b) apply a Fast Fourier Transform to the de-trended high frequency pressure record, (c) adjust the resulting spectrum for pressure attenuation with depth and wave frequency, and (d) re-construct the water level fluctuations and compute key wave parameters (such as significant wave height, Hs, and zero-upcrossing periods, Tz) from the adjusted spectrum and water level trace (Moeller et al., 1999; Möeller, 2006). Total energy dissipation (in Joules m-2) is also computed from the resultant (depth-adjusted) amplitude spectra following the methodology outlined in Möller et al. (1999) and Anderson and Smith (2014).
Wave dissipation is known to follow an exponential decay function (e.g. Anderson and Smith (2014)):
Where Hx is the wave height at the landward end of a cross-shore distance x, H0 is the incident wave height at the seaward point of the transect section, and k is the dissipation coefficient.
Here, we determined k empirically as H0 and Hx are known. We computed k for each transect section [i.e. between position S2 and S3 (hereafter ‘S2S3’), S3 and S4 (‘S3S4)] as well as for the entire transect between S2 and S4 (‘S2S4’) using the Gauss-Newton method of fitting the exponential equation to the data on the basis of a least-squares error. This allows us then to explore the relationship between the dissipation coefficient k, and reed characteristics.
Hourly records of wind speed and direction were obtained from Jurilovca Weather Station situated approximately 7 km NW of Cape Dolosman and 35 km NNE of Histria (Figure 2). The wind data was used to classify wave records into onshore and offshore wind conditions, whereby ‘onshore’ conditions were defined as winds from directions of ±30 degrees either side of the shore-normal transects. As transects at Histria and Cape Dolosman (see Figure 2 for site locations) were oriented at 79 and 100 degrees from North respectively, ‘onshore’ winds for each field site were defined as winds at 49 to 109 and 70 to 130 degrees from North respectively. Only those wave records for which winds were classed as ‘onshore’ were included in our analysis.
Bed elevations were recorded at five positions along the two wave recording transects (from ca 20 m offshore of the reed fringe to ca 30 m into the reed bed, i.e. from position S1 to S4) (see Figure 3). The overall slope was lower at Histria (0.009) compared to Cape Dolosman (0.018). At Histria, the slope fronting the reed margin is near horizontal (< 0.1 m elevation difference) and remains so until a distance of ca 20 m into the reed bed (S3) after which it rises by 0.2 m over the 11 m distance between S3 and S4. At Cape Dolosman, the bed at the reed front slopes relatively more steeply between S1 and S2 (0.2 m elevation difference) and continues to rise at a similar slope until the S4 position.
4.2 At Cape Dolosman, grain size on the wave transect varied from a mixture of fine sand (D50 of 225 µm) and up to 30% gravel and shell debris in the foreshore area (S1 in Figure 3) to fine sand only (D50 of 240 µm to 204 µm respectively) at S2 to S4 and to clayey silt (D50 of 25.5 µm) within the reeds close to the shore (S5, Figure 3). At Histria, grain size also varied along the wave recording transect, ranging from very coarse sand offshore at S1 and S2 (D50 of 506 µm and 456 µm respectively) to very fine sand at S3 (D50 of 106 µm), and clayey silt at S4 and S5 (D50 of 16 and 7.9 µm respectively), inside the reed beds.
Reed stem density was higher at Histria (means of 133, 174, and 146 stems m-2 in winter, spring, and summer respectively) compared to Cape Dolosman (means of 94, 72, and 78 stems m-2). During spring time, stem density at Histria was thus more than twice the density at Cape Dolosman (t-test, p < 0.05), but within-season between-site differences were statistically significant also during summer (t-test, p < 0.05) and winter (t-test, p < 0.10) (Table 1). Mean stem diameters were more than 18% and 7% higher at Cape Dolosman in summer and spring respectively, but only the summer differences were statistically significant (t-test, p < 0.05); in the winter season, by contrast, they were slightly (6%) higher at Histria (but this difference was not statistically significant, p > 0.10). Mean stem heights in Cape Dolosman exceeded those at Histria by just over 6% in summer (not significant, p > 0.10). In winter and spring, however, mean stem heights at Histria were just under 5% and 17% higher than at Cape Dolosman, with the latter difference statistically significant (t-test, p < 0.10). Total biomass was almost twice as high at Histria than at Cape Dolosman in summer and winter but high variability meant that these differences were not statistically significant (t-test, p > 0.10). In spring, biomass at Histria exceeded that at Cape Dolosman by more than a factor of five, a statistically significant difference (t-test, p < 0.05). The percentage of dry (dead) reed matter varied by a factor of 16 (Cape Dolosman) and 9 (Histria) between seasons and was lowest in summer and highest in winter at both sites. The biomass of dry reed reached 80% of the total biomass in the winter at Cape Dolosman and 60% at Histria, while in spring, it was considerably (almost six times) higher at Histria than at Cape Dolosman (Table 1). The latter difference was statistically significant (t-test, p < 0.05).
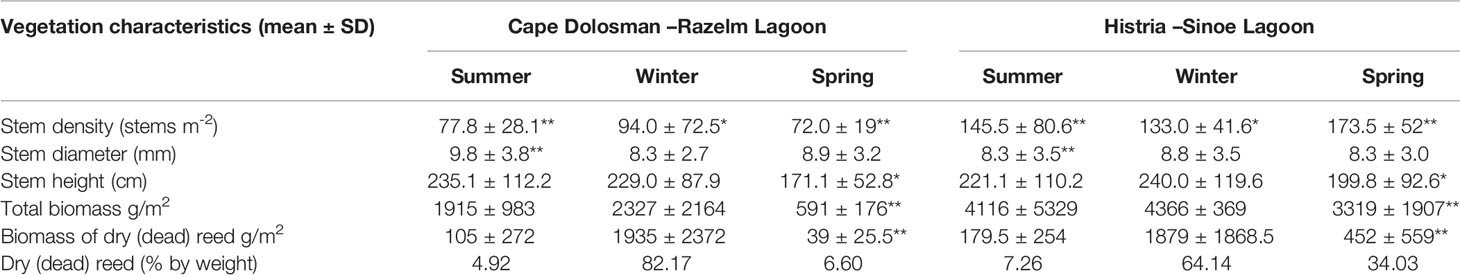
Table 1 Vegetation characteristics at the two studied sites [**indicates difference at p < 0.05 significance level; *indicates difference at p < 0.10 significance level (two-tailed t-test) between the sites within the given season].
Out of all analyzed vegetation parameters, stem density and biomass varied the most between the two sites and this variation was statistically significant (two tailed t-test; p <0.0001 and 0.025 respectively).
Water levels at the most seaward of the three wave recording locations (S2 in Figure 3) averaged 0.99 m (min 0.71 m to max 1.32 m) at Cape Dolosman and 1.11 m (min 0.86 m to max 1.29 m) at Histria, during wave records acquired in onshore wind conditions (see Figures 4B, D respectively). Water temperatures were recorded intermittently during site visits and fluctuated between 10°C in November and close to 30°C in September.
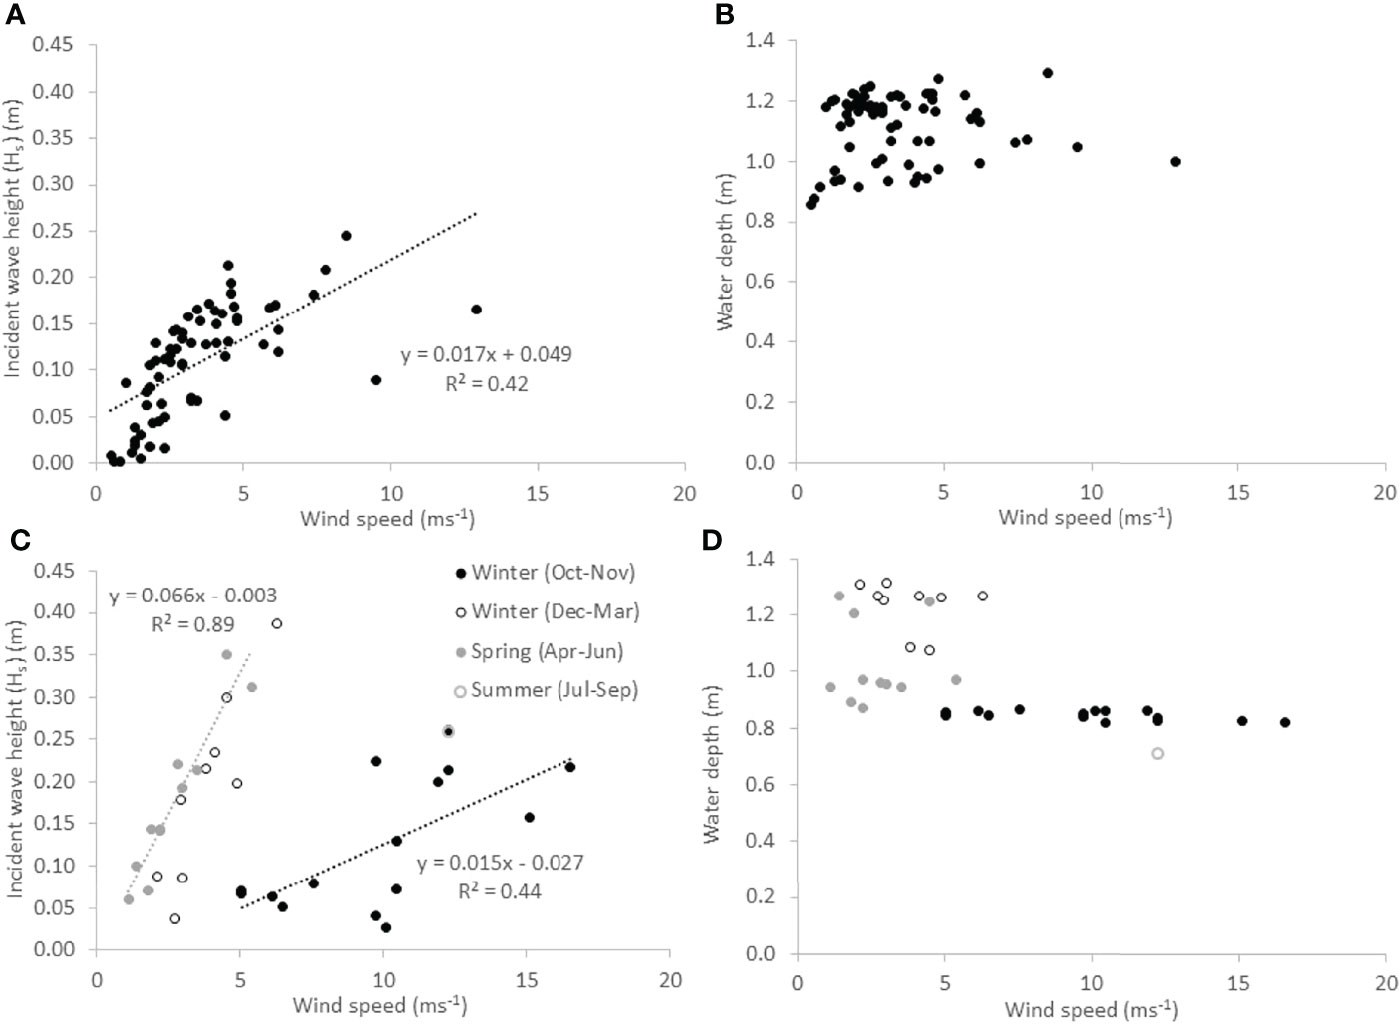
Figure 4 Incident wave height and water depth conditions accompanying different wind speeds during wave recording events at Histria (A, B) and Cape Dolosman (C, D). Regression lines and equations are shown for all data at Histria (A) and winter conditions only at Cape Dolosman (C), where data are shown for different seasons.
Winds were ‘onshore’ (i.e. ± 30 degrees relative to the wave recording transects) during 41 wave records at Cape Dolosman and 72 at Histria. After screening each reconstructed water level record and wave spectrum for malfunction of sensors or effects of sub-zero temperatures on the wave records, 36 intact and quality-controlled records remained for further analysis at Cape Dolosman (1, 24, and 11 in ‘summer’, ‘winter’, and ‘spring’ as defined above) and 66 at Histria (7, 38, 21 respectively). Incident wave heights reached a maximum significant wave height (Hs) of 0.39 m at Cape Dolosman and 0.25 m at Histria and, at Histria, significant wave heights were statistically significantly (p < 0.01) correlated with wind speed as recorded at Jurilovca weather station for all observations (Figure 4A). At Cape Dolosman, this was the case only when records were separated into those acquired between December and June and those acquired between October and November (Figure 4C). The latter period was associated with relatively higher wind speeds (> 5 ms-1) and lower water depths (< 0.9 m) compared to the former (wind speeds < 5 m-1in all but two instances; water depths ≥ 0.9 m) (Figure 4D). Residuals of the wind speed/wave height linear regression were not correlated with water depth (r2 < 0.1).
Relative wave heights (Hs/h, where h refers to water depth) were statistically significantly lower at Histria (mean of 0.097) than at Cape Dolosman (mean of 0.165) (independent sample two-tailed t-test, p<0.01). Incident zero-upcrossing periods (Tz) varied from 1.15 s to 1.92 s at Histria and from 1.23 s to 2.31 s at Cape Dolosman.
At Histria, mean significant wave heights (Hs) varied noticeably between the monitoring stations immediately fronting (mean Hs of 0.11 m at S2) and within the reed bed (0.06 and 0.03 at S3 and S4 respectively), i.e. reducing with distance into the reeds (from S2 to S3 and S4). At Cape Dolosman, mean significant wave heights reduced from 0.16 m at S2 to 0.13 and 0.07 m at S3 and S4 within the reeds respectively.
The highest incident (S2) significant wave height (0.39 m) was recorded on the 17th of March 2015 at Cape Dolosman. At the Histria site, the highest Hs on record at S2 was 0.25 m, recorded on the 10th of March 2016. For the record with the highest incident waves, a clear reduction in Hs is present at both sites: from 0.25 m (S2) to 0.17 m (S3) and 0.09 m (S4) at Histria and from 0.39 m to 0.27 m and 0.22 m, respectively, at Cape Dolosman.
A related-samples Friedman’s two-way analysis of variance test comparing Hs on an ‘event’ basis at S2, S3, and S4 confirms that wave heights were statistically significantly different between all three stations at each site (p < 0.01).
Total energy dissipation over the transect sections S2S3 and S3S4 correlated linearly (r2 = 0.89) with relative water depth at Cape Dolosman (Figure 5A) for wave conditions under near-onshore (± 10° either side of the transect) wind conditions. For winds between 10 and 30° either side of the transect, dissipation rates were less linked to relative water depth (Figure 5A).
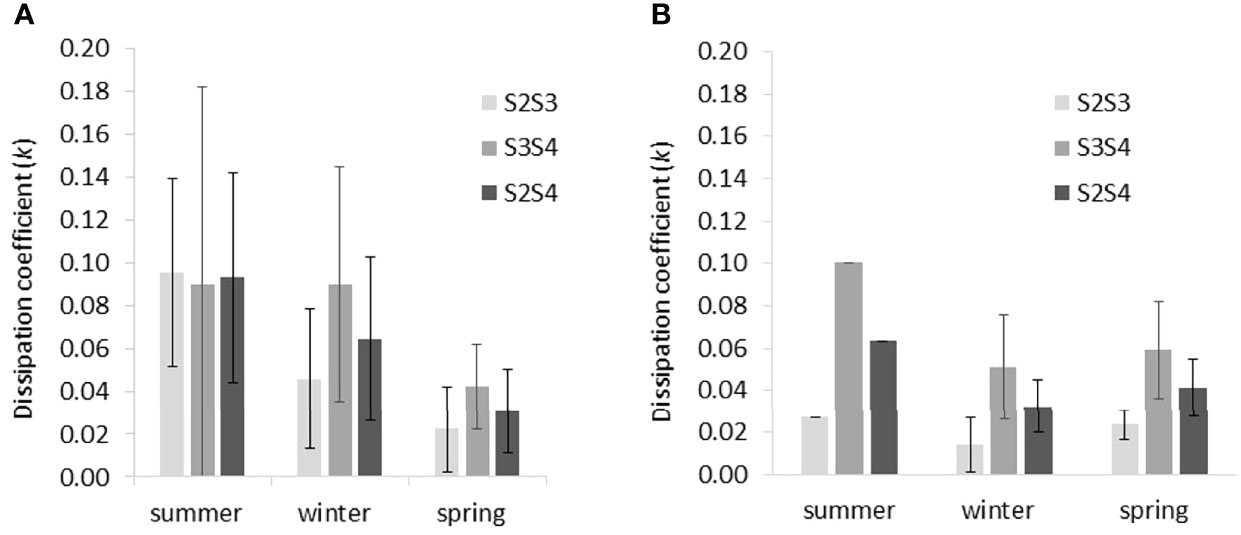
Figure 5 Relationship between relative wave height (Hs/h) and total spectral energy dissipation [(Jm-1) for (A) Cape Dolosman (three different onshore wind directions; linear regression line for winds approaching shore-normal to within ± 10 degress (solid black dots) is shown] and (B) all conditions with onshore (± 30 deg) winds at Histria (second order polynomial regression fit shown).
At Histria, by contrast, a second order polynomial relationship existed instead between normalised total energy dissipation from S2 to S3 and relative wave height for all ‘onshore’ wave records (r2 = 0.99, N=66, p < 0.001). All dissipation rates for waves travelling from S3 to S4 fell on or below this line of best fit (open circles in Figure 5B).
The mean dissipation coefficient, k (see equation 1), as determined empirically for each wave record and each transect section (S2S3 and S3S4) was highest (k of 0.10 m-1) in summer at both sites (Figure 6). k varied little along the transect at Histria in summer, although temporal variability was high (Figure 6A). At Cape Dolosman, only one summer record exists, and, during this event, the landward transect section showed the greatest dissipation (k of 0.10 m-1), while dissipation was lower (k 0.03 m-1) over the most seaward (S2S3) section of the transect. In winter and spring and at both sites, dissipation coefficients were greater over the S3S4 part (k of 0.05/0.06 m-1 and 0.09/0.04 m-1 in winter/spring at Cape Dolosman and Histria respectively) than over the S2S3 part (k of 0.01/0.02 m-1 and 0.05/0.02 m-1 in winter/spring at Cape Dolosman and Histria respectively).
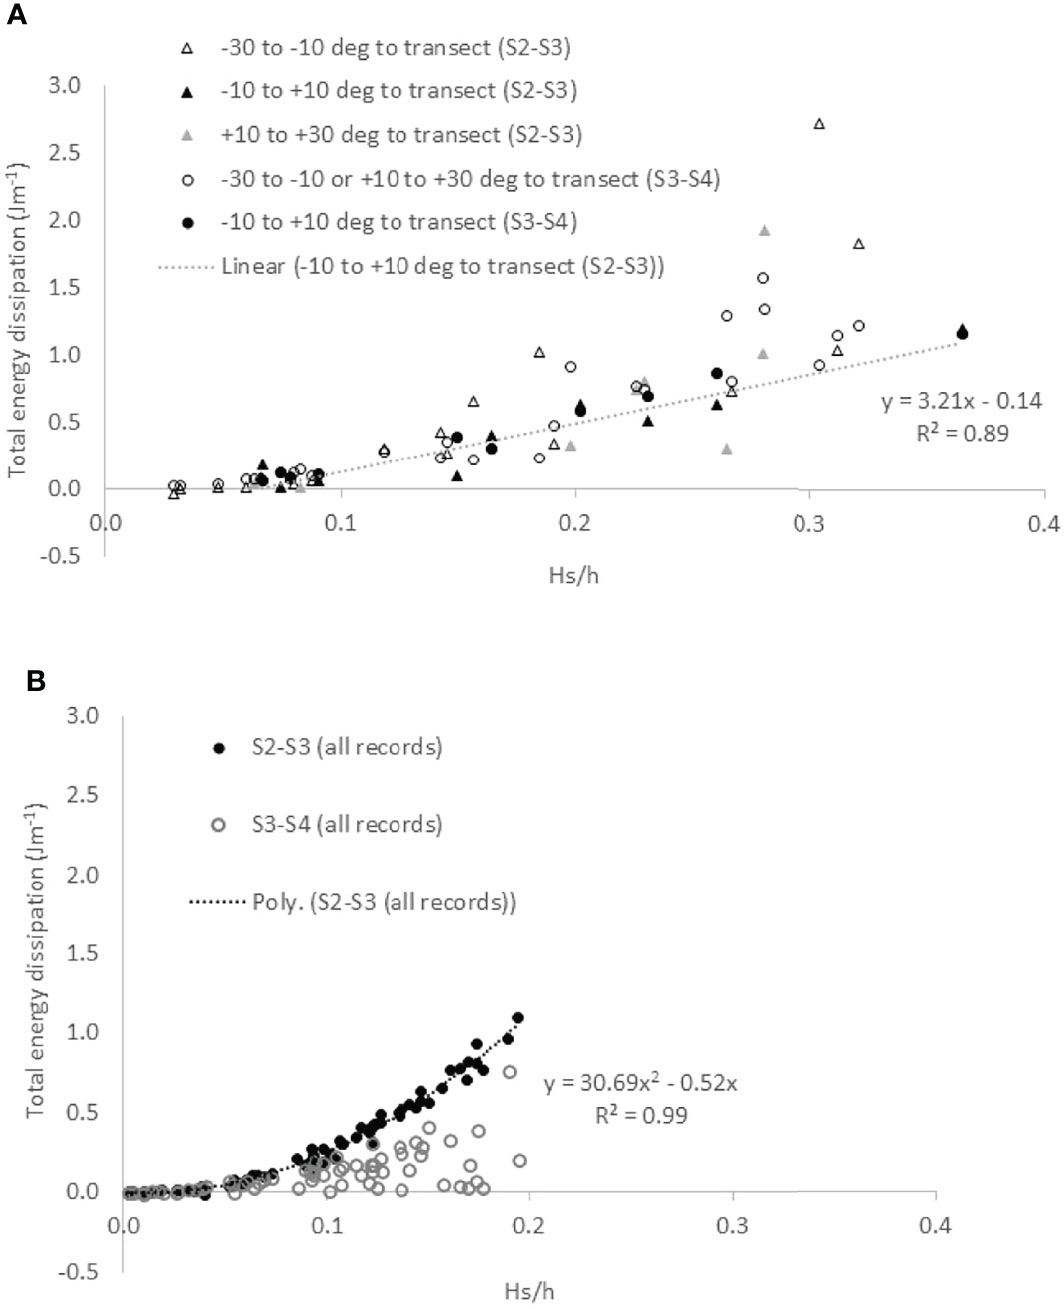
Figure 6 Seasonal variation in mean dissipation coefficients (k) derived empirically from observed wave height dissipation between pairs of sensors (S2S3, S3S4, and S2S4; see Figure 3 for sensor locations) at (A) Histria and (B) Cape Dolosman. Error bars indicate ± 1 standard deviation.
Differences in mean dissipation coefficients between the winter and spring season at Cape Dolosman were only statistically significant for the outer (S2S3) transect section (two-tailed t-test applied throughout this analysis, p ≤ 0.05) but not for the inner section (S3S4) (p > 0.05).
At Histria, mean dissipation coefficients were statistically significantly different (p ≤ 0.01) between winter and summer and between spring and summer at the seaward section (S2S3). At this most seaward section, the difference in mean dissipation coefficient was also significantly different (p ≤ 0.05) between winter and spring. Mean dissipation coefficients were also statistically significantly different (p ≤ 0.01) between winter and spring at the innermost section (S3S4).
Figures 7 and 8 highlight the degree to which the exponential decay function with the empirically determined (across all seasons) dissipation coefficients, k, allows measured wave heights (Hs) at the landward end of the individual sections (i.e. at S3 and S4) to be captured at each site. Sub-panel ‘c’ also shows the degree of fit for the prediction of S3 wave heights based on the best fit decay coefficient for the entire (S2S4) transect.
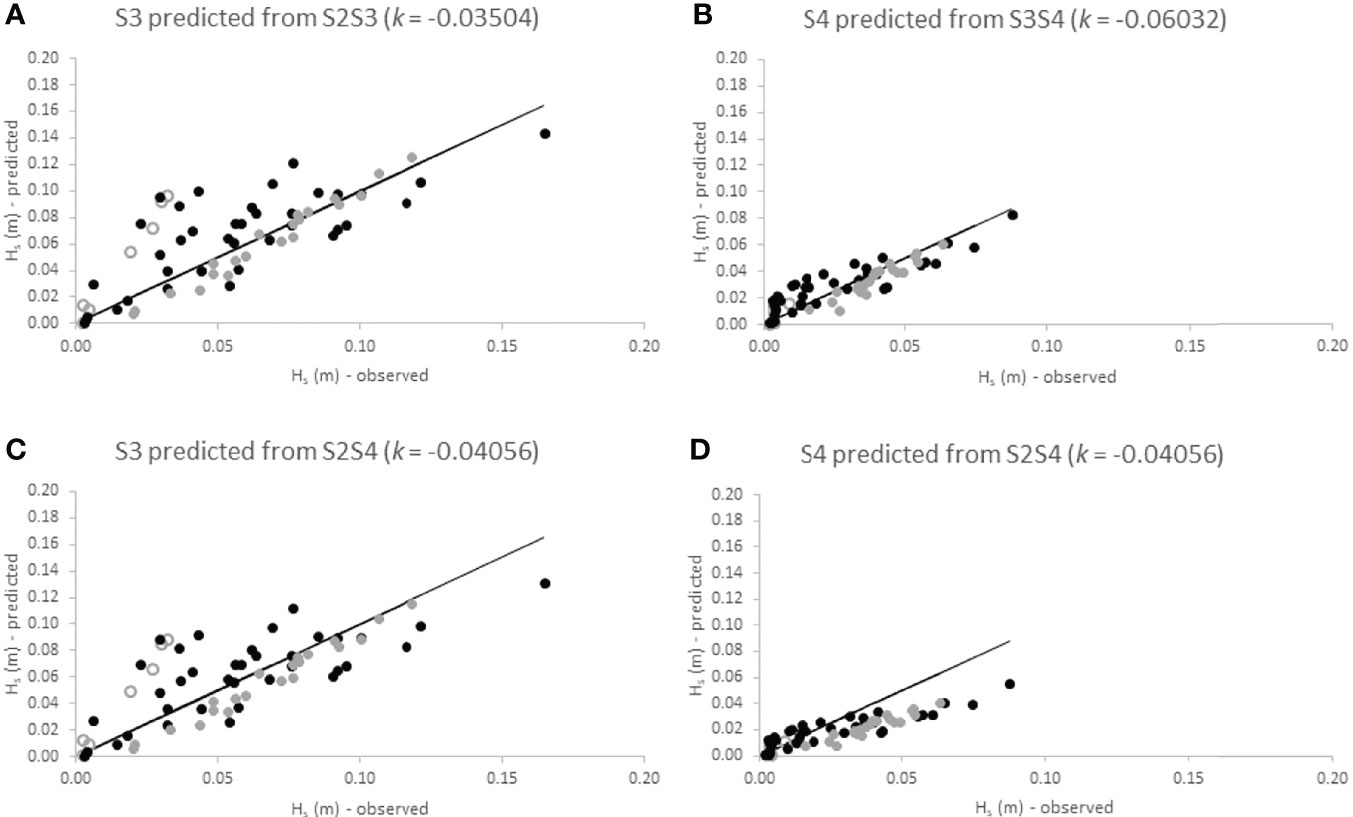
Figure 7 Observed significant wave heights at the landward location of transect sections S2S3 (A), S3S4 (B) and S2S4 (D) at Histria compared to wave heights calculated at those locations using the best-fit dissipation coefficient (k) as derived from observed wave height dissipation over all seasons for those respective transect sections. Panel (C) shows wave heights predicted for the middle location (S3) on the basis of k derived from observed dissipation between S2 and S4. Data is shown per season (open circles = summer; black dots = winter; grey dots = spring). Black lines indicate lines of direct correspondence between observed and calculated wave heights.
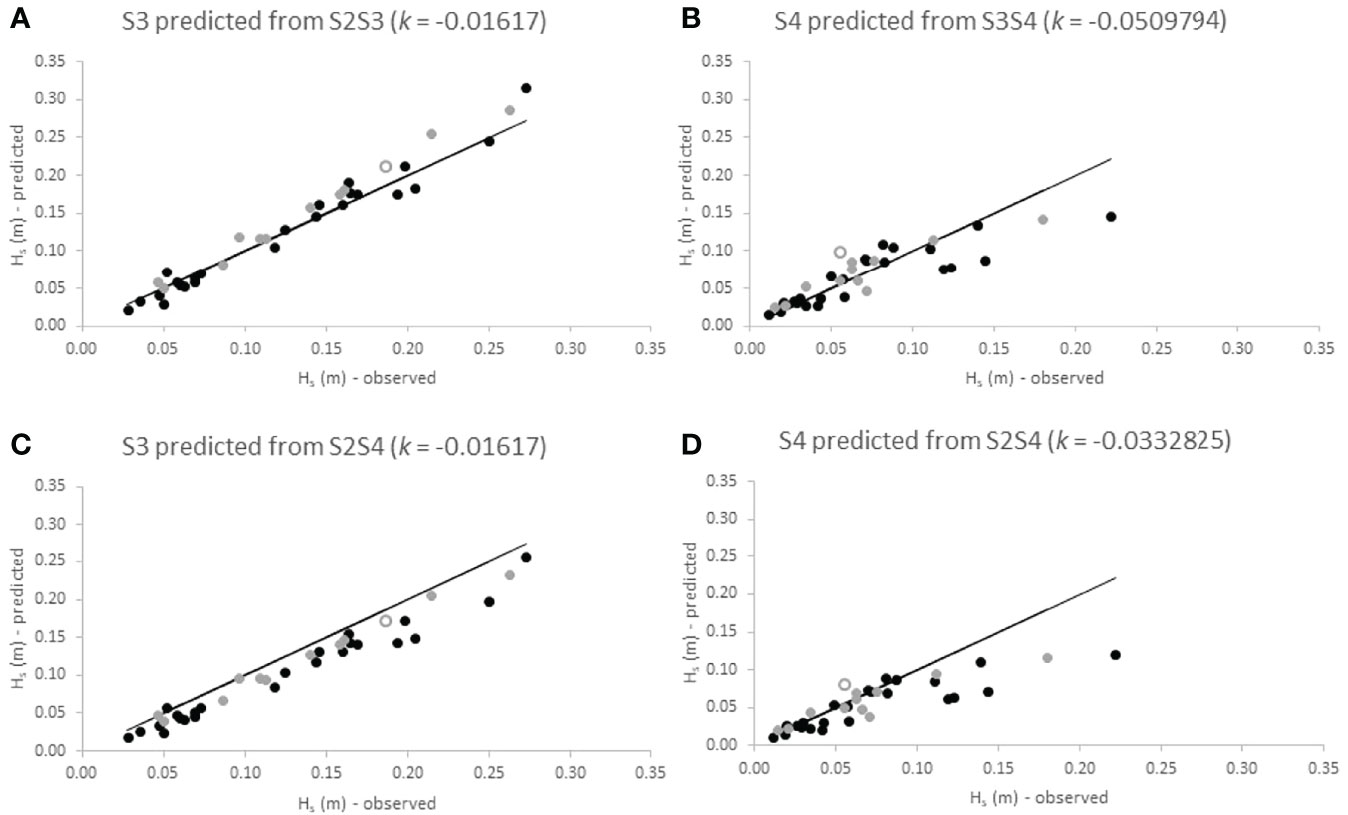
Figure 8 Observed significant wave heights at the landward location of transect sections S2S3 (A), S3S4 (B) and S2S4 (D) at Cape Dolosman compared to wave heights calculated at those locations using the best-fit dissipation coefficient (k) as derived from observed wave height dissipation over all seasons for those respective transect sections. Panel (C) shows wave heights predicted for the middle location (S3) on the basis of k derived from observed dissipation between S2 and S4. Data is shown per season (open circles = summer; black dots = winter; grey dots = spring). Black lines indicate lines of direct correspondence between observed and calculated wave heights.
For Histria, Figures 7A, C show a clear deviation of measured wave heights at S3 from predicted heights in the summer season (open circles). For both scenarios (k for the S2S3 section and k for the S2S4 section), the exponential decay function over-predicts wave heights at the respective landward location in the summer. In spring, however, the exponential decay represents observed wave height decay relatively well (grey dots in Figures 7A–C). In winter, predictive ability is reduced and the exponential decay function both over- and under-predicts observed decay (black dots in Figure 7). The performance of the exponential decay function is comparatively better for the landward section (S3S4) than for the seaward section (S2S3). When predicting wave heights at S4 from the dissipation coefficient determined for the entire transect (Figure 6D), however, the exponential decay function over estimates wave heights for waves with Hs > 0.03 m at S2.
For Cape Dolosman, Figure 8A shows that wave heights at S3 are well captured by the exponential decay function during all seasons. Using the dissipation coefficient determined for the entire transect distance (i.e. S2S4) led to an over prediction (by up to 25%) of wave heights at S3 (Figure 8C). For the S3S4 transect section, the empirically determined k predicted dissipation well for wave heights of up to around 0.10 m but over estimated wave heights for waves greater than 0.10 in height. The same is true for waves predicted for S4 from k derived for the S2S4 transect section (Figure 8D).
Average zero-upcrossing periods (Tz) reduced marginally from S2 (1.5 ± 0.2 s; where ‘±’ indicates one standard deviation) to S3 (1.4 ± 0.2 s) and S4 (1.4 ± 0.4 s s) at Histria, while at Cape Dolosman, Tz reduced from S2 (1.7 ± 0.3 s) to S3 (1.6 ± 0.3 s) and then increased again (to 1.7 ± 0.3 s) at S4 within the reeds.
Incident (S2) wave heights were smaller than 0.1 m for all but one of the conditions, during which the maximum wave period (Tz) shifts were observed. At Histria, wave period shifts were not correlated with either incident wave period (Tz), relative wave height (H/h), Hs, wind speed, or water depth. The same applied to the reed bed margin (S2-S3) at Cape Dolosman. Within the reeds at Cape Dolosman (S3-S4), however, wave period shifts showed a weak but statistically significant (p ≤ 0.01) positive correlation with Tz, H/h, and wind speeds (r2 of 0.27, 0.42, and 0.27 respectively).
Water level records and wave spectra for the three most energetic conditions within the wave records of Histria and Cape Dolosman are presented in Figures 9 and 10. These three records also covered all three seasons at each site. Further information on conditions at the time of these three records at each site are presented in Table 2. Water depths varied between 0.7 m and 1.3 m for all the six records while winds during the 4 Hz water level recording approached from between +7 and -29 degrees either side of the transect at speeds of between 4.5 and 12.9 ms-1 and significant wave heights ranged from 0.21 to 0.39 m. Peak spectral wave periods varied between 1.8 and 2.7 s and, with the exception of the record obtained in winter at Histria (10th March 2016) in conditions of the deepest water depth (1.29 m), peak spectral wave periods were linearly correlated with the zero-upcrossing periods of between 1.7 and 2.3 s (r2 of 0.98 when the record of 10th March 2016 is excluded and r2 of 0.79 including all six records). The attenuation of water level excursions and the corresponding reduction in wave energy for spectral frequencies between around 0.3 and 0.9 Hz (3 to 1 s periods) and between the three locations (S2, S3, and S4) is clearly visible in Figure 9 and 10.
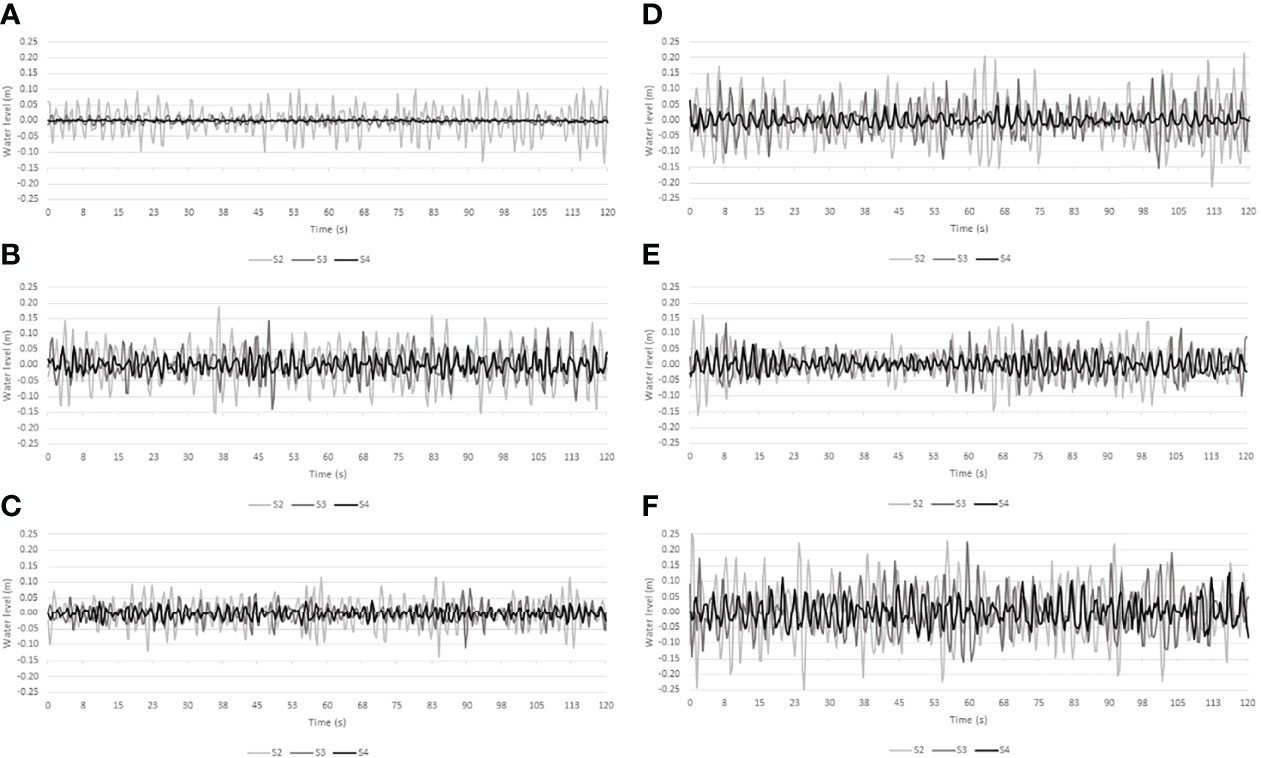
Figure 9 The first 2 minutes of water level fluctuations at all three transect locations (S2, S3 and S4) as reconstructed from depth-adjusted wave spectra at Histria (A–C) and Cape Dolosman (D–F) for the most energetic incident wave conditions (see Table 2 for dates and further information).
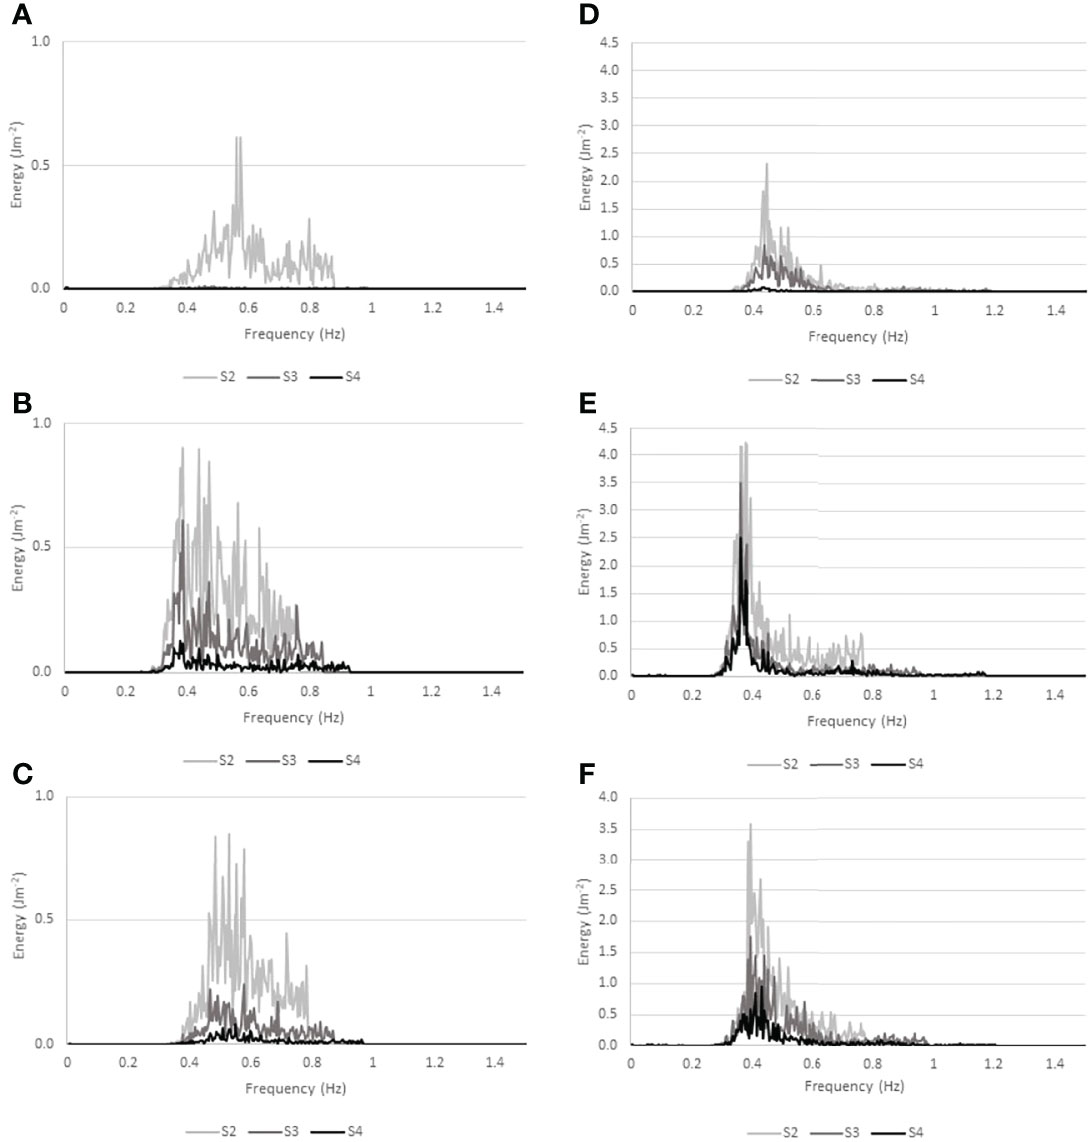
Figure 10 Wave energy spectra for all three recording positions (S2, S3, and S4) at Histria (A–C) and Cape Dolosman (D–F) during the three most energetic events at each site (see Table 3 for dates and further information and Figure 9 for water level traces). different y-axis scaling.

Table 2 Incident wave condition record at Cape Dolosman (CD) and Histria (HS) for onshore wind conditions (± 30 degrees either side of wave recording transect).
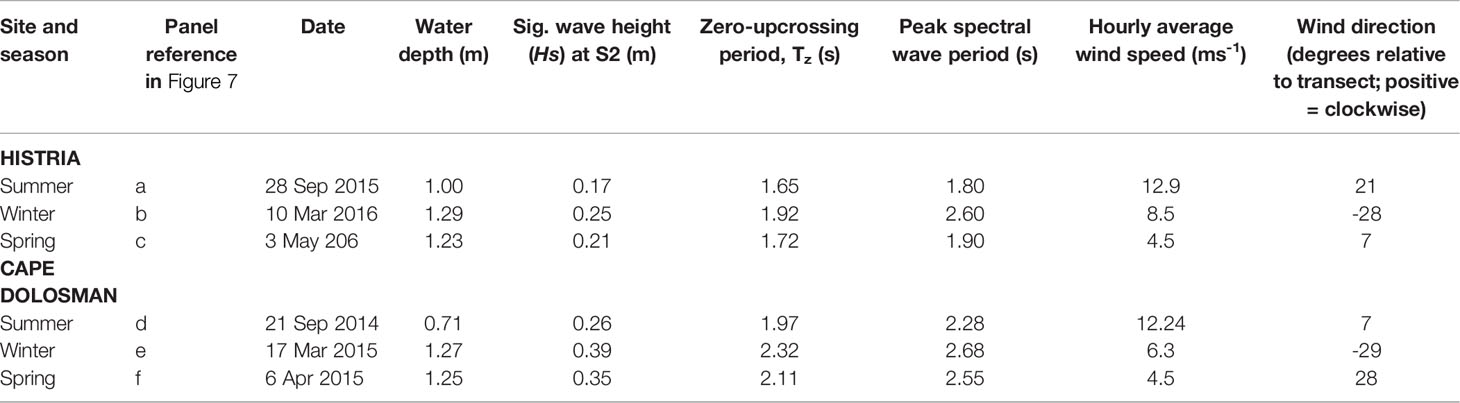
Table 3 Incident water depth wind speed, direction, zero-upcrossing and peak wave periods during the most energetic wave conditions in each season recorded at Cape Dolosman (CD) and Histria (HS) respectively.
The mean stem densities at Cape Dolosman and Histria measured over the course of the year (72-77 and 133-174 stems m-2 respectively) are at the high end of measurements reported elsewhere. Hanganu et al. (1999), for example, reported shoot densities of Giant reed of 11 ± 5 m-2 (freshwater site) to 53 ± 37 m-2 (saline site) and Fine reed of 142 ± 38 m-2 (freshwater site) to 174± 59 m-2 (saline site) in the outer Danube Delta.
With respect to stem heights, our measurements (mean of 171-235 and 200-240 cm at Cape Dolosman and Histria respectively) are within the range reported elsewhere in the outer Danube Delta, where Hanganu et al. (1999) reported heights of between 127 and 349 cm.
The comparison between the reed measurements in this study and those by Hanganu et al. (1999) suggest that both Histria and Cape Dolosman may be characterised by the ‘Fine reed’ variety, although ‘Giant Reed’ grows in small patches at Cape Dolosman and the sites appear characterized by different reed diameters and densities in the summer months. While the Danube Delta as a whole is experiencing a die-back of reed, studies suggest that Giant reed may be particularly affected and replaced by fine reed, the latter being more salt-tolerant (Hanganu et al., 1999). Of the two field sites, it is thus likely that any bio-physical feedbacks observed at Cape Dolosman and Histria will become less and more typical, respectively, of the types of feedback that might characterise the reed fringed shores of the Danube Delta in future, as sea levels and thus salt concentrations rise.
Meteorological conditions alongside water depth and bed slope controls (causing waves to shoal and thus wave heights to increase) can be expected to drive wave heights at vegetated coastal margins (Suzuki et al., 2012; Xue et al., 2021). Water depths and/or wind speeds can thus cause waves at Cape Dolosman and Histria to be depth and/or speed/duration limited.
Wave heights incident upon the reed margin (at S2) were generally small (< 0.39 m) and mean wave heights (Hs) were statistically significantly larger at Cape Dolosman (mean of 0.16 m) than at Histria (mean of 0.11 m) (t-test, p < 0.01). As wind speeds observed during onshore wave conditions at Histria were lower (< 13 ms-1) than at Cape Dolosman (< 17 ms-1), this may explain the greater wave heights at Cape Dolosman. However, although incident wave heights (Hs) at the reed margin correlated weakly with wind speeds at Histria (r2 = 0.42; Figure 4A) and strongly with wind speeds at Cape Dolosman during the December to June period (r2 = 0.89) (Figure 4C), waves during the October to November period were less affected by wind speeds (Figure 4C). Water depths during the monitored onshore wind conditions varied by less than 0.4 m at Histria and 0.6 m at Cape Dolosman. Although the water depth range was comparable between the two sites (0.9 – 1.3 m at Histria and 0.7 – 1.3 m at Cape Dolosman), at Cape Dolosman, the lower water depths (< 0.8 m) in the period October to November, compared to any other time of year when depths exceeded 0.8 m, appear to have resulted in depth-limited conditions for wave growth (Figure 4C). When water depths were deeper during other times of year (Figure 4D) and in spite of the lower wind speeds (< 5 ms-1), incident waves were able to grow to approximately twice the height of the waves in the October to November period (reaching Hs of up to 0.39 cm). Notwithstanding this seasonal water depth effect at Cape Dolosman, the transect here was located landwards of the deepest parts of the entire Razelm Lagoon System (3.5 m depth), while at Histria, the lagoon depth was less (average depth of around 1 m). This may explain the overall higher incident wave heights at Cape Dolosman. It also illustrates the importance of including the entire cross-shore region in any assessments of the coastal protection function provided by a coastal wetland. The importance of maintaining a shallow fronting foreshore to limit incident wave energy and allow the wetland to establish and thrive is often omitted from discussions around the use of coastal wetlands as nature-based coastal protection solutions. Xue et al. (2021) draw attention to the fact that nature-based coastal protection solutions need to be conceived of at the ‘landscape scale’ to fully account for all the factors determining (a) the exposure of the vegetated coastal fringe and (b) wave dissipation across that fringe. Our study confirms the importance of such an approach. However, while data on shallow coastal bathymetry is urgently required, it remains sparse and costly to obtain as access by vessels with depth sounding equipment is often difficult if not impossible in these water depths and satellite based remote sensing methods have thus far not achieved the sub-meter accuracy needed (Caballero and Stumpf, 2019; Xue et al., 2021).
The greater slope (0.018) present at the reed margin itself at Cape Dolosman compared to Histria (0.009) (see topographic profiles in Figure 3) may also explain some of the differences in incident wave heights. This greater slope may have caused waves to shoal and increase in height. Aside from seasonally varying water depth, seasonal differences in reed margin vegetation characteristics and seaward extent may have affected wave heights present at the margin. Reed stem density at Cape Dolosman was greatest in winter (94 compared to 77 and 72 stems m-2 in summer and spring respectively), unlike at Histria, where it was greatest in spring (at 173 compared to 146 and 133 stems m-2 in summer and winter respectively). More frequent observations of reed margin development as well as water levels across the seasons would shed further light on the patterns shown in Figure 4.
Few observations of wave propagation within reed beds exist, but those that do typically capture high temporal variability in both wave conditions and dissipation rates (Lövstedt and Larson, 2010; Möller et al., 2011). Such temporal variability is also characteristic of the wave decay measured at Histria and Cape Dolosman Figures 5, 6).
Average wave height decay coefficients (k) ranged from 0.02 to 0.10 m-1 at Histria and from < 0.01 to 0.10 m-1 at Cape Dolosman. These values compare well with those of the laboratory study with artificial emergent vegetation conducted by Anderson and Smith (2014) who record k between 0.02 and 0.12 m-1. At a maximum mean seasonal density of 174 stems m-2 [Histria in spring (see Table 1)], however, vegetation stem densities in this study were considerably lower than those in Anderson and Smith (2014) laboratory study. It is possible that the greater bed roughness in the field compared to that simulated in the laboratory played a role in raising overall dissipation rates in the field setting.
The two key field studies available, that have measured wave height dissipation in reed stands in similar settings, can be compared to this study (i.e. mean Hs reduction of 1.5% m-1 (Cape Dolosman) and 2.7% m-1 (Histria): First, Lövstedt and Larson (2010) report mean rates of root-mean-square wave height reduction of 4-5% m-1 at the margin (4-15 m into the vegetation) of a Phragmites australis reed bed on the northern shores of Lake Krakesjön in southern Sweden. Second, Möller et al. (2011) report a wider range (mean rates of Hs reduction of 2.6% m-1 and 11.8% m-1) at a sheltered and exposed site, on the southern shores of the Baltic sea in east Germany.
Comparing our observations with Lövstedt and Larson (2010) and Möller et al. (2011), water depths were lowest in the Lövstedt and Larson (2010) study (0.4 m), higher in Möller et al. (2011) [0.5 to 1.6 m but with > 90% of the observations at < 0.8 m depth)] and highest in this study (0.7 to 1.3 m). It is thus perhaps not surprising that dissipation rates were highest in the study of Lövstedt and Larson (2010), lower in Möller et al. (2011), and lowest in this study.
Vegetation characteristics are a key determinant in shallow-water wave dissipation, particularly for emergent vegetation [see Anderson and Smith (2014) for a general review]. Yang et al. (2012) provide evidence for a clear exponential increase in wave dissipation per unit distance with a decrease in the ratio of water depth at high tide to vegetation height in Spartina alterniflora marshes of Chongming island on the Yangtze Estuary. For emergent conditions (i.e. ratio of water depth to vegetation height less than 1), wave height reduction varied from just over 1% m-1 to 6% m-1 in Yang et al. (2012) study, placing our results for Phragmites australis reported here (mean of 1.5% m-1 at Cape Dolosman and 2.7% m-1 at Histria) at the lower end of that spectrum.
Reed diameters and stem density may, in part, explain the lower dissipation rates recorded in this study, where stem densities were relatively low (72 - 94 m-2 at Cape Dolosman and 133 - 174 m-2 at Histria), compared to around 300-600 m-2 in Yang et al. (2012) study and > 400 m-2 in Möller et al. (2011) study. At 8.3 - 9.8 mm, however, stem diameters in this study were almost twice those reported by Yang et al. (2012) (average diameter of 3.5 mm), Lövstedt and Larson (2010) (ca 4 mm) and Möller et al. (2011) (ca 4-5 mm). These comparisons and the comparison between stem densities/diameters at Cape Dolosman and Histria suggest that the relatively lower dissipation rates observed in this study reflect lower stem densities and that the effect of stem density may be greater than that of stem diameter. The effect of the comparably low stem densities in the Lövstedt and Larson (2010) study may have been compensated by the relatively shallower water depth encountered there and thus the increased effect of bed friction on dissipation.
Our results also show a clear dependency of dissipation on relative wave height (Hs/h, Figure 5), suggesting that bed friction remains a dominant control on wave dissipation alongside form drag around the emergent reed vegetation, most notably when waves are approaching close to the line of the transect. The importance of relative wave height to wave dissipation has been evident in field measurements elsewhere (e.g. Yang et al., 2012) but the comparison in how this relationship manifests itself at each of our two sites suggests that, due to a non-linear increase in energy dissipation with Hs/h at Histria, wave dissipation at this site exceeds that at Cape Dolosman for similar Hs/h conditions, particularly, towards the maximum Hs/h recorded at Histria. At both sites, Hs/h ratios remained well below the shallow water breaking ratio of 0.78 and a non-linear increase in interaction between waves and the bed is expected towards that point (Le Hir et al., 2000). The fact that wave heights remain generally lower, and thus Hs/h ratios remain restricted to less than 0.2 at Histria, may reflect relatively shallower lagoon water depths closer to the transect. The more linear relationship between Hs/h and wave dissipation and the larger overall range of Hs/h conditions observed at Cape Dolosman (Figure 6), suggests that either waves at this site continued to be affected by wind speed as they propagated from S2 to S3 and/or the steeper bed slope at this site caused waves to shoal and gain in height, as mentioned above. Yang et al., 2012, for their study on Spartina alterniflora marshes on the Yangtze estuary, already provide evidence for the need to determine locally specific dissipation/drag coefficients on account of locally varying plant characteristics, hydrological, and topographical conditions. Our study supports these findings in the context of Phragmites australis reed and adds to this evidence that small-scale (cm to m distance) wave generation and shoaling processes may also be important, neither of which are commonly resolved in coastal wetland wave dissipation models but have the potential to be counteracting dissipation induced by the vegetation canopy.
None of the above studies investigated the effect of seasonal variations in the vegetation characteristics on wave transformations within reed vegetation. This study has shown that reed vegetation properties can vary significantly between seasons and across space (within and between sites). Further, the contrasting seasonal reed density and extent may be a key factor in determining wave conditions at the outermost reed bed fringes.
The lower dissipation rates over the S2S3 section of the transect at Cape Dolosman (k of 0.03 and 0.01 in summer and winter respectively) compared to Histria (k of 0.05 and 010 respectively) (Figure 6) coincide with lower stem densities (78 and 94 stems m-2 compared to 146 and 133 stems m-2) (Table 1). It is also clear from Figure 6–8, however, that the spatial pattern of dissipation across the transect differs between sites and with respect to the theoretically expected exponential decay function (eq. 1). Thus, at Histria, we observed a consistent mean decay coefficient k across all transect sections during the summer (Figure 6A), but this was not the case for Cape Dolosman (Figure 6B), although only one observation was available for the latter during summer. At Cape Dolosman, dissipation over the S3S4 section of the transect was considerably lower (k = 0.05) than at Histria (k = 0.09). This may well be explained by the lower reed stem density (94 compared to 133 stems m-2) and lower biomass (2327 compared to 4360 gm-2) at Cape Dolosman as well as the greater proportion of dead (dry), rather than live, biomass (82% dry (dead) reed at Cape Dolosman compared to 64% at Histria) (Table 1).
If the difference in dissipation is down to vegetation properties alone, however, our data suggest that reed diameters may override the effect of reed density in that, for example, greater dissipation at Cape Dolosman occurred in spring (k = 0.02 over the S2S3 distance; mean reed diameter 8.9 mm) compared to winter (k = 0.01; mean reed diameter 8.3 mm) while stem density was greater in winter (94 stems m-2) compared to spring (72 stems m-2).
Existing theory (e.g. Mendez and Losada, 2004; Paul and Amos, 2011; Anderson and Smith, 2014); assume a relationship between stem diameters, density, and the wave dissipation coefficient, k. The data presented here (Figures 6–8 alongside Table 1) suggests that:
(a) seasonal differences in vegetation properties may play an important role in determining dissipation rates within reed beds in one location,
(b) it may not be sufficient to determine one dissipation coefficient per site, due to significant differences in dissipation rates within sites/along cross-shore transects, and
(c) the performance of the exponential decay function itself may need to be questioned as it may not accurately represent the decay during all hydrodynamic and biogeomorphological conditions.
Further studies on the seasonal variations in reed vegetation characteristics, including the temporary accumulation of dry (dead) reed debris and its fate over the seasons, are needed to better understand ‘a’.
With respect to ‘b’, the least-squares best fit exponential decay function [determined here using a single value for k, from the observed dissipation over the entire transect length (S2S4)] did not accurately represent the dissipation of waves between S2 and S4. For the shorter transect sections (Figures 7A–C and 8A–C), however, landward wave heights were better represented using the dissipation coefficient, k, derived either from observations over the shorter transect sections or from the whole transect (S2S4; Figures 7C and 8C). Our results (particularly Figures 7D and 8D) thus suggest that a spatially varying dissipation coefficient, k, appears necessary for widths of the vegetation zone that exceed the 10-15 m distance of the reed bed margin.
Our study also suggests (‘c’ above and see Figures 7B and 8B), however, that, even when applying a more locally derived dissipation coefficient as waves progress beyond the first 10 to 15 m into the reed stand (in our case for the section S3S4), the exponential decay function underestimates the decay of larger waves. When considering reed beds as nature-based coastal flooding or erosion protection, assuming an exponential decay function (eq 1) with locally calibrated dissipation coefficient k thus leads to a conservative assessment of the protection provided. Further studies are clearly now needed to systematically address the potential physical explanations for this lack of fit of an exponential decay as captured by equation 1 above.
The water level traces (Figure 9) and associated wave energy spectra (Figure 10) of the three most energetic wave events in the record at each site show that the lower energy conditions at Histria were also characterized by higher frequency waves and overall, more complex and less peaked wave spectra. The broader spectra typical of Histria (Figures 10A–C) suggest that waves have had less time to develop than at Cape Dolosman. Numerical modelling of the wind and wave field within this region may confirm these process controls. Within the reeds (S3-S4), at least at Cape Dolosman, the spectra (Figure 10) indicate a shift in the spectral peak period from S2 to S3 during all three events. Once the wave energy has reduced into the reed bed (from S2 to S3), any further reduction in energy appears reflected in all wave frequencies in the case of the two events with the higher (> 0.4 Hz) peak wave frequencies (Figures 10D, F) at Cape Dolosman. This does not hold true for the event with the lower peak wave frequency (< 0.4 Hz) (Figure 10E), which is characterized by a marked reduction in the high frequency components of the spectrum (> 0.4 Hz) but with a much lower reduction in the frequency range < 0.4 Hz. Even at the landward location (S3), the incident peak wave period and energy contained therein are still clearly visible (Figure 10E). This agrees with the observation of preferential dissipation of high frequency parts of the wave spectrum, within the reed beds of the southern Baltic (Möller et al., 2011). Given the emergent nature of reed vegetation, the form drag induced by the reed stems, alongside diffraction and reflection of wave motion by the reed cylinders, the persistence of longer period at the expense of shorter period water level fluctuations makes sense. The particularly strong persistence, in the case of this event, of the waves with the highest energy in this record cannot be explained by wind speed (winds were less than 7 ms-1 at this time (Table 2) and thus unlikely to have sustained wave heights into the inner reed bed) nor by seasonally reduced reed vegetation [in fact, reed density was greater at this time of year than any other time of year (Table 1)].
In contrast to the higher energy conditions at Cape Dolosman, the three highest energy events at Histria are characterized by a more even spread of energy across the frequencies of the spectrum (particularly noticeable in Figure 10B) and a more even reduction of energy at all frequencies from S2 to S3 and S4. The preferential reduction of higher frequency components is still visible in the case of the event that contained waves below the 0.4 Hz frequency (Figure 10B). For the other two records (Figures 10A, C), however, all frequencies appear reduced relatively evenly – and in the case of the lowest energy event of the three (Figure 10A), all of the dissipation in all frequencies occurred within the first transect section (from S2 to S3). It is possible that the very high frequency waves of very small amplitude are filtered out on account of the bottom-mounted pressure gauges missing the lower energy/high frequency wave components, particularly in deeper water. There is a need for future studies to confirm and explain the significance of this particular preferential attenuation of waves of frequencies above 0.4 Hz within coastal reed beds.
Attempts to incorporate some of the types of biogeomorpholgical interactions we identify here at Cape Dolosman and Histria into shallow water numerical wave modelling have only recently been made (Beudin et al., 2017). Our results thus show that short (weekly or monthly) observations may not suffice in order to explain the bio-hydro-morphodynamic processes that control reed shore wave dynamics. Neither is it helpful to report on average annual hydrodynamic and/or vegetation conditions, as seasonal interactions may exist between vegetation and hydrodynamic processes. The winter season is often the time of year when the susceptibility to sediment resuspension and erosion from the bed is greatest, but our results from Cape Dolosman (Figure 4) show that water level may override meteorological controls on wave growth seaward of shallow coastal reed beds and thus limit the waves’ energy incident upon the wetland. As mentioned above, waves can then be further reduced in height, certainly in the early winter period, through increased reed biomass and dry matter before this is removed by storms or ice formation later in the winter and prior to the spring season. Our study clearly suggests that any such attempts must carefully consider what data is used for model validation. Validation through observations acquired during individual inundation/wave events runs the risk of not capturing the temporal variability of the wave dissipation process at an individual site and all the biogeomorphologcical consequences connected to such variability. To advance our process understanding of how, why, and when wave dissipation by coastal wetlands is most effective within any given context, a larger body of continuous seasonal and even multi-annual spatially explicit field observational insights is clearly needed.
Our observations highlight several biophysical interrelationships that are critical to the study of wave dissipation on vegetated shores. Most importantly our results suggest that:
(1) The shallow nearshore region forms a critical component of what is an interconnected system from the shallow nearshore unvegetated foreshore to the inundated upper shore vegetation zone. Without knowledge of the nearshore bathymetry and meteorological effects on shallow water wave dynamics, an interpretation (or indeed modelling) of nearshore wave dynamics and dissipation is impossible. This study, alongside others, confirms the dependency of wave generation and dissipation on water depth (relative wave height). Quantifying shallow-water nearshore bathymetry, however, is often costly and/or difficult and remote sensing methods do not (yet) achieve the sub-meter accuracy needed for the purposes of linking nearshore wave dynamics to bio-physical dynamics on wetland shores (Caballero and Stumpf, 2019).
(2) Meteorological effects on the propagation of waves in shallow coastal vegetated settings are critical for understanding how waves propagate over the vegetated zone and how rapidly wave dissipation takes place during any given event and over time (seasonally, annually, and inter-annually).
(3) Wave transformation within reed beds is affected significantly by seasonal variations in the reed characteristics. In the reed beds studied here, seasonal biomass and dry matter variations resulted in significant differences in wave dissipation coefficients.
4) Further, our results suggest that wave height dissipation beyond the first 10-15 m of the reed bed is not well represented by an exponential decay function.
Critically, our results highlight the importance of direct and year-long empirical field observations for a deeper understanding of the full biogeomorphological feedbacks operating on shallow vegetated coasts. Week- to month-long field measurements are not sufficient to gain the information required to fully understand how, when, and why waves interact in particular ways with the vegetation and topography on these types of coasts. We call upon coastal wetland scientists to use the increasingly sophisticated digital environmental sensing technologies available, alongside the ever greater accessibility, accuracy and temporal frequency of remote sensing imagery, to continue to build the strong empirical knowledge base that is needed, alongside short-term numerical modelling (e.g. along the lines of Vuik et al., 2019), to underpin informed management strategies towards the preservation of the many ecosystem services provided by coastal wetlands.
The raw data supporting the conclusions of this article will be made available by the authors, without undue reservation.
IM was in charge of overall field project management and design and drafted and edited the majority of the text of this manuscript. AdS managed the Romanian team and contributed to site-selection and research design. BE assisted IM with the field project management and was in charge of technical oversight of the data capture and field instrument deployment. MI was in charge of continued data collection on site and, together with BE and AC, played a key role in editing the manuscript. AlS, DG, and MI assisted with field instrument deployment and data analysis respectively.
This work was funded as part of the EU FP7 project FAST (Foreshore Assessment using Space Technology) (grant 607131) and partially supported by three grants of the Romanian Ministry of Research and Innovation (PN 09410302,16450103 and 1920 0201). This work is also part of, and supports the PhD project of MSI, at the University of Bucharest.
The authors declare that the research was conducted in the absence of any commercial or financial relationships that could be construed as a potential conflict of interest.
All claims expressed in this article are solely those of the authors and do not necessarily represent those of their affiliated organizations, or those of the publisher, the editors and the reviewers. Any product that may be evaluated in this article, or claim that may be made by its manufacturer, is not guaranteed or endorsed by the publisher.
We are grateful for field and laboratory assistance to the staff of GeoEcoMar Bucuresti and Constanta and to S Boreham and C Rolfe at the Department of Geography, University of Cambridge. The meteorological data was made available by the Romanian National Meteorological Administration, Constanta. We give a special thank you to Galina Teleuca, deputy mayor of Jurilovca and to the local communities of Jurilovca and Istria for their support during field work.
Anderson M. E., Smith J. M. (2014). Wave Attenuation by Flexible, Idealized Salt Marsh Vegetation. Coast. Eng. 83, 82–92. doi: 10.1016/j.coastaleng.2013.10.004
Beudin A., Kalra T. S., Ganju N. K., Warner J. C. (2017). Development of a Coupled Wave-Flow-Vegetation Interaction Model. Comput. Geosci. 100, 76–86. doi: 10.1016/j.cageo.2016.12.010
Bouma T. J., Vries M., Herman P. M. J., De Vries M. B., Herman P. M. J. (2010). Comparing Ecosystem Engineering Efficiency of 2 Plant Species With Contrasting Growth Strategies. Ecology 91 (9), 2696–2704. doi: 10.1890/09-0690
Bondar C. (1994). Referitor La Aalimetarea Si Tranzitul Apelor Dunarii Prin Interiorul Deltei in Analele ICPDD, 111/2, 259–61 (in Romanian)
Bondar C., Panin N. (2001). The Danube Delta Hydrologic Database and Modelling. Geo-Eco-Marina, 5–6, 5–52
Caballero I., Stumpf R. P. (2019). Retrieval of Nearshore Bathymetry From Sentinel-2A and 2B Satellites in South Florida Coastal Waters. Estuar. Coast. Shelf. Sci. 226 (November 2018), 106277. doi: 10.1016/j.ecss.2019.106277
Cahoon D. R. (2006). A Review of Major Storm Impacts on Coastal Wetland Elevations. Estuar. Coast. 29 (6), 889–898. doi: 10.1007/BF02798648
Coops H., Van der Velde G. (1996). Effects of Waves on Helophyte Stands : Mechanical Characteristics of Stems of Phragmites Australis and Scirpus Lacustris Hugo Coops Av. Aquat. Bot. 53, 175–185. doi: 10.1016/0304-3770(96)01026-1
Cowell P., Thom B. (1994). ““Morphodynamics of Coastal Evolution,”,” in Coastal Evolution: Late Quaternary Shoreline Morphodynamics. Eds. Carter R., Woodroffe C. (Cambridge: Cambridge University Press), 33–86.
D’Alpaos A., Marani M. (2015). Reading the Signatures of Biologic-Geomorphic Feedbacks in Salt-Marsh Landscapes. Adv. Water Resour. 000, 1–11. doi: 10.1016/j.advwatres.2015.09.004
Dimitriu R. G., Oaie G., Gomoiu M. T., Begun T., Szobotka S., Radan S., et al. (2008). O Caracterizare Interdisciplinară a Stării Geoecologice a Complexului Lagunar Razelm - Sinoie La Începutul Secolului XXI, GEO-ECO-MARINA 14/2008 – SUPLIMENT NR. 1.
Dinu I., Umgiesser G., Bajo M., de Pascalis F., Stănică A., Pop C., et al. (2015). Modelling of the Response of the Razelm – Sinoe Lagoon System to Physical Forcing. GeoEcoMarina 21, 5–18.
Friess D., Krauss K. W., Horstman E. M., Balke T., Bouma T. J., Galli D., et al. (2012). Are All Intertidal Wetlands Naturally Created Equal? Bottlenecks, Thresholds and Knowledge Gaps to Mangrove and Saltmarsh Ecosystems. Biol. Rev. Cambr. Philos. Soc. 87 (2), 346–366. doi: 10.1111/j.1469-185X.2011.00198.x
Guannel G. P., Ruggiero J., Faries K., Arkema M., Gelfenbaum P. G., Guerry A., et al. (2015). Integrated Modeling Framework to Quantify the Coastal Protection Services Supplied by Vegetation. J. Geophys. Res. Oceans. 120, 324–345. doi: 10.1002/2014JC009821
Halcrow U. K. (2012). “2011-2012. Master Plan ‘Protection and Rehabilitation of the Coastal Zone. Report for A.N. Apele Romane,” in Administratia Bazinala De Apa Dobrogea – Litoral.
Hanganu J., Mihail G., Coops H. (1999). Responses of Ecotypes of Phragmites Australis to Increased Seawater Influence: A Field Study in the Danube Delta, Romania. Aquat. Bot. 64, 351–358. doi: 10.1016/S0304-3770(99)00062-5
Howes N. C., FitzGerald D. M., Hughes Z. J., Georgiou I. Y., Kulp M. A., Miner M. D., et al. (2010). Hurricane-Induced Failure of Low Salinity Wetlands. Proc. Natl. Acad. Sci. Unite. States America 107 (32), 14014–14019. doi: 10.1073/pnas.0914582107
Le Hir P., Roberts W., Cazaillet O., Christie M., Bassoullet P., Bacher C. (2000). Characterization of Intertidal Flat Hydrodynamics. Continent. Shelf. Res. 20 (12–13), 1433–1459. doi: 10.1016/S0278-4343(00)00031-5
Leonardi N., Carnacina I., Donatelli C., Ganju N. K., Plater A. J., Schuerch M., et al. (2018). Dynamic Interactions Between Coastal Storms and Salt Marshes: A Review. Geomorphology 301, 92–107. doi: 10.1016/j.geomorph.2017.11.001
Lövstedt C. B., Larson M. (2010). Wave Damping in Reed: Field Measurements and Mathematical Modeling. J. Hydraulic. Eng. 136 (4). doi: 10.1061/(ASCE)HY.1943-7900.0000167
Mendez F. J., Losada I. J. (2004). An Empirical Model to Estimate the Propagation of Random Breaking and Nonbreaking Waves Over Vegetation Fields. Coast. Eng. 51 (2), 103–118. doi: 10.1016/j.coastaleng.2003.11.003
Moeller I. (2006). Quantifying Saltmarsh Vegetation and Its Effect on Wave Height Dissipation; Results From a UK East Coast Saltmarsh. Estuar. Coast. Shelf. Sci. , XX, 1–15. doi: 10.1016/j.ecss.2006.05.003
Moeller I., Spencer T., French J. R., French, French J. R. (1996). Wind Wave Attenuation Over Saltmarsh Surfaces: Preliminary Results From Norfolk, England. J. Coast. Res. 12 (4), 1009–1016.
Moeller I., Spencer T., French J. R., Leggett D. J., Dixon M. (1999). Wave Transformation Over Salt Marshes: A Field and Numerical Modeling Study From North Norfolk, England. Estuar. Coast. Shelf. Sci. 49, 411–426. doi: 10.1006/ecss.1999.0509
Möller I. (2012). “Bio-Physical Linkages in Coastal Wetlands - Implications for Coastal Protection,” in Jubilee Conference Proceedings, NCK-Days 2012 University of Twente, Netherlands. doi: 10.3990/2.170
Möller I. (2019). Applying Uncertain Science to Nature-Based Coastal Protection: Lessons From Shallow Wetland-Dominated Shores. Front. Environ. Sci. 7 (April). doi: 10.3389/fenvs.2019.00049
Möller I., Kudella M., Rupprecht F., Spencer T., Paul M., van Wesenbeeck B. K., et al (2014). Wave Attenuation Over Coastal Salt Marshes Under Storm Surge Conditions. Nature Geoscience 7 (10), 727–31. doi: 10.1038/ngeo2251
Möller I., Mantilla-Contreras J., Spencer T., Hayes A. (2011). Micro-Tidal Coastal Reed Beds: Hydro-Morphological Insights and Observations on Wave Transformation From the Southern Baltic Sea. Estuar. Coast. Shelf. Sci. 92, 424–436. doi: 10.1016/j.ecss.2011.01.016
Nicholls R. J., Brown S., Goodwin P., Wahl T., Lowe J., Solan M., et al. (2018). Stabilization of Global Temperature at 1.5°C and 2.0°C: Implications for Coastal Areas. Philos. Trans. R. Soc. A.: Mathematic. Phys. Eng. Sci. 376 (2119). doi: 10.1098/rsta.2016.0448
Panin N., Dutu L. T., Dutu F. (2016). The Danube Delta. An Overview of Its Holocene Evolution. Revue Géoraphique Des Pays Méditerranéens. J. Mediterr. Geogr. 126, 37–54. doi: 10.4000/mediterranee.8186
Paul M., Amos C. L. (2011). Spatial and Seasonal Variation in Wave Attenuation Over Zostera Noltii. J. Geophys. Res. 116, C08019.
Rendón O. R., Garbutt A., Skov M., Möller I., Alexander M., Ballinger R., et al. (2019). A Framework Linking Ecosystem Services and Human Well-Being : Saltmarsh as a Case Study. People Nat. 00 (January), 1–11. doi: 10.1002/pan3.10050
Rudescu L., Niculescu C., Chivu I. P. (1965). Monografia Stufului Din Delta Dunarii, Editura Academiei Republicii Socialiste Romania (In Romanian).
Schwarz C., Gourgue O., Van Belzen J., Zhu Z., Bouma T. J., Van De Koppel J., et al. (2018). Self-Organizationof a Biogeomorphic Landscape Controlled by Plant Life-History Traits. Nat. Geosci. 11, 672–677. doi: 10.1038/s41561-018-0180-y
Silinski A., Schoutens K., Puijalon S., Schoelynck J., Luyckx D., Troch P, et al. (2018). Coping With Waves: Plasticity in Tidal Marsh Plants as Self-Adapting Coastal Ecosystem Engineers. Limnol. Oceanogr 63, 799–815. doi: 10.1002/lno.10671
Stanica A., Scrieciu A., Bujini J., Teaca A., Begun T., Ungureanu C., et al. (2013). “Razelm Sinoie Lagoon System – State of the Lagoon Report,” in Deliverable 2.2. ARCH (Architecture and Roadmap to Manage Multiple Pressures on Lagoons) FP7 Project, EC Grant 282748, Unpublished Report.
Suzuki T., Zijlema M., Burger B., Meijer M. C., Narayan S. (2012). Wave Dissipation by Vegetation With Layer Schematization in SWAN. Coast. Eng. 59 (1), 64–71. doi: 10.1016/j.coastaleng.2011.07.006
Temmerman S., Meire P., Bouma T. J., Herman P. M. J., Ysebaert T., De Vriend H. J. (2013). Ecosystem-Based Coastal Defence in the Face of Global Change. Nature 504 (7478), 79–83. doi: 10.1038/nature12859
Ungureanu V. G., Stanica A. (2000). Impact of Human Activities on the Evolution of the Romanian Black Sea Beaches. Lake. Reserv.: Res. Manage. , 111–115. doi: 10.1046/j.1440-1770.2000.00105.x
van Wesenbeeck B. K., de Boer W., Narayan S., van der Star W. R. L. L., de Vries M. B. (2016). Coastal and Riverine Ecosystems as Adaptive Flood Defenses Under a Changing Climate. Mitigat. Adapt. Strat. Global Change. 22. (April. 2015), 1–8. doi: 10.1007/s11027-016-9714-z
van Zelst V. T. M., Dijkstra J. T., van Wesenbeeck B. K., Eilander D., Morris E. P., Winsemius H. C., et al. (2021). Cutting the Costs of Coastal Protection by Integrating Vegetation in Flood Defences. Nat. Commun. 12 (1), 1–11. doi: 10.1038/s41467-021-26887-4
Vuik V., Borsje B. W., Willemsen P. W. J. M., Jonkman S. N. (2019). Salt Marshes for Flood Risk Reduction: Quantifying Long-Term Effectiveness and Life-Cycle Costs. Ocean. Coast. Manage. 171, 96–110. doi: 10.1016/j.ocecoaman.2019.01.010
Vuik V., Jonkman S. N., Borsje B. W., Suzuki T. (2016). Nature-Based Flood Protection: The Efficiency of Vegetated Foreshores for Reducing Wave Loads on Coastal Dikes. Coast. Eng. 116, 42–56. doi: 10.1016/j.coastaleng.2016.06.001
Xue L., Li X., Shi B., Yang B., Lin S., Yuan Y., et al. (2021). Pattern-Regulated Wave Attenuation by Salt Marshes in the Yangtze Estuary, China. Ocean. Coast. Manage. 209, 105686. doi: 10.1016/j.ocecoaman.2021.105686
Yang S. L., Luo X., Temmerman S., Kirwan M., Bouma T., Xu K., et al. (2020). Role of Delta-Front Erosion in Sustaining Salt Marshes Under Sea-Level Rise and Fluvial Sediment Decline. Limnol. Oceanogr. 65 (9), 1990–2009. doi: 10.1002/lno.11432
Keywords: Danube, Wave dissipation, Reed vegetation, coastal, lagoon, Bio-geomorphology, Nature-Based Solution (NBS)
Citation: Möller I, Ionescu MS, Constantinescu AM, Evans BR, Scrieciu A, Stanica A and Grosu D (2022) Bio-Physical Controls on Wave Transformation in Coastal Reed Beds: Insights From the Razelm-Sinoe Lagoon System, Romania. Front. Mar. Sci. 9:813474. doi: 10.3389/fmars.2022.813474
Received: 11 November 2021; Accepted: 12 May 2022;
Published: 15 June 2022.
Edited by:
Marco Ghisalberti, University of Western Australia, AustraliaReviewed by:
Maike Paul, Leibniz University Hannover, GermanyCopyright © 2022 Möller, Ionescu, Constantinescu, Evans, Scrieciu, Stanica and Grosu. This is an open-access article distributed under the terms of the Creative Commons Attribution License (CC BY). The use, distribution or reproduction in other forums is permitted, provided the original author(s) and the copyright owner(s) are credited and that the original publication in this journal is cited, in accordance with accepted academic practice. No use, distribution or reproduction is permitted which does not comply with these terms.
*Correspondence: Iris Möller, bW9lbGxlcmlAdGNkLmll
Disclaimer: All claims expressed in this article are solely those of the authors and do not necessarily represent those of their affiliated organizations, or those of the publisher, the editors and the reviewers. Any product that may be evaluated in this article or claim that may be made by its manufacturer is not guaranteed or endorsed by the publisher.
Research integrity at Frontiers
Learn more about the work of our research integrity team to safeguard the quality of each article we publish.