- 1Faculty/Graduate School of Fisheries Sciences, Hokkaido University, Hakodate, Japan
- 2Arctic Research Center, Hokkaido University, Sapporo, Japan
- 3Research Development Section, Office for Enhancing Institutional Capacity, Hokkaido University, Sapporo, Japan
A remarkable early sea-ice reduction event was observed in the northern Bering Sea during 2018. In turn, this unusual hydrographic phenomenon affected several marine trophic levels, resulting in delayed phytoplankton blooms, phytoplankton community changes, and a northward shift of fish stocks. However, the response of the zooplankton community remains uncharacterized. Therefore, our study sought to investigate the zooplankton community shifts in the northern Bering Sea during the summers of 2017 and 2018 and evaluate the effects of early sea-ice melt events on the zooplankton community, population structure of large copepods, and copepod production. Five zooplankton communities were identified based on cluster analysis. Further, annual changes in the zooplankton community were identified in the Chirikov Basin. In 2017, the zooplankton community included abundant Pacific copepods transported by the Anadyr water. In 2018, however, the zooplankton community was dominated by small copepods and younger stages of large copepods (Calanus glacialis/marshallae and Metridia pacifica), which was likely caused by reproduction delays resulting from the early sea-ice reduction event. These environmental abnormalities increased copepod production; however, this higher zooplankton productivity did not efficiently reach the higher trophic levels. Taken together, our findings demonstrated that zooplankton community structure and production are highly sensitive to the environmental changes associated with early sea-ice reduction (e.g., warm temperatures and food availability).
Introduction
The northern Bering Sea is a shallow shelf (approximately 50 m in depth) that connects the Bering Sea and the Arctic Ocean. This region is one of the most productive in the world (Springer and McRoy, 1993) owing to the continuous inflow of nutrient-rich water from Anadyr Bay (Coachman et al., 1975). Therefore, the high primary productivity of this region supports higher trophic levels including fish, birds, and mammals (Springer et al., 1996; Kuletz et al., 2015). However, this region has recently faced drastic changes in sea-ice cover and hydrographic conditions during summer (Grebmeier et al., 2015; Frey et al., 2018). The sea-ice coevrage period in the northern Bering Sea is highly variable and exhibits no inter-annual trends until 2000s; however, from the winter of 2014 and 2015, ice coverage in this region has decreased remarkably (Stabeno and Bell, 2019; Stabeno et al., 2019). Particularly, in the winter of 2017 and 2018, the sea-ice coverage reached a historical minimum based on satellite observations dating back to 1978 (Cornwall, 2019). This early sea ice retreat has been largely attributed to relatively warm winds from the south, accompanied by a westward shift of the Aleutian low from its typical position (Stabeno et al., 2019; Basyuk and Zuenko, 2020). This drastic change in sea ice coverage may weaken the water column stratification of the Chirikov Basin (Ueno et al., 2020), thus decreasing the cold pool in the bottom layer of the Bering shelf (Stabeno and Bell, 2019).
The impacts of the early sea-ice retreat are also clearly observed at several trophic levels in the marine ecosystem, including phytoplankton bloom delays (Kikuchi et al., 2020) and phytoplankton community shifts from cold-water to cosmopolitan species (Fukai et al., 2020). Moreover, fish populations have been found to migrate northward in response to the aforementioned cold pool decrease, which functions as a barrier to these fishes (Cornwall, 2019; Duffy-Anderson et al., 2019; Stevenson and Lauth, 2019). Additionally, these events have been linked to decreases in sea bird populations due to food scarcity (Nishizawa et al., 2020), as well as a decline in the body condition (mass/length) of phocid seals (Boveng et al., 2020).
Zooplankton form a vital link from primary production to higher trophic levels. Zooplankton species-level community structure varies geographically and is governed by water mass inflow from the south (Springer et al., 1989; Ozaki and Minoda, 1996). Zooplankton biomass is largely dominated by copepods (Eisner et al., 2013), particularly the small-sized copepods Pseudocalanus spp. and the large-sized Calanus glacialis/marshallae, Eucalanus bungii, Metridia pacifica, and Neocalanus spp. (Hopcroft et al., 2010). Except for Neocalanus spp., these large copepods reproduce with feeding on phytoplankton blooms at the surface layer (Padmavati et al., 2004; Shoden et al., 2005; Søreide et al., 2010). In fact, this strong link between phytoplankton blooms and copepod phenology has been demonstrated from field observations. Specifically, the community structure of copepods is affected not only by water mass characteristics but also by phytoplankton bloom timing (Kimura et al., 2020).
The early sea-ice reduction in 2018 resulted in an increase in small copepod populations, which was potentially due to warm temperatures (Duffy-Anderson et al., 2019). Further, this phenomenon also caused delay of the phytoplankton blooms (Kikuchi et al., 2020), which could have affected the zooplankton community and population structure as potentially changing their reproduction timing (Kimura et al., 2020), and this changes in zooplankton will reach higher trophic levels due to mis-match timing for getting their prey (Duffy-Anderson et al., 2019). However, the effect of early sea-ice reduction on zooplankton community structure remains unclear because of a lack of information on zooplankton species composition, population structure, and production in the northern Bering Sea.
Our study thus investigated the zooplankton community and population structure of large-sized copepods in the northern Bering Sea during the summers of 2017 (exhibiting a typical sea-ice retreat timing after the winters of 2014 and 2015; Stabeno et al., 2019) and 2018 (extremely early sea-ice retreat). These 2 years were compared to evaluate the effects of phytoplankton bloom delays coupled with an early sea-ice reduction on zooplankton community structures. Additionally, copepod production was estimated using metabolic equations based on body mass and in situ temperature to evaluate the impact of copepod community changes on higher trophic levels.
Materials and Methods
Satellite Data
Sea-ice concentration data (10-km resolution) were obtained from the Advanced Microwave Scanning Radiometer 2 (AMSR2) to evaluate the extent of the sea ice coverage. These AMSR2 data were supplied by the Japan Aerospace Exploration Agency via the Arctic Data archive System (ADS)1, through the cooperation of the National Institute of Polar Research and Japan Aerospace Exploration Agency (JAXA). Based on the data, melt day (MD) was defined as the last date when the sea ice concentration (SIC) fell below 20% prior to the observed annual sea-ice minimum across the study region. Additionally, the time since sea-ice melt (TSM) was defined as the number of open-water days from the MD to the sampling date at each station.
Field Samplings
A total of 34 zooplankton sample collections were taken by the T/S Oshoro-Maru in the northern Bering Sea (62°10′–66°44′N, 166°30′–174°05′W) during 11–22 July 2017 and 2–12 July 2018 (Figure 1 and Supplementary Table 1). The study areas were the waters south of St. Lawrence Island, the Chirikov Basin (from the north of St. Lawrence Island to the south of Bering Strait), and the Bering Strait (Figure 1). Historically, this region has exhibited complex hydrographic dynamics due to the inflow of multiple currents with different hydrographic features (Danielson et al., 2017). These water masses can be identified by salinity rather than location (Coachman et al., 1975). According to Coachman et al. (1975), the three water masses were categorized as low-saline (S < 31.8) and low nutrient Alaskan Coastal Water (ACW), high-saline (S > 32.5) and high nutrient Anadyr Water (AnW), and Bering Shelf Water (BSW, 31.8 < S < 32.5).
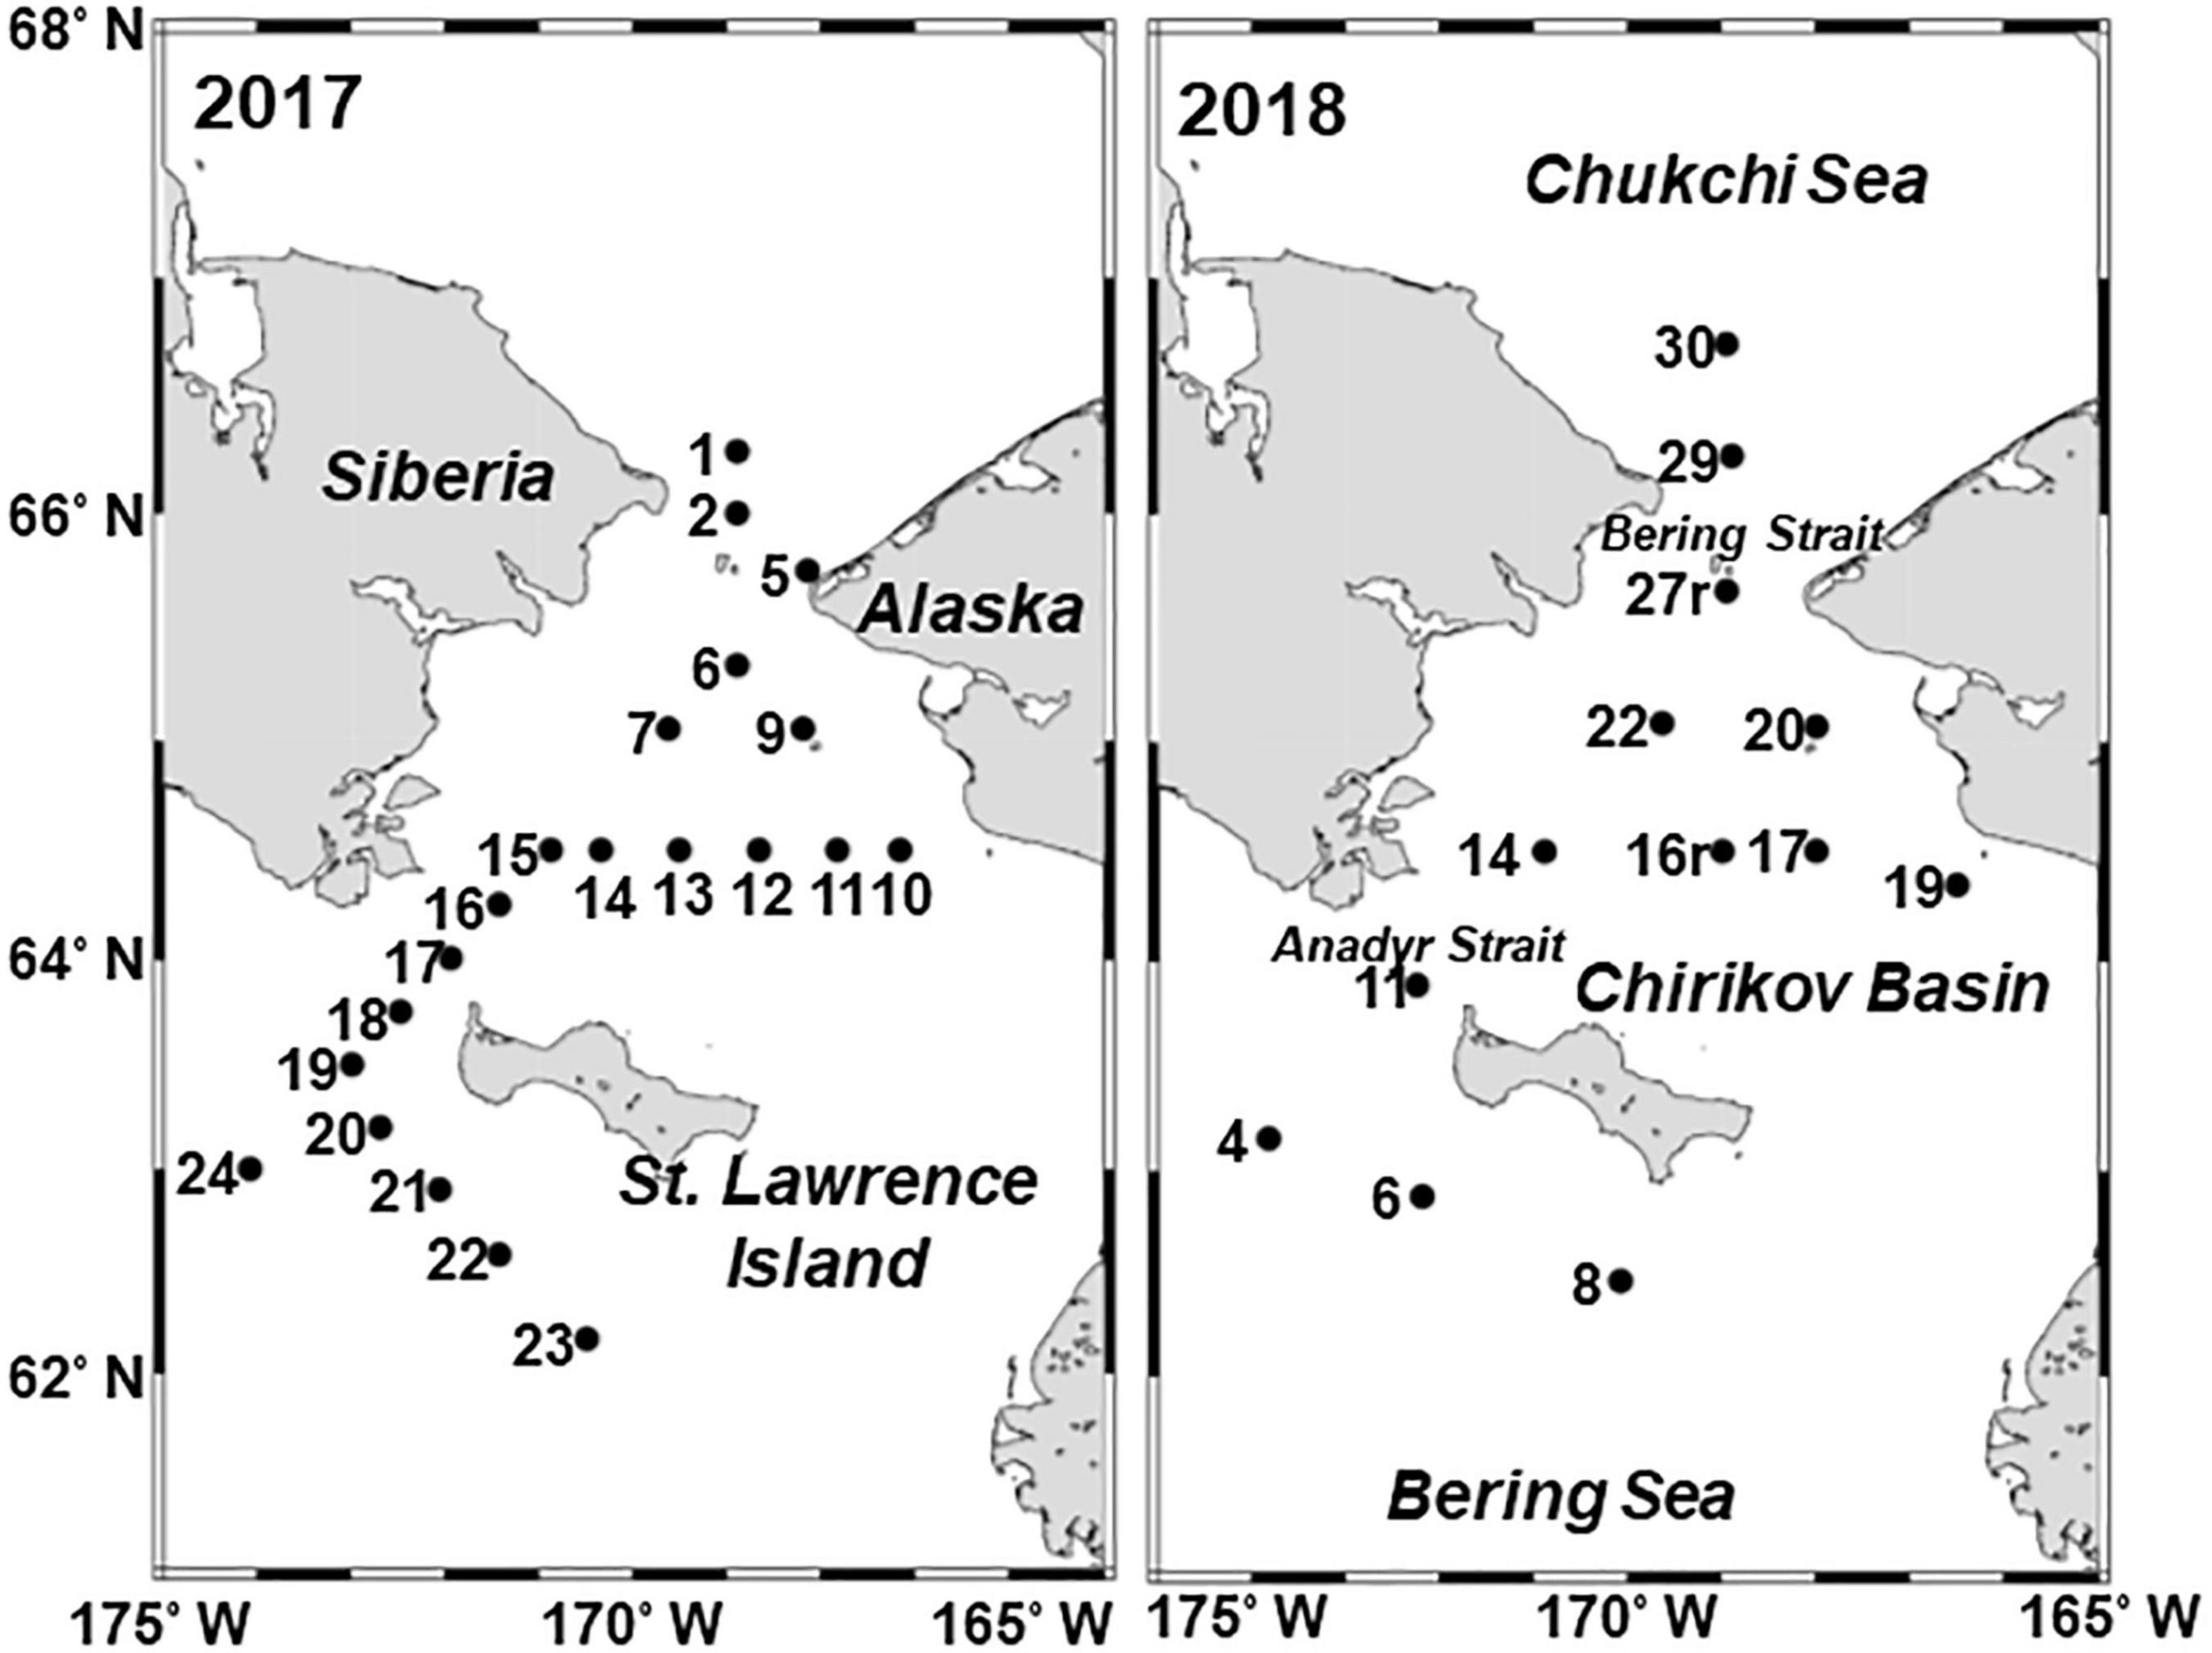
Figure 1. Location of stations in the northern Bering Sea during 11–22 July 2017 and 2–12 July 2018. The numbers indicate the station ID.
Zooplankton samples were collected by vertical hauls with a NORPAC net (mouth diameter: 45 cm; mesh size: 150 μm) from 5 m above the bottom. The towing depth of the net ranged from 22 to 71 m. The volume of the water filtered through the net was estimated using a one-way flow meter (Rigosha CO., Ltd., Bunkyo-ku, Tokyo, Japan) mounted in the mouth of the net. Zooplankton samples were immediately preserved using 5% v/v borax buffered formalin. At all stations, temperature, salinity, and fluorescence were measured using vertical casts of a CTD (SBE911Plus, Sea-Bird Electronics Inc., Bellevue, WA, United States). The mixed layer depth was defined as the depth where the density was 0.10 kg m3 greater than the value at a 5 m depth (Danielson et al., 2011). Water samples for nutrient analysis were collected from 4 to 6 layers every 10 m from the surface to 5 m above the seafloor using a bucket and Niskin bottles (cf. Fukai et al., 2020). The obtained unfiltered nutrient samples were frozen on board at −80°C. In the laboratory, the concentrations of major nutrients (NO2–N + NO3–N, NH4–N, PO4–P, and Si (OH)4) were measured using an auto-analyzer (QuAAtro 2HR, BL-TEC Co., Ltd., Osaka, Japan).
Sample Analysis
In the laboratory, zooplankton samples were split using a Motoda box splitter (Motoda, 1959). The zooplankton in the aliquots was identified and counted under a dissecting microscope. Calanoid copepods were identified to the species and copepodid stage level, as described by Brodsky (1967). Calanus glacialis and Calanus marshallae were treated as C. glacialis/marshallae in this study owing to the difficulty of distinguishing between these two organisms at the species level (Frost, 1974). The mean copepodid stage (MCS) of the dominant large copepods (C. glacialis/marshallae, E. bungii, and M. pacifica) was calculated using the following equation:
where i (1–6 indicate C1–C6) indicates the copepodid stage for a given species and Ai (ind. m–2) is the abundance of a copepodid stage (cf. Marin, 1987). For quantitative comparison of the abundance among the stations, abundance per square meter (ind. m–2) was used for later analysis.
Data Analysis
Abundance data (X: ind. m–2) for each species were transformed to the fourth root (X–4) prior to cluster analysis to reduce the bias of abundant species. Similarities between samples were examined using the Bray–Curtis index according to differences in species composition excluding rare species (i.e., those that occurred only once in the study area). For grouping samples, similarity indices were coupled with hierarchical agglomerative clustering and the complete linkage method (unweighted pair group method with arithmetic mean; UPGMA) (Field et al., 1982). Based on the fourth root transformed abundance, similarity percentages (SIMPER) analysis was applied to determine which species contributed to the top 50% of total abundance for each group. To find potential indicator species in the groups that resulted from the cluster analysis, the program Indicator Value (IndVal) was applied (Dufréne and Legendre, 1997).
To evaluate the relationship between environmental parameters and zooplankton community, a distance based linear modeling (DistLM) and a distance based redundancy analysis (dbRDA) were carried out. Firstly, to remove multicollinearity among the environmental parameters (mixed layer depth, mean water column temperature, mean water column salinity, integrated water column fluorescence [the sum of the fluorescence values from the water column], mean water column nutrients [NO2–N + NO3–N, NH4–N, PO4–P, and Si (OH)4], MD and TSM), we calculated variance inflation factors (VIF) for each parameter. Only MD showed higher than 5 to TSM, it was removed from the explanatory parameters. All environmental parameters were normalized, and then the DistLM was run with dbRDA plot by combining the resemblance matrix (based on Bray–Curtis similarities between the abundances of zooplankton species in the samples) and the hydrographic variables. To run DistLM, we choose a “Step-wise” as a selection procedure, a “AICc” as a selection criterion, and the number of permutations was 999. The analyses were conducted using the Primer 7 software (PRIMER-E Ltd., Albany, Auckland, New Zealand).
Additionally, the interannual differences in copepodite abundance, nauplii abundance, and MCS for the dominant large copepods (C. glacialis/marshallae, E. bungii and M. pacifica) were compared using the Mann–Whitney U test performed in the StatView v5 software (SAS Institute Inc., Cary, NC, United States).
Copepod Biomass and Production
Biomass of copepods at each station was estimated by multiplying individual dry weight (mg ind.–1) from references and unpublished data (cf. Supplementary Table 2), abundance (ind. m–2) and a conversion factor 48% from dry weight to carbon biomass (Kiørboe, 2013). Then, we classified C. glacialis/marshallae as Arctic copepods, and E. bungii, N. cristatus, N. flemingeri, N. plumchrus, M. pacifica as Pacific copepods, and the other copepods (cf. Table 2) as small copepods.

Table 1. Summary table of the results of the DistLM sequential tests, results shown are for the model with the lowest AICc values for each response variable.
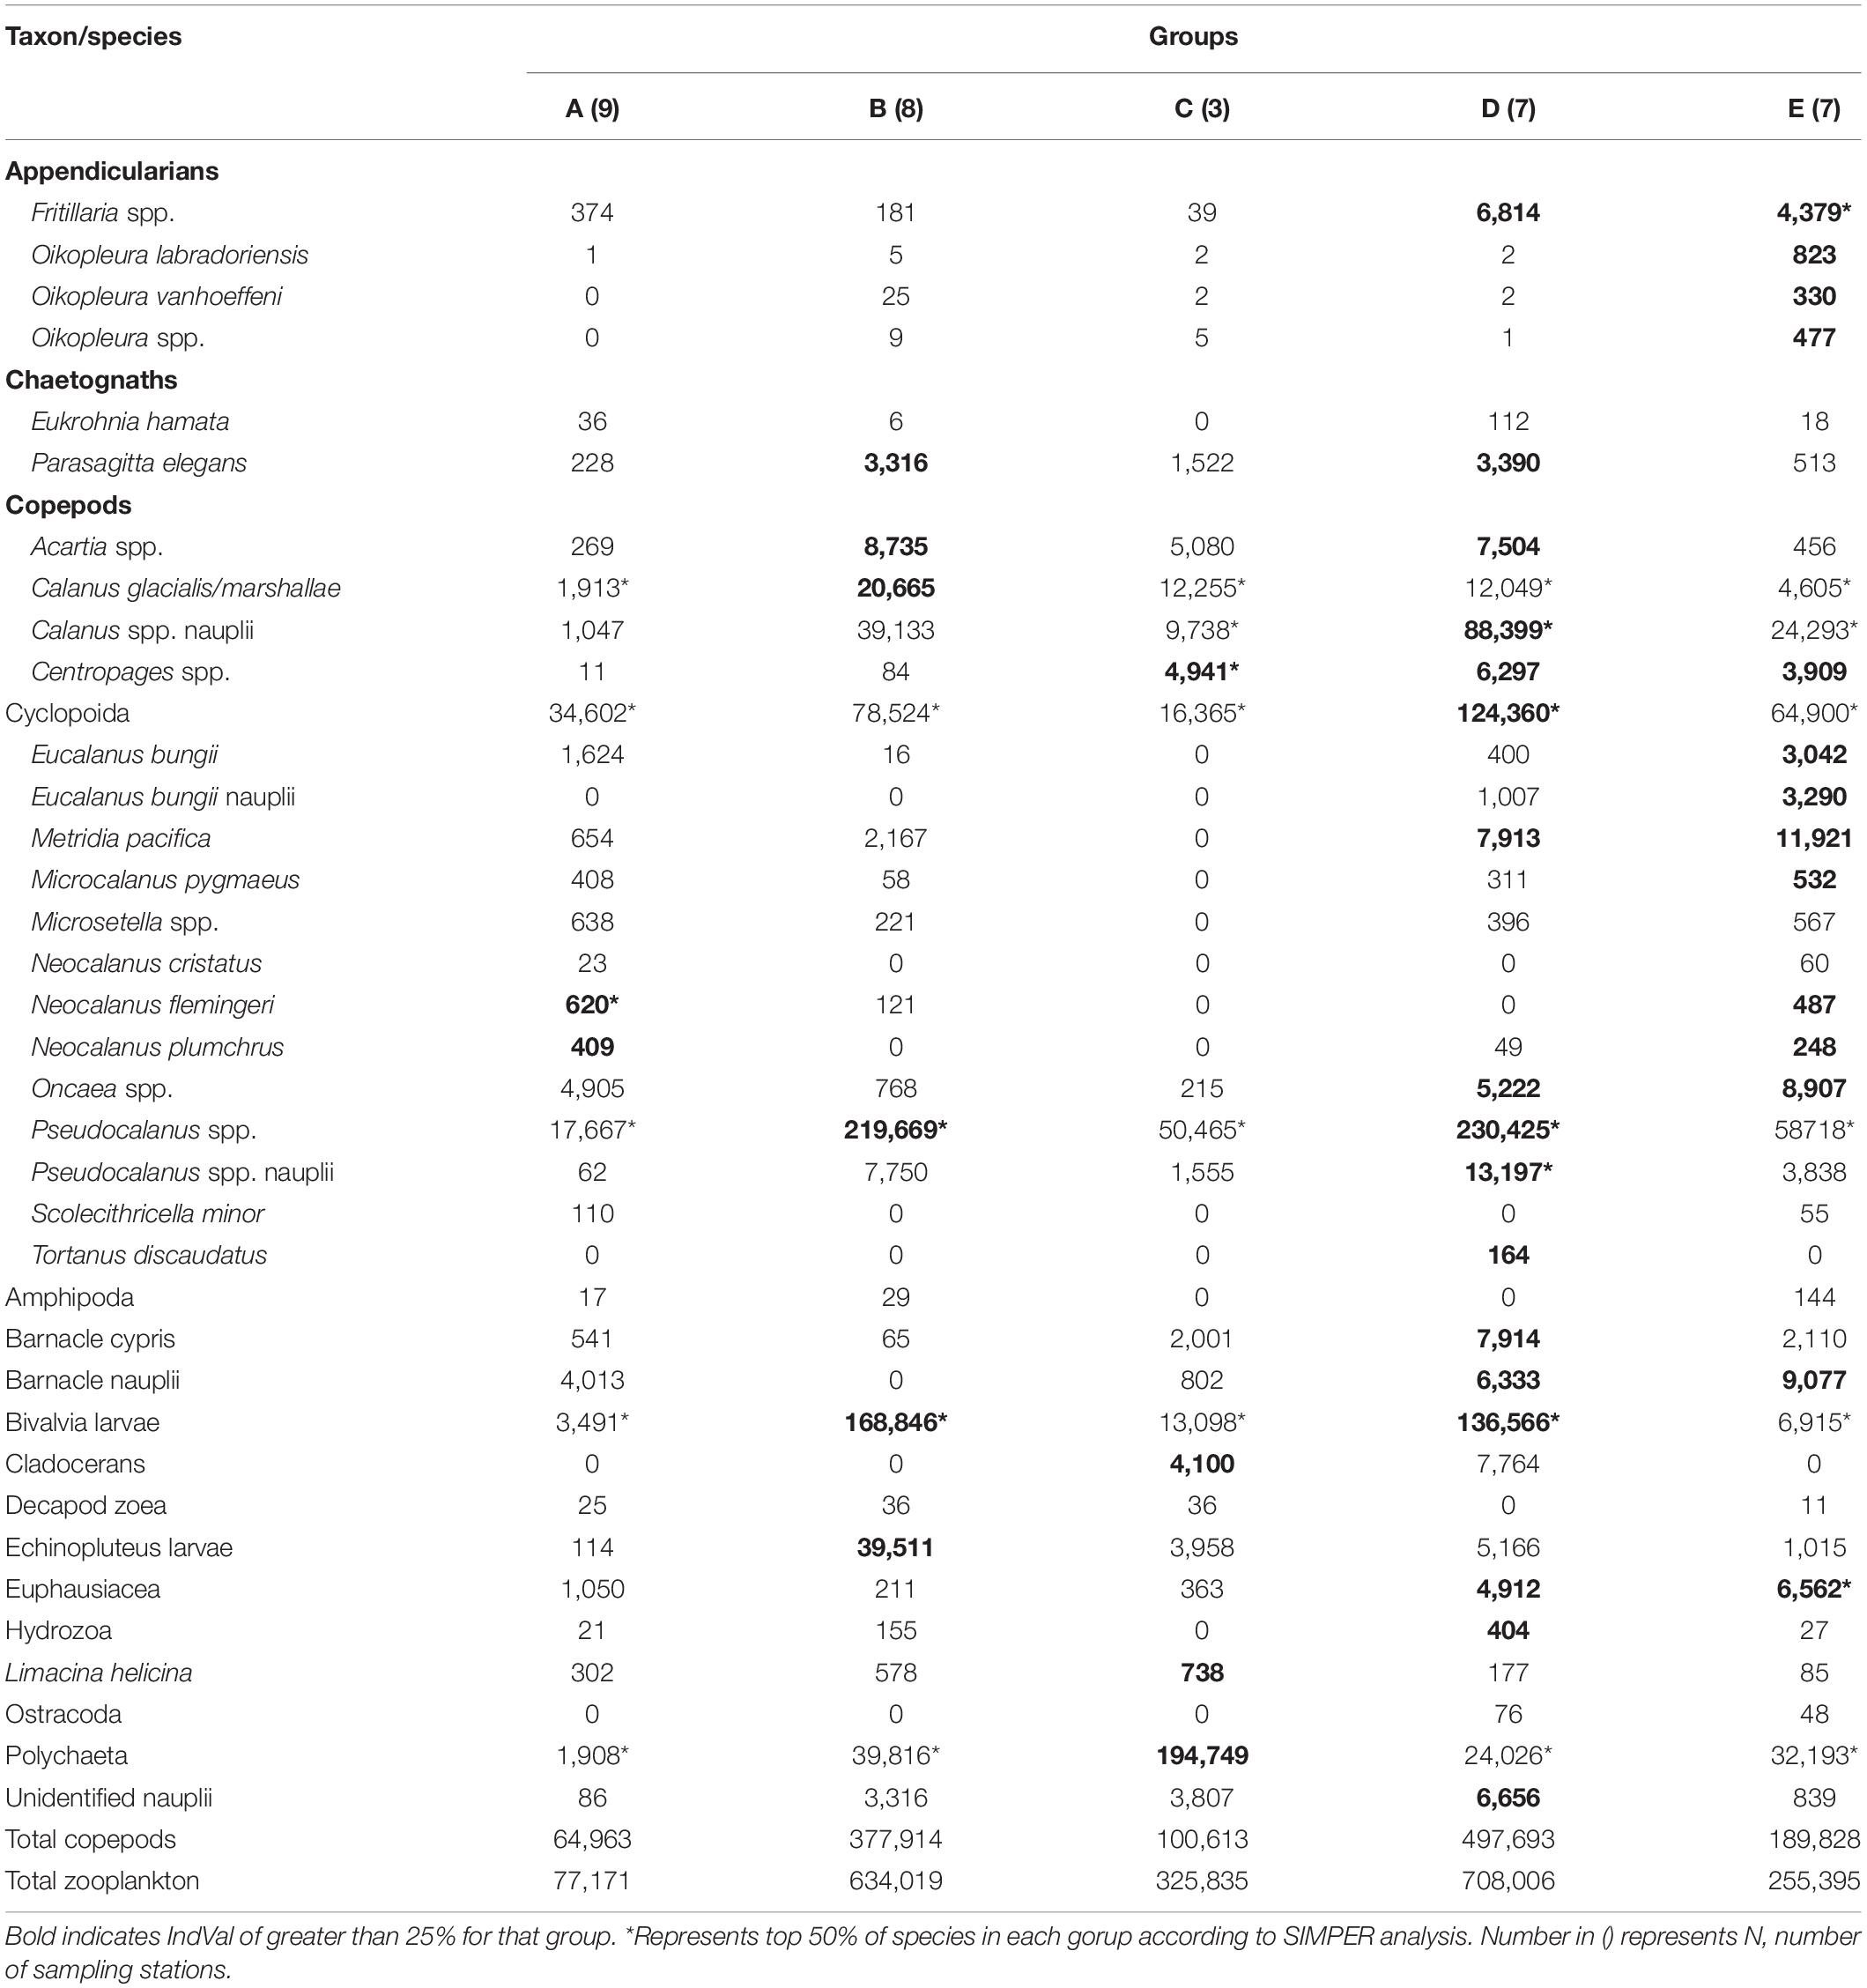
Table 2. Mean abundance (ind. m–2) for all species/taxon of the zooplankton groups identified by cluster analysis (cf. Figure 4) in the northern Bering Sea during July of 2017 and 2018.
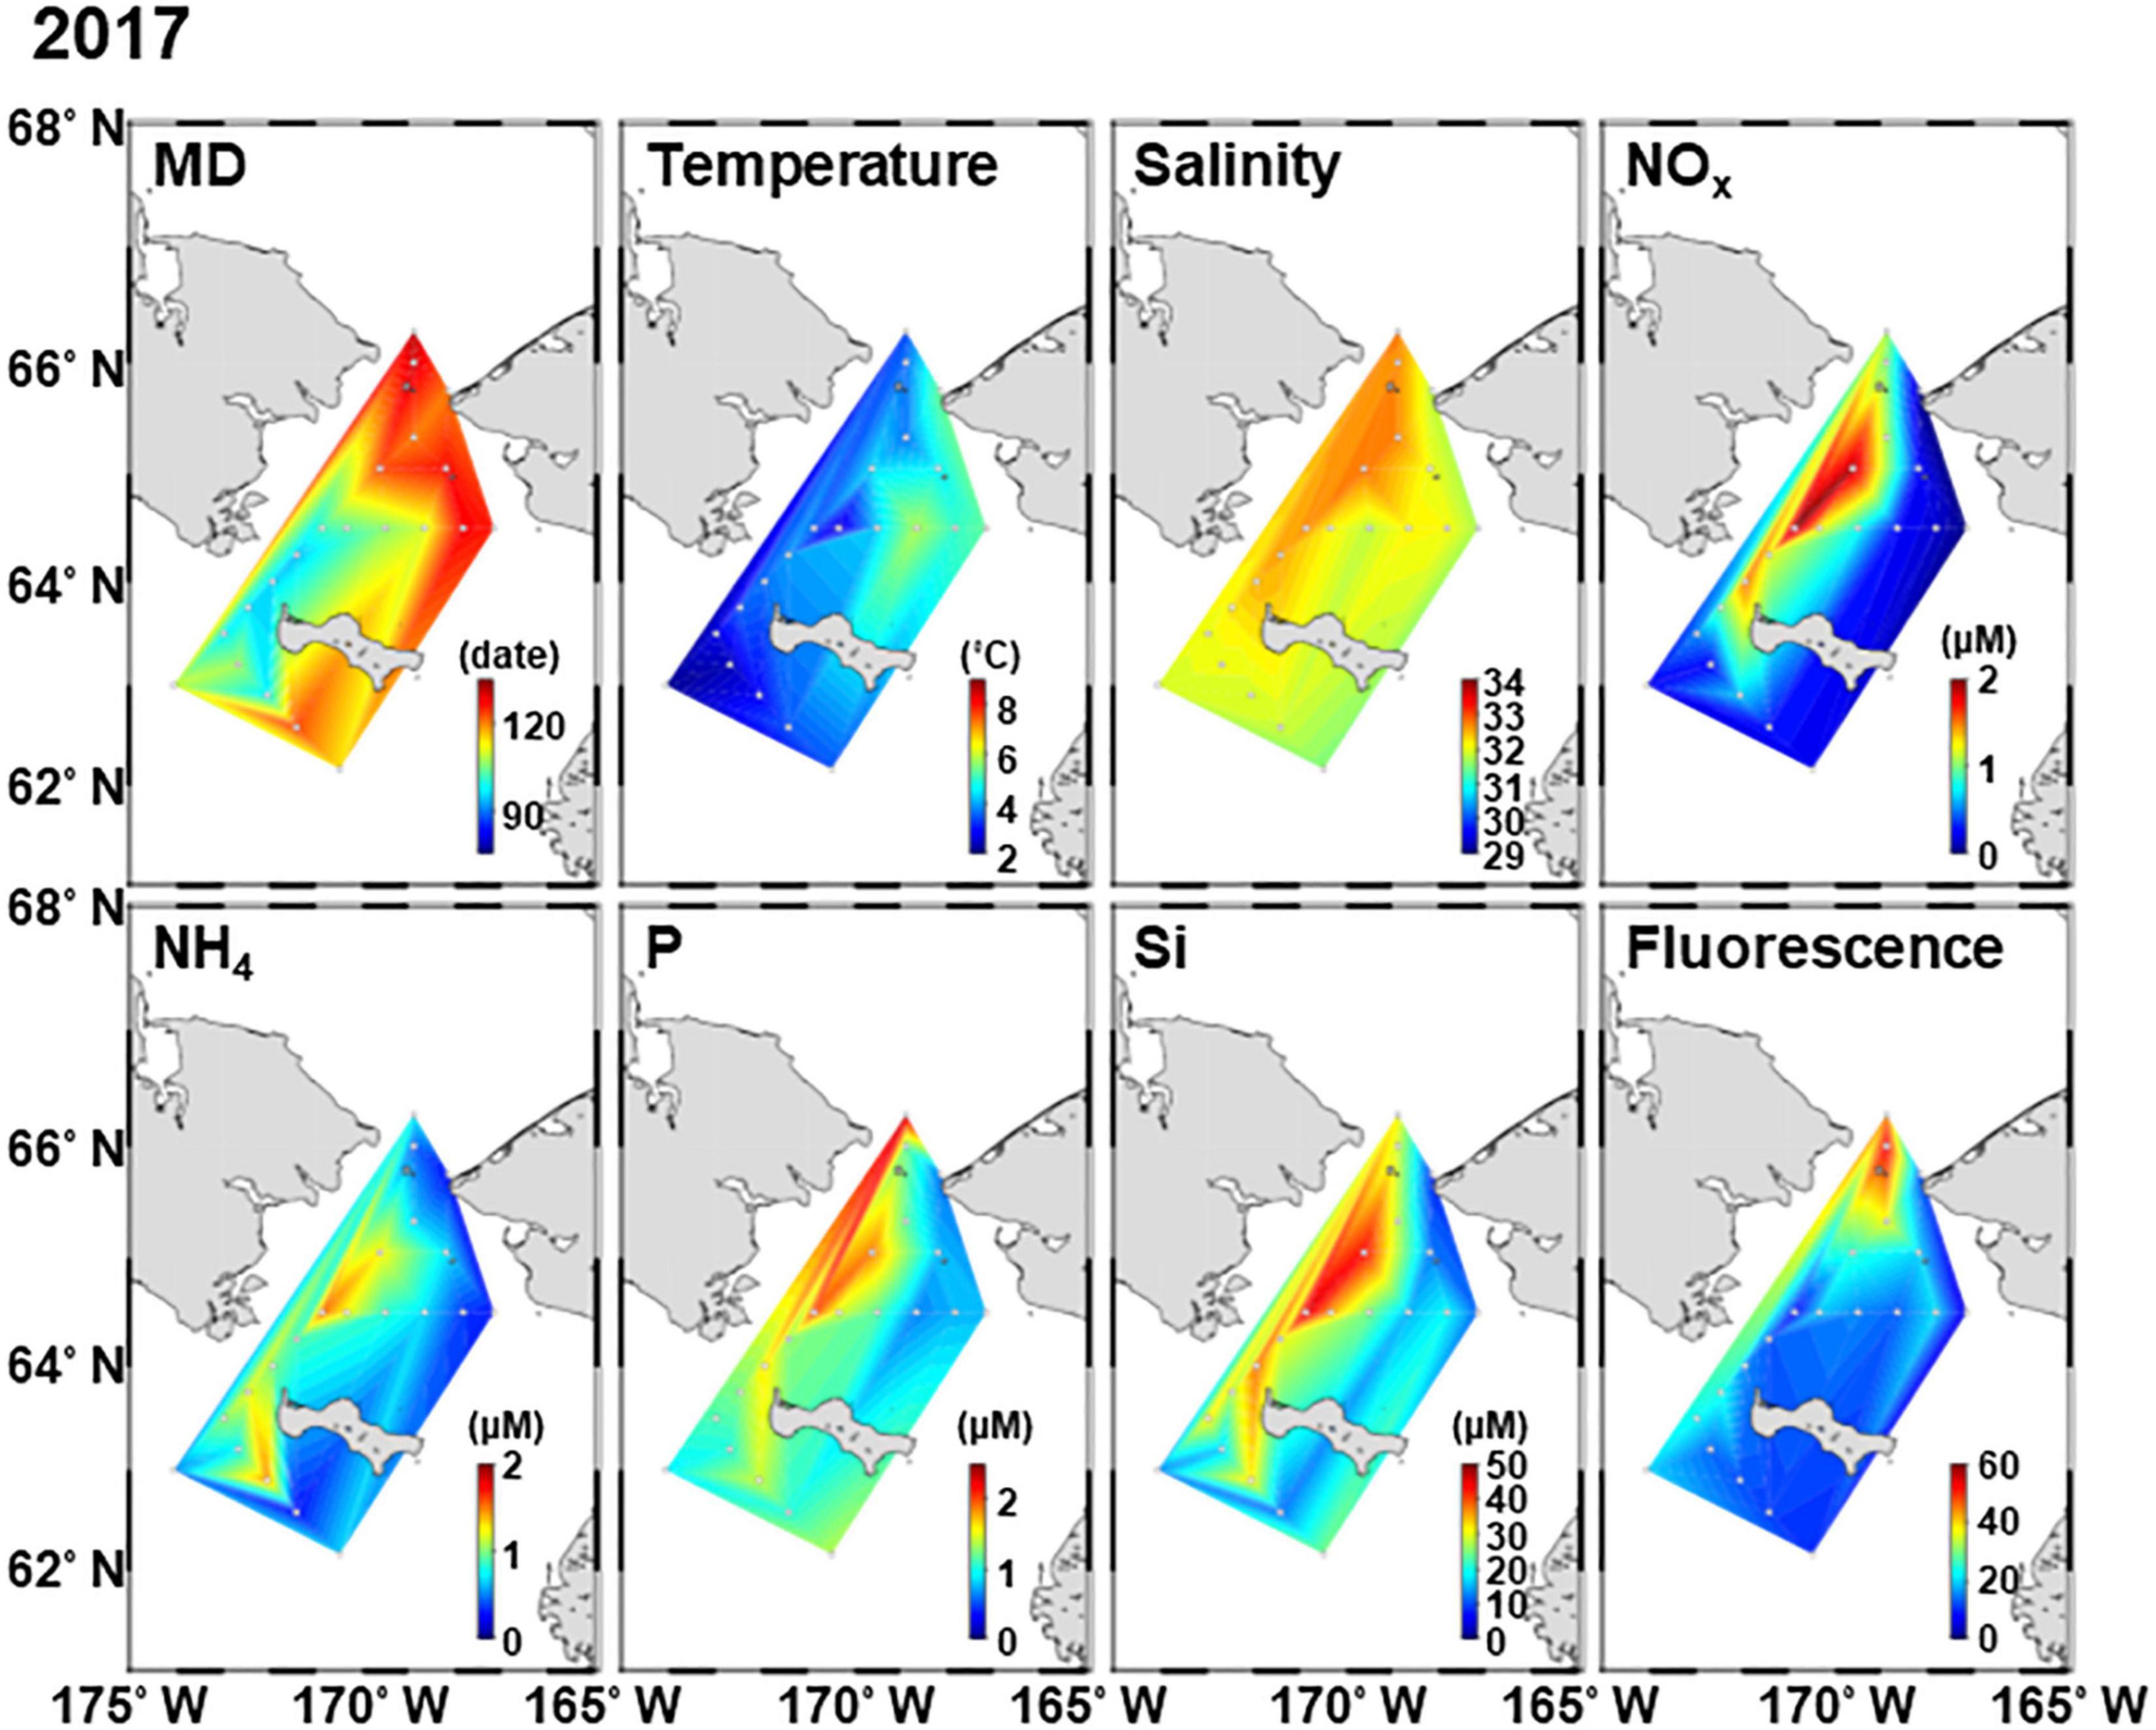
Figure 2. Horizontal distribution of environmental factors in the northern Bering Sea during 11–22 July 2017. MD, melt day.
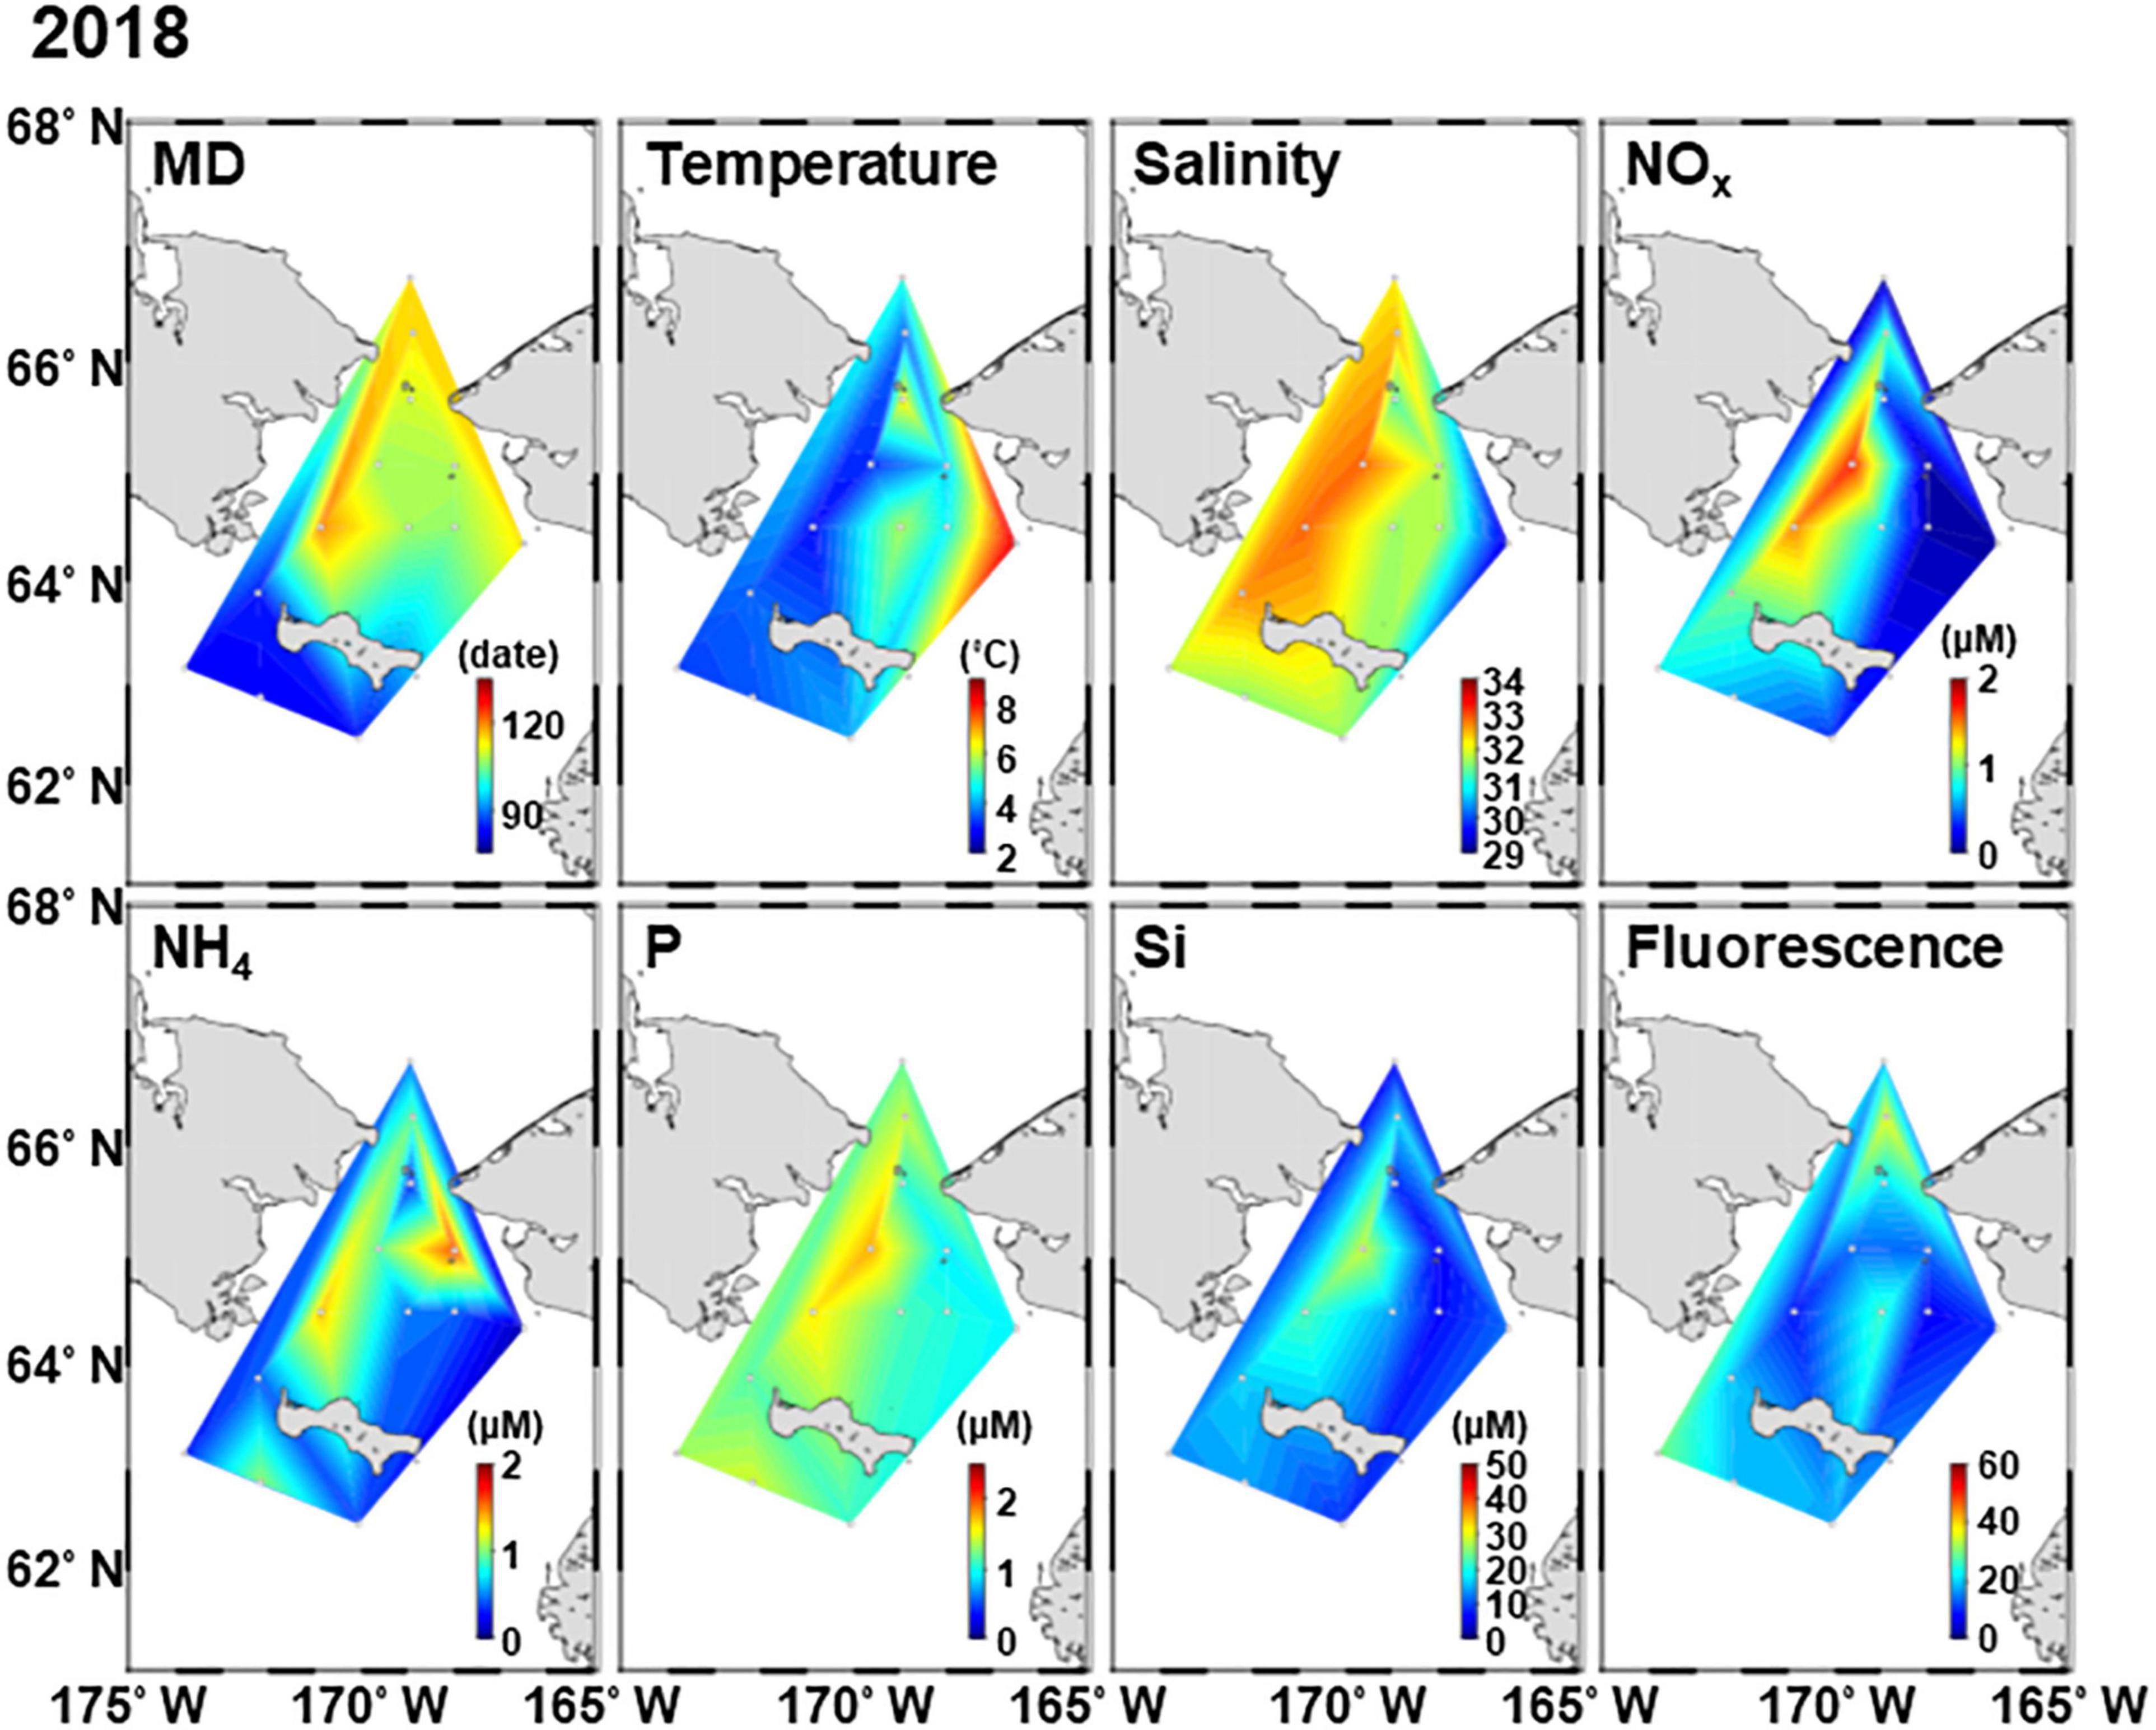
Figure 3. Horizontal distribution of environmental factors in the northern Bering Sea during 2–12 July 2018. MD, melt day.
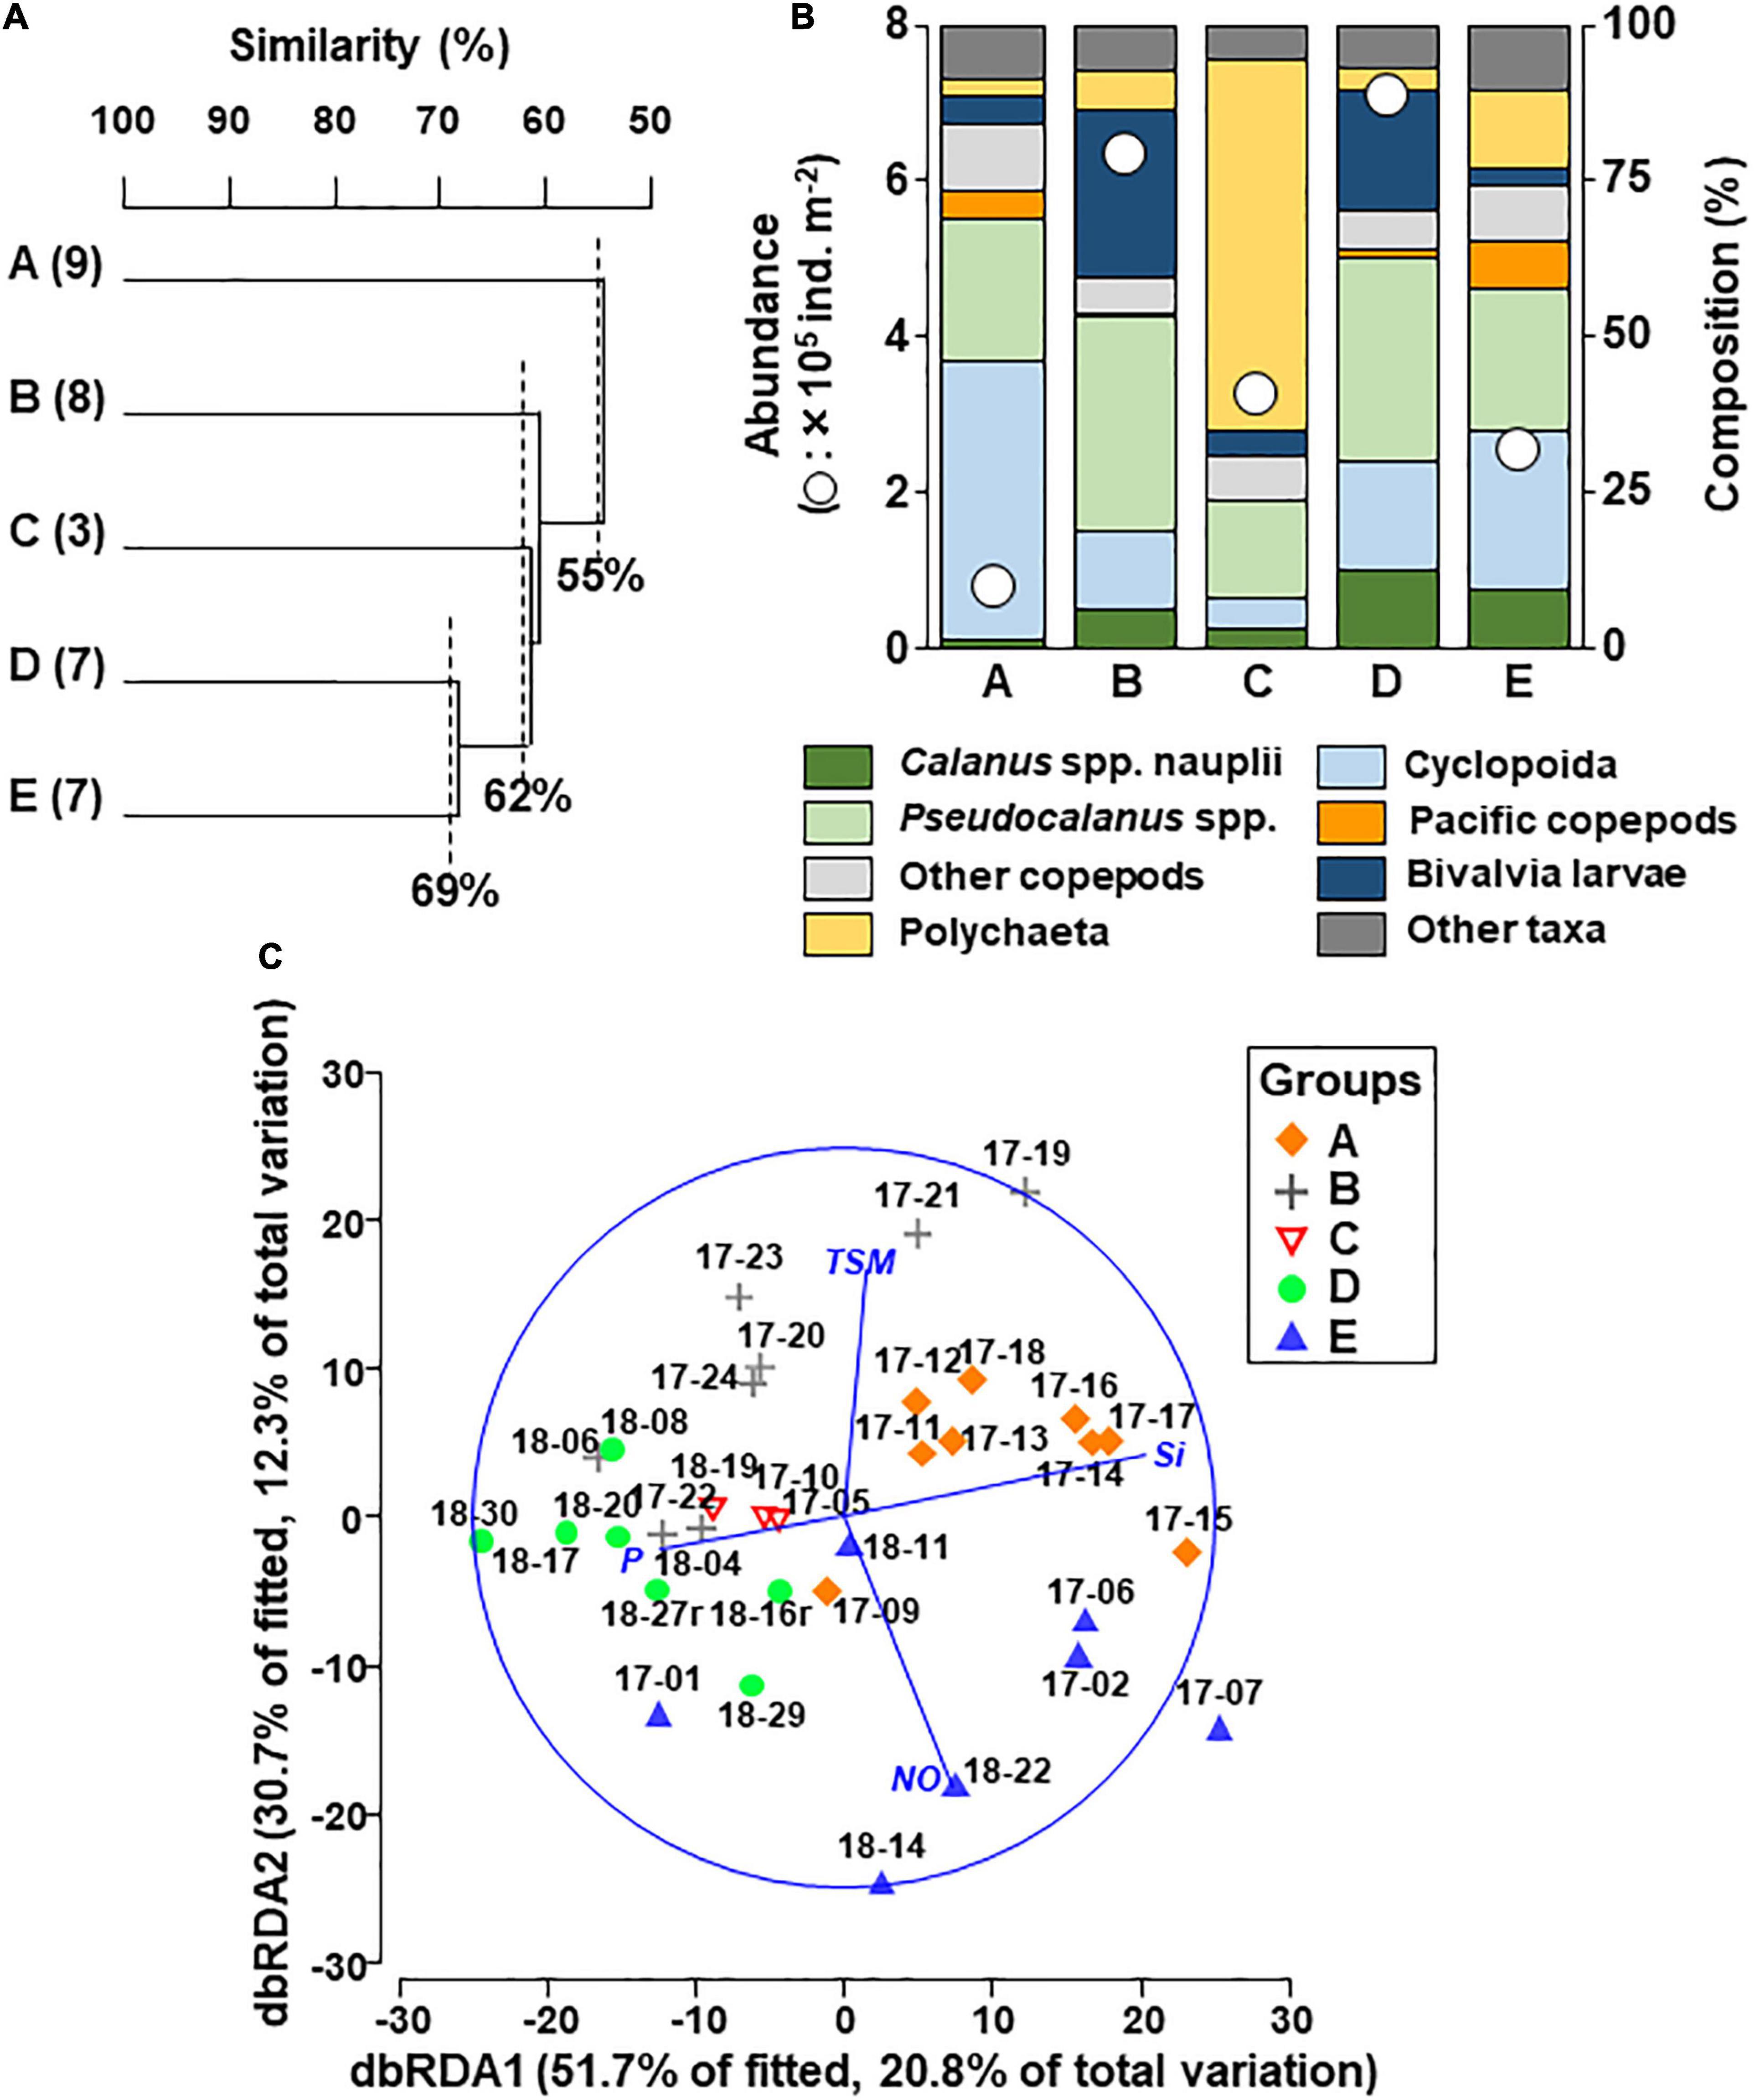
Figure 4. Cluster analysis based on zooplankton abundance in the northern Bering Sea during July of 2017 and 2018 (A). Five groups (A–E) were identified from the Bray–Curtis similarity connected with UPGMA. Mean abundance and species/taxon composition of each group (B). dbRDA plots of the five groups with environmental parameters (C). The direction and length of the lines indicate the relationship between groups and the strength of the relationship. The station IDs in the plots indicate the year-station number. NO, nitrate+nitrite; P, phosphate; Si, silicate; TSM, time since sea-ice melt.
To calculate the production of copepodite stages of all copepods, the respiration rate (μL O2 ind. –1 h–1) was calculated using the following equation (Ikeda et al., 2001).
where R is the respiration rate, DW is the individual dry weight (mg ind. –1) from references (cf. Supplementary Table 2) and T is the ambient temperature (°C). The respiration rate was converted to carbon units by assuming a respiratory quotient of 0.97 (Gnaiger, 1983) and multiplied by 0.75 (Production = 0.75*Respiration, cf. Ikeda and Motoda, 1978), abundance (ind. m–2), and 24 (hours) to estimate production (P, mg C m–2 day–1). To evaluate the effect of temperature and species composition on copepod production, a pacification index (%) of copepod production was calculated using the following equation:
where Ppacific copepods is the Pacific copepod production, Pwhole copepods is the sum of the whole copepod production (including small, Arctic, and Pacific copepods). Finally, P/B ratio was assumed by dividing the production with the biomass.
Results
Sea Ice, Water Mass, and Hydrography
The MD in 2018 was much earlier than that in 2017; MD occurred from April 4 to May 11 in 2017 and from March 23 to April 29 in 2018 (Supplementary Table 1 and Figures 2, 3). In this study, the spatial variations of in situ hydrographic parameters showed interannual similarities. The eastern side exhibited high temperatures and low salinity, these features belonging to the ACW. Whereas the cold and high saline water of the western side was attributed to the AnW (Figures 2, 3). All nutrients also exhibited high concentrations associated with the high salinity of the Chirikov Basin. Both years exhibited high chlorophyll fluorescence at the Bering Strait.
Zooplankton Community
The zooplankton abundances ranged from 31 to 1,163 × 103 ind. m–2 in 2017 and from 240 to 1,420 × 103 ind. m–2 in 2018, and relatively high values were observed in the south of St. Lawrence Island (Supplementary Figure 1). Copepods were the most dominant taxon, accounting for 11%–97% of the overall zooplankton abundance throughout the study site. Small-sized copepods such as Cyclopoida and Pseudocalanus spp. were dominant in the eastern side and the south of St. Lawrence Island. Pacific copepods (i.e., E. bungii, M. pacifica, Neocalanus cristatus, Neocalanus flemingeri, and Neocalanus plumchrus) occurred from the south of the St. Lawrence Island to the Bering Strait and were especially abundant in Chirikov Basin in 2018 (Supplementary Figure 1).
Based on cluster analysis of zooplankton community composition, five groups (A–E) including 3–9 stations were identified at 55%, 62%, and 69% similarity levels (Figure 4A). Copepoda was the most dominant taxon in the groups except group C, which was dominated by Polychaeta (Figure 4B). Each zooplankton assemblage was also relatively well separated in the dbRDA plot (Figure 4C). As a best solution in DistLM, four environmental parameters were selected and explained 40.1% of the zooplankton variation (Table 1). In the result, three variables were categorized in nutrients (silicate, phosphate and nitrate and nitrite), and the remaining one was TSM (Table 1).
Group D exhibited the highest total zooplankton abundance (708,006 ind. m–2) due to the abundance of small size copepods (Cyclopoida, Pseudocalanus spp.), Calanus spp. nauplii and bivalve larva in group D (Table 2). In the group, the highest number (total seventeen species/taxon) of the indicator species, including the small copepods, Fritillaria spp., barnacle nauplii and cypris, bivalve larva, were selected by IndVal (Table 2). Whereas group E had high abundances of Oikopleura species, Euphausiacea and Pacific copepods (especially, E. bungii and M. pacifica) originating from AnW. The Pacific copepod N. flemingeri and N. plumchrus were also selected as indicator species in group A. The horizontal distributions of the groups varied between the study years, and groups A and D were only observed in 2017 and 2018, respectively (Figure 5). Interannual changes in group E distribution were also identified, whereas groups B and C remained, respectively, distributed in the south of St. Lawrence Island and near the Alaskan coasts in both years.
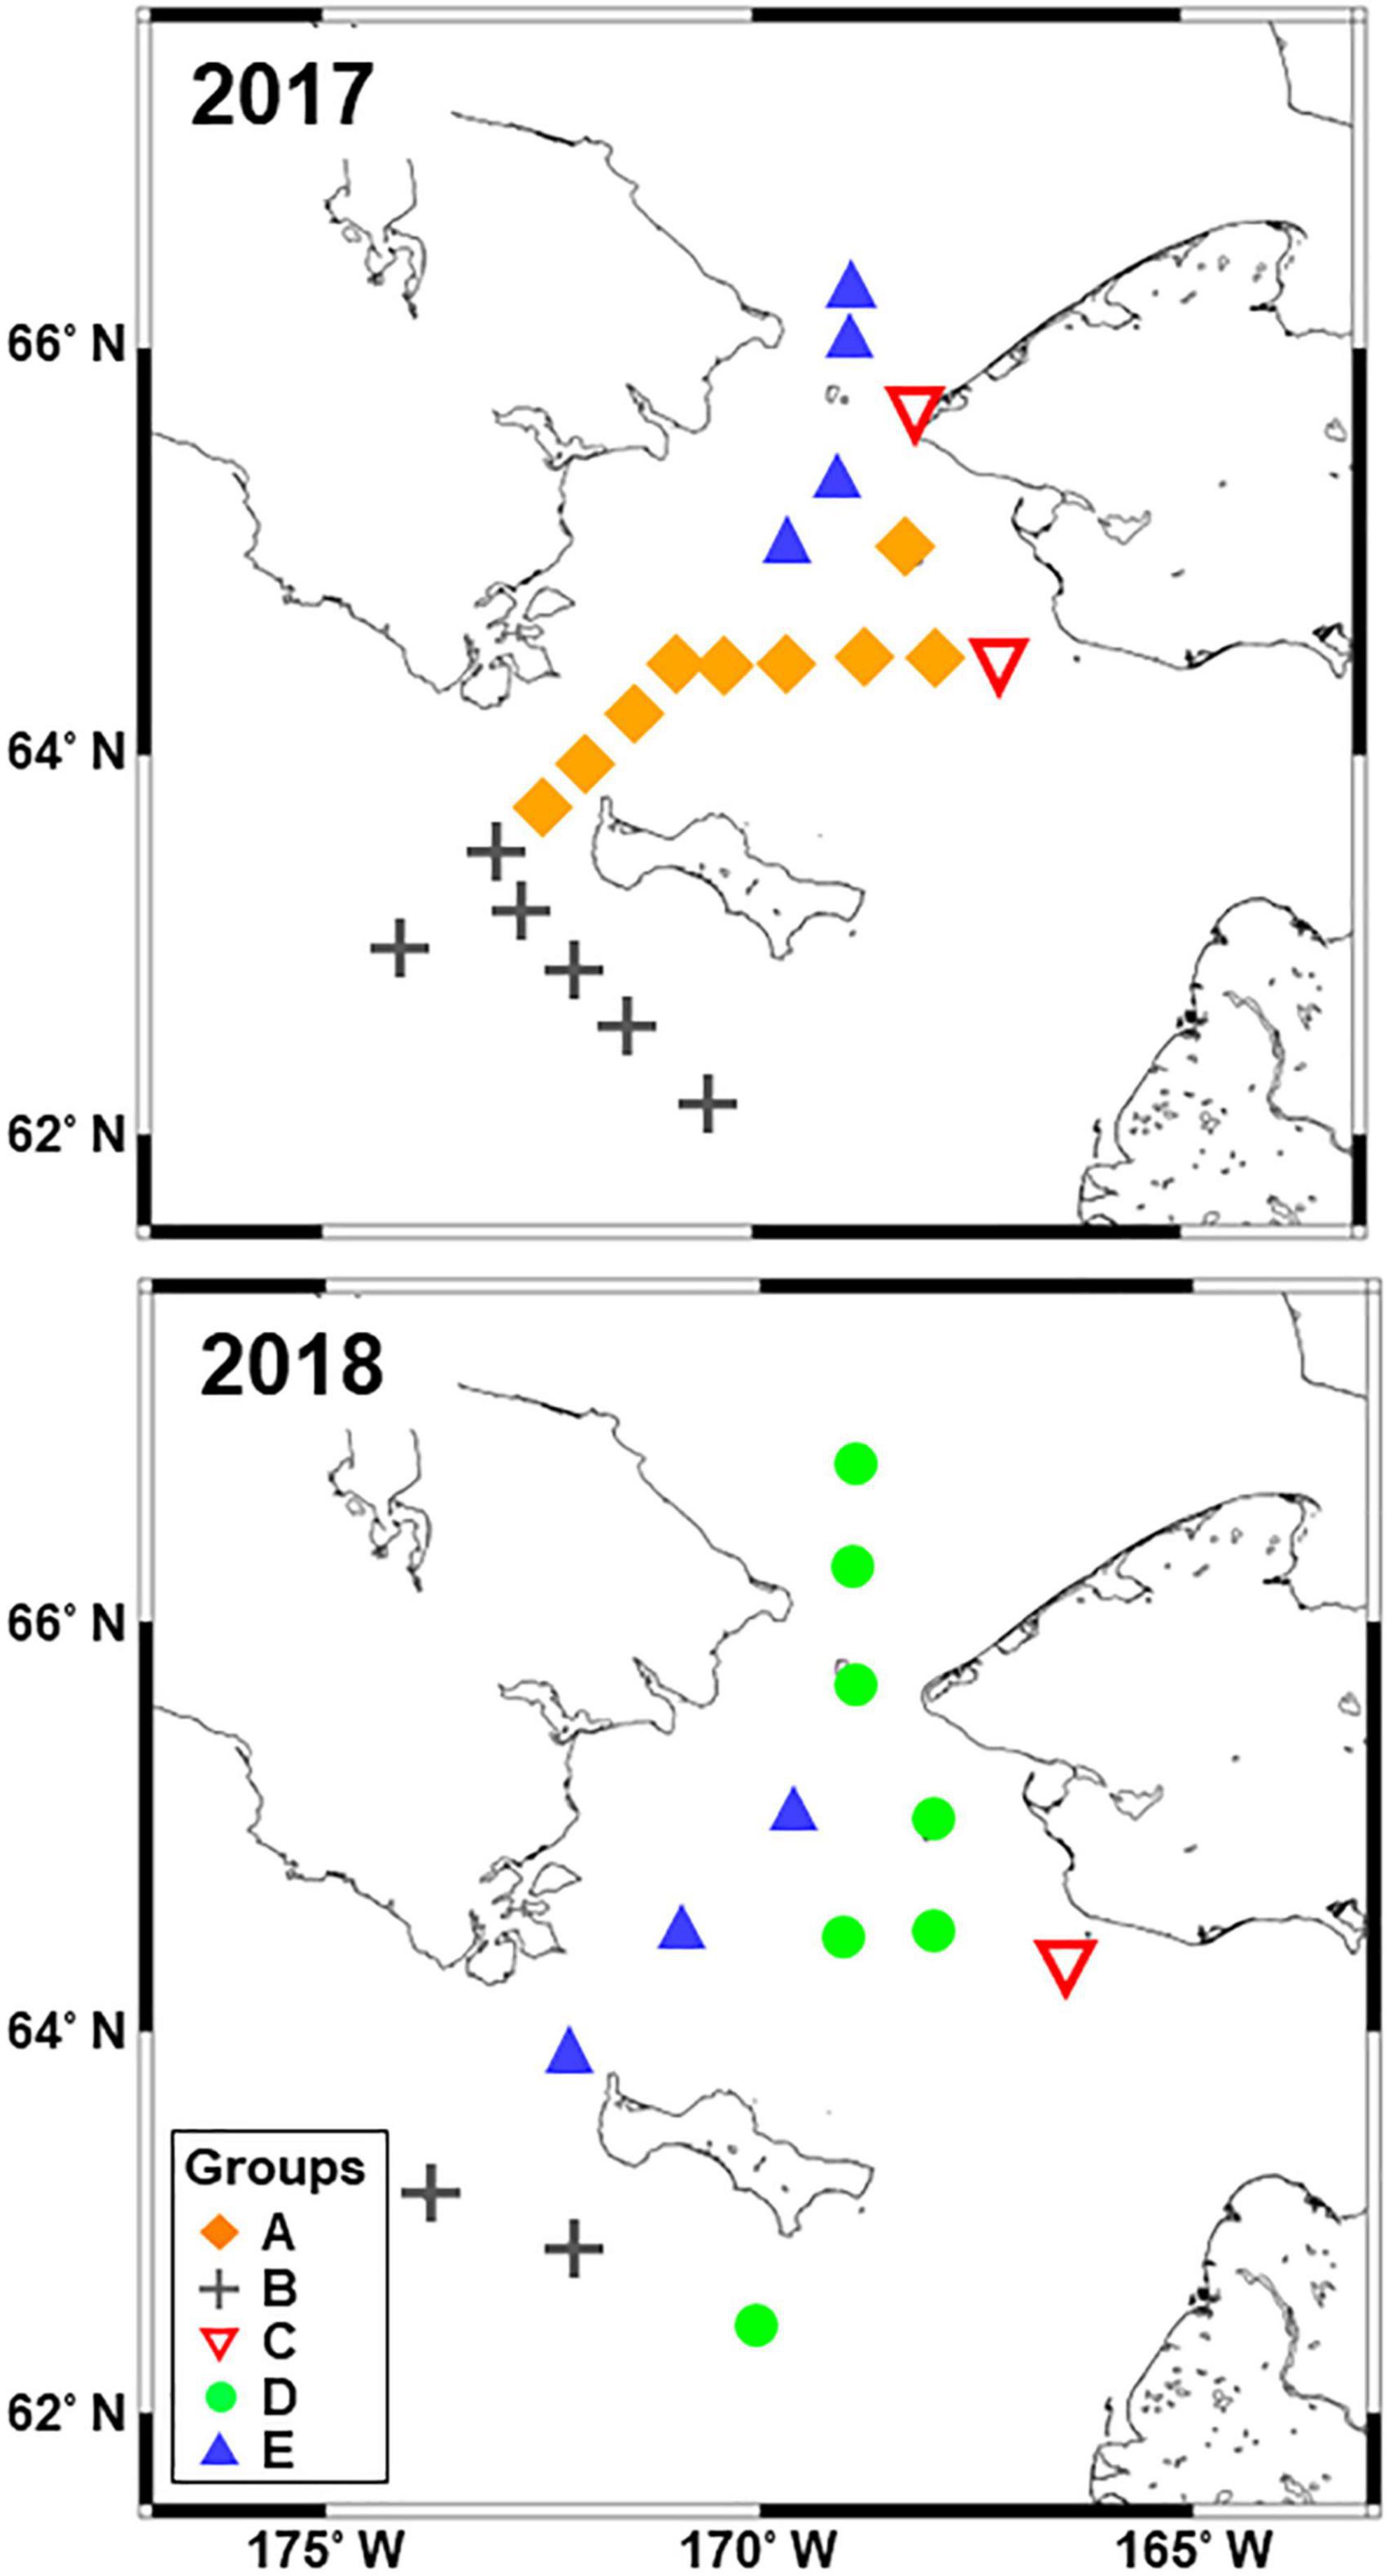
Figure 5. Horizontal distribution of the five groups identified from the Bray–Curtis similarity analysis based on zooplankton abundance (cf. Figure 4) in the northern Bering Sea during July of 2017 and 2018.
Hydrographic Features in the Clustering Groups
According to Danielson et al. (2020), water mass composition in the water column was different among the groups. Warm Coastal Water (wCW) was mainly observed in group C, all groups presented warm Shelf Water (wSW), cool Shelf Water (cSW) was mainly observed in groups A and B, Anadyr Water (AnW) in groups A and E, and Modified Winter Water (MWW) and Winter Water (WW) in group B (Figure 6). The interannual differences of the water mass composition in groups B and E were generally subtle, especially the salinity of group E. In contrast, the T-S diagram of group C varied greatly between years (Figure 6). As hydrographic features of the groups, groups A and E exhibited high concentrations of all nutrients except NH4–N compared to the other groups (Table 3). Group B showed the lowest temperature owing to the presence of MWW and WW. The warmest water was observed in Group C. Group D did not show clear difference on hydrographic parameters among the groups, excepting slightly higher temperature comparing to these in group A and E.
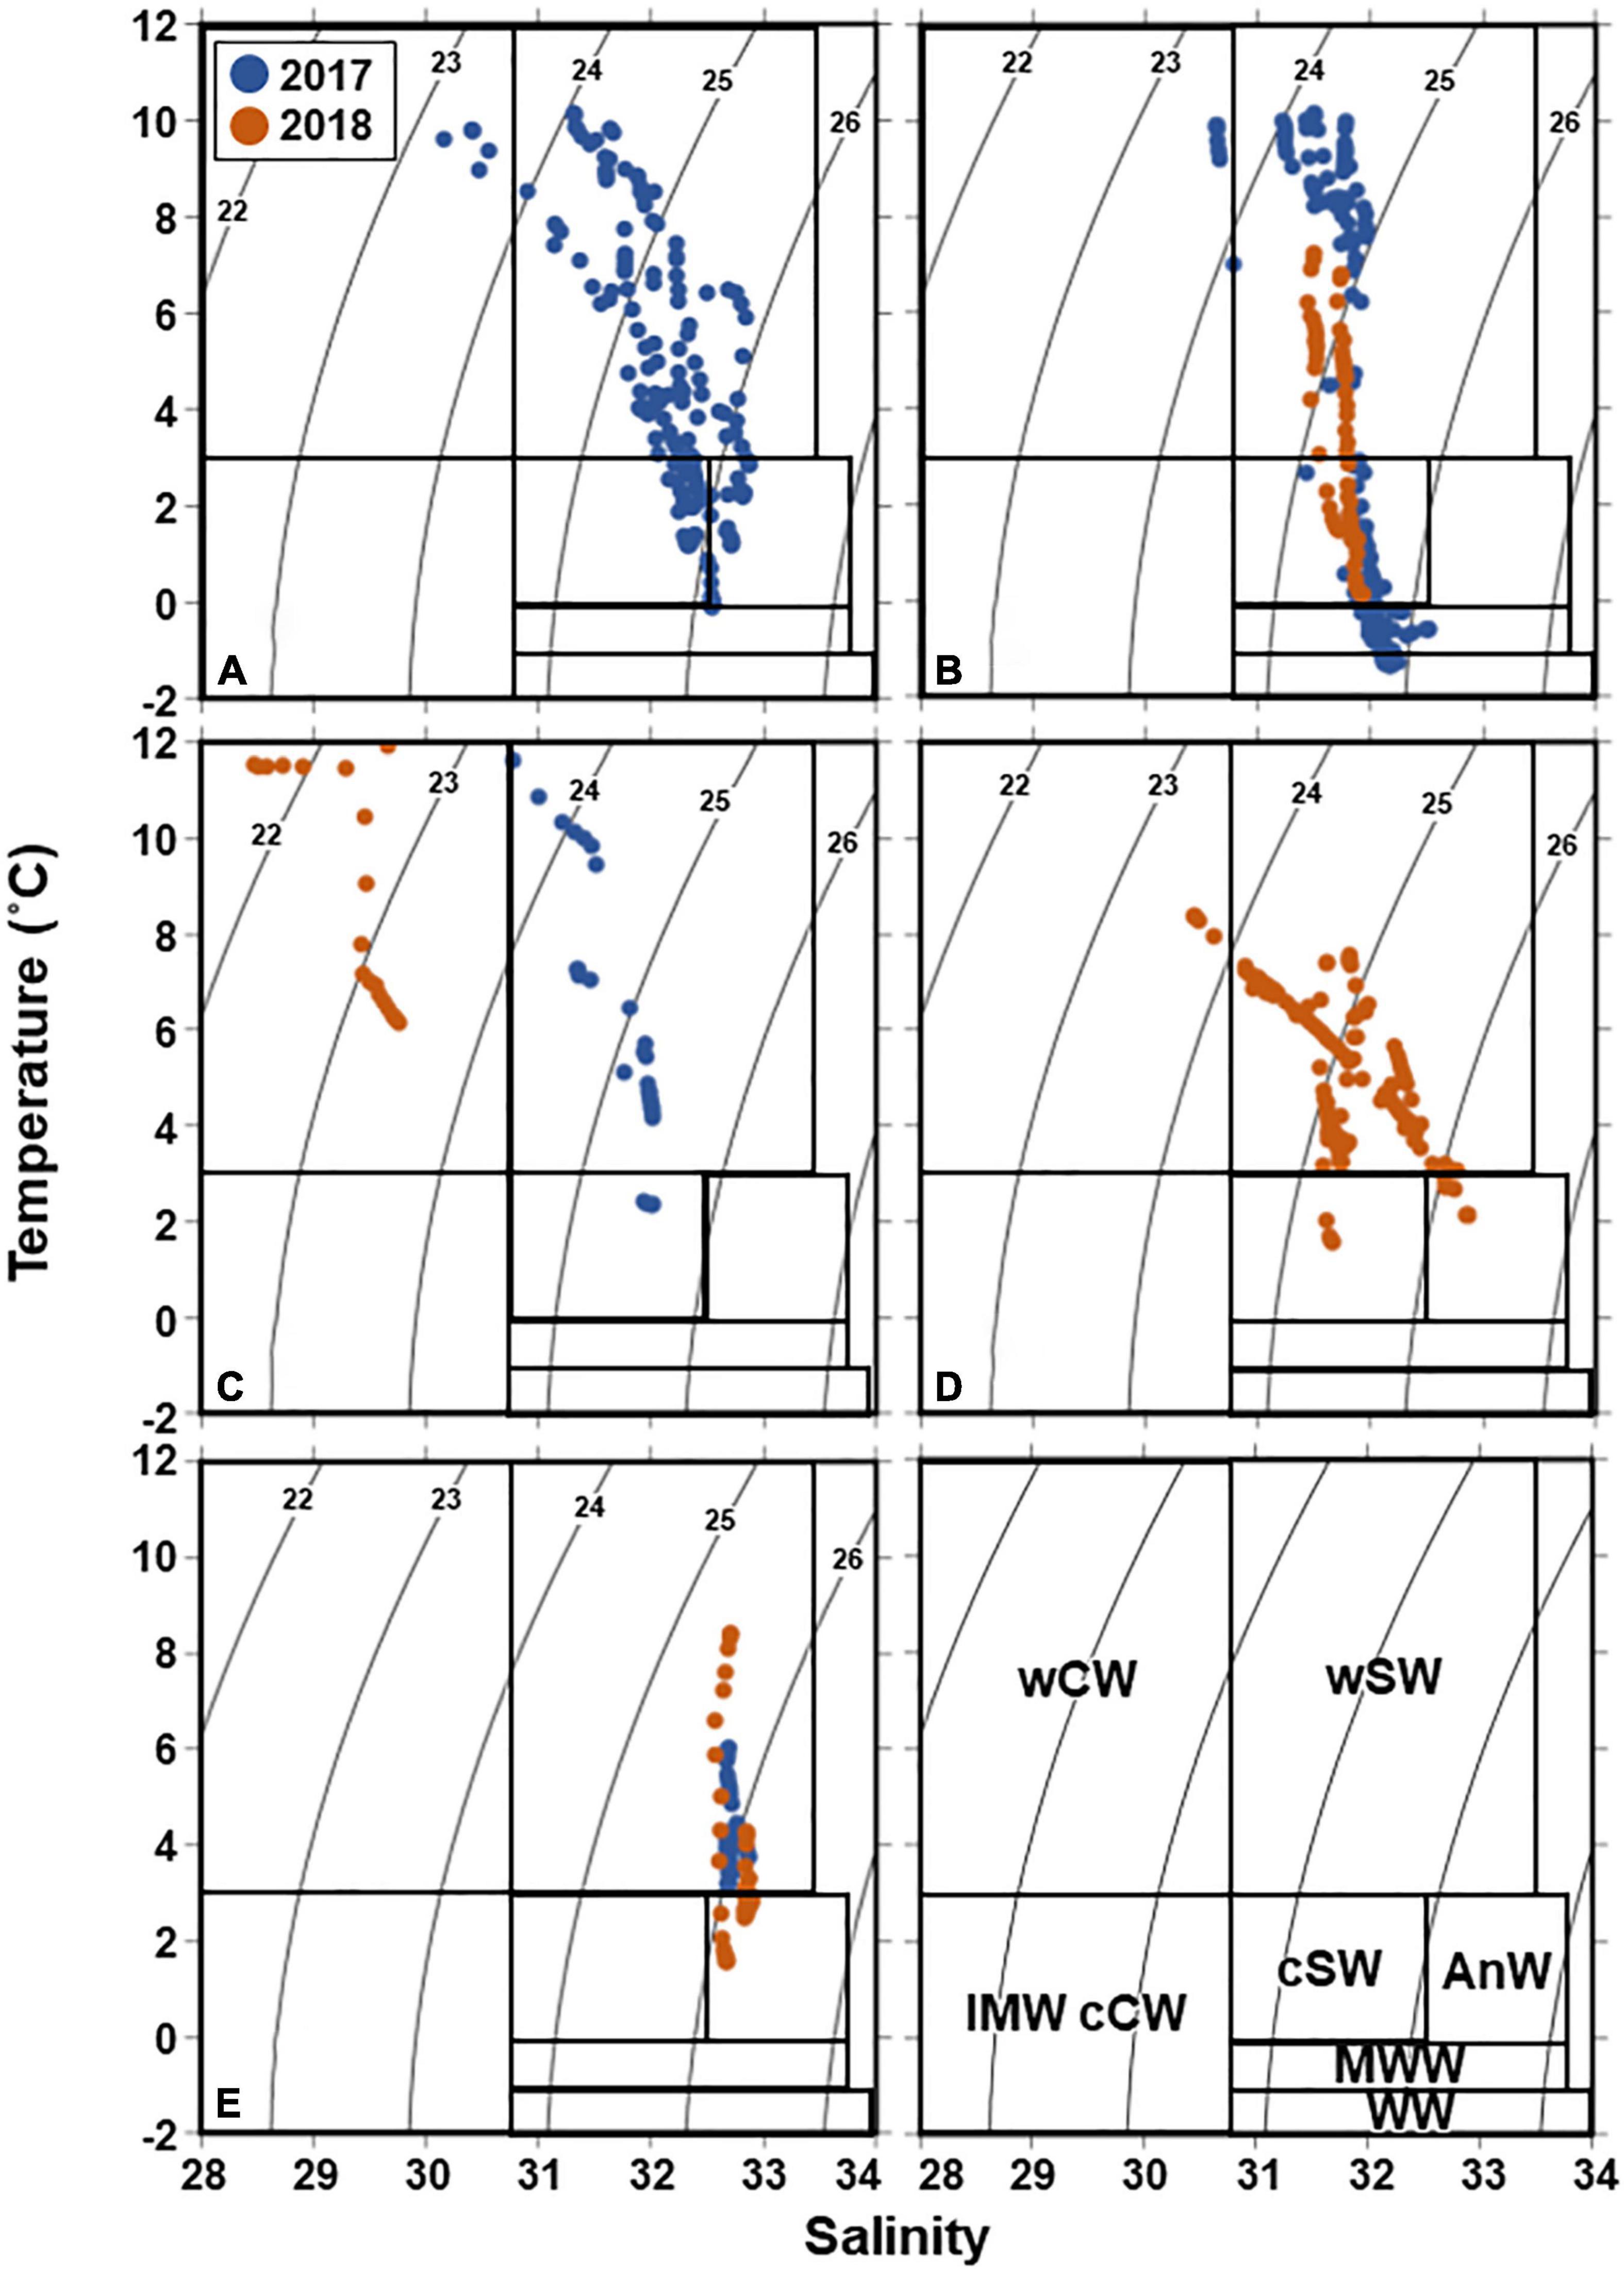
Figure 6. T-S diagram of the five groups (A–E) identified from Bray–Curtis similarity analysis based on zooplankton abundance (cf. Figure 4) in the northern Bering Sea during July of 2017 and 2018. The numbers in the panels indicate water density. wCW, warm coastal water; wSW, warm shelf water; IMW cCW, ice melt water and cool coastal water; cSW, cool shelf water; AnW, Anadyr water; MWW, modified winter water; WW, winter water (cf. Danielson et al., 2020).
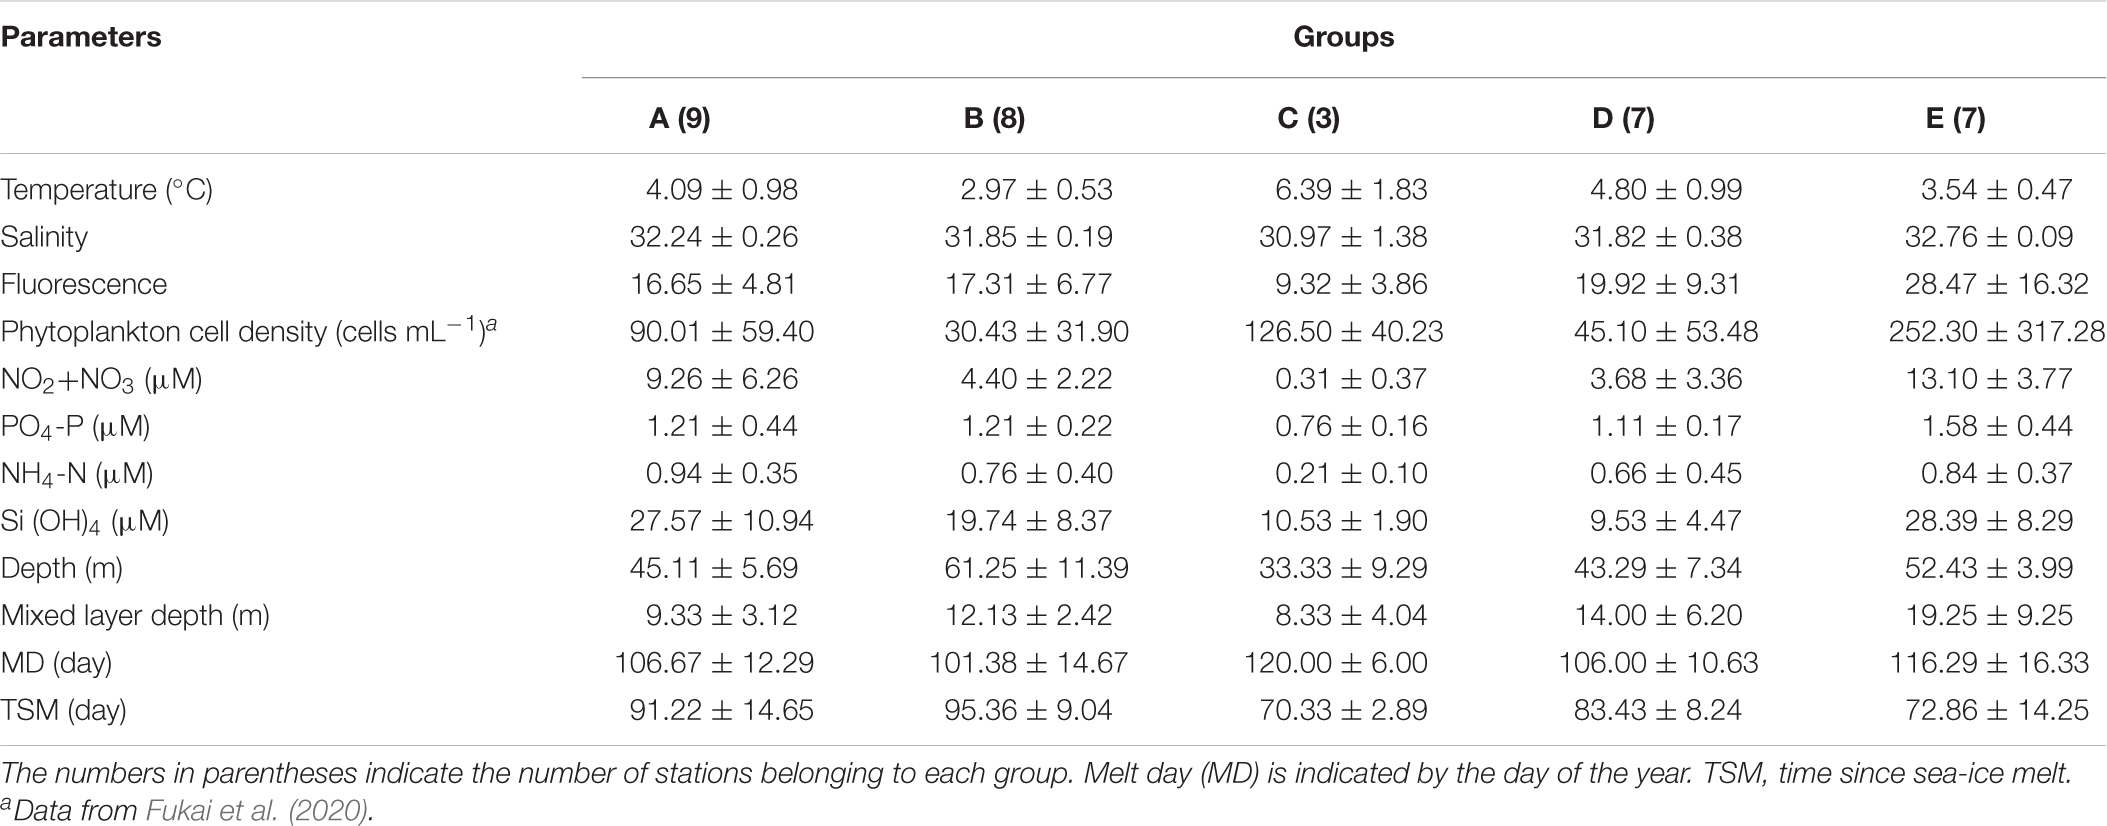
Table 3. Mean and standard deviations of environmental factors between the groups identified by cluster analysis (cf. Figure 4) in the northern Bering Sea during July of 2017 and 2018.
Population Structure of Large Dominant Copepods
Calanus glacialis/marshallae abundance was high in the south of St. Lawrence Island but low in Chirikov Basin in 2017 (Figure 7). In contrast, their abundance was high through the sampling area in 2018. The MCS of the copepod species was substantially lower in 2018 (2.10–3.44) compared to 2017 (3.02–5.24). E. bungii mainly occurred in the north of the St. Lawrence Island with no interannual differences. A higher abundance of M. pacifica was observed in 2018 than in 2017. The MCS of the copepod species exhibited a clear border at the west of St. Lawrence Island. Specifically, later stages (3.29–4.63) were observed in the northern area, whereas younger stages (1.46–2.32) were observed in the south. In 2018, their MCS remained low throughout the sampling area.
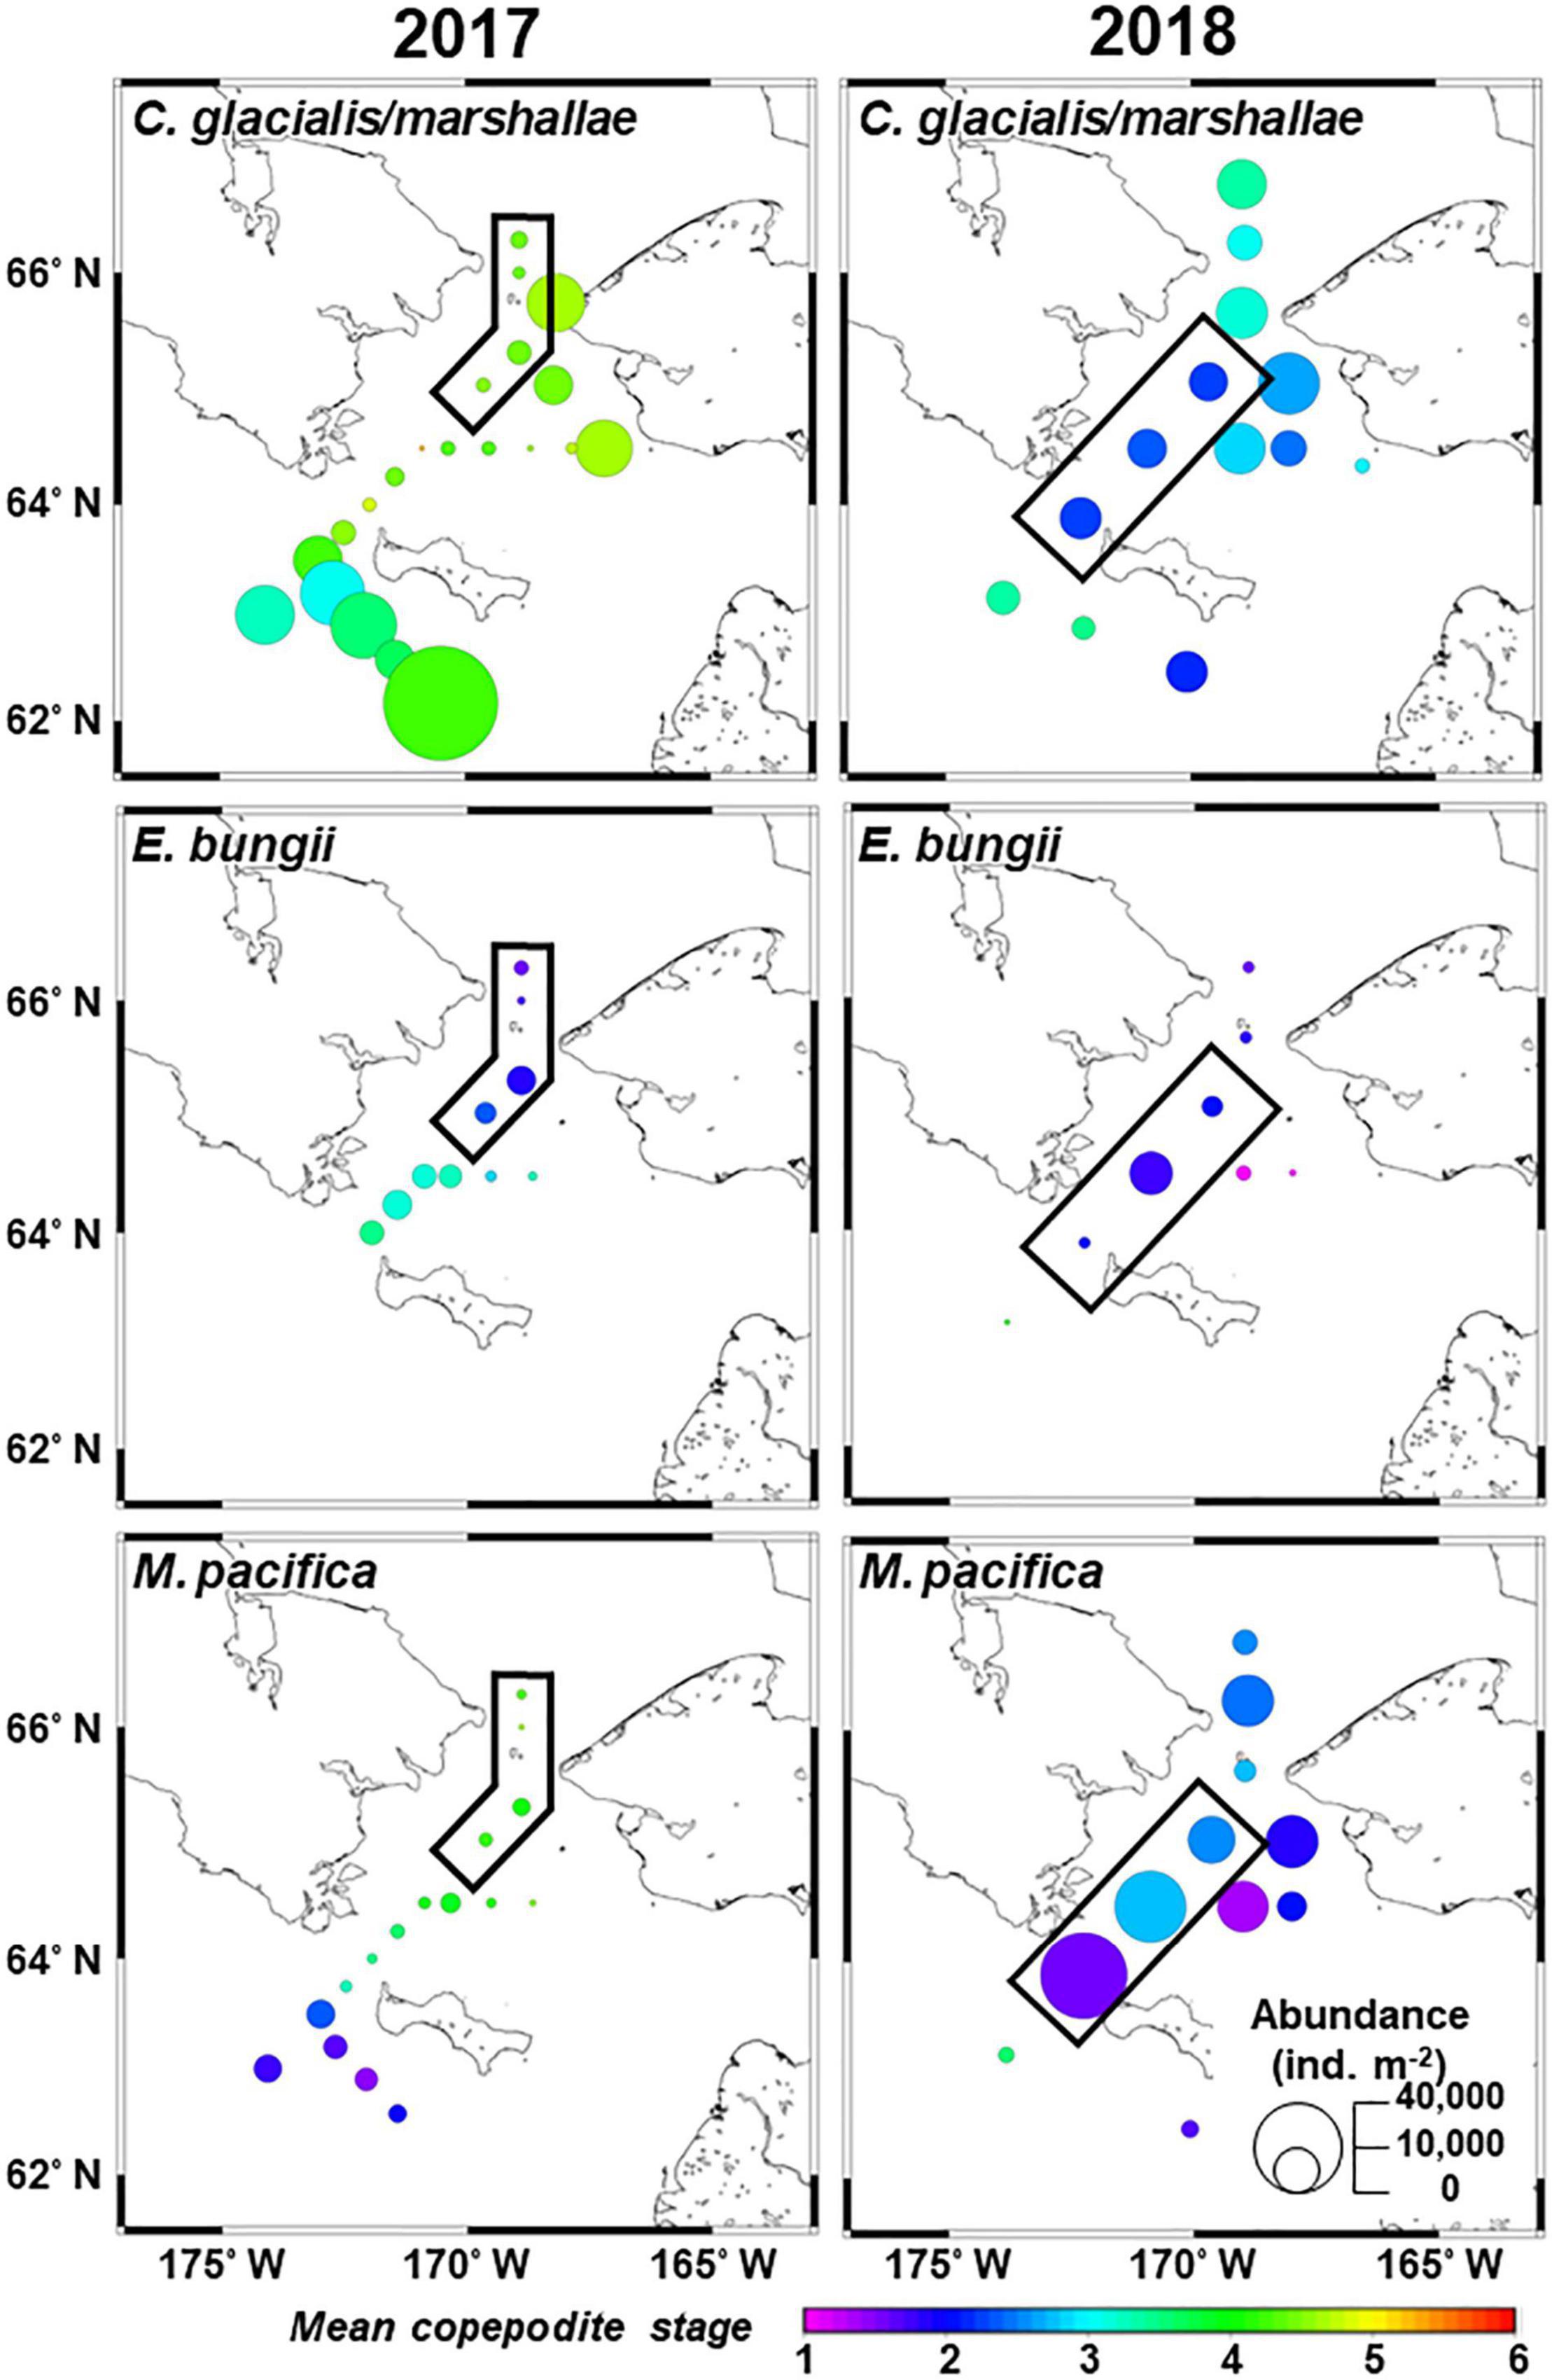
Figure 7. Horizontal distribution of dominant large copepods in the northern Bering Sea during July 2017 (left) and 2018 (right). The circle size and color denote the abundance and mean copepodite stage of each species. The black frames indicate the stations identified as group E, as demonstrated by Bray–Curtis similarity analyses based on zooplankton abundance (cf. Figure 4).
The abundance of Calanus spp. nauplii ranged from 0 to 26,136 ind. m–2 in 2017 and from 12,608 to 224,316 ind. m–2 in 2018 (Figure 8), and high abundances were frequently observed in 2018. Eucalanus bungii nauplii were distributed only around the Bering Strait in 2017 but they were observed throughout the study area in 2018.
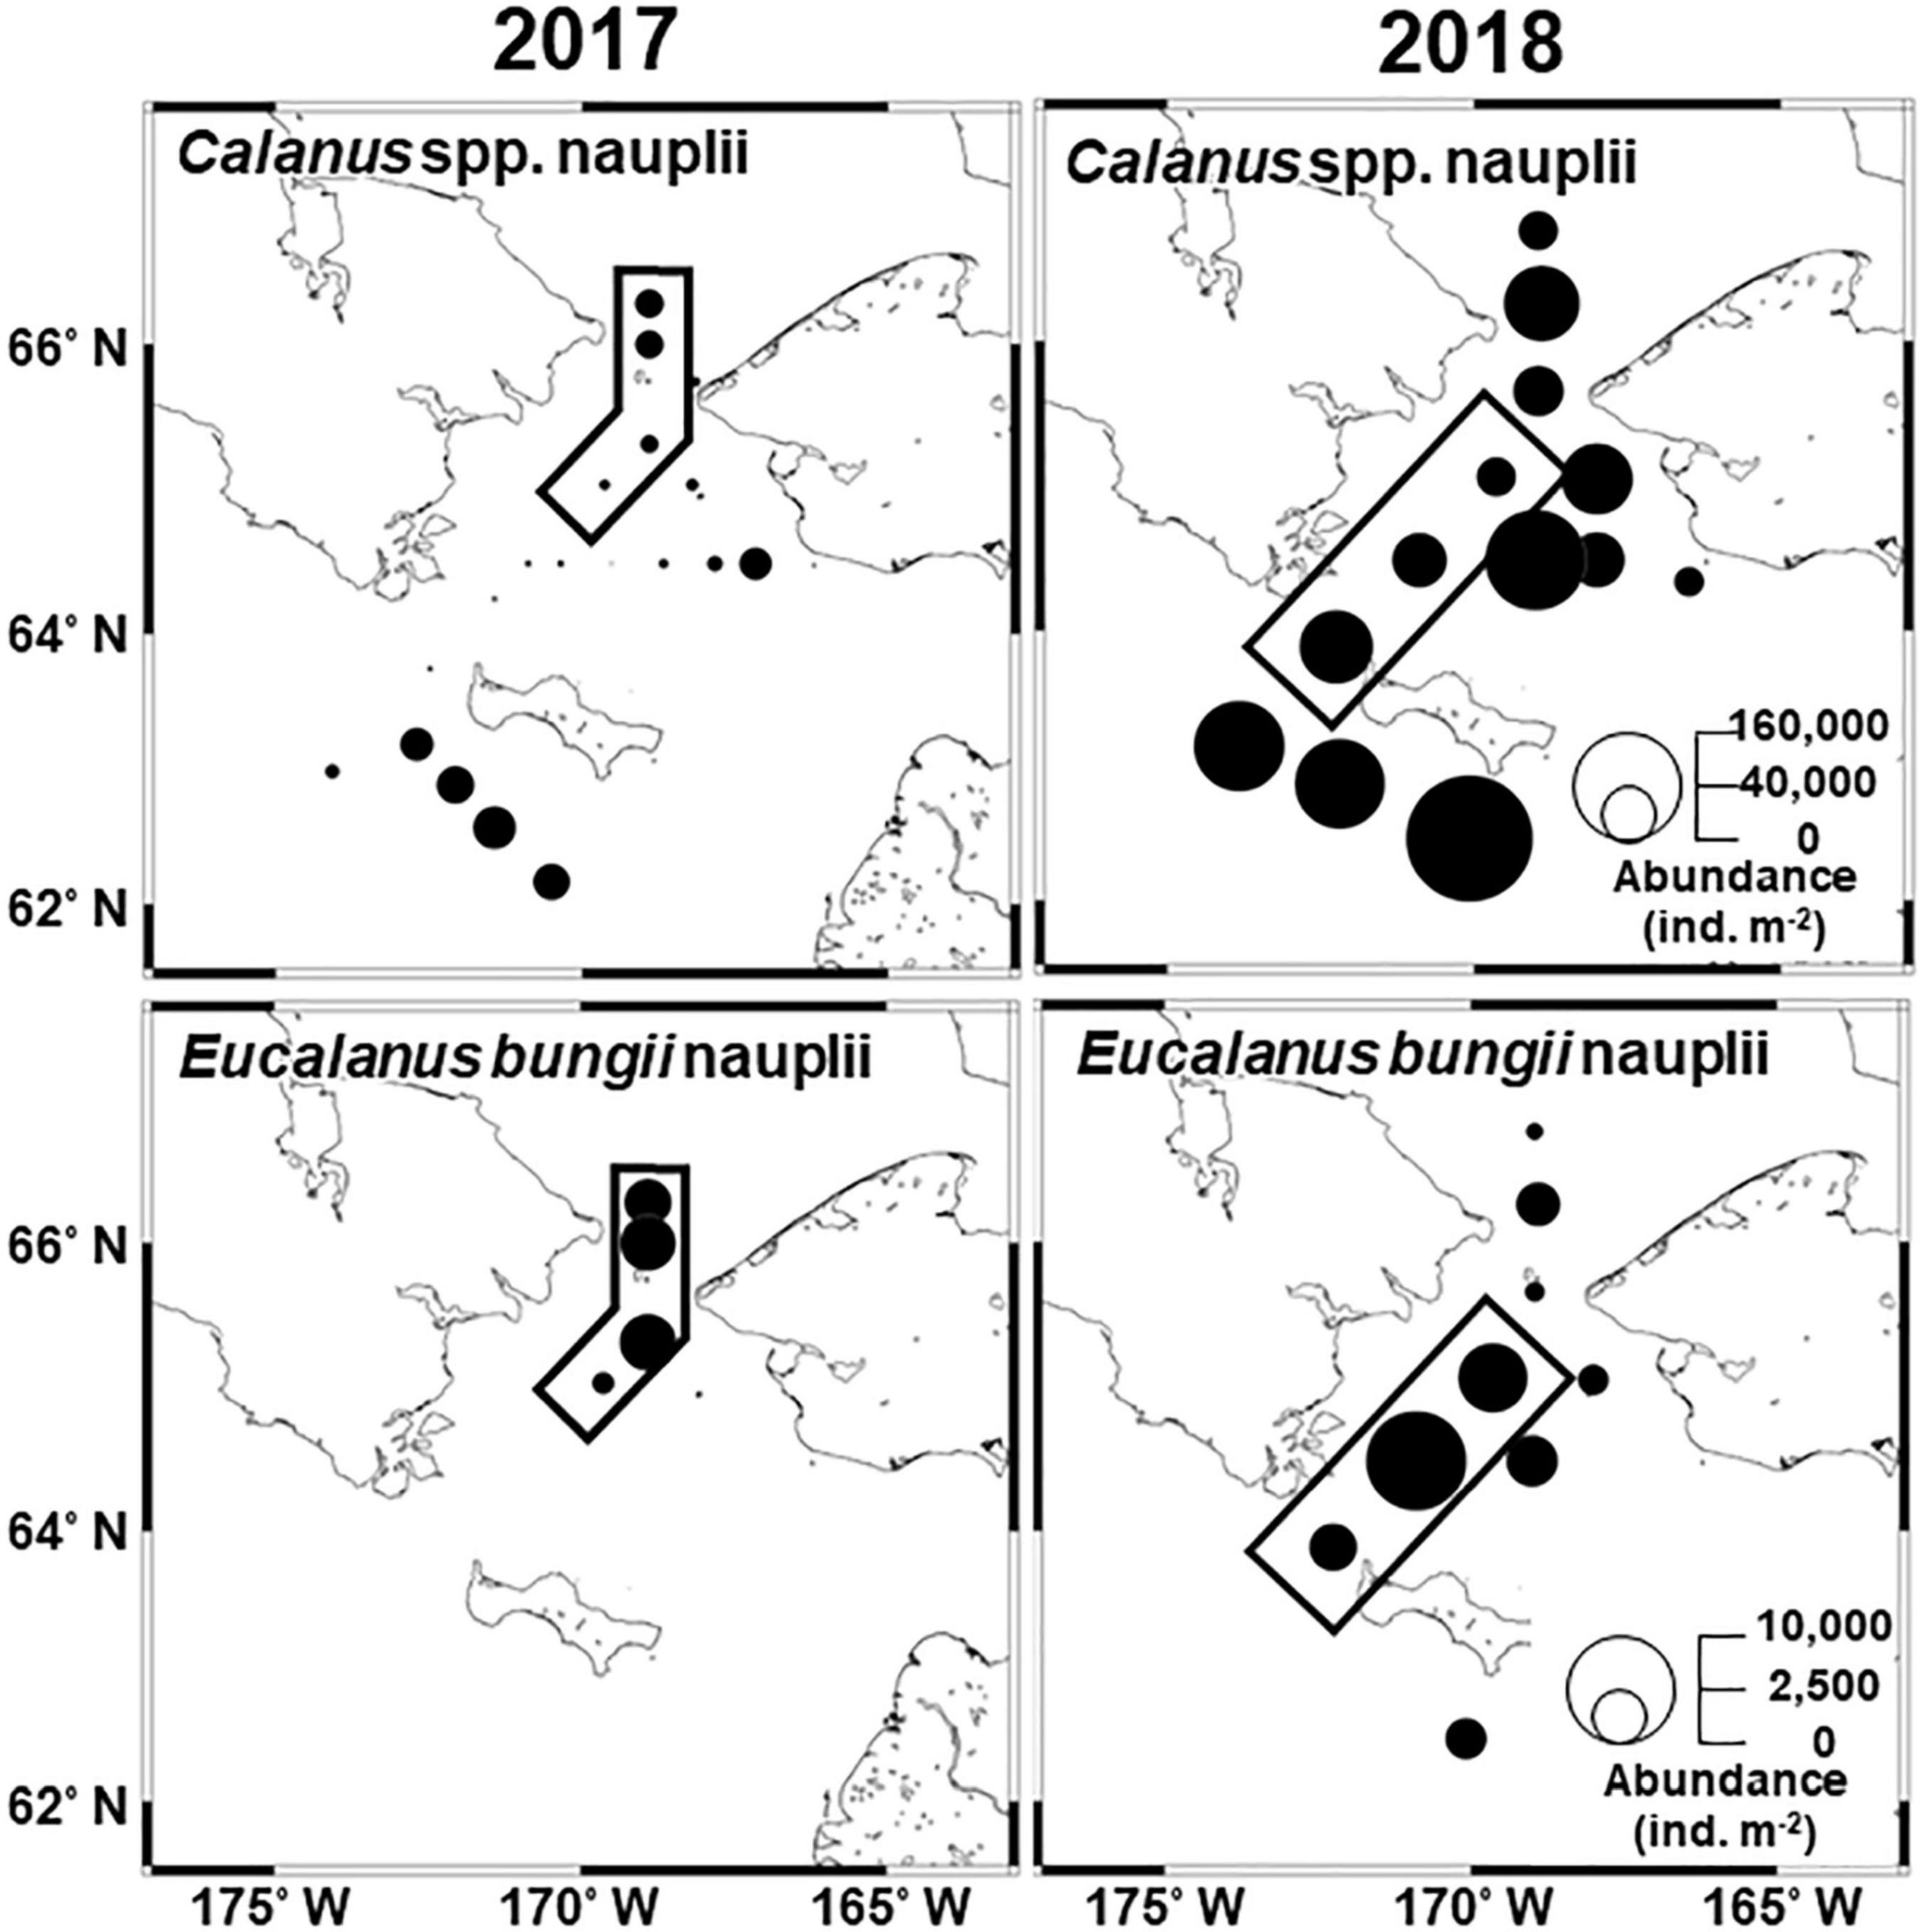
Figure 8. Horizontal distribution of dominant large copepod nauplii in the northern Bering Sea during July 2017 (left) and 2018 (right). The circle size denotes the abundance of each species. Black frames indicate the stations identified as group E, as demonstrated by Bray–Curtis similarity analyses based on zooplankton abundance (cf. Figure 4).
To compare the interannual population structure of large copepods excluding water mass differences, the abundance and MCS of group E copepods were compared between 2017 and 2018, as this group occurred in both years and showed similar hydrographic conditions (cf. Figure 6). This comparison indicated that C. glacialis/marshallae and M. pacifica exhibited significantly higher abundances and younger populations in 2018 than in 2017 (Table 4 and Figure 7). Calanus spp. nauplii were also significantly more abundant in 2018 than in 2017. In contrast, E. bungii did not exhibit any significant interannual differences.
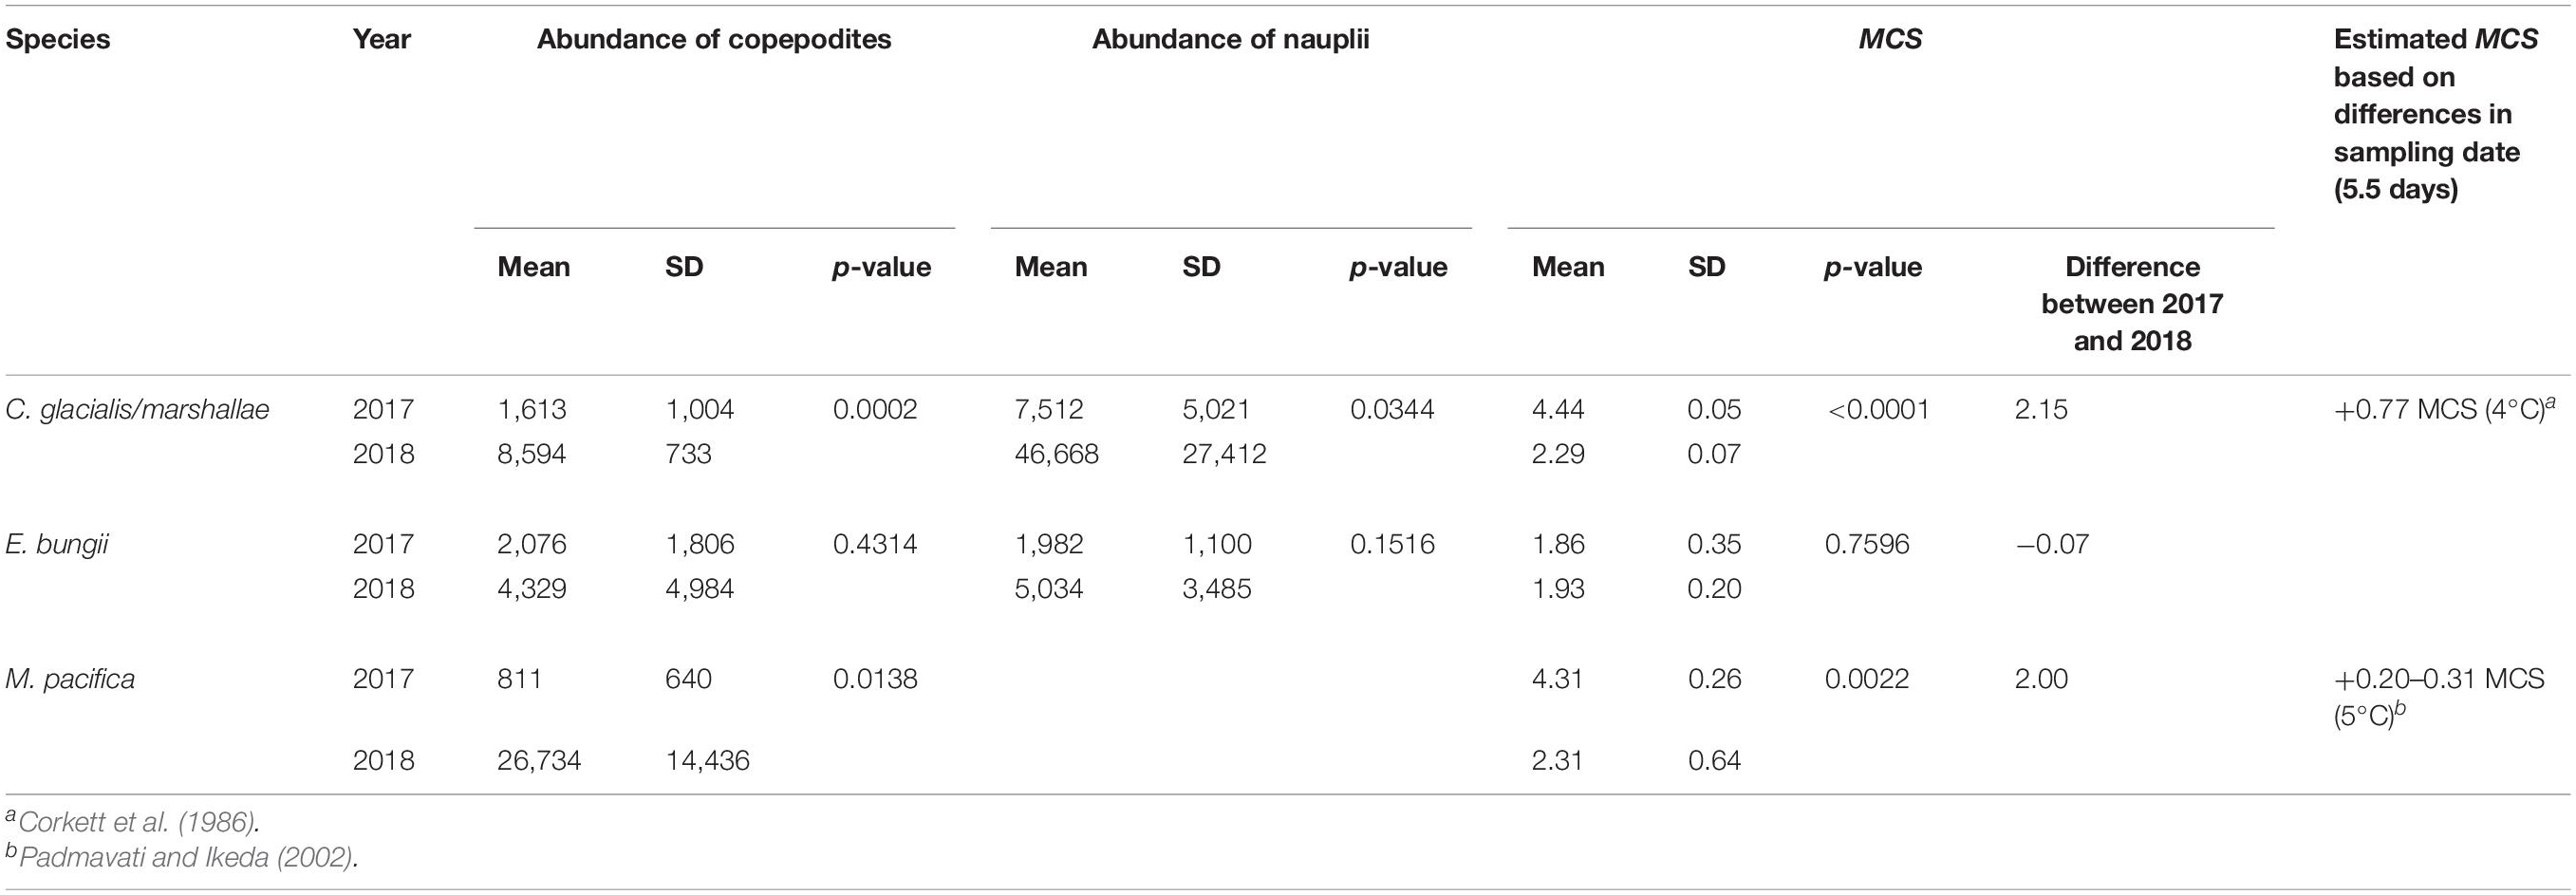
Table 4. Result of the Mann–Whitney U test on mean and standard deviation of copepodite abundance, nauplii abundance, and MCS of the dominant large copepods in group E identified via Bray–Curtis similarity analysis based on zooplankton abundance (cf. Figure 4) in the northern Bering Sea during July of 2017 and 2018.
Biomass and Production of Copepods
The copepod biomass and production exhibited significant inter-group differences (Figures 9A,B). In groups B and C, Arctic species mainly contributed to the parameters, whereas small copepods dominated biomass and production in group D. In groups A and E, biomass and production were dominated by Pacific copepods, but was lower than that observed in the other groups. Regarding to P/B ratio, small copepods showed the highest contribution (4.54–5.32%) among the group category (Figure 9C). When comparing the effects of the pacification index and temperature on the copepod community, the index did not increase the total production, and temperature had a slightly positive effect on the production (Figure 9D).
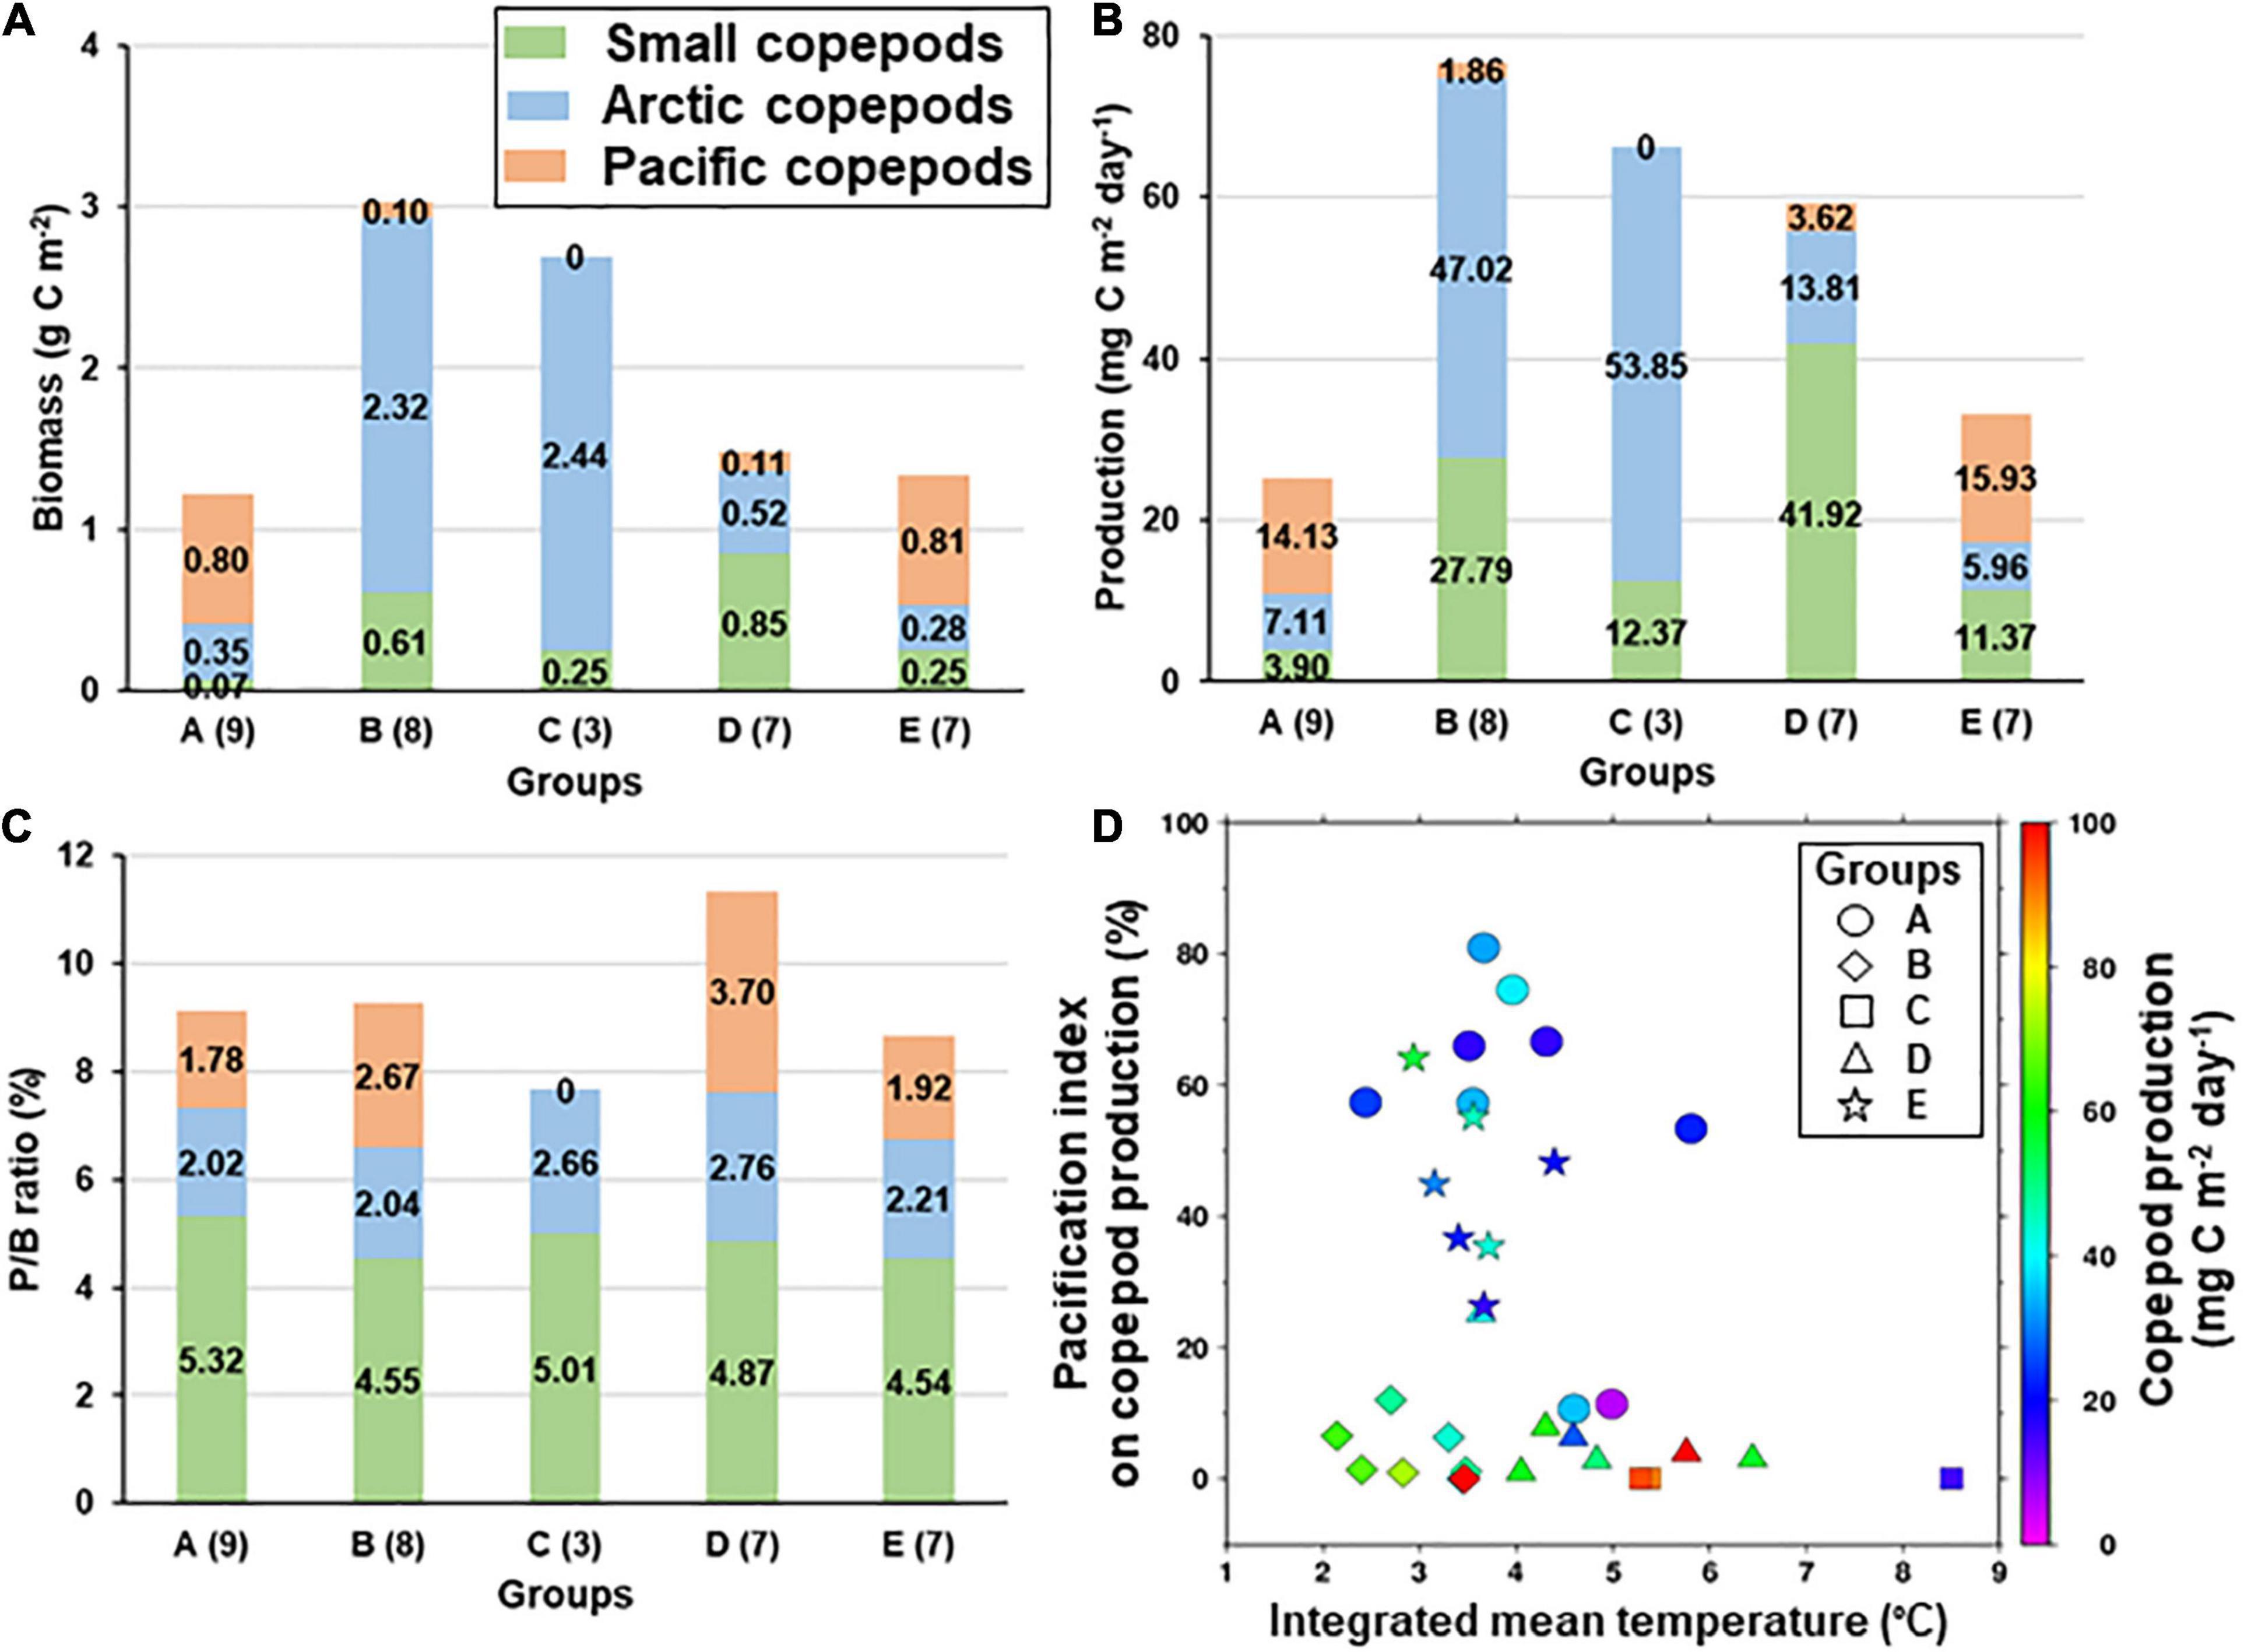
Figure 9. Inter-group comparison of copepod biomass (A), production (B), and P/B ratio (C) by group category (cf. Supplementary Table 2) in the northern Bering Sea during July 2017 and 2018. The values in the parenthesis are the number of stations in each group (cf. Figure 4A). Relationship between the pacification index, temperature, and total copepod production in the northern Bering Sea during July 2017 and 2018 (D). The pacification index in the copepod community was calculated by dividing the Pacific-copepod production by the whole copepod production (see the “Materials and Methods” section for more details). The symbols indicate cluster groups.
Discussion
Summer Zooplankton Community in Alaska Coastal Region and St. Lawrence Island
Interannual differences in the zooplankton community were observed in the Chirikov Basin but not near the Alaska coastal region and the south of St. Lawrence Island.
Group C was observed in the Alaska coastal region during both years. Given that the water column of this group exhibited high temperature and low salinity, we concluded that this group belonged to the ACW community (Coachman et al., 1975; Danielson et al., 2017). The ACW community is abundant in cladocerans and coastal copepods (e.g., Acartia hadsonica and Centropages abdominalis) (Hopcroft et al., 2010). However, in this study, mitraria larvae of benthic Polychaeta (Shanks, 2001) were the most dominant taxa. Particularly, the highest abundance (581,378 ind. m–2) of the mitraria larvae was recorded at Stn. 19 in 2018, where the integrated water-column salinity was 29.4, which was lower than the previous value (29.9–30.8) defined as ACW in Hopcroft et al. (2010). Therefore, given that Stn. 19 was strongly affected by brackish water from the coastal region, mitraria larvae of benthic Polychaeta were dominant in this study region. In brackish water, the copepod production was extremely low (14.68 mg C m–2 day–1) even at the highest temperature (8.5°C).
Group B was observed south of St. Lawrence Island in both years, and was characterized with high TSM in dbRDA (Figure 4C) because their stations located in the most southern area in whole study region. On zooplankton composition in the group, Acartia spp., C. glacialis/marshallae, bivalve larvae, and echinopluteus larvae were dominated. The biomass of C. glacialis was linked to the presence of cold (<0°C) and saline WW (Pinchuk and Eisner, 2017). In this study, because of the presence of WW in the near-bottom layer in 2017, C. glacialis/marshallae was abundant in group B. The highest copepod production was observed in this group owing to the contribution of this species. Moreover, the south of St. Lawrence Island is known to be a hot spot of benthic species (Grebmeier et al., 2006), and the high abundances of bivalve and echinopluteus larvae in group B are likely due to their high reproduction rates. Given the high copepod production and benthic larva abundance observed in this region, we concluded that the south of St. Lawrence Island plays a key role in sustaining the zooplankton abundance of the northern Bering Sea.
Interannual Differences in Chirikov Basin
In Chirikov Basin, the zooplankton community explicitly showed interannual changes. For instance, groups A and E were observed in 2017, whereas groups D and E were observed in 2018. Groups A and E were characterized by the presence of Pacific copepods (N. flemingeri, N. plumchrus, E. bungii, and E. bungii nauplii). These species are transported by saline and nutrient-rich AnW (Springer et al., 1989; Matsuno et al., 2011; Ershova et al., 2015). In fact, the salinity and the concentration of all nutrients except NH4–N in the water column of groups A and E were higher than those of the other groups. Based on species composition and hydrographic results, groups A and E in 2017 were found to belong to the AnW community. Additionally, nutrients (silicate, nitrate and nitrite) were significantly contributed to zooplankton variability, and groups A and E were located in higher values (Figure 4C). In other words, nutrients may be a good indicator of water masses and zooplankton assemblages in this region during summer (Springer et al., 1989; Matsuno et al., 2011; Ershova et al., 2015).
We next compared the Pacific copepod abundances in this study with those reported in a previous study from the northern Bering Sea and the Chukchi Sea during September 2007 (Eisner et al., 2013). Neocalanus species exhibited a similar abundance in both studies [23–620 ind. m–2 (this study) vs. 10–1,718 ind. m–2 (cf., Table 4 in Eisner et al., 2013)]. However, the abundances of E. bungii and M. pacifica were much lower in this study than in the previous work. Particularly, group A showed only approximately 1/20 of the abundance reported in the earlier study. It is also worth noting that the sampling methods between the studies were almost the same (mouth diameter 45 cm vs. 50 cm; mesh size 150 μm vs. 160 μm). The characteristics of group A, which belonged to the AnW community with low abundance, had not been previously reported in Chirikov Basin. The group A water column is known to be strongly stratified (Ueno et al., 2020), and the upper layers were occupied by low-density wCW and wSW. These observations suggested that low-density water masses prevent nutrient supply from the bottom layer. In turn, this restricts phytoplankton growth and dramatically decreases zooplankton abundance. In contrast, the water column of group E exhibited thorough vertical mixing in 2017 due to weak stratification (Ueno et al., 2020). AnW upwells in the Chirikov Basin by bottom friction through the Anadyr Strait (Kawaguchi et al., 2020). Therefore, nutrient-rich AnW upwells into the upper layer without stratification in group E, followed by an increase in phytoplankton production and an increase in Appendicularia, E. bungii, and Euphausiacea compared to group A.
Group D, which was observed only in 2018, had the highest abundance of total zooplankton and copepods and was dominated by small copepods (Cyclopoida and Pseudocalanus spp.). Based on studies in the southeastern and northern Bering Sea during the summer of 2018, the abundance of small copepods (<2 mm prosome length) increased whereas that of large copepods (>2 prosome length) decreased owing to a reduction in sea-ice cover, elevated temperature, and delayed phytoplankton spring bloom (Duffy-Anderson et al., 2019). The temperatures in group D were slightly higher than those in groups A and E in this study, and therefore these warm conditions may have accelerated the growth rate of small copepods (Corkett and McLaren, 1978). Regarding copepod food availability, the number of diatom resting stage cells in the surface sediment, a variable that represents the time-integrated abundance of diatoms from sea-ice melt to the sampling period (e.g., spring and summer), was 10–100 times higher in 2018 than in 2017 (Fukai et al., 2019). This suggests that food was much more available for copepods in 2018 than in 2017. In turn, these unusual conditions (warm temperatures and food abundance) associated with early sea-ice melt favored the reproduction, survival rate, and growth rates of small copepods (Duffy-Anderson et al., 2019), which eventually resulted in high copepod production in the Chirikov Basin in 2018.
Interannual Changes in the Population Structure of Large Copepods
The zooplankton biomass in the northern Bering Sea was dominated by the large copepods C. glacialis/marshallae, E. bungii, M. pacifica, and Neocalanus species (Hopcroft et al., 2010; Eisner et al., 2013). Among these species, C. glacialis/marshallae, E. bungii, and M. pacifica reproduce in the upper layer with active phytoplankton grazing (Padmavati et al., 2004; Shoden et al., 2005; Søreide et al., 2010). Owing to the strong link between copepod reproduction and phytoplankton blooms, zooplankton population structure was expected to be directly affected by shifts in spring bloom timing.
The interannual comparison of population structure for the three large copepods in group E, C. glacialis/marshallae, and M. pacifica exhibited significant differences, particularly a higher abundance and younger stages in 2018 than in 2017. This was likely because sampling was conducted 5.5 days earlier in 2018 than in 2017. When copepod development was estimated in these 5.5 days, we assumed +0.77 MCS for C. glacialis at 4°C (Corkett et al., 1986) and +0.20–0.31 MCS for M. pacifica at 5°C (Padmavati and Ikeda, 2002). However, given that these values were much lower than the interannual MCS differences (2.15 MCS and 2.00 MCS for C. glacialis/marshallae and M. pacifica, respectively) in this study, we concluded that the sampling date was not the main reason for the observed differences.
Alternatively, reproduction timing, which is strongly linked with spring bloom (Padmavati et al., 2004; Shoden et al., 2005; Søreide et al., 2010) was also explored. In 2017, the spring bloom in the Chirikov Basin was observed as an ice-edge bloom on 23 April due to a late sea-ice retreat (Kikuchi et al., 2020). In 2018, however, the open-water bloom was delayed (17 May) owing to an early sea-ice retreat and weakened water column stratification by strong winds (Kikuchi et al., 2020). Owing to this shift in the phytoplankton bloom timing, the number of days from the bloom to the sampling date was calculated as 78.5 days in 2017 and 49 days in 2018. Additionally, the abundance of the two species was significantly higher in 2018 than that in 2017 (U test: p < 0.05). Assuming that the natural mortality rate of the copepods was not different in both years, the reproduction timing of the species in 2018 was closer to the sampling date than that in 2017. Therefore, late sea-ice retreat induces early reproduction of large copepods with ice-edge bloom, as observed in 2017. Conversely, early sea-ice retreat delays phytoplankton blooms resulting in copepod reproduction delays, as observed in 2018. In conclusion, the interannual changes in the population structure of the large copepods C. glacialis and M. pacifica are largely driven by the timing of phytoplankton blooms associated with sea-ice retreat.
It is not immediately clear why E. bungii abundances and populations did not change between the studied years; however, we believe this could have been due to species-specific grazing strategies. C. glacialis and M. pacifica are believed to selectively graze on microzooplankton, whereas E. bungii has been described as an opportunistic grazer (Campbell et al., 2016). Thus, the sensitivity of copepods to environmental changes including prey availability could be substantially affected by their species-specific grazing strategy.
Ecological Impacts of Changing Zooplankton Communities
Our findings demonstrated that early sea-ice retreat induces high copepod production with abundant small copepods and young stages of large copepods. The changes in copepod size frequency and production can directly and indirectly affect higher trophic levels, particularly fish and planktivorous seabirds (Heintz et al., 2013; Jones et al., 2018; Duffy-Anderson et al., 2019). Negative effects in higher trophic levels were reported during 2018, including decreases in the population of forage fish species associated with decreases in phytoplankton blooms and zooplankton productivity (Cornwall, 2019; Duffy-Anderson et al., 2019). Other studies have reported high mortality rates and reproductive failure of sea birds due to warm temperatures and food scarcity (Jones et al., 2018, 2019; Dragoo et al., 2019; Nishizawa et al., 2020), whereas another study reported a decline in phocid seal body condition (fat and mass/length) (Boveng et al., 2020). These opposite responses between zooplankton and higher trophic levels suggest that small copepods do not efficiently reach the higher trophic levels despite being highly abundant, which reported in the 1980s investigations (Springer et al., 1989). Food availability, food quality, and transfer efficiency could thus be limiting factors that prevent the transfer of energy from copepods to higher trophic levels. Food availability for fish species could be expressed as a ratio of small copepod production to total copepod production, and the lowest value (31.9%) was observed in group D compared to the other groups (51.7%–81.1%). This low food availability (dominance of small individuals) likely caused a marked decrease in predator feeding (O’Brien, 1979). Almost none of the small copepods in this study store lipids in their bodies, and therefore small copepod species are far less nutritious than their larger counterparts. In the Bering Sea, the dominance of low-lipid (i.e., low nutrition) zooplankton has decreased the survival rate of pollock in winter regardless of zooplankton abundance (Heintz et al., 2013). Recent studies linked a lack of interaction between the members of the plankton food web during 2018 with a decrease in energy and material transfer efficiency (Yamaguchi et al., 2021), resulting in a substantial decrease in jellyfish populations in 2018 (Maekakuchi et al., 2020). Therefore, even if zooplankton abundance and production are higher, the dominance of small-sized and low-nutrition zooplankton adversely affects the higher trophic levels in the northern Bering Sea (Springer et al., 1989).
The northern Bering Sea and the southern Chukchi Sea are undergoing “pacification,” a borealization process related to the transport of anomalies from sub-Arctic seas into the Arctic Ocean, such as an increased influx of Pacific water containing sub-Arctic species (cf. Polyakov et al., 2020). We estimated the pacification index of copepod production as the ratio of Pacific copepod production to that of all copepod species. In cases of high pacification indices (e.g., groups A and E), the Pacific copepods contributed half of the total copepod production; however, the amounts did not reach the original production by Arctic copepod C. glacialis (e.g., groups B and C). Therefore, the pacification of the copepod community will ultimately decrease copepod productivity in the study area. The marine ecosystem of the northern Bering Sea is thus undergoing profound and unexpected ecological changes due to its unique geographical characteristics (e.g., high-latitude, nutrient inflow) (Huntington et al., 2020), which will invariably affect the local marine biota. Therefore, continued monitoring of the trophic levels and energy transfer in this region is required to prevent further ecological impacts.
Conclusion
In this study, the patterns of inter-annual changes in the zooplankton community differed among the regions. The zooplankton communities in the Alaska coastal region and the south of St. Lawrence Island were consistently affected by water masses and input of benthic larvae without interannual changes.
Clear interannual changes in the zooplankton community were observed in the Chirikov Basin. The AnW community, which was characterized by pacific copepods, was dominant in 2017, whereas the zooplankton community was dominated by small copepods in 2018. This change was thought to be associated with the unusual conditions (warm temperatures and food abundance) caused by the early sea-ice reduction. The large copepods C. glacialis and M. pacifica exhibited large interannual differences in population structure, suggesting that their reproduction timing shifted because of the changes in phytoplankton bloom timing.
Early sea-ice retreat resulted in a higher copepod production, which was dominated by small copepods and young stages of large copepods; however, this increased copepod productivity did not efficiently reach the higher trophic levels owing to decreased food availability and quality. Based on the pacification index of the copepod community, pacification will further decrease copepod production. Therefore, our findings demonstrated that the zooplankton community and production was highly sensitive to environmental changes (warm temperatures and food abundance) associated with early sea-ice retreat, which adversely affects the higher trophic levels in the northern Bering Sea.
Data Availability Statement
The raw data supporting the conclusions of this article will be made available by the authors, without undue reservation.
Author Contributions
KM and AY designed the study and wrote the manuscript with contributions from all authors. FK and YA performed the research. FK and KM analyzed the data. All authors contributed to the article and approved the submitted version.
Funding
This work was funded by the Arctic Challenge for Sustainability (ArCS) (Program Grant Number JPMXD1300000000) and Arctic Challenge for Sustainability II (ArCS II) (Program Grant Number JPMXD1420318865) project. Funding was also provided by the Environment Research and Technology Development Fund (JPMEERF20214002) of the Environmental Restoration and Conservation Agency of Japan. Additionally, this work was partly supported by the Japan Society for the Promotion of Science (JSPS) KAKENHI Grant Numbers JP21H02263 (B), JP20K20573 (Pioneering), JP20H03054 (B), JP20J20410 (B), JP19H03037 (B), JP18K14506 (Early Career Scientists), and JP17H01483 (A).
Conflict of Interest
The authors declare that the research was conducted in the absence of any commercial or financial relationships that could be construed as a potential conflict of interest.
Publisher’s Note
All claims expressed in this article are solely those of the authors and do not necessarily represent those of their affiliated organizations, or those of the publisher, the editors and the reviewers. Any product that may be evaluated in this article, or claim that may be made by its manufacturer, is not guaranteed or endorsed by the publisher.
Acknowledgments
We thank the captain, officers, crew, and researchers on board the T/S Oshoro-Maru (Hokkaido University) for their crucial contributions during the field sampling. The ADS dataset is archived and was provided by the Arctic Data archive System (ADS), which was developed by the National Institute of Polar Research.
Supplementary Material
The Supplementary Material for this article can be found online at: https://www.frontiersin.org/articles/10.3389/fmars.2022.808910/full#supplementary-material
Footnotes
References
Basyuk, E., and Zuenko, Y. (2020). Extreme oceanographic conditions in the northwestern Bering Sea in 2017-2018. Deep Sea Res. II 181-182:104909.
Boveng, P. L., Ziel, H. L., McClintock, B. T., and Cameron, M. F. (2020). Body condition of phocid seals during a period of rapid environmental change in the Bering Sea and Aleutian Islands, Alaska. Deep Sea Res. II 181-182:104904. doi: 10.1016/j.dsr2.2020.104904
Brodsky, K. A. (1967). Calanoida of the far Eastern Seas and Polar Basin of the USSR. Jerusalem: Israel Program Scientific Translation.
Campbell, R. G., Ashjian, C. J., Sherr, E. B., Sherr, B. F., Lomas, M. W., Ross, C., et al. (2016). Mesozooplankton grazing during spring sea-ice conditions in the eastern Bering Sea. Deep Sea Res. II 134, 157–172.
Coachman, L. K., Aagaard, K., and Tripp, R. B. (1975). Bering Strait: The Regional Physical Oceanography. Washington, DC: University of Washington Press, Seattle, 172.
Corkett, I. J., McLaren, I. A., and Sevigny, J.-M. (1986). The rearing of the marine calanoid copepods Calanus finmarchcus (Gunnerus), C. glacialis Jaschnov and C.hyperboreus Kroyer with comment on the equiproportional rule. Syllogeus 58, 539–546.
Cornwall, W. (2019). Vanishing Bering Sea ice poses climate puzzle. Science 364, 616–617. doi: 10.1126/science.364.6441.616
Danielson, S. L., Ahkinga, O., Ashjian, C., Basyuk, E., Cooper, L. W., Eisner, L., et al. (2020). Manifestation and consequences of warming and altered heat fluxes over the Bering and Chukchi Sea continental shelves. Deep Sea Res. II 177:104781. doi: 10.1016/j.dsr2.2020.104781
Danielson, S. L., Eisner, L., Ladd, C., Mordy, C., Sousa, L., and Weingartner, T. J. (2017). A comparison between late summer 2012 and 2013 water masses, macronutrients, and phytoplankton standing crops in the northern Bering and Chukchi Seas. Deep Sea Res. II 135, 7–26.
Danielson, S., Eisner, L., Weingartner, T., and Aagaard, K. (2011). Thermal and haline variability over the central Bering Sea shelf: seasonal and interannual perspectives. Continent. Shelf Res. 31, 539–554. doi: 10.1016/j.csr.2010.12.010
Dragoo, D. E., Renner, H. M., and Kaler, R. S. A. (2019). Breeding Status and Population Trends of Seabirds in Alaska, 2018. U.S. Fish and Wildlife Service Report AMNWR 2019/03. Homer, AK: US Fish & Wildlife Department Services.
Duffy-Anderson, J. T., Stabeno, P., Andrews, A. G. III, Cieciel, K., Deary, A., Farley, E., et al. (2019). Responses of the northern Bering Sea and southeastern Bering Sea pelagic ecosystems following record-breaking low winter sea ice. Geophy. Res. Lett. 46, 9833–9842.
Dufréne, M., and Legendre, P. (1997). Species assemblages and indicator species: the need for a flexible asymmetrical approach. Ecol. Monogr. 67, 345–366.
Eisner, L., Hillgruber, N., Martinson, E., and Maselko, J. (2013). Pelagic fish and zooplankton species assemblages in relation to water mass characteristics in the northern Bering and Southeast Chukchi seas. Polar Biol. 36, 87–113.
Ershova, E. A., Hopcroft, R. R., Kosobokova, K. N., Matsuno, K., Nelson, R. J., Yamaguchi, A., et al. (2015). Long-term changes in summer zooplankton communities of the western Chukchi Sea, 1945-2012. Oceanography 28, 100–115. doi: 10.5670/oceanog.2015.60
Field, J. G., Clarke, K. R., and Warwick, R. M. (1982). A practical strategy for analyzing multispeacies distribution patterns. Mar. Ecol. Prog. Ser. 8, 37–52.
Frey, K. E., Comiso, J. C., Cooper, L. W., Grebmeier, J. M., and Stock, L. V. (2018). Arctic Ocean Primary Productivity: The Response of Marine Algae to Climate Warming and Sea Ice Decline. In: Arctic Report Card. Arctic Region 2018. Available online at: https://www.arctic.noaa.gov/Report-Card/Report-Card-2018/ArtMID/7878/ArticleID/778/Arctic-Ocean-Primary-Productivity-The-Response-of-Marine-Algae-to-Climate-Warming-and-Sea-Ice-Decline (accessed June 2, 2021).
Frost, B. W. (1974). Calanus marshallae, a new species of calanoid copepod closely allied to the sibling species C. finmarchicus and C. glacialis. Mar. Biol. 26, 77–99.
Fukai, Y., Abe, Y., Matsuno, K., and Yamaguchi, A. (2020). Spatial changes in the summer diatom community of the northern Bering Sea in 2017 and 2018. Deep Sea Res. II 18:104903.
Fukai, Y., Fukai, Y., Matsuno, K., Fujiwara, A., and Yamaguchi, A. (2019). The community composition of diatom resting stages in sediments of the northern Bering Sea in 2017 and 2018: the relationship to the interannual changes in the extent of the sea ice. Polar Biol. 42, 1915–1922.
Gnaiger, E. (1983). “Calculation of energetic and biochemical equivalents of respiratory oxygen consumption,” in Polarogranic Oxygen Sensors, eds E. Gnaiger and H. Forstner (Berlin: Springer), 337–345. doi: 10.1007/978-3-642-81863-9_30
Grebmeier, J. M., Bluhm, B. A., Cooper, L. W., Danielson, S. L., Arrigo, K. R., Blanchard, A. L., et al. (2015). Ecosystem characteristics and processes facilitating persistent macrobenthic biomass hotspots and associated benthivory in the Pacific Arctic. Prog. Oceanogr. 136, 92–114.
Grebmeier, J. M., Cooper, L. W., Feder, H. M., and Sirenko, B. I. (2006). Ecosystem dynamics of the Pacific-influenced Northern Bering and Chukchi Seas in the Amerasian Arctic. Prog. Oceanogr. 71, 331–361. doi: 10.1016/j.pocean.2006.10.001
Heintz, R. A., Siddon, E. C., Farley E. V. Jr., and Napp, J. M. (2013). Correlation between recruitment and fall condition of age-0 pollock (Theragra chalcogramma) from the eastern Bering Sea under varying climate conditions. Deep. Sea. Res. II 94, 150–156. doi: 10.1016/j.dsr2.2013.04.006
Hopcroft, R. R., Kosobokova, K. N., and Pinchuk, A. I. (2010). Zooplankton community patterns in the Chukchi sea during summer 2004. Deep Sea Res. II 57, 27–39.
Huntington, H. P., Danielson, S. L., Wiese, F. K., Baker, M., Boveng, P., Citta, J. J., et al. (2020). Evidence suggests potential transformation of the Pacific Arctic ecosystem is underway. Nat. Clim. Change 10, 342–348. doi: 10.1038/s41558-020-0695-2
Ikeda, T., and Motoda, S. (1978). Estimated zooplankton production and their ammonia excretion in the Kuroshio and adjacent seas. Fish. Bull. 76, 357–367.
Ikeda, T., Kanno, Y., Ozaki, K., and Shinada, A. (2001). Metabolic rates of epipelagic marine copepods as a function of body mass and temperature. Mar. Biol. 139, 587–596.
Jones, T., Divine, L. M., Renner, H., Knowles, S., Lefebvre, K. A., Burgess, H. K., et al. (2019). Unusual mortality of tufted puffins (Fratercula cirrhata) in the eastern Bering Sea. PLoS One 14:e0216532. doi: 10.1371/journal.pone.0216532
Jones, T., Parrish, J. K., Peterson, W. T., Bjorkstedt, E. P., Bond, N. A., Ballance, L. T., et al. (2018). Massive mortality of a planktivorous seabird in response to a marine heatwave. Geophys. Res. Lett. 45, 3193–3202. doi: 10.1002/2017GL076164
Kawaguchi, Y., Nishioka, J., Nishino, S., Fujio, S., Lee, K., Fujiwara, A., et al. (2020). Cold water upwelling near the Anadyr Strait: observations and simulations. J. Geophys. Res. 125:e2020JC016238.
Kikuchi, G., Abe, H., Hirawake, T., and Sampei, M. (2020). Distinctive spring phytoplankton bloom in the Bering Strait in 2018: a year of historically minimum sea ice extent. Deep Sea Res. II 181-182:104905. doi: 10.1016/j.dsr2.2020.104905
Kimura, F., Abe, Y., Matsuno, K., Hopcroft, R. R., and Yamaguchi, A. (2020). Seasonal changes in the zooplankton community and population structure in the northern Bering Sea from June to September, 2017. Deep Sea Res. II 181-182:104901.
Kiørboe, T. (2013). Zooplankton body composition. Limnol. Oceanogr. 58, 1843–1850. doi: 10.4319/lo.2013.58.5.1843
Kuletz, K. J., Ferguson, M. C., Hurley, B., Gall, A. E., Labunski, E. A., and Morgan, T. C. (2015). Seasonal spatial patterns in seabird and marine mammal distribution in the eastern Chukchi and western Beaufort seas: identifying biologically important pelagic areas. Prog. Oceanogr. 136, 175–200. doi: 10.1016/j.pocean.2015.05.012
Maekakuchi, M., Matsuno, K., Yamamoto, J., Abe, Y., and Yamaguchi, A. (2020). Abundance, horizontal and vertical distribution of epipelagic ctenophores and scyphomedusae in the northern Bering Sea in summer 2017 and 2018: quantification by underwater video imaging analysis. Deep Sea Res. II 181:104818.
Marin, V. (1987). The oceanographic structure of eastern Scotia Sea-IV. Distribution of copepod species in relation to hydrography in 1981. Deep Sea Res. 34A, 105–121.
Matsuno, K., Yamaguchi, A., Hirawake, T., and Imai, I. (2011). Year-to-year changes of the mesozooplankton community in the Chukchi Sea during summers of 1991, 1992 and 2007, 2008. Polar Biol. 34, 1349–1360. doi: 10.1007/s00300-011-0988-z
Nishizawa, B., Yamada, N., Hayashi, H., Wright, C., Kuletz, K., Ueno, H., et al. (2020). Timing of spring sea-ice retreat and summer seabird-prey associations in the northern Bering Sea. Deep Sea Res. II 181-182:104849.
O’Brien, W. J. (1979). The predator-prey interaction of planktivorous fish and zooplankton: recent research with planktivorous fish and their zooplankton prey shows the evolutionary thrust and parry of the predator-prey relationship. Am. Sci. 67, 572–581.
Ozaki, K., and Minoda, T. (1996). On the occurrence of oceanic copepods in the northeastern Bering Sea Shelf during the summer. Bull. Plankton Soc. Jpn. 43, 107–120.
Padmavati, G., and Ikeda, T. (2002). Development of Metridia pacifica (Crustacea: Copepoda) reared at different temperatures in the laboratory. Plankton Biol. Ecol. 49, 93–96.
Padmavati, G., Ikeda, T., and Yamaguchi, A. (2004). Life cycle, population structure and vertical distribution of Metridia spp. (Copepoda: Calanoida) in the Oyashio region (NW Pacific Ocean). Mar. Ecol. Prog. Ser. 270, 181–198.
Pinchuk, A. I., and Eisner, L. B. (2017). Spatial heterogeneity in zooplankton summer distribution in the eastern Chukchi Sea in 2012–2013 as a result of large-scale interactions of water masses. Deep Sea Res. II 135, 27–39.
Polyakov, I. V., Alkire, M. B., Bluhm, B. A., Brown, K. A., Carmack, E. C., Chierici, M., et al. (2020). Borealization of the Arctic Ocean in response to anomalous advection from sub-Arctic seas. Front. Mar. Sci. 7:491. doi: 10.3389/fmars.2021.667007
Shanks, A. (2001). An identification Guide to the Larval Marine Invertebrates of the Pacific Northwest. Corvallis, OR: Oregon State University Press.
Shoden, S., Ikeda, T., and Yamaguchi, A. (2005). Vertical distribution, population structure and lifecycle of Eucalanus bungii (Copepoda: Calanoida) in the Oyashio region, with notes on its regional variations. Mar. Biol. 146, 497–511.
Søreide, J. E., Leu, E., Berge, J., Graeve, M., and Falk-Petersen, S. (2010). Timing of blooms, algal food quality and Calanus glacialis reproduction and growth in a changing Arctic. Glob. Change Biol. 16, 3154–3163.
Springer, A. M., and McRoy, C. P. (1993). The paradox of pelagic food webs in the northern Bering Sea III. Patterns of primary production. Continent. Shelf Res. 13, 575–599.
Springer, A. M., McRoy, C. P., and Flint, M. V. (1996). The Bering Sea Green Belt: shelf-edge processes and ecosystem production. Fish. Oceanogr. 5, 205–223.
Springer, A. M., McRoy, C. P., and Turco, K. R. (1989). The paradox of pelagic food webs in the northern Bering Sea-II. Zooplankton communities. Continent. Shelf Res. 9, 359–386.
Stabeno, P. J., and Bell, S. W. (2019). Extreme Conditions in the Bering Sea (2017–2018): record-breaking low sea-ice extent. Geophys. Res. Lett. 46, 8952–8959.
Stabeno, P. J., Bell, S. W., Bond, N. A., Kimmel, D. G., Mordy, C. W., and Sullivan, M. E. (2019). Distributed biological observatory region 1: physics, chemistry and plankton in the northern Bering Sea. Deep Sea Res. II 162, 8–21.
Stevenson, D. E., and Lauth, R. R. (2019). Bottom trawl surveys in the northern Bering Sea indicate recent shifts in the distribution of marine species. Polar Biol. 42, 407–421. doi: 10.1007/s00300-018-2431-1
Ueno, H., Komatsu, M., Ji, Z., Dobashi, R., Muramatsu, M., Abe, H., et al. (2020). Stratification in the northern Bering Sea in early summer of 2017 and 2018. Deep Sea Res. II 18:104820.
Yamaguchi, A., Kimura, F., Fukai, Y., Abe, Y., Matsuno, K., Ooki, A., et al. (2021). Between-year comparison of interactions between environmental parameters and various plankton stocks in the northern Bering Sea during the summers of 2017 and 2018. Polar Sci. 27:100555. doi: 10.1016/j.polar.2020.100555
Keywords: community structure, population structure, phytoplankton bloom timing, reproduction, copepod production, pacification
Citation: Kimura F, Matsuno K, Abe Y and Yamaguchi A (2022) Effects of Early Sea-Ice Reduction on Zooplankton and Copepod Population Structure in the Northern Bering Sea During the Summers of 2017 and 2018. Front. Mar. Sci. 9:808910. doi: 10.3389/fmars.2022.808910
Received: 04 November 2021; Accepted: 20 January 2022;
Published: 22 February 2022.
Edited by:
Daniel J. Mayor, National Oceanography Centre, United KingdomReviewed by:
Terry Whitledge, Retired, Fairbanks, AK, United StatesVladimir G. Dvoretsky, Murmansk Marine Biological Institute, Russia
Agata Weydmann-Zwolicka, University of Gdańsk, Poland
Copyright © 2022 Kimura, Matsuno, Abe and Yamaguchi. This is an open-access article distributed under the terms of the Creative Commons Attribution License (CC BY). The use, distribution or reproduction in other forums is permitted, provided the original author(s) and the copyright owner(s) are credited and that the original publication in this journal is cited, in accordance with accepted academic practice. No use, distribution or reproduction is permitted which does not comply with these terms.
*Correspondence: Kohei Matsuno, ay5tYXRzdW5vQGZpc2guaG9rdWRhaS5hYy5qcA==
 Fumihiko Kimura1
 Kohei Matsuno
 Atsushi Yamaguchi