
94% of researchers rate our articles as excellent or good
Learn more about the work of our research integrity team to safeguard the quality of each article we publish.
Find out more
ORIGINAL RESEARCH article
Front. Mar. Sci., 11 February 2022
Sec. Marine Fisheries, Aquaculture and Living Resources
Volume 9 - 2022 | https://doi.org/10.3389/fmars.2022.808282
 Hao Tian1
 Yang Liu1,2*
 Yongjun Tian1,2
 Irene D. Alabia3
 Yuanzhe Qin1He Sun1Jianchao Li1,2
 Shuyang Ma1,2
 Sei-Ichi Saitoh3
Monitoring the dynamics of ocean-going fishing vessels is essential for fisheries stock assessment and management. In this paper, coupled fishery and remote sensing methods were applied to propose a satellite-based fishery resource monitoring and assessment system (SFRMAS) that supported chub mackerel (Scomber japonicus), Pacific saury (Cololabis saira) and neon flying squid (Ommastrephes bartramii) fishing activities in the northwest Pacific. A multispecies fishing vessel database was generated in the SFRMAS using visible infrared imaging radiometer suite day/night band (VIIRS/DNB) images, automatic identification system (AIS) data and multimarine remote sensing resources. The results showed that the VIIRS/DNB vessel detection (VVD) and AIS vessel detection approaches improved the extraction accuracy of multispecies fishing vessels. A high productivity area with a higher chlorophyll a concentration had the most concentrated distribution of mackerel vessels. The widest longitudinal migrations of the neon flying squid and the latitudinal ranges of Pacific saury were highly related to sea surface temperature (SST), which was well captured by the movement of the fishing vessels. In the SFRMAS, the accuracy of detected multispecies fishing days and fishing catches was mostly between 60 and 90%, which can provide data support for fisheries stock assessment and management.
The northwest Pacific Ocean is one of the most productive fishing grounds in the world due to its unique geographical conditions and oceanographic properties (Yasuda, 2003). According to statistics from the Food and Agriculture Organization (FAO) of the United Nations, catch from the northwest Pacific has reached 20 million tons, accounting for 25% of the total marine fish production of the world (FAO, 2019). Pelagic fish are the main component of fishery resources in the northwest Pacific, among which Pacific saury (Cololabis saira), neon flying squid (Ommastrephes bartramii), and chub mackerel (Scomber japonicus) are the major commercial species considered by the North Pacific Fisheries Commission (NPFC) (NPFC, 2019b). Currently, these fishery resources are being exploited by China, Japan, Korea, Russia, Chinese Taipei and Vanuatu. Most fishing vessels attract and concentrate these species with strong lights at night (Oozeki et al., 2018). Fish have specific habitat requirements at different life history stages, so environmental changes in the northwest Pacific may affect the growth and spatiotemporal distribution of pelagic species and thus further affect the location of fishing grounds (Mugo et al., 2014; Chang et al., 2019; Wang et al., 2021). To achieve the long-term sustainability of fisheries resources, a series of active conservation and management measures have been put into practice in recent years (NPFC, 2019a,2021a,b), and several studies have carried out fishing ground forecasts and fishery resource assessments of these commercial species (Syah et al., 2016; Yu et al., 2016; NPFC, 2019b).
Establishment of a multispecies fishing vessel database is particularly important and can provide accurate data for the construction of predictive models. With the continuous development of satellite technology in the past 30 years (Croft, 1978; Small and Elvidge, 2011; Miller et al., 2013), various communication satellite data (such as the automatic identification system, AIS) and observation satellite data (such as the Visible Infrared Imaging Radiometer Suite Day/Night Band, VIIRS/DNB) have been widely used in monitoring ocean-going fishing vessels and have supplemented insufficient fishery data (Elvidge et al., 2015, 2018; Kroodsma et al., 2018). Combined with environmental remote sensing, these satellite-based fishing vessel data have been widely used to understand the relationship between fishery distributions and ocean characteristics (Alabia et al., 2016a; Chiu et al., 2017; Paulino et al., 2017; Kroodsma et al., 2018). However, these satellite data cannot effectively monitor multispecies fishing vessels, and the respective deficiencies of these data also limit relevant fishery studies. More importantly, a comprehensive system to monitor multispecies fishery dynamics and evaluate fishery resources that integrates VIIRS/DNB images, AIS data, fishing catch data and environmental data is still lacking.
VIIRS/DNB data have been increasingly utilized in various fishery studies since the launch of the Suomi National Polar Orbiting Partnership satellite in 2011. Its applications include detecting changes in the number and positions of fishing vessels, identifying illegal, unreported and unregulated fishing, tracking the operation status of saury fishing vessels, mapping fishing activities and suitable fishing grounds, and tracking fishing vessel distributions in combination with vessel monitoring system data (Liu et al., 2015; Straka et al., 2015; Cozzolino and Lasta, 2016; Syarifudin et al., 2017; Geronimo et al., 2018; Tian et al., 2018; Hsu et al., 2019; Saito et al., 2019). Threshold segmentation and DNB local maximum extraction are key steps of the VIIRS/DNB boat detection (VBD) algorithm developed by Elvidge et al. (2015) to extract offshore night light fishing boats. However, ocean-going fishing vessels with different gear types have different radiation characteristics. Compared to offshore boats, these ocean-going fishing vessels are larger and brighter (Cozzolino and Lasta, 2016). Therefore, in the detection of species-specific ocean-going fishing vessels, it is necessary to determine the detection thresholds and ranges of local maxima according to their radiance characteristics in the VIIRS/DNB images. To date, a suitable VIIRS/DNB vessel detection (VVD) approach for distinguishing multispecies fishing vessels operating in the northwest Pacific has not yet been developed.
The automatic identification system (AIS) was originally designed for communications and to prevent marine vessel collisions by transmitting signals, including the identity, gear type, instantaneous speed, and location information of each vessel, as often as every few seconds (De Souza et al., 2016; Kroodsma et al., 2018). AIS data are not affected by weather, as opposed to VIIRS/DNB images, and by matching the signals transmitted in the AIS data with official fleet registries, fishing vessels and their AIS positions can be identified using the AIS vessel detection (AVD) approach to indicate fishing activity. In recent years, the increased use of satellite-based AIS fishing vessel positions has also allowed great progress in detecting the patterns and activities of ocean-going fishing vessels and managing fishery resources (Flothmann et al., 2010; Natale et al., 2015; Le Guyader et al., 2017; James et al., 2018). However, the AIS data have several obvious shortcomings, including incomplete coverage, errors in the maritime mobile service identity (MMSI), missing data, and deliberate suspension of signal transmissions (McCauley et al., 2016; Oozeki et al., 2018). In addition, to date, the target species information of fishing vessels registered in the NPFC has not been used to distinguish multiple AVDs in the northwest Pacific.
Our intention was to develop a comprehensive monitoring and assessment system for key fisheries resources in the northwest Pacific by combining multiple satellite remote sensing resources. Therefore, the objectives of this paper were (1) to develop suitable AVD and VVD approaches for distinguishing multispecies fishing vessels in the northwest Pacific, (2) to understand the relationship between the spatiotemporal distribution of species-specific fishing vessels, species life histories and environmental changes, and (3) to provide support for multiple fisheries resource management based on the satellite-based fishery resource monitoring and assessment system (SFRMAS) proposed in this study.
The study focused on the fishing grounds of night light fishing vessels targeting chub mackerel, Pacific saury and neon flying squid in the northwest Pacific. The possible fishing area of chub mackerel is from 35–45°N to 140–160°E (Watanabe and Yatsu, 2006). The potential fishing areas of Pacific saury are between 36–50°N and 140–170°E (Tian et al., 2003). Neon flying squid is widely distributed in the Pacific and is mainly targeted by squid-jigging boats in two areas: 38–45°N, 144–170°E and 36–46°N, 170°E–160°W (Tian et al., 2009; Alabia et al., 2016b). Hence, the defined study area covered the waters between 35–50°N and 140°E–160°W, excluding the exclusive economic zones (EEZs) of Japan and Russia (Figure 1).
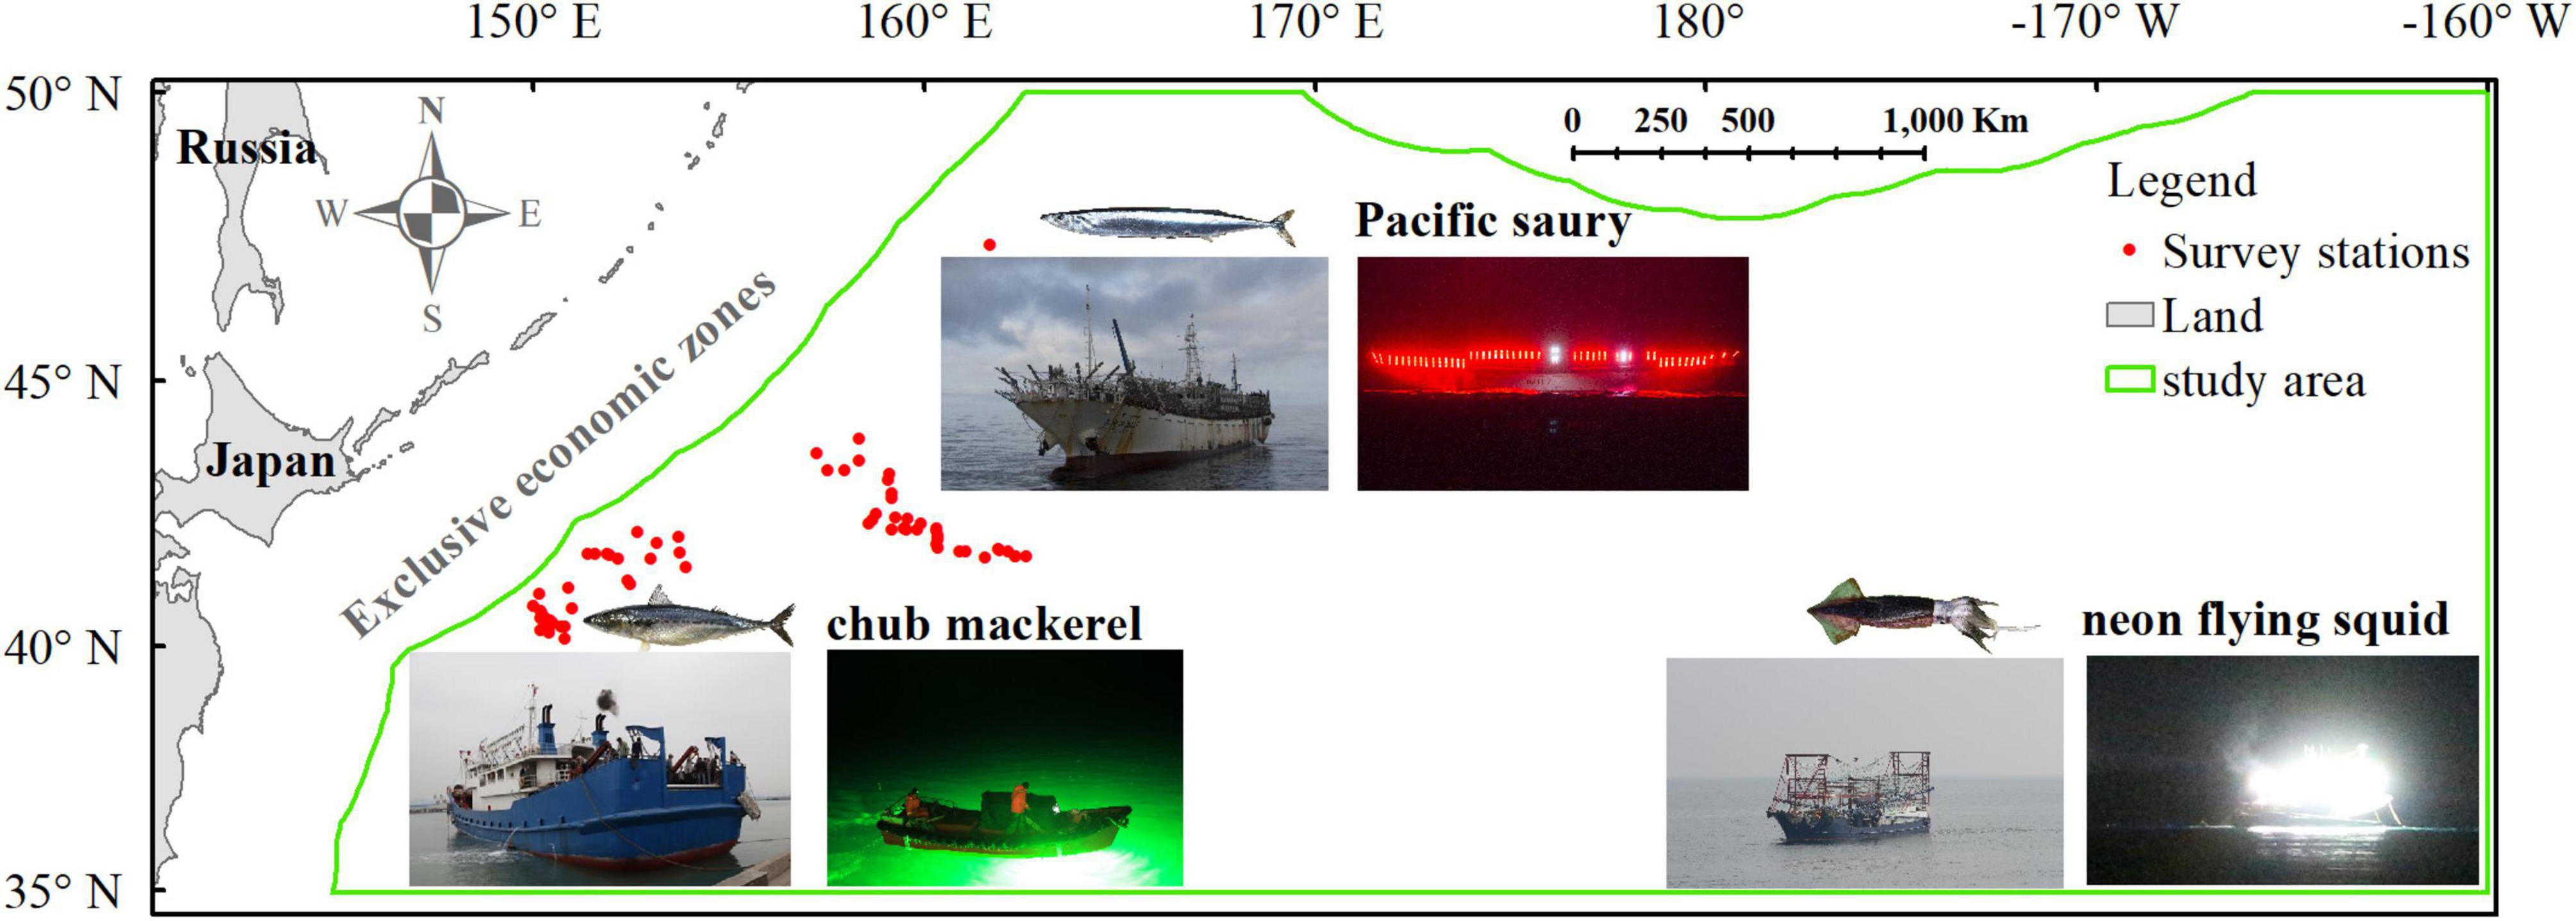
Figure 1. Map of the northwest Pacific Ocean showing the study area (outlined in green). Major pelagic fish (Pacific saury, neon flying squid, and chub mackerel) targeted by night light fishing vessels in the study area are overlain. The red points are the survey stations where radar images of lit saury fishing vessels were taken.
The approved vessel information from the NPFC1 was used to distinguish the multiple types of night light fishing vessels (Figure 1) in our study area. Night light fishing vessels in the study area were initially selected from the NPFC-approved vessel list. The missing MMSI information of fishing vessels was completed on a ship information inquiry website.2 In this study, information on vessel type, fishing gear, and target species was critical for classifying different fishing vessels. For example, stick-held dip nets and lift nets are the primary fishing gear used by most saury vessels, while mackerel vessels mainly use purse seines (NPFC, 2019b). Therefore, vessels without such information were excluded from analysis. Then, the remaining vessels were divided into mackerel, saury, and squid vessel lists according to their critical information.
Multispecies catch data harvested by night light fishing vessels in the study area between 2012 and 2018 were also derived from the NPFC,3 and the average catch per unit effort (CPUE) was calculated by dividing the total catch (metric ton) by fishing day and fishing vessel.
The AIS-based daily fishing effort dataset was obtained from the Global Fishing Watch online repository,4 which contains fishing effort information in fishing hours for each vessel, gridded at 0.1 degree.
VIIRS/DNB nighttime images were obtained from the National Oceanic and Atmospheric Administration Comprehensive Larger Array-Data Stewardship System,5 which are distributed in version 5 of the Hierarchal Data Format (Mills and Miller, 2016). The spectral range of the VIIRS/DNB waveband allows it to collect light from fishing vessels at night, and the spatial resolution of VIIRS/DNB images is 742 m (Cao et al., 2013; Elvidge et al., 2013). Daily VIIRS/DNB images covering our study area were downloaded between January and December 2018, totaling 1,200 granules.
Shipborne radar images were collected at half-hour intervals between 14:30 and 16:30 (Coordinated Universal Time) every night from August 16, 2018 to November 10, 2018, on a Chinese saury vessel: LU HUANG YUAN YU 116, whose MMSI is 412331055 (Figure 1). The radar image contained the following information: the vessel’s position, direction, speed, radar scanning radius, and other vessels detected by the radar. Vessel positions extracted from the radar image were used to verify the VVD.
Sea surface temperature (SST), sea surface chlorophyll a concentration (SSC) and sea surface height (SSH) were selected as the primary factors to analyze the marine environmental conditions affecting the monthly distribution of fishing vessels. Monthly SST data, at a spatial resolution of 0.05 and monthly SSC data at a spatial resolution of 0.04° were obtained from the NOAA Ocean Watch website.6 Monthly SSH data at a spatial resolution of 0.083° were obtained from the Copernicus Marine Service.7
The sea level anomaly (SLA), SSC, and SST variables were used to analyze the mesoscale oceanic eddies affecting the distribution of multispecies fishing vessels on September 18, 2018. These daily data, at a spatial resolution of 0.25°, were also obtained from the Copernicus Marine Service.
By merging the location information of species-specific fishing vessels from the VVD and AVD datasets, a comprehensive multispecies fishing vessel database was established in this study (Figure 2). The first step of the flowchart was to distinguish the daily multispecies AVD from the raw AIS fishing effort data. Daily fishing positions of mackerel, saury and squid vessels were selected based on the MMSI matched with the filtered multispecies NPFC lists. Only the location with the longest fishing time was selected to count the number of AVDs, and the results were stored in the AVD dataset as.shp files.
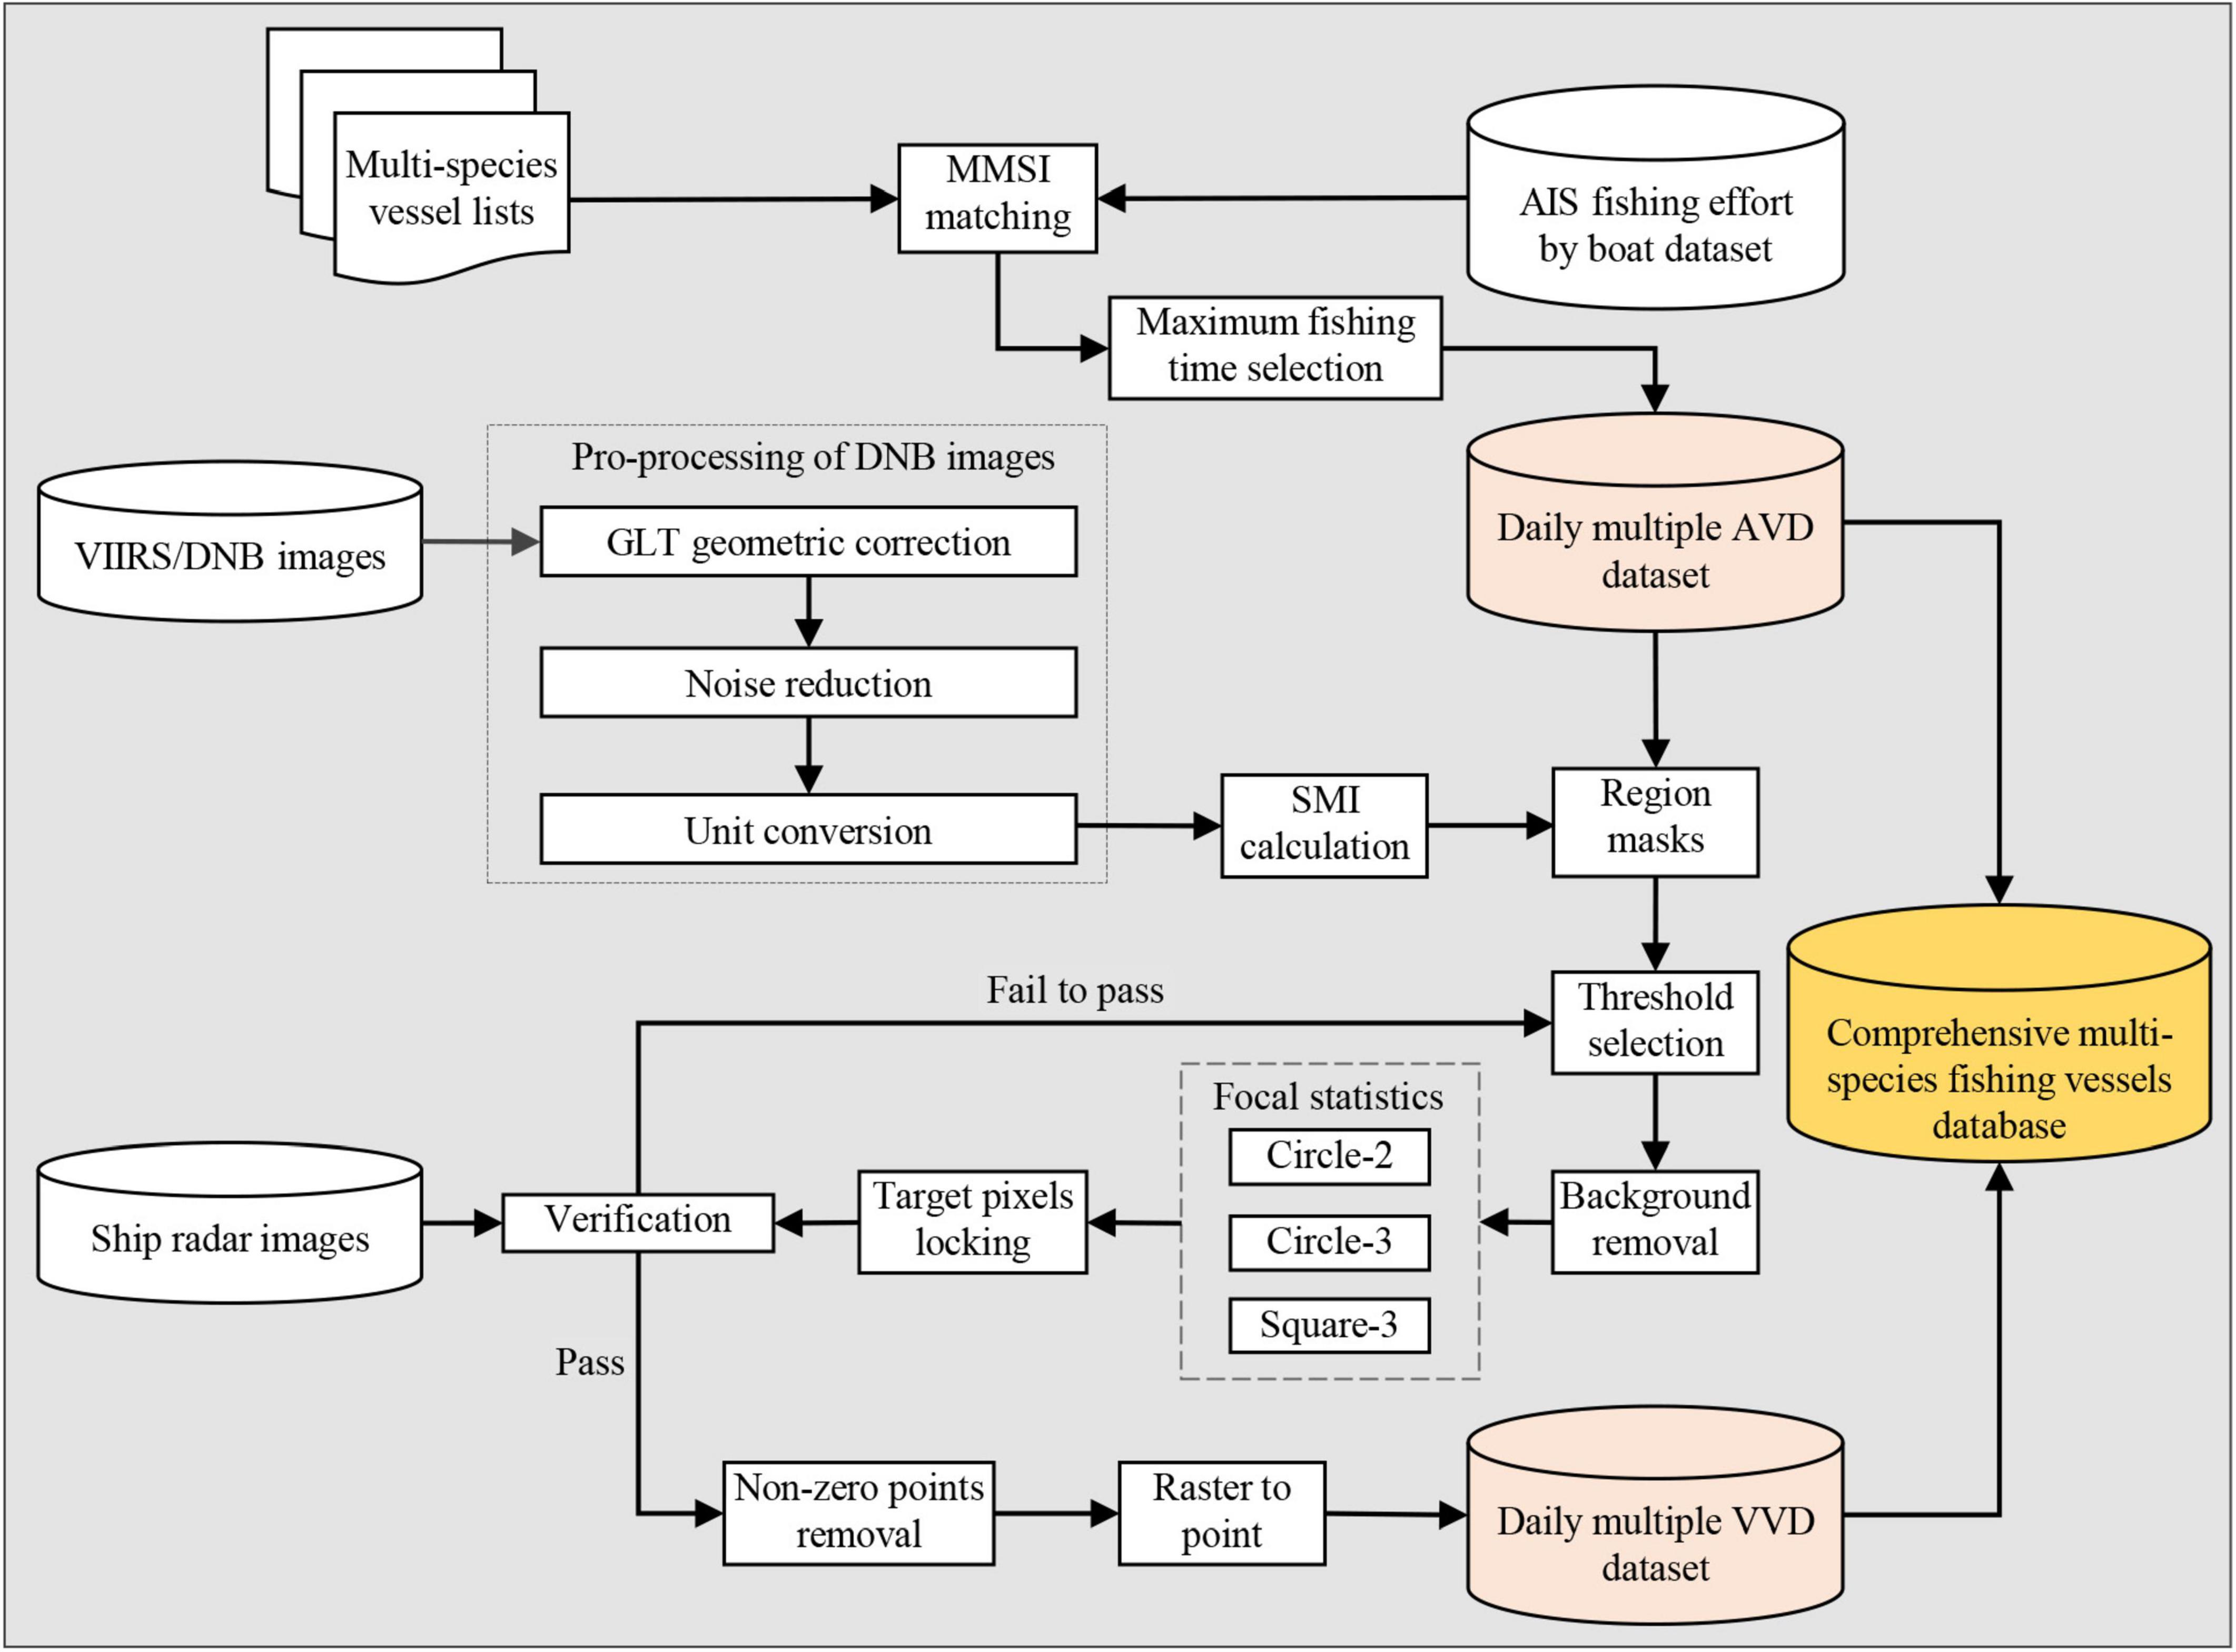
Figure 2. Diagram of species-specific fishing vessels distinguished using AVD and VVD approaches.
The improved VVD approach, which is suitable for species-specific fishing vessel identification in the northwest Pacific, is based on the offshore light fishing boat detection model proposed by Elvidge et al. (2015). Daily operating regions of species-specific fishing vessels in the VIIRS/DNB image were distinguished by matching the positions of these vessels extracted using the AVD approach (Supplementary Figures 1A–E), and the appropriate thresholds were chosen separately. By generating a sorted spike median index (SMI) scatterplot, initial thresholds to distinguish luminous pixels from surrounding dark background pixels can be determined based on the turning points (Supplementary Figures 1F–H). To determine the range of multiple VVDs, a statistics tool was used to calculate the largest SMI of pixels within a specified neighborhood. In the VVD approach, Circle-2 (a circle with a 2-pixel radius), Circle-3 (a circle with a 3-pixel radius) and Square-3 (a square with 3*3 pixels) were selected as neighborhood types. The three focal statistical ranges were performed on daily multispecies VVD data, and the most suitable range was employed by comparing the detection results. Ultimately, Circle-2 was employed in mackerel and saury VVD analyses. Circle-2 or Circle-3 were used in squid VVD analysis, depending on the spatial gaps between these vessels. Then, the values of all target pixels were locked at zero in the image before using focal statistics for comparison with the image obtained after using focal statistics (Supplementary Figures 2A–C). After verifying the detection results with radar images, background pixels with negative values were removed. Finally, the locked pixel was extracted and stored in the VVD dataset as a point.shp file.
Ultimately, to obtain the number of species-specific fishing vessels on a given day, the dataset with the highest record was selected. Taking into account the operating characteristics of ocean-going fishing vessels and the shortcomings of different satellites on the fluctuations of species-specific fishing vessel observations, the 3-day running mean of the highest vessel counts represented the number of comprehensive fishing vessel databases.
The spatiotemporal variations in fishing grounds of multispecies fishing vessels were mapped in ArcGIS ver. 10.7 software. The trajectories of fishing vessels indicated the movement patterns of target species. Therefore, the daily distribution centers of mackerel, saury, and squid fishing vessels were calculated using the following equations:
where and are the daily average coordinates of mackerel, saury, and squid fishing vessels in the meridional and zonal directions, respectively. xi is the coordinate of each vessel in the meridional plane, yi is the coordinate of each vessel in the zonal plane, and n is the number of these vessels in a given day.
Then, we used the “points to line” tool to connect the daily distribution center points of mackerel, saury, and squid fishing vessels into monthly track lines. Finally, “smooth line” tools were used to smooth the monthly track lines for each species-specific fishing fleet.
The VIIRS/DNB image from September 18, 2018, was selected as an example to demonstrate the extraction effect of multispecies fishing vessels (Figure 3). The masks used to distinguish multispecies VVDs were effectively defined based on the AVD results. Based on the turning points of the sorted SMI scatterplots, for this particular day, 1.00, 0.90, and 1.00 were the thresholds used for the mackerel, squid, and saury VVDs, respectively. Figures 3A1–D3 shows the extraction results of multispecies fishing vessels under different local statistical ranges. The red points in Figure 3F are vessels extracted from the radar image (Figure 3E) that are closest in time, and the verification results are shown in Figures 3C1–C3. The results showed that the Circle-2 VVD approach accurately extracted mackerel fishing vessels (Figure 3A1), squid fishing vessels (Figure 3B1), clump saury fishing vessels (Figure 3C1) and scattered saury fishing vessels (Figure 3D1).
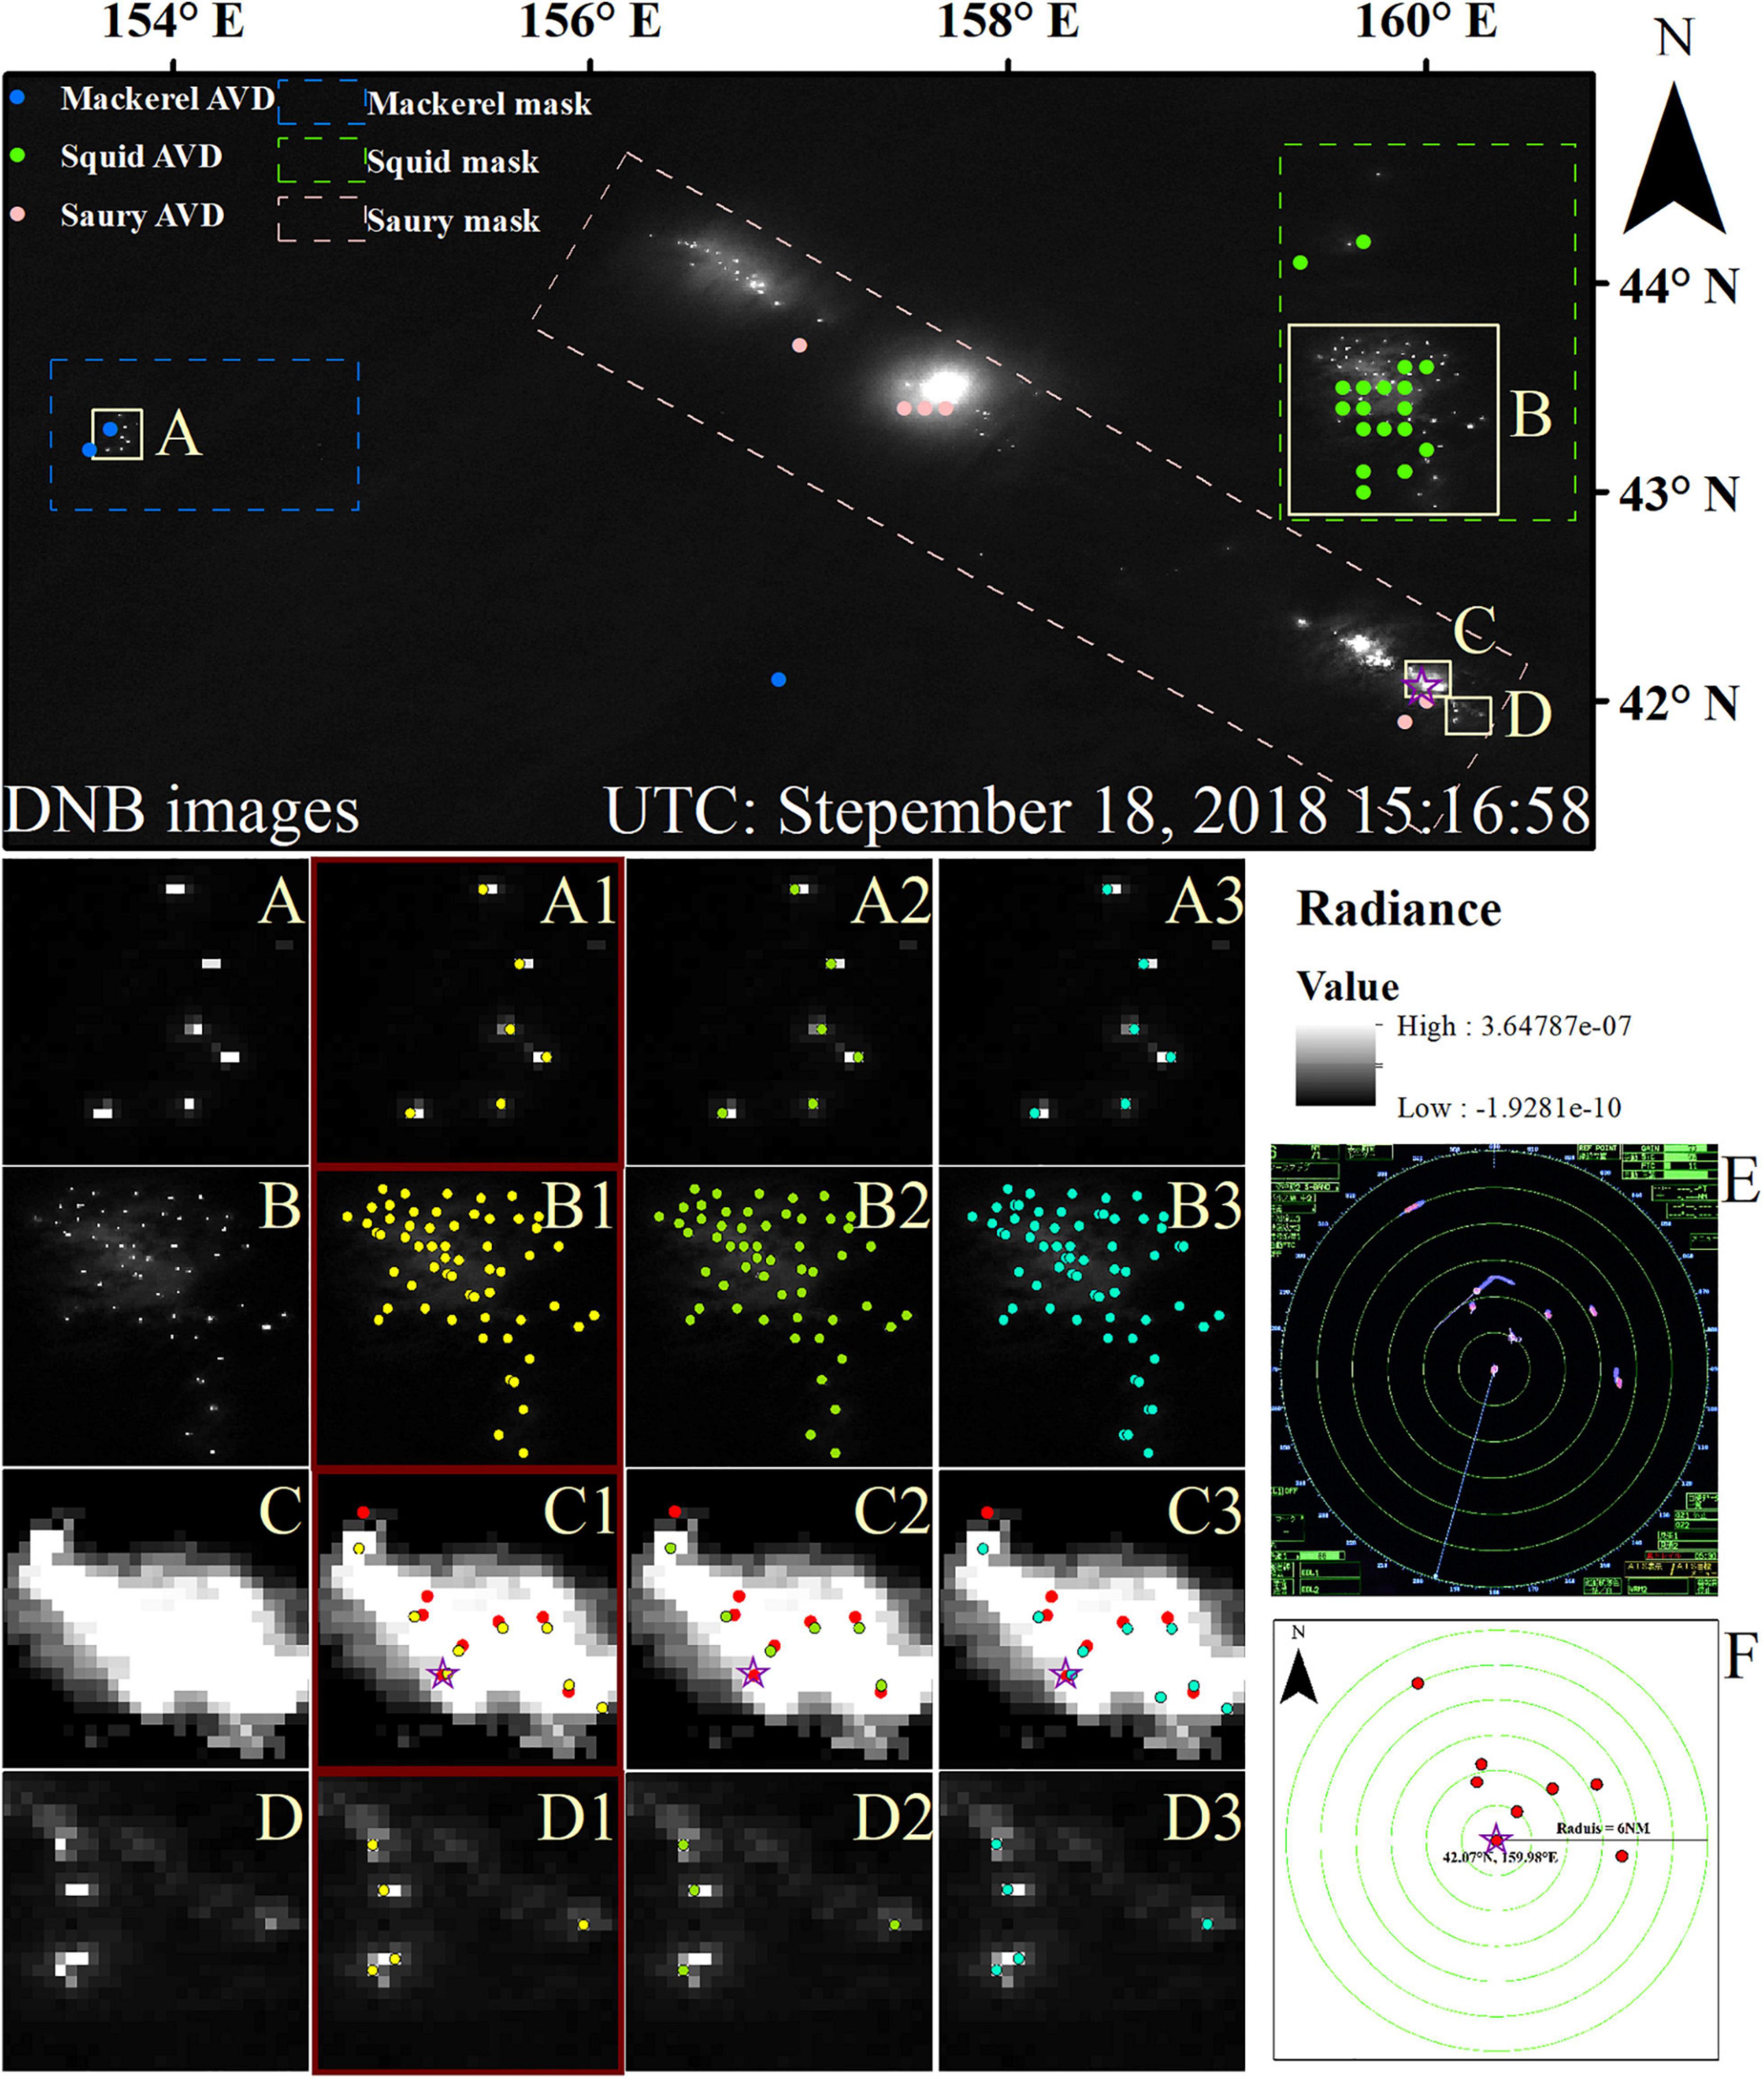
Figure 3. An example diagram of multispecies identification on September 18, 2018. According to the AVD positions, (A–D) are regions containing scattered mackerel vessels, scattered squid vessels, and clumped and scattered saury vessels, respectively. The yellow, green, and blue points in (A1–D3) are VVDs detected by Circle-2, Circle-3, and Square-3, respectively. (E) Shows the radar image taken at 15:15 on September 18, 2018, which is almost synchronized with the time of the VIIRS/DNB image. The red points in (C1–C3,F) are saury boats extracted from (E). In terms of the number of VVDs, (C1) has the closest match to the extraction result of the radar image. The purple pentagram represents the location of LU HUANG YUAN YU 116 when the radar image was taken. Due to the time difference between the VIIRS/DNB and radar images, it is acceptable that the positions of the fishing vessels do not completely coincide. UTC corresponds to the Coordinated Universal Time.
The fluctuations in the number of comprehensive multispecies fishing vessel databases in 2018 are shown in Figure 4. The number of species-specific fishing fleets detected using the VVD approach was larger than that via the AVD for most days in 2018. However, the number of VVD-based fishing vessels also fluctuated abruptly due to the influences of moon phases and weather conditions (Figures 4A–C). The comprehensive fishing vessel database overcame the respective shortcomings of the AVD and VVD and provided reliable monitoring information on multispecies fishing vessels (Figures 4D–F). The largest numbers of mackerel, squid, and saury vessels were 67, 89, and 161, respectively. The respective starting dates of fishing for mackerel, squid, and saury fishing vessels varied between March 9, May 5, and May 12. However, the end fishing dates of each fishery species targeted by night light fishing vessels were basically the same and were all around the end of November. The number of mackerel and squid fishing vessels gradually decreased after October and November, respectively. The number of saury fishing vessels decreased abruptly after November 18. Several key periods for multispecies fishing vessels detected from the comprehensive fishing vessel database are listed in Table 1. The fishing periods for the mackerel, squid and saury fishing fleets were March 9-November 27, May 12-December 7, and May 5-November 27, respectively. Periods with increased numbers of mackerel, squid, and saury fishing vessels were March 9 to July 20, May 12 to August 19, and May 5 to September 4, respectively. The fishing periods with the most (more than 2/3) mackerel, squid and saury fishing vessels were April 29 to October 8, June 7 to November 7, and August 14 to November 18, respectively.
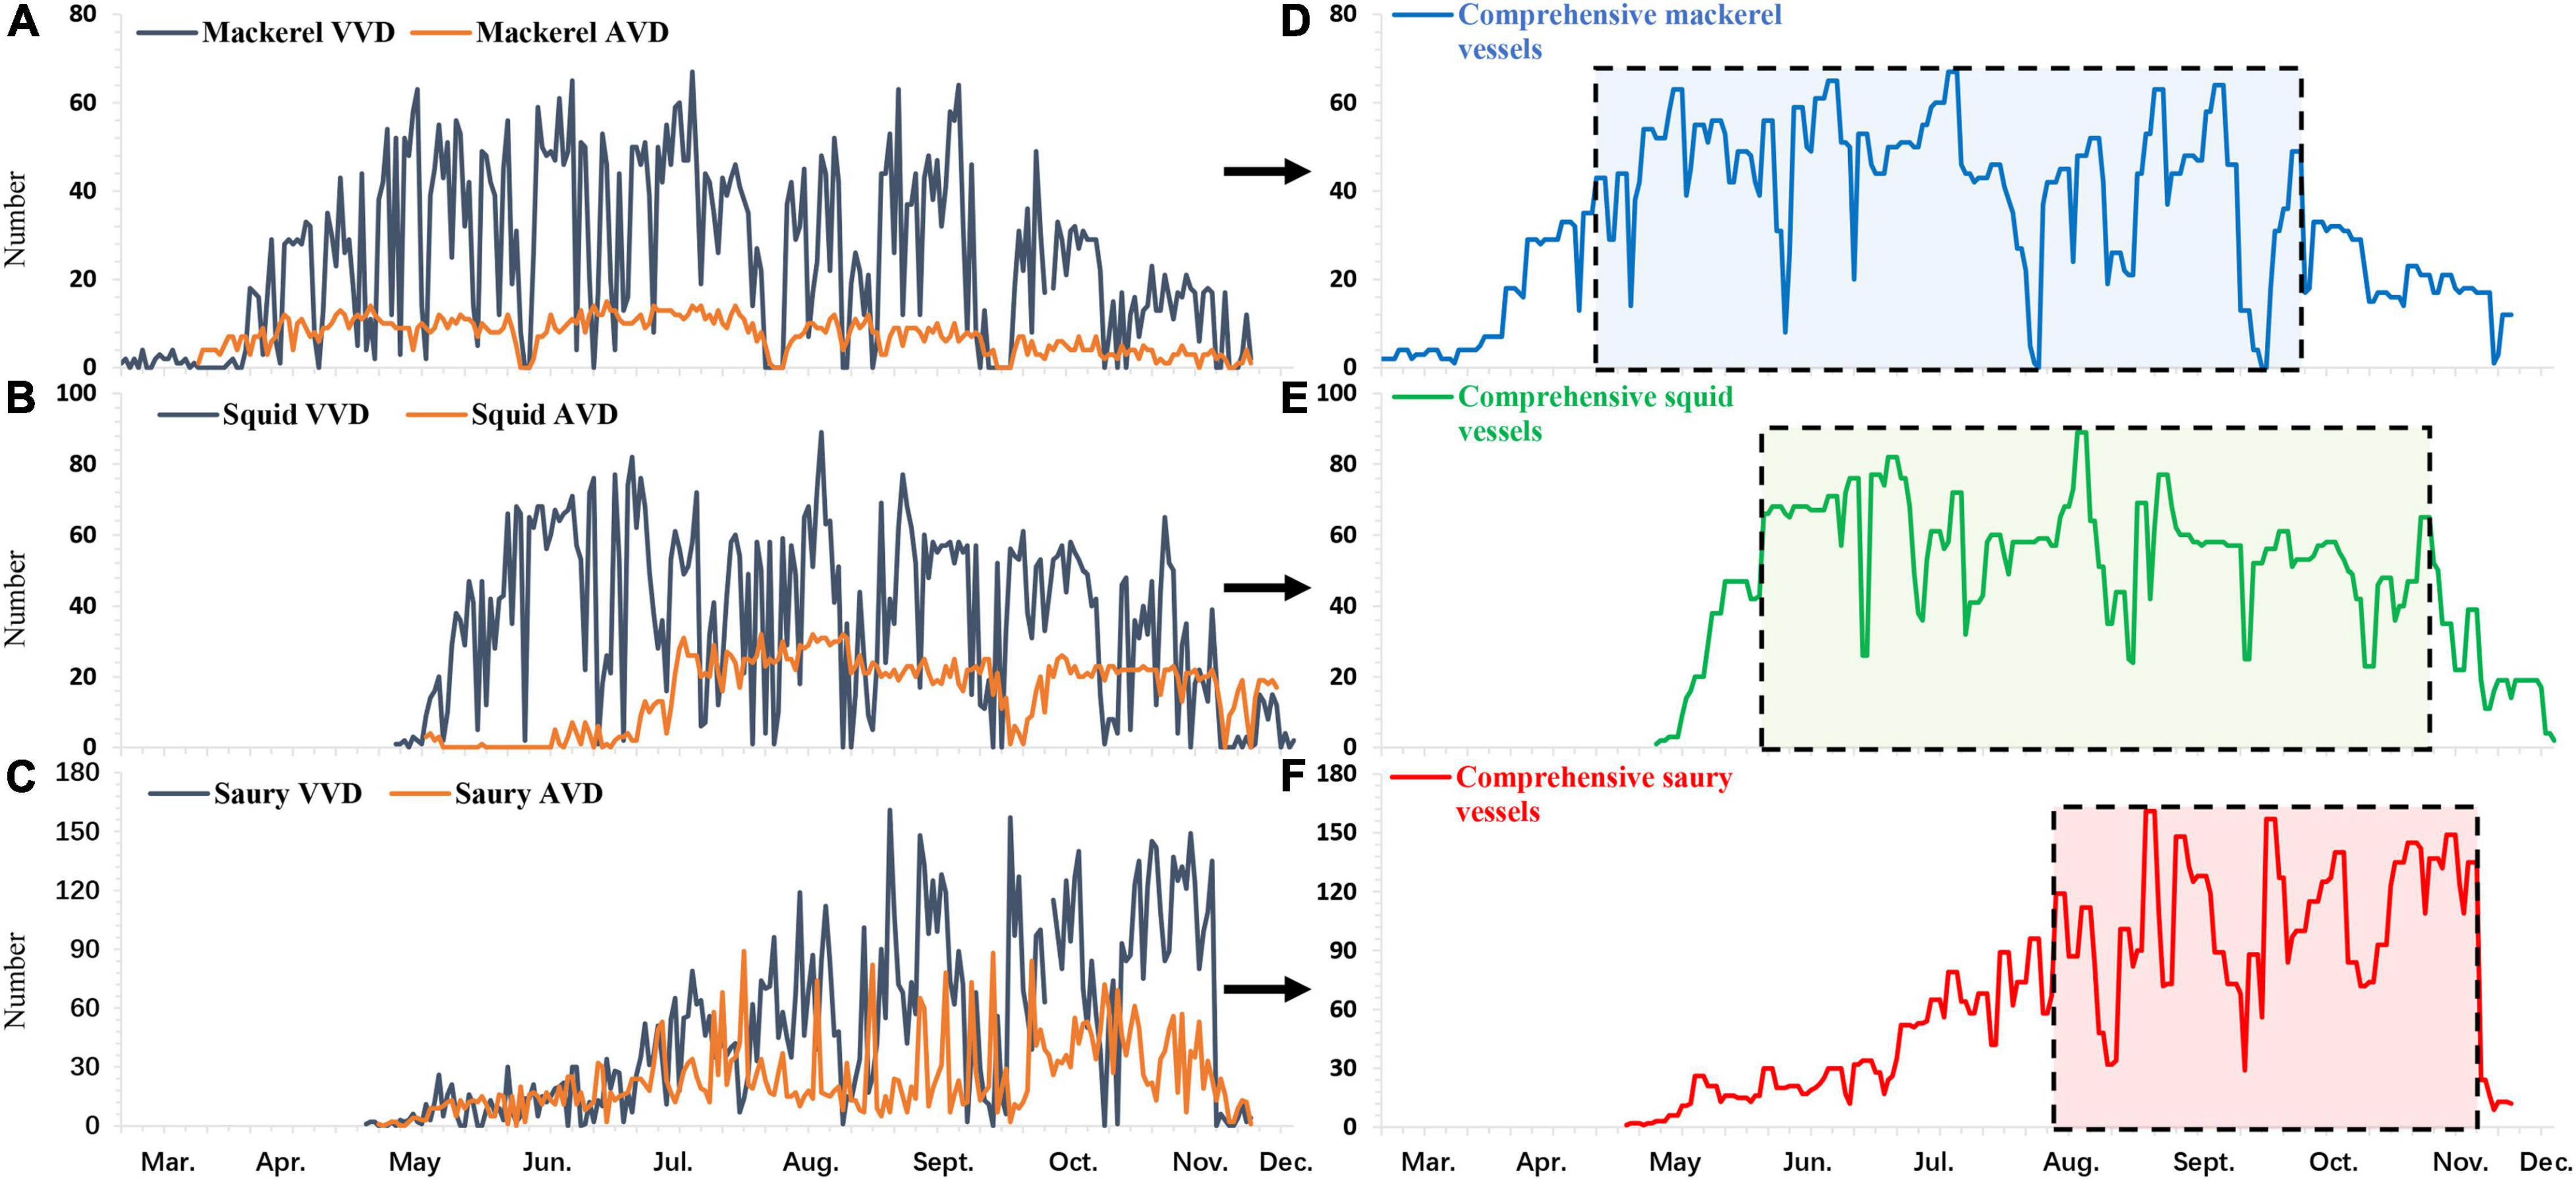
Figure 4. Daily number of (A) mackerel, (B) squid, and (C) saury fishing vessels detected by the AVD (orange lines) and VVD (dark blue lines) approaches. Three-day running means of the largest number of (D) mackerel, (E) squid, and (F) saury fishing vessel from the comprehensive fishing vessels database between March and December 2018. The black dotted lines in (D–F) indicate the fishing periods with the most (more than 2/3) fishing vessels.
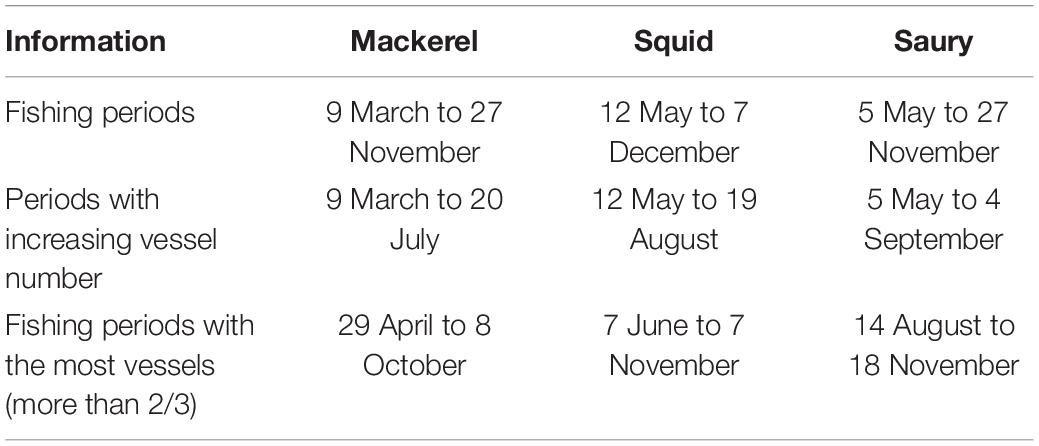
Table 1. Several key periods for multiple species in the comprehensive fishing vessel database.
The daily distribution centers and monthly trajectories of mackerel, saury and squid fishing vessels in 2018 are shown in Figure 5. From a year-long perspective, the distribution of mackerel vessels was the smallest and was concentrated within 146°–154°E and 38°–44°N. However, the daily distribution centers of saury vessels had the widest latitudinal range within 148°–165°E and 39°–49°N. The longitudinal distribution of squid vessels was the widest, spanning two fishing grounds: 177°E-172°W and 38°–44°N from May to early August and 154°–161°E and 39°–45°N from late July to November.

Figure 5. Daily distribution centers (color-coded dots) and monthly trajectories (color-coded lines) of mackerel, saury, and squid fishing vessels from March to December 2018.
The trajectories of mackerel vessels showed movements along the borders of the EEZs from southwest to northeast between March and September, and this pattern reversed in October (Figure 5B). The trajectories of saury fishing vessels showed that from May to July, they mainly moved northward near 160°E, and from August to November, these vessels moved southwest along the high-seas border of the EEZs. The trajectories of squid fishing vessels highlighted an east to west movement. From May to October, squid fishing vessels moved in a northwestward direction. However, these vessels moved southwestward along the boundaries of the EEZs after October.
Figure 6 shows that the SST in the study area gradually increased until it reached a maximum in August, and the water temperature gradually decreased after autumn. The spatiotemporal distributions of mackerel and squid vessels varied in the productive Kuroshio–Oyashio transition area, which was consistent with the SST fronts. However, compared to mackerel and squid vessels, saury vessels moved into colder subarctic waters from May to July. Figure 7 shows that the high SSC area was mainly distributed near the coasts and was the smallest in March. From April to August, a high SSC area was mainly distributed in the Kuroshio–Oyashio transition area and the Oyashio waters. After September, the SSC in the study area increased abruptly, particularly near the EEZs, where fishing vessels were concentrated. SSH data were also overlaid with the monthly distribution of species-specific fishing vessels (Figure 8). In 2018, the SSH changed very little in the study area, with the high SSH areas distributed south of 38°N. Correspondingly, almost all the multispecies fishing vessels were concentrated north of 38°N.
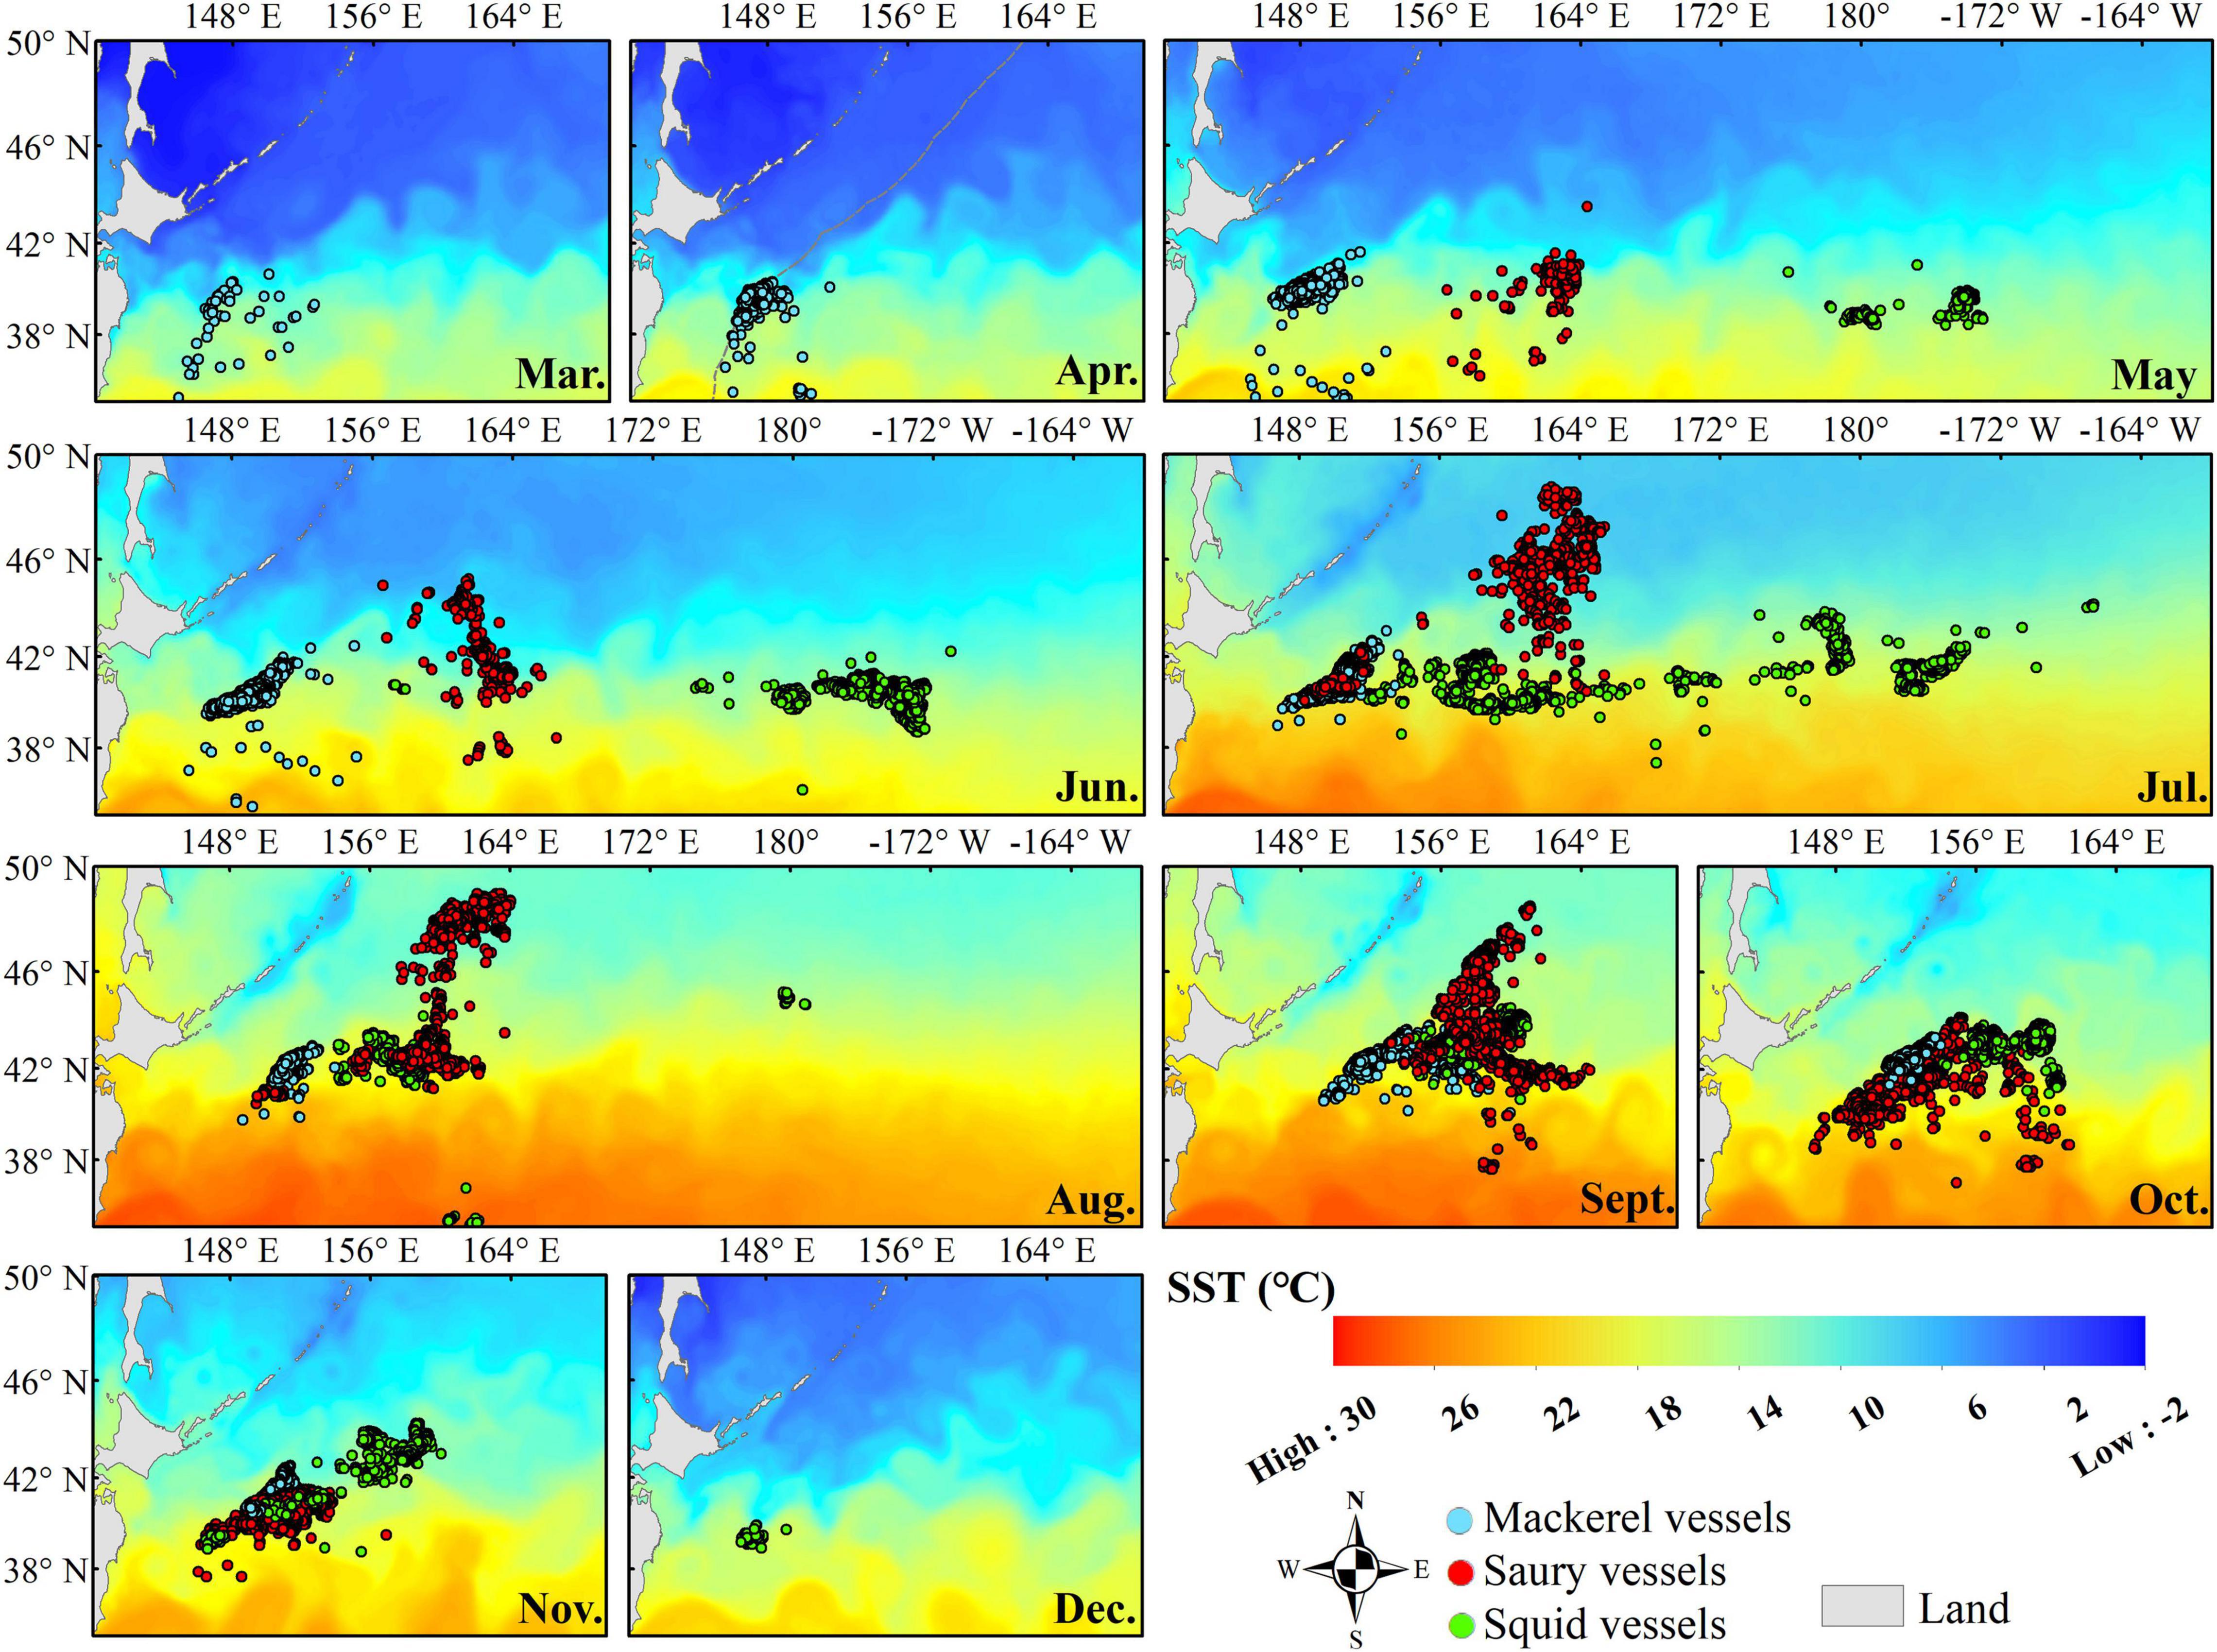
Figure 6. Monthly distributions of mackerel (blue dots), saury (red dots), and squid (green dots) fishing vessels that overlap with the SST in the northwest Pacific from March to December 2018.
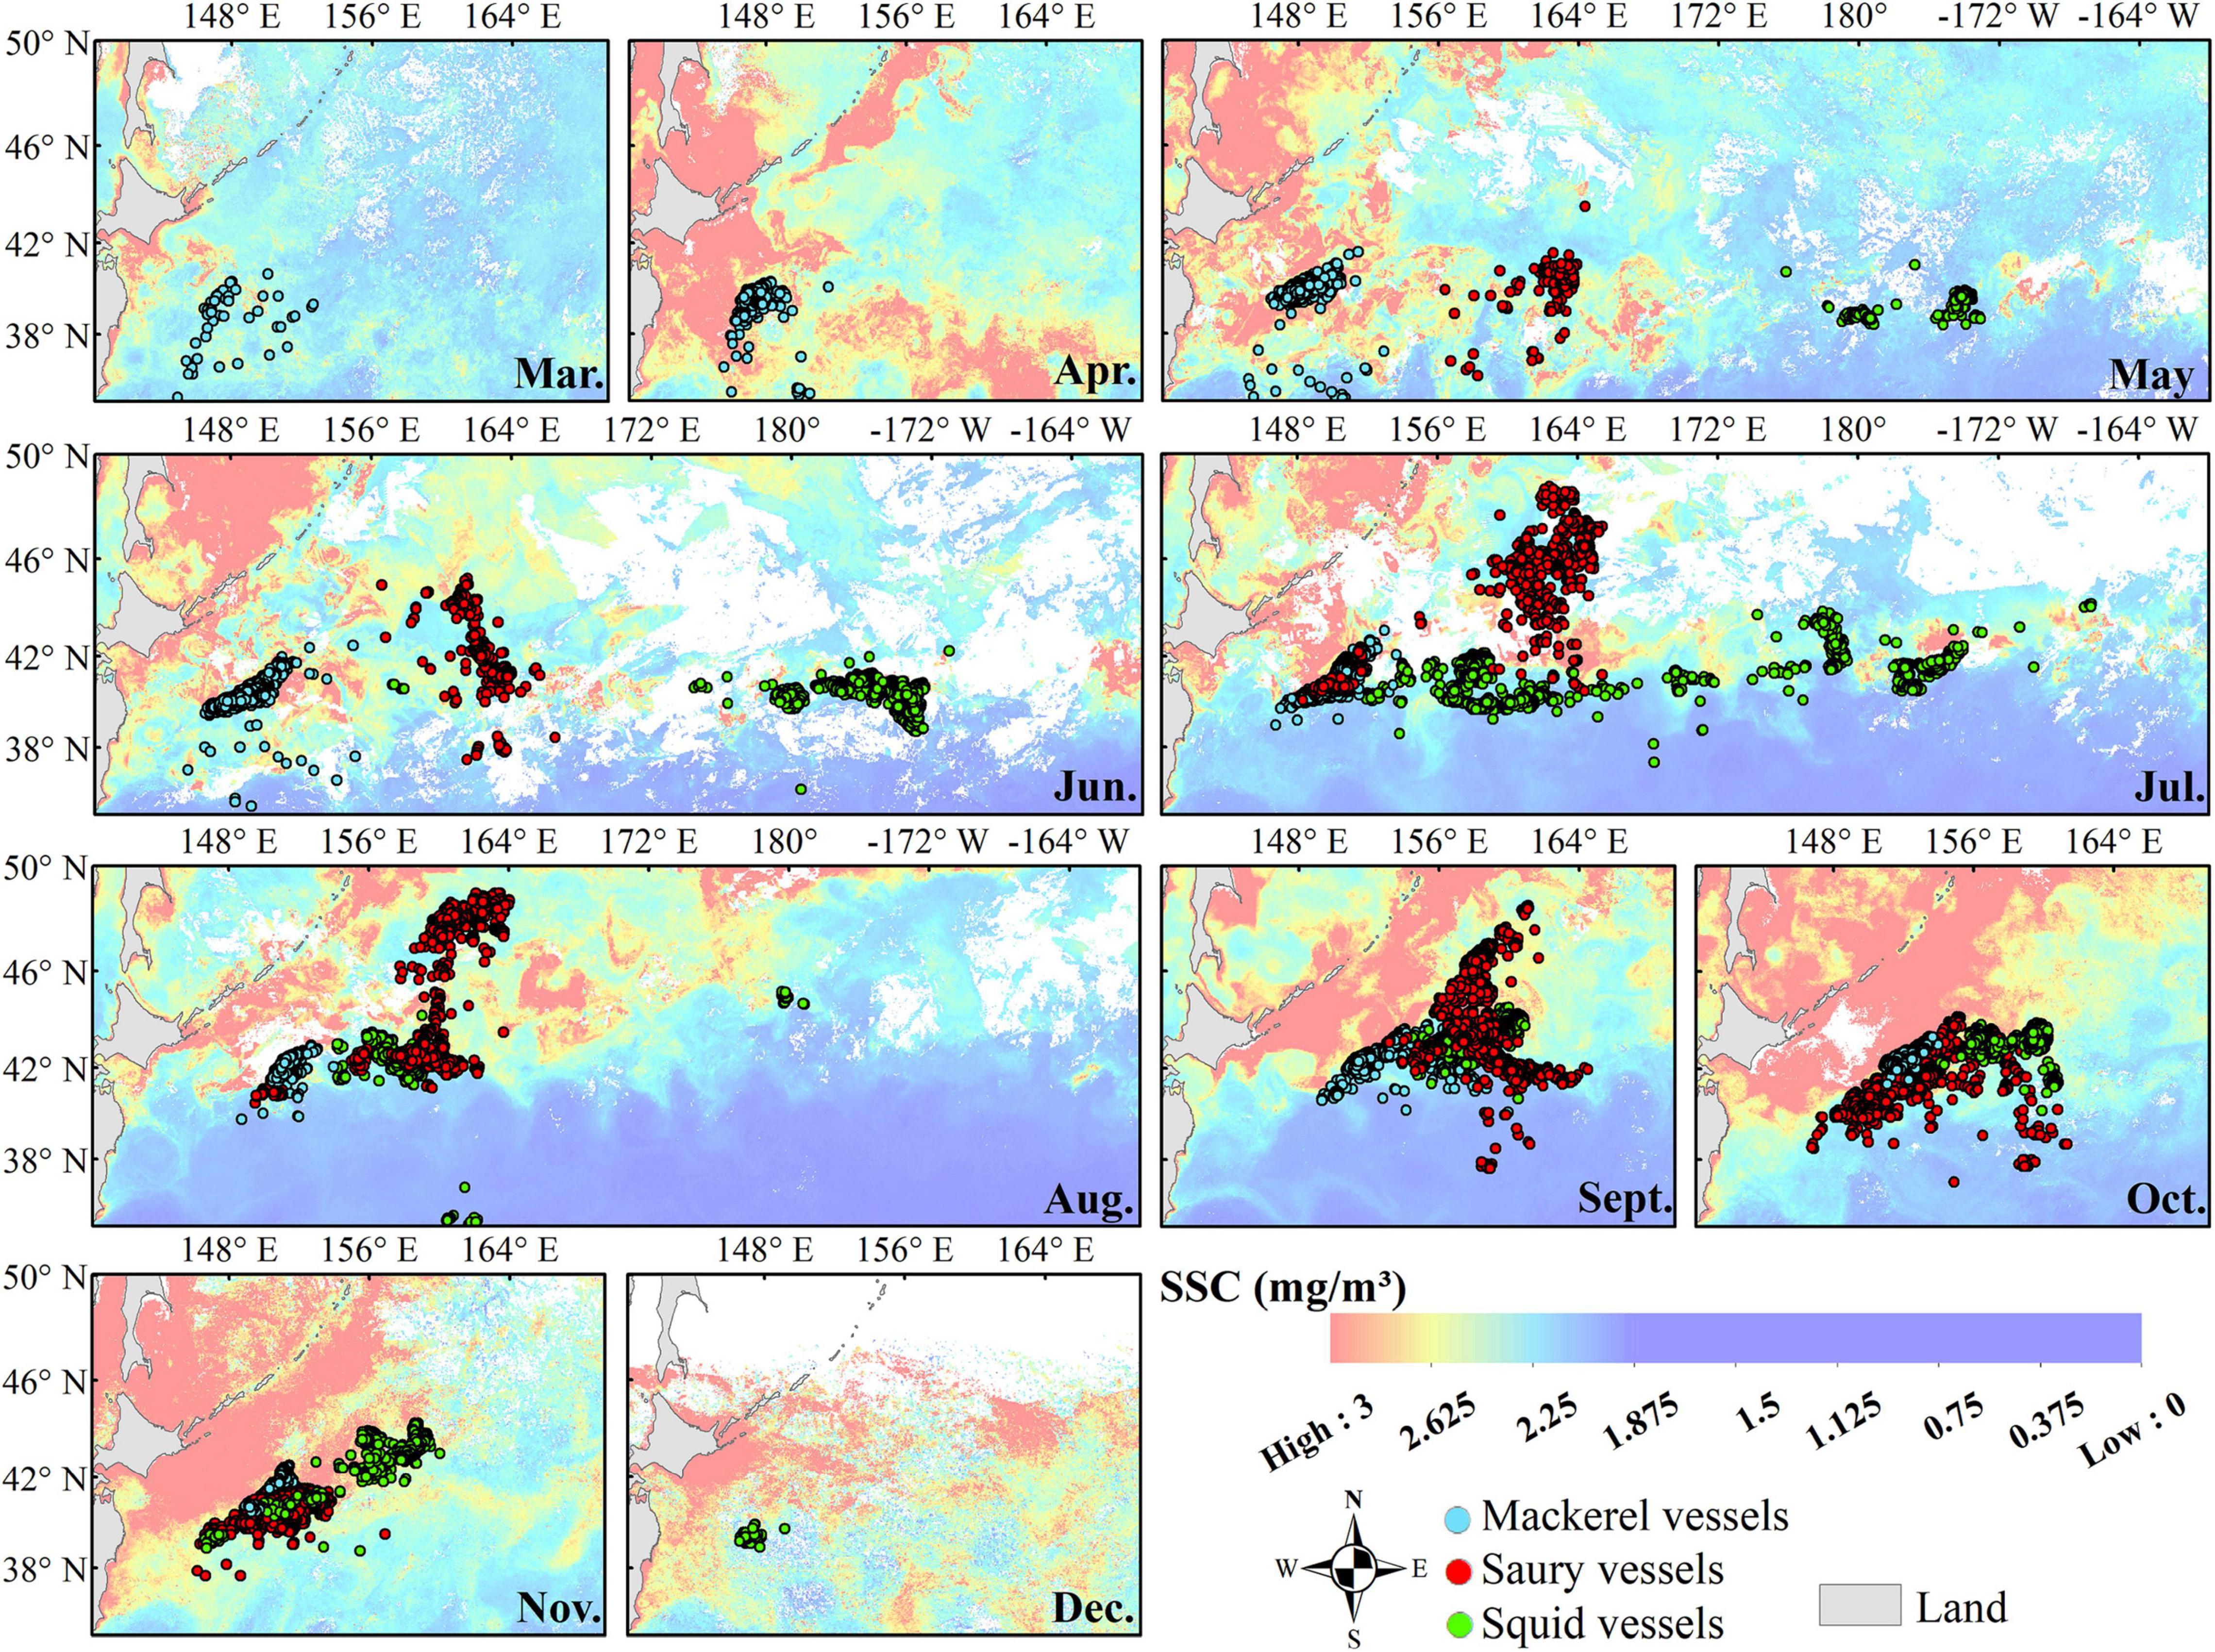
Figure 7. Monthly distributions of mackerel (blue dots), saury (red dots), and squid (green dots) fishing vessels that overlap with the SSC in the northwest Pacific from March to December 2018. Missing SSC pixels are shown in white.
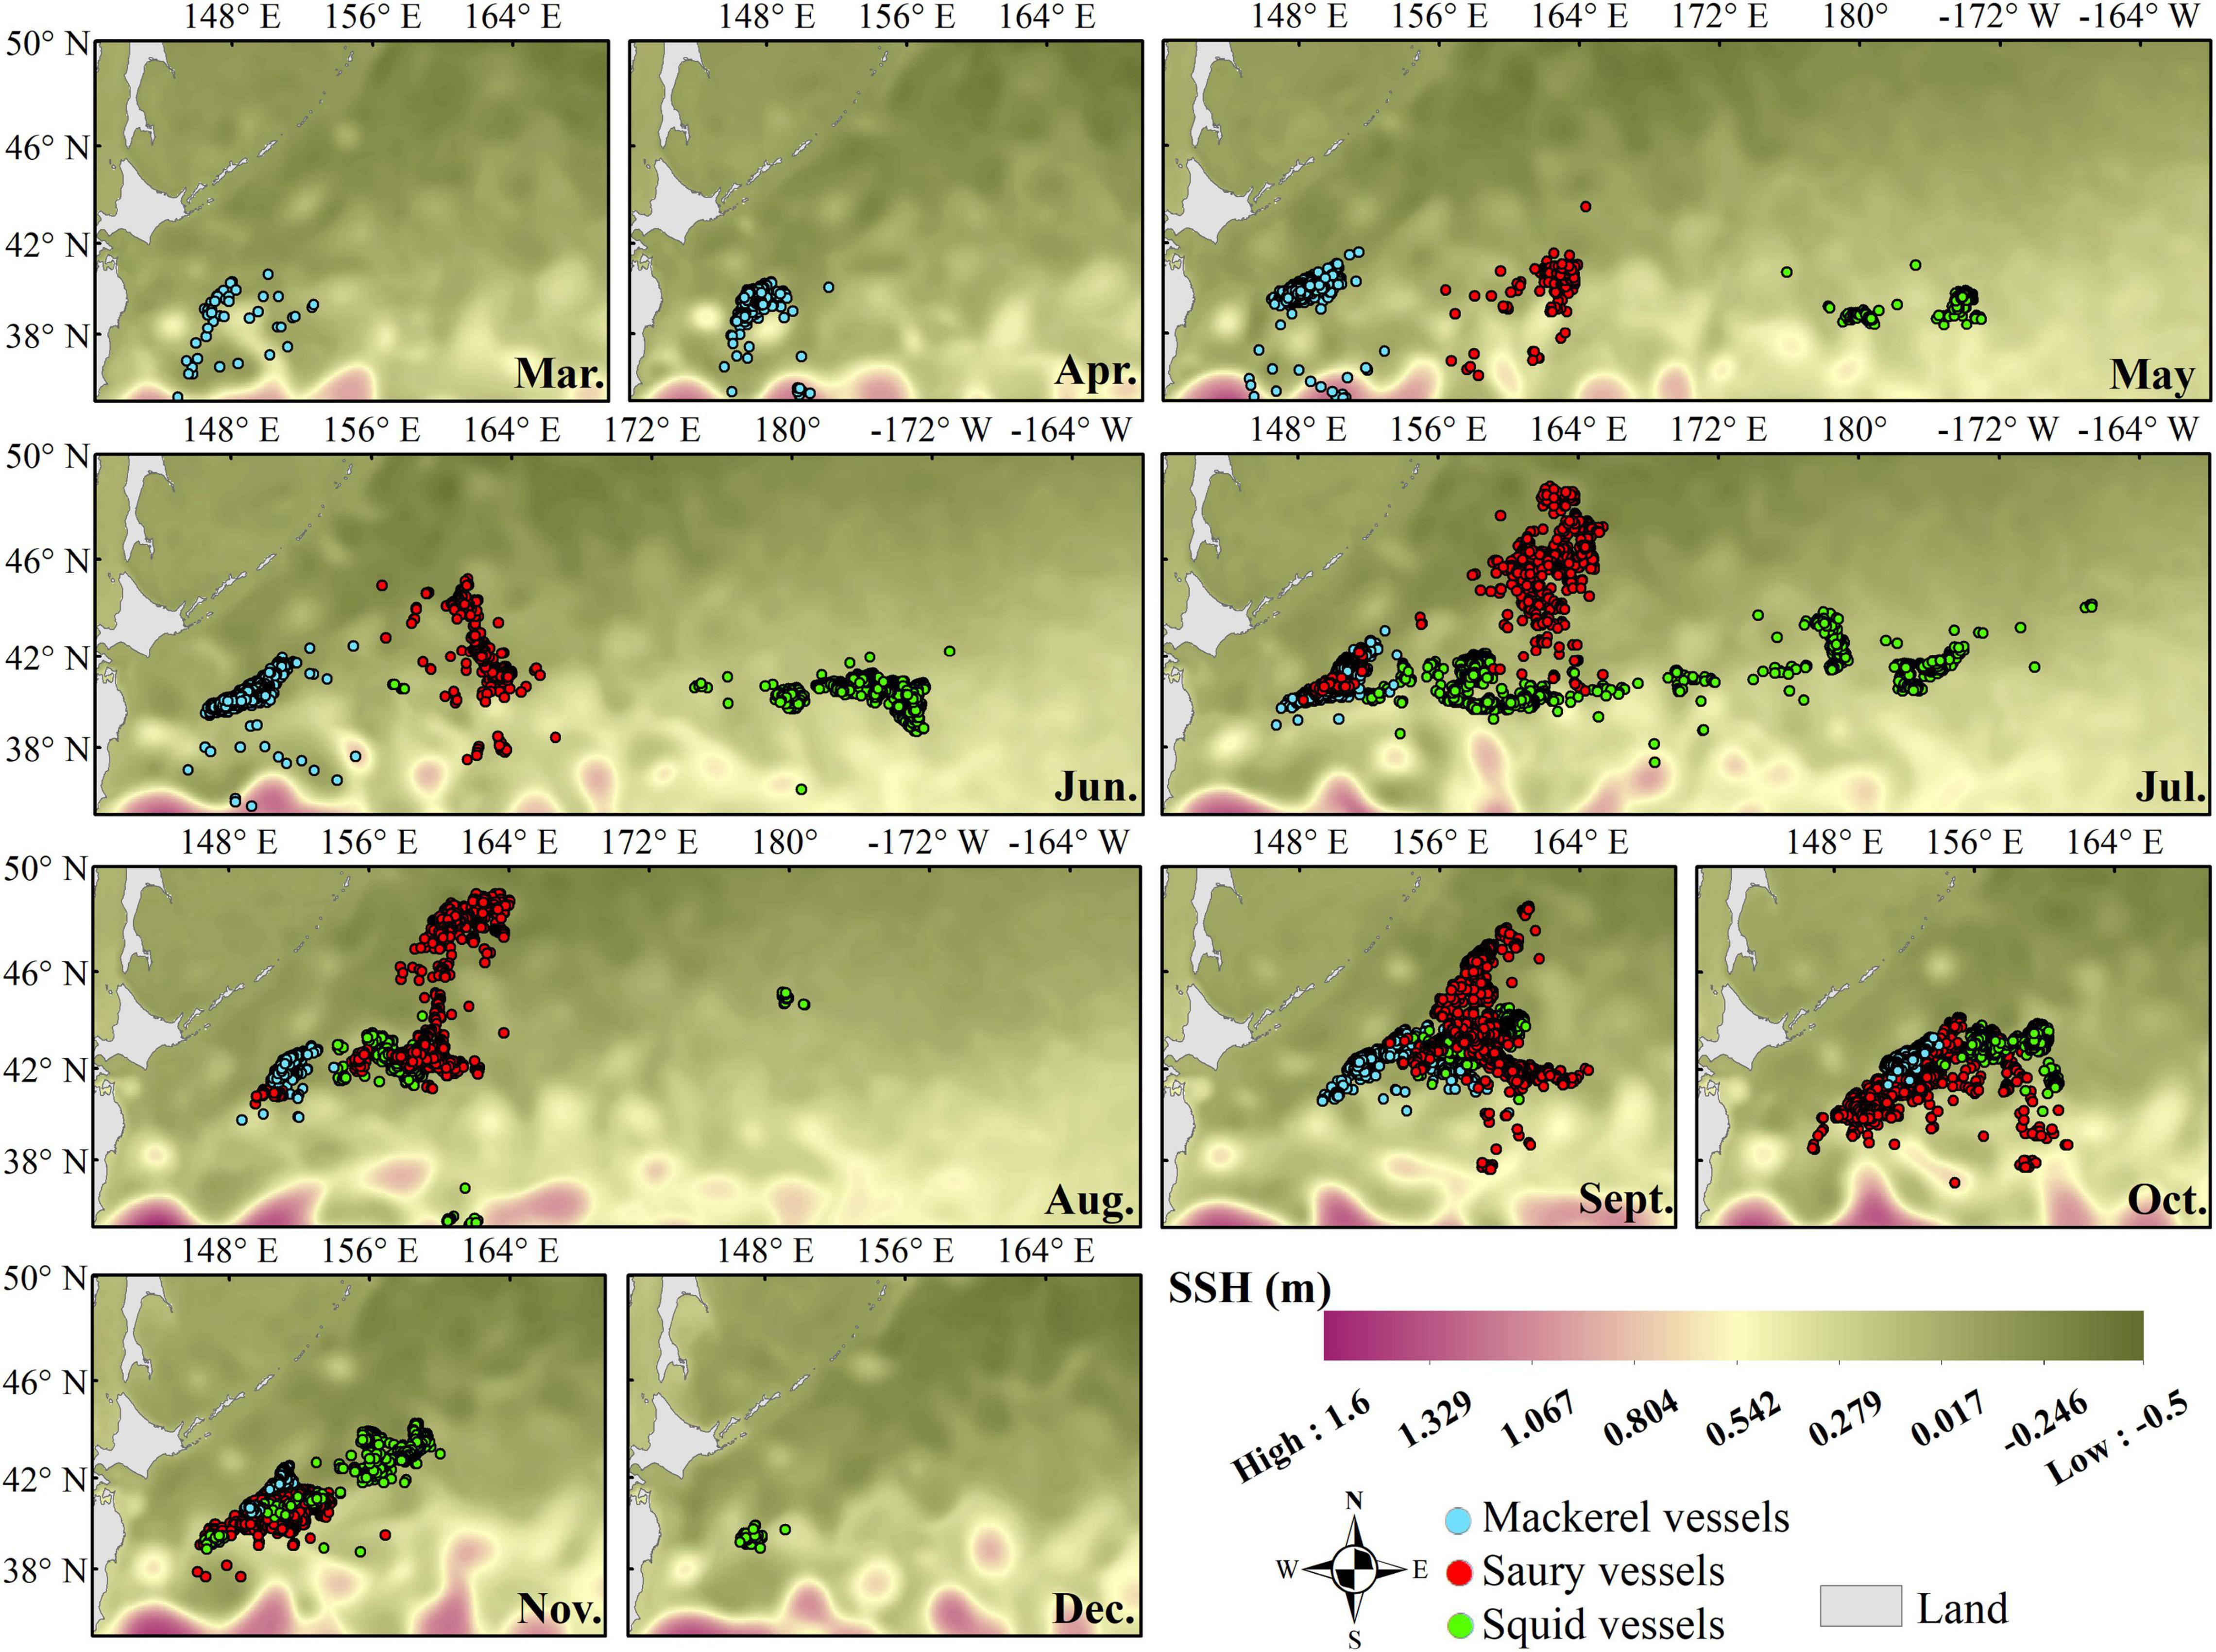
Figure 8. Monthly distributions of mackerel (blue dots), saury (red dots), and squid (green dots) fishing vessels that overlap with the SSH in the northwest Pacific from March to December 2018.
The main advantages of the SFRMAS is that it monitors and distinguishes species-specific fishing vessels, establishes a multispecies fishing vessel database, determines links between fish species, fishing vessels, and the marine environment, predicts changes in fishing grounds, and provides support for the assessment and protection of fishery resources.
In the world’s oceans, traditional fishing logs are not timely nor easy to obtain, and therefore, insufficient location data of fishing vessels limits relevant fishery research. The development of satellite technology has made high-powered ocean-going fishing vessels visible in remotely sensed data. However, several shortcomings limit the use of these data to supplement fishery data, most importantly, their inability to monitor species-specific fishing vessels. The comprehensive database built in this study based on satellite remotely sensed images and AIS data successfully distinguished multispecies fishing vessels, which can complement traditional fisheries data in the northwest Pacific. Real-time radar images captured on a saury fishing vessel were used to verify the VVD approach, which ensured the reliability of the multispecies VVD (Figure 3). Compared to the detection ranges of the AVD dataset or VVD dataset alone, the detection ranges for the fishing periods of mackerel, squid, and saury fishing vessels from the comprehensive database were 18, 11, and 3 days greater, respectively. Furthermore, the comprehensive database detected 17.0% of the mackerel vessels, 22.8% of the squid vessels and 29.6% of the saury vessels (Figure 4) that were obscured by the variations in moon phases and opaque clouds in the VVD dataset (Elvidge et al., 2013; Yamaguchi et al., 2016). Thus, there is no doubt that the comprehensive multispecies fishing vessel database addresses the respective limitations of communication and observation satellites and provides the best system for species-specific fishing vessel monitoring in terms of accurately detecting the number of fishing vessels and fishing periods (Figures 4D–F). Compared with previous data-limited studies, the comprehensive fishing vessel database covered wider spatiotemporal ranges and offered robust multispecies fleet detection results.
The south-to-north distributions of multispecies vessels outside the EEZs (Figure 5) were consistent with the seasonal migration between the spawning and feeding grounds of their target species (Watanabe, 1970; Tian et al., 2004; Watanabe and Yatsu, 2006; Alabia et al., 2016b), which are considered to be driven by suitable SSTs and their need for food resources (Figures 6, 7). Therefore, the SST, SSC and SSH ranges in the fishing positions are provided in Figure 9 to further analyze the suitable oceanographic characteristics of multiple fisheries. From the perspective of SST (Figure 9A), mackerel and squid fisheries had a similar trend, with fishing vessels mainly concentrated in waters with SSTs ranging from 16 to 18°C between July and September and less than 15°C in other months. These results for squid fisheries were consistent with optimal SST requirements for neon flying squid at different life history stages (Chen et al., 2007; Alabia et al., 2015; Yu et al., 2020). Conversely, as the Pacific saury is a cold-water pelagic fish (Sugisaki and Kurita, 2004), the distribution of the saury vessels in summer was different from those of mackerel and squid vessels and mainly occurred in colder waters with SSTs ranging from 8 to 12°C. Saury vessels were mainly concentrated in waters with SSTs between 15 and 18°C starting in August, corresponding with the most suitable environmental factor (15°C SST) affecting the distribution of saury during their southward-spawning migration in autumn (Huang, 2009).
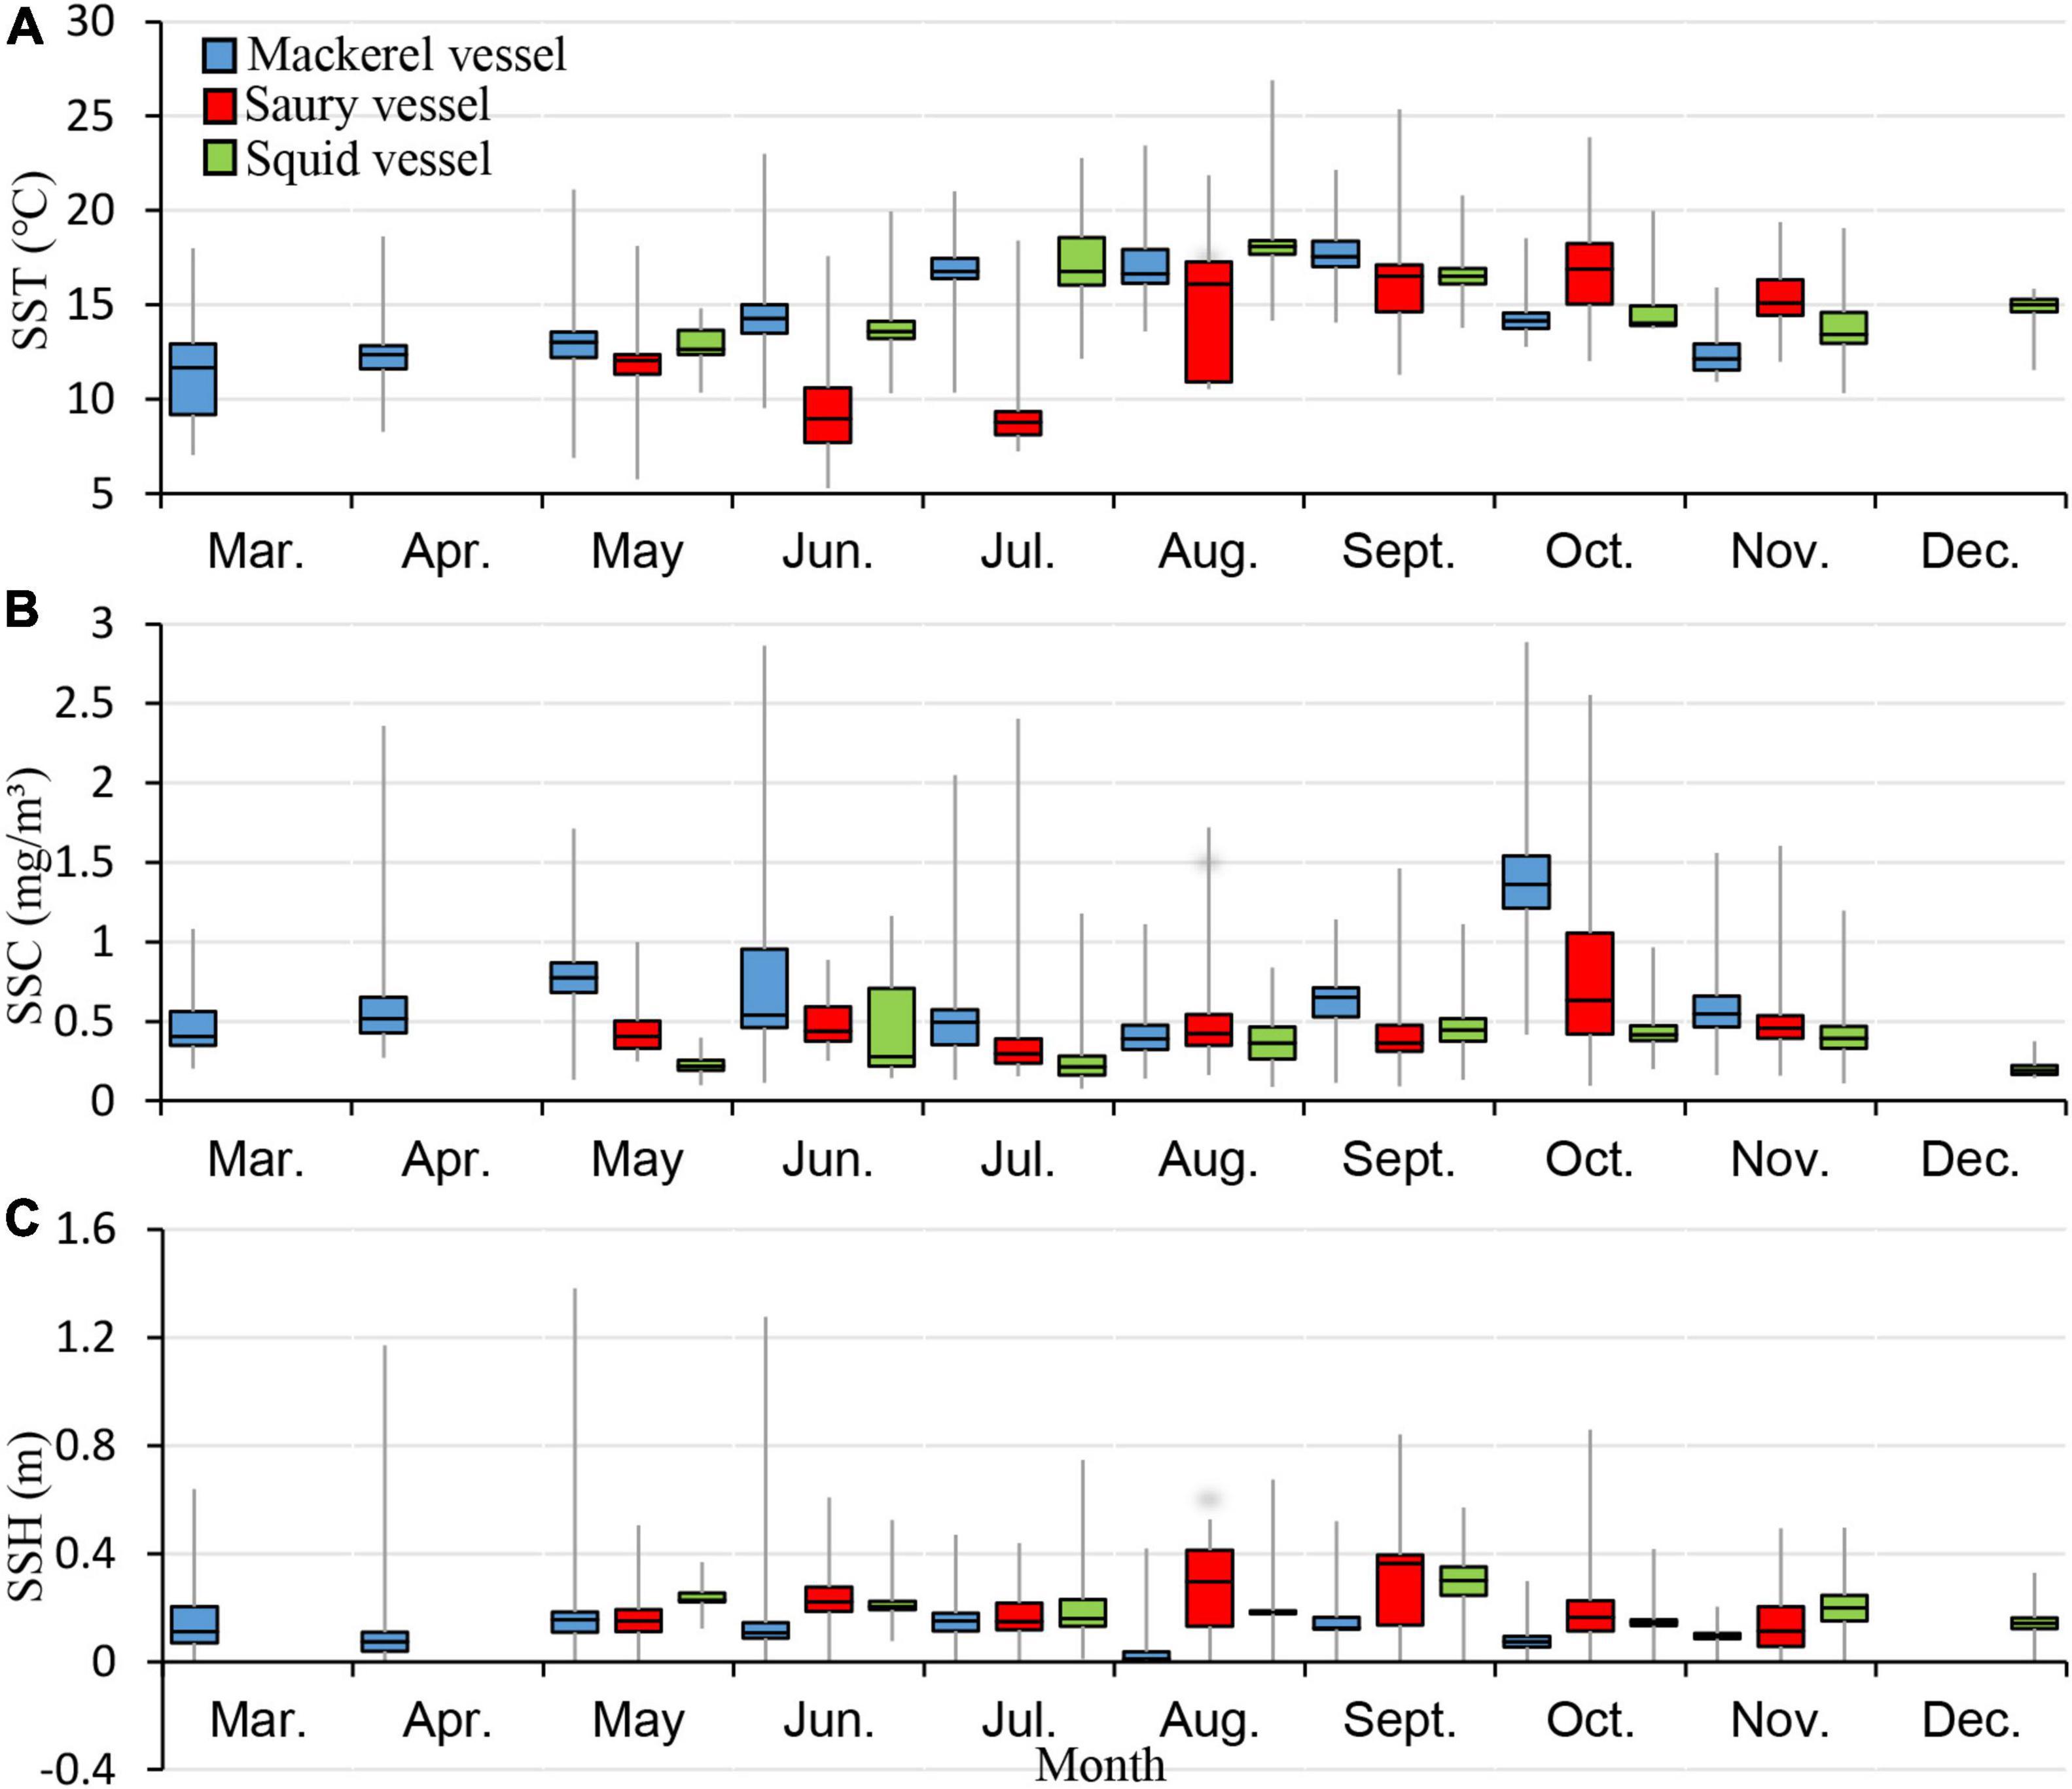
Figure 9. Medians (the black lines within the boxes), concentration ranges (the upper and lower borders of the boxes) and dispersion ranges (the gray whiskers) of the marine environments of the species-specific fishing positions for the (A) SST, (B) SSC, and (C) SSH.
From the perspective of the SSC (Figure 9B), mackerel vessels were mainly concentrated in fishing grounds with high SSCs (0.4–1 mg/m3) from April to June, when suitable feeding conditions accelerated the growth of mackerel (Watanabe and Yatsu, 2004). In addition, chub mackerel has the longest life cycle among the three pelagic fish species (Suyama et al., 1996; Yatsu et al., 1997; Yukami et al., 2018). Accordingly, the fishing period of mackerel vessels was the earliest and longest (Figure 4). However, in summer, mackerel vessels were mainly distributed in waters with lower SSCs (0.3–0.7 mg/m3). Most likely due to a large inflow of the Oyashio Current into the feeding grounds, most mackerel vessels move southwest into cold and productive fishing grounds in October, with SSCs ranging from 1.2 to 1.6 mg/m3. These results were consistent with previous research that showed that the SSC plays a vital role in mackerel growth (Kamimura et al., 2021). However, squid fisheries were mainly concentrated in waters with SSCs that were almost all less than 0.5 mg/m3, which were the lowest among the multispecies fishing vessels, suggesting that the SSC does not seem to directly affect the distribution of neon flying squid (Chen et al., 2007). Compared with squid vessels, saury vessels tended to be distributed in waters with higher SSCs, which indicates that the SSC was also an important factor affecting the distribution and migration of Pacific saury.
From the perspective of SSH (Figure 9C), mackerel vessels were mainly concentrated in waters with an SSH of 0–0.2 m, which was the lowest compared to squid and saury vessels. The SSH may affect the local distribution of squid by driving mesoscale ocean features such as food concentration (Chen et al., 2010), and the squid fishing grounds in 2018 were characterized by SSHs within the range of 0.1–0.4 m. The higher SSHs in saury fishing grounds after September also indicated that the strength of the Oyashio intrusion and transport drove the southward migration of the Pacific saury after they had reached a sufficient size (Tseng et al., 2014).
Mesoscale oceanic eddies have been shown to positively influence the catch of commercial fishing vessels using different fishing gear (Arur et al., 2020). Probably because the overlap between the monthly distribution of fishing vessels and the SSH layers blurs the mesoscale oceanic features, almost all night light fishing vessels were distributed in calm oceans (0–0.4 m SSH). Accordingly, SLA, SSC, and SST data were overlaid on the position of fishing vessels on September 18, 2018 to explore the effects of mesoscale eddies on multispecies fisheries in the northwest Pacific (Figure 10). Figure 10A shows that the mackerel and saury vessels were located in warm core eddy peripheries, which are considered productive due to the depressed sea surface and the occurrence of divergence or upwelling (Figure 10B). The overlap of fishing vessel positions with the SST layer also reveals that mackerel and saury vessels tended to fish near the high-productivity fronts. In contrast, on this date, squid vessels were mainly distributed near warm core eddy centers, which are not considered productive. Although all multispecies fishing vessels use light to catch pelagic species, those in the northwest Pacific were concentrated in waters with different SSCs, which can be attributed to differences in fishing gear and the feeding habits of their target species. Upwelling at eddies can increase local SSC, attracting pelagic planktivorous fishes; therefore, mackerel and saury vessels in the northwest Pacific tend to be distributed in warm core eddy peripheries and move with them. The opposite distribution pattern of squid vessels may be related to the fact that these longliners locate fishing grounds based on the color and turbidity of water and that they target predatory fish (Arur et al., 2014). The multispecies fishing vessels database developed in this study provides a basis for exploring the relationship between fishing activities and ocean phenomena. A previous study showed that the influence of upwelling on the Sardinella longiceps catch is seasonal (with 2- and 3-month lags) in the coastal waters of the southeastern Arabian Sea (Menon et al., 2019). However, the present study did not consider the lag (even of a few days) that may occur in multispecies fishing when considering the influence of mesoscale oceanic features, which may be important as there is a time requirement before these physical feature impact fish abundance. In the future, the temporal resolution for exploring the influence of mesoscale oceanic features on multispecies commercial fishing in the northwest Pacific and their lead-lag correlation may reach accuracy on the scale of days.
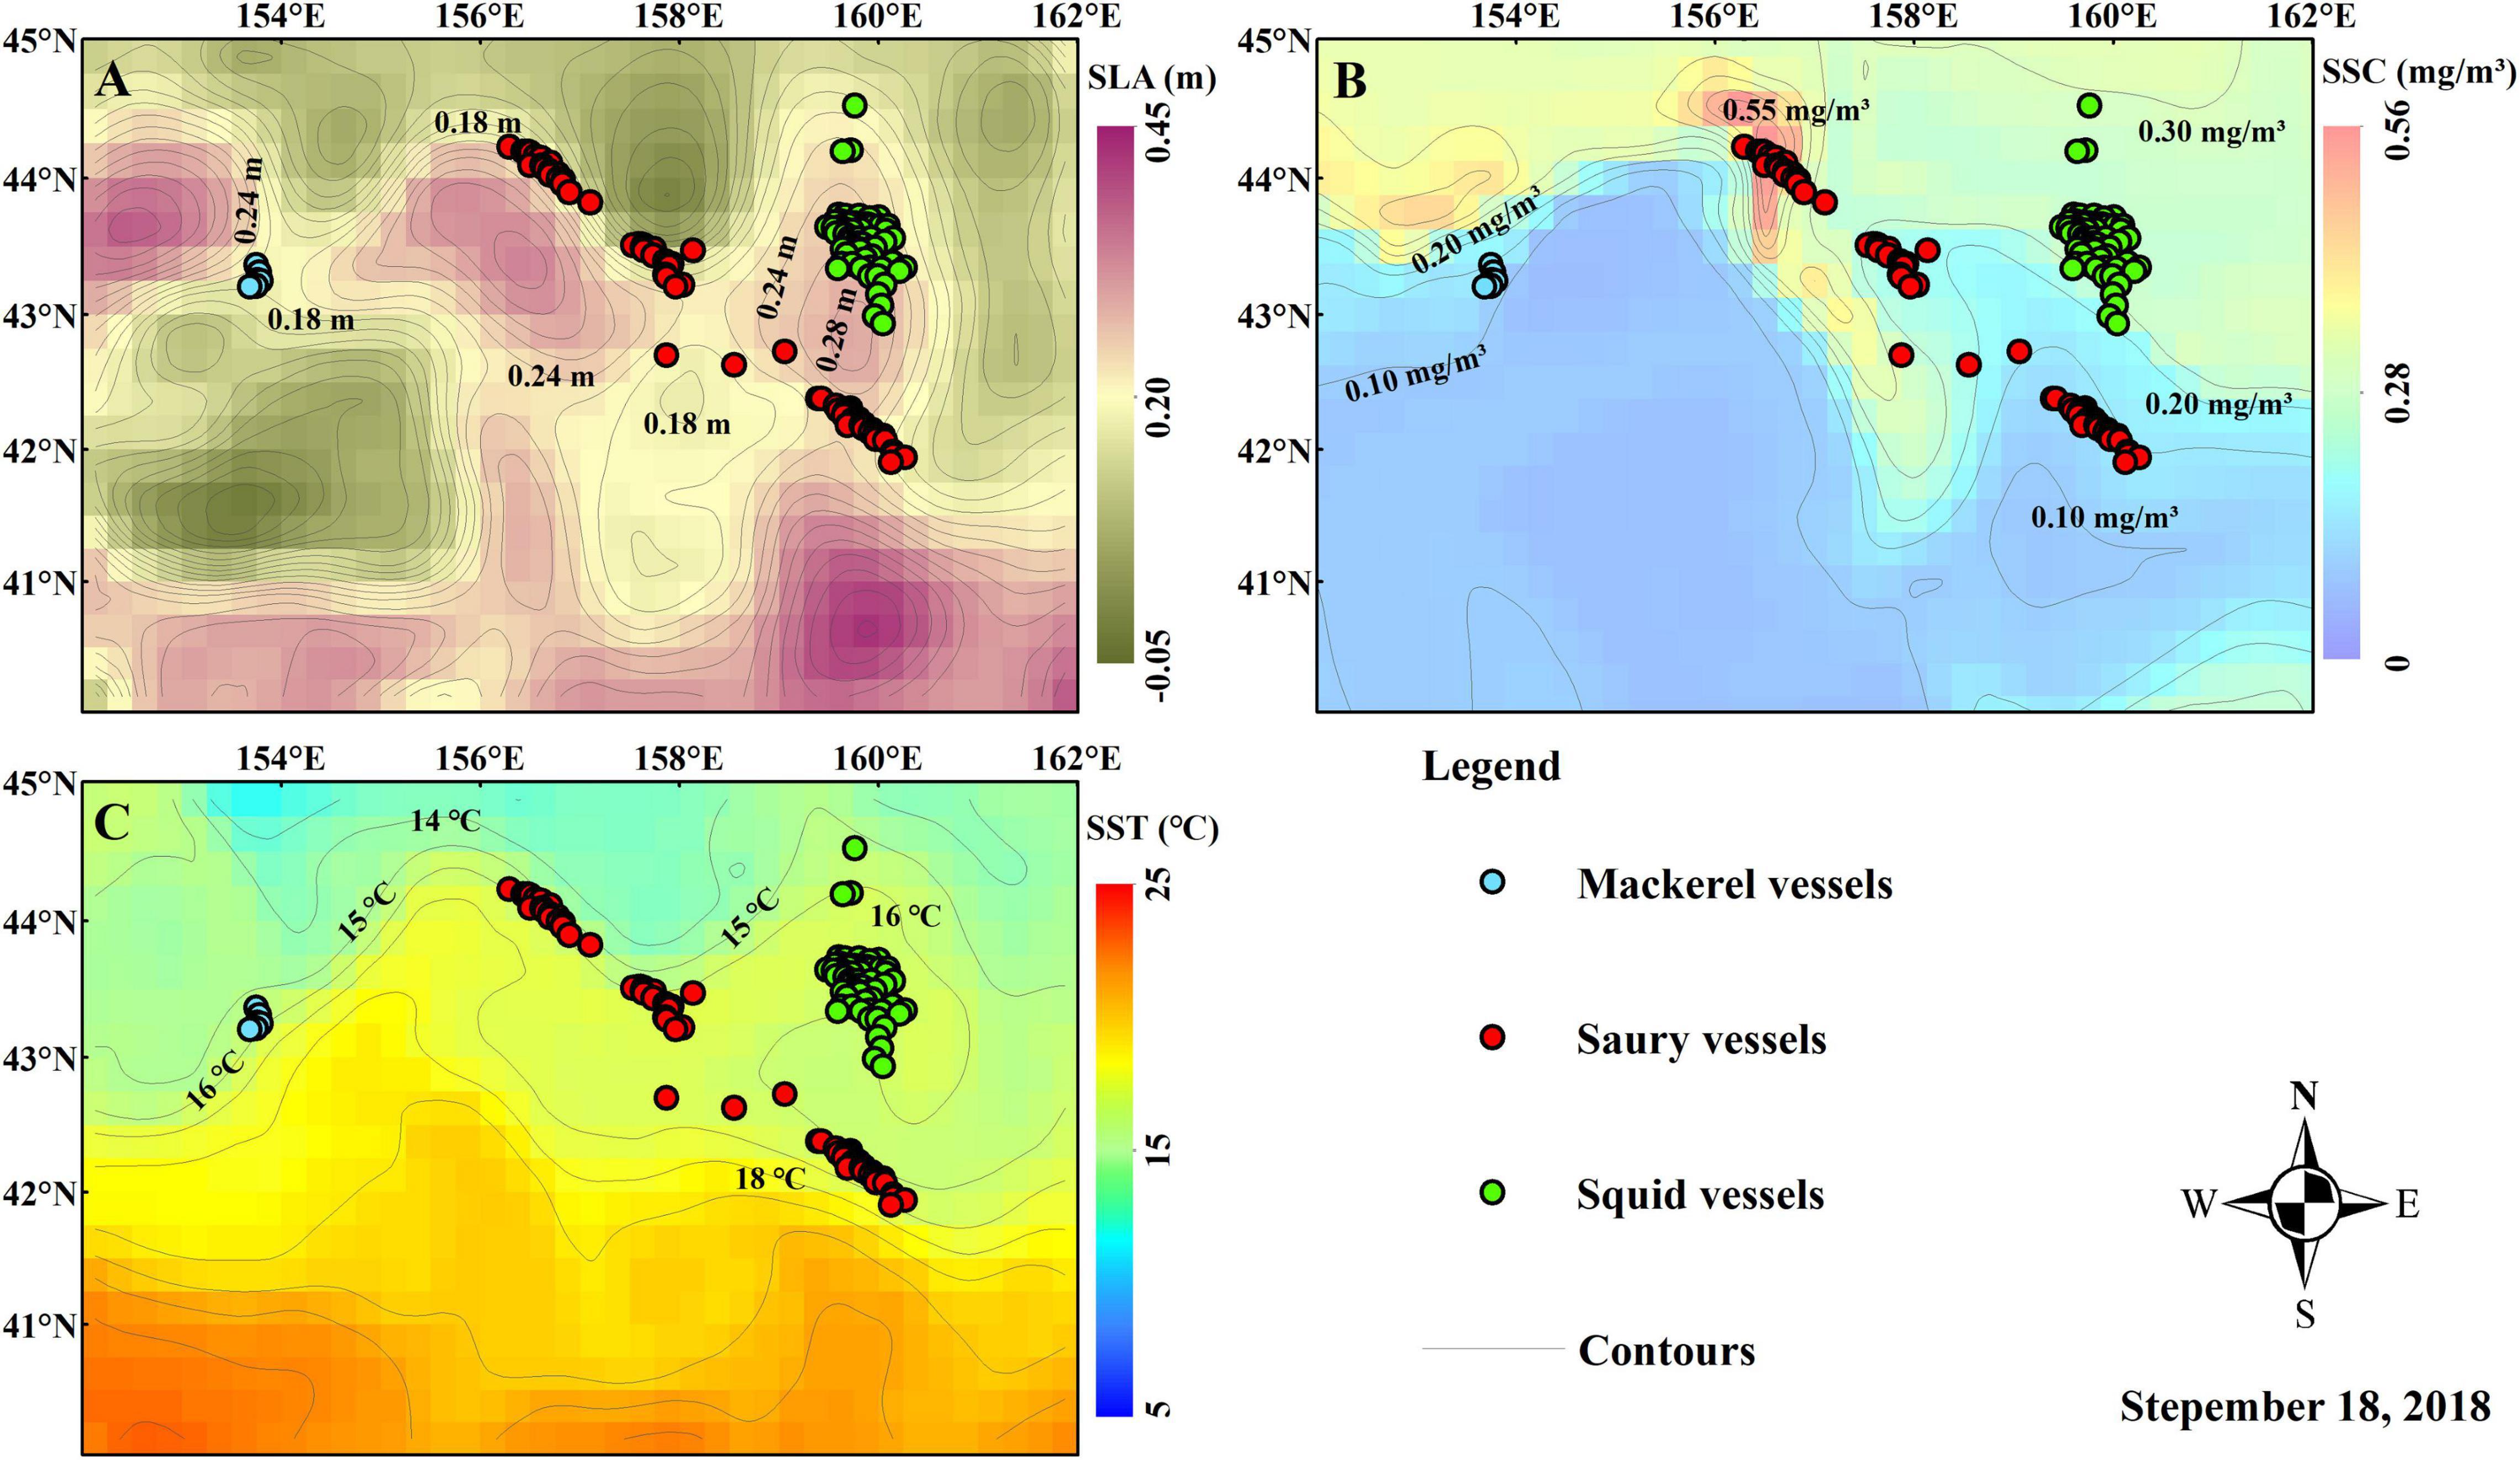
Figure 10. Distributions of mackerel (blue dots), saury (red dots), and squid (green dots) fishing vessels on September 18, 2018, overlain with (A) SLAs, (B) SSCs and (C) SSTs. The SLA, SSC and SST contours were generated at 0.02 m, 0.05 mg/m3 and 1°C intervals, respectively.
Conservation and management measures for commercial species are inseparable from monitoring of species-specific fishery activities. Controlling the total allowable catch is a crucial conservation measure for commercial fishery resources but it is limited by incomplete fishing logs, and previous studies on fishery resource management have often focused on a single fish species. Therefore, multispecies fishing vessels in 2013–2018 in the northwest Pacific were distinguished, and the ratios of fishing days detected by SFRMAS to those based on the NPFC data were mostly between 60 and 90% (Figure 11A). More importantly, by combining the SFRMAS-based fishing days (Figures 4D–F) and the NPFC-based average CPUE before a particular year, the SFRMAS can provide multispecies catch predictions for that year. The forecasted catches of multiple species from 2013 to 2018 are shown in Figure 11B, and compared to the NPFC-based catches, the prediction accuracies of mackerel, squid and saury were within 65–70%, 55–60%, and 70–75%, respectively. These relatively low prediction accuracies may be due to data constraints in the fishing vessel identification and the coarse time resolution (year) of the CPUE. Therefore, real-time CPUE data will be collected in the future to improve the SFRMAS-based catch predictions. Night-light fishing vessels obscured by thick clouds may also be detected using satellite-based synthetic aperture radar (SAR) data (Ren et al., 2021). As the lunar phase progressed, the number of VVD-based fishing vessels decreased significantly (Figures 4D–F). More field surveys will be conducted to determine a more reasonable range of running means to reduce the influence of moon phases, especially the full moon, on the VVD detection and catch prediction.
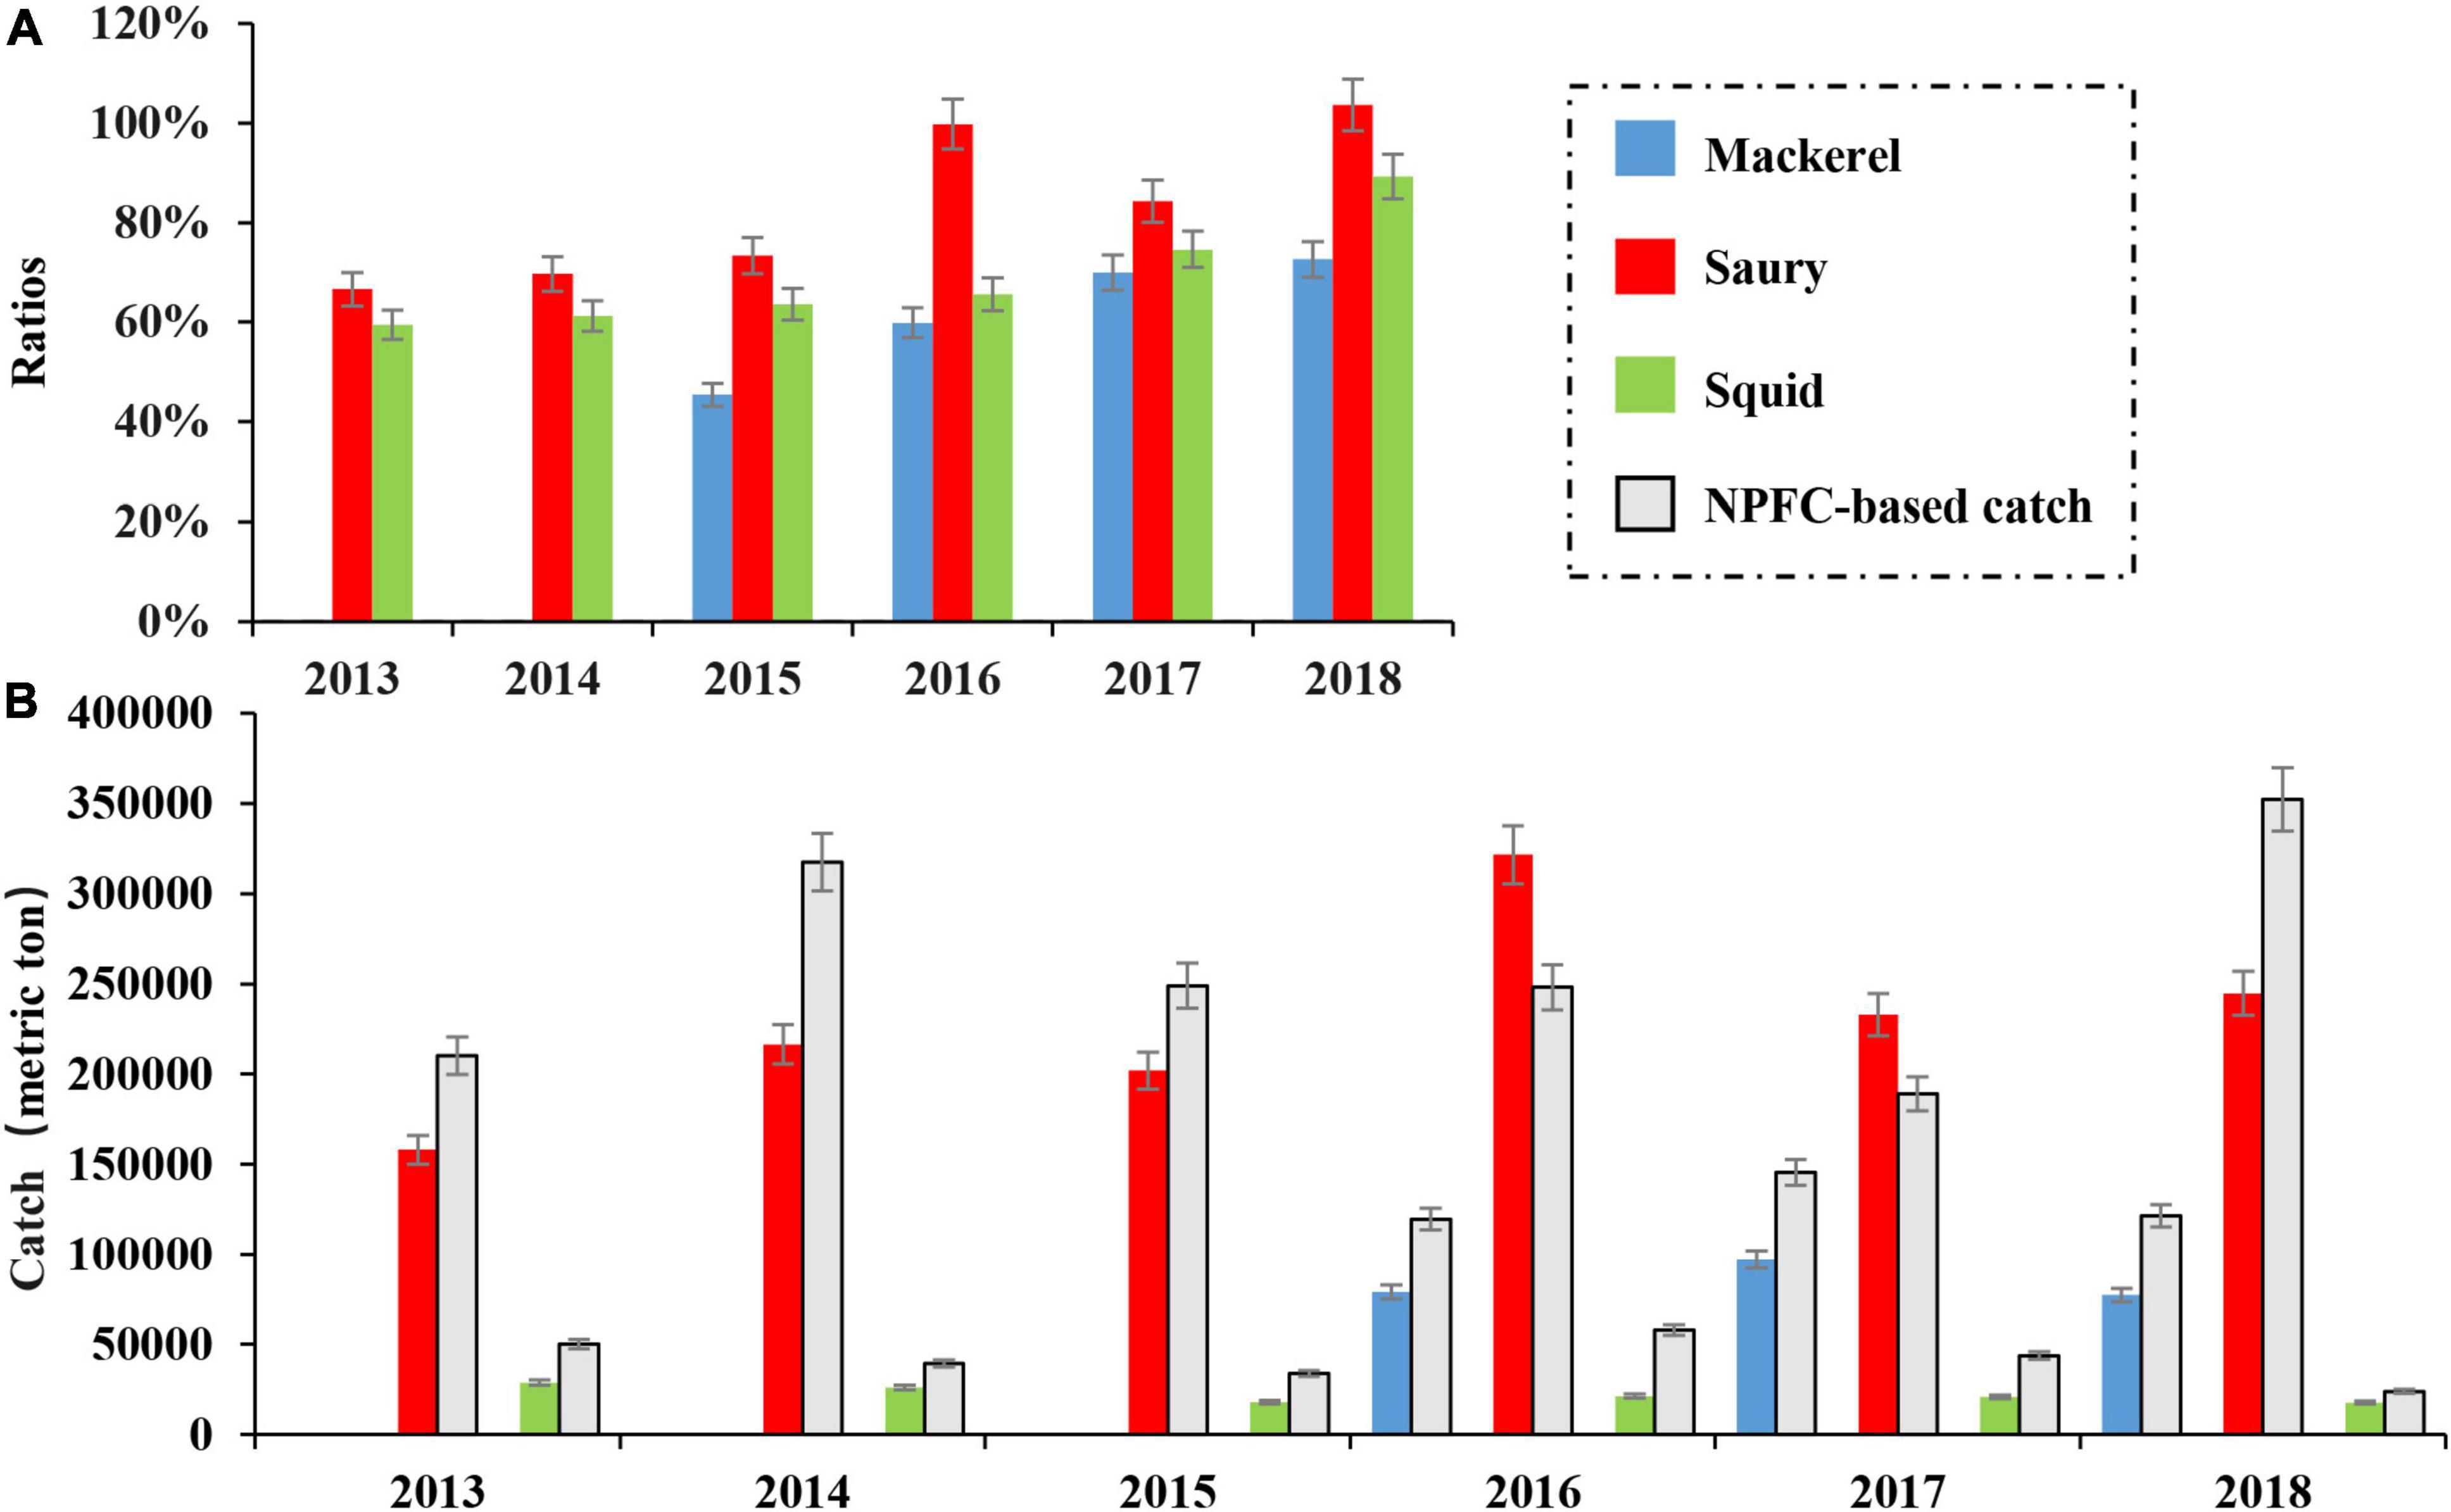
Figure 11. (A) Ratios of SFRMAS-based fishing days to NPFC-based fishing days, and (B) SFRMAS-based and NPFC-based catches.
The strong link between commercial species, fishing vessels and environmental conditions makes it possible to monitor the large-scale migration routes and forecast the fishing grounds of pelagic fishes by using satellite remote sensing data, which is especially useful for the conservation of spawning groups. From the SFRMAS-based spatiotemporal variations in multispecies fishing vessels, we assumed that the spawning migration of chub mackerel, neon flying squid (autumn cohort) and Pacific saury started after October 7, September 21, and August 9, respectively. Using the near real-time characteristics of observation satellites, the SFRMAS can be used to combat illegal fishing by monitoring the daily number and location of fishing vessels, and long-term monitoring can help fisheries agencies protect juvenile fish by defining fishing ban areas (NPFC, 2019b). By assisting in estimating catches, protecting spawning groups, combating illegal fishing, and defining closed fishing areas, the SFRMAS presented in this study could result in improved conservation and management of multiple fishery resources.
This study established the SFRMAS for multiple fisheries resources in the northwest Pacific. Based on satellite remote sensing technology, a comprehensive multispecies fishing vessel database was generated in the SFRMAS, and a strong link between fish, fishing vessels and the marine environment was found. The SST and SSC influenced the distribution and migration patterns of target species and further affected variations in the spatiotemporal distribution patterns of the fishing vessels. Gear types restricted the distribution of night light fishing vessels in oceans with low SSHs. The SFRMAS could provide support for the monitoring, management, and evaluation of multiple fishery resources. Additional fishing vessel information and remote sensing data are needed in the future to monitor and manage more fish species based on the SFRMAS.
The raw data supporting the conclusions of this article will be made available by the authors, without undue reservation.
HT took the radar images, designed and developed the method, extracted the DNB fishing vessels, and wrote the manuscript. YL conceived the idea for the study and analyses and edited the manuscript. IA edited and proofread earlier versions of the manuscript. YQ extracted the AIS fishing vessels. HS calculated the daily centers of the fishing vessels. JL, SM, S-IS, and YT reviewed and edited the manuscript. All authors listed have made a direct and substantial contribution to this work.
This work was supported by the National Natural Science Foundation of China (Grant/Award Nos. 41861134037, 41876177, and 41930534), the Shandong Key R&D Program (Grant/Award No. 2019GHY112014), and the Fundamental Research Funds for the Central Universities (Grant/Award No. 201762015).
The authors declare that the research was conducted in the absence of any commercial or financial relationships that could be construed as a potential conflict of interest.
All claims expressed in this article are solely those of the authors and do not necessarily represent those of their affiliated organizations, or those of the publisher, the editors and the reviewers. Any product that may be evaluated in this article, or claim that may be made by its manufacturer, is not guaranteed or endorsed by the publisher.
The research benefited from the AIS data provided by the Global Fishing Watch. We especially thank the Zhongtai Fishery Company for its support in the process of capturing radar images.
The Supplementary Material for this article can be found online at: https://www.frontiersin.org/articles/10.3389/fmars.2022.808282/full#supplementary-material
Alabia, I. D., Dehara, M., Saitoh, S.-I., and Hirawake, T. (2016a). Seasonal habitat patterns of Japanese common squid (Todarodes Pacificus) inferred from satellite-based species distribution models. Remote Sens. 8:921. doi: 10.3390/rs8110921
Alabia, I. D., Saitoh, S., Mugo, R., Igarashi, H., Ishikawa, Y., Usui, N., et al. (2015). Identifying pelagic habitat hotspots of neon flying squid in the temperate waters of the central north pacific. PLoS One 10:e0142885. doi: 10.1371/journal.pone.0142885
Alabia, I. D., Saitoh, S.-I., Hirawake, T., Igarashi, H., Ishikawa, Y., Usui, N., et al. (2016b). Elucidating the potential squid habitat responses in the central North Pacific to the recent ENSO flavors. Hydrobiologia 772, 215–227. doi: 10.1007/s10750-016-2662-5
Arur, A., Krishnan, P., George, G., Goutham Bharathi, M. P., Kaliyamoorthy, M., Hareef Baba Shaeb, K., et al. (2014). The influence of mesoscale eddies on a commercial fishery in the coastal waters of the Andaman and Nicobar Islands, India. Int. J. Remote Sens. 35, 6418–6443. doi: 10.1080/01431161.2014.958246
Arur, A., Krishnan, P., Kiruba-Sankar, R., Suryavanshi, A., Lohith Kumar, K., Kantharajan, G., et al. (2020). Feasibility of targeted fishing in mesoscale oceanic eddies: a study from commercial fishing grounds of Andaman and Nicobar Islands, India. Int. J. Remote Sens. 41, 5011–5045. doi: 10.1080/01431161.2020.1724347
Cao, C., Xiong, J., Blonski, S., Liu, Q., Uprety, S., Shao, X., et al. (2013). Suomi NPP VIIRS sensor data record verification, validation, and long-term performance monitoring. J. Geophys. Res. Atmospheres 118, 11664–11678. doi: 10.1002/2013jd020418
Chang, Y. J., Lan, K. W., Walsh, W. A., Hsu, J., and Hsieh, C.h. (2019). Modelling the impacts of environmental variation on habitat suitability for Pacific saury in the Northwestern Pacific Ocean. Fish. Oceanogr. 28, 291–304. doi: 10.1111/fog.12408
Chen, X. J., Zhao, X. H., and Chen, Y. (2007). Influence of El Niño/La Niña on the western winter-spring cohort of neon flying squid (Ommastrephes bartramii) in the northwestern Pacific Ocean. ICES J. Mar. Sci. 64, 1152–1160.
Chen, X., Tian, S., Chen, Y., and Liu, B. (2010). A modeling approach to identify optimal habitat and suitable fishing grounds for neon flying squid (Ommastrephes bartramii) in the Northwest Pacific Ocean. Fish. Bull. 108, 1–14.
Chiu, T.-Y., Chiu, T.-S., and Chen, C.-S. (2017). Movement patterns determine the availability of Argentine shortfin squid Illex argentinus to fisheries. Fish. Res. 193, 71–80. doi: 10.1016/j.fishres.2017.03.023
Cozzolino, E., and Lasta, C. A. (2016). Use of VIIRS DNB satellite images to detect jigger ships involved in the Illex argentinus fishery. Remote Sens. Appl. Soc. Environ. 4, 167–178. doi: 10.1016/j.rsase.2016.09.002
De Souza, E. N., Boerder, K., Matwin, S., and Worm, B. (2016). Improving fishing pattern detection from satellite AIS using data mining and machine learning. PLoS One 11:e0158248. doi: 10.1371/journal.pone.0158248
Elvidge, C. D., Baugh, K., Zhizhin, M., and Hsu, F.-C. (2013). Why VIIRS data are superior to DMSP for mapping nighttime lights. Proc. Asia Pac. Adv. Netw. 35, 62–69. doi: 10.7125/apan.35.7
Elvidge, C. D., Ghosh, T., Baugh, K., Zhizhin, M., Hsu, F.-C., Katada, N. S., et al. (2018). Rating the effectiveness of fishery closures with visible infrared imaging radiometer suite boat detection data. Front. Mar. Sci. 5:132. doi: 10.3389/fmars.2018.00132
Elvidge, C. D., Zhizhin, M., Baugh, K., and Hsu, F.-C. (2015). Automatic boat identification system for VIIRS low light imaging data. Remote Sens. 7, 3020–3036. doi: 10.3390/rs70303020
Flothmann, S., Kistowski, K.v., Emily Dolan, E. L., Meere, F., and Album, G. (2010). Closing loopholes: getting illegal fishing under control. Science 328, 1235–1236.
Geronimo, R., Franklin, E., Brainard, R., Elvidge, C., Santos, M., Venegas, R., et al. (2018). Mapping fishing activities and suitable fishing grounds using nighttime satellite images and maximum entropy modelling. Remote Sens. 10:1604. doi: 10.3390/rs10101604
Hsu, F.-C., Elvidge, C. D., Baugh, K., Zhizhin, M., Ghosh, T., Kroodsma, D., et al. (2019). Cross-matching VIIRS boat detections with vessel monitoring system tracks in Indonesia. Remote Sens. 11:995. doi: 10.3390/rs11090995
Huang, W.-B. (2009). Comparisons of monthly and geographical variations in abundance and size composition of Pacific saury between the high-seas and coastal fishing grounds in the northwestern Pacific. Fish. Sci. 76, 21–31. doi: 10.1007/s12562-009-0196-8
James, M., Mendo, T., Jones, E. L., Orr, K., McKnight, A., and Thompson, J. (2018). AIS data to inform small scale fisheries management and marine spatial planning. Mar. Policy 91, 113–121. doi: 10.1016/j.marpol.2018.02.012
Kamimura, Y., Taga, M., Yukami, R., Watanabe, C., and Furuichi, S. (2021). Intra- and inter-specific density dependence of body condition, growth, and habitat temperature in chub mackerel (Scomber japonicus). ICES J. Mar. Sci. 78, 3254–3264. doi: 10.1101/2021.03.25.436928
Kroodsma, D. A., Mayorga, J., Hochberg, T., Miller, N. A., Boerder, K., Ferretti, F., et al. (2018). Tracking the global footprint of fisheries. Science 359, 904–908.
Le Guyader, D., Ray, C., Gourmelon, F., and Brosset, D. (2017). Defining high-resolution dredge fishing grounds with Automatic Identification System (AIS) data. Aquat. Living Resour. 30:39. doi: 10.1051/alr/2017038
Liu, Y., Saitoh, S. I., Hirawake, T., Igarashi, H., and Ishikawa, Y. (2015). Detection of squid and pacific Saury fishing vessels around Japan using VIIRS Day/Night Band image. Proc. Asia Pac. Adv. Netw. 39, 28–39. doi: 10.7125/APA
McCauley, D. J., Woods, P., Sullivan, B., Bergman, B., Jablonicky, C., Roan, A., et al. (2016). Ending hide and seek at sea. Science 351, 1148–1150.
Menon, N. N., Sankar, S., Smitha, A., George, G., Shalin, S., Sathyendranath, S., et al. (2019). Satellite chlorophyll concentration as an aid to understanding the dynamics of Indian oil sardine in the southeastern Arabian Sea. Mar. Ecol. Prog. Ser. 617-618, 137–147. doi: 10.3354/meps12806
Miller, S., Straka, W., Mills, S., Elvidge, C., Lee, T., Solbrig, J., et al. (2013). Illuminating the capabilities of the suomi national polar-orbiting partnership (NPP) visible infrared imaging radiometer suite (VIIRS) Day/Night Band. Remote Sens. 5, 6717–6766. doi: 10.3390/rs5126717
Mills, S., and Miller, S. (2016). VIIRS day/night band—correcting striping and nonuniformity over a very large dynamic range. J. Imaging 2:9. doi: 10.3390/jimaging2010009
Mugo, R. M., Saitoh, S.-I., Takahashi, F., Nihira, A., and Kuroyama, T. (2014). Evaluating the role of fronts in habitat overlaps between cold and warm water species in the western North Pacific: a proof of concept. Deep Sea Res. Part II Top. Stud. Oceanogr. 107, 29–39. doi: 10.1016/j.dsr2.2013.11.005
Natale, F., Gibin, M., Alessandrini, A., Vespe, M., and Paulrud, A. (2015). Mapping fishing effort through AIS Data. PLoS One 10:e0130746. doi: 10.1371/journal.pone.0130746
NPFC (2021a). Conservation and Management Measure for Japanese Sarding, Neon Flying Squid and Japanese Flying Squid. Tokyo: NPFC.
Oozeki, Y., Inagake, D., Saito, T., Okazaki, M., Fusejima, I., Hotai, M., et al. (2018). Reliable estimation of IUU fishing catch amounts in the northwestern Pacific adjacent to the Japanese EEZ: potential for usage of satellite remote sensing images. Mar. Policy 88, 64–74. doi: 10.1016/j.marpol.2017.11.009
Paulino, C., Aroni, E., Xu, H., Alburqueque, E., and Demarcq, H. (2017). Use of nighttime visible images in the study of the spatial and temporal variability of fishing areas of jumbo flying squid (Dosidicus gigas) outside Peruvian EEZ 2004–2015. Fish. Res. 191, 144–153. doi: 10.1016/j.fishres.2017.03.009
Ren, Y., Li, X., and Xu, H. (2021). A deep learning model to extract ship size from sentinel-1 SAR images. IEEE Trans. Geosci. Remote Sens. 60, 1–14. doi: 10.1109/tgrs.2021.3063216
Saito, R., Sasaki, H., Yamada, H., Hiroe, Y., Inagake, D., and Saito, T. (2019). Development of a technique to estimate the horizontal distribution of lit fishing vessels in the East China Sea using satellite luminescence. Fish. Sci. 86, 13–25. doi: 10.1007/s12562-019-01370-8
Small, C., and Elvidge, C. D. (2011). Mapping decadal change in anthropogenic night light. Procedia Environ. Sci. 7, 353–358. doi: 10.1016/j.proenv.2011.07.061
Straka, W., Seaman, C., Baugh, K., Cole, K., Stevens, E., and Miller, S. (2015). Utilization of the Suomi national polar-orbiting partnership (NPP) visible infrared imaging radiometer suite (VIIRS) Day/Night band for arctic ship tracking and fisheries management. Remote Sens. 7, 971–989. doi: 10.3390/rs70100971
Sugisaki, H., and Kurita, Y. (2004). Daily rhythm and seasonal variation of feeding habit of Pacific saury (Cololabis saira) in relation to their migration and oceanographic conditions off Japan. Fish. Oceanogr. 13, 63–73.
Suyama, S., Sakurai, Y., and Shimazaki, K. (1996). Age and growth of pacific Saurey Cololabis saira (Brevoort) in the Western North Pacific Ocean estimated from daily Otolith growth increments. Fish. Sci. 62, 1–7. doi: 10.2331/fishsci.62.1
Syah, A. F., Saitoh, S.-I., Alabia, I. D., and Hirawake, T. (2016). Predicting potential fishing zones for Pacific saury (Cololabis saira) with maximum entropy models and remotely sensed data. Fish. Bull. 114, 330–342. doi: 10.7755/fb.114.3.6
Syarifudin, U., Salman, D., Ali, S. A., and Budimawan. (2017). Application of Viirs-Dnb satellite data to detect ship distribution patterns, fishing activity index and planning instrument of pelagic capture fisheries in bone bay waters. Int. J. Sci. Res. 6, 693–702. doi: 10.21275/ART20174216
Tian, H., Liu, Y., Tian, Y., Chen, G., Li, J., Liu, S., et al. (2018). “Detection of fishing boats in the Northwest Pacific using satellite nighttime image,” in Proceedings of the 2018 International Conference on Communication, Network and Artificial Intelligence. Lancaster: DEStech Publications.
Tian, S., Chen, X., Chen, Y., Xu, L., and Dai, X. (2009). Standardizing CPUE of Ommastrephes bartramii for Chinese squid-jigging fishery in Northwest Pacific Ocean. Chin. J. Oceanol. Limnol. 27, 729–739. doi: 10.1007/s00343-009-9199-7
Tian, Y., Akamine, T., and Suda, M. (2003). Variations in the abundance of pacific saury (Cololabis saira) from the northwestern pacific in relation to oceanic-climate changes. Fish. Res. 60, 439–454.
Tian, Y., Ueno, Y., Suda, M., and Akamine, T. (2004). Decadal variability in the abundance of Pacific saury and its response to climatic/oceanic regime shifts in the northwestern subtropical Pacific during the last half century. J. Mar. Syst. 52, 235–257. doi: 10.1016/j.jmarsys.2004.04.004
Tseng, C.-T., Sun, C.-L., Belkin, I. M., Yeh, S.-Z., Kuo, C.-L., and Liu, D.-C. (2014). Sea surface temperature fronts affect distribution of Pacific saury (Cololabis saira) in the Northwestern Pacific Ocean. Deep Sea Res. Part II Top. Stud. Oceanogr. 107, 15–21. doi: 10.1016/j.dsr2.2014.06.001
Wang, L., Ma, S., Liu, Y., Li, J., Liu, S., Lin, L., et al. (2021). Fluctuations in the abundance of chub mackerel in relation to climatic/oceanic regime shifts in the northwest Pacific Ocean since the 1970s. J. Mar. Syst. 218:103541. doi: 10.1016/j.jmarsys.2021.103541
Watanabe, C., and Yatsu, A. (2004). Effects of density-dependence and sea surface temperature on interannual variation in length-at-age of chub mackerel (Scomber japonicus) in the Kuroshio-Oyashio area during 1970–1997. Fish. Bull. 102, 196–206.
Watanabe, C., and Yatsu, A. (2006). Long-term changes in maturity at age of chub mackerel (Scomber japonicus) in relation to population declines in the waters off northeastern Japan. Fish. Res. 78, 323–332. doi: 10.1016/j.fishres.2006.01.001
Watanabe, T. (1970). Morphology and ecology of early stages of life in Japanese common mackerel, Scomber japonicus HOUTTUYN, with special reference to fluctuation of population. Bull. Tokai Reg. Fish. Res. Lab. 62, 1–283. (in Japanese with English abstract),
Yamaguchi, T., Asanuma, I., Park, J. G., Mackin, K. J., and Mittleman, J. (2016). “Estimation of vessel traffic density from Suomi NPP VIIRS daynight band,” in Proceedings of the OCEANS 2016 MTS/IEEE Monterey, (Piscataway, NJ: IEEE).
Yasuda, I. (2003). Hydrographic structure and variability in the KuroshioOyashio Transition area. J. Oceanogr. 59, 389–402.
Yatsu, A., Midorikawa, S., Shimada, T., and Uozumi, Y. (1997). Age and growth of the neon flying squid, Ommastrephes bartramii, in the North Pacific Ocean. Fish. Res. 29, 257–270.
Yu, W., Chen, X., Yi, Q., and Chen, Y. (2016). Spatio-temporal distributions and habitat hotspots of the winter–spring cohort of neon flying squid Ommastrephes bartramii in relation to oceanographic conditions in the Northwest Pacific Ocean. Fish. Res. 175, 103–115. doi: 10.1016/j.fishres.2015.11.026
Yu, W., Wen, J., Zhang, Z., Chen, X., and Zhang, Y. (2020). Spatio-temporal variations in the potential habitat of a pelagic commercial squid. J. Mar. Syst. 206:103339. doi: 10.1016/j.jmarsys.2020.103339
Yukami, R., NishidCa, H., Isu, S., Watanabe, C., Kamimura, Y., and Hashimoto, M. (2018). “Stock assessment and evaluation for Pacific stock of chub mackerel (fiscal year 2017/2018),” in Marine Fisheries Stock Assessment and Evaluation for Japanese Waters (Fiscal Year 2017/2018), (Tokyo: Fisheries Agency and Fisheries Research Agency of Japan), 163–208. (in Japanese).
Keywords: satellite remote sensing, fishing vessels identification, spatiotemporal variation, marine environment, fishery resources management, northwest Pacific Ocean
Citation: Tian H, Liu Y, Tian Y, Alabia ID, Qin Y, Sun H, Li J, Ma S and Saitoh S-I (2022) A Comprehensive Monitoring and Assessment System for Multiple Fisheries Resources in the Northwest Pacific Based on Satellite Remote Sensing Technology. Front. Mar. Sci. 9:808282. doi: 10.3389/fmars.2022.808282
Received: 03 November 2021; Accepted: 21 January 2022;
Published: 11 February 2022.
Edited by:
Huang Wei, Second Institute of Oceanography, Ministry of Natural Resources, ChinaReviewed by:
Nan-Jay Su, National Taiwan Ocean University, TaiwanCopyright © 2022 Tian, Liu, Tian, Alabia, Qin, Sun, Li, Ma and Saitoh. This is an open-access article distributed under the terms of the Creative Commons Attribution License (CC BY). The use, distribution or reproduction in other forums is permitted, provided the original author(s) and the copyright owner(s) are credited and that the original publication in this journal is cited, in accordance with accepted academic practice. No use, distribution or reproduction is permitted which does not comply with these terms.
*Correspondence: Yang Liu, WWFuZ2xpdTMxNUBvdWMuZWR1LmNu
Disclaimer: All claims expressed in this article are solely those of the authors and do not necessarily represent those of their affiliated organizations, or those of the publisher, the editors and the reviewers. Any product that may be evaluated in this article or claim that may be made by its manufacturer is not guaranteed or endorsed by the publisher.
Research integrity at Frontiers
Learn more about the work of our research integrity team to safeguard the quality of each article we publish.