 Tingting Han1
 Zhanhui Qi
 Rongjun Shi
 Honghui Huang
95% of researchers rate our articles as excellent or good
Learn more about the work of our research integrity team to safeguard the quality of each article we publish.
Find out more
ORIGINAL RESEARCH article
Front. Mar. Sci. , 01 March 2022
Sec. Aquatic Physiology
Volume 9 - 2022 | https://doi.org/10.3389/fmars.2022.806848
This article is part of the Research Topic The Physiological and Molecular Response of Aquatic Animals to Environmental Stresses View all 23 articles
Creseis acicula is a swimming shelled pteropod species, widely distributed in the world’s oceans. In 2020, an unprecedented bloom of C. acicula was observed in Daya Bay, and lasted from June to July. To date, there is very limited information on the physiological characteristics of this species, which is essential to understand bloom dynamics. In the present study, the physiological performances of C. acicula in response to temperature (17–35°C) and salinity (18–38 ppt) were investigated. The oxygen consumption (OCR) and calcification rates (CR) of C. acicula peaked at 32 and 26°C, respectively, while ammonia excretion rate (AER) significantly increased with increasing temperature. The thermal coefficient Q10 (respiration) of C. acicula dropped to a minimum value between 32 and 35°C, suggesting that they were in a stressful status. The O:N ratio ranged from 3.24 to 5.13, indicating that protein was the major catabolism substrate. Temperature exerted a stronger effect on the OCR and AER of C. acicula. Salinity has a more influence on CR. The preferable temperature for C. acicula ranges from 29 to 32°C, and the preferable salinity ranges from 28 to 33 ppt. Based on a comprehensive consideration, we presumed that the warmer seawater temperature around the thermal discharge area of Daya Bay nuclear power plant is a possible cause for the bloom of C. acicula.
Creseis acicula belongs to the Pteropoda order, Cavoliniidae family, and Creseis genus. This pteropod is the largest in the Creseis genus. C. acicula lives in the upper portion of the water column (less than 500 m), and is abundant in the Atlantic, Indian, and Pacific Oceans (Albergoni, 1975). The temporal dynamics and spatial distribution patterns of pteropods are well studied. C. acicula outbreaks have been reported in the coastal waters of India (Sakthivel and Haridas, 1974; Peter and Paulinose, 1978; Pillai and Rodrigo, 1984; Naomi, 1988), Japan (Nishimura, 1965; Morioka, 1980), Gulf of Mexico (Hutton, 1960), and in the Mediterranean Sea (Burgi and Devos, 1962; Albergoni, 1975; Kokelj et al., 1994) between the 1960s and the 1990s, with the highest abundance recorded at about 500 inds m–3. In Daya Bay, South China Sea, C. acicula generally appear from March to November each year, with average abundances ranging from 0.04 to 1.9 inds m–3 (Xu, 1989). Since the 1990s, there was no report of C. acicula bloom in the world. However, a massive aggregation occurred from June to July 2020 near the thermal discharge area of Daya Bay Nuclear Power Plant (DNPP), with the highest abundance reaching 4525–5595 inds m–3 (Dai et al., 2020; Zhong et al., 2021). Large amount of C. acicula gathered around the thermal discharge area of DNPP and seriously affected the normal operation of the plant.
The outbreak mechanism of C. acicula is very complex, like any other species (Wishner et al., 1995; Baliarsingh et al., 2020; Maas et al., 2020). The distribution of C. acicula is restricted by various physical and chemical environmental parameters, such as temperature, salinity, food, oxygen, and water depth (Herman, 1998; Dai et al., 2020; Zeng et al., 2021). The potential mechanisms for the bloom of C. acicula include optimum temperature and salinity (or the temperature and salinity are not at the most optimal levels for C. acicula, but they might be worse for the competitors or predators of C. acicula) and an adequate food supply for C. acicula. As Dai et al. (2020) suggested that the initiation of C. acicula bloom in Daya Bay well-matched a sharp increase of temperature and chlorophyll a, as well as an abrupt decrease of salinity attributed to a heavy rainfall happened before the bloom which lasted for more than 20 days. However, till now, there is very little information on the causes of C. acicula blooms from a physiological point of view. A further understanding of the physiological mechanisms regulating the blooms will contribute to our knowledge of the survival tolerance of this species.
The objective of the present study was to investigate the effects of temperature and salinity on the physiological responses of C. acicula, and to provide the useful information on the outbreak reasons of C. acicula around the thermal discharge area of DNPP.
Experimental C. acicula samples were collected on July 6, 2020, in Daya Bay, which is located in the northern part of the South China Sea in Guangdong Province, Southern China (Figure 1). It is a semi-enclosed drowned valley bay with water depth ranging from 5 to 20 m and a water area of about 600 km2. More than 50 islands locate inside the bay area. The DNPP base was built in 1994 on the southwestern shore of Daya Bay, which is located on Dapeng Peninsula, Dapeng New District, Shenzhen city, Guangdong Province (Figure 1). The bay is dominated by an irregular semidiurnal tide with a narrow tidal range, which affects the transport of thermal discharge (Jiang and Wang, 2020). On June 12, 2020, a large amount of C. acicula was spotted in the waters close to the southwestern shore of Daya Bay.
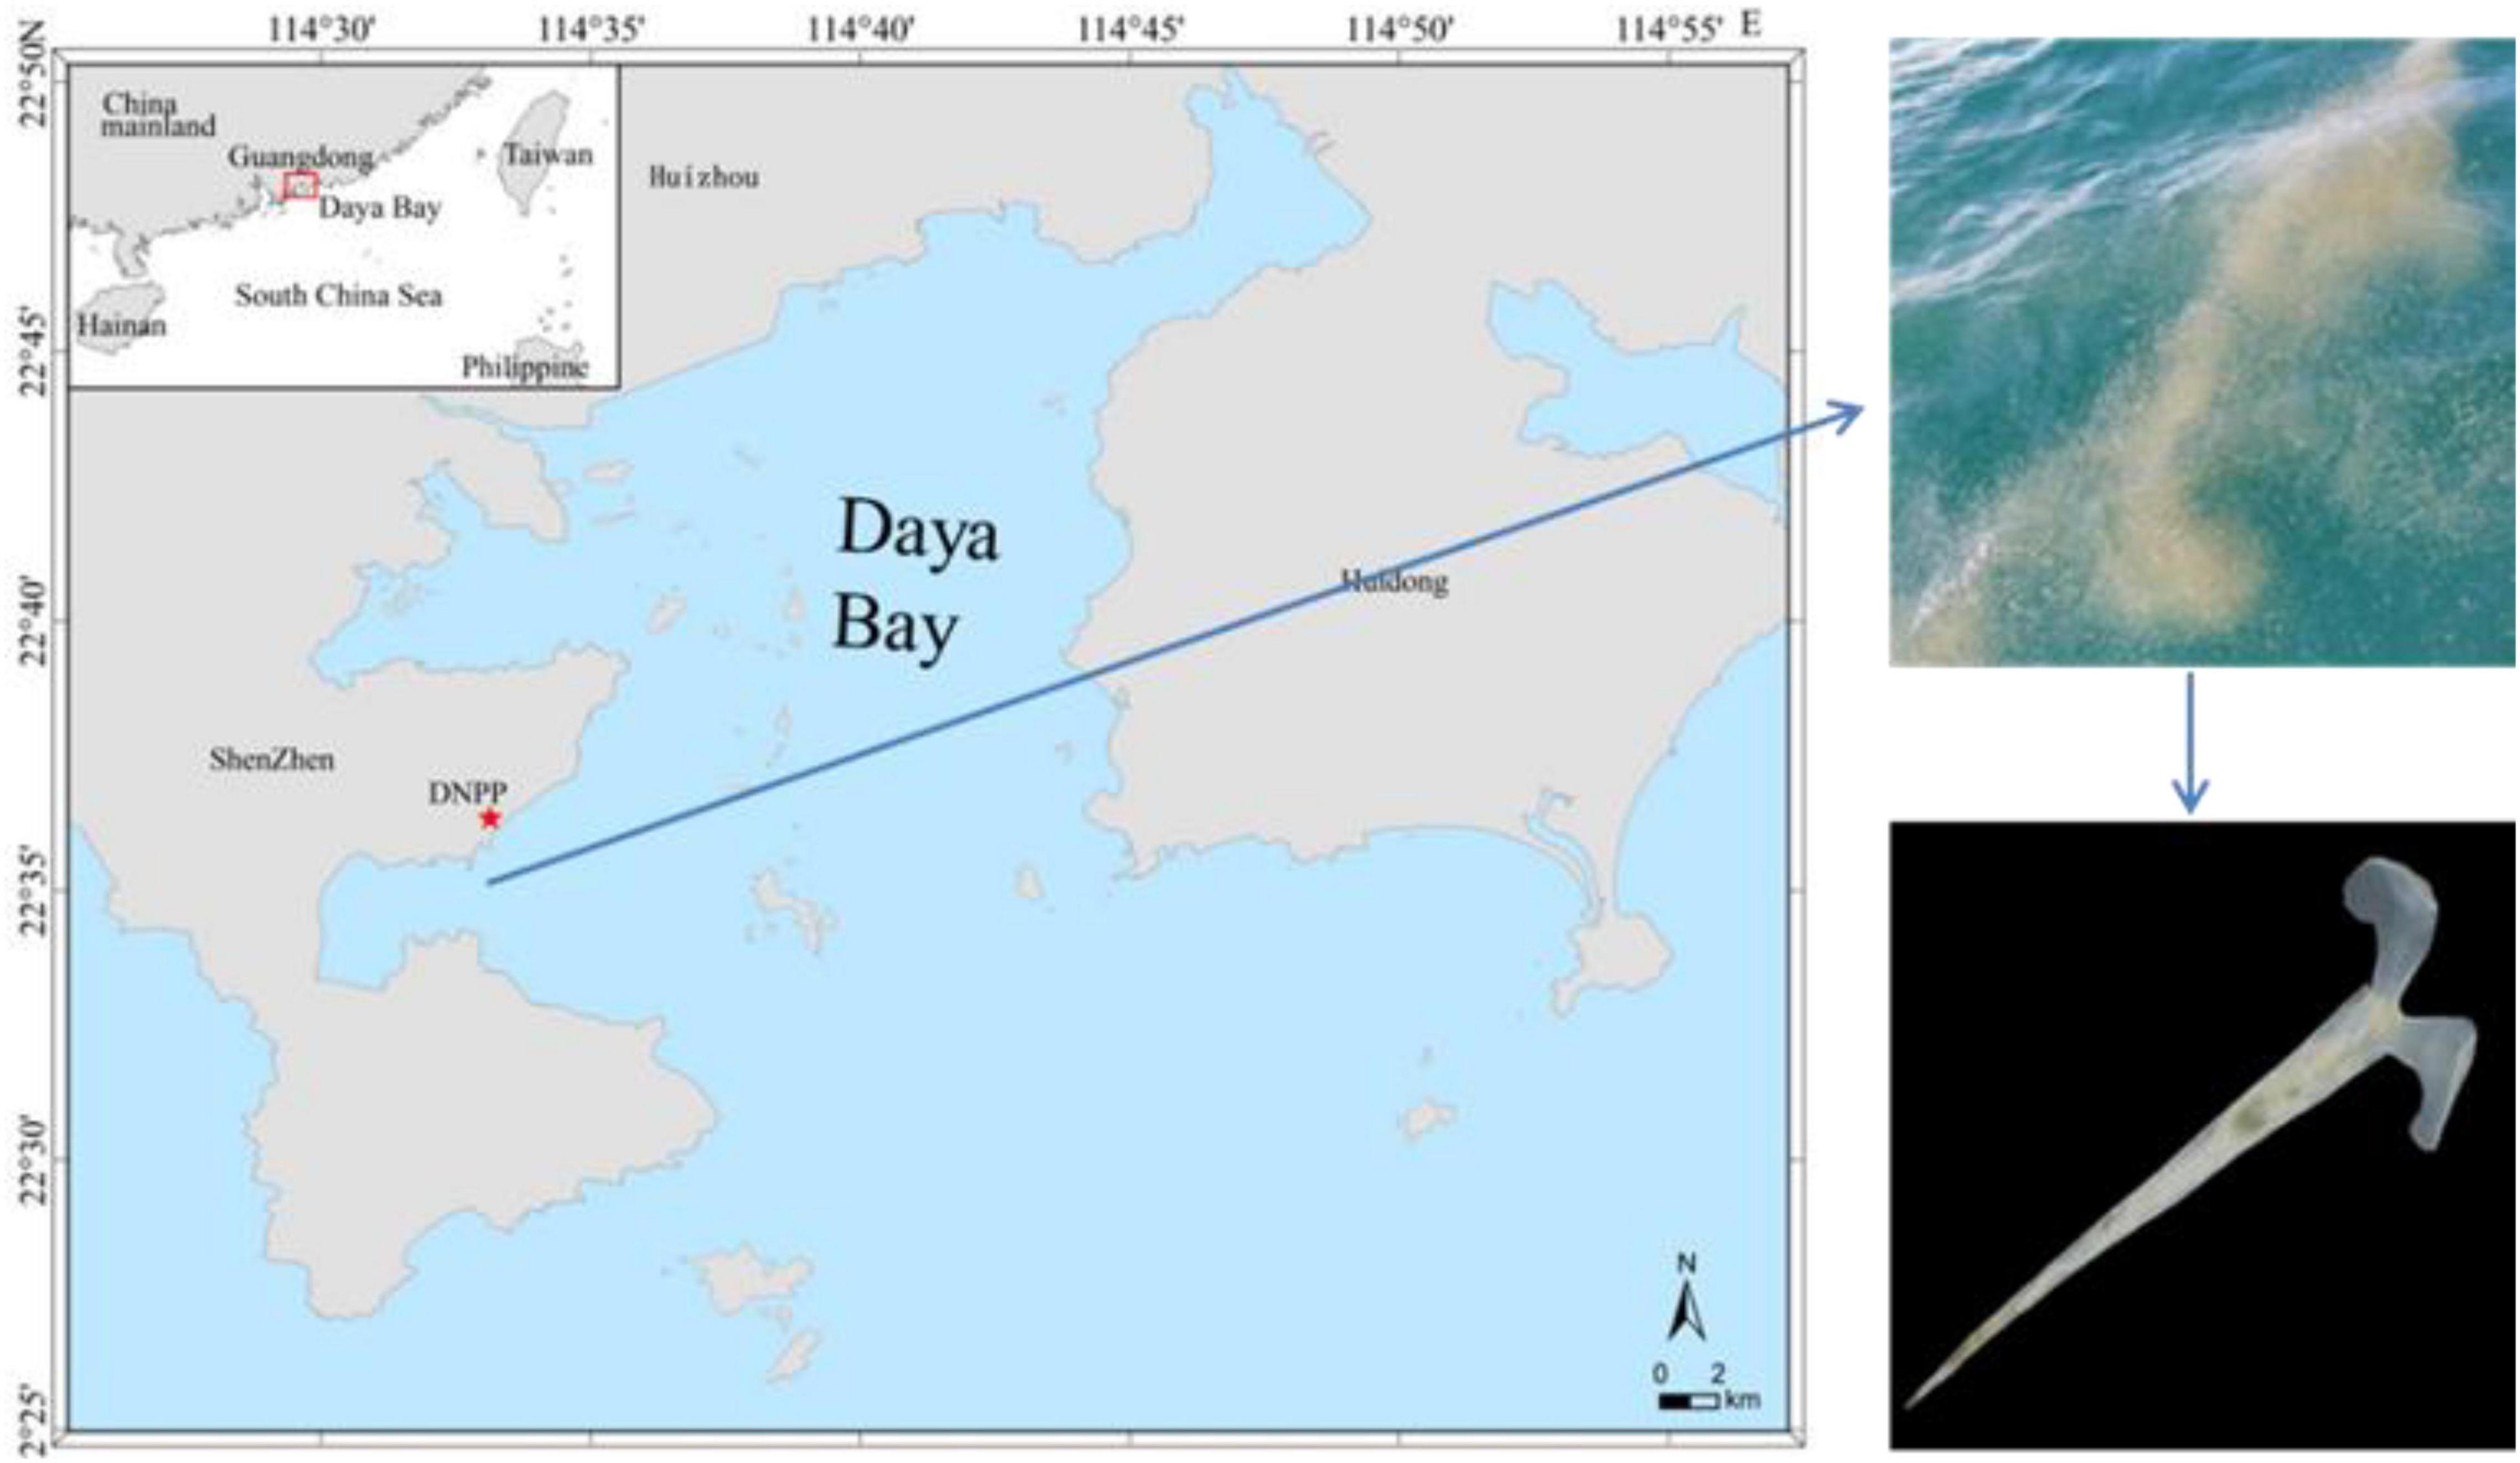
Figure 1. Sampling sites of Creseis acicula nearby the Daya Bay nuclear power plant (DNPP).
During sampling, the average seawater temperature was 30.92 ± 0.86°C and the average salinity was 32.36 ± 0.38 ppt. Experimental C. acicula were at their mature stage as ovulating phenomenon was observed. They were collected using a bucket with water to avoid possible stress of capture. Specimens were placed in a 100-L container and were transported to the laboratory at the Marine Biology Experimental Base, located on the Daya Bay seafront, within 1 h of capture. Before the start of experiments, C. acicula samples were acclimated to laboratory conditions for 2 days. In Daya Bay, C. acicula mostly appears from March to November each year (Xu, 1989), when the average seawater temperature and salinity are 26.97 ± 2.85°C and 33.14 ± 1.10 ppt, respectively (unpublished data). Thus, during acclimation, pteropods were transferred into 40-L transparent glass bottles filled with sand-filtered seawater (to a density of ca. 1000 pteropods per bottle), at a temperature of 26°C and salinity of 33 ppt, bubbled with ambient air. C. acicula were fed once daily with a mixture of the chlorophyte Chlorella vulgaris and the diatom Skeketonema costatum, with an equal algal cell density of 40,000 cells mL–1 at 08:00.
Oxygen consumption rate (OCR), ammonia excretion rate (AER), and calcification rate (CR) were measured using a closed-chamber method, as described in Ikeda et al. (2000). Brown respiration bottles (1-L vol.) were used for incubation experiments. Seven graded temperatures (i.e., 17, 20, 23, 26, 29, 32, and 35°C, respectively), and five graded salinities (i.e., 18, 23, 28, 33, and 38 ppt, respectively) were set to determine the effects of these two environmental factors on physiological responses. The incubation water temperature was gradually decreased or increased to each experimental value in a 5-h period by an automatic temperature controller. Water salinity was also gradually decreased or increased within a 5-h period to each experimental value by adding freshwater or artificial sea salt to natural seawater, respectively.
Pre-experiments were conducted to make sure that at the end of incubation, the oxygen concentration must be kept at a high level–at no less than 50% of the initial concentration–in order to avoid any possible hypoxia stress on the normal physiological activities of C. acicula. The incubation time and density of C. acicula in each respiration bottle were determined accordingly. The optimum number of C. acicula was determined as 100 individuals per bottle. The optimum incubation duration was 8 h. Healthy (actively moving) individuals with similar size (8–9 mm of shell length) were selected for the subsequent experiments. Prior to the experiments, C. acicula were not fed for 24 h to allow for gut clearance and avoid interference from post-prandial metabolism and excretion of feces. The experimental C. acicula were rinsed 3–4 times with filtered seawater (using Whatman GF/F filters), and then were transferred into respiration bottles. The respiration bottles were submerged and incubated in a water bath to maintain an identical ambient temperature for all of them.
Experimental C. acicula were incubated in respiration bottles (100 individuals per bottle), and were further assigned to the seven temperature treatments and the five salinity treatments.
For the temperature experiment, the bottles were filled with filtered seawater (using Whatman GF/F filters) and were left open for 24 h to obtain the air-sea equilibrium of the CO2-carbonate system. Each temperature treatment has six bottles (three for treatment group and three for control). Bottles were capped and submerged in water with corresponding experimental water temperature. In each temperature treatment, three bottles filled with filtered seawater and without pteropods served as respective controls. For the salinity experiment, all the bottles were submerged in a water bath at a temperature of 26°C.
At the end of the incubation period, dissolved oxygen (DO) was measured with an optical DO meter (YSI Pro, Yellow Springs Instrument Company, Yellow Springs, OH, United States), and pH was measured using a pH meter (Thermo Scientific Orion 320P-01, Thermo Fisher Scientific, Waltham, MA, United States). Then, 100 mL of water samples was siphoned out to measure ammonia (through the oxidizing reaction of sodium hypobromite, GB/T 12763.4-2007, 2007), and total alkalinity (TA) (Gran titration with 0.1 M HCl using an alkalinity titrator, AS-ALK2 Total Alkalinity Titration System, Apollo, United States). For each bottle, these parameters were measured in triplicates. Calcium carbonate (CaCO3) saturation for aragonite (Ωa) was obtained from water temperature, salinity, pH, and TA using the CO2_SYS_XLS calculation program (Pierrot et al., 2006). The wet weights of the pteropods were estimated through weighting the 100 residual individuals, similar with the experimental samples, after blotting dry, and this weighting repeated 6 times to acquire the mean wet weight of 100 pteropods.
The OCR (μmol O2 g–1 h–1), AER (μmol N g–1 h–1) and CR (μmol g–1 h–1) of the C. acicula samples were calculated as follows:
OCR = (DO0 − DOt) × V/W/t
AER = (At − A0) × V/W/t
CR = (TA0 − TAt) × V/2/W/t
where DO0, A0, and TA0 are the oxygen, ammonia, and total alkalinity concentrations (μmol L–1) of the control bottle after incubation, respectively; DOt, At, and TAt are the oxygen, ammonia, and total alkalinity concentrations (μmol L–1) of the treatment bottle after incubation, respectively; V is the bottle volume (L); W is the total wet weight of the pteropods in each bottle (g); and t is the duration of the experiment (h).
Thermal coefficients (Q10) were calculated using the following the equation (Bayne and Newell, 1983):
where R1 and R2 are the corresponding metabolic rates (OCR or AER) at temperatures t1 and t2, respectively.
The O:N ratio indicated the ratio of proteins, lipids, and carbohydrates that were used as energy substrates by the organisms under different experimental conditions, and it was estimated for the tested pteropods in each bottle based on the OCR and AER, in atomic equivalents (Yu et al., 2018).
Statistical analyses were conducted using SPSS 19.0 for Windows (IBM Corp., Armonk, NY, United States). The values of OCR, AER, CR, Q10, and O:N ratio in all experimental groups were analyzed using one-way ANOVA, followed by a comparison of means through the Tukey test. Prior to conducting statistical analyses, the normality and homogeneity of variance of all data were examined using the Shapiro–Wilk test and Levene’s test, respectively. The effects of temperature and salinity on OCR, AER, CR, and O:N ratio were tested using stepwise multiple regression analysis. Statistical significance was set at P < 0.05.
At the end of the incubation, the survival rates of C. acicula were > 90% for the 17, 20, 23, 26, 29, and 32°C treatments, and the 28, 33, and 38 ppt treatments. The survival rate of C. acicula was ∼50% for the 23 ppt treatment. Unfortunately, no C. acicula survived in the 35°C and 18 ppt treatments. The survival results suggest that C. acicula can tolerate a temperature range between 17 and 32°C and a salinity range between 23 and 38 ppt.
The OCR of C. acicula significantly increased with temperature and salinity values of 32°C and 28 ppt, respectively, and decreased thereafter [one-way ANOVA, temperature: F(6,20) = 80.112, P < 0.05; salinity: F(4,14) = 5.906, P < 0.05; Figure 2]. The rate differed significantly among all temperatures (Tukey test, P < 0.05), except between 29 and 35°C. OCR significantly increased at 28 ppt compared to the values observed at the lowest (18 ppt) and highest (38 ppt) salinities tested, respectively (Tukey test, P < 0.05). But there was no significant difference of OCR within the 23–33 ppt range (Tukey test, P > 0.05).
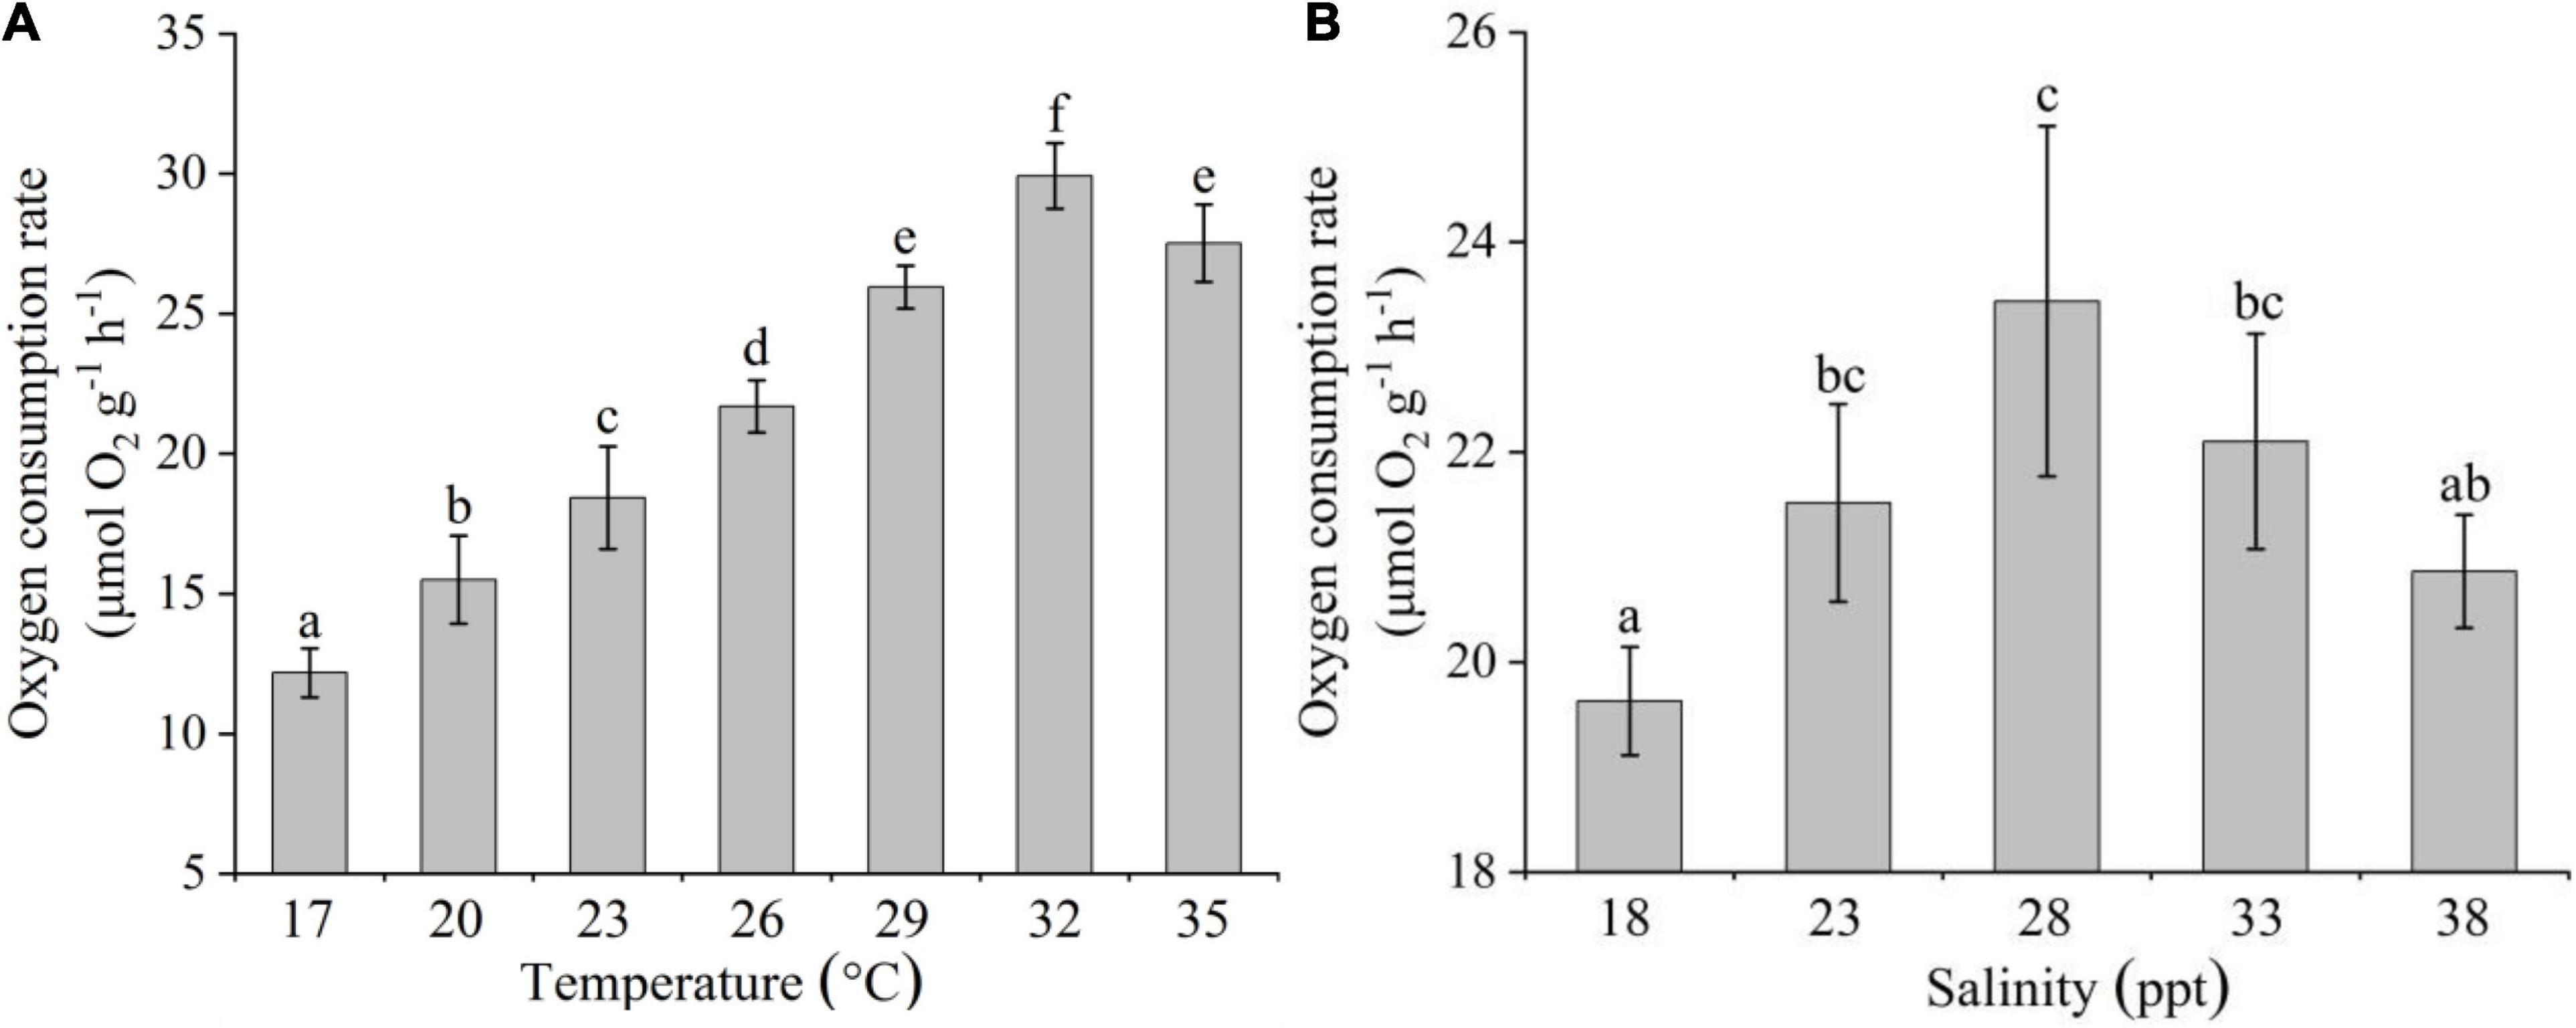
Figure 2. Effects of temperature (A) and salinity (B) on the oxygen consumption rate of Creseis acicula. Bars denote standard deviation. Different superscripts indicate significance (P < 0.05) among the different temperature and salinity treatments, respectively.
Stepwise multiple regression analysis explained 86.6% of the variation in the OCR of C. acicula [F(1,35) = 114.563, R2-adjusted = 0.866]. This regression analysis also showed that temperature was significantly correlated (P < 0.05) with the OCR, but salinity was not (P > 0.05). The coefficients of temperature and salinity were assumed as 0.980 and 0.051, respectively. The overall regression analysis results illustrate that the OCR of C. acicula was more influenced by temperature than by salinity.
AER increased significantly as temperature increased within the 17–35°C range [one-way ANOVA, F(6,20) = 48.311, P < 0.05]. It increased by 70% at the highest temperature (35°C) in comparison with the value at the lowest temperature (17°C) (Figure 3A). Although AER decreased gradually with salinity up to 33 ppt, and then increased slightly at 38 ppt [one-way ANOVA, F(4,14) = 1.105, P < 0.05], there was no significant difference among any of salinities (Tukey test, P > 0.05; Figure 3B).
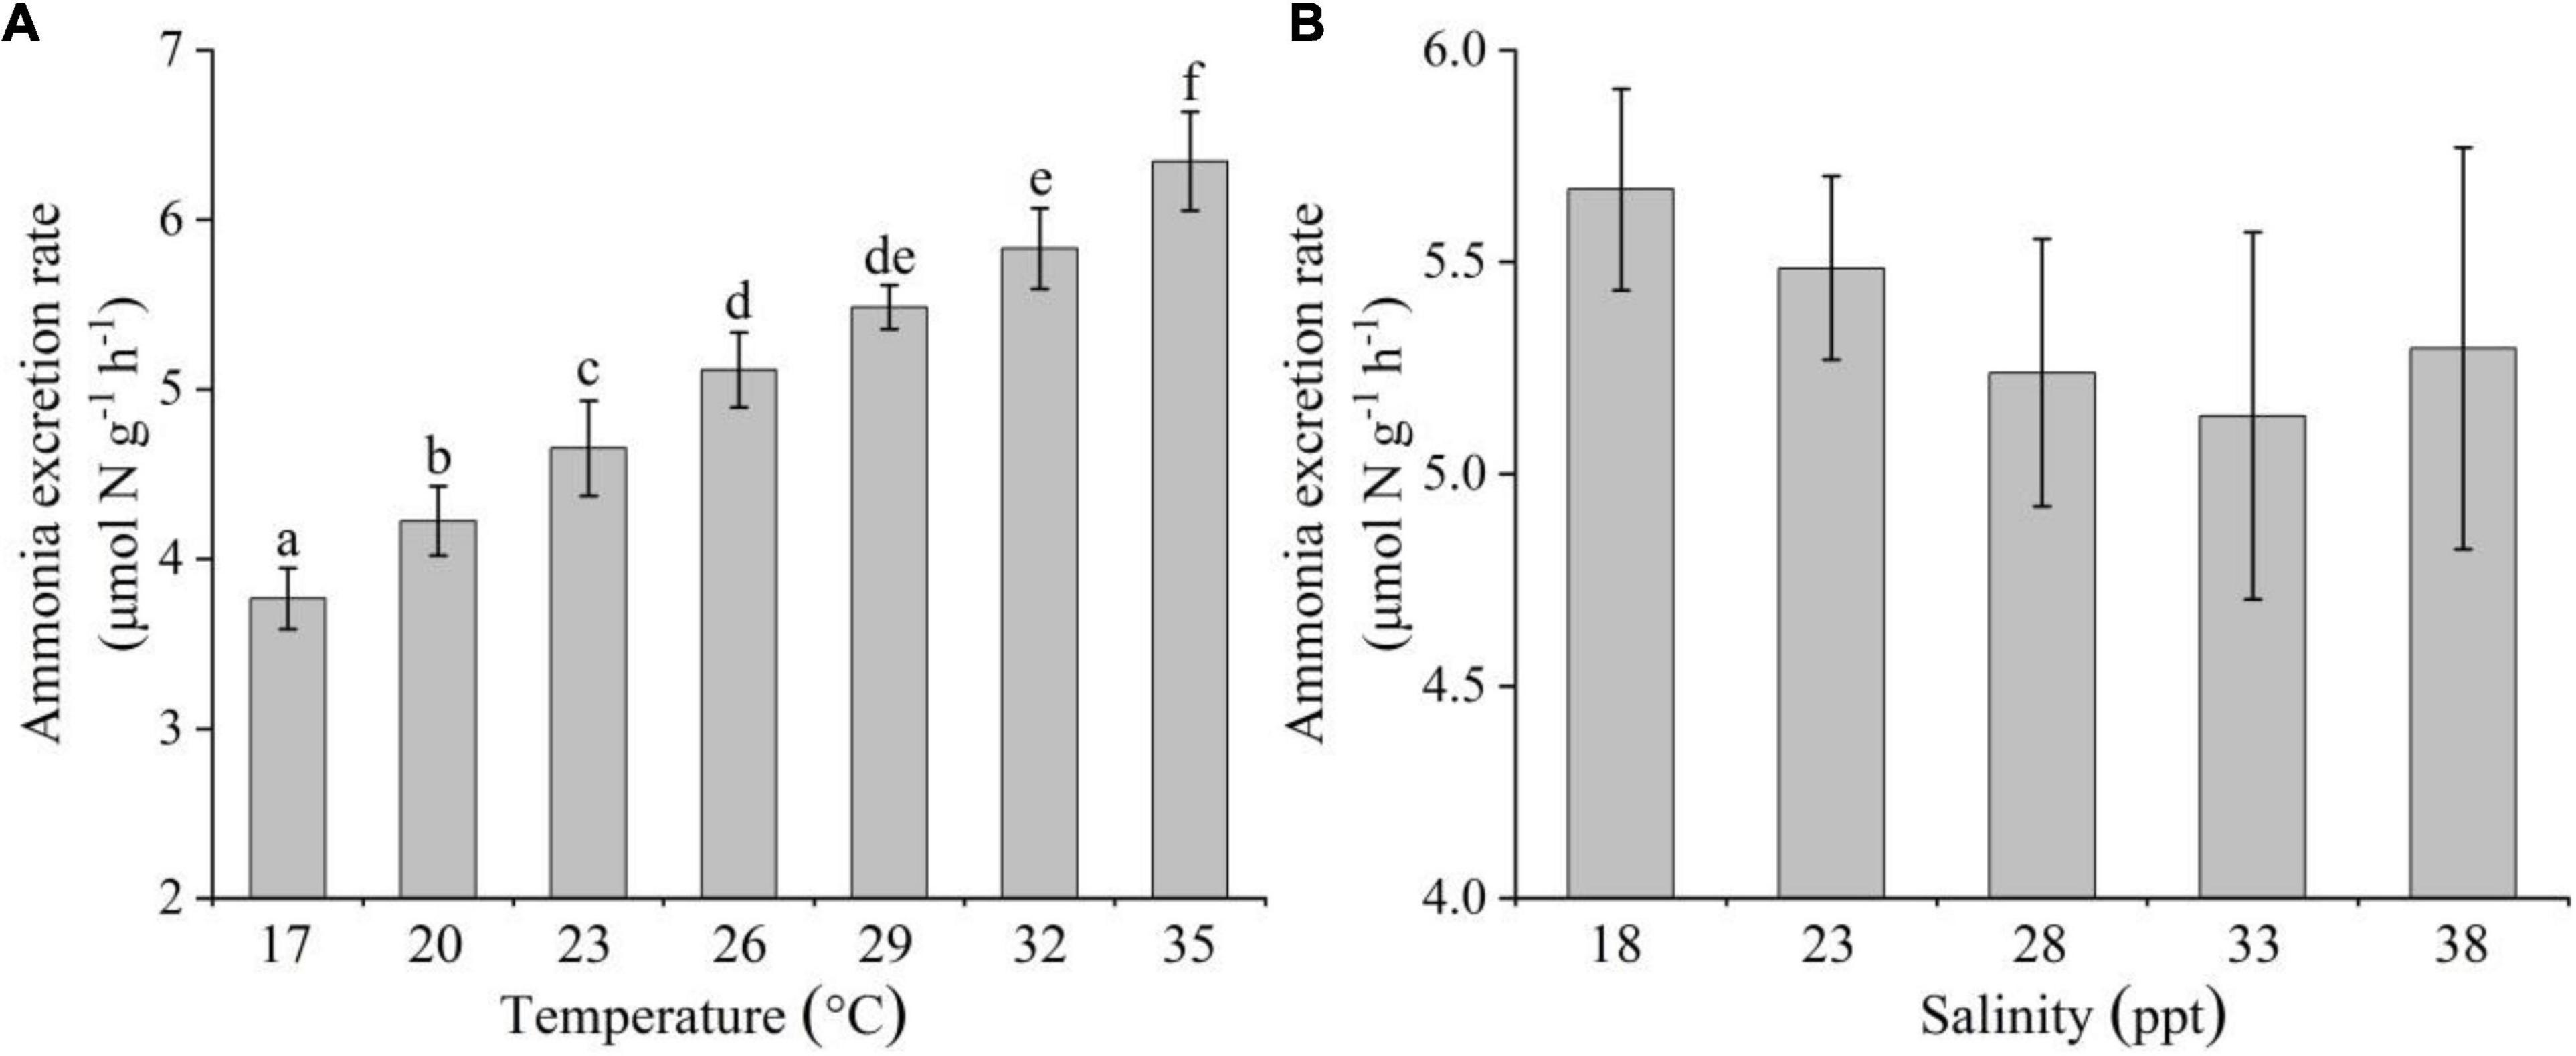
Figure 3. Effects of temperature (A) and salinity (B) on the ammonia excretion rate of Creseis acicula. Bars denote standard deviation. Different superscripts indicate significance (P < 0.05) among the different temperature and salinity treatments, respectively.
Stepwise multiple regression analysis explained 85.9% of the variation in the AER of C. acicula [F(1,35) = 107.682, R2-adjusted = 0.859]. Both temperature and salinity were statistically significant (P < 0.05). The coefficients of temperature and salinity were assumed as 0.140 and −0.031, respectively, which showed that AER was also more influenced by temperature than by salinity.
The CR of C. acicula firstly increased with increasing temperature and salinity, with the highest values at 26°C and 33 ppt, respectively, and decreased thereafter [one-way ANOVA, temperature: F(6,20) = 26.781, P < 0.05; salinity: F(4,14) = 36.229, P < 0.05; Figure 4]. The CR values at 20–29°C were significantly higher than those at 32–35°C (Tukey test, P < 0.05); at 28–38 ppt, CR values were significantly higher than those at 18–23 ppt (Tukey test, P < 0.05). Negative CR values were detected at 35°C, and 18 and 23 ppt. No significant difference in CR was found within the 20–29°C and 28–38 ppt ranges (Tukey test, P > 0.05).
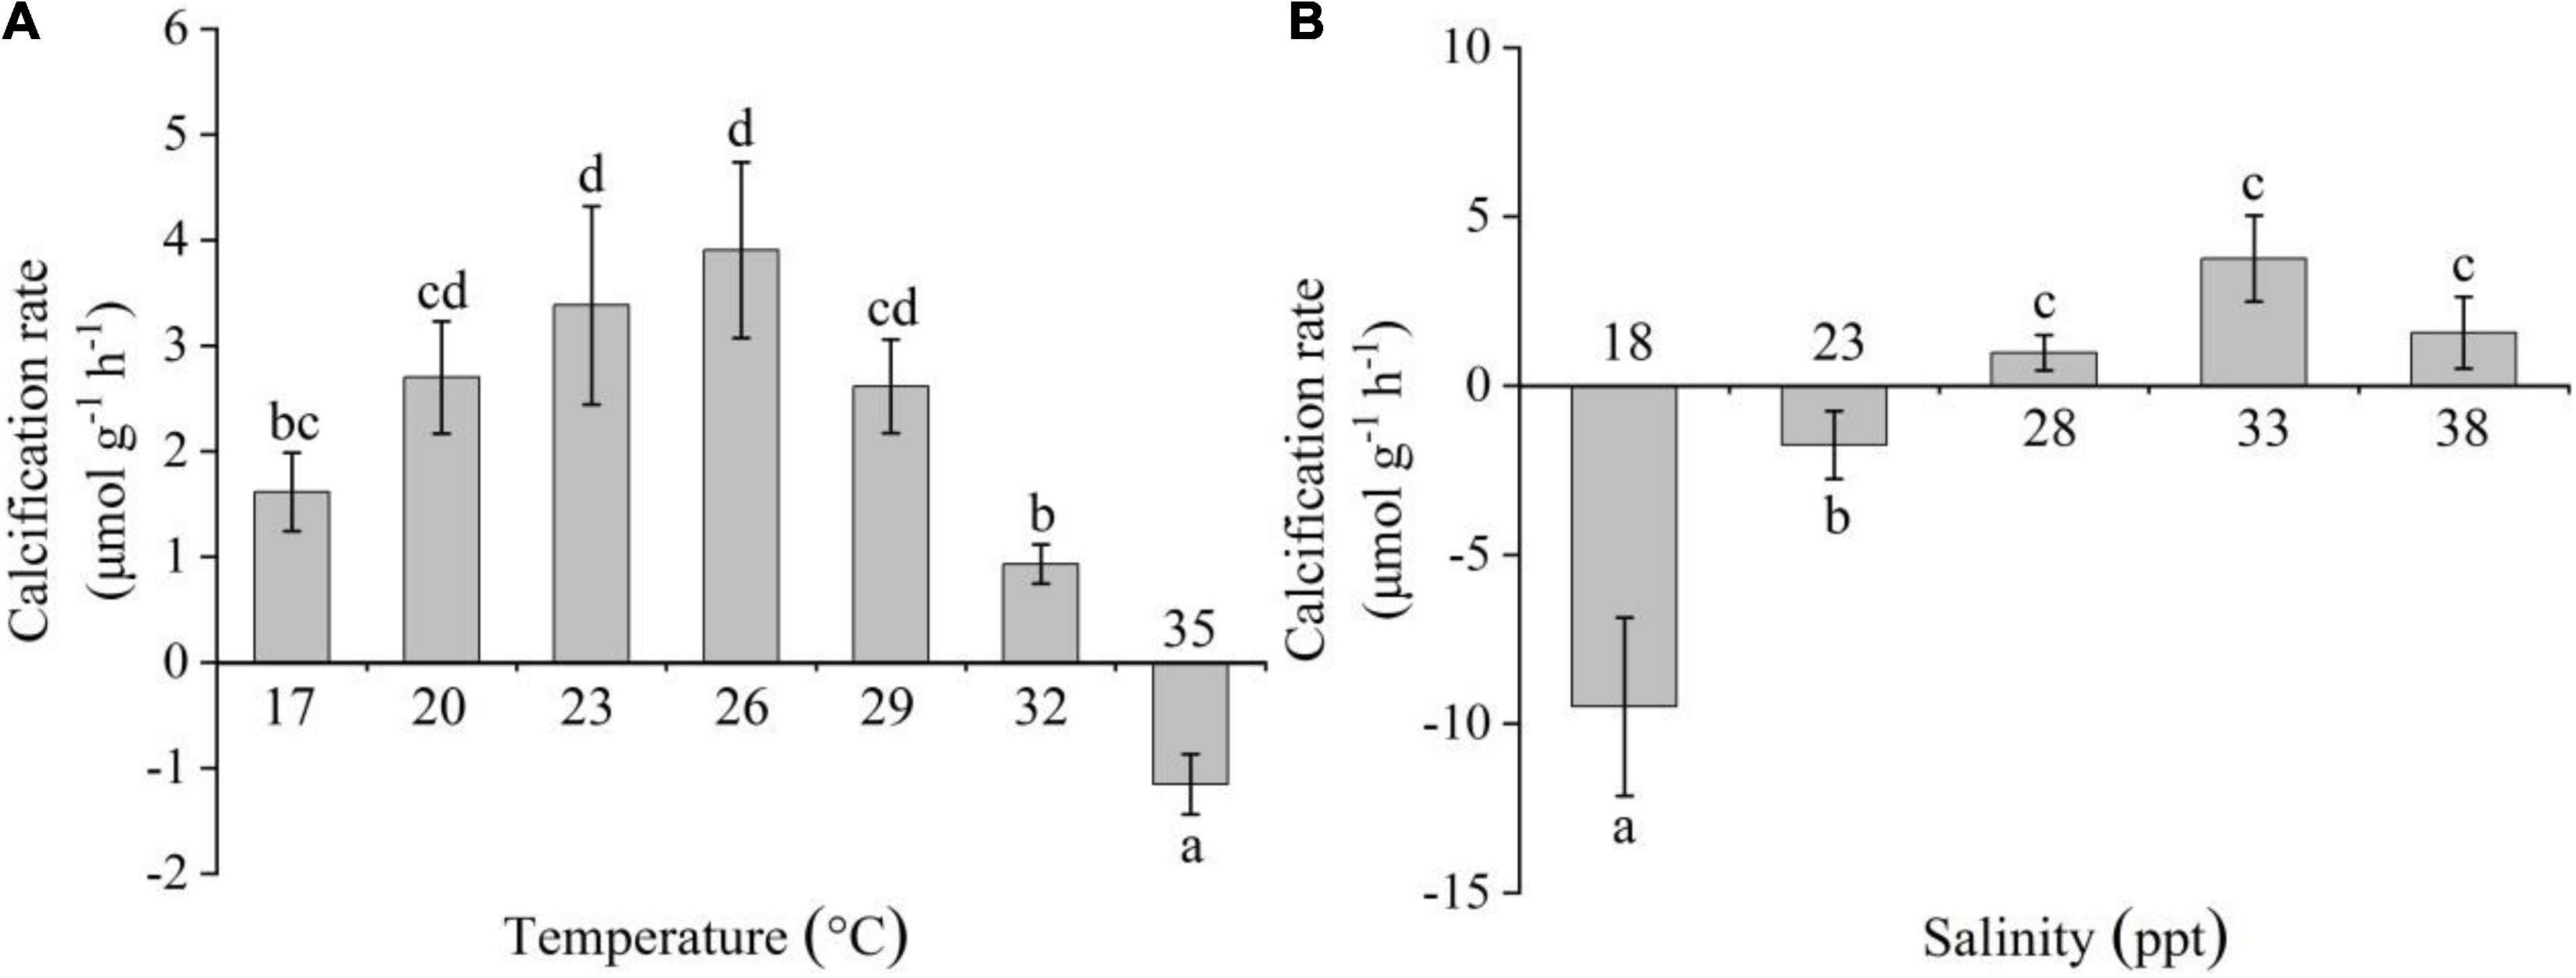
Figure 4. Effects of temperature (A) and salinity (B) on the calcification rate of Creseis acicula. Bars denote standard deviation. Different superscripts indicate significance (P < 0.05) among the different temperature and salinity treatments, respectively.
Stepwise multiple regression analysis explained 66.2% of the variation in the CR of C. acicula [F(1,35) = 35.326, R2-adjusted = 0.662]. The regression analysis showed that salinity was significantly correlated with CR (P < 0.05), but temperature was not (P > 0.05). The coefficients of temperature and salinity were −0.150 and 0.563, respectively. In C. acicula, CR was more influenced by salinity than by temperature.
The O:N ratio of C. acicula ranged from 3.24 to 5.13; it increased significantly as temperature increased from 17 to 32°C, and then it significantly decreased at 35°C [one-way ANOVA, F(6,20) = 33.789, P < 0.05; Tukey test, P < 0.05; Figure 5A]. And the ratio also showed a significant difference among the salinities [one-way ANOVA, F(4,14) = 5.947, P < 0.05; Figure 5B]. It initially increased with increasing salinity, with the highest values detected at 28 and 33 ppt, and it decreased at 38 ppt. There was no significant difference within the 23–38 ppt range (Tukey test, P > 0.05), but the ratio at 18 ppt was significantly lower than that at 28 and 33 ppt (Tukey test, P < 0.05).
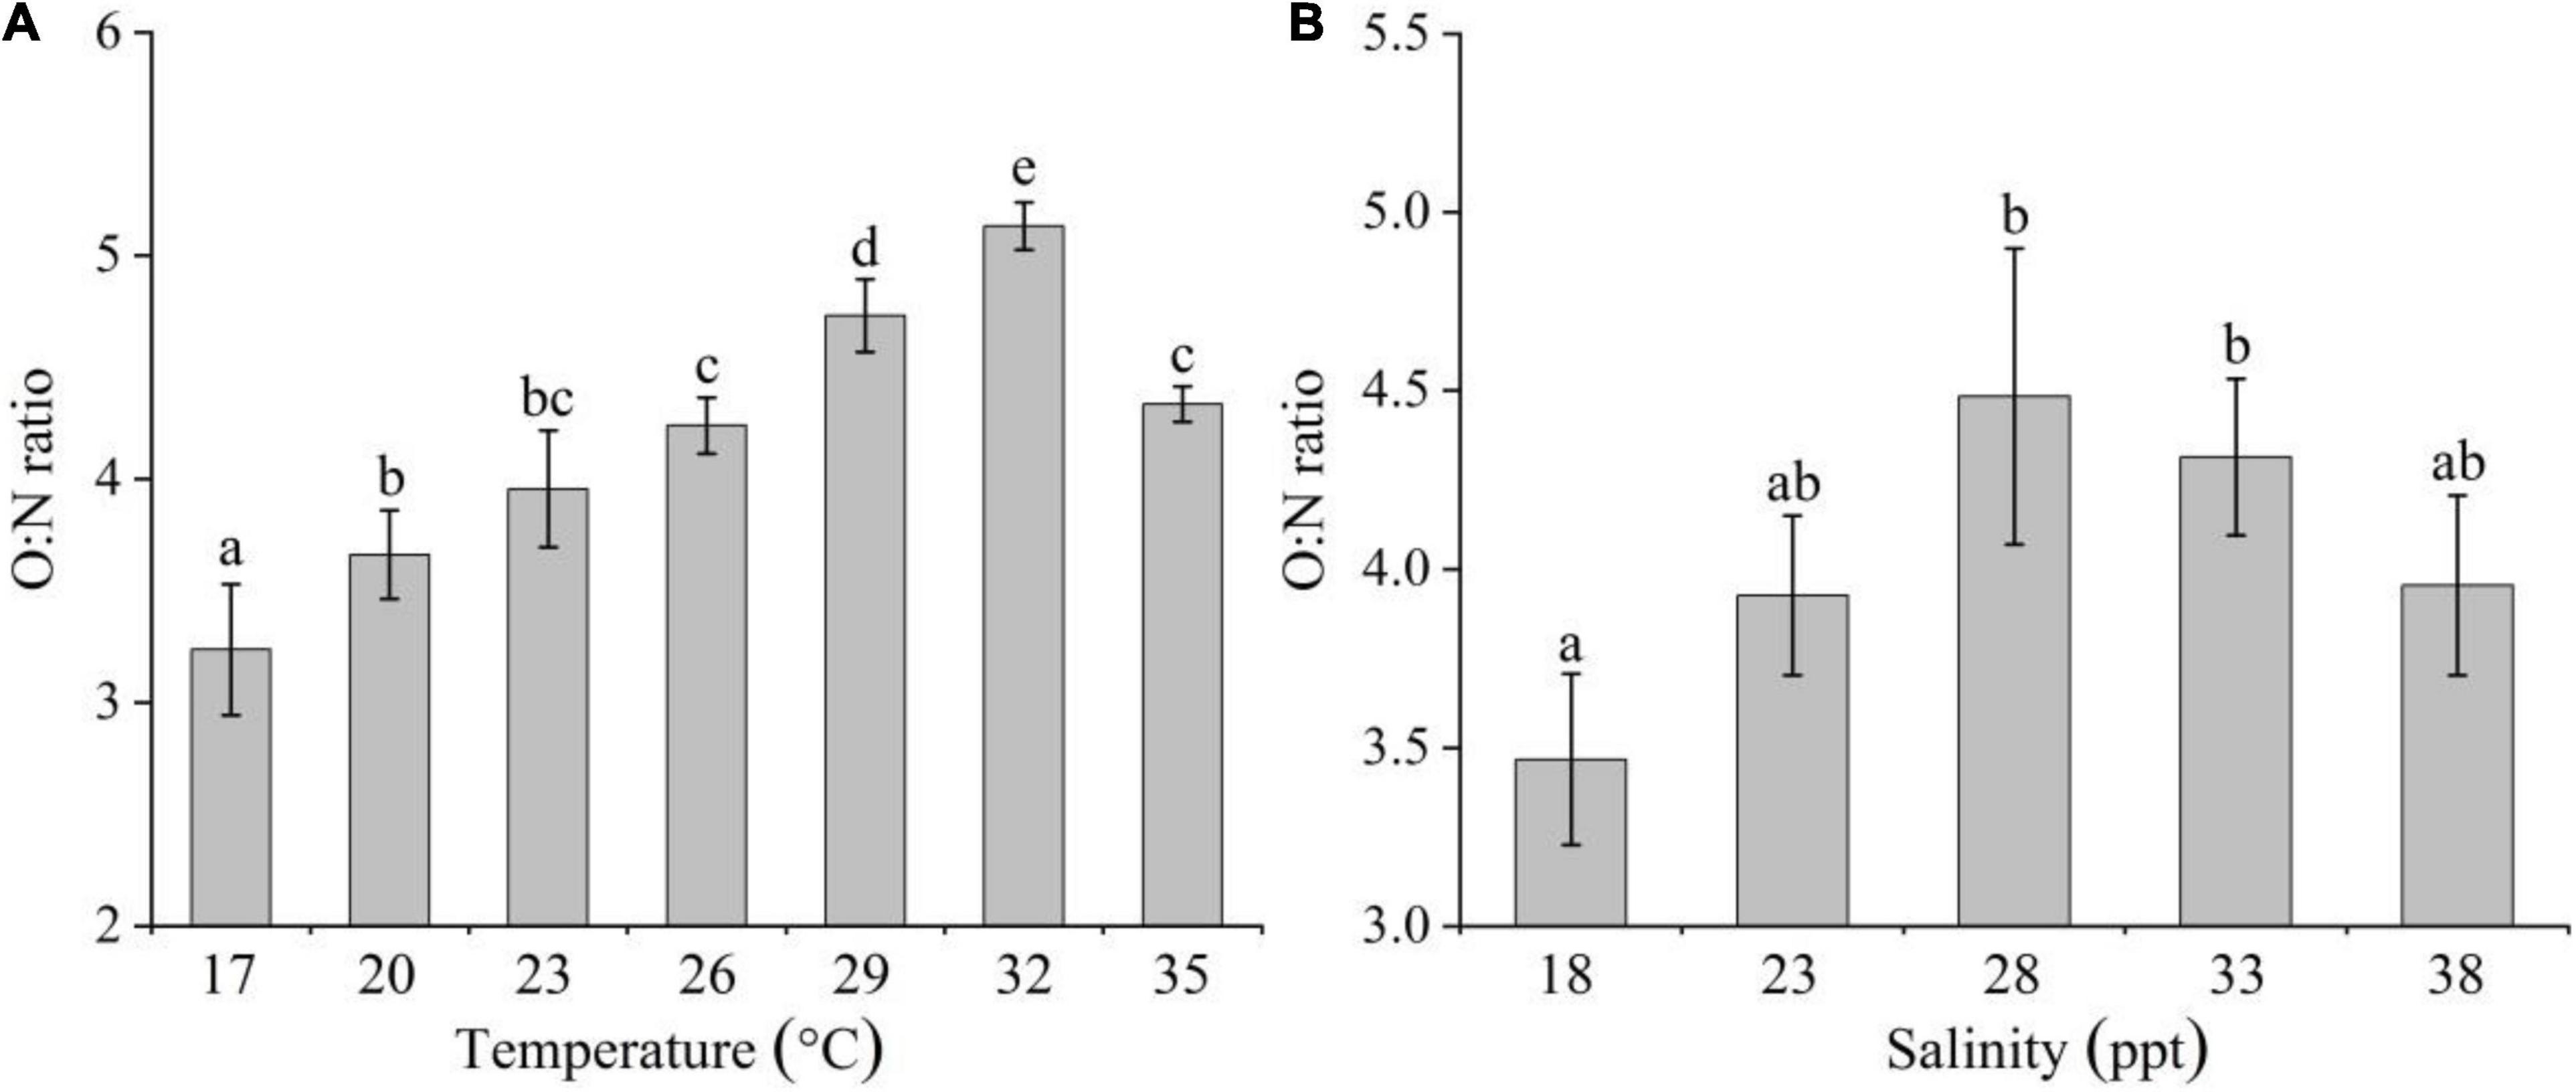
Figure 5. Effects of temperature (A) and salinity (B) on the O:N ratio of Creseis acicula. Bars denote standard deviation. Different superscripts indicate significance (P < 0.05) among the different temperature and salinity treatments, respectively.
Stepwise multiple regression analysis explained 53.7% of the variation in the O:N ratio of C. acicula [F(1,35) = 21.336, R2-adjusted = 0.537]. The regression analysis showed that both temperature and salinity were significantly correlated with the O:N ratio (P < 0.05). The temperature and salinity coefficients were 0.083 and 0.028, respectively, indicating that temperature had a greater effect on O:N ratio than salinity.
The Q10 values calculated for the different tested temperatures are shown in Table 1. Both the Q10 for respiration and excretion decreased with increasing temperature, except for the Q10 values for excretion within 32 and 35°C. The highest Q10 values for respiration and excretion were observed within 17 and 20°C, followed by that within 20 and 23°C. The lowest Q10 value for respiration was 0.79 within 32 and 35°C, and the lowest Q10 value for excretion value was 1.23 within 29 and 32°C. A narrow range of Q10 for excretion was observed for C. acicula when exposed to the different temperatures.
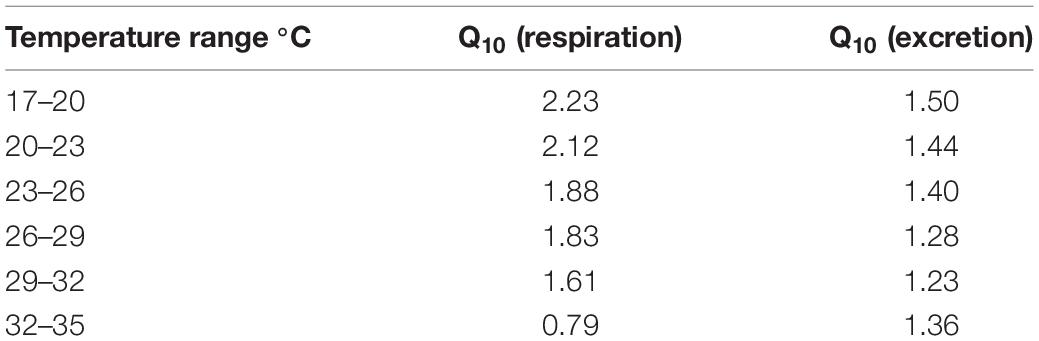
Table 1. Q10 values for respiration and excretion in Creseis acicula exposed to different temperatures.
The results of the present study suggest that C. acicula has the ability to regulate its metabolisms, e.g., respiration, ammonia excretion, and calcification rates, within a relatively broad range of water temperature and salinity. This could be an advantage for its worldwide distribution. The results showed that the OCR of C. acicula increased by 145%, as the experimental temperature increased from 17 to 32°C, and its value decreased at 35°C. The respiration rates of pteropod species increased with increasing temperature (Seibel et al., 2007; Comeau et al., 2010; Maas et al., 2012; Bednaršek et al., 2016). However, the correlation between respiration and temperature was not linear in C. acicula. This is consistent with previous findings reported for copepod species, usually rising more steeply at the upper end and falling when the lethal temperature is approached (Krause et al., 2003). This indicated that C. acicula has a metabolic regulation ability. The decrease in OCR here reported suggests that when the water temperature reached 35°C, C. acicula entered a state of physiological stress and paid relatively higher energy cost. On the other hand, AER in C. acicula increased with increasing temperature, with the highest value observed at 35°C. It is well-known that ammonia is the major form of nitrogen waste–derived from protein metabolism–excreted by marine zooplankton (Butler et al., 1970; Corner and Davies, 1971). Therefore, the high ammonia production at 35°C indicates that C. acicula uses more protein as its energy source in higher water temperature than in lower water temperature conditions.
Q10 has been recognized as a common parameter that reflects the adjustments related to the enzymatic and physiological requirements for energy when temperature increases within natural range (Kita et al., 1996; Manush et al., 2004; Kim et al., 2005). As for most animals, the normal Q10 value for pteropods is approximately 2–3 (Fry, 1971). In the present study, the Q10 for excretion did not clearly change with the increase in temperature. Whereas, the increase in oxygen consumption with rising temperature is fully accounted for by the basal metabolism (Hirche, 1987). Thus, in C. acicula the Q10 for respiration ranged from 2.23 to 1.61 at the 17–32°C range, which indicated that this pteropod is well adapted to these temperatures. However, when the temperature increased to 32–35°C, the Q10 for respiration was lowered to 0.79, indicating that C. acicula is no longer sensitive to temperature variation when temperature exceeded the optimum value.
The principle of osmotic adjustment holds that when osmotic pressure is at a minimum, the metabolic level is the lowest; when salinity is higher or lower than the isotonic point, more energy is consumed to maintain homeostasis, and the metabolic level increases (Cao and Wang, 2015). In this study, the OCR of C. acicula increased as the salinity increased from 18 to 28 ppt. A turning point was observed at 28 ppt, beyond which the OCR decreased as salinity increased from 28 to 38 ppt. Although AER in C. acicula did not significantly vary with salinity, it firstly decreased to the lowest level at 33 ppt, and then increased at 38 ppt, showing an opposite pattern to that observed for OCR. This supports the theory that the energetic cost associated with ionic and osmotic regulation is minimal within the normal salinity range tolerated by a species at species life stages (Morgan and Iwama, 1991). And at the same time, neither OCR nor AER at 28 ppt significantly differed from the corresponding values both at 23 and 33 ppt, indicating that C. acicula could well adapt to salinity range from 23 to 33 ppt. The decrease in OCR at salinities of 18 and 38 ppt is also reflected in the observed retraction of the pteropod body inside its shell–which is similar to valve closure in bivalves–that occurs when salinity either drops or increases excessively (Berger and Kharazova, 1997).
The O:N ratio can be considered as representative of the overall metabolic balance of an organism. It is usually used as an index of lipid versus protein catabolism that reflects the effects of environmental stressors on zooplankton energy reserves (Mayzaud and Conover, 1988). Typically, an O:N ratio lower than 7 indicates a protein-only catabolism; values between 7 and 17, indicating a protein-oriented catabolism; and values >17, indicating a lipid/carbohydrate catabolism (Mayzaud and Conover, 1988; Ikeda et al., 2000). In the present study, the O:N ratio values calculated for C. acicula fall into a narrow range (from 3.24 to 5.13). Previous studies also reported a low O:N ratio for some adult pteropod species, such as Clio pyramidata (4.4) and Limacina helicina antarctica (2–9) (Thibodeau et al., 2020). Thus, pteropod species, including C. acicula in this study, use protein as the major metabolism substrate.
CaCO3 occurs in several solid forms, including aragonite and calcite, and between these two, the former is less stable than the latter (Fransson et al., 2016). C. acicula is sensitive to chemical changes in seawater due to its highly soluble aragonite shells (Tunçer et al., 2021). The CaCO3 saturation (Ω) is used as a chemical indicator for the dissolution potential of this compound (Fransson et al., 2016). Increasing temperature leads to increased Ω (Chierici et al., 2011), while freshwater supply causes a decrease in this parameter (Sejr et al., 2011; Fransson et al., 2015). Severe shell dissolution of aragonite-forming organisms takes place when Ωa < 1.4 (Bednaršek and Ohman, 2015). In this study, the CR of C. acicula firstly increased to the highest level at 26°C and 33 ppt, but then decreased at 29–35°C and 38 ppt; CR values were negative at high temperature (35°C) and at low salinities (18–23 ppt). The Ωa increased from 17 to 35°C and from 18 to 38 ppt, with all Ωa values being > 1.4, except at 26 ppt after incubation (Table 2). Thus, it is easy to understand that the CR was negative at low salinities (18 and 23 ppt) and the salinity had a stronger effect on the CR than temperature. While, the negative CR values observed at 35°C may have been caused by the presence of physiological stress due to higher temperature–which increases the risk of dissolution and thinning of the aragonitic shells in C. acicula (Fransson et al., 2016)–rather than by the variation of Ωa. For example, higher energetic costs may derive from necessary repair calcification processes in response to shell dissolution (Lischka and Riebesell, 2012; Blachowiak-Samołyk et al., 2015; Vader et al., 2015). In this study, for the negative CR, C. acicula could not meet the needs for increased energetic costs, and responded with metabolic depression to save energy and increase its chance of survival. This is consistent with the findings of previous studies (Bibby et al., 2007; Rosa and Seibel, 2008; Navarro et al., 2013).

Table 2. Saturation states of the water related to aragonite minerals (Ωa) before and after the physiological experiment with different temperatures (T) and salinities (S).
Studies of various marine species suggest that a number of large swarms or aggregations are due to biological forces (i.e., development time, bloom timing, species interactions) (Wishner et al., 1995; Ji et al., 2009; Baliarsingh et al., 2020). In this study, the experimental C. acicula were at mature stage with ovulating. After this study, we also observed the reproductive development of C. acicula. But the metamorphosis to juveniles with shells was absent after 20 days of veliger stage. Most studies confirm that the early stages of pteropod development are the most vulnerable (Kurihara, 2008; Comeau et al., 2010; Lischka et al., 2011), as the organisms do not have fully formed shells (Kobayashi, 1974; Fabry et al., 2008; Howes et al., 2014; Thabet et al., 2015). Meanwhile this study showed that the protein was the major catabolism substrate of C. acicula. Due to a strong depletion of lipids suffered during the spawning phase in the summer, active lipid storage in eggs may occur in pteropods (Gannefors et al., 2005). And female pteropods generally die shortly after spawning (Gannefors et al., 2005), which may explain the extinction of C. acicula after 1 month of the bloom. Thus, this massive aggregation of C. acicula may explain to be a reproductive bloom.
Our results indicate that seawater temperature has a stronger influence on OCR and AER of C. acicula, compared to salinity. On the other hand, CR was more affected by salinity than by temperature. The preferable temperature for C. acicula ranged from 29 to 32°C and the preferable salinity ranged from 28 to 33 ppt. The warmer water (30.92 ± 0.86°C) around the thermal discharge area of DNPP may favor the physiological performances for reproduction. In addition, it is well-known that water temperature shows a regular seasonal cycle in Daya Bay (Wu et al., 2016). The C. acicula bloom occurred only in 2020. This impenetrable phenomenon may be mainly related to the tidal current which drives the horizontal migration of C. acicula from the inside to the outside of the bay during the ebb tide period (Zeng et al., 2021). Thus, it is contingency for this bloom (Zhong et al., 2021). However, it must be pointed out that the bloom formatting mechanism of C. acicula is very complex and almost be combination of many factors. Further studies are in need for a fully understanding on the bloom forming mechanism of C. acicula.
The original contributions presented in the study are included in the article/supplementary material, further inquiries can be directed to the corresponding author.
TH and HH conceived the study. TH and ZQ designed the experiments, analyzed the data, and wrote the manuscript. RS and QL conducted the research and collected the data. MD and HH provided materials and interpreted the data. All authors contributed to the article and approved the submitted version.
This work was supported by the National Key Research and Development Program of China (2018YFC1407501 and 2018YFC1407504), Central Public-interest Scientific Institution Basal Research Fund, South China Sea Fisheries Research Institute, CAFS (2019TS29 and 2021SD03), Central Public-interest Scientific Institution Basal Research Fund, CAFS (2020TD15 and 2020YJ02), Financial Fund of the Ministry of Agriculture and Rural Affairs, P.R. China (NFZX2021), and Key Special Project for Introduced Talents Team of Southern Marine Science and Engineering Guangdong Laboratory (Guangzhou) (GML2019ZD0402).
The authors declare that the research was conducted in the absence of any commercial or financial relationships that could be construed as a potential conflict of interest.
All claims expressed in this article are solely those of the authors and do not necessarily represent those of their affiliated organizations, or those of the publisher, the editors and the reviewers. Any product that may be evaluated in this article, or claim that may be made by its manufacturer, is not guaranteed or endorsed by the publisher.
We would like to appreciate Jing Li, Xiaoqing Qin, and Lingling Wang for their assistance in experimental work. We are grateful for valuable suggestions and comments from editor and reviewers.
Albergoni, A. (1975). Addensamento improvviso di Creseis acicula (Rang, 1828) (Gastropoda, pteropoda) in una baia del Mare Ligure. Conchiglie 11, 233–236.
Baliarsingh, S. K., Lotliker, A. A., Srichandan, S., Samanta, A., Kumar, N., and Nair, T. M. B. (2020). A review of jellyfish aggregations, focusing on India’s coastal waters. Ecol. Proc. 9:58. doi: 10.1186/s13717-020-00268-z
Bayne, B. L., and Newell, R. C. (1983). Physiological energetics of marine mollusks. Mollusca 4, 407–515. doi: 10.1016/B978-0-12-751404-8.50017-7
Bednaršek, N., Harvey, C. J., Kaplan, I. C., Feely, R. A., and Mozina, J. (2016). Pteropods on the edge: Cumulative effects of ocean acidification, warming, and deoxygenation. Prog. Oceanogr. 145, 1–24. doi: 10.1016/j.pocean.2016.04.002
Bednaršek, N., and Ohman, M. D. (2015). Changes in pteropod distributions and shell dissolution across a frontal system in the California Current System. Mar. Ecol. Prog. 523, 93–103. doi: 10.3354/meps11199
Berger, V. J., and Kharazova, A. D. (1997). Mechanisms of salinity adaptations in marine molluscs. Interact. Adapt. Strateg. Mar. Organ. 355, 115–126. doi: 10.1007/978-94-017-1907-0_12
Bibby, R., Cleall-Harding, P., Rundle, S., Widdicombe, S., and Spicer, J. (2007). Ocean acidification disrupts induced defences in the intertidal gastropod Littorina littorea. Biol. Lett. 3, 699–701. doi: 10.1098/rsbl.2007.0457
Blachowiak-Samołyk, K., Wiktor, J. M., Hegseth, E. H., Wold, A., Falk-Petersen, S., and Kubiszyn, A. M. (2015). Winter Tales: the dark side of planktonic life. Polar Biol. 38, 23–36. doi: 10.1007/s00300-014-1597-4
Burgi, C. M., and Devos, C. (1962). Accumulation exceptionelle de Creseis acicula au long des cìtes dans la région de Banyuls-sur-Mer. Vie et Milieu. 13, 391–392.
Butler, E. I., Corner, E. D. S., and Marshall, S. M. (1970). On the nutrition and metabolism of zooplankton. VII. Seasonal survey of nitrogen and phosphorus excretion by Calanus in the Clyde Sea area. J. Mar. Biol. Ass. U.K. 50, 525–560. doi: 10.1017/s0025315400004707
Cao, F., and Wang, H. (2015). Effects of salinity and body mass on oxygen consumption and ammonia excretion of mudskipper Boleophthalmus pectinirostris. Chin. J. Oceanol. Limn. 33, 92–98. doi: 10.1007/s00343-015-4107-9
Chierici, M., Fransson, A., Lansard, B., Miller, L. A., Mucci, A., Shadwick, E., et al. (2011). Impact of biogeochemical processes and environmental factors on the calcium carbonate saturation state in the Circumpolar Flaw Lead in the Amundsen Gulf, Arctic Ocean. J. Geophys. Res. Oceans 116:C9. doi: 10.1029/2011JC007184
Comeau, S., Jefferee, R., Teyssié, J.-L., and Gattuso, J.-P. (2010). Response of the Arctic pteropod Limacina helicina to projected future environmental conditions. PLoS One 5:e11362. doi: 10.1371/journal.pone.0011362
Corner, E. D. S., and Davies, A. G. (1971). Plankton as a factor in the nitrogen and phosphorus cycles in the sea. Adv. Mar. Biol. 9, 101–204. doi: 10.1016/S0065-2881(08)60342-9
Dai, M., Qi, Z. H., Zeng, L., Zhang, S. F., Wang, L. L., Qin, X. Q., et al. (2020). An unprecedented outbreak of pelagic molluscs Creseis acicula in Daya Bay, South China Sea. Authorea 2020, 1–7. doi: 10.22541/au.159809490.05151881
Fabry, V. J., Seibel, B. A., Feely, R. A., and Orr, C. J. (2008). Impacts of ocean acidification on marine fauna and ecosystem process. ICES J. Mar. Sci. 65, 414–432. doi: 10.1016/j.tree.2012.10.001
Fransson, A., Chierici, M., Hop, H., Findlay, H. S., Kristiansen, S., and Wold, A. (2016). Late winter-to-summer change in ocean acidification state in Kongsfjorden, with implications for calcifying organisms. Polar Biol. 39, 1841–1857. doi: 10.1007/s00300-016-1955-5
Fransson, A., Chierici, M., Nomura, D., Granskog, M. A., Kristiansen, S., Martma, T., et al. (2015). Effect of glacial drainage water on the CO2 system and ocean acidification state in an Arctic tidewater-glacier fjord during two contrasting years. J. Geophys. Res. Oceans. 120, 2413–2429. doi: 10.1002/2014JC010320
Fry, F. E. J. (1971). 1-The effect of environmental factors on the physiology of fish. Fish Physiol. 6, 1–98. doi: 10.1016/S1546-5098(08)60146-6
Gannefors, C., Boer, M., Kattner, G., Graeve, M., Eiane, K., Gulliksen, B., et al. (2005). The Arctic sea butterfly Limacina helicina: lipids and life strategy. Mar. Biol. 147, 169–177. doi: 10.1007/s00227-004-1544-y
GB/T 12763.4-2007 (2007). Specifications for oceanographic survey-Part 4: Survey of chemical parameters in sea water. Beijing: Standards Press of China, 21–23.
Herman, Y. (1998). “Pteropods,” in Introduction to Marine Micropaleontology, 2nd Edn, eds B. U. Haq and A. Boersma (Amsterdam: Elsevier Science Press), 151–159.
Hirche, H. J. (1987). Temperature and Plankton. II. Effect on respiration and swimming activity in copepods from the Greenland Sea. Mar. Biol. 94, 347–356. doi: 10.1007/BF00428240
Howes, E. L., Bednaršek, N., Büdenbender, J., Comeau, S., Doubleday, A., Gallager, S. M., et al. (2014). Sink and swim: a status review of thecosome pteropod culture techniques. J. Plankton. Res. 36, 299–315. doi: 10.1093/plankt/fbu002
Hutton, R. F. (1960). Marine dermatosis: Notes on seabather’s eruption with Creseis Acicula Rang (Mollusca: Pteropoda) as the cause of a particular type of sea sting along the west coast of Florida. Arch. Dermatol. 82, 153–157. doi: 10.1001/archderm.1960.01580060107017
Ikeda, T., Torres, J. J., Hernández-León, S., and Geiger, S. P. (2000). “Metabolism,” in ICES Zooplankton Methodology Manual, eds R. Harris, P. Wiebe, J. Lenz, H. R. Skjoldan, and M. Huntley (London: Academic Press), 455–532.
Ji, R., Davis, C. S., Chen, C., and Beardsley, R. C. (2009). Life history traits and spatiotemporal distributional patterns of copepod populations in the Gulf of Maine-Georges Bank region. Mar. Ecol. Prog. Ser. 384, 187–205. doi: 10.3354/meps08032
Jiang, R., and Wang, Y. S. (2020). Modeling the ecosystem response of the semi-closed Daya Bay to the thermal discharge from two nearby nuclear power plants. Ecotoxicology 29, 736–750. doi: 10.1007/s10646-020-02229-w
Kim, W. S., Yoon, S. J., Kim, J. M., Gil, J. W., and Lee, T. W. (2005). Effects of temperature changes on the endogenous rhythm of oxygen consumption in the Japanese flounder Paralichthys olivaceus. Fish. Sci. 71, 471–478. doi: 10.1111/j.1444-2906.2005.00990.x
Kita, J., Tsuchida, S., and Setoguma, T. (1996). Temperature preference and tolerance and oxygen consumption of the marbled rock-fish. Sebastiscus marmoratus. Mar. Biol. 125, 467–471. doi: 10.1007/BF00353259
Kobayashi, H. A. (1974). Growth-cycle and related vertical distribution of thecosomatous pteropod Spiratella (“Limacina”) helicina in central Arctic Ocean. Mar. Biol. 26, 295–301. doi: 10.1007/BF00391513
Kokelj, F., Milani, L., Lavaroni, G., and Casaretto, L. (1994). Marine dermatitis due to Creseis acicula. J. Eur. Acad. Dermatol. Venereol. 3, 555–561. doi: 10.1111/j.1468-3083.1994.tb00420.x
Krause, M., Fock, H., Greve, W., and Winkler, G. (2003). North sea zooplankton: a review. Senckenb. marit. 33, 71–204. doi: 10.1007/BF03043048
Kurihara, H. (2008). Effects of CO2-driven ocean acidification on the early developmental stages of invertebrates. Mar. Ecol. Prog. Ser. 373, 275–284. doi: 10.3354/meps07802
Lischka, S., Büdenbender, J., Boxhammer, T., and Riebesell, U. (2011). Impact of ocean acidification and elevated temperatures on early juveniles of the polar shelled pteropod Limacina helicina: mortality, shell degradation, and shell growth. Biogeosciences 8, 919–932. doi: 10.5194/bgd-7-8177-2010
Lischka, S., and Riebesell, U. (2012). Synergistic effects of ocean acidification and warming on overwintering pteropods in the Arctic. Glob. Change Biol. 18, 3517–3528. doi: 10.1594/PANGAEA.832422
Maas, A. E., Lawson, G. L., Bergan, A. J., Wang, Z. A., and Tarrant, A. M. (2020). Seasonal variation in physiology and shell condition of the pteropod Limacina retroversa in the Gulf of Marine relative to life cycle and carbonate chemistry. Prog. Oceanogr. 186:102371. doi: 10.1016/j.pocean.2020.102371
Maas, A. E., Wishner, K. F., and Seibel, B. A. (2012). Metabolic suppression in the thecosomatous pteropods as an effect of low temperature and hypoxia in the eastern tropical North Pacific. Mar. Biol. 159, 1955–1967. doi: 10.1007/s00227-012-1982-x
Manush, S. M., Pal, A. K., Chatterjee, N., Das, T., and Mukherjee, S. C. (2004). Thermal tolerance and oxygen consumption of Macrobrachium rosenbergii acclimated to three temperatures. J. Therm. Biol. 29, 15–19. doi: 10.1016/j.jtherbio.2003.11.005
Mayzaud, P., and Conover, R. J. (1988). O: N atomic ratio as a tool to describe zooplankton metabolism. Mar. Ecol. Prog. Ser. 45, 289–302. doi: 10.3354/meps045289
Morgan, J. D., and Iwama, G. K. (1991). Effects of salinity on growth, metabolism, and ionic regulation in juvenile rainbow trout and steelhead trout (Oncorhynchus mykiss) and fall chinook salmon (Oncorhynchus tshawytscha). Can. J. Fish. Aquat. Sci. 48, 2083–2094. doi: 10.1139/f91-247
Morioka, Y. (1980). Dense population of a pteropod, Creseis acicula (needle sea butterfly) in the neritic waters of the middle Japan Sea. Bull. Jap. Sea Reg. Fish. Res. Lab. 31, 169–171.
Naomi, T. S. (1988). On a swarm of Creseis acicula Rang (Pteropoda) in the Karwar waters. Indian J. Fish. 35, 64–65.
Navarro, J. M., Torres, R., Acuna, K., Duarte, C., Manriqueza, P. H., Lardies, M., et al. (2013). Impact of medium-term exposure to elevated pCO2 levels on the physiological energetics of the mussel Mytilus chilensis. Chemosphere 90, 1242–1248. doi: 10.1016/j.chemosphere.2012.09.063
Nishimura, S. (1965). Dropletss from the plankton net-xx. “sea stings” caused by Creseis acicula Rang (Mollusca: pteropoda) in Japan. Publ. Seto. Mar. Bioi. Lab 8, 287–290.
Peter, K. J., and Paulinose, V. T. (1978). Swarming of Creseis acicula Rang (Pteropoda) in the Bay of Bengal. Indian J. Mar. Sci. 7, 126–127.
Pierrot, D., Lewis, E., and Wallace, D. W. R. (2006). MS Excel program developed for CO2 system calculations. ORNL/CDIAC-105 [R]. Carbon Dioxide Information Analysis Center, Oak Ridge National Laboratory. Oak Ridge, TN: US Department of Energy.
Pillai, S. K., and Rodrigo, J. X. (1984). Swarming of Cresies acicula Rang (Pteropoda) in the Palk Bay off Mandapam. J. Mar. Bio. Assoc. India 21, 178–180.
Rosa, R., and Seibel, B. A. (2008). Synergistic effects of climate-related variables suggest future physiological impairment in a top oceanic predator. Proc. Natl. Acad. Sci. USA Biol. Sci. 105, 20776–20780. doi: 10.1073/pnas.0806886105
Sakthivel, M., and Haridas, P. (1974). Synchronization in the occurrence of Trichodesmium bloom and swarming of Creseis acicula Rang (Pteropoda) and Penilia avirostris Dana (Cladocera) in the area off Cohin. Mahasagar 7, 61–64.
Seibel, B. A., Dymowska, A., and Rosenthal, J. (2007). Metabolic temperature compensation and coevolution of locomotory performance in pteropod molluscs. Integr. Comp. Biol. 47, 880–891. doi: 10.1093/icb/icm089
Sejr, M. K., Krause-Jensen, D., Rysgaard, S., Sørensen, L. L., Christensen, P. B., and Glud, R. N. (2011). Air-sea flux of CO2 in arctic coastal waters influenced by glacial melt water and sea ice. Tellus B 63, 815–822. doi: 10.1111/j.1600-0889.2011.00540.x
Thabet, A. A., Maas, A. E., Lawson, G. L., and Tarrant, A. M. (2015). Life cycle and early development of the thecosomatous pteropod Limacina retroversa in the Gulf of Marine, including the effect of elevated CO2 levels. Mar. Biol. 162, 2235–2249. doi: 10.1007/s00227-015-2754-1
Thibodeau, P. S., Steinberg, D., and Maas, A. E. (2020). Effects of temperature and food concentration on pteropod metabolism along the Western Antarctic Peninsula. J. Exp. Mar. Biol. Ecol. 53, 151412. doi: 10.1016/j.jembe.2020.151412
Tunçer, S., Öğretmen, N., Çakır, F., Öztekin, A., Oral, A., and Suner, S. C. (2021). First record of straight-needle pteropod Creseis acicula Rang, 1828, bloom in the Çanakkale Strait (NE Aegean Sea, Turkey). Oceanol. Hydrobiol. St. 50, 310–324. doi: 10.2478/oandhs-2021-0026
Vader, A., Marquardt, M., Meshram, A. R., and Gabrielsen, T. M. (2015). Key Arctic phototrophs are widespread in the polar night. Polar Biol. 38, 13–21. doi: 10.1007/s00300-014-1570-2
Wishner, K. F., Schoenherr, J. R., Beardsley, R., and Chen, C. (1995). Abundance, distribution and population structure of the copepod Calanus finmarchicus in a springtime right whale feeding area in the southwestern Gulf of Maine. Cont. Shelf Res. 15, 475–507. doi: 10.1016/0278-4343(94)00057-t
Wu, M. L., Wang, Y. S., Wang, Y. T., Sun, F. L., Sun, C. C., Cheng, H., et al. (2016). Seasonal and spatial variations of water quality and trophic status in Daya Bay. South China Sea. Mar. Pollut. Bull. 112, 341–348. doi: 10.1016/j.marpolbul.2016.07.042
Xu, G. Z. (1989). Daya Bay Environment and resources. Hefei: Anhui Science and Technology Press, 175–212.
Yu, Z. H., Luo, P., Liu, W. G., Huang, W., and Hu, C. Q. (2018). Influence of water temperature on physiological performance of the sea cucumber Holothuria moebii. Aquac. Res. 49, 3595–3600. doi: 10.1111/are.13826
Zeng, L., Chen, G. B., Wang, T., Zhang, S. F., Dai, M., Yu, J., et al. (2021). Acoustic study on the outbreak of Creseise acicula nearby the Daya Bay Nuclear Power Plant Base during the summer of 2020. Mar. Pollut. Bull. 165:112144.
Keywords: Creseis acicula, temperature, salinity, physiological performance, bloom
Citation: Han T, Qi Z, Shi R, Liu Q, Dai M and Huang H (2022) Effects of Seawater Temperature and Salinity on Physiological Performances of Swimming Shelled Pteropod Creseis acicula During a Bloom Period. Front. Mar. Sci. 9:806848. doi: 10.3389/fmars.2022.806848
Received: 01 November 2021; Accepted: 10 February 2022;
Published: 01 March 2022.
Edited by:
Vengatesen Thiyagarajan, The University of Hong Kong, Hong Kong SAR, ChinaReviewed by:
Ramadoss Dineshram, Council of Scientific and Industrial Research (CSIR), IndiaCopyright © 2022 Han, Qi, Shi, Liu, Dai and Huang. This is an open-access article distributed under the terms of the Creative Commons Attribution License (CC BY). The use, distribution or reproduction in other forums is permitted, provided the original author(s) and the copyright owner(s) are credited and that the original publication in this journal is cited, in accordance with accepted academic practice. No use, distribution or reproduction is permitted which does not comply with these terms.
*Correspondence: Honghui Huang, aHVhbmdoaEBzY3NmcmkuYWMuY24=
Disclaimer: All claims expressed in this article are solely those of the authors and do not necessarily represent those of their affiliated organizations, or those of the publisher, the editors and the reviewers. Any product that may be evaluated in this article or claim that may be made by its manufacturer is not guaranteed or endorsed by the publisher.
Research integrity at Frontiers
Learn more about the work of our research integrity team to safeguard the quality of each article we publish.