 Teresa Fish
 Nathan Wolf
 Timothy Scott Smeltz1†
 Bradley P. Harris
 Josep V. Planas
94% of researchers rate our articles as excellent or good
Learn more about the work of our research integrity team to safeguard the quality of each article we publish.
Find out more
ORIGINAL RESEARCH article
Front. Mar. Sci. , 11 April 2022
Sec. Marine Biology
Volume 9 - 2022 | https://doi.org/10.3389/fmars.2022.801759
Developing a robust understanding of Pacific halibut reproductive biology is essential to understanding the different components (e.g. maturity) that determine the reproductive output of the species and, therefore, for estimating the relative female spawning biomass. With these, effective and proactive management strategies can be designed and implemented to face the large-scale environmental changes to which high-latitude spawning fish are particularly vulnerable. To date, reproductive studies of Pacific halibut have mainly focused on population or regional scales, leaving the specific details of organism-level reproductive development unexamined. The work described here aimed to address information gaps in Pacific halibut reproductive biology by conducting a detailed histological examination of temporal changes in ovarian development over an annual reproductive cycle with special attention to the use of biological indicators (e.g. oocyte diameter, gonadosomatic index, hepatosomatic index, Fulton’s condition factor, somatic fat) in characterizing female developmental stages and reproductive phases. Our results provide a foundation for future studies directed at improving current maturity estimations by histological assessment and explore models that test the utility of biological indicators to predict maturity in this important fish species.
Spawning adult teleosts are particularly vulnerable to temperature variations associated with large-scale environmental change (Graham and Harrod, 2009) due in part to the considerable energy demands required by gamete production (Berg and Finstad, 2008). This vulnerability necessitates proactive management based on a complete understanding of fundamental biological processes (Ficke et al., 2007; Free et al., 2019), particularly those related to spawning and reproductive development. This is especially true for species such as Pacific halibut (Hippoglossus stenolepis) that inhabit high latitude waters where relatively dramatic temperature anomalies associated with climate change have already been observed (Graham and Harrod, 2009; Serreze and Barry, 2011; Walsh et al., 2018).
Currently, management of the Pacific halibut stock is based on reference points that rely on annual estimations of the relative spawning biomass that takes into account mature females (Stewart and Webster, 2021). Maturity is, therefore, an important determinant factor of the species’ reproductive output that is included directly in the stock assessment. Consequently, potential temporal or spatial changes in maturity, as well as differences in the precision and accuracy of maturity determinations, can greatly influence estimations of spawning biomass and management status. As in many managed fish species, maturity in Pacific halibut is currently estimated based on at-sea visual (i.e. macroscopic) examination of the ovary. This macroscopic maturity classification method can potentially add uncertainty in data interpretation in the absence of validation using supporting information (e.g. histology) on female reproductive development. Therefore, developing a robust understanding of Pacific halibut reproductive development is foundational for our ability to improve the estimation of maturity and other reproductive traits in this species.
Previous studies on Pacific halibut reproduction have largely focused on describing reproductive patterns at population or regional scales. These studies report that prior to spawning, Pacific halibut undertake seasonal offshore migrations from summer feeding areas on the continental shelf to deeper (200 to 600 m) winter spawning grounds on the outer continental shelf and slope (reviewed in Carpi et al., 2021). In the Gulf of Alaska, spawning occurs from November to March, peaks in late January (St-Pierre, 1984), and is likely accompanied by a spawning-rise behavior in which females ascend in the water column and eggs are released for fertilization at the peak of the rise (Loher and Seitz, 2008). In a recent study, we histologically described oocyte developmental stages in Pacific halibut that were used to assign female developmental stages, from early primary growth until the periovulatory stage (Fish et al., 2020). Importantly, we also provided evidence for a group synchronous ovarian developmental pattern with determinate fecundity in Pacific halibut (Fish et al., 2020). However, no work has yet been conducted to characterize the temporal progression of reproductive development in female Pacific halibut that would allow for a better understanding of the reproductive cycle of the species and, importantly, the identification of physiological traits and biological indicators (e.g. age, somatic fat content, gonadosomatic index, etc.) that could be indicative of the female’s commitment towards spawning within a reproductive cycle.
The work described here aimed to address information gaps in female Pacific halibut reproductive biology by conducting a detailed examination of the annual reproductive cycle with special attention to biological indicators that could be used to predict maturity. Specifically, we 1) investigated the temporal variation in developmental stage- and reproductive phase-specific proportions of female Pacific halibut; 2) investigated the temporal variation in biological indicators throughout a calendar year as well as their characterization of developmental stages and reproductive phases; and 3) evaluated a suite of models to predict reproductive phase based on biological indicators. The results from this study provide basic information on key characteristics of the Pacific halibut annual reproductive cycle and identify effective indicators of reproductive development that can be used to predict the reproductive phase. Importantly, our results are foundational to guide future studies to refine current maturity estimates and to evaluate potential changes in spatial and temporal patterns of reproductive development in response to climate change.
From September 2017 to August 2018, we collected approximately 30 female Pacific halibut each month using contracted longline commercial fishing vessels in the Gulf of Alaska (n = 356 fish). Monthly sampling trips occurred within a one- to four-day period. The sampling locations were within approximately 6,000 square nautical miles (spanning from 57.75 to 58.83 decimal degrees N and 149.3 to 152.3 decimal degrees W) near the Portlock Bank region (Figure 1) that contains a known spawning area for Pacific halibut (St. Pierre, 1984). In order to capture all stages of female reproductive development during our annual sample collection, sampling during the spawning season was conducted at deeper depths to capture females that migrated to winter spawning grounds (reviewed in Carpi et al., 2021). While our goal was not to provide an interannual comparison, we note that mean sea surface temperature for the region during the collection period was within one standard deviation of a five-year average (National Data Buoy Center 1971), indicating the sampling period as comparatively representative. Fish were captured using longline gear with each set consisting of up to 8 skates of 100 chum salmon-baited 16/0 circle hooks per skate. The starting and ending location of sets were recorded as well as the depth of anchors at each skate end. Mean depth (d) of each set is calculated as where di is the depth in meters (m) at each anchor, and n is the total anchors deployed for the set.
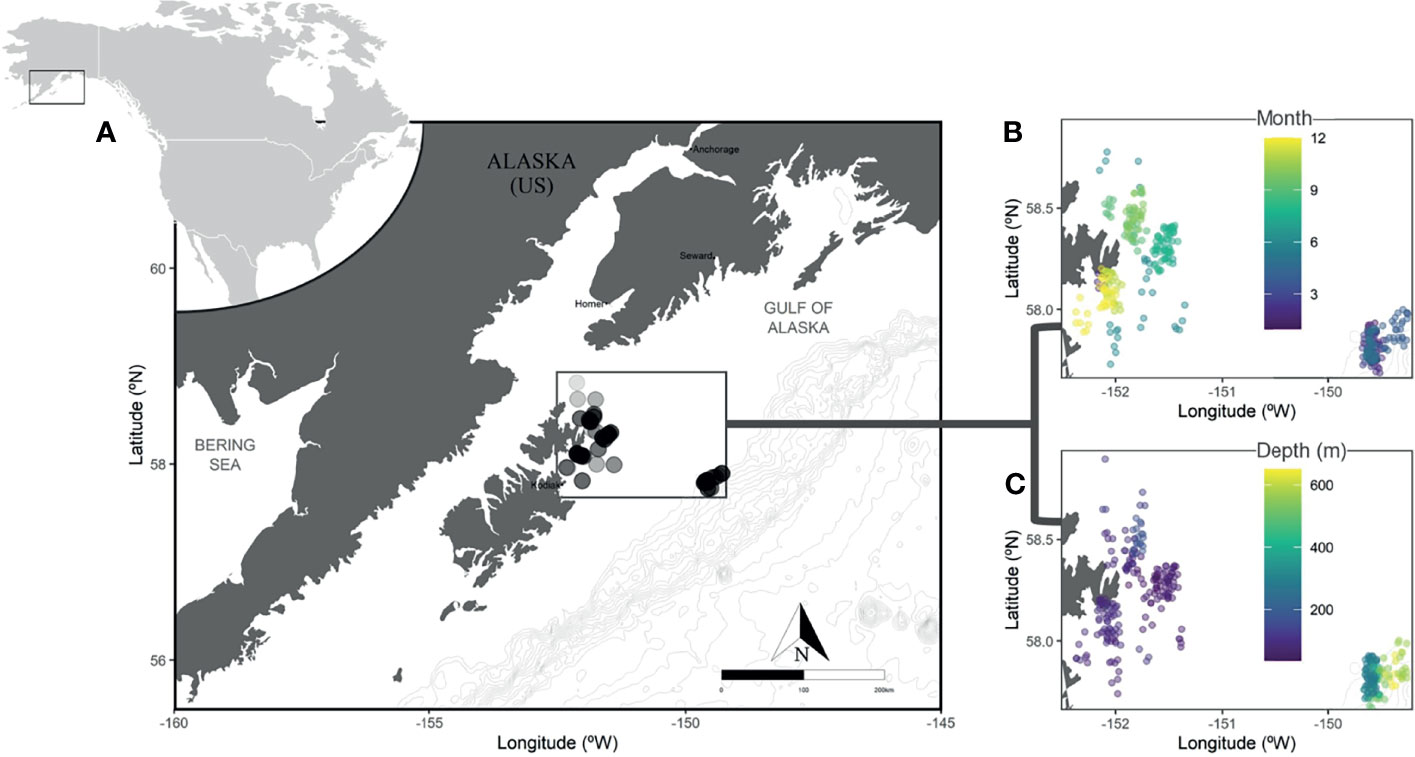
Figure 1 Sampling locations in the Gulf of Alaska Portlock region with light gray bathymetry lines at 100-meter intervals. All sampling occurred within the dark gray box; each fish is represented by a transparent dot where darker, more opaque areas produced more samples (A). The location and month (B) or depth in meters (C) of samples collected. Locations are jittered both horizontally and vertically to better display overlapping information, with depth and month displayed by color with blue representing both shallower depths or samples from the beginning of the year (e.g. January), and yellow representing greater depths or seasonally later samples.
In order to reduce the sampling of prepubescent fish, a target fork length of ≥ 90 cm was set (in this region, fish ≥ 90 cm have a greater than 50% probability of being mature; Clark et al., 1999; Loher and Seitz, 2008). However, in three of the twelve sampled months (February, July, and September 2018), slightly smaller individuals were used to help meet the sampling goal of 30 female Pacific halibut per month. Ranges of fork length and age for sampled females were 83-180 cm and 7-24 years, respectively.
For each fish, we measured the fork length (L; cm), total body weight (W; kg) to the nearest 100th of a kg, and gonadal (G; g) and liver (H; g) weights to the nearest whole gram using motion compensating scales (B-3220 and B-5440, BibbiCo, Lynwood, USA) with accuracies of 10/20 g for 30/60 kg samples and 0.5/1 g for 1.5/3 kg samples, respectively. Gonadosomatic index (GSI) and hepatosomatic index (HSI) were calculated as , and . Fulton’s K was calculated as . Somatic fat content was estimated using a Distell Fish Fatmeter (Model FM 692, Fauldhouse West Lothian, Scotland), a non-invasive tool that utilizes low-power microwave emission to estimate subdermal lipid content based on the water content of tissues (Kent, 1990).Two readings from an area located midway between the lateral arch and the dorsal fin insertion on the non-pigmented side of the fish were obtained, averaged, and applied to a fat calibration curve developed for Pacific halibut (Dykstra et al. Unpublished Data) to derive somatic fat content values using where Fat% is the percent muscle fat calculated from the raw Fatmeter reading value (Fatr). The left sagittal otolith was removed, stored in 50% glycerin solution, and later aged to the nearest year using the break-and-bake method (Forsberg, 2001). Approximately 1 cm3 of tissue was excised from the central area of the ovary and fixed in 10 milliliters of 10% buffered formalin for subsequent histological processing.
Ovarian tissue samples were processed for histology as described in Fish et al. (2020). Slides were examined visually with a compound microscope (1x – 100x magnification), and oocyte developmental stages were identified according to Brown-Peterson et al. (2011) and Grier et al. (2009) and used to assign the female developmental stage as described in Fish et al. (2020). In addition to the previously described female developmental stages, an additional developmental stage category – post spawning (PS) – was used to differentiate between cortical alveolar (CA) stage females in early development and CA stage females that had just spawned (containing abundant post-ovulatory follicles or POFs). The presence and degradation of POFs were defined following Haslob et al. (2012). Further, the presence of blood vessels and ovarian follicles undergoing atresia (alpha, beta, gamma) were noted, and ovarian structure was described on an ordinal scale as loose, moderate, or compact for all histological samples.
Reproductive phases were identified for each female by comparing developmental stages with evidence of previous spawning (i.e. POFs) to classify fish as immature, developing, spawning capable, regressing, or regenerating following a modified version of Brown-Peterson et al. (2011; Table 1).
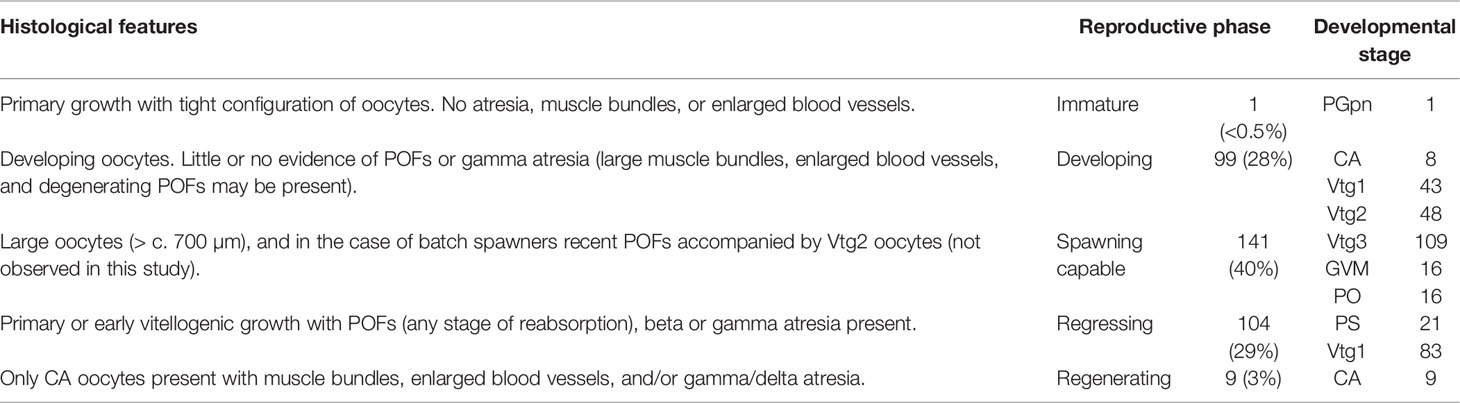
Table 1 Description of the histological features of reproductive phases for large (83-180 cm) female Pacific halibut (modified from Brown-Peterson et al., 2011), total fish observed from each phase (percent shown in parentheses), and a summary of total fish observed in corresponding developmental stages (see Fish et al., 2020 for detailed stage descriptions).
The largest three oocytes from each fish were visually identified and photographed at 1x – 10x magnification using a microscope-mounted camera for use in assessing oocyte diameters. Oocyte diameter measurements (µm) of photographed ovarian follicles were collected using ImagePro Premier 9.1 (Media Cybernetics Inc., Rockville, MD, USA) by tracing the perimeter of the oocyte, and we calculated the mean length of diameters measured at 2-degree intervals passing through the traced oocyte centroid – hereafter referred to simply as “oocyte diameter”.
Oocyte diameter, GSI, HSI, Fulton’s K, age, percent somatic fat, total body weight, length, and depth were examined for normal distributions (Shapiro–Wilk test) and homogenous variances (Levene’s test) by month, developmental stage, and reproductive phase. Because distributions were not normal and variances were not homogenous, we used Kruskal-Wallis test for significant differences followed by Dunn’s post hoc test if applicable. Additionally, relationships among individual variables were examined using Spearman’s rank correlation coefficient.
The utility of potential indicators of reproductive development in predicting reproductive phase was assessed using multinomial models from the R nnet package. All possible combinations of the variables – as well as interactions – were explored using the dredge function in the R muMIn package. Akaike’s Information Criterion (AIC) was used to compare models. Model selection was based on the lowest AIC. In order to facilitate the most expedient use of these indicators in field settings, we constructed a series of models in which we systematically omitted indicators that are costly, time- or labor-intensive, or that require specific equipment to examine (i.e. 1. oocyte diameter – costly, time and labor intensive, requires specific equipment and training; 2. organ weights, HSI, and GSI – time and labor intensive, require specific equipment; and 3. total body weight and Fulton’s K – require specific equipment). Resulting model fits were compared to determine the best indicator or combinations of indicators for use under a variety of field scenarios. Omissions were conducted in a stepwise fashion, resulting in four models that range from most inclusive (i.e. all covariates included) to most restrictive (i.e. all covariates listed above omitted). Here, we refer to the four models as A (most inclusive), B, C, and D (most restrictive), respectively. Model accuracy was assessed as a percentage within the dataset by dividing correct predictions (i.e., reproductive phase categories as identified by histological analysis) of female reproductive phase by the total number of predictions.
A principal component analysis (PCA; Joliffe, 2002) was performed to examine the direction and magnitude of the effects, as well as the location of maturity phases relative to the first and second principal components (PC1 and PC2). Additional PCAs were created for proposed models A-D. All statistical analyses were conducted in R version 4.0.4 (2021-02-15).
Temporal changes in female developmental stages showed a clear progression through early-, mid-, and late-secondary growth (SG), final oocyte maturation (OM), and PS over the annual sample collection period (Figure 2A). January and February corresponded to the period of spawning for Pacific halibut females in the sampled area as indicated by the presence of PS females (characterized by CA oocytes and POFs). Females in the initial stages of SG (primary vitellogenesis or Vtg1 stage) were present predominantly between March and June, followed by a significant increase in the percent (50-60% of total) of females in mid SG (secondary vitellogenesis or Vtg2 stage) in July and August. Females in late SG (tertiary vitellogenesis or Vtg3 stage) predominated between September and December. Females undergoing final OM (germinal vesicle migration or GVM and periovulatory or PO stages) were found in low proportion (<7%) in November and December but comprised the majority of non-spawning females in January and a substantial proportion of non-spawning females in February. Nine females in primary growth (PG) were observed during the period of predominantly SG and OM. Of these females, one was at the PG perinuclear (PGpn) stage (observed in December), and the remaining females were at the CA stage, with one female observed in November and seven in December.
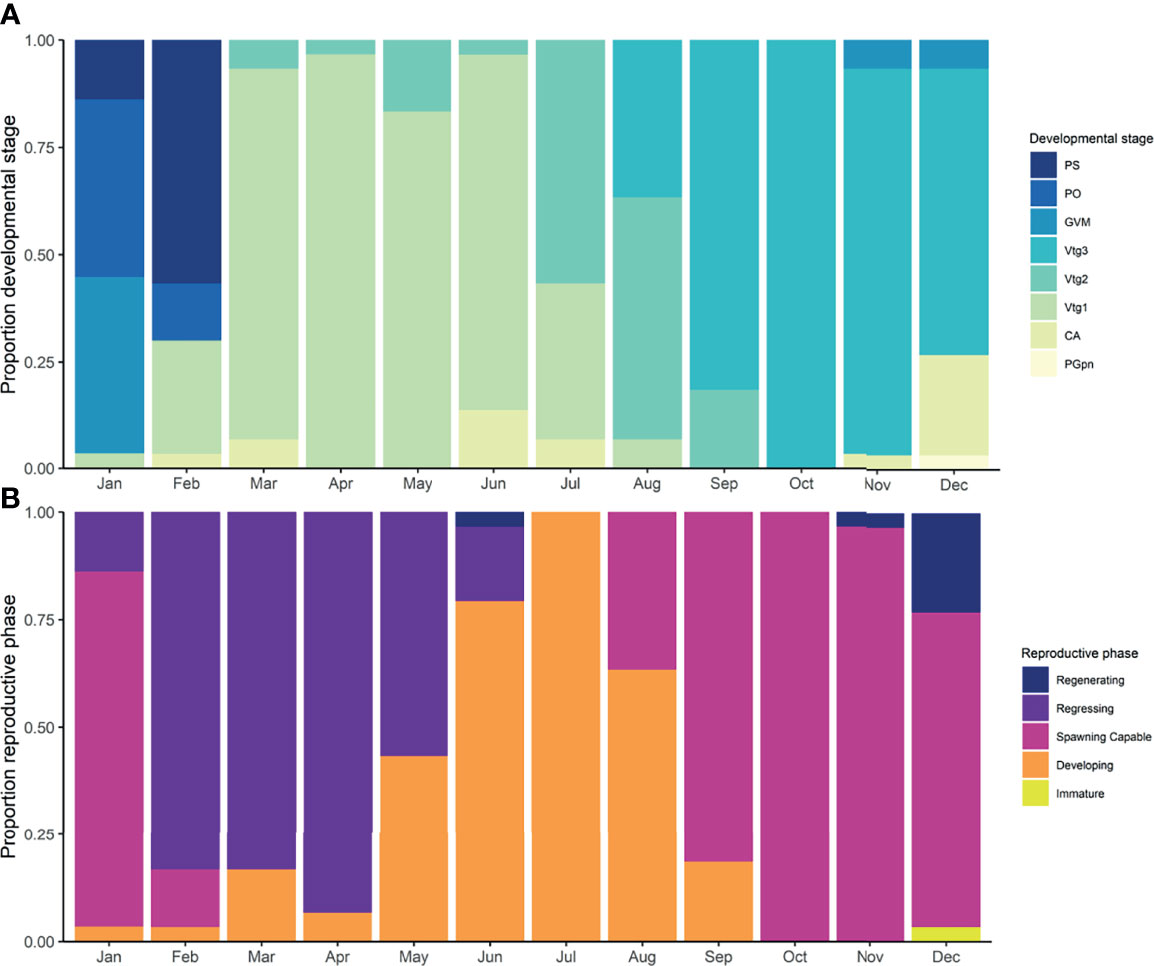
Figure 2 Proportions of developmental stages (A) (Primary Growth Perinuclear, PGpn; Cortical Alveolar, CA; Primary Vitellogenesis, Vtg1, Secondary Vitellogenesis, Vtg2; Tertiary Vitellogenesis, Vtg3; Germinal Vesicle Migration, GVM; Periovulatory, PO; Post-Spawning, PS) of female Pacific halibut where yellow is the earliest developmental stage (PGpn) and dark blue is the most advanced stage that occurs just after spawning (PS); and reproductive phases (B) where chartreuse is immature, orange is developing, magenta is spawning capable, and purple and dark blue represent regressing and regenerating phases.
Reproductive phases also showed a clear temporal progression (Figure 2B) from regressing to developing and to spawning capable prior to the peak of spawning in February. The presence of PS females in January marked the beginning of the regressing phase that predominated from February until April and extended until June. Females in the developing reproductive phase were observed in low proportion (< 15%) from January to April but increased in May and predominated between June and August, decreasing thereafter. Females in the spawning capable phase were first observed in August (30%) and predominated until January, when most females were undergoing OM and the first PS females were observed. While found much less frequently (n = 9) most females in the regenerating phase were found in December (23%) but were also present in low proportions (<1%) in November and June. The only immature fish (at the PGpn developmental stage) was found in December (<1%).
Oocyte diameter (H11 = 198.03, p < 0.001), GSI (H11 = 180.71, p < 0.001), HSI (H11 = 163.97, p < 0.001), Fulton’s K (H11 = 161.38, p < 0.001), age (H11 = 22.75, p = 0.019), and somatic fat (H11 = 34.05, p < 0.001) were significantly different among months (Figure 3). Mean oocyte diameter was lowest in February (493 µm) and increased steadily, with the largest mean diameter (~1800 µm) in January. GSI followed the same temporal pattern as average oocyte diameter: lowest mean values in March increasing to the largest values in January. HSI displayed low mean values between February and May, increased between June and October and declined thereafter. Similarly, mean Fulton’s K values increased from June to August, remained elevated until October and declined thereafter. Age was similar among most months, with the exception of slightly lower mean ages for females sampled in December. Mean fat content increased significantly from February to March, decreased in May, increased significantly again from June to October and, finally, underwent a significant decrease from October to December. The presence of POFs was first detected in January, was high (>80%) from February to April, decreased in May and further decreased in June. No POFs were detected in or after July, suggesting that POFs can be present in the Pacific halibut ovary for approximately 6 months after spawning (Figure 4A). Recent POFs were only observed in January and February, whereas older POFs were observed from January until May, and the oldest POFs were observed starting in February and were the predominant POFs from March to June (Figure 4A).
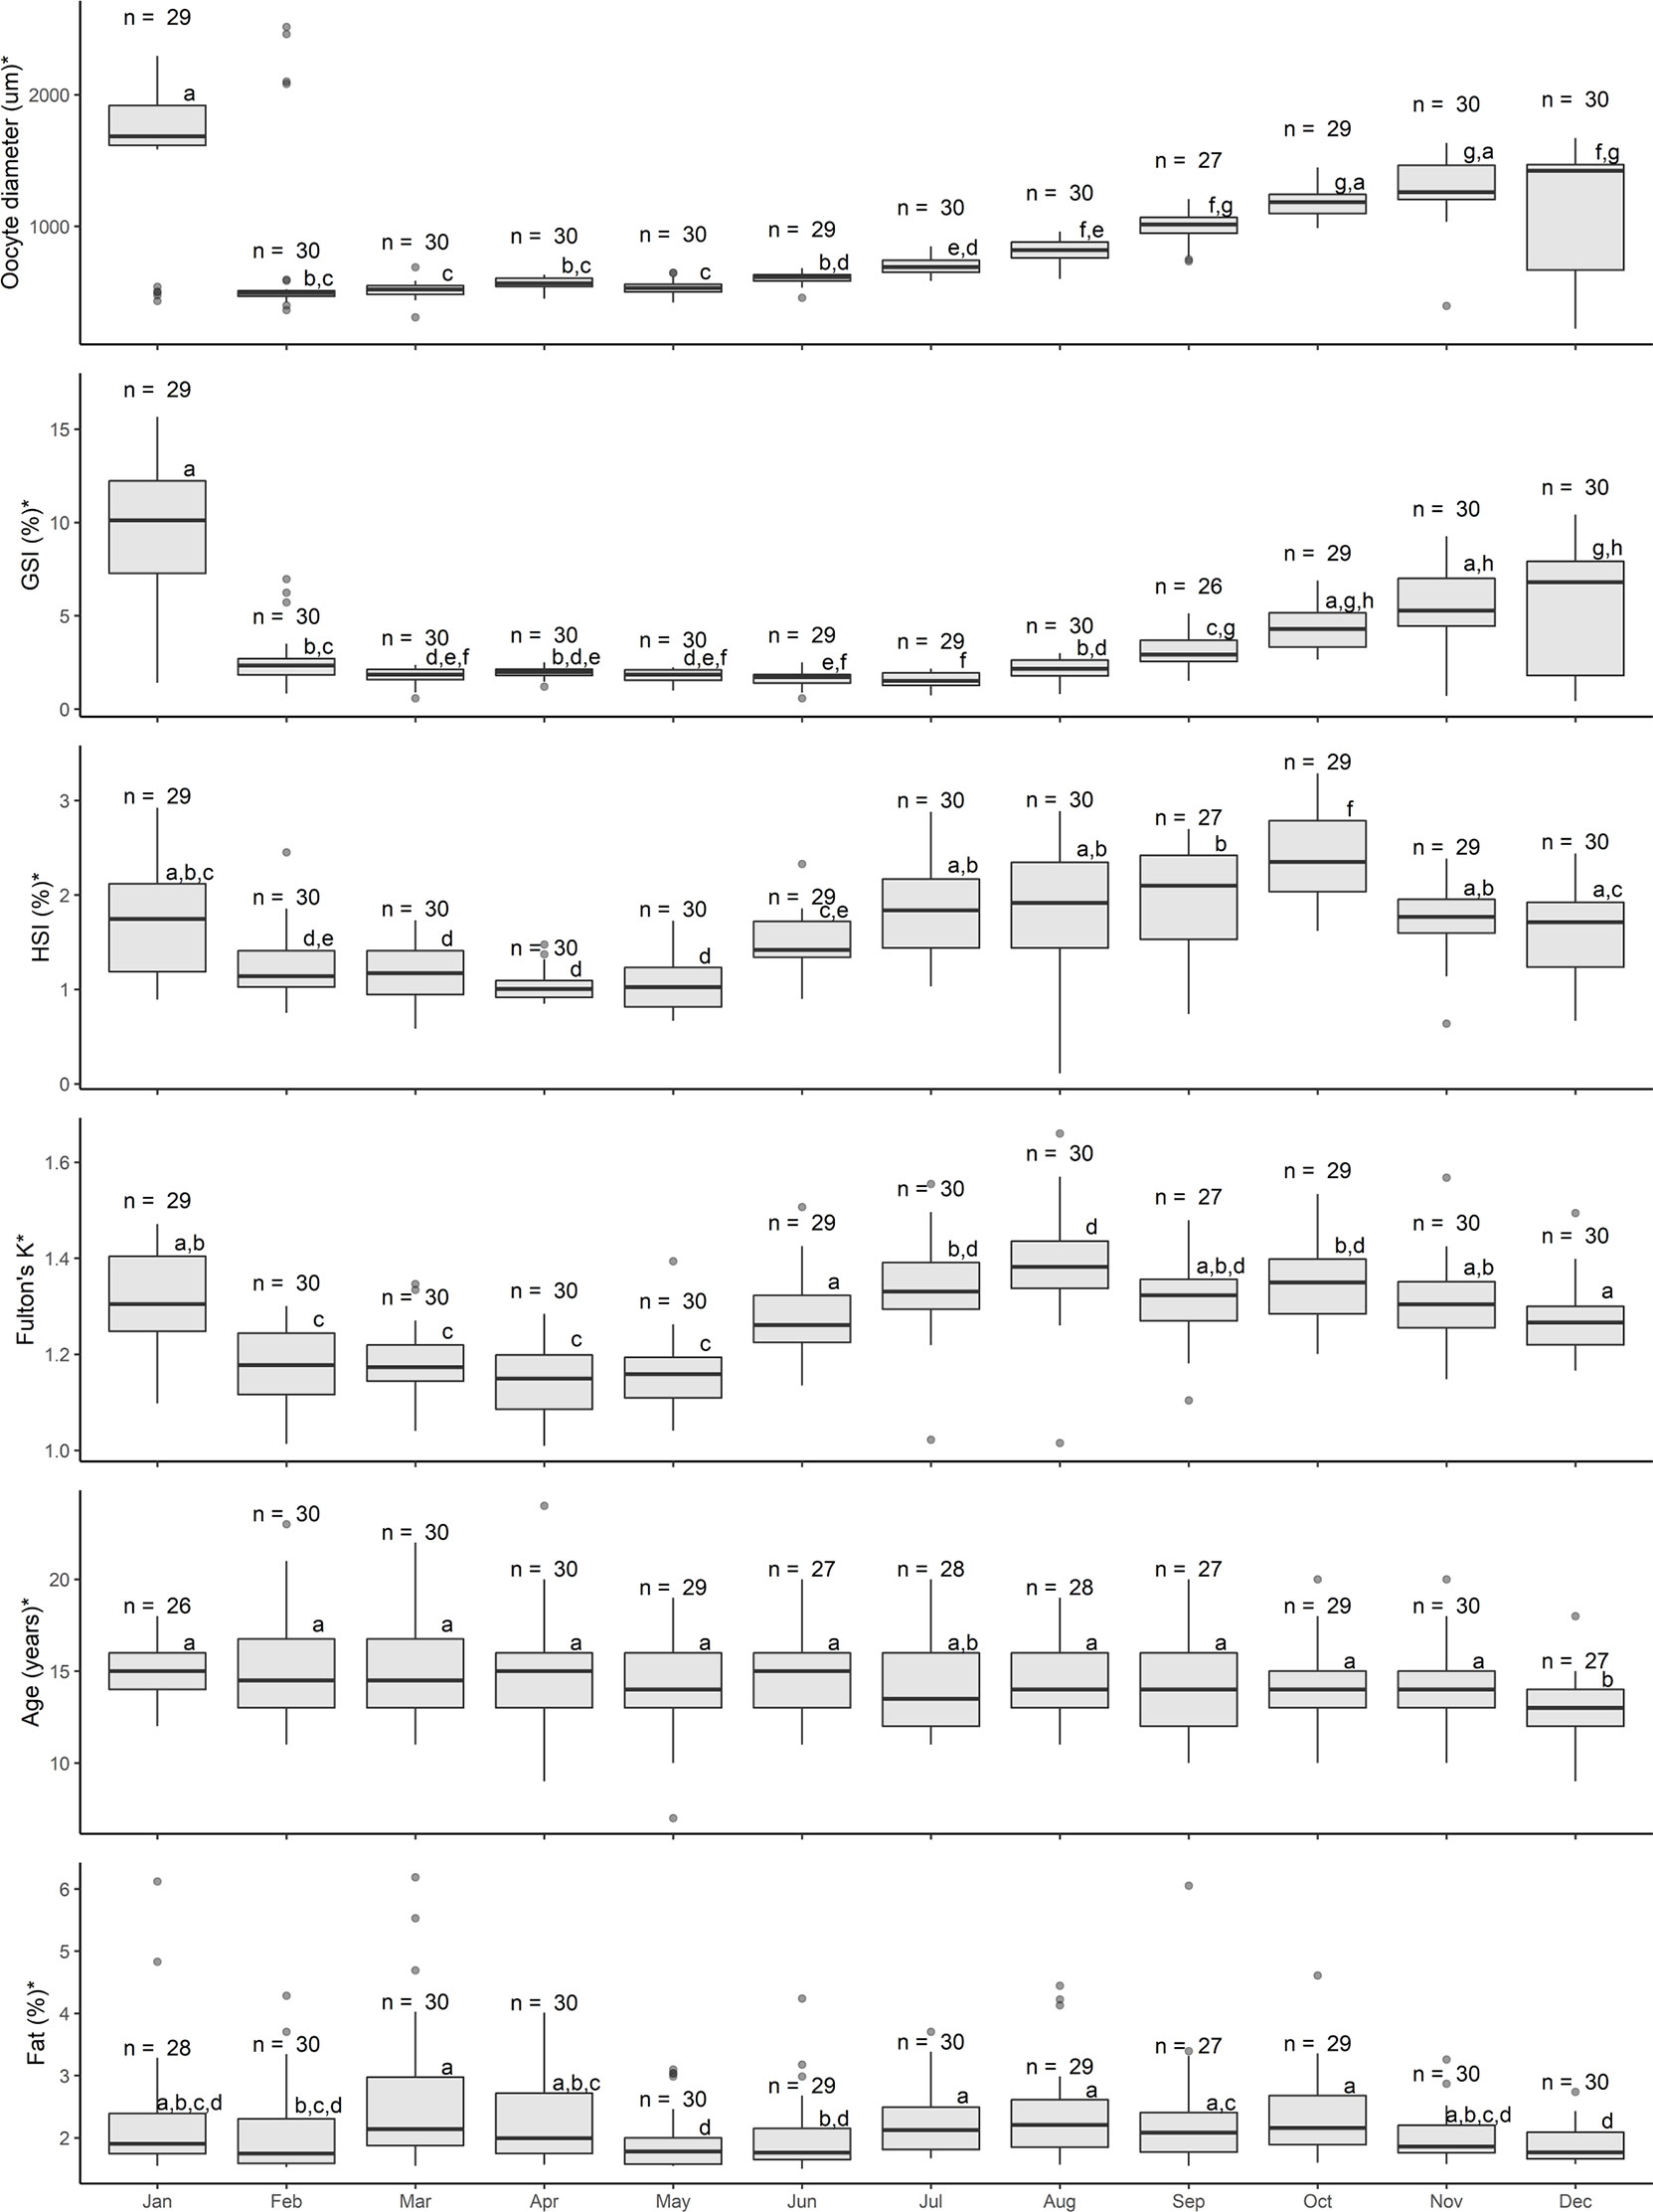
Figure 3 Temporal assessment of oocyte size (diameter in µm), gonadosomatic index (GSI, %), hepatosomatic index (HSI, %), Fulton’s condition factor (K), age (years), and somatic fat (%) of female Pacific halibut during an entire calendar year. For each parameter statistical significance (p < 0.05, Kruskal-Wallis) was denoted with an * in the y-axis title, with different letters indicating statistically significant (p < 0.05, Dunn’s post hoc) differences among groups (e.g. “a” is different from “b” but not from “ab”), and with the sample size displayed above the boxes.
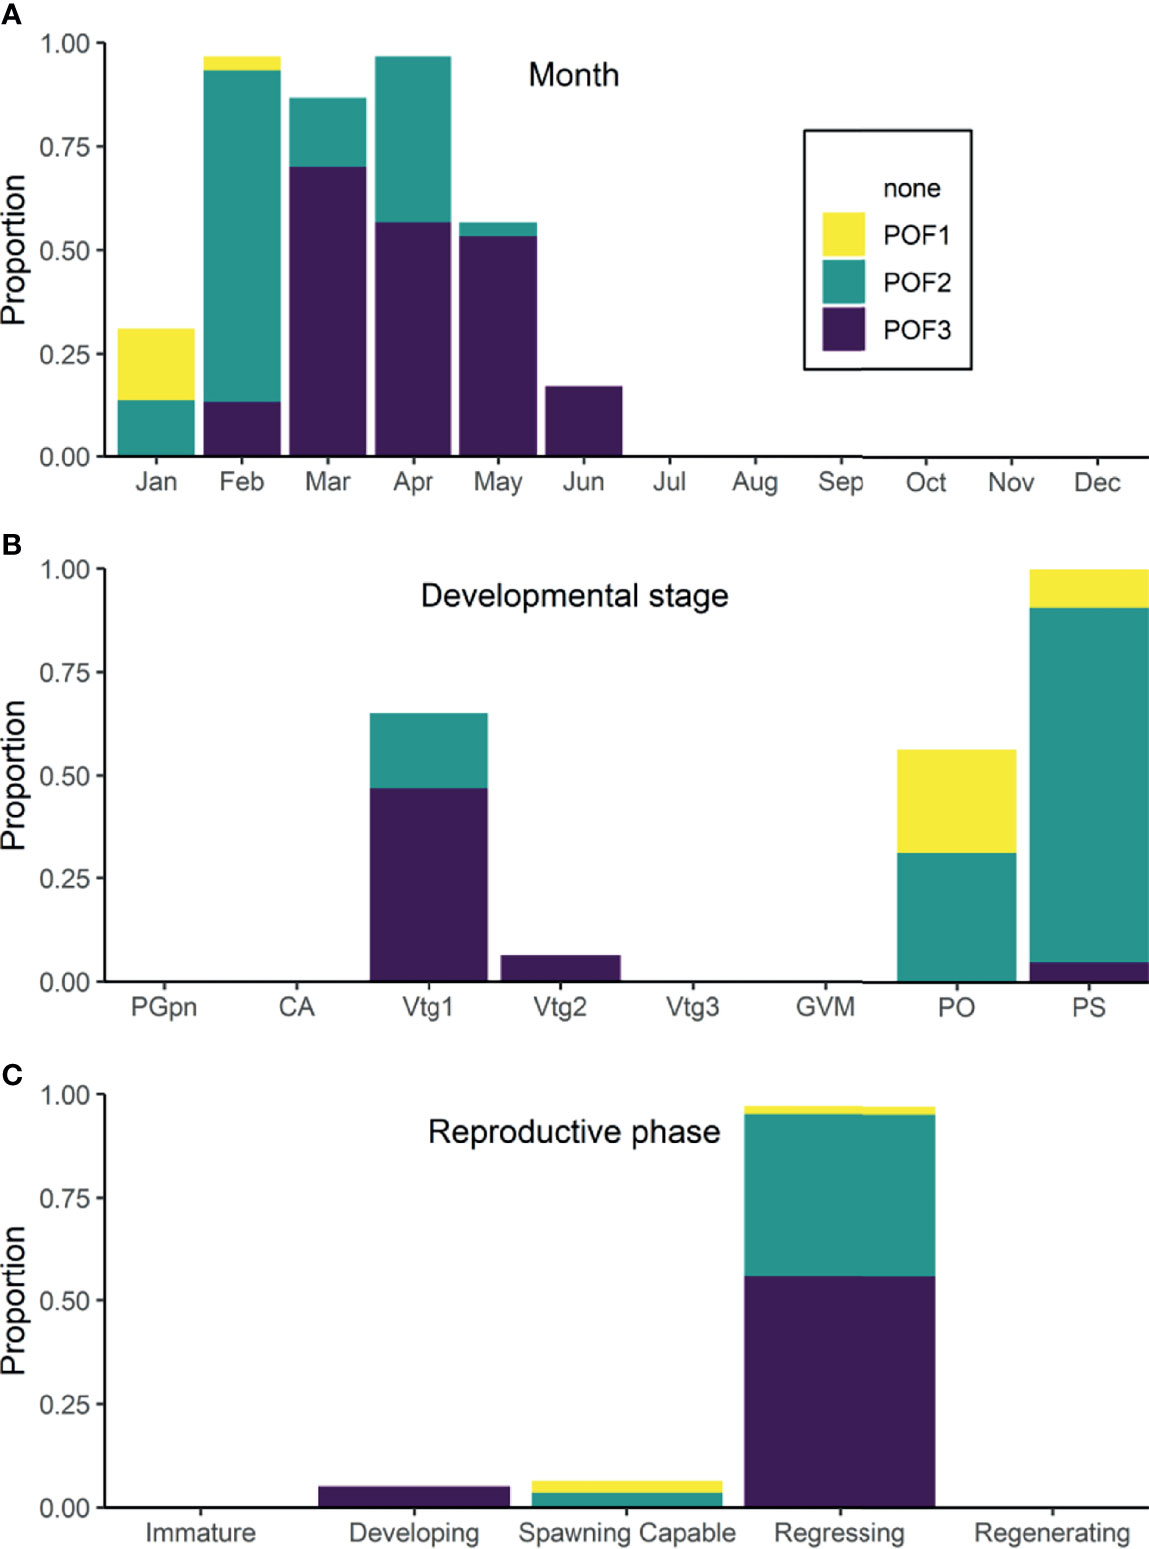
Figure 4 Proportions and relative age of post-ovulatory follicles (POFs) in female Pacific halibut in months (A), developmental stages (B), and reproductive phases (C) where POF1 are ranked as the most recent, POF2 as older, and POF3 as the oldest observed.
Oocyte diameter (H7 = 298.01, p < 0.001), GSI (H7 = 252.11, p < 0.001), HSI (H7 = 153.14, p < 0.001), Fulton’s K (H7 = 106.95, p < 0.001), and age (H7 = 32.54, p < 0.001) were significantly different among female developmental stages; however, somatic fat (H7 = 10.90, p = 0.143) was not (Figure 5). As only one PGpn individual was observed in the dataset, the PGpn stage was omitted from subsequent analyses. Mean oocyte diameter and GSI both increased congruently as females advanced in their developmental stage to PO, with both parameters decreasing significantly at the PS stage. Mean values for HSI and Fulton’s K followed similar patterns with a significant increase at the Vtg2 stage and a subsequent decrease at the PO and PS stages. CA stage females were, on average, younger (~12 years old) than those at more advanced developmental stages. The temporal distribution of female developmental stages for each of the biological indicators measured is shown in Supplemental Figure 1. POFs were present in all PS stage females and in lesser proportion in Vtg1 (>60%), PO (>50%) and Vtg2 stage (~6%) females (Figure 4B). Recent POFs were only observed in PO and PS stage females, whereas older POFs were observed in PS, PO and Vtg1 stage females, and the oldest POFs were observed in PS, Vtg2 and, to a higher proportion (~50%), Vtg1 stage females (Figure 4B). No POFs were observed in females in any other developmental stages.
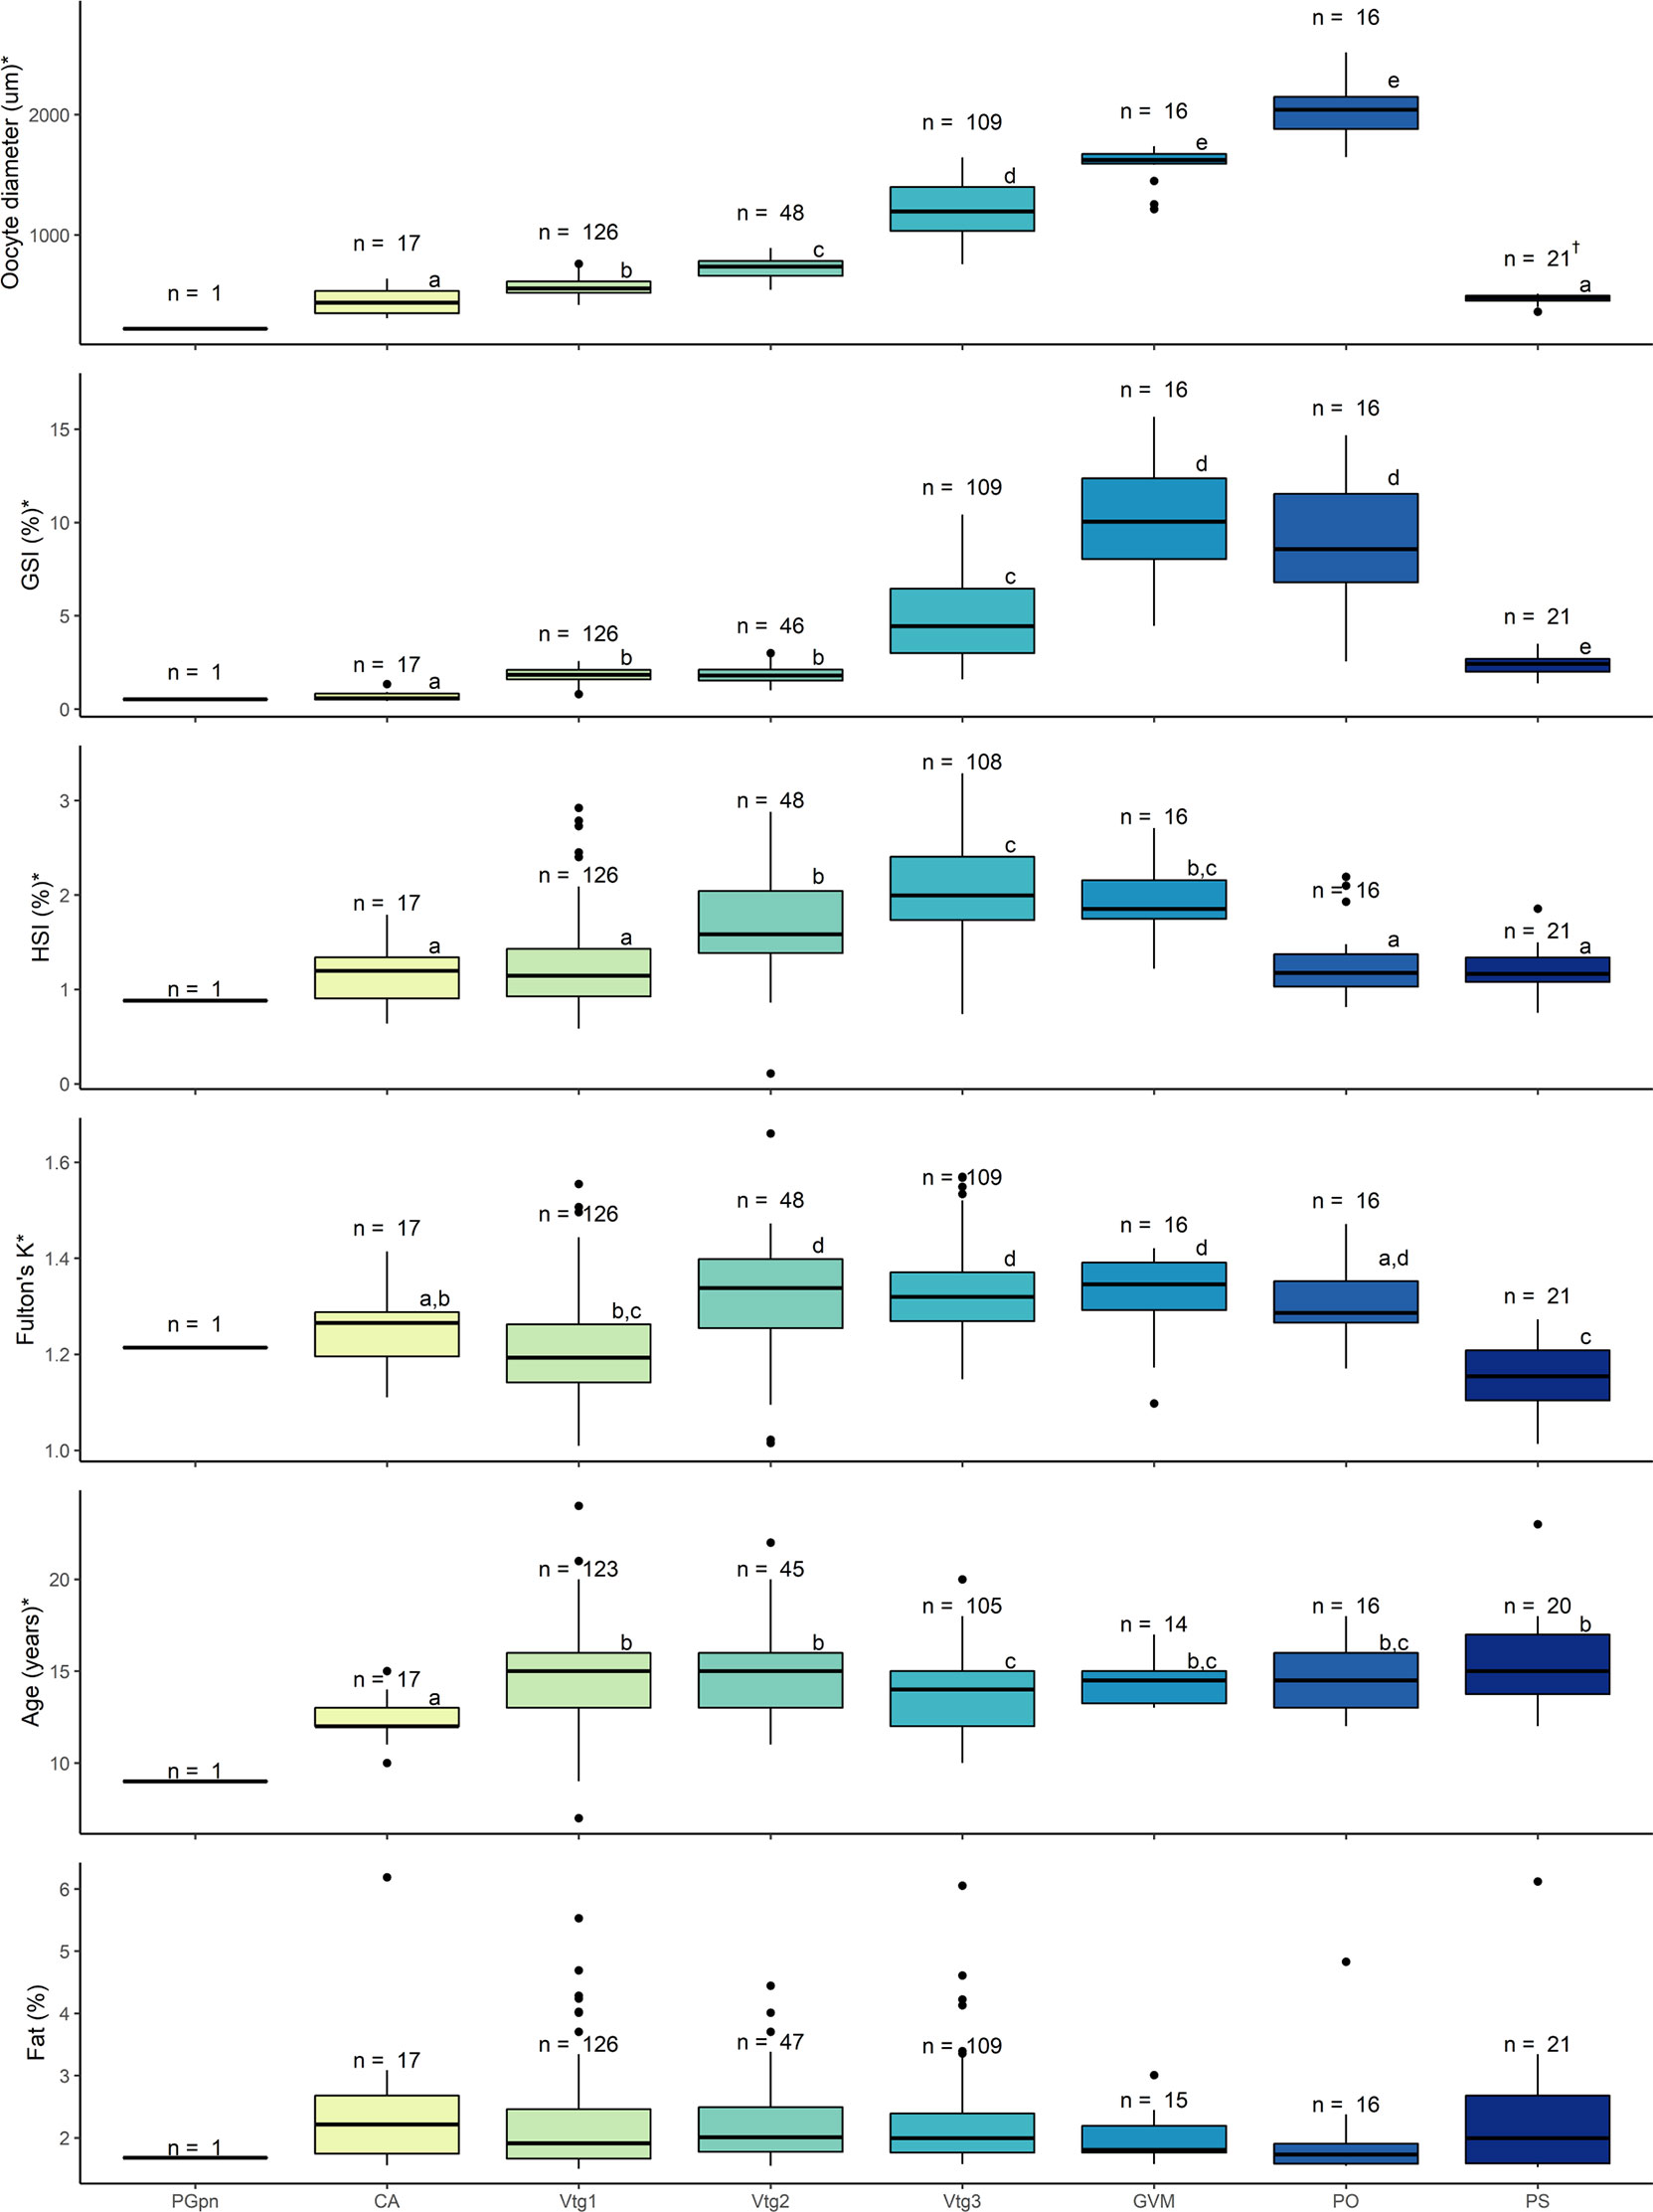
Figure 5 Oocyte size (diameter in µm), gonadosomatic index (GSI, %), hepatosomatic index (HSI, %), Fulton’s condition factor (K), age (years), and somatic fat (%) of female Pacific halibut according to developmental stage. For each parameter, statistical significance (p < 0.05, Kruskal-Wallis) was denoted with an * in the y-axis title, with different letters indicating statistically significant (p < 0.05, Dunn’s post hoc) differences among groups (e.g. “a” is different from “b” but not from “ab”), and with the sample size displayed above the boxes. PS stage, denoted by † is identified by the presence of POFs and, therefore, the oocyte diameters are representative of the CA oocytes which in this case only are not the most advanced follicle.
Oocyte diameter (H4 = 278.45, p < 0.001), GSI (H4 = 238.82, p < 0.001), HSI (H4 = 150.72, p < 0.001), and Fulton’s K values (H4 = 128.25, p < 0.001) were significantly higher in females at the spawning capable phase than in all other reproductive phases (Figure 6). For females at the regressing phase, mean values of biological indicators were significantly lower than those for females in the developing phase, with the exception of GSI which were significantly higher. In females at the regenerating phase, mean oocyte diameter, GSI and HSI values were overall lower than in females at the regressing phase but only significantly for GSI. Age was significantly different among reproductive phases (H4 = 22.10, p < 0.001). Females in the regressing phase were the oldest and had the widest age range, while regenerating females were the youngest and had the smallest age range. Developing and spawning capable female ages were intermediate. No significant differences in somatic fat content were observed among reproductive phases (H4 = 2.32, p = 0.676). The temporal distribution of female reproductive phases for each of the biological indicators measured is shown in Supplemental Figure 2. POFs were observed in all regressing phase females, with a small proportion of recent and a similar proportion of older and oldest POFs (Figure 4C). In contrast, a small proportion of POFs were observed in spawning capable phase females (7%; only recent and older POFs) and in developing phase females (5%; oldest POFs) (Figure 4C).
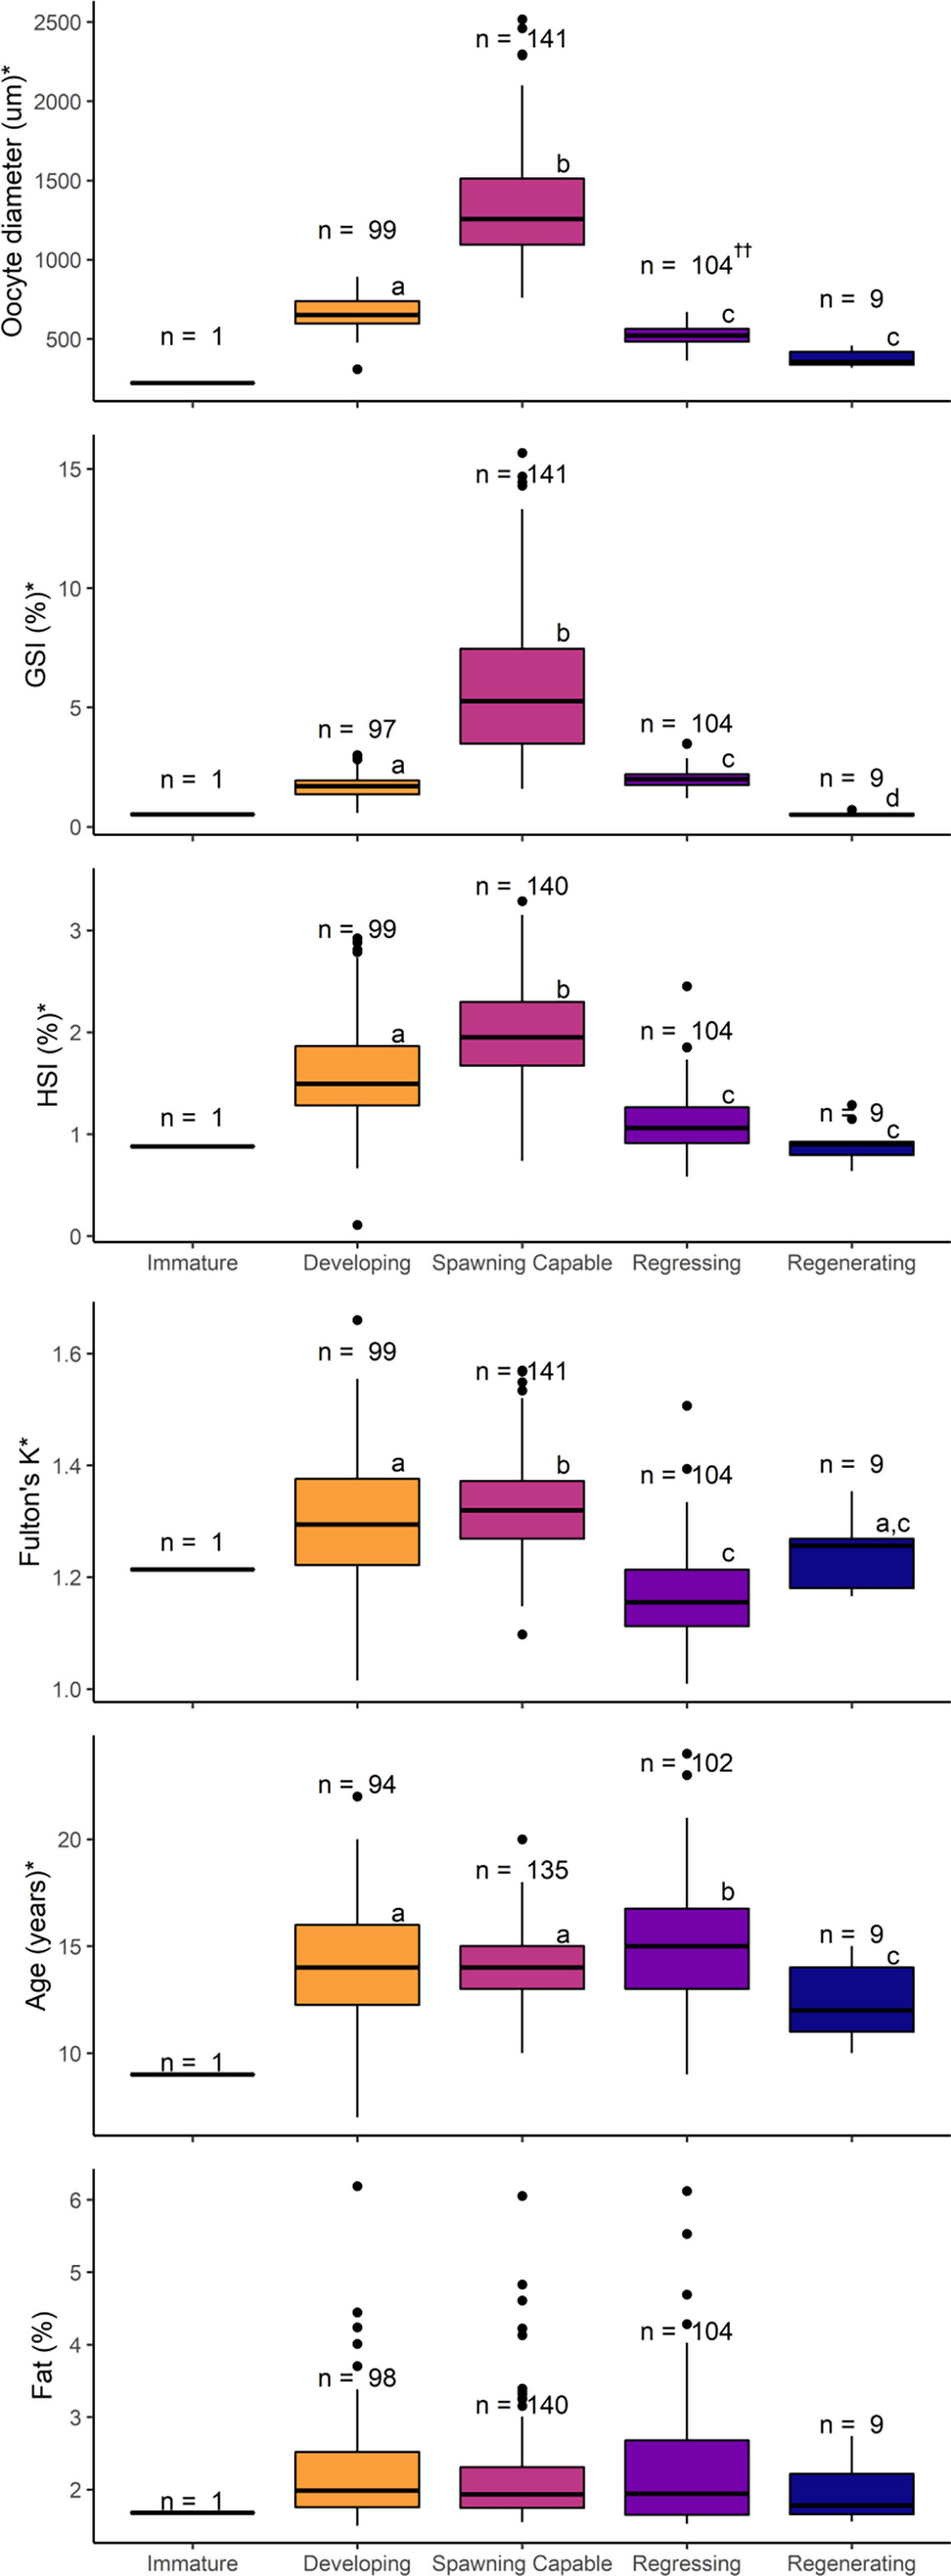
Figure 6 Oocyte size (diameter in µm), gonadosomatic index (GSI, %), hepatosomatic index (HSI, %), Fulton’s condition factor (K), age (years), and somatic fat (%) of female Pacific halibut according to the reproductive phase. For each parameter, statistical significance (p < 0.05, Kruskal-Wallis) was denoted with an * in the y-axis title, with different letters indicating statistically significant (p < 0.05, Dunn’s post hoc) differences among groups (e.g. “a” is different from “b” but not from “ab”), and with the sample size displayed above the boxes. Regressing phase, denoted by ††, contains 21 PS stage fish as identified by presence of POFs and, therefore, oocyte diameters are representative of the CA oocytes which in this case are not the most advanced follicle.
Substantial variability was evident in the strengths and directions of correlations among individual indicators (Figure 7). Very strong positive correlations (ρ ≥ 0.70; Dancey and Reidy, 2004) were observed for 6 of 66 comparisons: length/weight (ρ = 0.93, p < 0.0001), GSI/gonad weight (ρ = 0.85, p < 0.0001), oocyte diameter/gonad weight (ρ = 0.81, p < 0.0001), HSI/liver weight ρ = 0.79, p < 0.0001), oocyte diameter/GSI (ρ = 0.74, p < 0.0001), and liver weight/Fulton’s K (ρ = 0.72, p < 0.0001). Strong positive correlations (ρ = 0.40 – 0.69; Dancey and Reidy, 2004) were observed for 16 additional comparisons: total body weight/liver weight (ρ = 0.67, p < 0.0001), HSI/Fulton’s K (ρ = 0.62, p < 0.0001), gonad weight/liver weight (ρ = 0.59, p < 0.0001), oocyte diameter/HSI (ρ = 0.58, p < 0.0001), oocyte diameter/liver weight (ρ = 0.57, p < 0.0001), oocyte diameter/Fulton’s K (ρ = 0.57, p < 0.0001), month/liver weight (ρ = 0.49, p < 0.0001), fork length/liver weight (ρ = 0.48, p < 0.0001), gonad weight/Fulton’s K (ρ = 0.46, p < 0.0001), HSI/gonad weight (ρ = 0.46, p < 0.0001), total body weight/gonad weight (ρ = 0.46, p < 0.0001), total body weight/Fulton’s K (ρ = 0.46, p < 0.0001), month/HSI (ρ = 0.44, p < 0.0001), month/oocyte diameter (ρ = 0.43, p < 0.0001), GSI/HSI (ρ = 0.43, p < 0.0001), and month/Fulton’s K (ρ = 0.41, p < 0.0001). Only 5 indices were strongly or very strongly negatively correlated: depth/liver weight (ρ = -0.64, p < 0.0001), depth/month (ρ = -0.62, p < 0.0001), depth/Fulton’s K (ρ = -0.59, p < 0.0001), depth/HSI (ρ = -0.50, p < 0.0001), and depth/total body weight (ρ = -0.46, p < 0.0001).
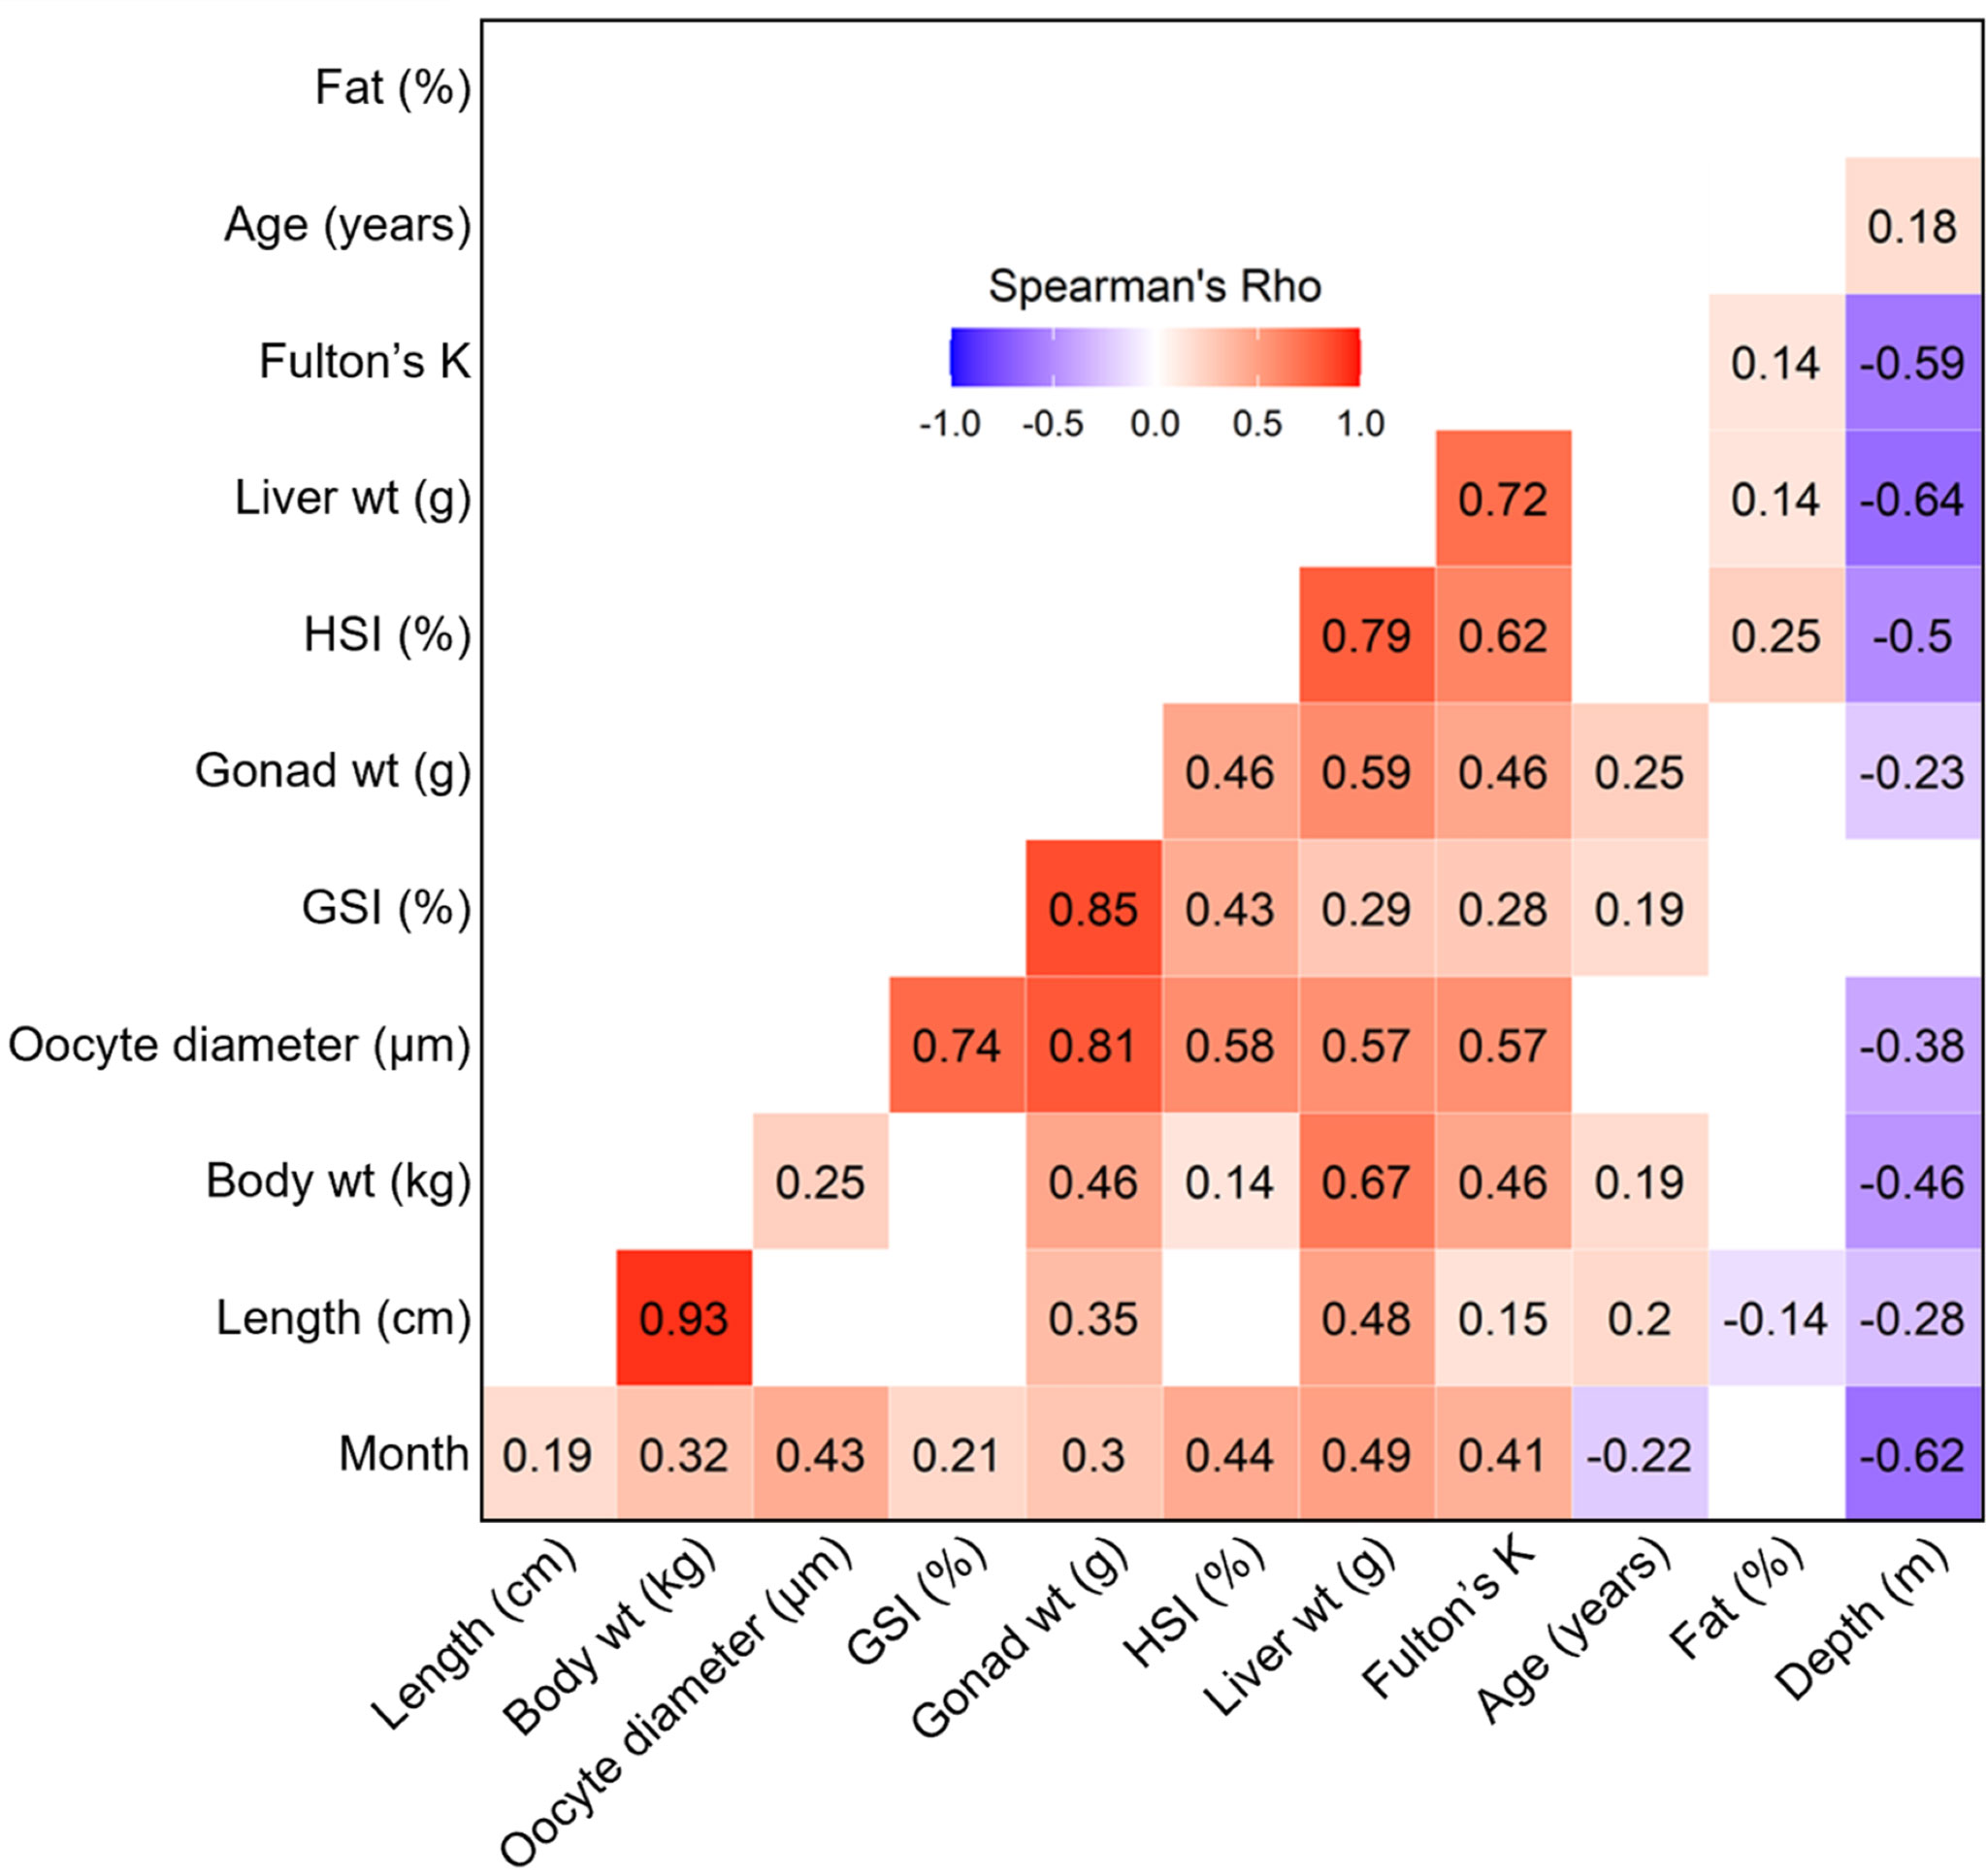
Figure 7 Spearman’s correlations of biological indices for all statistically significant comparisons (p < 0.05). Direction of correlation is mapped with red (positive) and blue (negative) color scheme, and magnitude of correlation is shown from lighter tints (weak) to dark (strong).
AIC scores (Supplemental Table 1) indicated that the most parsimonious model for predicting reproductive phase using all available potential indicators of reproductive development (model A; Table 2) had an accuracy of 94%. Influential covariates in this global model included oocyte diameter, GSI, age, and depth. A slightly more restrictive model, in which oocyte diameter was removed, was nearly as accurate (model B; accuracy = 90%). Influential covariates in this model included GSI, age, depth, and HSI. Two additional models (models C and D) were far less accurate (72% and 63% accuracy, respectively). Influential covariates in these models included age, total body weight, Fulton’s K, length, and depth (model C); and age, length, and depth (model D).
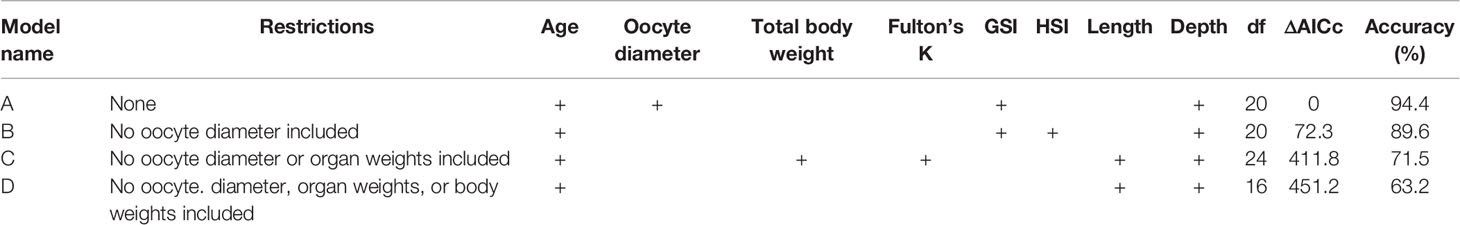
Table 2 Summary of models (Models A-D) predicting female Pacific halibut reproductive phase, including model name, logistical restrictions, variables retained in best-fit models denoted by a “+”, degrees of freedom (df), change in AICc from the best model (ΔAICc), and the percent accuracy defined as the number of correct predictions out of total.
PCA suggested moderate grouping among reproductive phases (Figure 8) with spawning capable fish associated with larger oocyte diameter, GSI, gonad weight, HSI, and Fulton’s K values and shallower depths. In contrast, regressing and regenerating fish were associated with smaller oocyte diameter, GSI, gonad weight, HSI, and Fulton’s K values, and deeper depths. Developing fish occupied a much more centralized position associated with more moderate values of the examined variables. Further, the resolution of reproductive phases (as observed by decreased grouping and increased overlap of ellipsis) decreased from model A to model D (Figures 8A–D), suggesting moderate utility in predicting reproductive phases using an abridged suite of covariates should on-vessel constraints prevent collection of all covariates explored here.
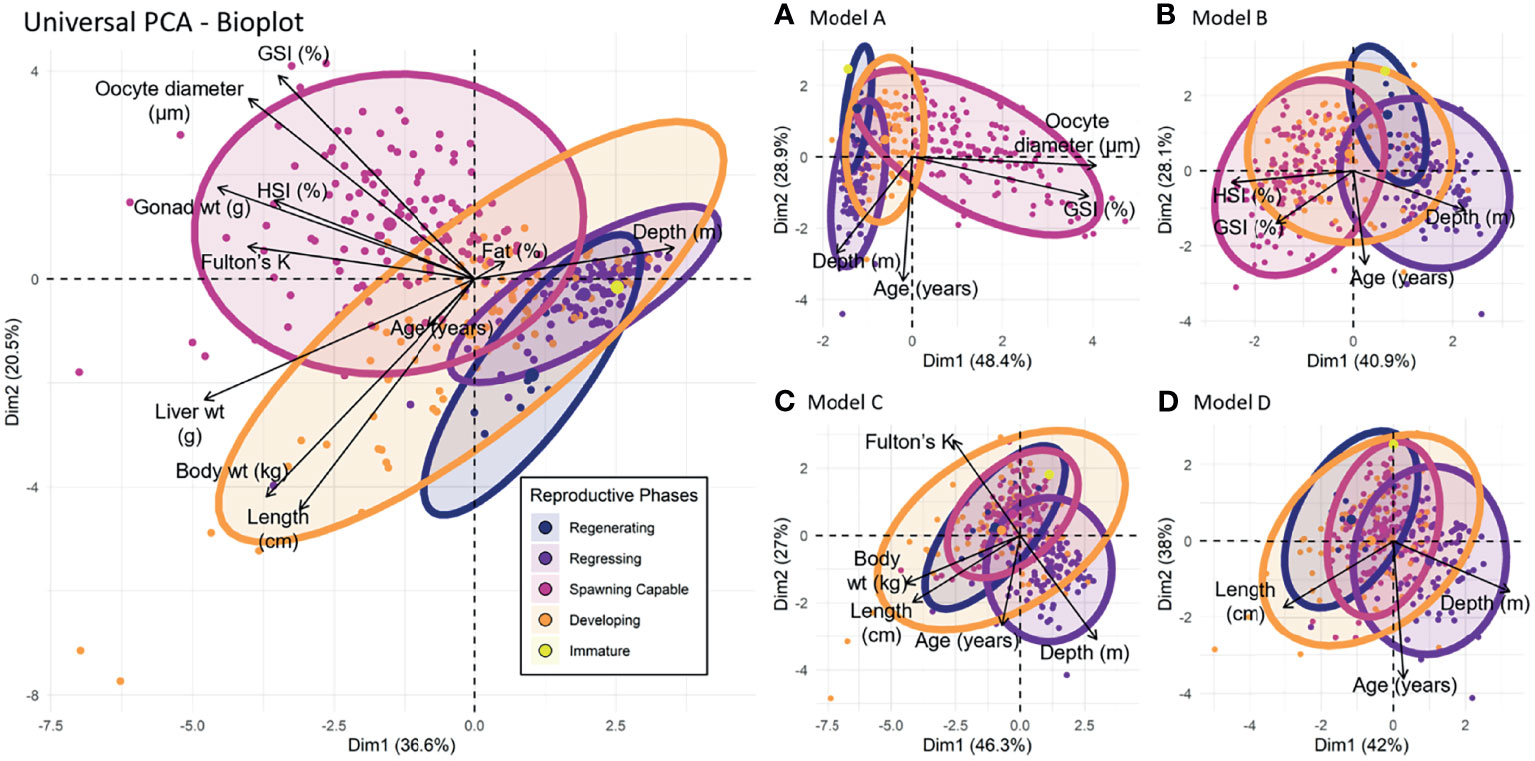
Figure 8 Principal component analysis (PCA) biplot of biological indices grouped by reproductive phase of female Pacific halibut. The x-axis represents the first principal component (PC1) and the y-axis represents the second component (PC2). Together they account for 57.1% of the total variance observed in the data. Side panels (A-D) are PCA biplots of the best models (model A-D) developed from survey variables constrained by logistical sampling challenges and are useful visual keys to how the proposed model parameters interact with each other as well the separation of phases within each model.
This study represents the first attempt to characterize female Pacific halibut reproductive development through time and explore relationships among physiological characteristics, developmental stage, and reproductive phase. Monthly histological examination revealed a clear progression in female developmental stages. Based on this progression, and the timing at which PS females were observed, we conclude that spawning in the Portlock region in the central Gulf of Alaska takes place in January and February, as suggested by previous studies of spawn timing (St-Pierre, 1984) and observations of electronically tagged Pacific halibut (Seitz et al., 2005; Loher and Seitz, 2008). After spawning, Pacific halibut enter early SG and move through mid and late SG, with females initiating and completing GVM in January. Further, our data show that transitions between female developmental stages occur in succession, are completed in full and most likely result in spawning. This is supported by the observed size progression of the largest cohort of oocytes through advancing female developmental stages in Pacific halibut (Fish et al., 2020), that is characteristic of group-synchronous ovarian development. Our results therefore suggest that female Pacific halibut sampled in the central Gulf of Alaska follow an annual reproductive cycle, in contrast to the two-year oocyte developmental period reported in the related Greenland halibut (Reinhardtius hippoglossoides; Rideout et al., 2012). Furthermore, the initiation of the spawning capable reproductive phase in August, that marks the time of the reproductive cycle when females appear fully committed to spawning, provides an excellent opportunity for future collections of biological samples during annual summer surveys conducted by the International Pacific Halibut Commission to (1) update maturity ogives based on histological data and (2) investigate potential changes in spatial and temporal patterns of reproductive development in response to environmental change.
The annual reproductive cycle of Pacific halibut females was characterized by temporal changes in measured biological indicators. Oocyte diameter and GSI, both strongly correlated, displayed lower values in the spring and summer, increased through the autumn, and eventually peaked in late winter, coinciding with late SG and oocyte maturation. The increase in GSI observed in females at the GVM and PO stages is similar to observations on other flatfish species such as Greenland halibut (Fedorov, 1971; Kennedy et al., 2014), California halibut (Paralichthys californicus; Lesyna and Barnes, 2016), common sole (Solea solea L.; Ramsay and Witthames, 1996), winter flounder (Pseudopleuronectes americanus; McBride et al., 2013; Press et al., 2014) and summer flounder (Paralichthys lethostigma; Midway and Scharf, 2012).
While higher oocyte diameter and GSI values indicate later stages of female reproductive development, HSI and Fulton’s K are strong indicators of the transition from early to late SG. HSI and Fulton’s K are moderately correlated and display gradual increases over the summer and autumn, coinciding with the entry of Pacific halibut females into mid and late SG. The observed increase in HSI can be attributed to the growth of the liver in relation to its increased role in producing lipoproteins that are released in the bloodstream and incorporated into the growing SG oocytes (Lubzens et al., 2010), likely as a result of surplus energy derived from feeding along the continental shelf during the summer months. Similar temporal patterns have been observed for HSI and Fulton’s K in sablefish (Guzmán et al., 2017), and for HSI in California halibut (Lesyna and Barnes, 2016), and Arctic cod (Skjæraasen et al., 2009). These results suggest that Fulton’s K, a simple index measure using only length and weight, could potentially be used as a proxy for both relative HSI and the progression of SG in female Pacific halibut. Furthermore, the subsequent decrease in both HSI and Fulton’s K in Pacific halibut females upon reaching late SG and GVM stage is likely a reflection of the use and mobilization of stored energy in the liver to support the later stages of the reproductive cycle, including reproductive migration to spawning grounds on the continental shelf edges and slopes as well as spawning behavior. These observations therefore support that Pacific halibut is a capital breeder like other Pleuronectiform species that display similar group synchronous oocyte development and determinate fecundity (reviewed in McBride et al., 2015).
Somatic fat content showed a small increase after spawning during the progression from late PG to early SG, coinciding with the increase in HSI and Fulton’s K, and a decrease during the transition between late SG and OM. While we note that these changes were not significant, the variations may be indicative of hepatic lipid mobilization during the SG phase with potential lipid deposition in skeletal muscle, possibly as an adaptation for spawning migration. Indeed, somatic fat and HSI showed a very modest, but positive, correlation (ρ = 0.14; Figure 7), and sustained swimming in other fish species has been shown to be metabolically supported by lipid-derived energy in skeletal muscle (reviewed in Magnoni et al., 2013). Interestingly, somatic fat content appeared to increase after spawning, followed by HSI and Fulton’s K, possibly as a result of resuming feeding, as shown in other flatfish species (Wuenschel et al., 2009).
Biological indicators can also act as useful guides for characterizing females into reproductive phases for management purposes. Our PCA results show relatively distinct separations among three of the five reproductive phases, with spawning capable fish (comprised of females in the Vtg3, GVM, and PO developmental stages) associated with elevated GSI, oocyte diameter, gonad weight, HSI, and Fulton’s K values compared to developing fish (comprised of females in the CA and Vtg1 developmental stages), which displayed intermediate values. Females in the regressing reproductive phase (comprised of individuals with evidence of recent spawning) had lower oocyte diameter, HSI, and Fulton’s K values and were older than fish at the developing and spawning capable phases. This distinction in the values of biological indicators among these three reproductive phases fosters the potential to assign the reproductive phase using proxy measures that are relatively easily obtained. As would be expected, separation between the reproductive phases decreases as biological covariates are removed (Figures 8A–D). Interestingly, regenerating phase fish have a more positive association with length compared to the regressing phase which may suggest certain tradeoffs between energy into somatic growth as compared to oocyte development. We note that our study design, chosen to best describe reproductive development, was biased towards mature or maturing females and that the immature reproductive phase is not well represented in our data or results (n = 1 female in the PGpn developmental stage and immature reproductive phase).
Despite distinction in the values of biological indicators among the reproductive phases, predictive models aimed at reproductive phase assignment must perform with extreme accuracy, stemming from the importance of reproductive phase assignments in estimating maturity ogives for stock assessment purposes. Our models A and B demonstrate that reproductive phase of Pacific halibut can very accurately be predicted given depth of sample collection, age, GSI, and either oocyte diameter or HSI (90 – 94%; Table 2), but model accuracy quickly declines when the inputs are restricted. Further, one may question the utility of a predictive model that still requires time and labor-intensive covariates (e.g. oocyte diameter, GSI) or that is potentially specific to one geographic area (e.g. depth). In this regard, researchers and managers should note the predictive power associated with more restricted models (e.g. models C and D) and decide whether it is sufficient to meet their respective needs. The high levels of accuracy achieved by our top-performing models does; however, suggest that predictive models may perform equally or better than the current method used in the field for maturity assignment – gross visual inspection of the gonad – but further model and covariate refinement and methodological comparisons are needed. Nevertheless, our model accuracies are similar to those generated for sablefish by Rodgveller (2019), and demonstrative of the potential for model-based reproductive phase assignment in Pacific halibut and other species.
Somewhat surprisingly, depth was retained as a covariate in all our models. This inclusion does, in part, conform to expectations that during the spawning season more developed fish will be found at more profound depths. We base this expectation on previous studies of Pacific halibut biology (St-Pierre, 1984; Loher and Seitz, 2008) and our own data showing strong negative correlations between depth and other potential indicators of more advanced reproductive development (i.e. high Fulton’s K, HSI, and liver weight values; ρ = 0.59,= -0.50, and -0.64, respectively; Figure 7). However, relative influence of depth in our predictive models may also be an artifact of our sampling design and collection methods, as fishers traveled to deeper waters in the winter months to collect the large female Pacific halibut required by the study design (Figures 1B, C). As evidence of this phenomenon, we see a strong correlation between depth and month (ρ = 0.62; Figure 7). As such, we caution that depth may play a potentially confounding role in the relationship between month and spawning shown in our results (Figure 2). In previous work, Rodgveller (2019) also advised scrutiny in timing of sample collection to ensure reliability in the relationships between reproductive phases and reproductive and developmental indicators. Therefore, the effectiveness of the female Pacific halibut models, or even in the current reproductive phase macroscopic measures, may be improved by sampling closer to the onset of spawning (October to January).
It is worth noting the identification of 8 females that were classified into the regenerating reproductive phase during a period (November-December) dominated by females in the spawning capable phase. These females were all in the CA developmental stage and showed some histological indications suggestive of reproductively mature fish (e.g. enlarged blood vessels, gamma or delta atresia, and a more loose ovarian structure than would be expected for an immature ovary), but lacked concrete evidence of previous spawning (e.g. POFs). In addition, these females were large (91-122 cm FL; 9.56-24.1 kg W), showed significantly lower GSI and HSI values than developing females, and were significantly younger on average (ranged from 10 to 15 years) than females in the developing, spawning capable, and regressing phases (Figure 6). Given that age at 50% maturity for female Pacific halibut is estimated at ~12 years (Stewart and Webster, 2021), we cannot rule out the possibility that these regenerating females may actually be immature females undergoing abortive maturation, as we are unable to differentiate between females that may have arrested the first attempted reproductive cycle (i.e. reproductively immature) and those that had previously spawned but that arrested the current reproductive cycle (true skip spawners; Rideout et al., 2005). Clearly, future studies that include larger numbers of immature and mature females are needed to better characterize the possible incidence of skip spawning in Pacific halibut.
The work described here represents the first detailed examination of temporal changes in developmental stages, reproductive phases, and biological indicators of Pacific halibut reproductive development. We demonstrate that female Pacific halibut have a cyclic annual reproductive cycle involving a clear progression of female developmental stages towards spawning within a single year. These results provide foundational information for future studies aimed at updating maturity ogives by histological assessment and at investigating skip spawning in Pacific halibut. Furthermore, we demonstrate the potential use of easily-obtained biological indicators in predictive models to assign reproductive phase in Pacific halibut.
The original contributions presented in the study are included in the article/Supplementary Material. Further inquiries can be directed to the corresponding author.
Ethical review and approval was not required for the animal study because the tissues were collected as part of survey activities conducted under a letter of acknowledgment from the National Oceanographic and Atmospheric Administration (NOAA) Fisheries division. Nonetheless, biological samples were collected under the guidelines for the euthanasia of finfish as outlined by the American Veterinary Medical Association (AVMA, 2020).
TF contributed to the study design, collected samples, analyzed and interpreted the results and was the primary manuscript author. NW assisted with analysis, and interpretation of the results and assisted TF in writing the manuscript. TS assisted with model building and interpretation of PCA results. BH assisted in early project design and analysis and manuscript development. JP designed the study, supervised data collection, analysis and interpretation, and edited the manuscript. All authors read and approved the final manuscript. BH assisted in early project design and analysis and manuscript development.
This study and TF were supported by funding from the International Pacific Halibut Commission with additional funds provided by Alaska Education Tax Credit contributions from the At-Sea Processors Association and the Groundfish Forum.
The authors declare that the research was conducted in the absence of any commercial or financial relationships that could be construed as a potential conflict of interest.
All claims expressed in this article are solely those of the authors and do not necessarily represent those of their affiliated organizations, or those of the publisher, the editors and the reviewers. Any product that may be evaluated in this article, or claim that may be made by its manufacturer, is not guaranteed or endorsed by the publisher.
The authors send gratitude to the International Pacific Halibut Commission setline survey specialists as well as Joan Forsberg for biological sample collection, processing, and continued laboratory and equipment support.
The Supplementary Material for this article can be found online at: https://www.frontiersin.org/articles/10.3389/fmars.2022.801759/full#supplementary-material
American Veterinary Medical Association (2020). VMA Guidelines for the Euthanasia of Animals: 2020 Edition. Schauburg, Illinois. Available at: https://www.avma.org/sites/default/files/2020-02/Guidelines-on-Euthanasia-2020.pdf.
Berg O. K., Finstad A. G. (2008). “Energetic Trade-Offs in Reproduction: Cost-Benefit Considerations and Plasticity,” in Fish Reproduction (Boca Raton: CRC Press), 351–376. doi: 10.1201/b10747
Brown-Peterson N. J., Wyanski D. M., Saborido-Rey F., Macewicz B. J., Lowerre-Barbieri S. K. (2011). A Standardized Terminology for Describing Reproductive Development in Fishes. Marine Coastal Fisheries 3 (1), 52–705. doi: 10.1080/19425120.2011.555724
Carpi P., Loher T., Sadorus L. L., Forsberg J. E., Webster R. A., Planas J. V., et al. (2021). Ontogenetic and Spawning Migration of Pacific Halibut: A Review. Rev. Fish Biol. Fisheries.31, 879–908. doi: 10.1007/s11160-021-09672-w
Clark W. G., Hare S. R., Parma A. M., Sullivan P. J., Trumble R. J. (1999). Decadal Changes in Growth and Recruitment of Pacific Halibut (Hippoglossus Stenolepis). Can. J. Fisheries Aquat. Sci. 56 (2), 242–525. doi: 10.1139/f98-163
Dancey C., Reidy J. (2004). Statistics Without Maths for Psychology: Using SPSS for Windows (Prentice Hill: London).
Fedorov K. E. (1971). The State of the Gonads of the Barents Sea Greenland Halibut, Hippoglossoides (Walb.) in Connection With Failure to Spawn. J. Ichthyol 11 (1), 673–682.
Ficke A. D., Myrick C. A., Hansen L. J. (2007). Potential Impacts of Global Climate Change on Freshwater Fisheries. Rev. Fish Biol. Fisheries 17, 581-603. doi: 10.1007/s11160-007-9059-5
Fish T., Wolf N., Harris B. P., Planas J. V. (2020). A Comprehensive Description of Oocyte Developmental Stages in Pacific Halibut, Hippoglossus Stenolepis. J. Fish Biol. 97, 1880–1885. doi: 10.1111/jfb.14551
Forsberg J. E. (2001). Ageing Manual for Pacific Halibut: Procedures and Methods Used at the International Pacific Halibut Commission. Int. Pac. Halibut Commun. Tech. Rep. 46.
Free C. M., Thorson J. T., Pinsky M. L., Oken K. L., Wiedenmann J., Jensen O. P. (2019). Comment on ‘Impacts of Historical Warming on Marine Fisheries Production. Science 365 (6454), 979–983. doi: 10.1126/science.aax5721
Graham C. T., Harrod C. (2009). Implications of Climate Change for the Fishes of the British Isles. J. Fish Biol. 74 (6), 1143–1205. doi: 10.1111/j.1095-8649.2009.02180.x
Grier H. J., Uribe M. C., Patino R. (2009). “The Ovary, Folluculogenesis, and Oogenesis in Teleosts,” in Reproductive Biology and Phylogeny of Fishes (Agnathans and Bony Fishes), vol. Vol. 8A . Ed. Jamieson B. G. M. (Enfield, New Hampshire: Science Publishers), 25–84.
Guzmán J.M., Luckenbach J.A., Middleton M. A., Massee K. C., Jensen C., Goetz F. W., et al. (2017). Reproductive Life History of Sablefish (Anoplopoma Fimbria) From the U.S. Washington Coast. PloS One 12 (9), e0184413. doi: 10.1371/journal.pone.0184413
Haslob H., Kraus G., Saborido-Rey F. (2012). The Dynamics of Postovulatory Follicle Degeneration and Oocyte Growth in Baltic Sprat. J. Sea Res. 67 (1), 27–33. doi: 10.1016/j.seares.2011.09.001
Head M. A., Keller A. A., Bradburn M. (2014). Maturity and Growth of Sablefish, Anoplopoma Fimbria, Along the U.S. West Coast. Fisheries Res. 159, 56–67. doi: 10.1016/j.fishres.2014.05.007
Joliffe I. T. (2002). Principal Component Analysis, Second Edition (New York: Springer-Verlag New York, Inc).
Kennedy J., Hedeholm R. B., Gundersen A. C., Boje J. (2014). Estimates of Reproductive Potential of Greenland Halibut (Reinhardtius Hippoglossoides) in East Greenland Based on an Update of Maturity Status. Fisheries Res. 154, 73–81. doi: 10.1016/j.fishres.2014.02.009
Kent M. (1990). Hand-Held Instrument for Fat/Water Determination in Whole Fish. Food Control 1, 47–53. doi: 10.1016/0956-7135(90)90121-R
Lesyna K. M., Barnes C. L. (2016). Assessment of Length-And Age-At-Maturity for California Halibut (Paralichthys Californicus), Including a Histologically-Based Description of the Reproductive Cycle. California Fish Game 102, 79-99.
Loher T., Seitz A. C. (2008). Characterization of Active Spawning Season and Depth for Eastern Pacific Halibut (Hippoglossus Stenolepis), and Evidence of Probable Skipped Spawning. J. Northwest Atlantic Fishery Sci. 41, 23–36. doi: 10.2960/J.v41.m617
Lubzens E., Young G., Bobe J., Cerdà J. (2010). Oogenesis in Teleosts: How Fish Eggs Are Formed. Gen. Comp. Endocrinol. 165 (3), 367–895. doi: 10.1016/j.ygcen.2009.05.022
Magnoni L. J., Felip O., Blasco J., Planas J. V. (2013). “Metabolic Fuel Utilization During Swimming: Optimizing Nutritional Requirements for Enhanced Performance,” in Swimming Physiology of Fish. Eds. Palstra A. P., Planas J. V. (Heidelberg: Springer), 203–235.
McBride R. S., Somarakis S., Fitzhugh G. R., Albert A., Yaragina N. A., Wuenschel M. J., et al. (2015). Energy Acquisition and Allocation to Egg Production in Relation to Fish Reproductive Strategies. Fish Fisheries 16, 23–57. doi: 10.1111/faf.12043
McBride R. S., Wuenschel M. J., Nitschke P., Thornton G., King J. R. (2013). Latitudinal and Stock-Specific Variation in Size- and Age-at-Maturity of Female Winter Flounder, Pseudopleuronectes Americanus, as Determined With Gonad Histology. J. Sea Res. 75, 41–51. doi: 10.1016/j.seares.2012.04.005
Midway S. R., Scharf F. S. (2012). Histological Analysis Reveals Larger Size at Maturity for Southern Flounder With Implications for Biological Reference Points. Marine Coastal Fisheries 4 (1), 628–385. doi: 10.1080/19425120.2012.717524
National Data Buoy Center < US DOC/NOAA/NWS/NDBC (1971) Meteorological and Oceanographic Data Collected From the National Data Buoy Center Coastal-Marine Automated Network (C-MAN) and Moored (Weather) Buoys (Station 46080 (LLNR 982), Portlock Bank, 2008-2018: NOAA National Centers for Environmental Information). Available at: https://ncei.noaa.gov/archive/accession/NDBC-CMANWx (Accessed 02.03.22).
Press Y. K., Wuenschel M. J., McBride R. S. (2014). Time Course of Oocyte Development in Winter Flounder (Pseudopleuronectes Americanus) and Spawning Seasonality for the Gulf of Maine, Georges Bank, and Southern New England Stocks. J. Fish Biol. 85, 421–445. doi: 10.1111/jfb.12431
Ramsay K., Witthames P. (1996). Using Oocyte Size to Assess Seasonal Ovarian Development in Solea Solea (L.). J. Sea Res. 36 (4), 275–283. doi: 10.1016/S1385-1101(96)90796-0
Rideout R. M., Morgan M. J., Lambert Y., Cohen A. M., Banoub J. H., Treble M. (2012). Oocyte Development and Vitellogenin Production in Northwest Atlantic Greenland Halibut Reinhardtius Hippoglossoides. J. Northwest Atlantic Fishery Sci. 44, 15–29. doi: 10.2960/J.v44.ms679
Rideout R. M., Rose G. A., Burton M. P. M. (2005). Skipped Spawning in Female Iteroparous Fishes. Fish Fisheries 6, 50–72. doi: 10.1111/j.1467-2679.2005.00174.x
Rodgveller C. J. (2019). The Utility of Length, Age, Liver Condition, and Body Condition for Predicting Maturity and Fecundity of Female Sablefish. Fisheries Res. 216, 18–28. doi: 10.1016/j.fishres.2019.03.013
Seitz A. C., Norcross B. L., Wilson D., Nielsen J. L. (2005). Identifying Spawning Behavior in Pacific Halibut, Hippoglossus Stenolepis, Using Electronic Tags. Environ. Biol. Fishes 73 (4), 445–515. doi: 10.1007/s10641-005-3216-2
Serreze M. C., Barry R. G. (2011). Processes and Impacts of Arctic Amplification: A Research Synthesis. Global Planetary Change 77 (1–2), 85–96. doi: 10.1016/j.gloplacha.2011.03.004
Skjæraasen J. E., Kennedy J., Thorsen A., Fonn M., Strand B. N., Mayer I., et al. (2009). Mechanisms Regulating Oocyte Recruitment and Skipped Spawning in Northeast Arctic Cod (Gadus Morhua). Can. J. Fisheries Aquat. Sci. 66 (9), 1582–1965. doi: 10.1139/F09-102
Stewart I. J., Webster R. A. (2021). Overview of Data Sources for the Pacific Halibut Stock Assessment, Harvest Policy, and Related Analyses (IPHC-2021-SA-02), (Seattle, Washington), 54. Available at: https://www.iphc.int/uploads/pdf/sa/2021/iphc-2021-sa-02.pdf.
St-Pierre G. (1984). Spawning Locations and Season for Pacific Halibut (International Pacific Halibut Commission), pp 45. Available at: https://iphc.int/uploads/pdf/sr/IPHC-1984-SR070.pdf. Report No 70.
Walsh J. E., Thoman R. L., Bhatt U. S., Bieniek P. A., Brettschneider B., Braubaker M., et al. (2018). The High Latitude Marine Heat Wave of 2016 and Its Impacts on Alaska. Bull. Am. Meteorol Soc. 99, S39–S43. doi: 10.1175/1520-0477-95.9.s1.1. ([in “Explaining Extreme Events of 2016 from a Climate Perspective”]).
Keywords: female reproductive phase, ovarian developmental stage, maturity, annual cycle, Pacific halibut, Gulf of Alaska, spawning
Citation: Fish T, Wolf N, Smeltz TS, Harris BP and Planas JV (2022) Reproductive Biology of Female Pacific Halibut (Hippoglossus stenolepis) in the Gulf of Alaska. Front. Mar. Sci. 9:801759. doi: 10.3389/fmars.2022.801759
Received: 25 October 2021; Accepted: 14 March 2022;
Published: 11 April 2022.
Edited by:
Pierluigi Carbonara, COISPA Tecnologia & Ricerca, ItalyReviewed by:
Cheryl Barnes, University of Washington, United StatesCopyright © 2022 Fish, Wolf, Smeltz, Harris and Planas. This is an open-access article distributed under the terms of the Creative Commons Attribution License (CC BY). The use, distribution or reproduction in other forums is permitted, provided the original author(s) and the copyright owner(s) are credited and that the original publication in this journal is cited, in accordance with accepted academic practice. No use, distribution or reproduction is permitted which does not comply with these terms.
*Correspondence: Teresa Fish, dGZpc2hAYWxhc2thcGFjaWZpYy5lZHU=
†ORCID: Teresa Fish, orcid.org/0000-0002-1310-7216
Nathan Wolf, orcid.org/0000-0002-6707-0295
Timothy Scott Smeltz, orcid.org/0000-0002-8578-8540
Josep V. Planas, orcid.org/0000-0002-6525-9617
Disclaimer: All claims expressed in this article are solely those of the authors and do not necessarily represent those of their affiliated organizations, or those of the publisher, the editors and the reviewers. Any product that may be evaluated in this article or claim that may be made by its manufacturer is not guaranteed or endorsed by the publisher.
Research integrity at Frontiers
Learn more about the work of our research integrity team to safeguard the quality of each article we publish.