 Ming Li
- 1College of Meteorology and Oceanography, National University of Defense Technology, Nanjing, China
- 2Collaborative Innovation Center on Meteorological Disaster Forecast, Warning and Assessment, Nanjing University of Information Science and Engineering, Nanjing, China
Risk assessment and management of marine disasters are the prerequisite of ocean exploitation and utilization. Marine disaster assessment is a complicated system engineering with high non-linearity and uncertainty. To deal with the problem, Bayesian network (BN) has become a powerful model used for disaster assessment due to its capability of expressing complex relationships and reasoning with uncertainty. However, scarce data sets and case samples of marine disasters pose an obstacle to BN modeling, particularly for structure and parameter learning. In our research, we combine expert knowledge with small sample to propose a new BN-based assessment model. Expert knowledge is regularly expressed and quantitatively incorporated into BN learning with DS evidence theory. Then, the genetic algorithm is adopted to search the optimal network parameters. Comparative experiments show that the new model has a better assessment accuracy (91.03%) than BPNN (61.34%) and SVM (70.67%), especially with small samples. The proposed model achieves the risk assessment of marine disasters under the small sample condition, providing the technical support for marine disaster prevention and mitigation.
Introduction
The twenty-first century has been widely recognized as “A Century of Ocean.” Ocean, as the main space of marine development and security strategy, plays a significant role in safeguarding security, enriching resources, and expanding the development space for the economy and society. It is well-known that the marine environment contains many oceanic and meteorological factors, which are constantly changing and have mutual actions between each other (Li et al., 2021b). With climate change, marine disasters are occurring more frequently and disaster losses are heavier. Therefore, risk management of ocean is urgently needed so as to provide solutions for tackling climate impacts and marine disasters. Nowadays, risk assessment of marine disasters is taken increasingly seriously, which can provide basis for the development of nature-based solutions, such as hazard prevention and mitigation.
The Marine environment is complicated and changeable, producing varieties of marine disasters, such as marine geologic disaster, red tide, wave disaster, sea ice disaster, and storm surge disaster. Scholars have carried out many studies about risk assessment on different types of marine disasters. Zhao et al. (2007) summarized the research progress of storm surge disaster assessment and constructed a multi-level assessment system for storm surge disaster. Wen et al. (2007) analyzed features of risk-causing factors and risk-taking bodies of red tide to establish the risk assessment model based on fuzzy comprehensive evaluation (FCE) method. Qiao et al. (2014) focused on the risk assessment of geologic disaster sources in coastal areas. Yu et al. (2020) adopted several machine learning (ML) algorithms to evaluate the sea ice disasters and conducted the short-term prediction of the risk.
Different marine disasters usually occur in the form of cluster, concurrence, and contingency, causing considerable disaster losses. However, it is unable to express these forms through the risk assessment of one single type of marine disaster. Aiming at this problem, several studies have been devoted to the comprehensive risk assessment of multiple marine disasters. Ye et al. (2005) analyzed the temporal–spatial characteristics of oceanic and meteorological factors and established the comprehensive risk management system of marine disasters. Zhang (2012) elaborated marine environmental features in the South China Sea from the perspectives of marine geography, marine meteorology, and marine hydrology, and adopted the FCE method to evaluate the marine disaster. Gao et al. (2018) established a comprehensive hazard assessment system targeted at five marine disasters, including waves, sea levels, storm surges, sea ice, and tsunami. Weights for each of these marine disasters were obtained by analytic hierarchy process (AHP), based on which the risk of marine disasters were classified. Li et al. (2021b) used the non-stationary model for dynamic assessment of comprehensive marine disasters. In addition, government agencies also attach great importance to relevant research. The Earth System Science Partnership started the proposal of integrated risk governance to analyze internal relations between marine disasters and climate change at different scales (Ignaciuk et al., 2012). The Federal Emergency Administration of the USA developed a natural hazard loss estimation software to evaluate and predict the risk losses caused by multiple marine disasters, including storm surges, sea waves, and typhoons (Khatsü, 2011). Comprehensive risk assessment of multiple marine disasters, emphasizing systematization and interdisciplinarity, can analyze different types of marine disasters to establish a more comprehensive assessment index system. With the index system set up, varieties of mathematical models can be combined for quantitative assessment.
In the above assessment researches of marine disasters, whether for a single marine disaster or multiple marine disasters, most studies use qualitative and semi-quantitative assessment methods, mainly including Delphi method, AHP, gray comprehensive evaluation method (GCE), and FCE. ML algorithms, such as BP neural network (BPNN) and support vector machine (SVM), are initially introduced into disaster assessment. It should be noted that the marine disaster is a complicated system containing a number of factors, which influence each other and are strongly coupled together. The risk mechanism of marine disaster is highly non-linear and uncertain. However, the traditional assessment methods rely heavily on expert experience or domain knowledge. The subjectivity and empiricism are so strong in the expert investigation method that it is difficult to express complex relationships among indicators quantitatively. Besides, the ML-based assessment models usually have strict mathematical assumptions and have high requirements on data quality, which is hard to model with large-scale assessment indicators and non-linear relationships in marine environments, especially with uncertain knowledge and deficient data. It is urgent to develop a new assessment model.
Bayesian network (BN), as an effective intelligent model for coping with complex system problems, has been gradually introduced into the risk assessment of natural disasters and achieved successful applications. Straub and Kiureghian (2012) constructed a BN-based assessment framework for natural disaster risk, combining expert knowledge and objective data. This framework realizes the probabilistic assessment of disaster risk through node selection, structure learning, parameter learning, and Bayesian inference. Aiming at the flood disaster, Boutkhamouine et al. (2017) adopted BN learning algorithms to identify the causal relationship among assessment indicators from large-scale samples and constructed the risk assessment model. Liu (2016) also applied the BN to flood disaster assessment. He used naive BN and weighted BN for risk modeling, respectively, and the assessment results were visualized through the GIS platform. Gu (2017) proposed a risk reasoning and prediction model based on the BN and disaster chain. The influence relationship among factors in rainstorm disaster is identified through BN learning, used for the risk assessment and prediction of rainstorm disaster. In recent years, BN has been preliminarily applied to the risk assessment of marine disaster due to its advantages in the expression of complex relationships and uncertainty reasoning, but correlational studies are limited: Bai et al. (2014) attempted to combine BN with the FCE model to carry out a risk assessment and zoning of storm surge disaster. Through systematic analysis of risk-causing factors and risk-bearing bodies of marine disasters, Li et al. (2018b) adopted the BN and gray relational analysis to build a risk assessment model. Then, Li et al. (2020; 2021a) also proposed the improved weighted BN to mine the causal relationship of disaster factors and realized probabilistic reasoning of marine disaster risk.
The core of BN-based assessment model is network learning, including structure learning and parameter learning. Based on objective data sets, the process can identify and express the causal relationship among indicators through data mining algorithms. Therefore, BN learning needs to be supported by large-scale samples. However, natural disasters are extreme events with very small occurring frequency and there are few observation samples, which makes it difficult to learn the BN structure and parameters from data sets (Li et al., 2020). In existing studies about BN-based risk assessment, the network structure and parameters are manually constructed by experts based on domain knowledge. This modeling method is very subjective and one-sided without the participation of objective data. Aiming at the problem of data deficiencies, some scholars used sample augment methods for BN learning, such as the Bootstrap algorithm (Huang, 2006) and information diffusion theory (Zhang et al., 2013). The scarce samples are expanded to sufficient samples, and then data mining algorithms are adopted to learn the network. Sample expansion can solve the problem of insufficient samples to a certain extent. However, when the evaluation system is very complex and contains a lot of indicators, the rationality and effectiveness of expanded samples cannot be guaranteed. How to learn a reliable BN with small sample?
Nowadays, BN construction with expert knowledge incorporated has become a hot topic of BN learning under the condition of small samples. Zhang et al. (2014) adopted DS evidence theory to integrate different expert opinions and preliminarily identified the causal relationship among nodes, reducing the search space of network structure and improving the efficiency of BN learning. Aiming at the small sample learning problem, Zeng et al. (2020) proposed a learning method combining expert prior knowledge and monotonic constraints. This method integrates the expert prior knowledge into the process of parameter learning in the form of normal distribution and further improves the accuracy and stability of BN learning with a small sample set. Taking expert knowledge as constraint to improve BN learning can effectively increase learning accuracy and efficiency. We will combine knowledge and data to drive BN learning and build the marine disaster assessment model in the small sample environment.
To deal with the problem of scarce modeling samples in marine disaster assessment, we integrate expert knowledge into BN learning in a regular and quantitative manner. Based on knowledge constraint and limited data, we introduce DS evidence theory and genetic algorithm for BN learning, accomplishing the assessment modeling under the small sample condition. For the model verification, we apply the model to the risk assessment of marine disasters in Shanghai. The remainder of the paper is organized as follows: Section “Theory and Model” presents the BN theory. Section “Bayesian Network-Based Risk Modeling Driven by Knowledge and Data” explains the specific techniques of the assessment model. The obtained results and analysis are shown in section “Risk Assessment Experiment of Marine Disaster.” Section “Conclusion” draws conclusions and summarizes the main findings.
Theory and Model
In this section, we first introduce the basic theory of BN and different BN learning methods. Then we design the technical framework of the BN-based risk assessment model under the small sample condition and give a brief elaboration of the technical procedure.
Bayesian Network Theory
Bayesian Network (BN), whose theoretical foundations are graph theory and probability theory, is not only a graphical expression of causal relationship among variables, but also a probabilistic reasoning technique for random variables (Pearl, 1995). It is a quantitative causality graph and can be represented by a binary B = < G, θ >:
• G = (V, E) represents a directed acyclic graph. V is a set of nodes and each one represents a variable in the knowledge domain. E is a set of arcs, and a directed arc represents the causal dependency between two variables.
• θ is the network parameter, that is the conditional probability distribution (CPD) of network nodes. θ expresses the degree of mutual influence between two nodes by conditional probability and presents quantitative features in the knowledge domain.
Assume a set of variables V = (v1, ⋯, vn). The mathematical basis of BN is Bayes Theorem showed by Eq. 1, which is also the core principle of Bayesian reasoning.
where: P(vi) is the prior probability, P(vj|vi) is the conditional probability and P(vi|vj) is the posterior probability. With P(vi), P(vi|vj) can be derived by Bayes Theorem under the relevant condition P(vj|vi).
The joint probability distribution for all network nodes can be derived from Eq. 1 under the conditional independence assumption, namely, each child node is independent of non-parent nodes under conditions given.
where: vi is network node; Pa(vi) is parent node of vi. Bayesian inference is the calculation of probability distribution of a set of query variables according to updated evidence of input variables through Eq. 2.
Bayesian Network Learning and Modeling
The BN modeling procedure mainly includes structure learning, parameter learning, and probabilistic reasoning (Li and Liu, 2019). This process is specifically described as: firstly, mining causal relationship among nodes to construct the network topology; then, learning the CPD of each node to describe the strength of causality quantitatively; finally, performing the network probabilistic inference based on the structure and parameter.
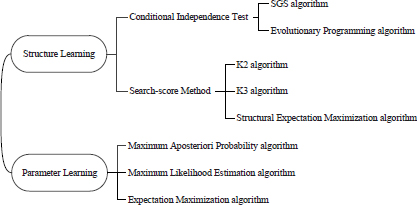
BN learning is to find a network that can match the given actual samples according to a certain measure, including the learning of a directed acyclic graph and CPD of each node, namely structure learning and parameter learning. BN learning has two main ways: manual learning and automatic learning. The former is to manually determine the network structure and probability distribution based on the empirical knowledge of experts. The latter is to automatically determine and optimize structure and parameters from large-scale data sets by using intelligent algorithms. The widely used automatic learning algorithms for structure and parameter learning are shown below.
As we have analyzed in the Introduction, it is impossible to conduct BN modeling with the above intelligent algorithms because of the data sparsity of disaster assessment indicators. In our research, we propose a new BN learning method driven by expert knowledge and objective data. DS evidence theory and genetic algorithm are introduced to optimize BN structure and parameter learning under the small sample condition. We design the BN-based risk assessment model for marine disasters and the technical framework is shown as follows.
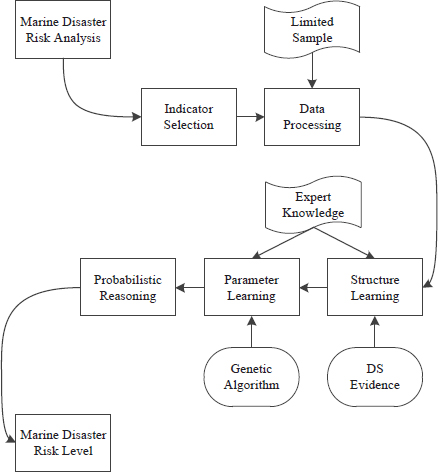
Firstly, analyze the mechanism of action between the disaster-pregnant environment and marine disaster risk, and screen out the evaluation indicators that have a significant effect on the risk. Then, preprocess the observation samples, including normalization and discretization. Next, integrate expert knowledge into BN learning. DS evidence theory is used to optimize the search scoring method and learn the optimal network structure. Genetic algorithm is used for the optimal parameter inversion. Finally, the probabilistic reasoning of BN is performed to evaluate the risk level of marine disaster. In the next section, based on the practical application of marine disaster risk assessment, the algorithms used in the BN-based assessment technology will be explained and analyzed in detail.
Bayesian Network-Based Risk Modeling Driven by Knowledge and Data
In this section, our proposed assessment model is applied to evaluate the monthly comprehensive risk of marine disasters in Shanghai, which borders the Yangtze River and the East China Sea. There are many kinds of marine disasters occurring in Shanghai with high frequency and activity intensity. The marine environment is complicated, and disaster risk has tremendous uncertainty. The refined evaluation of overall marine risk is of great significance for conducting hazard prevention and mitigation, and ensuring economic-social development and city operation. Next, specific algorithms and steps of each link of the technical route are elaborated.
Assessment Indicator and Data Process
Assessment System
According to the risk mechanism analysis, International Decade for Natural Disaster Reduction (IDNDR) makes a clear definition of risk: the disaster risk consists of the hazard of risk-causing factors and the vulnerability of risk-taking bodies. Hazard refers to the danger level of the disaster-pregnant environment. Vulnerability is generally interpreted as how easily an exposed unit is harmed due to disturbance and its ability to deal with disasters, which is related to exposure, emergency capacity and robustness. We define the hazard of marine disaster risk as the danger level of the oceanic and meteorological environment that breeds marine disasters, including wind, currents, waves, temperature, and so on; and define the vulnerability as the susceptible degree to which population and properties are exposed to marine disasters and the region’s emergency response and recovery capabilities after a disaster.
It is well-known that marine disasters threatening the security of Shanghai mainly include storm surges, ocean waves, sea-level rise, and tsunamis. Considering the disaster-causing mechanism of different types of marine disasters and referring to previous indicator systems (Sun, 2010; Qi et al., 2019), we select five representative environmental variables as hazard indicators and four social factors as vulnerability indicators for assessment modeling. The assessment system is constructed as follows.
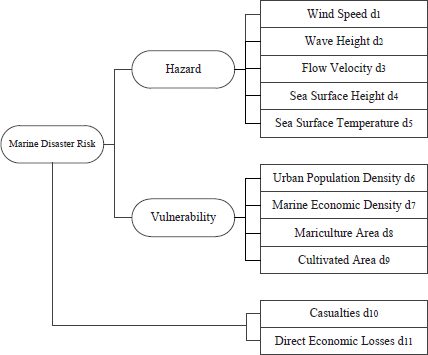
As shown in the assessment system, hazard indicators include wind speed, wave height, flow velocity, sea surface height, and sea surface temperature. Vulnerability indicators include urban population density, marine economic density, mariculture area and cultivated area. All assessment indicators are benefit indicators, that is, indicators are positively correlated with the risk. In addition, the assessment target of our research is the marine disaster risk. We use the casualties and direct economic losses caused by marine disasters to quantify the risk, and define the following risk index, denoted as R:
where: w1 and w2, respectively, represent the weight of casualties and direct economic losses, which are determined according to the actual situation. Referring to related research (Gao et al., 2018), this paper sets w1 = 0.6 and w2 = 0.4.
Data Preprocessing
We aim to carry out a refined monthly assessment of marine disaster risk, so indicator data used for the assessment modeling must be monthly average data. The data of hazard indicators are obtained from the monthly measured data sets (2000--2019) in Shanghai station (National Data Center for Marine Sciences).1 However, there is almost no monthly data of vulnerability indicators. Considering that the inter-monthly change of these indicators is small, it is reasonable to use annual data instead of monthly data. The data of vulnerability indicators are collected from the < China Ocean Statistical Yearbook >, < China Statistical Yearbook >, < China City Statistical Yearbook >, and < China Finance Statistical Yearbook >. On account of limited data recording and data storage, the time series of vulnerability indicators are not long enough and discontinuous. We look up the statistical yearbook from 2000 to 2019 and only get 120 complete samples.
All indicator data need to be normalized and discretized. The former is to eliminate the influence of dimension, and the latter is to determine the assessment level so as to improve the training efficiency of the model and facilitate decision-making analysis. All indicators are normalized according to the maximin rule shown by Eq. 4.
where: X is the normalized value; x is the original value; xmax, xmin denote maximum and minimum of original data.
Then we use the equal interval division method for data discretization to determine the grade space of indicators. We take the interval value as 0.2 and each indicator is divided into five grades. The discrete samples are shown in Table 1.
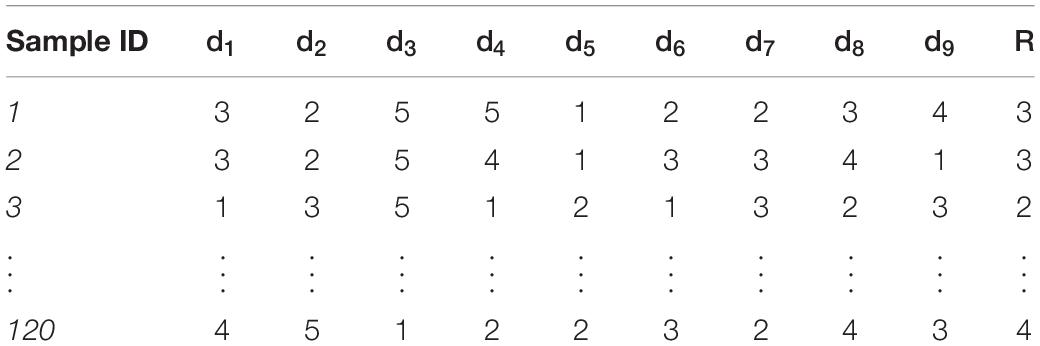
Table 1. Discrete samples of assessment indicators.
The sample size is too small to directly use conventional statistical analysis methods and data mining algorithms for BN learning. In the following subsection, we express expert knowledge in a regular manner, and then quantitatively integrate it into the BN learning to propose a BN-based assessment modeling technology under the small sample condition. In the modeling process, there are 90 training samples and 30 testing samples.
Bayesian Network Structure Learning
Structure learning of BN can mine and identify the causal relationship among indicators from objective data. Structure learning with a small sample size is the research hotspot and difficult subject of BN learning. At present, there are two main methods for this problem (Li et al., 2018a): the first is to expand limited data and increase the sample size, then use the classic learning algorithms to learn the structure; the second is to construct constraints by introducing expert experience or domain knowledge to make up for the data deficient, improving the efficiency and accuracy of structure learning. As the modeling samples in our research are extremely scarce, the accuracy of the expanded data is difficult to guarantee. We will adopt the second method and propose an improved search-score method to learn the network structure.
Structure Learning Algorithm With Knowledge Fusion
The basic idea of our proposed algorithm: Firstly, expert knowledge is described in a regular manner, and a quantitative constraint model is designed to express expert knowledge. Then multi-expert knowledge is fused by the DS evidence theory and incorporated into the structure scoring function. Finally, the heuristic search algorithm is used to search for the optimal network structure. Detailed steps are elaborated as follows.
(1) Connection probability distribution of structure
In order to integrate expert knowledge into the process of structure learning, we adopt the constraint model proposed by Di et al. (2017) to express the knowledge. The connection probability distribution is defined as follows:
Assuming that a and b are two nodes of BN, the connection state between a and b have three types: a points to b (a → b); b points to a (b → a); and there is no connection between a and b (a\b). The connection probability between a and b satisfies:
• Assuming that in a BN, the expert has no relevant knowledge of the connection between nodes a and b, then the connection probability obeys a uniform distribution:
• Assuming that the expert has a certain understanding of the connection between a and b, for example, the expert knowledge is P(a → b) = 3/4. It is considered that the probability of the remaining connection state still obeys a uniform distribution:
According to the above rules, the connection probability distribution of all nodes in a BN can be obtained. For example, the connection probability distribution of three network nodes is shown below.

(2) Multi-expert knowledge fusion based on DS evidence theory
In order to reduce the subjectivity, one-sidedness, and contingency of different experts, multiple experts are asked to generate connection probability distributions, then DS evidence theory is used to fuse the different prior knowledge to obtain a synthetical network connection probability distribution. The main idea of DS evidence theory: obtain the basic credibility distribution of evidence, and then use the evidence combination rules for knowledge fusion (Niu, 2016). The basic concepts of DS evidence theory are as follows.
• Definition 1: Let be a recognition frame, if the set function m:2Θ→[0,1] satisfies m(Φ) = 0 and ∑A∈Θm(A) = 1, then m is the basic credibility distribution on the recognition frame Θ. If A⊂Θ and A ≠ Φ, then m(A) is the basic credibility of proposition A. If m(A) > 0, then A is called a focal element of evidence, and the set of all focal elements is called the core.
• Definition 2: Let m1, m2 be the two basic credibility distribution functions on the same recognition frame, and their focal elements are A1, A2, ⋯, Ap and B1, B2, ⋯, Bq, respectively. The combined result of m1 and m2 is denoted as m1⊕m2, and the evidence combination rule is expressed as shown by Eq. 8.
where: i = 1, 2, ⋯, p; j = 1, 2, ⋯, q; K = ∑Ai∩Bj = Φ m1(Ai)m2(Bj). 11-K is planning factor. When K = 1, the combination rule cannot be applied. For the combination of multiple evidences, this rule can be used to fuse them in sequence.
The key of DS evidence theory is the determination of the credibility distribution function, also called the basic probability distribution. According to the Definition 1 of the basic distribution, in our research, the basic credibility distribution is just the connection probability distribution. Assuming that there are m experts, the credibility distribution of the structure connection is shown in Table 2. Based on the DS combination rule, the connection probability distribution integrated with multi-expert knowledge can be obtained. To deal with the evidence conflict, we adopt the correction factor-based combination rule. First determine the uncertainty degree of each evidence, and then conduct evidence combination. The flow of the multi-expert knowledge fusion algorithm for BN structure learning is shown in Figure 1.
(3) Structure learning with improved scoring function
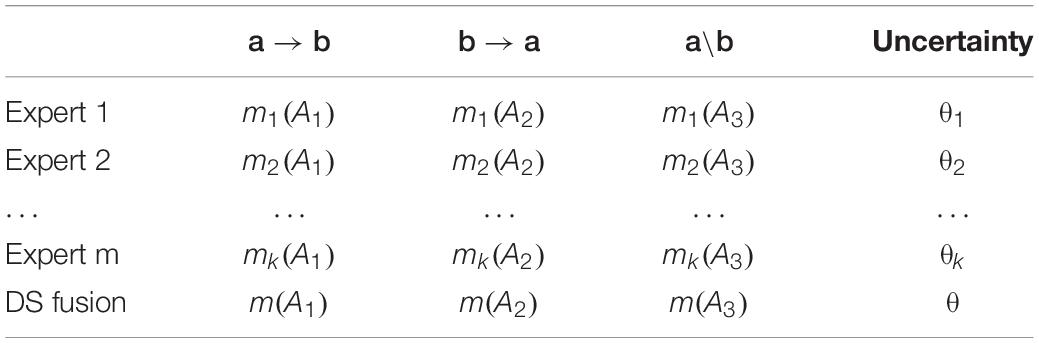
Table 2. Credibility distribution of structure connection with m experts.
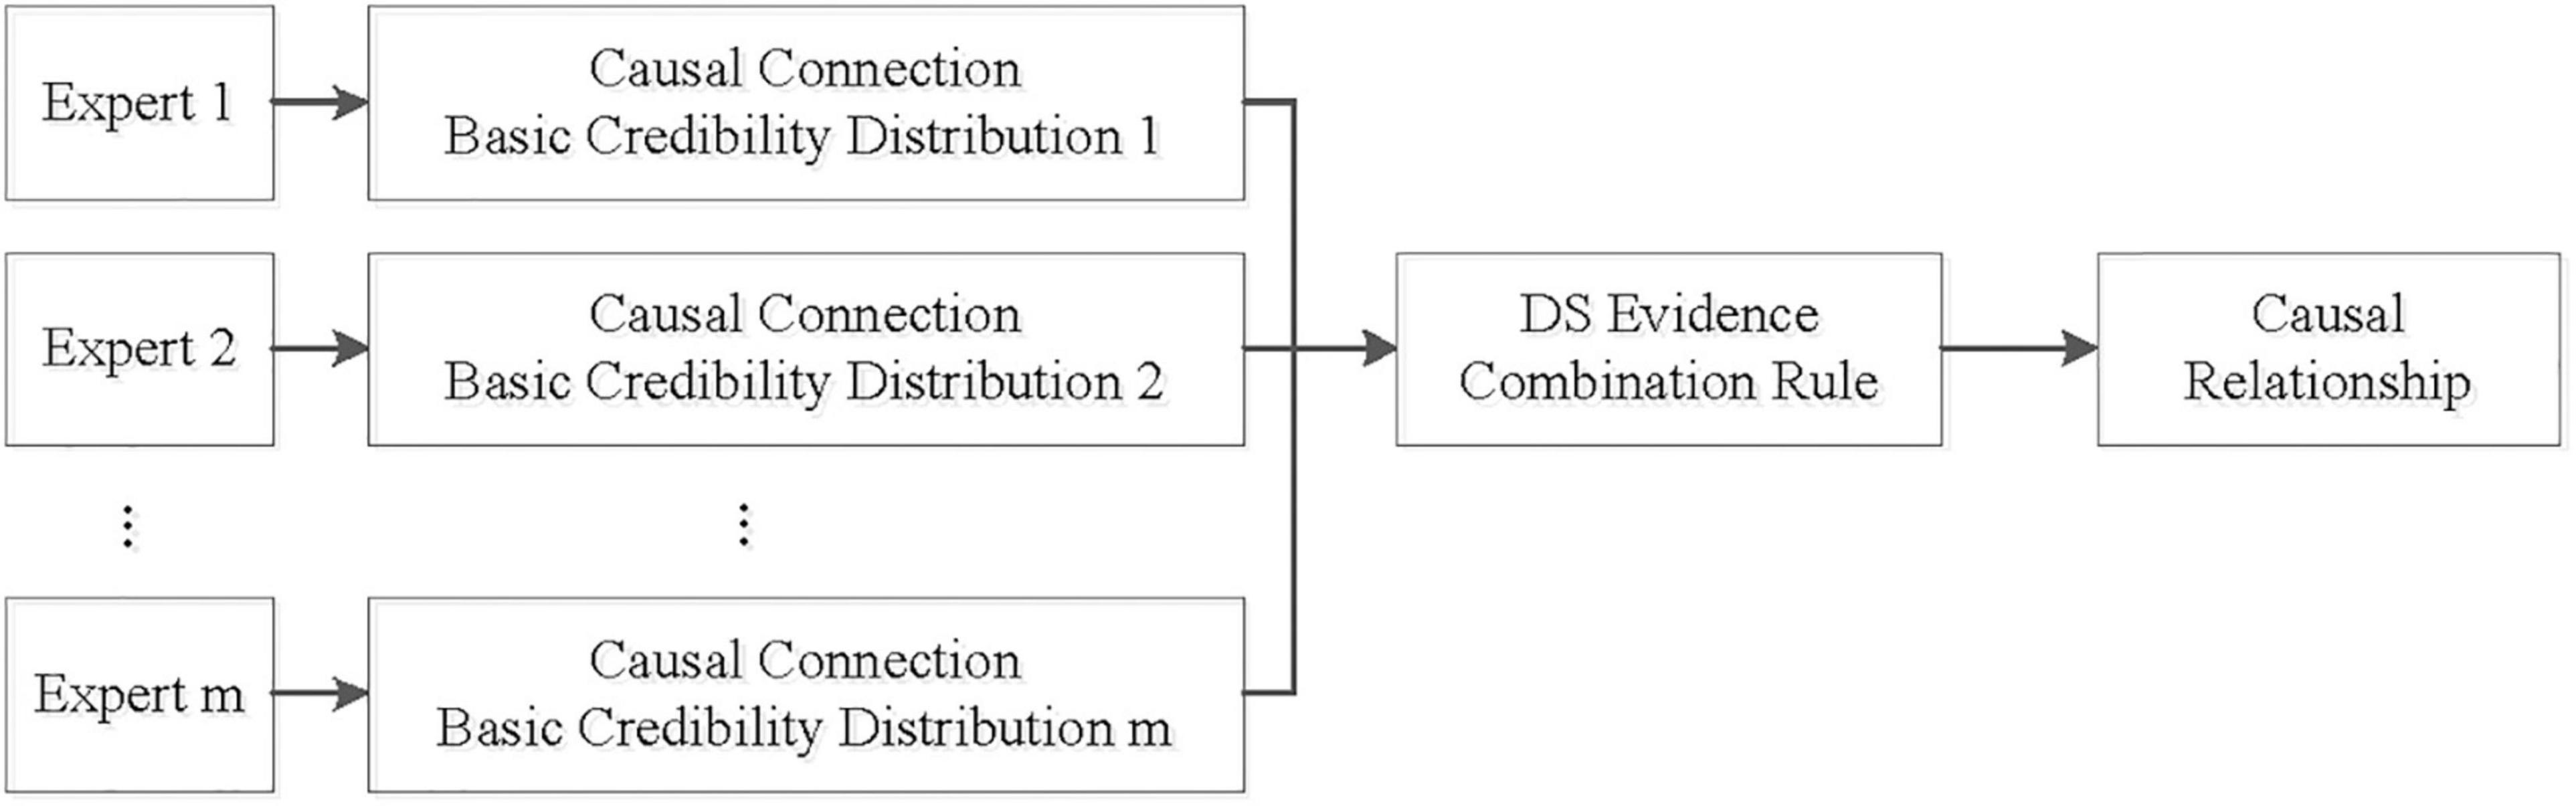
Figure 1. Knowledge fusion for BN structure learning.
BIC score is the most common scoring function in structure learning. We use the structural constraint obtained through DS evidence theory to optimize the BIC score. The structural constraint is added into the BIC scoring function with a priori evidence of local structure. The improved scoring function combined with expert knowledge is expressed by Eq. 9.
where: m is the sample size. e is the connection probability of the arc based on the fusion of multi-expert knowledge. φ is the tuning function.
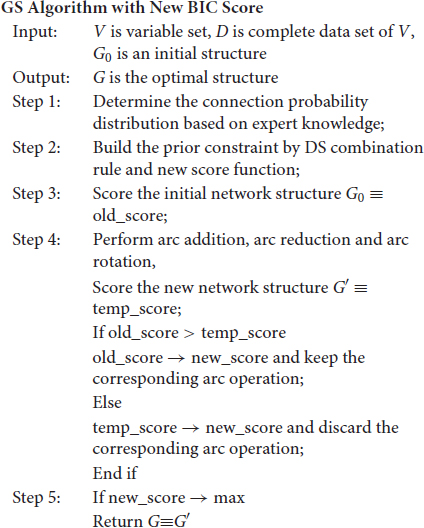
Based on the improved BIC score, the greedy search algorithm is used to search for the optimal structure. The basic thought of the GS algorithm: start from an initial structure, perform arc addition, arc reduction, and arc rotation on the initial structure and score it after each operation. If the score is increased, the operation is retained (Chickering et al., 2004). The process is iterated until the network score is optimal. The specific algorithm flow is as follows.
Bayesian Network Structure Learning for Marine Disaster Assessment
Simulation Experiment
In order to verify the effectiveness of the proposed structure learning algorithm, the famous Asia network (eight nodes and eight directed arcs) is used as a simulation model for experiments and compared with the classic K2 algorithm. Hamming distance is used to measure the quality of learning structures (Li et al., 2018a). The smaller the Hamming distance, the more accurate the structure learning.
Ask three experts to give the connection probability between each two nodes based on the professional knowledge, and use DS evidence theory to fuse the prior knowledge to obtain the structural connection probability distribution. For the sake of space, this paper only lists the fusion process of the two nodes “Smoking and Bronch,” as shown in Table 3. Figure 2A shows the connection probability distribution based on expert knowledge, which is added to the BIC scoring function. Then search for the optimal network based on the improved scoring function.

Table 3. Expert knowledge fusion of nodes “Smoking and Bronch.”

Figure 2. Structure learning of Asia network. (A) Connection probability distribution. (B) Comparison of structure learning.
Figure 2B shows the structure learning results of the two algorithms with different sample sizes. It can be seen that when the sample size is less than 1,700, our proposed structure learning algorithm is better than the K2 algorithm, especially when the sample size is less than 400, the advantage of our algorithm is more obvious. Comparative experiments show that when modeling samples are very scarce, reasonable integration with expert knowledge can effectively improve the accuracy of structure learning.
Bayesian Network Structure for Marine Disaster Assessment
Following the same steps as above, the DS evidence theory is used to fuse the professional knowledge of three experts to obtain the connection probability distribution of the marine disaster network. Then, based on the knowledge-based constraint, the greedy algorithm is adopted to search for the optimal structure. Table 4 shows the expert knowledge fusion process of nodes d1 and d2. Figure 3A shows the connection probability distribution based on expert knowledge, and Figure 3B shows the optimal network structure.
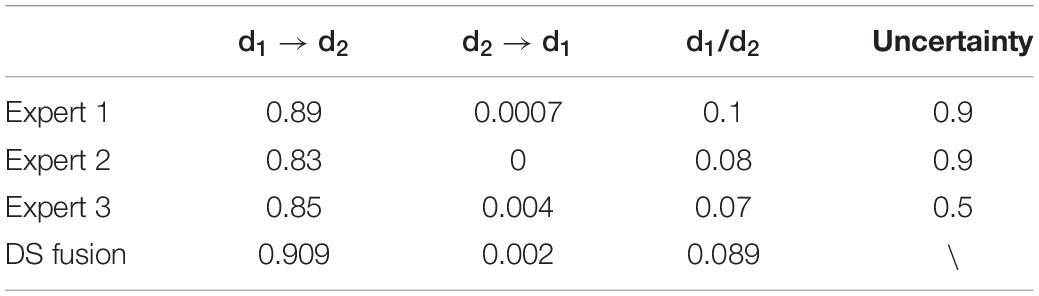
Table 4. Expert knowledge fusion of nodes d1 and d2.
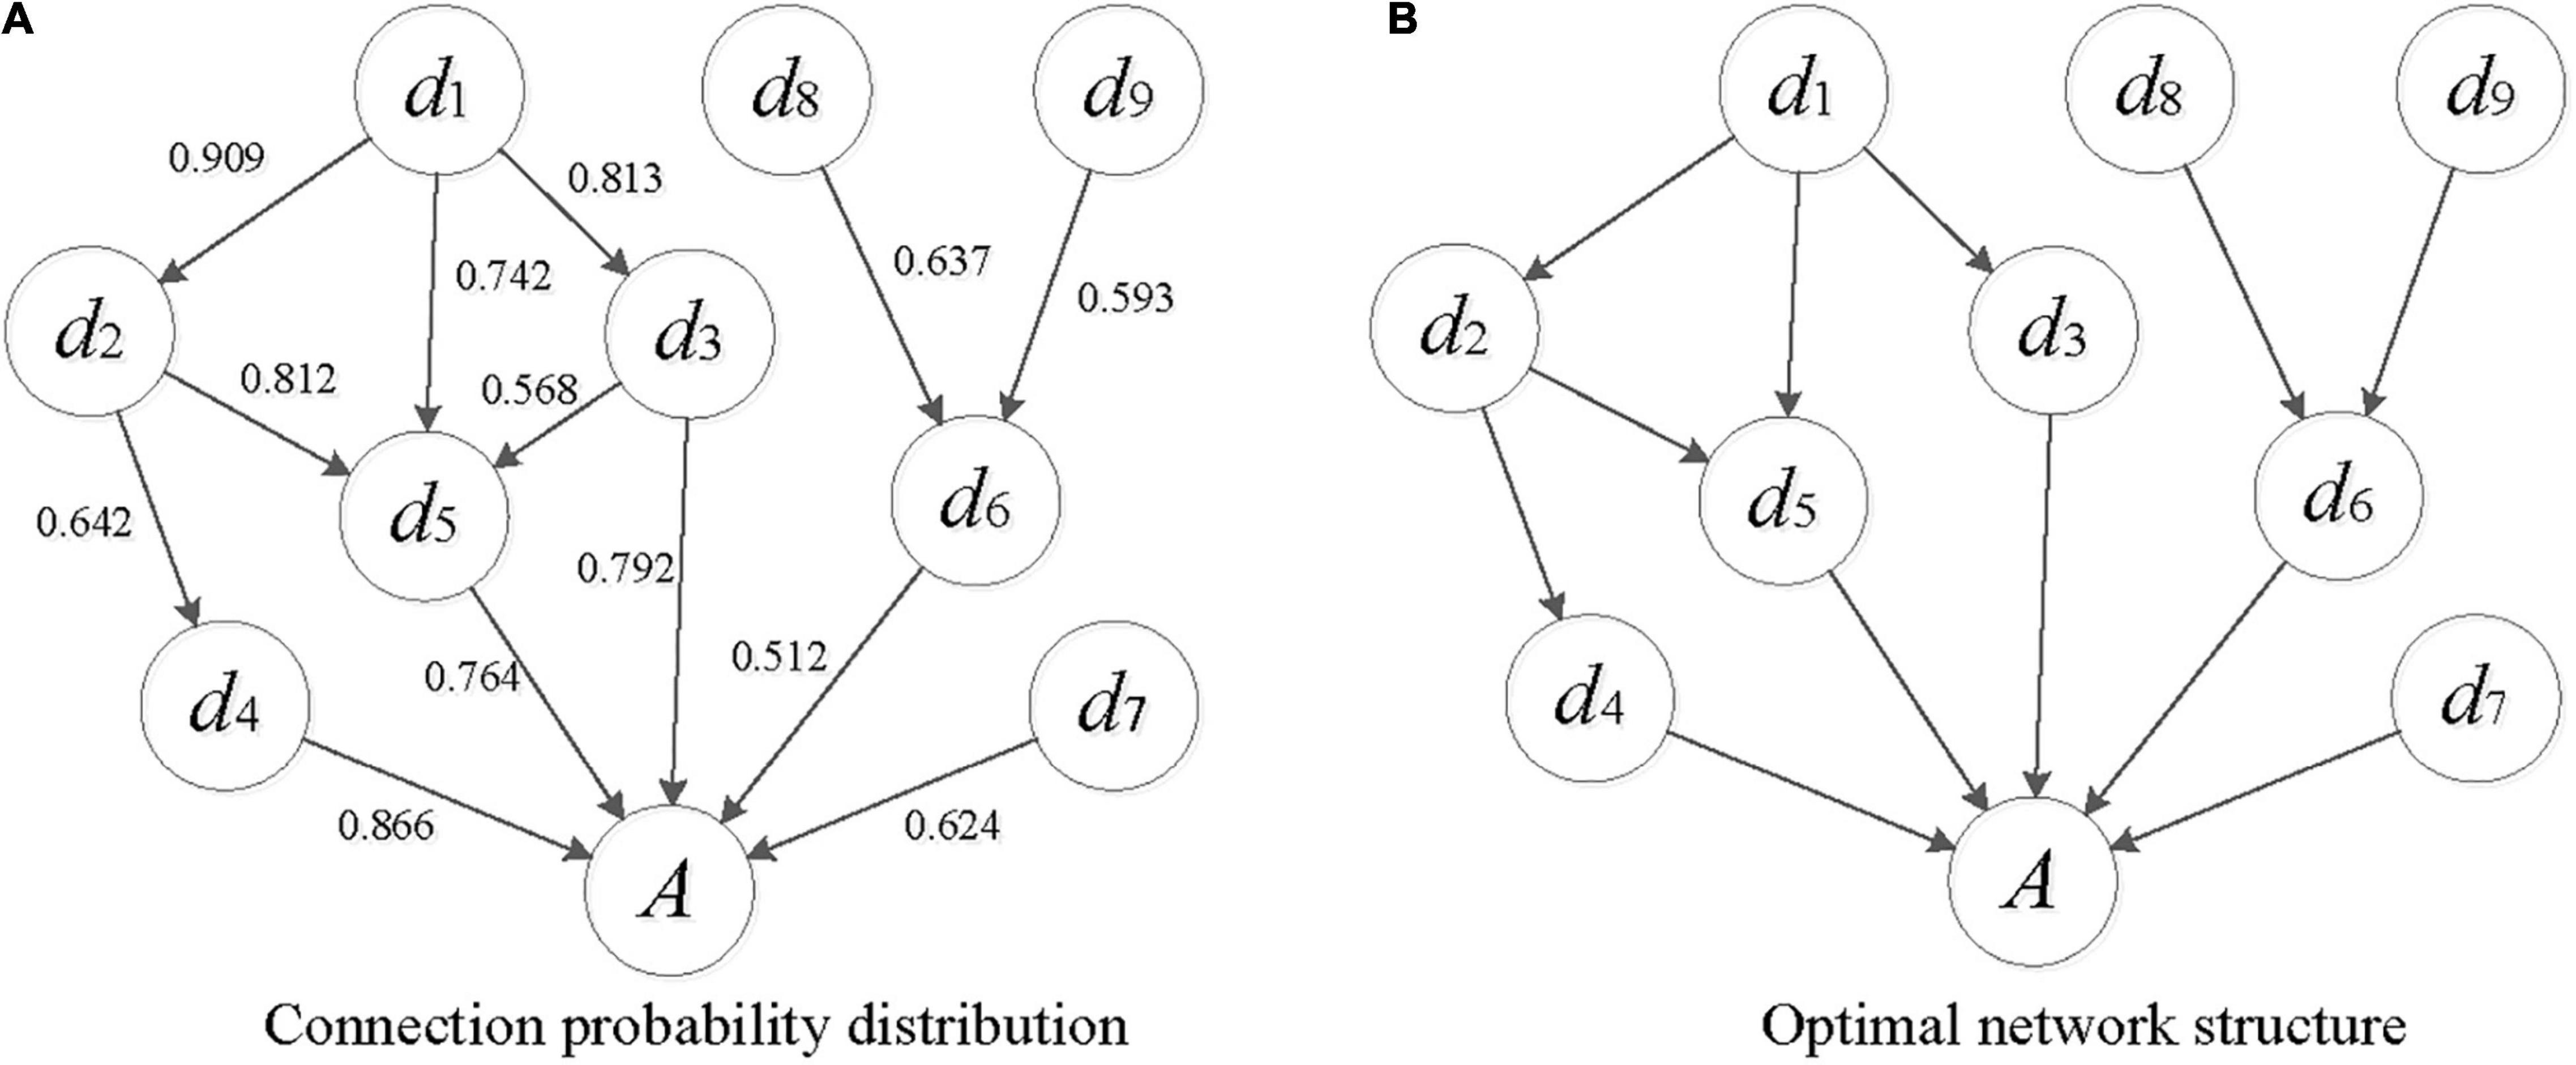
Figure 3. Structure learning of BN Structure for marine disaster assessment. (A) Connection probability distribution. (B) Optimal network structure.
Bayesian Network Parameter Learning
BN parameter learning is to learn the CPD of each node on the basis of the complete structure. Sparse data of vulnerability indicators in marine disaster assessment makes traditional parameter learning algorithms, such as MAP and MLE, difficult to implement. Aiming at parameter learning with a small sample size, we have proposed a GA-based parameter inversion algorithm (GA-CPD), and the effectiveness of this algorithm has been verified through simulation experiments (Li et al., 2018b). In this research, we still use this algorithm for parameter learning.
GA-Based Parameter Inversion Algorithm Algorithm
GA-CPD algorithm adopt the principle of optimality. The error function based on limited sample and expert knowledge is constructed and the genetic algorithm is used to search the optimal network parameters. This algorithm does not need the support of large-scale data sets. The learning efficiency is less affected by the degree of data missing and the complexity of network, and the convergence speed is faster. The algorithm flow is elaborated as follows.
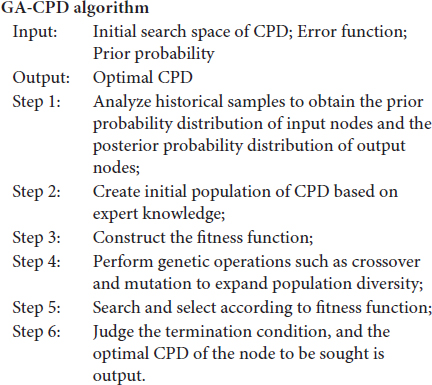
The key of GA-CPD algorithm is the construction of the fitness function, which determines the accuracy and efficiency of parameter search. For BN parameter learning, we define the reasoning error function as the fitness function. The error is the difference between the actual and reasoning posterior probability of the output node, as shown by Eq. 10.
where: M is the number of states taken by the node, P(Vi=xji) is the reasoning posterior probability of node i taking state j, and P0(Vi=xji) is the actual posterior probability of node i taking state j.
Bayesian Network Parameter Learning for Marine Disaster Assessment
We learn the CPD of network nodes according to the above steps based on limited samples and expert knowledge. Firstly, count the frequency distribution of each state of each node from the existing samples, as shown in Figure 4.
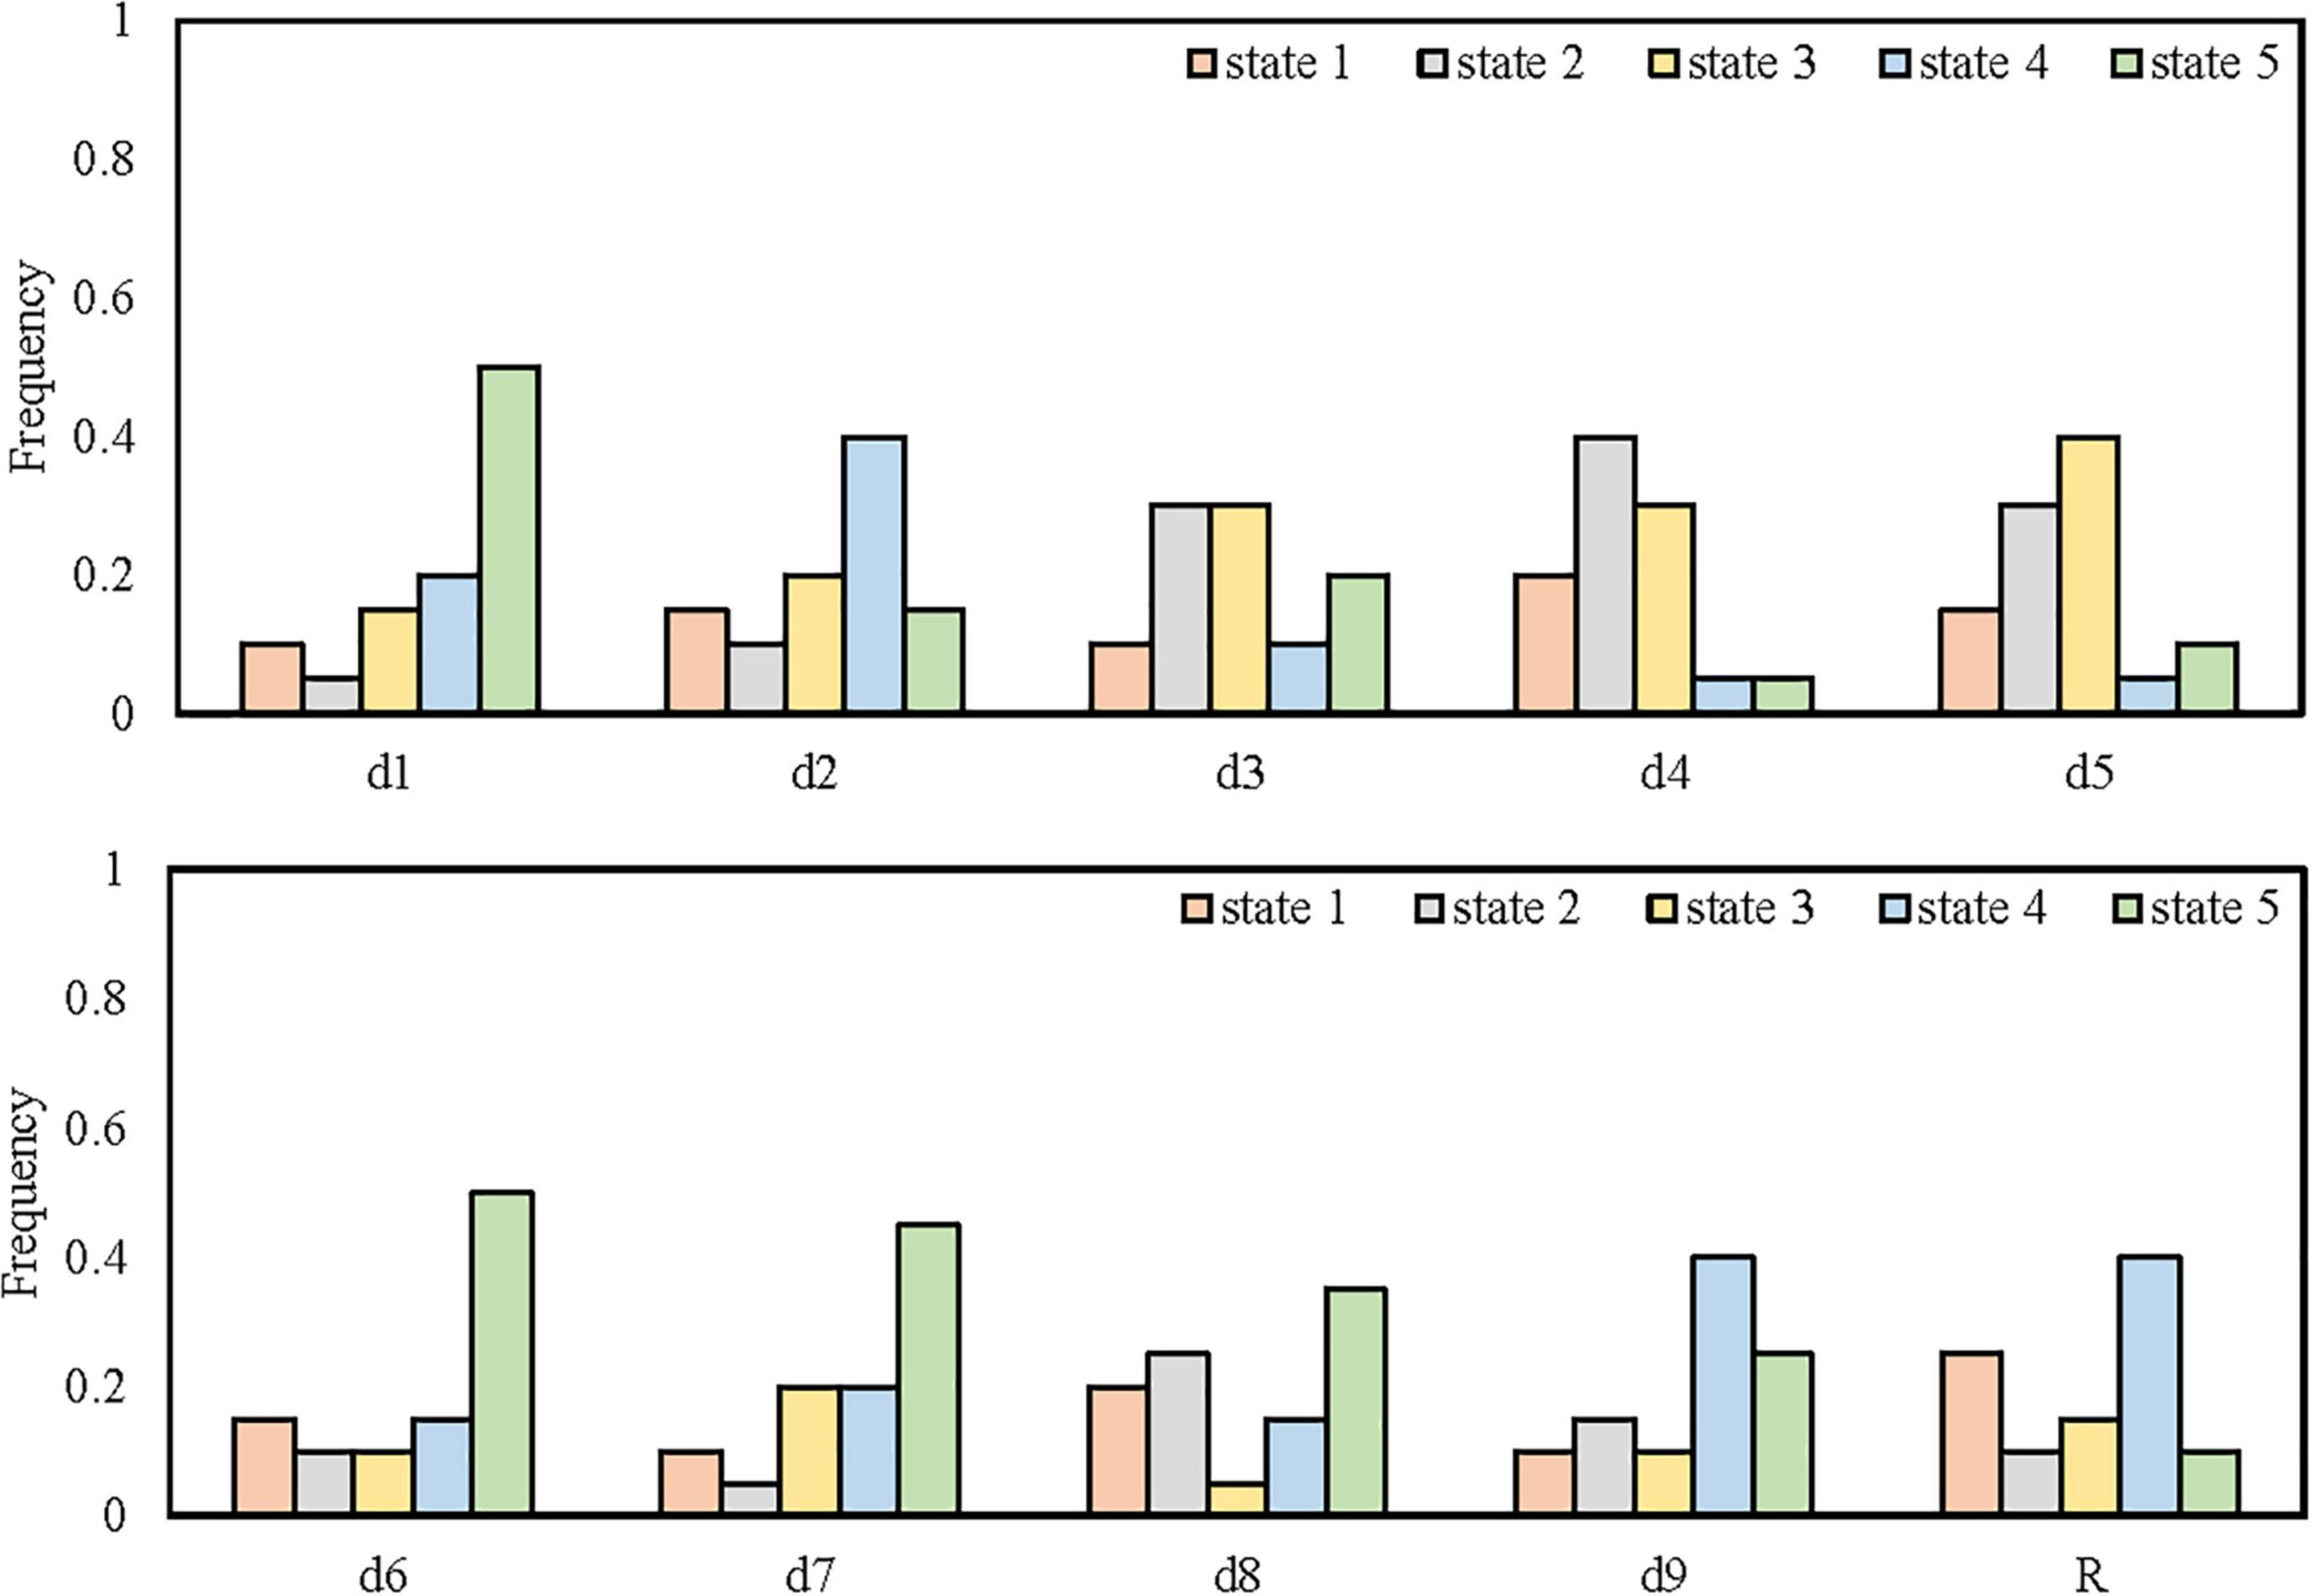
Figure 4. Frequency distribution of all states of each node.
Secondly, determine search parameters and search space of the genetic algorithm. For the sake of space, take the probability distribution P(d2|d1) between nodes d1 and d2 as an example. The search parameter settings are shown in Table 5. The initial range of the parameter is determined based on expert knowledge, thus the rationality of the search is ensured by introducing expert knowledge.
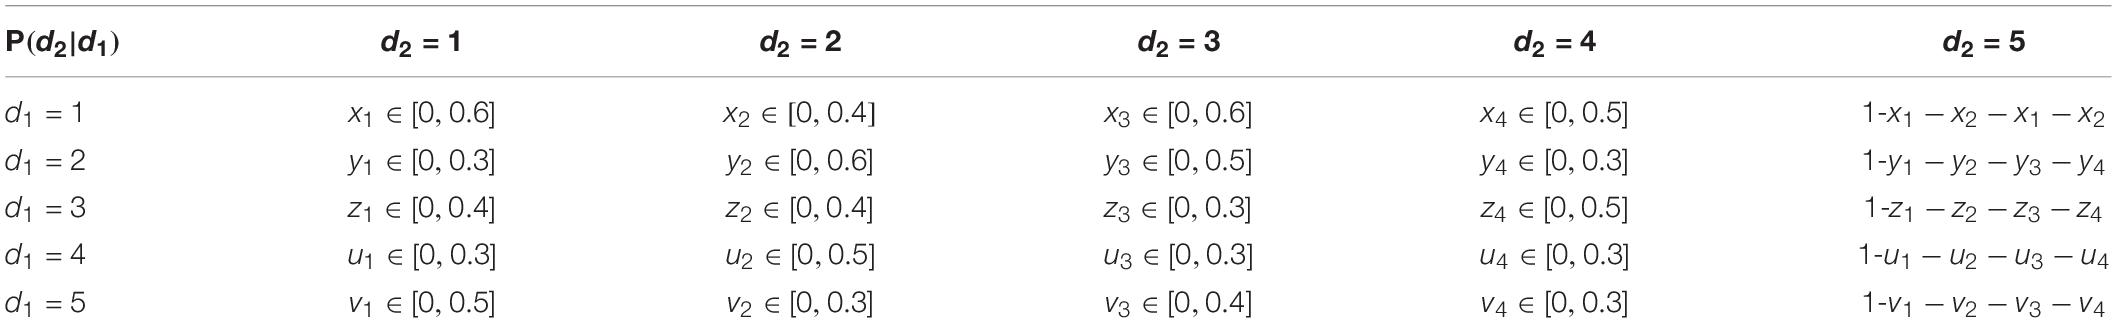
Table 5. Initial range of search parameters.
Finally, based on the posterior probability distribution of the evaluation target, the error function is constructed as shown by Eq. 11.
Input the prior probability of hazard indicators and vulnerability indicators, use the joint tree reasoning mechanism to perform the probabilistic reasoning. Based on the reasoning error, the genetic algorithm is used to search for the optimal CPD of each network node. Take CPD P(d2|d1) between nodes d1 and d2 for example. The convergence curve of the fitness function is displayed by Figure 5, and Table 6 lists the optimal probability distribution. At this point, it’s completed to build the BN-based assessment model for marine disaster.
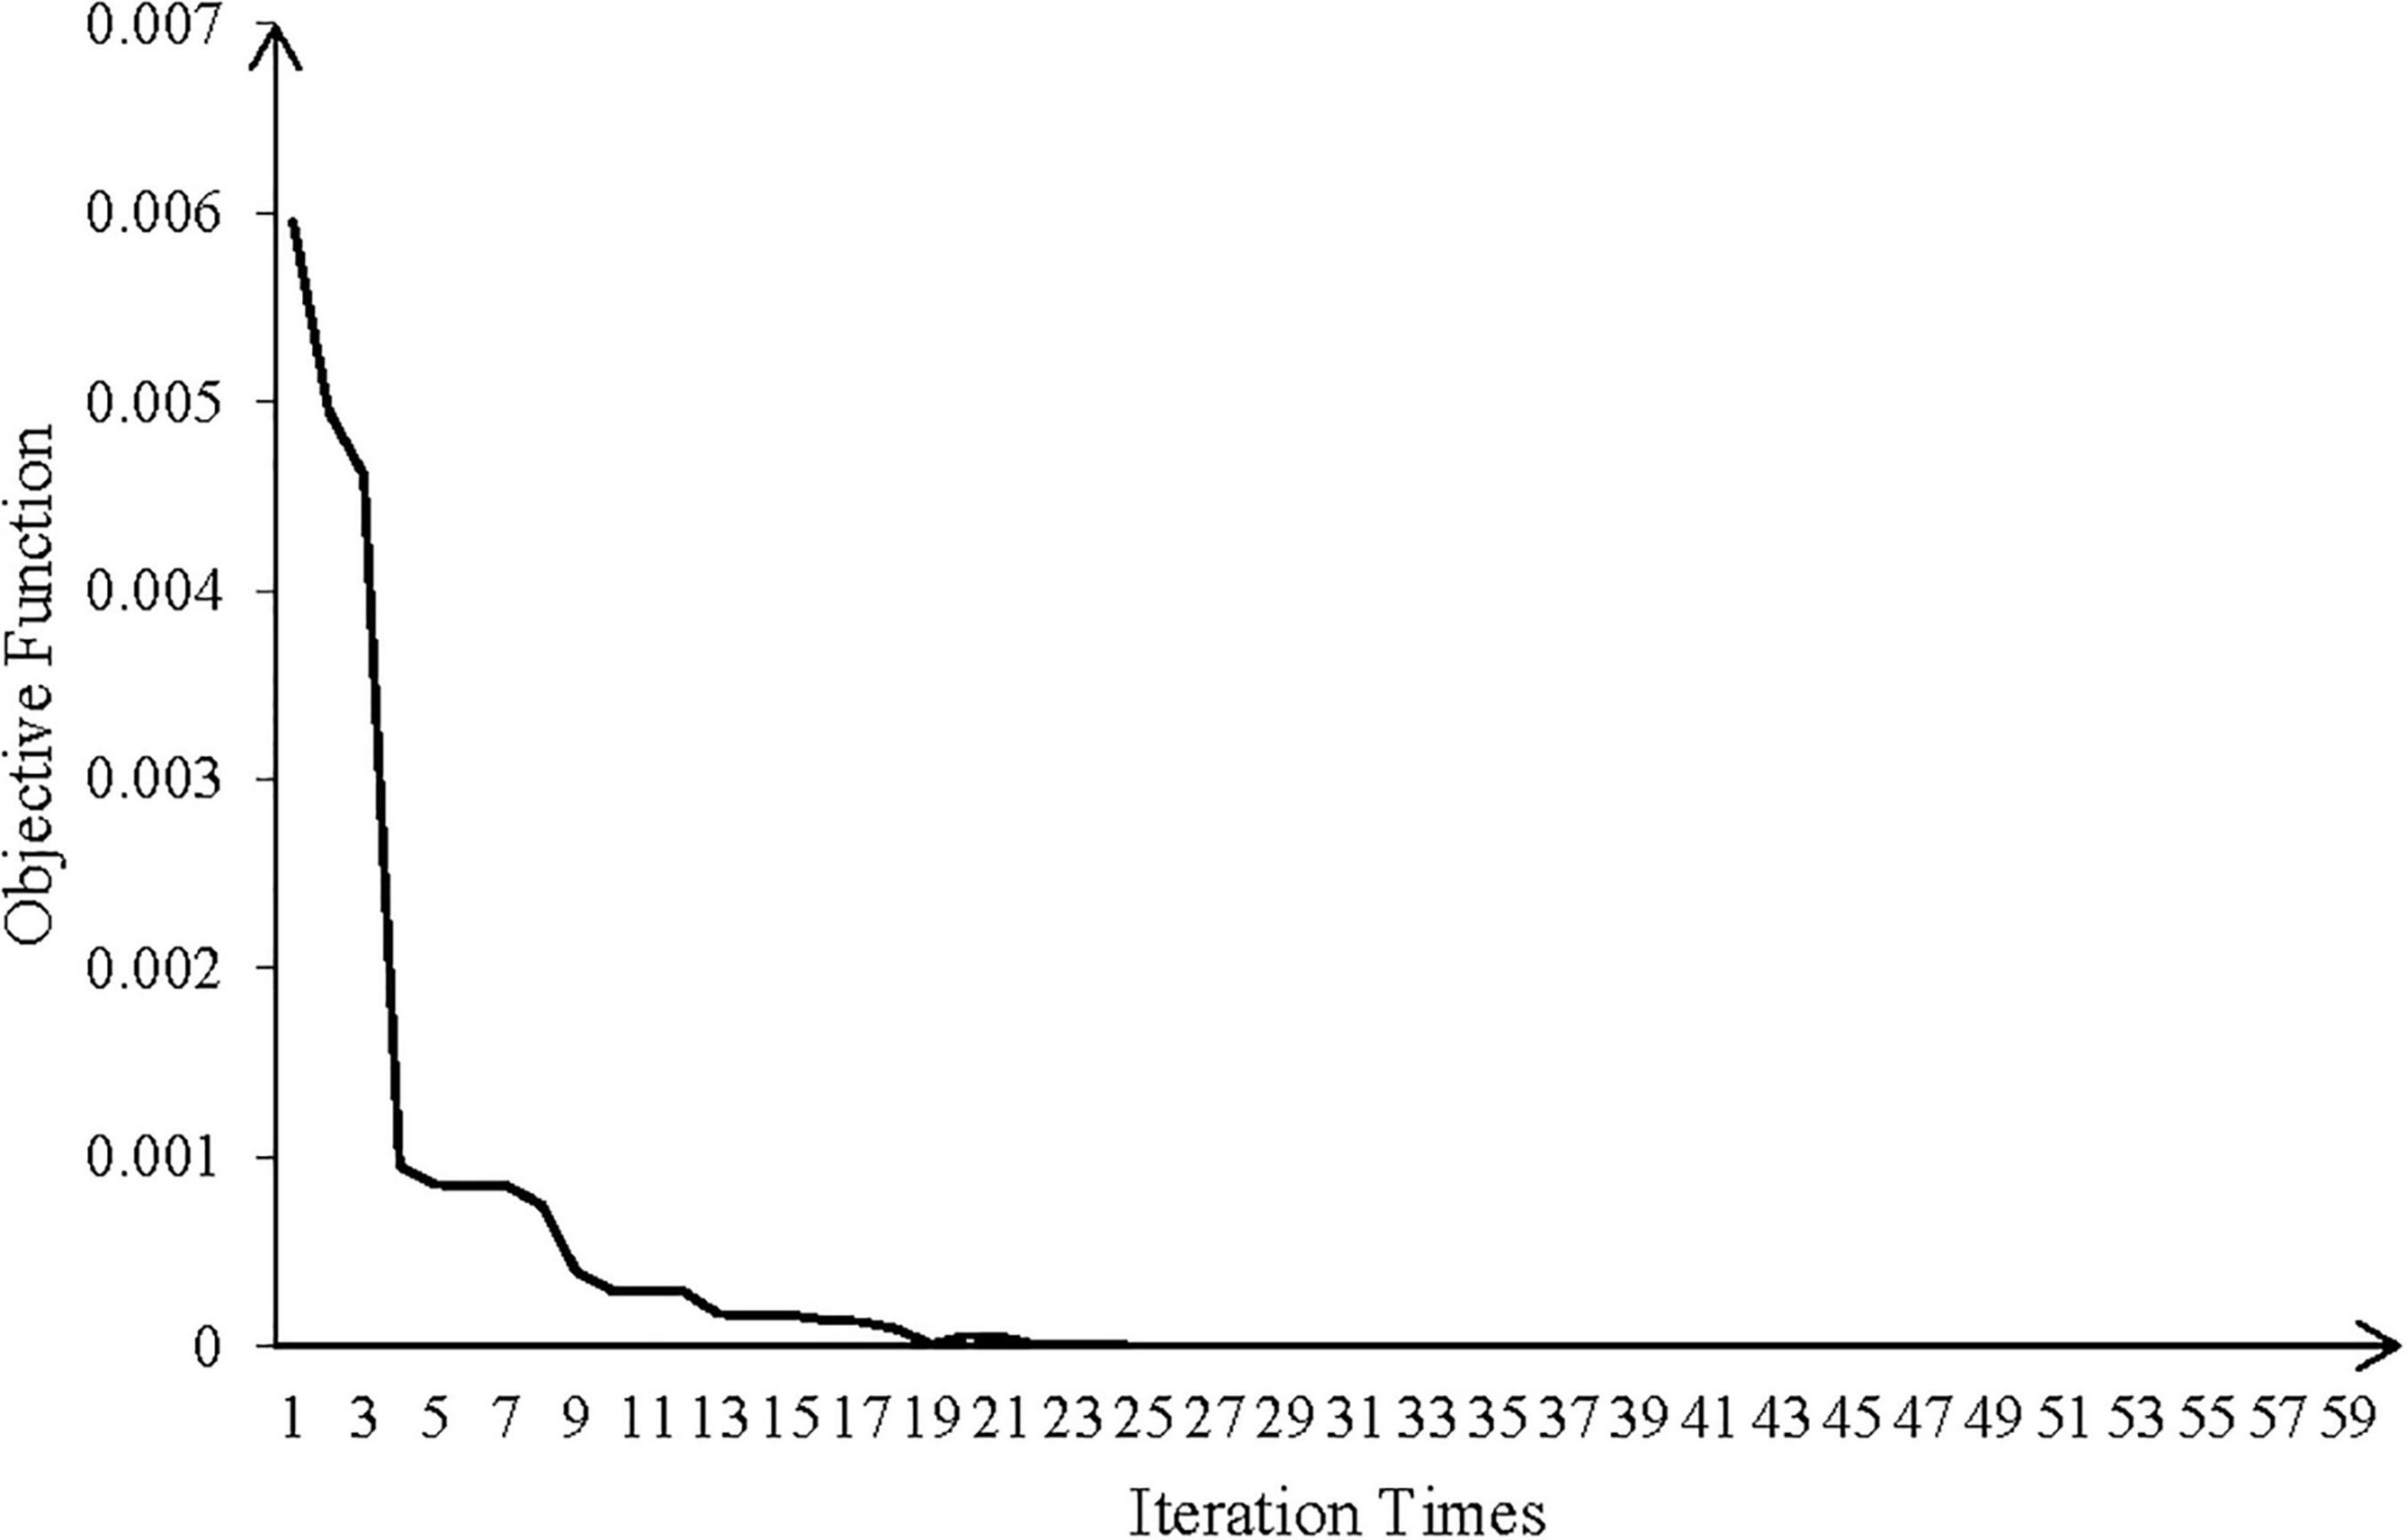
Figure 5. The convergence curve of the fitness function.
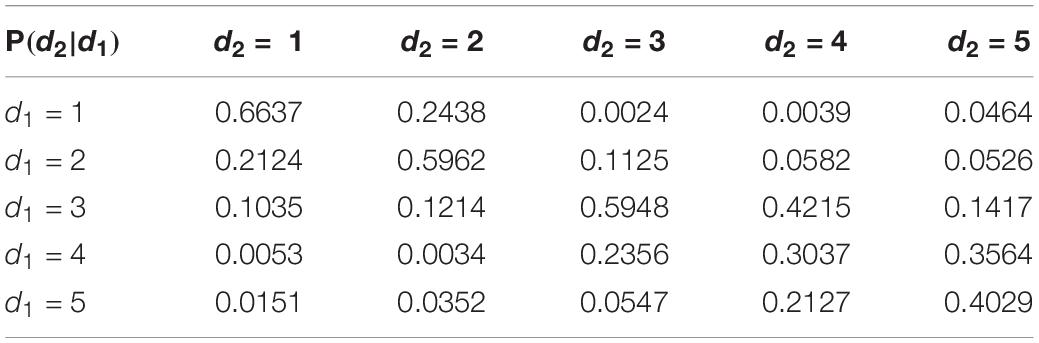
Table 6. The optimal CPD P(d2|d1).
Risk Assessment Experiment of Marine Disaster
In section “Bayesian Network-Based Risk Modeling Driven by Knowledge and Data,” on the basis of limited samples, we have combined expert knowledge into BN learning and constructed a BN-based risk assessment model under the condition of extreme shortage of samples. Next, we will input testing samples of hazard indicators and vulnerability indicators to evaluate the risk level of marine disaster through probabilistic reasoning, in order to verify the effectiveness of the risk assessment technology with small sample size.
Probabilistic Assessment
Based on the information of assessment indicators, the comprehensive risk of marine disaster is evaluated by probabilistic reasoning. The reasoning algorithm of BN includes the exact reasoning algorithm and approximate reasoning algorithm. Considering the small scale of network structure in our research, we choose the joint tree reasoning mechanism, one of the most widely used exact reasoning algorithms, to calculate the posterior probability distribution of the node R. We input the testing samples and the risk level is determined according to the maximum probability principle, as shown in Table 7. Take the first sample as example, the probability distribution of target node R is [level 1 = 0.912, level 2 = 0.055, level 3 = 0.033, level 4 = 0, level 5 = 0]. “level 1” has the highest probability, so the risk level of marine disaster is judged as “level 1.”
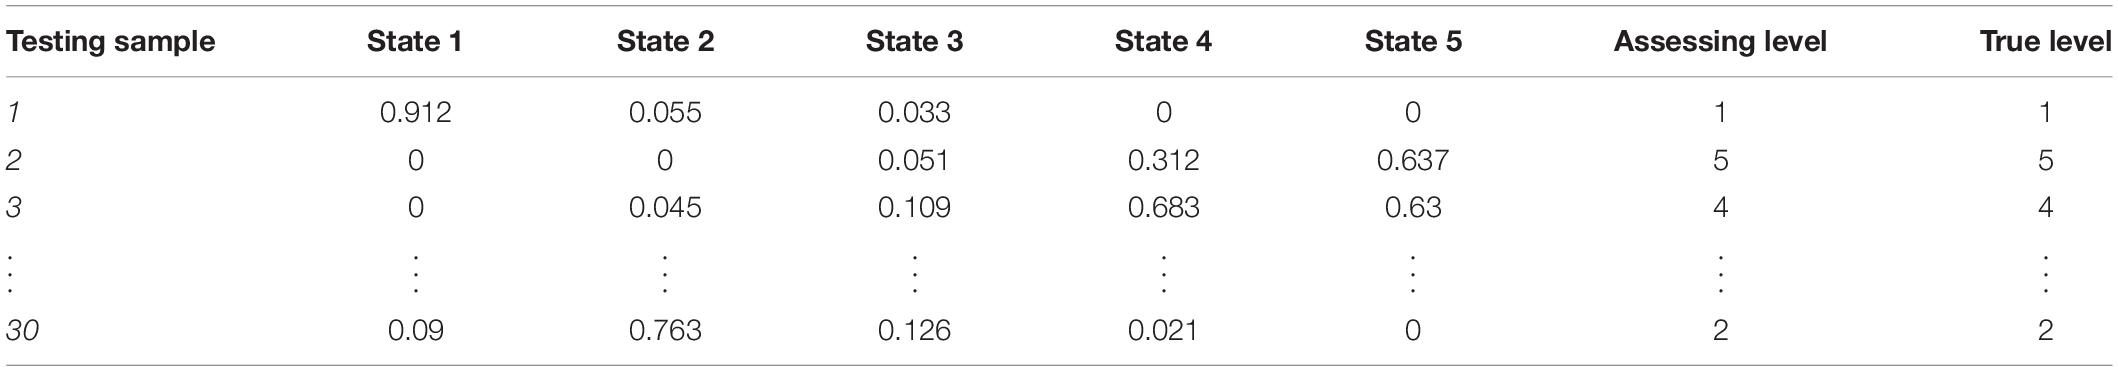
Table 7. Posterior probability distribution and risk level of marine disaster.
The evaluation results are expressed in the posterior probability distribution, clearly showing the probabilities of different risk levels. The assessment results display richer information and expresses the uncertainty of disaster risk. Compared with the actual risk level, the assessment accuracy of our proposed assessment model is 91.03%, which can effectively evaluate the comprehensive risk of marine disaster under the small sample condition.
Comparison Experiment
In the marine disaster assessment, associated samples between disaster losses and environmental conditions are deficient. It is hard to construct a scientific and accurate BN with classic structure and parameter learning algorithms directly, which has been verified by simulation experiments. To further discuss the performance of our assessment model and verify its effectiveness under the conditions of limited samples and uncertain knowledge, we design multiple sets of comparative experiments.
Comparison With Other Intelligent Assessment Models
The BN-based assessment model is an intelligent model and we focus on comparing it with other intelligent assessment models. At present, BPNN and SVM have achieved successful applications in the field of risk assessment (Feng and Liu, 2017; Li et al., 2021a). BPNN can better deal with the non-linear relationship among complex indicators. SVM is a non-linear modeling method that is suitable for solving small samples and high dimension modeling problems. Based on the same modeling samples, we also use BPNN and SVM to evaluate the marine disaster risk in Shanghai. The parameter settings of BPNN and SVM are shown as follows.
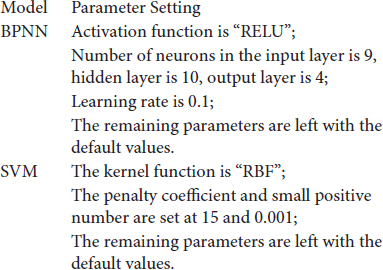
Figure 6 displays the disaster assessment results of the three models. The assessment accuracy of BPNN and SVM are 61.34 and 70.67%, respectively, which are significantly lower than the accuracy of BN (91.03%). More importantly, BPNN and SVM are ML algorithms with deterministic outputs, and the assessment results are single certain values, which cannot handle and express the uncertainty in disaster assessment. In contrast, BN not only obtains high accuracy in assessment with mining the causal relationship among indicators, but also can deal with uncertainty through probabilistic reasoning.
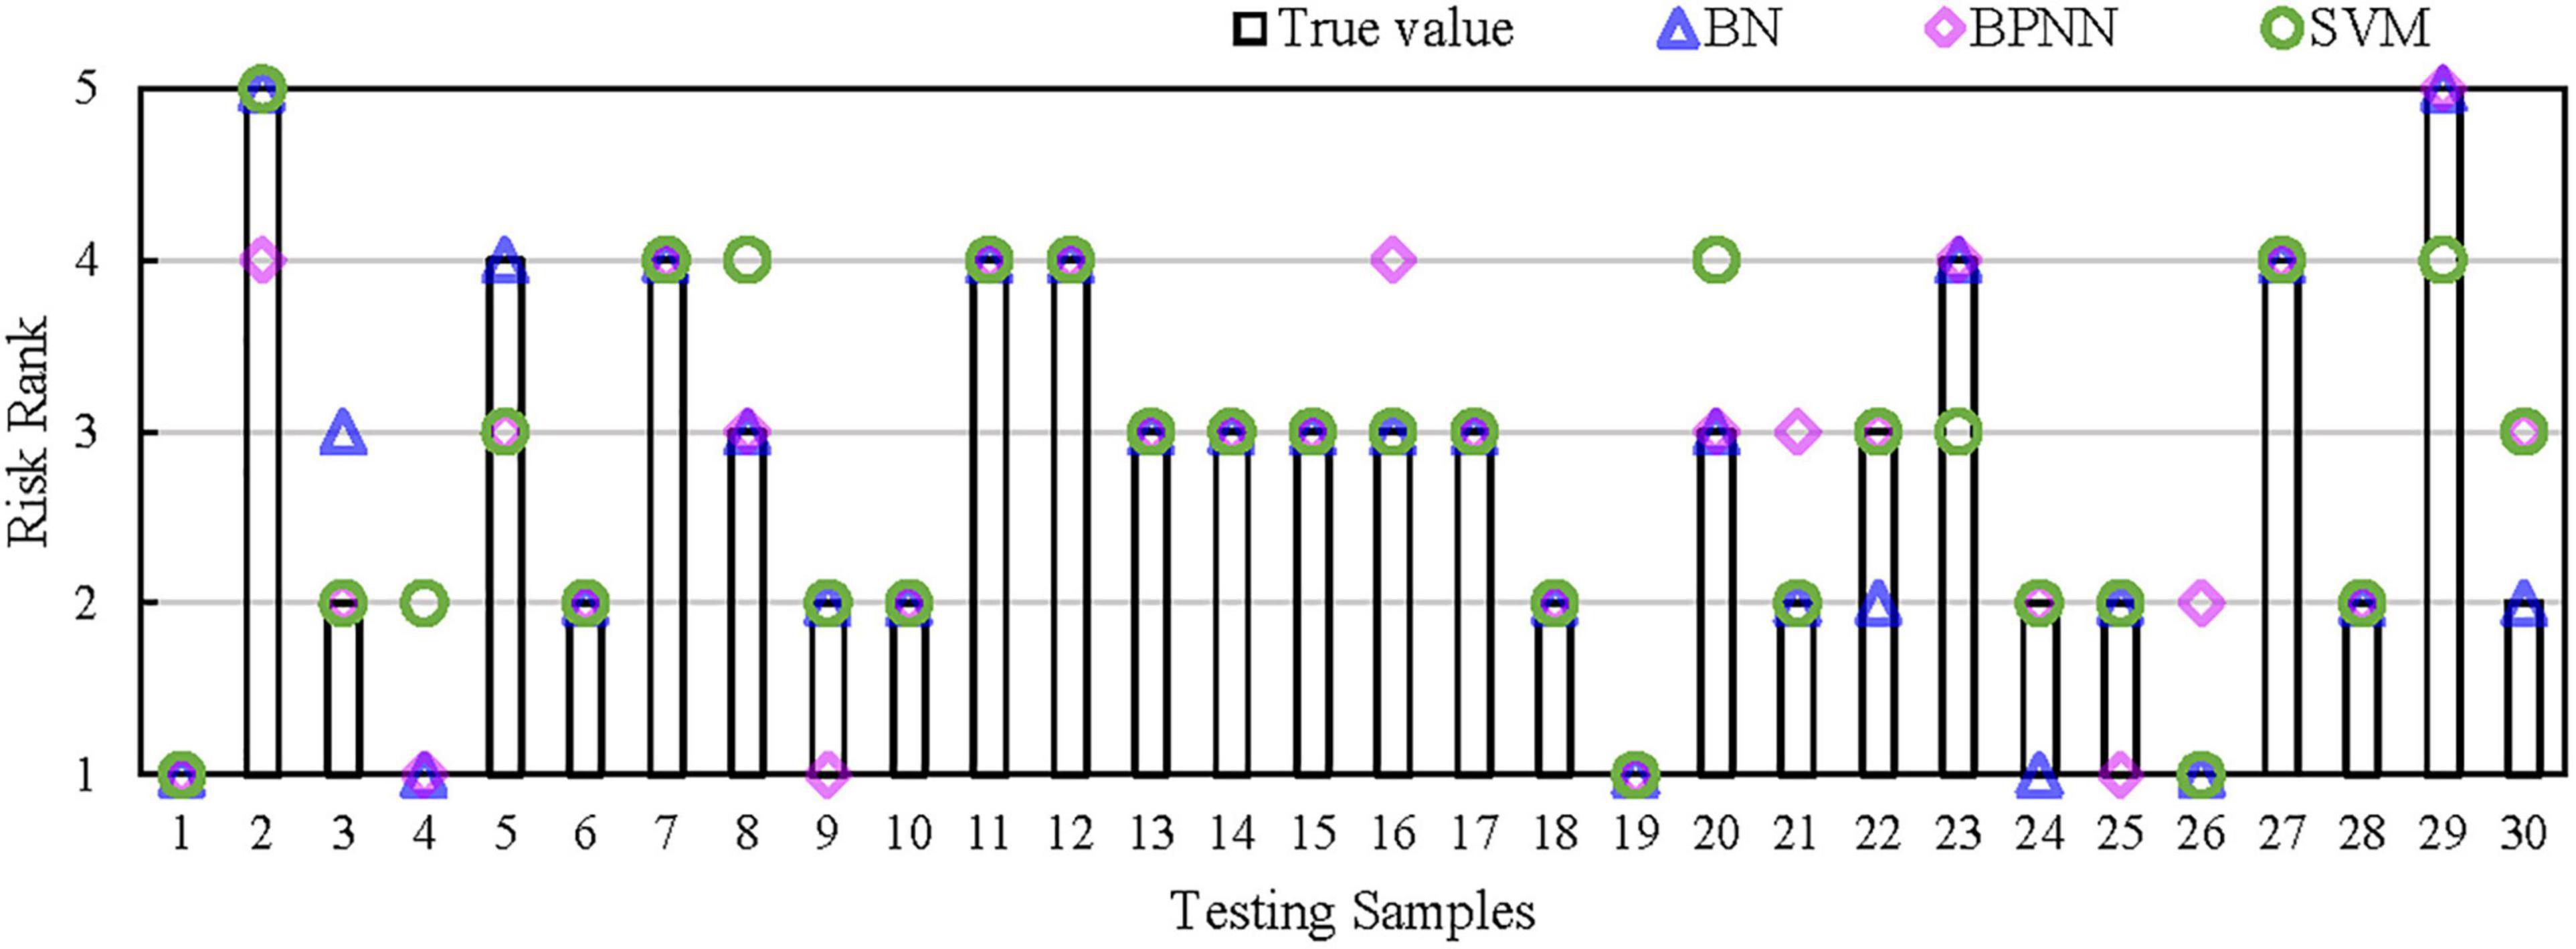
Figure 6. Assessment results of BN, BPNN and SVM.
To further test the effectiveness of our proposed technique for small sample modeling, we use three models to conduct risk assessment experiments based on different training sample sizes (sample sizes from 10 to 90). Figure 7 shows the assessment accuracy with the testing samples. It can be seen that when the training sample size is small, the accuracy of our proposed model is better than that of BPNN and SVM, and the sample size has less impact on the BN-based model. Especially, when the training samples are extremely scarce (<30), the proposed model can still maintain a high evaluation accuracy rate (>60%), while the other two models are under-performing (<30%).
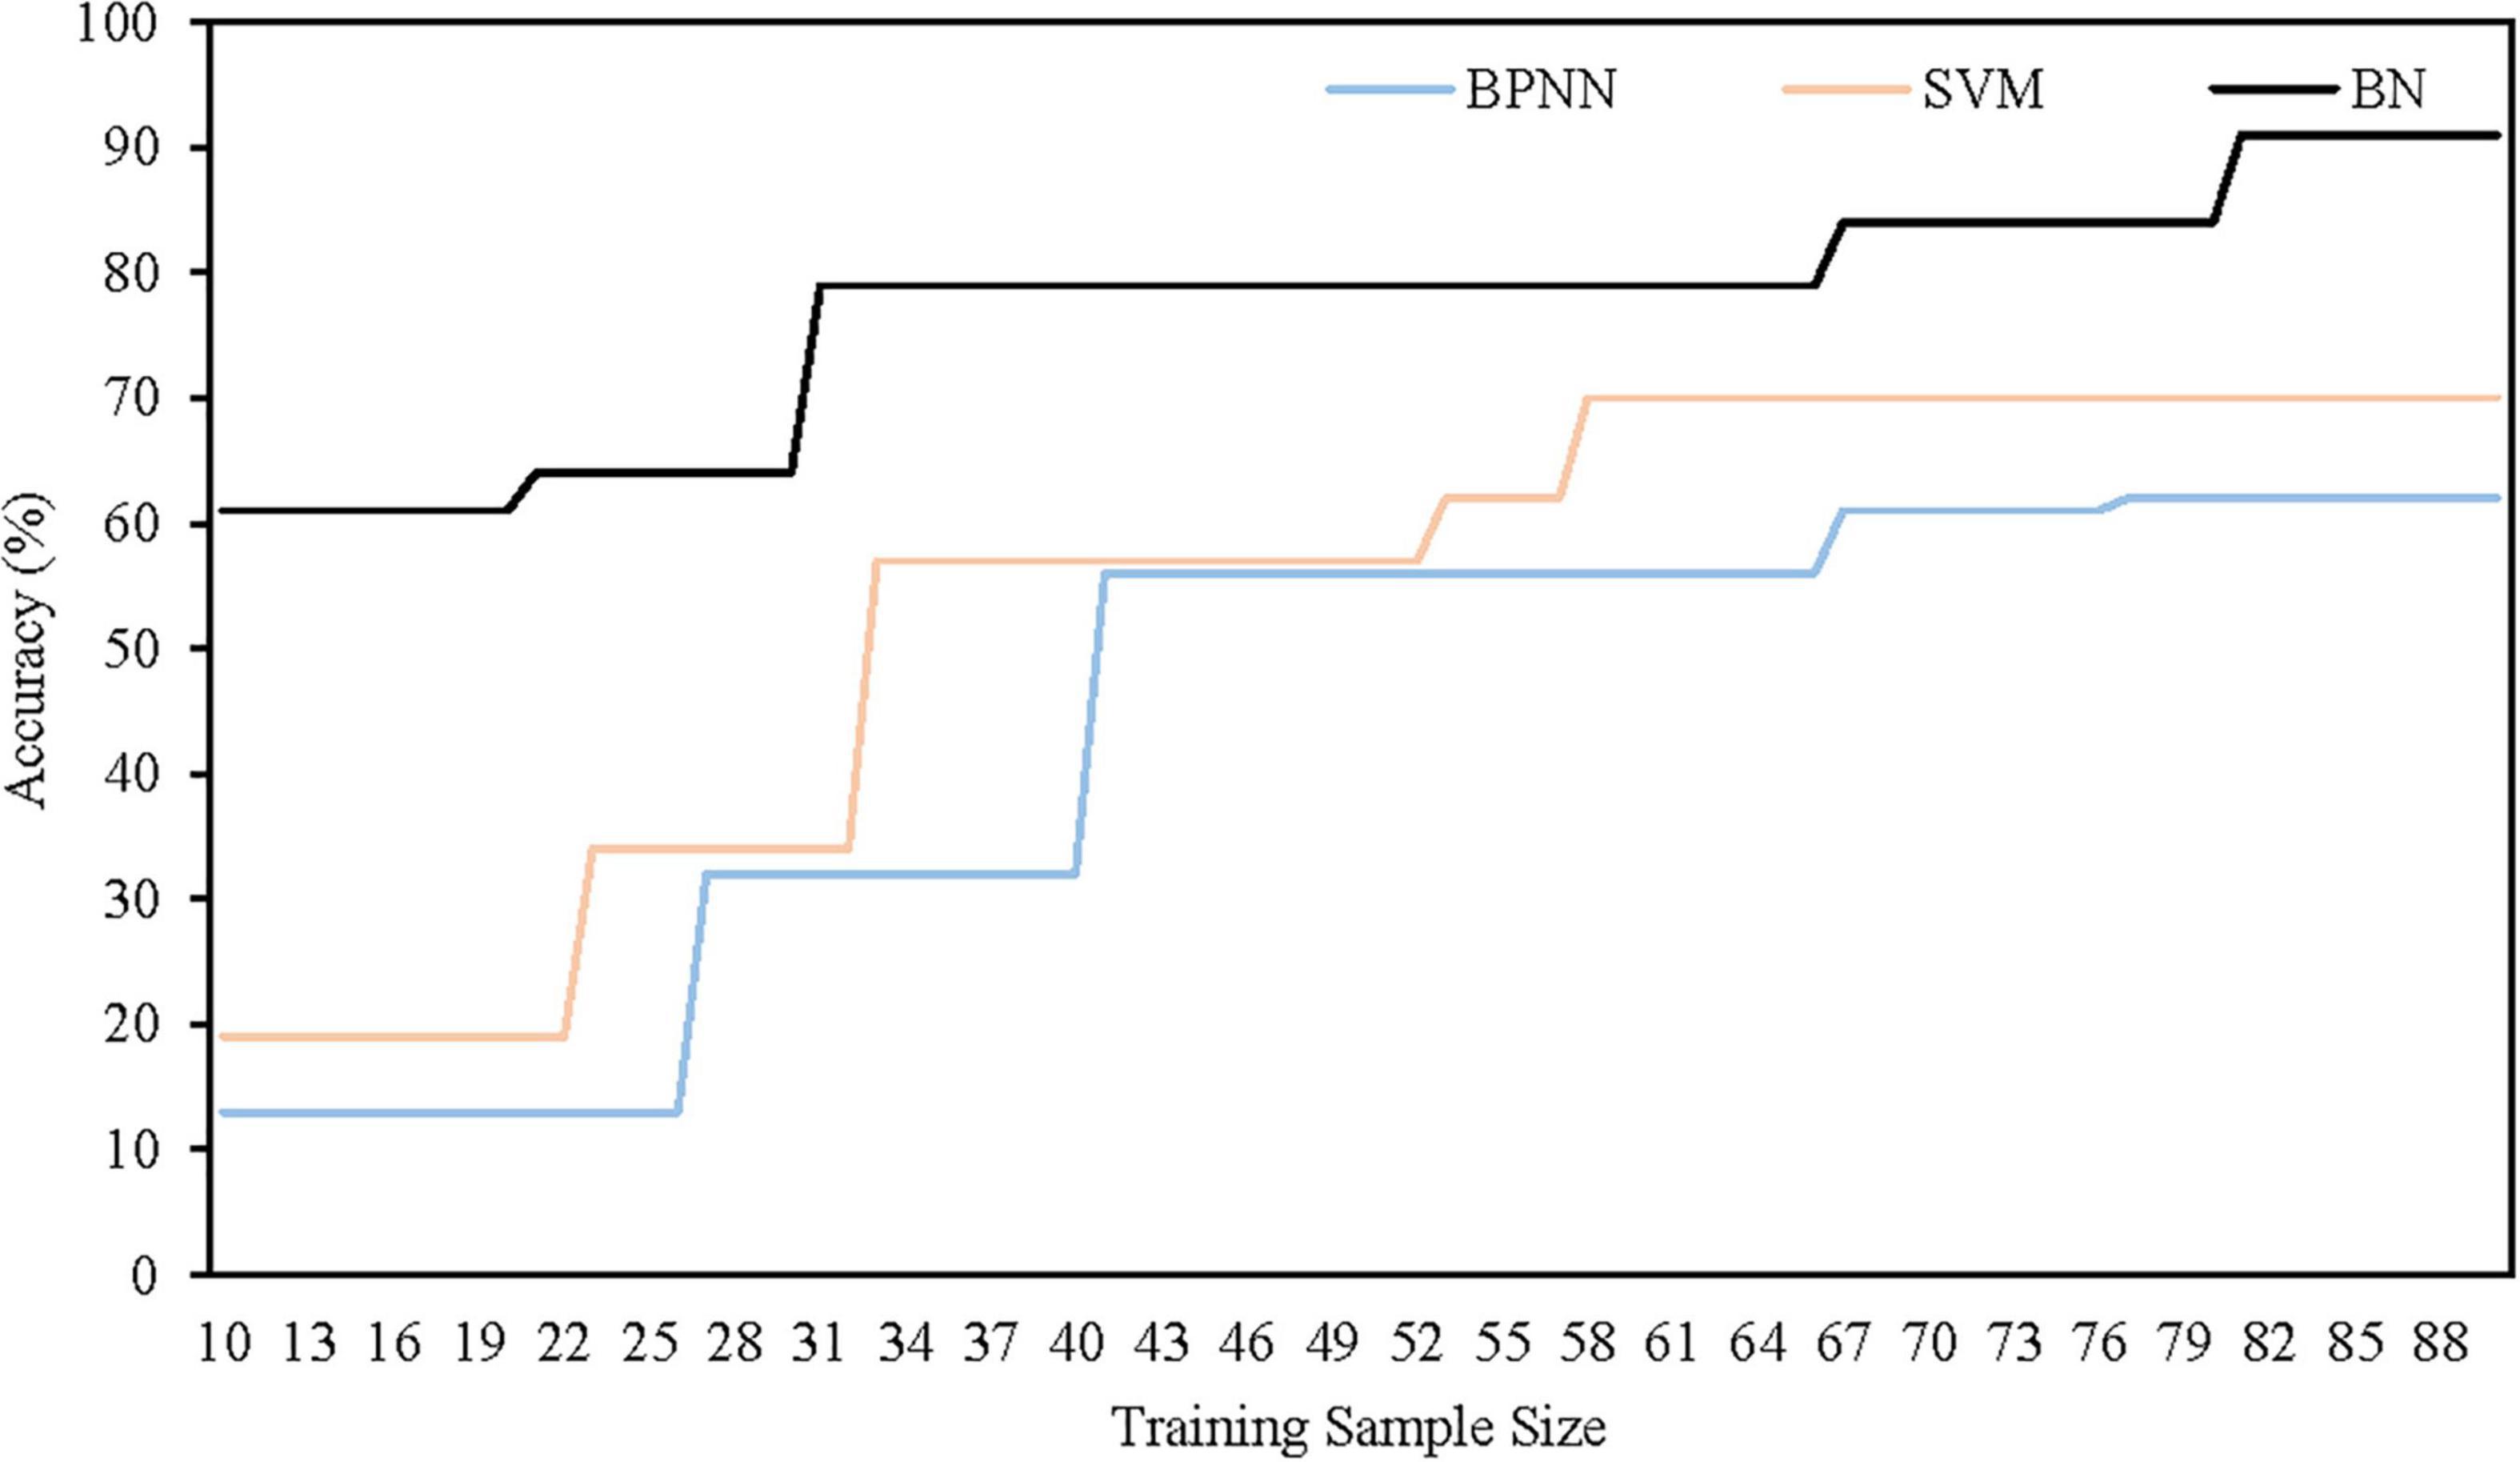
Figure 7. Assessment accuracy of three models with different training samples.
In conclusion, ML-based intelligent assessment models usually require big data to train the mapping relation between input and output. The mapping relation is surely unreliable if there is just small sample. In our proposed model, expert knowledge is regularly expressed and quantitatively incorporated into BN learning to make up for the information loss. The combination of data and knowledge results in a better accuracy.
Generalization Verification
Generalization ability is usually known in the ML community, used to describe the algorithm’s adaptive capacity to new samples. In order to test the generality of our proposed model for new scenes, we conducted the risk assessment of marine disaster in five other coastal cities: Dalian, Qingdao, Xiamen, Guangzhou, and Haikou. In the risk-modeling process, there are still 90 training samples and 30 testing samples. The parameter settings of the three models remain unchanged. The assessment results are shown in Figure 8. For different cities, the accuracy of the BN-based assessment model is higher than that of BPNN and SVM, indicating that the proposed model has a better stability.

Figure 8. Risk assessment of different coastal cities.
Conclusion
Risk management of marine disasters is crucial to ocean exploitation and utilization. With climate change, marine disasters are occurring more frequently and risk management of ocean is urgently needed so as to provide solutions for tackling climate impacts and marine disasters. Our research is focused on the risk assessment of marine disasters, which can provide basis for the development of nature-based solutions, such as hazard prevention and mitigation.
On one hand, the marine disaster is a complicated system consisting of a number of factors, which can influence each other and are strongly coupled together. The interaction in the disaster system has strong non-linearity and uncertainty. On the other hand, marine disasters are extreme natural phenomena, which are small-probability events with very small occurring frequency, so there are few observation samples. BN is a powerful model for dealing with uncertain and complex relationships and has been widely used in the field of risk evaluation and decision-making. But BN modeling needs to be supported by big data, which contradicts the small sample size in marine disaster assessment. Aiming at this problem, we propose a new BN learning method driven by a hybrid of knowledge and data, and apply it to marine disaster risk assessment, expanding the application of BN in small sample modeling.
For BN structure learning, the expert knowledge is expressed quantitatively in the form of network connection probability, and DS evidence theory is used to fuse the multi-expert knowledge, building the prior constraint for structure learning. For parameter learning, by introducing the principle of optimality, we establish the error function based on limited samples and expert knowledge, and adopt the genetic algorithm to search the optimal network parameters. Expert knowledge is regularly expressed and quantitatively integrated into BN learning, achieving the risk assessment modeling under the condition of insufficient samples. Comparative experiments show that the proposed model has better accuracy and stability than BPNN and SVM.
However, the DS evidence combination rule used in our model is relatively simple and the reliability of different evidence is not taken into full consideration. We will adopt a more sensible combination rule for knowledge fusion in the next step. Besides, we will also improve the search algorithm in BN structure learning to avoid the remaining local optima.
Data Availability Statement
The original contributions presented in the study are included in the article/supplementary material, further inquiries can be directed to the corresponding author/s.
Author Contributions
ML and RZ designed the experiments. ML collected the data, conducted the experiments, and wrote the manuscript. ML and KL analyzed the results. All authors contributed to the article and approved the submitted version.
Funding
This work was supported by the National Natural Science Foundation of China (Nos. 41976188, 41775165, 51609254, and 42106200) and the Graduate Research and Innovation Project of Hunan Province (No. CX20200009).
Conflict of Interest
The authors declare that the research was conducted in the absence of any commercial or financial relationships that could be construed as a potential conflict of interest.
Publisher’s Note
All claims expressed in this article are solely those of the authors and do not necessarily represent those of their affiliated organizations, or those of the publisher, the editors and the reviewers. Any product that may be evaluated in this article, or claim that may be made by its manufacturer, is not guaranteed or endorsed by the publisher.
Footnotes
References
Bai, C., Zhang, R., and Hong, M. (2014). “Guangdong province typhoon storm surge disaster risk zoning based on improved fuzzy Bayesian network[C]. Chinese society of system engineering,” in Proceedings of the 18th Annual Conference of Chinese Society of System Engineering, Shanghai.
Boutkhamouine, B., Roux, H., and Pérès, F. (2017). A Bayesian Network Approach for Flash Flood Risk Assessment. The EGU General Assembly Conference. Vienna.
Chickering, D. M., Meek, C., and Heckerman, D. (2004). Large-sample learning of Bayesian networks is NP-hard. J. Mach. Learn. Res. 5, 1287–1330.
Di, R. H., Gao, X. G., and Guo, Z. G. (2017). Bayesian network structure learning based on improved BIC score[J]. Syst. Eng. Electron. 39, 437–444. doi: 10.1016/j.jsr.2019.02.008
Feng, Q., and Liu, Q. (2017). Pre-assessment of storm surge disaster loss based on SVM-BP neural network[J]. Mar. Environ. Sci. 36, 134–146.
Gao, S., Zhong, S. H., and Li, Y. R. (2018). Research on comprehensive risk assessment of marine natural disasters in shandong Province. Mar. Sci. 42, 55–63.
Gu, J. Y. (2017). Ontology Construction and Reasoning Method of Rainstorm and Flood Disaster Chain[D]. Hubei: Wuhan University.
Huang, C. F. (2006). Information matrix method for natural disaster risk analysis. J. Nat. Disasters 15, 1–10. doi: 10.2328/jnds.30.1
Ignaciuk, A., Rice, M., and Bogardi, J. (2012). Responding to complex societal challenges: a decade of Earth system science partnership (ESSP) interdisciplinary research. Curr. Opin. Environ. Sustain. 4, 147–158. doi: 10.1016/j.cosust.2011.12.003
Khatsü, P. (2011). Urban Multi-Hazard Risk Analysis Using GIS and Remote Sensing. Berlin: Springer Press.
Li, M., and Liu, K. F. (2019). Causality-based attribute weighting via information flow and genetic algorithm for naive bayes classifier. IEEE Access 7, 150630–150641. doi: 10.1109/access.2019.2947568
Li, M., Zhang, R., and Hong, M. (2018b). Improved Bayesian network-based risk model and its application in disaster risk assessment. Int. J. Disaster Risk Sci. 9, 237–248. doi: 10.1007/s13753-018-0171-z
Li, M., Zhang, R., and Hong, M. (2018a). Bayesian network structure learning algorithm based on information flow improvement. Syst. Eng. Electron. 40, 1386–1390. doi: 10.1016/j.neuroimage.2013.02.054
Li, M., Zhang, R., and Liu, K. F. (2020). A new ensemble learning algorithm combined with causal analysis for Bayesian network structural learning. Symmetry 12:2054. doi: 10.3390/sym12122054
Li, M., Zhang, R., and Liu, K. F. (2021b). Risk assessment of marine environments along the South China Sea and North Indian ocean on the basis of a weighted Bayesian network. J. Ocean Univ. China 20, 521–531. doi: 10.1007/s11802-021-4631-5
Li, M., Zhang, R., and Liu, K. F. (2021a). Machine learning incorporated with causal analysis for short-term prediction of sea ice. Front. Mar. Sci. 8:649378. doi: 10.3389/fmars.2021.649378
Liu, R. (2016). Research on Flood Disaster Risk Assessment and Modelling Based on Bayesian Network. Shanghai: East China Normal University.
Niu, L. L. (2016). Research on Bayesian Network Modeling Method Driven by Knowledge and Data[D]. Boston, MA: Northeastern University.
Pearl, J. (1995). Bayesian Networks. Arbib, M. Handbook of Brain Theory & Neural Networks. Berlin: Springer Press.
Qi, Q. H., Cai, R. S. H., and Yan, X. H. (2019). Discussion on climate change and China’s marine disaster risk management[J]. Ocean Bull. 225, 4–10. doi: 10.3390/ijerph15091802
Qiao, J. G., Gong, S. J., and Zhao, W. (2014). Risk assessment of geological hazards in the coastal zone of Tianjin Binhai New Area. Chin. J. Geol. Hazard Control 25, 110–115.
Straub, D., and Kiureghian, A. D. (2012). Bayesian network enhanced with structural reliability methods: application [J]. J. Eng. Mech. 136, 1259–1270. doi: 10.1061/(asce)em.1943-7889.0000170
Sun, Y. T. (2010). Research on China’s Marine Disaster Emergency Management[M]. Beijing: Ocean University of China Press.
Wen, S. Y., Zhao, D. Z., and Chen, Y. L. (2007). Research on the weight of red tide disaster risk assessment index based on AHP method. J. Catastr. 22, 9–14.
Ye, T., Guo, W. P., and Shi, P. J. (2005). Analysis of risk characteristics of China’s marine disaster system and its integrated risk management since 1990. J. Nat. Disasters 14, 65–70.
Yu, S. S., Li, S. Y., and Zhang, D. Y. (2020). Research on sea ice risk short-term forecast based on mechanical learning theory. J. Ocean Technol. 39:7.
Zeng, Q., Huang, Z. H., and Wei, S. H. H. (2020). Bayesian network parameter learning method combining expert prior knowledge and monotonic constraints. Syst. Eng. Electron. 042, 646–652.
Zhang, R. (2012). Diagnosis of Marine Environment Characteristics and Risk Assessment of Maritime Military Activities. Beijing: Beijing Normal University Press, 26–35.
Zhang, R., Xu, Z. S., and Shen, S. H. (2013). Natural disaster risk assessment based on small sample cases—Information diffusion probability model. Syst. Sci. Math. 8, 65–76.
Zhang, Z. H. H., Wang, X. M., and Dang, J. W. (2014). Bayesian network structure learning method based on expert knowledge fusion[J]. Comput. Eng. Appl. 50, 1–13.
Keywords: marine disaster, risk assessment, Bayesian network, expert knowledge, small sample modeling
Citation: Li M, Zhang R and Liu K (2022) Expert Knowledge-Driven Bayesian Network Modeling for Marine Disaster Assessment Under the Small Sample Condition. Front. Mar. Sci. 9:799141. doi: 10.3389/fmars.2022.799141
Received: 21 October 2021; Accepted: 01 February 2022;
Published: 04 March 2022.
Edited by:
Eugen Victor Cristian Rusu, Dunarea de Jos University, RomaniaCopyright © 2022 Li, Zhang and Liu. This is an open-access article distributed under the terms of the Creative Commons Attribution License (CC BY). The use, distribution or reproduction in other forums is permitted, provided the original author(s) and the copyright owner(s) are credited and that the original publication in this journal is cited, in accordance with accepted academic practice. No use, distribution or reproduction is permitted which does not comply with these terms.
*Correspondence: Ren Zhang, ywlypaper@163.com