
94% of researchers rate our articles as excellent or good
Learn more about the work of our research integrity team to safeguard the quality of each article we publish.
Find out more
ORIGINAL RESEARCH article
Front. Mar. Sci., 01 April 2022
Sec. Marine Biogeochemistry
Volume 9 - 2022 | https://doi.org/10.3389/fmars.2022.793556
This article is part of the Research TopicPhysics and Biogeochemistry of the East Asian Marginal SeasView all 30 articles
The cycling of particulate organic carbon (POC) in continental shelf regions of the Yellow Sea (YS) and the East China Sea (ECS) was investigated by analyzing the concentrations and carbon isotope signatures (δ13C, Δ14C) of POC, together with the particulate aluminum (Al) concentration and 234Th activity over the period 10–20 August 2020. POC concentrations in the surface layer (0–20 m) were twice as high as those in the middle layer (20–50 m); the highest concentrations of all were observed in the bottom layer (> 50 m) of the YS and the region affected by Changjiang Diluted Water (CDW). Particulate Al concentrations in the bottom layer were three times higher than those in the overlying water column, indicating extensive sediment resuspension. Based on the three-endmember mixing model for the dual carbon isotopes, the estimated contribution of resuspended sedimentary organic carbon to POC ranged from 18% in the surface layer to 65% in the bottom layer. The contribution of riverine input to POC ranged from < 5% in the CDW region to ∼45% in the surface layer of the YS region, whereas that of in situ production was ∼40% in the entire study region. A deficiency of 234Th relative to 238U indicates short residence times of particles in the entire water column (2.6 ± 2.2 d). The flux of POC settling to the seafloor, calculated based on 234Th–238U disequilibrium, was 47–125 mmol m–2 d–1. The POC settling flux was one to two orders of magnitude higher than the burial rate of POC in the underlying sediment, implying the rapid decomposition of POC before incorporation into the sediment. Thus, sediment resuspension is prevalent and an important component of the POC cycling in this shelf region. Overall, our study revealed the complex nature of POC cycling on this shelf, quantified the relative importance of each source of POC, and determined POC flux to the sediment.
The cycling of particulate organic carbon (POC) in continental shelf regions is affected by various sources, including rivers, the atmosphere, groundwater, and in situ production. Primary production in continental shelf waters accounts for ∼30% of the total primary production of the global ocean, although these shelves account for only 10% of the oceans (Eppley and Peterson, 1979). Continental shelves also account for ∼80% of organic carbon burial within sediments, and they contribute up to 50% of the organic carbon supply to the open ocean through lateral transport (Muller-Karger et al., 2005; Liu et al., 2010). Thus, continental shelves play a crucial role in carbon cycling in the ocean.
The continental shelf of the Yellow Sea (YS), East China Sea (ECS), and southern Sea of Korea (SSK) is one of the largest continental shelves on the global ocean, having a total area of ∼0.9 × 10⁶ km2. This shelf receives an extraordinarily large volume of terrestrial material from rivers, groundwater, and the atmosphere (Zhang et al., 1992; Kim et al., 2005). The Changjiang (Yangtze River; water discharge = 0.9 × 10¹² m–3 yr–1), which is the third-largest river in the world, and other smaller rivers, including the Yellow River (0.6 × 10¹¹ m–3 yr–1) and the Han River (1.7 × 10¹⁰ m–3 yr–1) discharge onto this shelf. The Changjiang has an annual discharge of 3.1 × 10⁶ t of organic carbon (Wang et al., 2012), 500 × 106 t of sediments (Xu et al., 2018), and 0.8 × 10⁶ t of dissolved inorganic nitrogen (Shen and Liu, 2009). The Yellow River has an annual discharge of 0.5 × 10⁶ t of organic carbon (Ran et al., 2013) and 1,100 × 106 t of sediments (Ren and Shi, 1986).
Primary production in the ECS averages 400 mg C m–2 d–1, with a large seasonal variation (Gong et al., 2003). The maximum value in summer reaches 940 mg C m–2 d–1. This region is regarded as an important sink of atmospheric CO2 because of its high primary productivity, and this shelf accounts for ∼9% of the total carbon burial within ocean sediments (Zhai and Dai, 2009; Song et al., 2018). Hung et al. (2013) suggested that a high portion of the suspended POC (50–90%) is derived from sediment on this shelf based on a vertical endmember mixing model. However, the relative contributions of various sources of POC, together with processes such as settling, resuspension, decomposition, and burial of POC, in the sediment are still poorly understood in this area. In addition, Zhu et al. (2006) reported that the cross-shelf flux of POC from these shelf regions to the open ocean is also significant, equivalent to ∼2% of the Changjiang POC discharge. Thus, the characterization of POC cycle in this shelf is important to better understand the global carbon cycle.
In this study, we investigated the sources of POC and the settling fluxes of POC and Al to the seafloor. Stable carbon isotope ratio (δ13C) was used to differentiate terrestrial vs. marine sources of POC (Cifuentes et al., 1996; Kohn, 2010), and radiocarbon isotope ratio (Δ14C) was used to determine the contribution of POC from sediment resuspension (Kim et al., 2020). 234Th (half-life: 24.1 days) was used to determine particle scavenging rates because it is particle-reactive, whereas its parent, 238U (half-life: 4.5 × 10⁹ y), is chemically conservative in seawater. The fluxes of POC and trace elements were determined using a box model based on 234Th–238U disequilibrium (Buesseler et al., 2006; Black et al., 2019).
Samples were collected onboard the R/V Onnuri from 10 to 20 August 2020 (Figure 1). Hydrographic parameters, including salinity and temperature, were obtained at 21 stations using a conductivity–temperature–depth (CTD) instrument (Seabird, SBE-911 plus). Chlorophyll-a (Chl-a) concentration was determined by a fluorescence sensor (Wet Labs Eco-AFL/FL) calibrated by an independent measurement using a high-performance liquid chromatography (HPLC, Waters 2695). Water and particulate samples were collected at nine stations using a Rosette sampler equipped with Niskin bottles and in situ large volume filtration units with dual-filter heads (WTS-LV, McLane Labs, United States), respectively. For total 234Th (234Tht), 6 L water samples were collected in 10 L polyethylene bottles without filtration and immediately acidified to pH = 1 using 8 N HNO3. Particulate samples for measurements of 234Th (234Thp), POC, δ13C, Δ14C, and trace elements were collected using a GF/F filter (Whatman, 0.7 μm pore size, 47 mm diameter) or a Supor filter (Pall, 0.8 μm pore size, 142 mm diameter) following pre-filtration using a 51 μm pore-size filter. The average filtration volume through the Supor and GF/F filters was ∼190 L and ∼15 L, respectively. Filter pads were stored immediately in a freezer at –70°C.
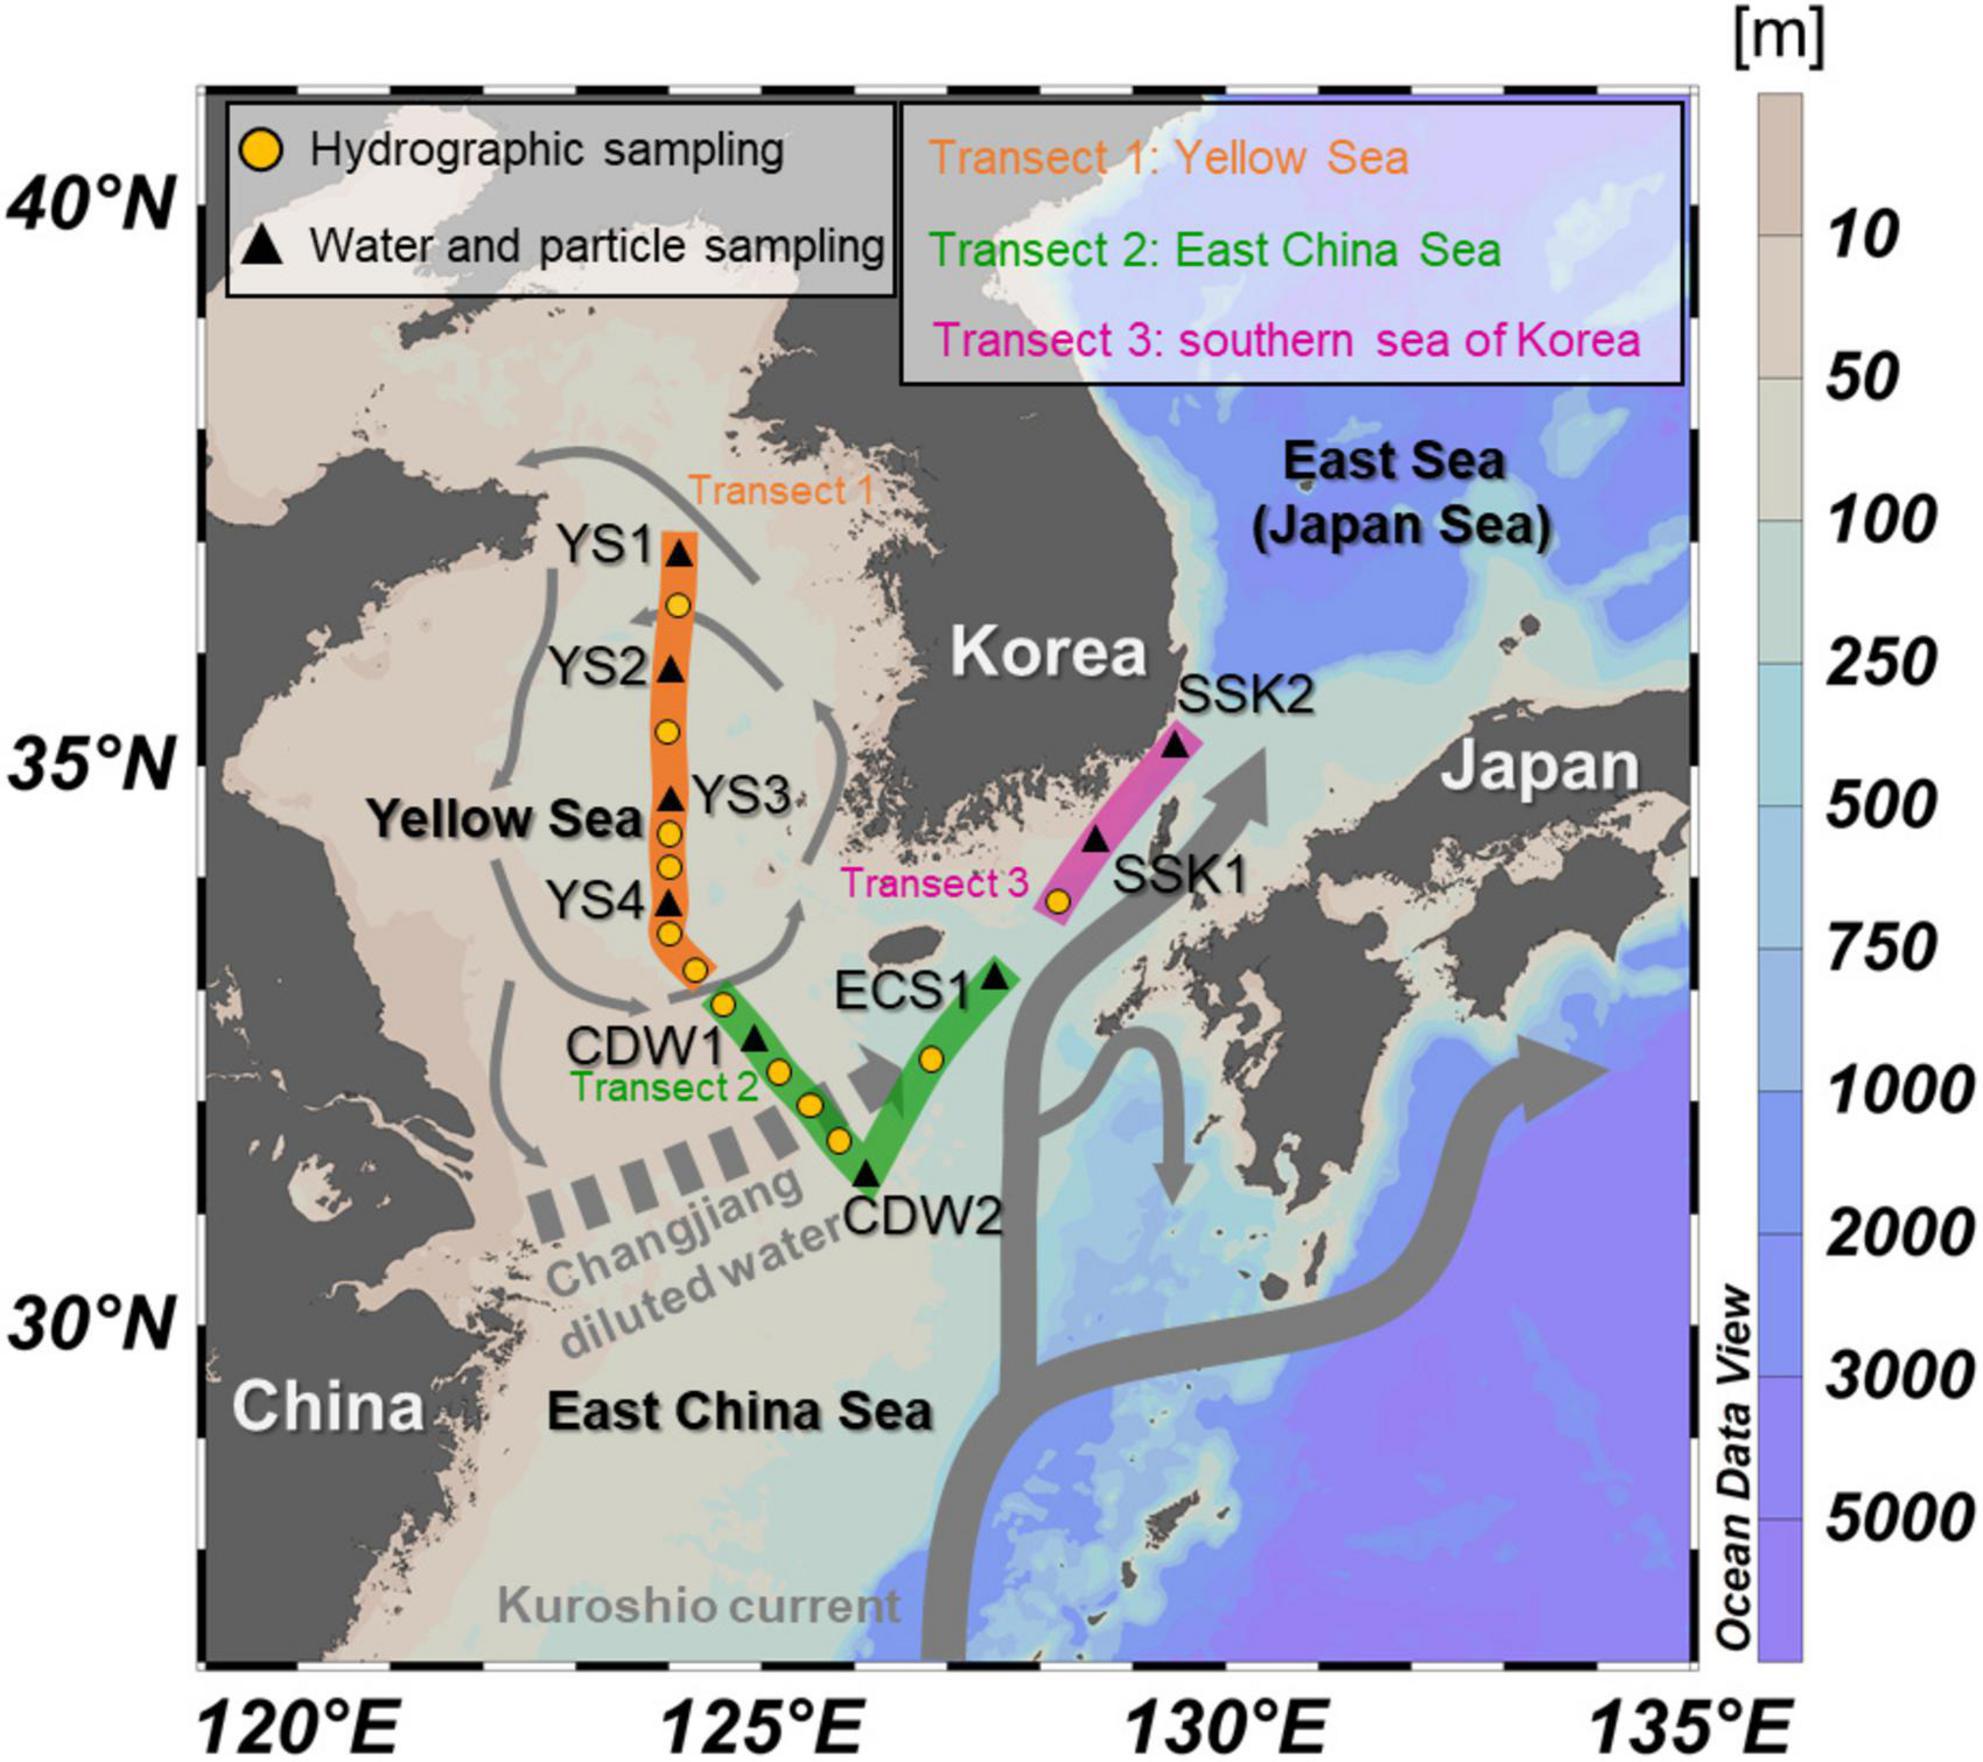
Figure 1. Bathymetric map showing the locations of sampling stations in the study region. Triangles indicate sites where water sampling and particle filtration were performed, and circles indicate hydrographic sampling sites. Transects 1, 2, and 3 represent the Yellow Sea (YS), the East China Sea (ECS), and the southern Sea of Korea (SSK), respectively. The arrows indicate current systems in operation during the sampling period.
The method used to obtain 234Tht in this study is described in Seo et al. (2021). Briefly, an internal standard (230Th, 6.5 dpm) and Fe carrier (70 mg) were added to each acidified seawater sample. After isotopic equilibration for 12 h, pH was adjusted to ∼8 by adding 7% NH4OH solution. The supernatant was siphoned off, and Fe precipitates were collected on a filter paper (Whatman Grade 54). The recovered Fe precipitates were dissolved with 8 N HNO3 and heated to release Th to the solution. After heating, the solution was loaded onto UTEVA resin (Eichrom Industries, Darien, IL), and Th was eluted with 6 N HCl onboard. In the land-based laboratory, Th was micro-precipitated with Ce for preparation of the counting source. The Ce precipitates were collected on filter paper (Eichrom, 0.1 μm pore size, and 25 mm diameter) and placed on a stainless-steel plate. The 234Th activity was measured using a beta counter (low-level RISØ beta counter, Denmark) and was corrected for chemical recovery, decay, and ingrowth from 238U. A series of counting was performed to validate the decay curve of 234Th. 234Thp activity was determined using the same method as for 234Tht, following acid digestion (using a mixture of concentrated HCl and HNO3) of a portion of the Supor filter that corresponded to ∼95 L of seawater volume. The time delay between sampling and beta measurement was 8 ± 1 d for all 234Th samples. The overall measurement uncertainty was < 2% based on replicate analyses, and the uncertainties for 234Th activities are based on 2-sigma counting statistics.
For measurements of POC concentrations, a portion of the GF/F filter corresponding to ∼2 L of water volume was freeze-dried and then de-carbonated by HCl fumigation in a desiccator (< 12 h) (Hedges and Stern, 1984). The de-carbonated sample was heated (80°C, 2 h) to remove residual HCl. The POC content was measured using an elemental analyzer (EA 2400 CHNS/O Series II, PerkinElmer, United States). The procedural blank for POC (n = 3) was ∼1% of the average sample concentration, and the relative uncertainty based on multiple duplicate analyses was ∼0.2%. For measurements of the δ13C and Δ14C of POC, a portion of the GF/F filter corresponding to 7 ± 5 L of filtration volume was used. The filter sample was de-carbonated and placed in a double pre-combusted quartz tube with cupric oxide and silver. The quartz tube was then flame-sealed and combusted (850°C, 4 h) to convert POC to CO2 gas; this CO2 was cryogenically purified and stored in a Pyrex tube. Carbon isotope ratios were determined at the National Ocean Sciences Accelerator Mass Spectrometry Facility (NOSAMS) at the Woods Hole Oceanographic Institution (WHOI), United States. The procedural blank for isotope ratio analyses was < 1% of the sample, and the measurement uncertainty for δ13C and Δ14C was 0.1 and < 10‰, respectively.
A portion of the Supor filter, corresponding to ∼20 L water volume, was placed in a Teflon acid-cycle digestion vessel (60 mL), and 1 mL of 10% HF/50% HNO3 (v/v) digestion solution was added (Ohnemus et al., 2014). The filter was placed above the solution to enable sample digestion by the acid fumes. A closed vial was placed on a graphite surface hot plate at 130°C for 6 h, and the solution was dried after the filter was removed. The solution was converted to 2% HNO3 and further diluted to an appropriate concentration to enable measurement using a magnetic sector-field inductively coupled plasma–mass spectrometer (ICP–MS, Element 2, Thermo Scientific). The measurement accuracy was verified using marine sediment reference materials (HISS-1 and MESS-3, National Research Council of Canada). The experimentally determined concentrations of the reference materials were 94 ± 2% of the certified values. The procedural blank (n = 5) was < 3% of the lowest sample concentration in the study region.
Temperature and salinity in the study region ranged from 4 to 29°C and 26.7 to 34.7, respectively (Figure 2 and Table 1). The surface mixed layer (SML) was 20–30 m thick, except for the ECS sites where it was > 50 m thick. A temperature-salinity (T–S) diagram for the study region shows six major water masses (Figure 2D); the Shelf Mixed Water (SMW); the warmer, less saline Changjiang Diluted Water (CDW); the more saline Kuroshio Surface Water (KSW); Kuroshio Subsurface Water (KSSW); the cold Kuroshio Intermediate Water (KIW); the less saline Yellow Sea Bottom Cold Water (YSBW).
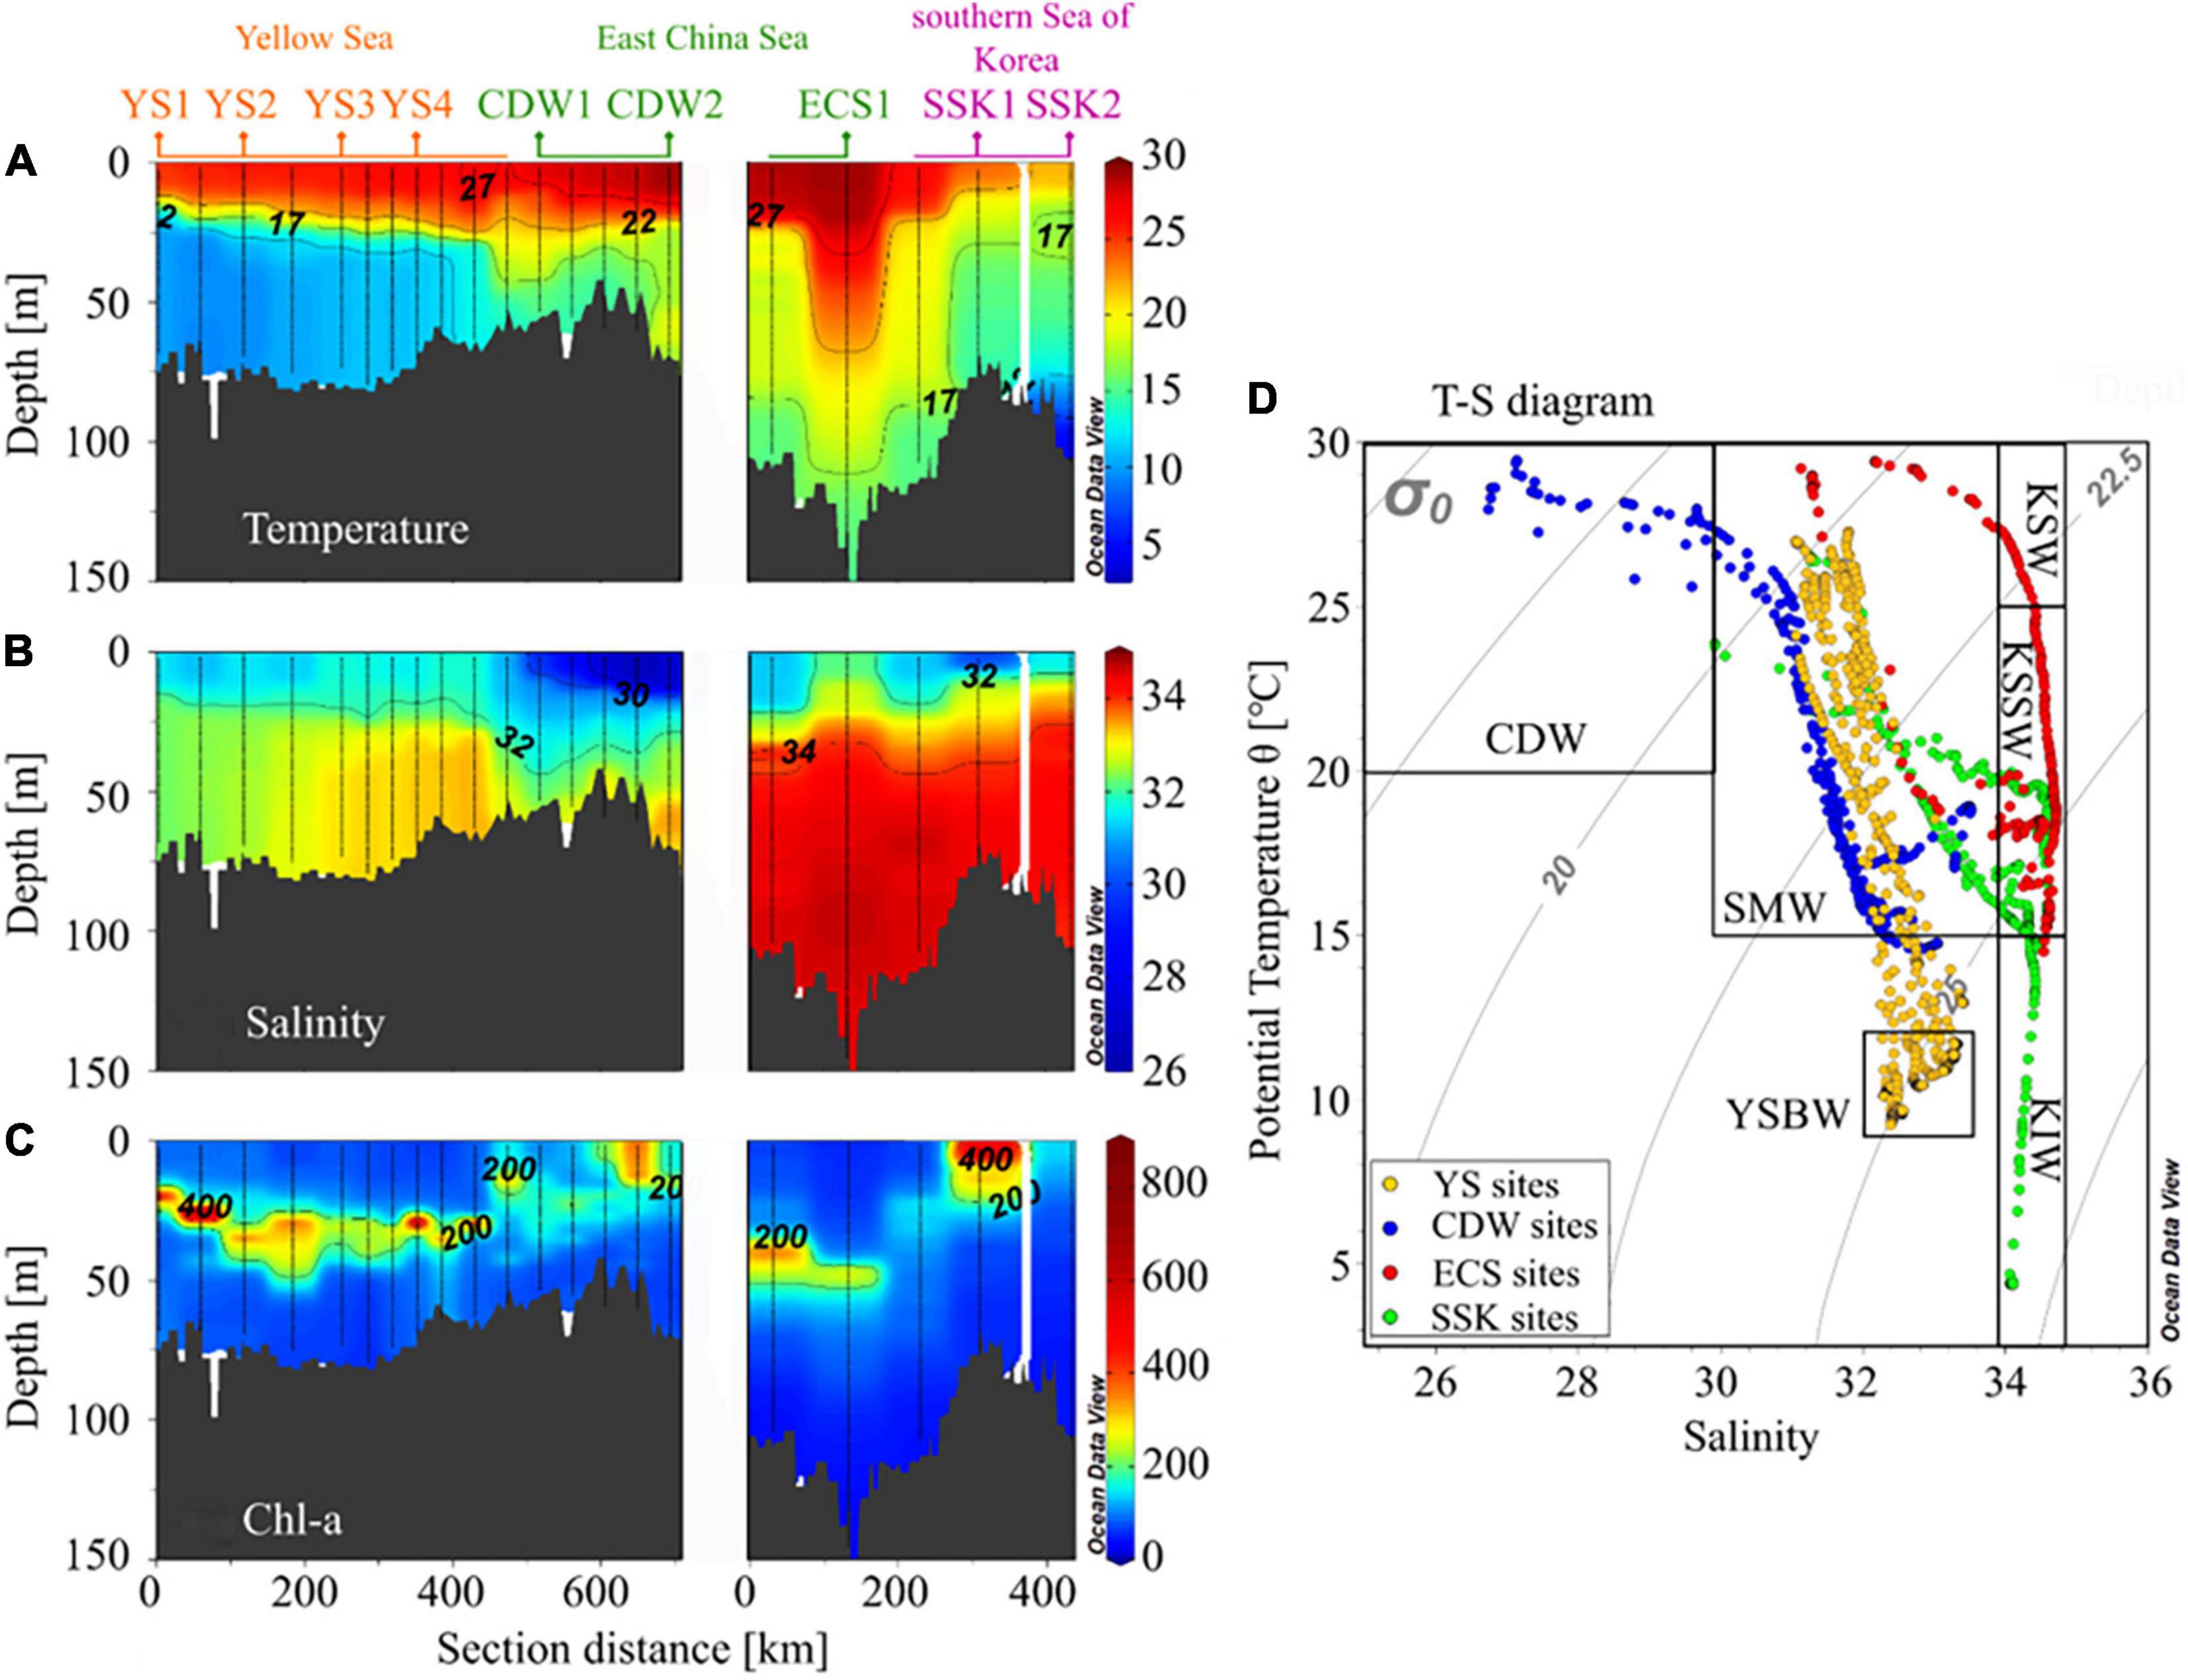
Figure 2. Distributions of (A) temperature (°C), (B) salinity, (C) chlorophyll-a (ng L–1), and (D) temperature-salinity (T-S) diagrams in the study region. Water masses are also indicated on the T-S diagram: CDW, KSW, KSSW, SMW, YSBW, and KIW refer to Changjiang Diluted Water, Kuroshio Surface Water, Kuroshio Subsurface Water, Shelf Mixed Water, Yellow Sea Bottom Cold Water, and Kuroshio Intermediate Water, respectively.
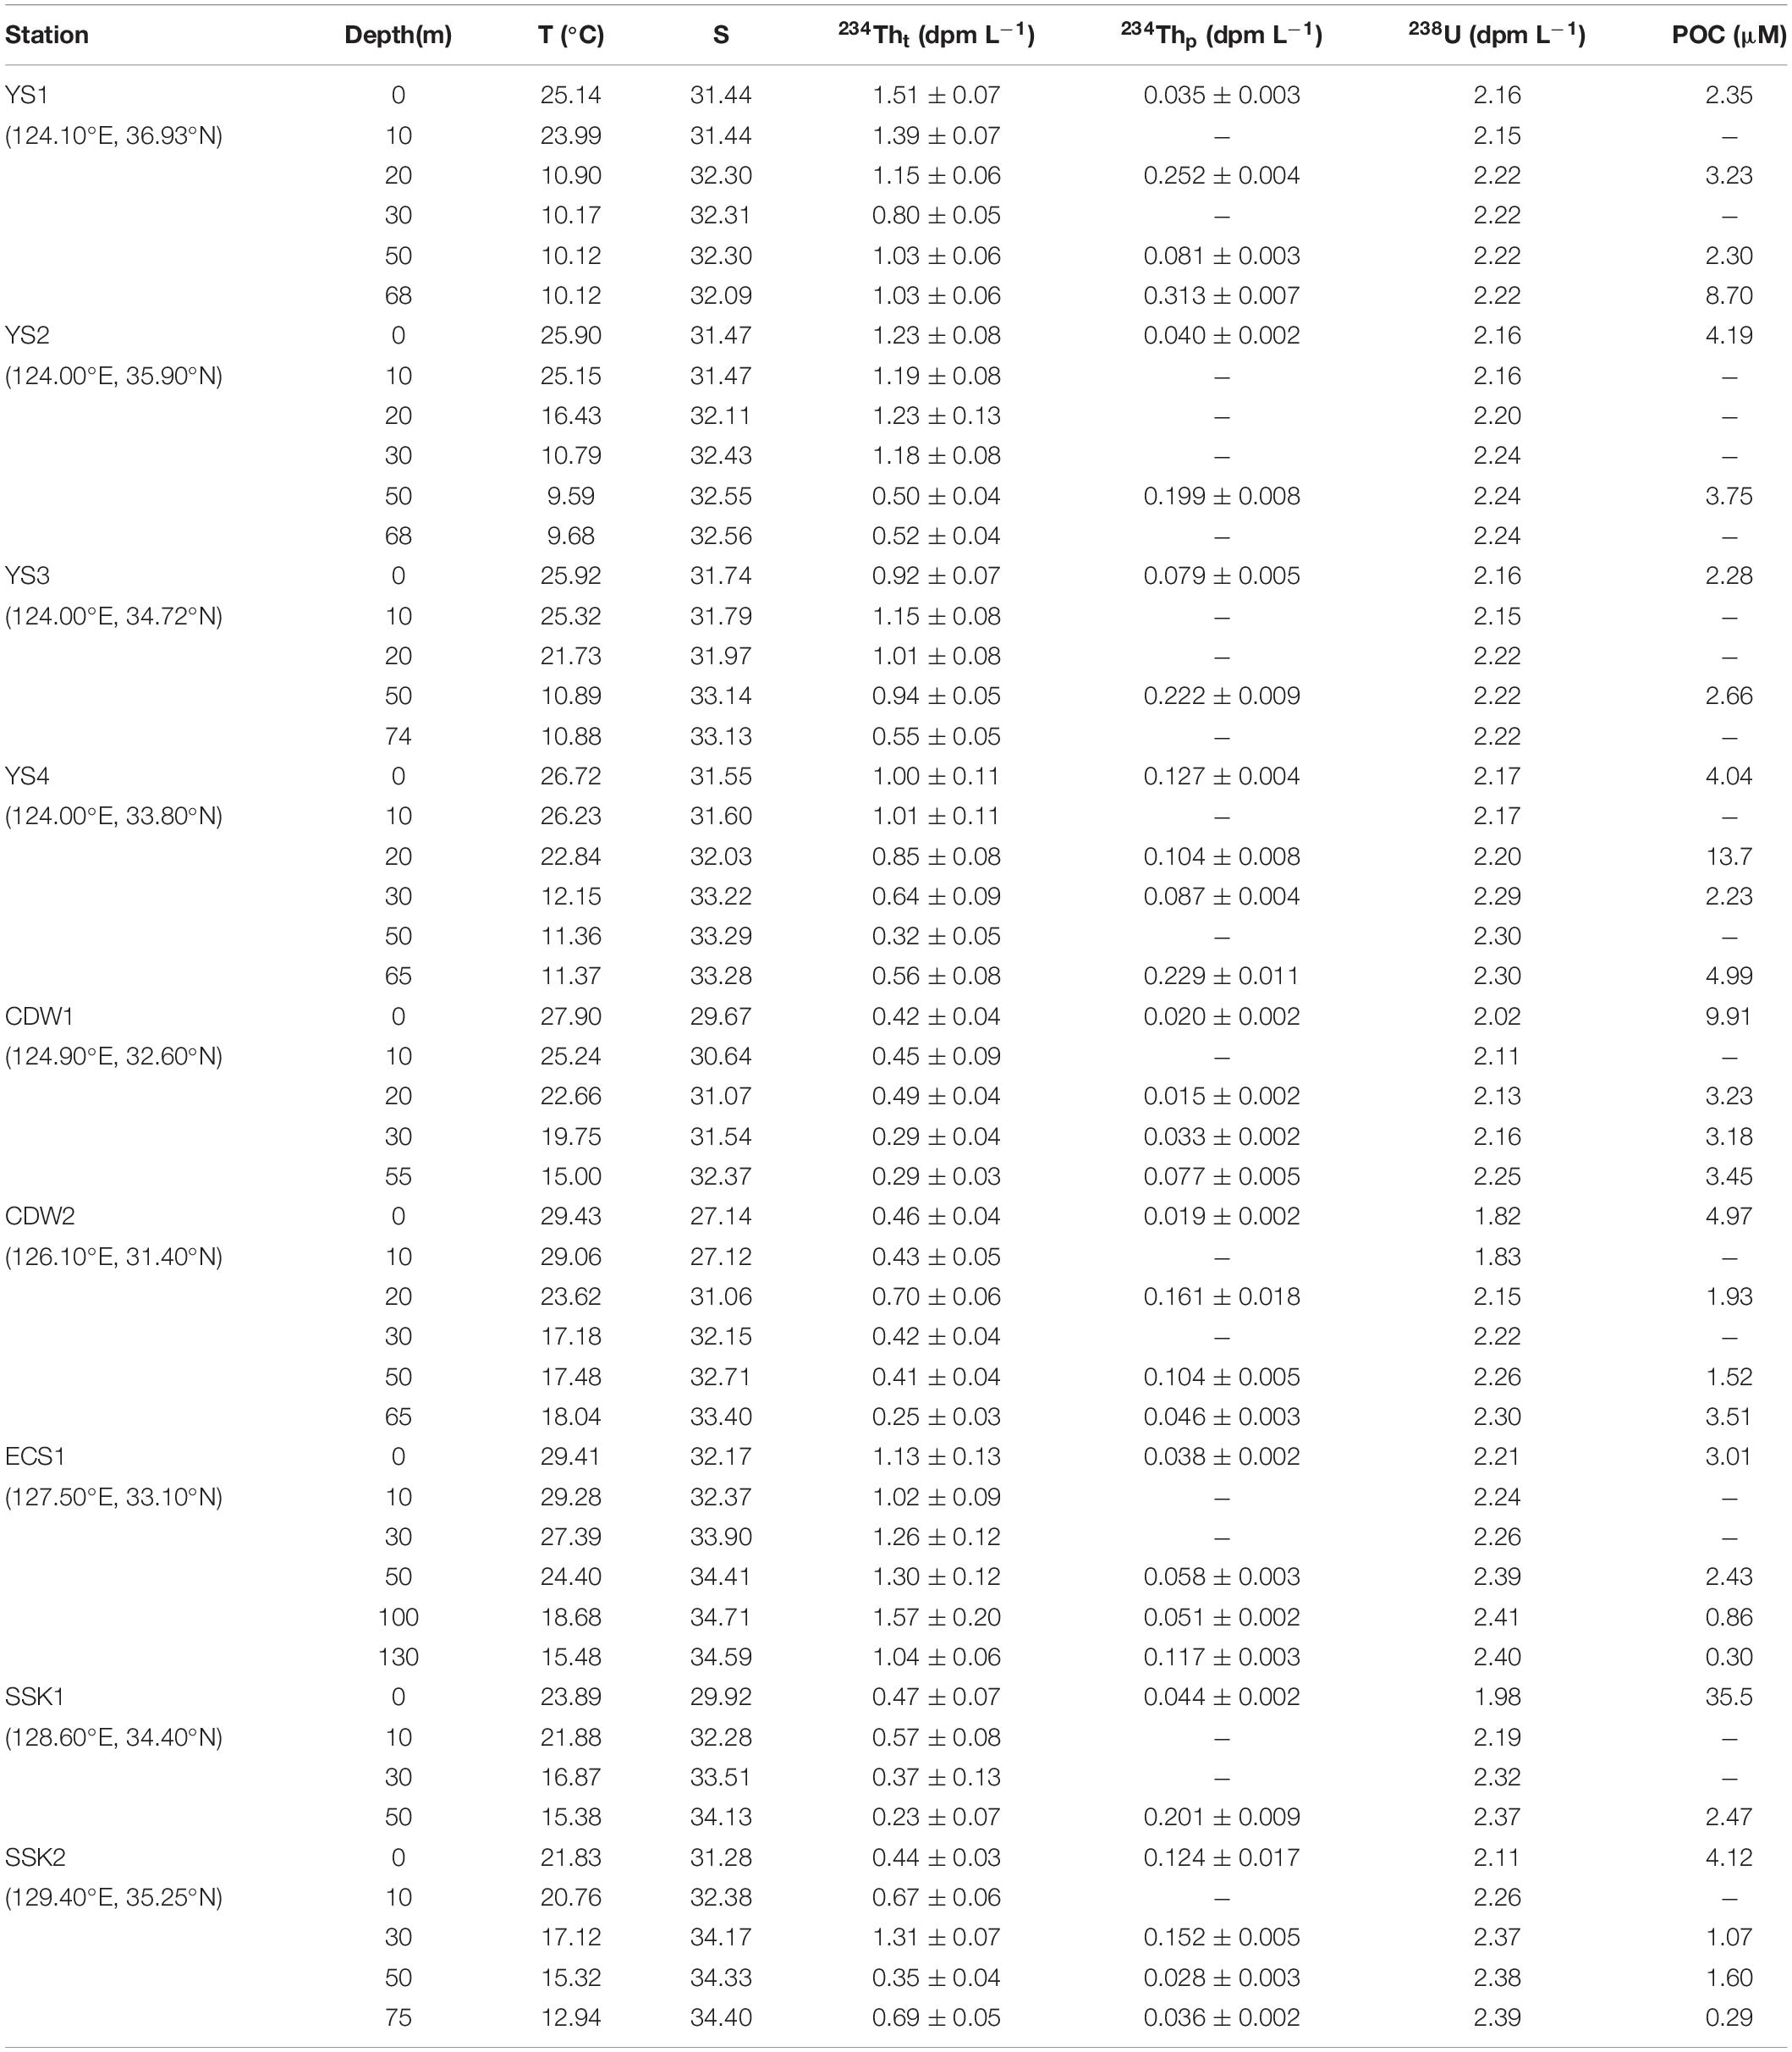
Table 1. Temperature (T), salinity (S), 234Th (total and particulate) and 238U activities, and POC concentrations in the East China Sea and the Yellow Sea in August 2020.
We named each of the particle-sampling stations of the YS, CDW, ECS1, and SSK according to the occurrences of the various water masses (Figure 1). The bottom layer of the SSK stations exhibited the lowest temperature and mainly comprised KIW. The relatively high temperature (> 15°C) observed in the 30–75 m layer at the ECS1 station was identified as KSSW and KSW on the T–S diagram (Figure 2). The CDW, characterized by the lowest salinity, was observed in the surface layer of the five ECS stations (Figure 1, transect 2). The Chl-a concentration in the surface water (< 20 m) was generally low (< 100 ng L–1), except for a few hot spots (Figure 2C). A subsurface chlorophyll maximum (SCM) was observed within the 20–50 m layer, with the highest values (> 800 ng L–1) at the YS station. The Chl-a concentrations were higher than the typical Kuroshio current summer values (∼100 ng L–1), but lower than typical values in the equivalent region during the spring and fall (500–2,000 ng L–1; Kim et al., 2009).
The activity of 234Tht varied from 0.22 to 1.57 dpm L–1, with an average of 0.79 ± 0.03 dpm L–1 (n = 49) (Figure 3). 234Tht activity was highest in the upper waters (< 30 m) except for the ECS1 station, where the maximum value was observed at 100 m depth. 238U activity, based on salinity (Owens et al., 2011), ranged from 1.82 to 2.41 dpm L–1. The deficit of 234Tht relative to 238U varied from 30 to 90%. The highest deficiency was observed at the CDW and SSK stations. The deficiency of 234Tht in the study region is similar to that in the Gulf of Maine and the continental shelf off the Changjiang (McKee et al., 1984; Gustafsson et al., 1998).
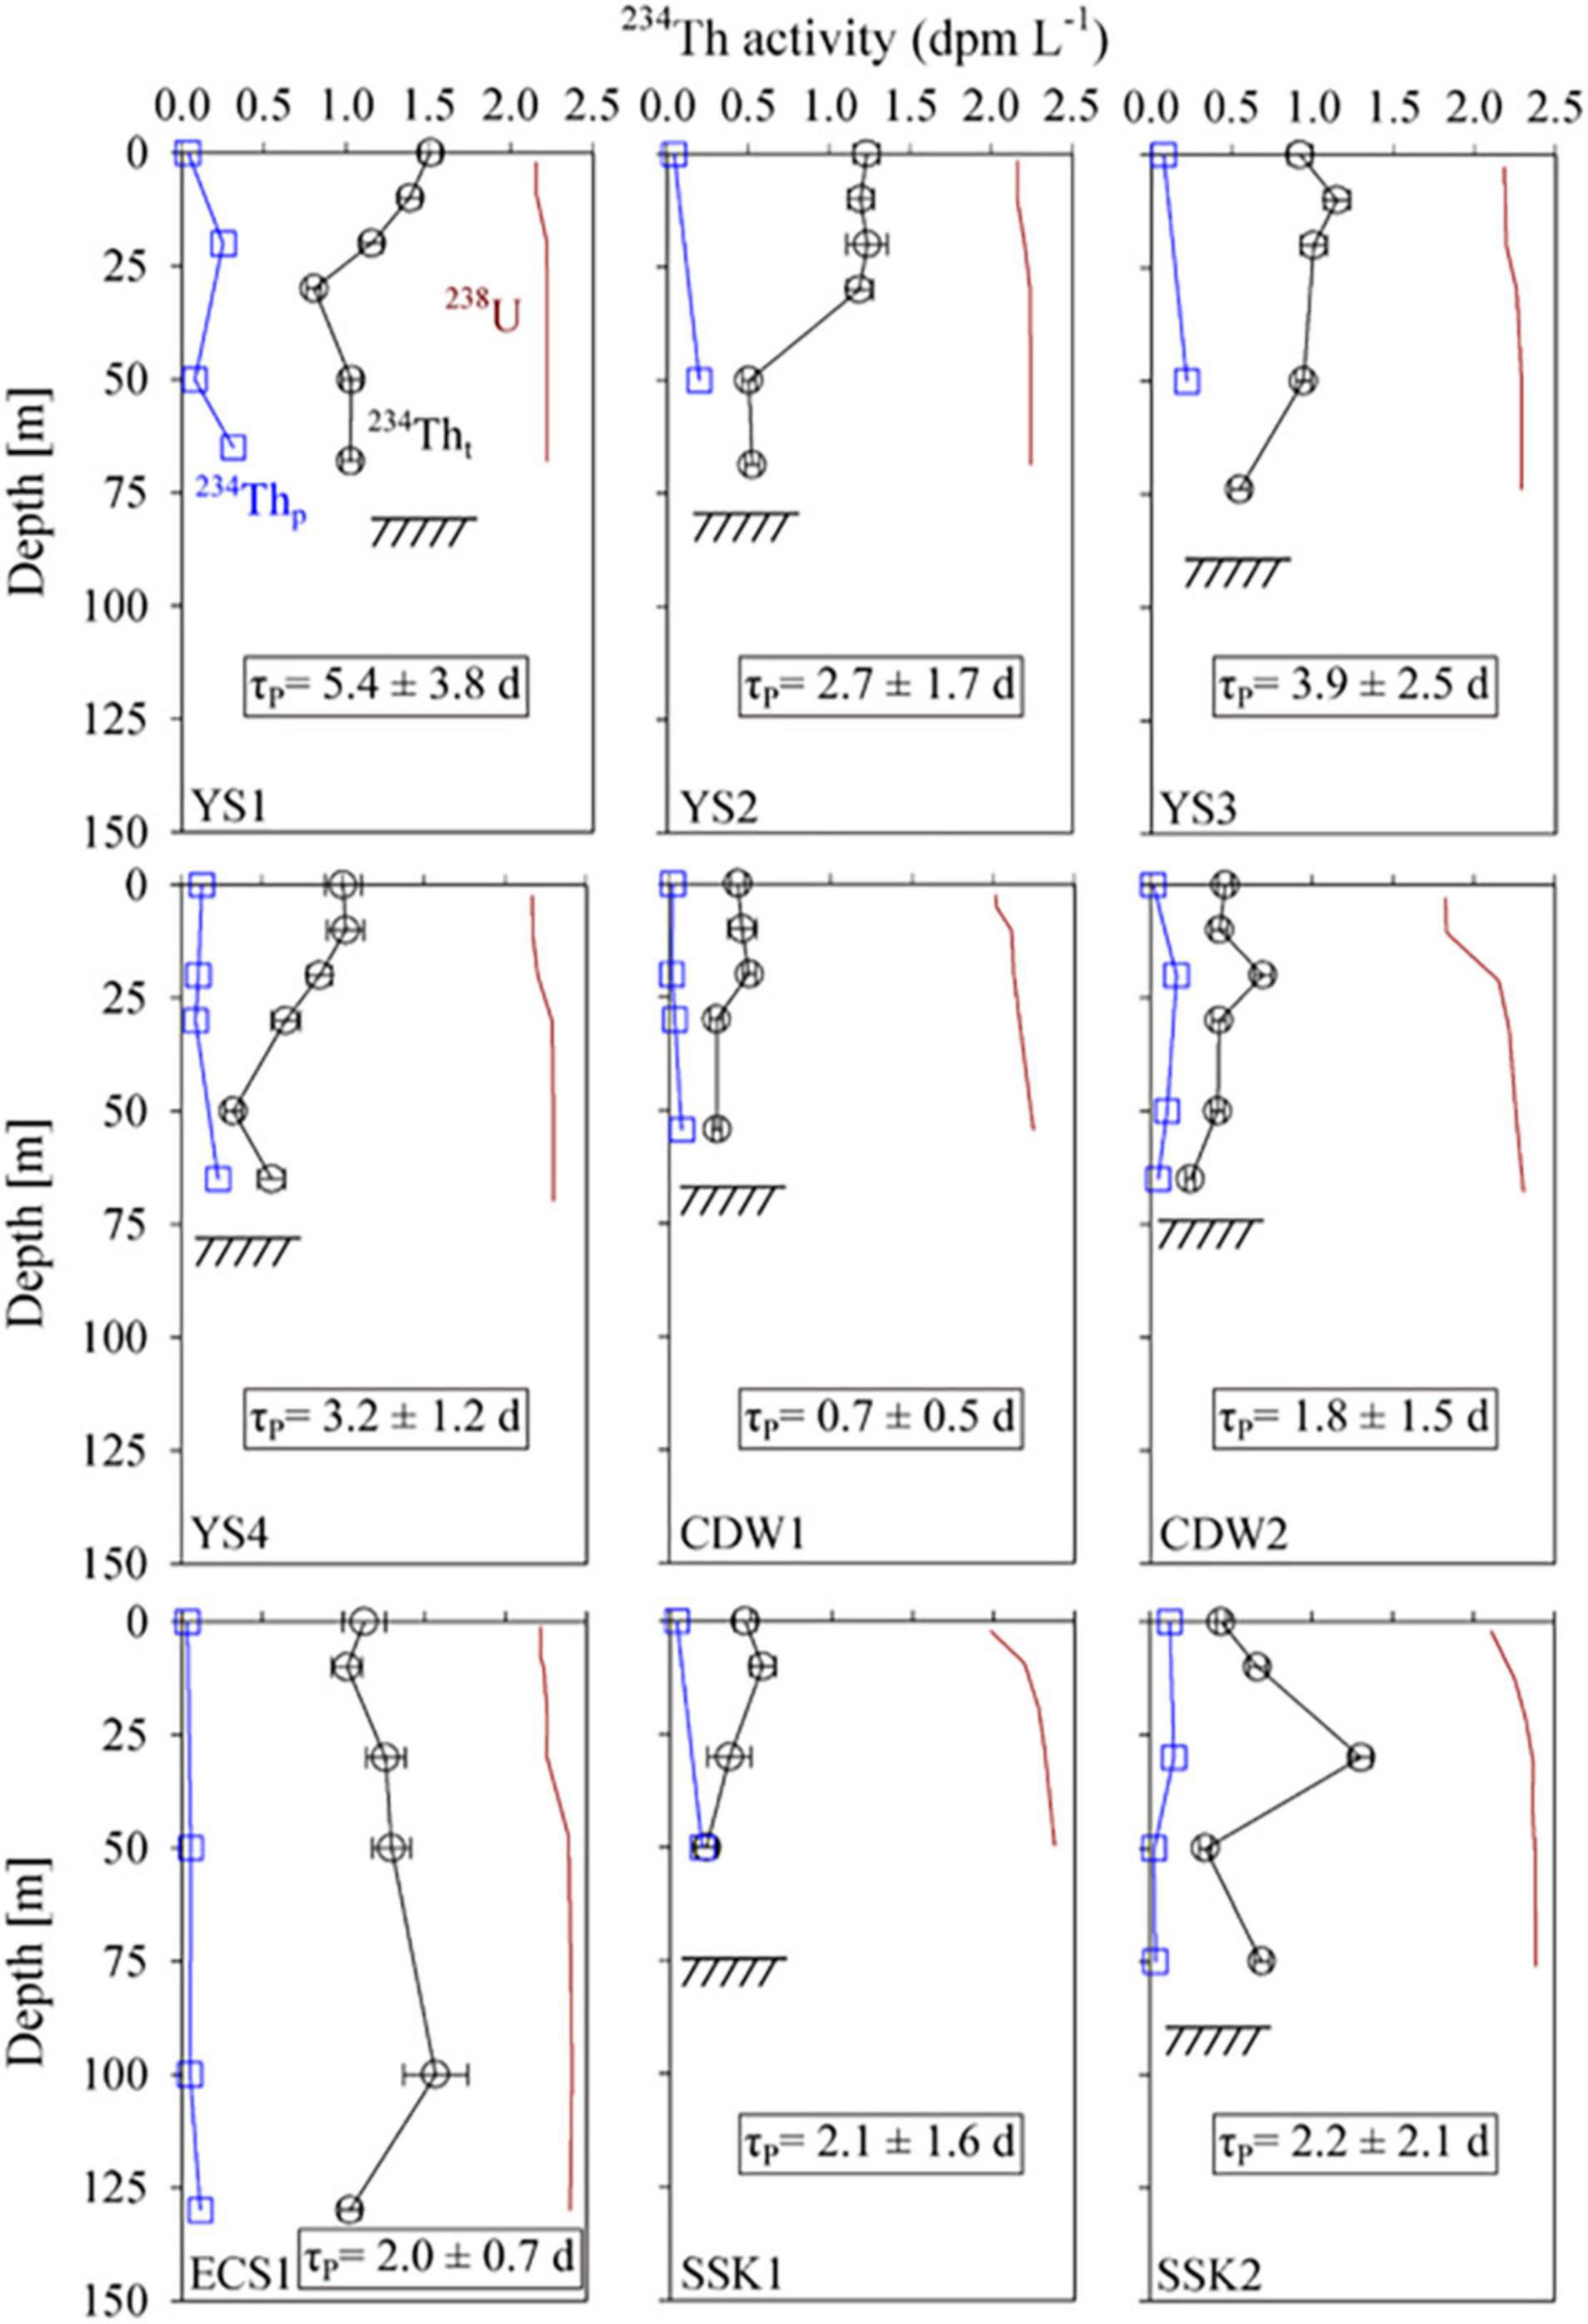
Figure 3. Vertical distributions of 234Th in the Yellow Sea (YS), the East China Sea (ECS), and the southern Sea of Korea (SSK). Circles and squares indicate the total and particulate 234Th activities, respectively. The solid line indicates 238U activity. Seafloor depths are indicated by horizontal bars. The uncertainties of 234Th are 2-sigma counting statistics. The uncertainties of 234Thp are smaller than the symbol size.
234Thp activity (0.8–51 μm particle size) ranged from 0.02 to 0.31 dpm L–1 (0.10 ± 0.01 dpm L–1, mean ± σ) (Figure 3). The activity of 234Thp was 2–89% of 234Tht, with the highest value in the bottom layer of the SSK1 station. In the surface layer, the activity of 234Thp ranged from 0.02 to 0.13 dpm L–1 (0.06 ± 0.04 dpm L–1), with the YS4 and SSK2 stations having slightly higher values. The activity of 234Thp in the layer close to the seafloor was about three times higher than that in the surface layer, except for the CDW2 and SSK2 stations. The activity of 234Thp in large particles (> 51 μm) was below the detection limit in all samples.
POC concentration (0.8–51 μm particle size) showed a large variation, ranging from 0.3 to 35 μM (3.5 ± 2.8 μM, mean ± σ) (Figure 4A). Unusually high POC concentrations were observed in the surface layer at the CDW1 (10 μM) and SSK1 (36 μM) stations. These high values were validated by an independent analysis of POC, using pressure measurement of the CO2 gas obtained during POC combustion for carbon isotope analysis. These anomalously high concentrations appear to be associated with site-specific events that were not reflected in the distribution of Chl-a. POC concentrations were higher in the surface and bottom layers than in the middle layer, and they were higher at the YS and CDW stations (4.1 ± 2.6 μM) than at the ECS and SSK stations (1.8 ± 1.3 μM). The range of POC concentrations is similar to that previously observed in the ECS during summer (< 8 μM) (Hung et al., 2007).
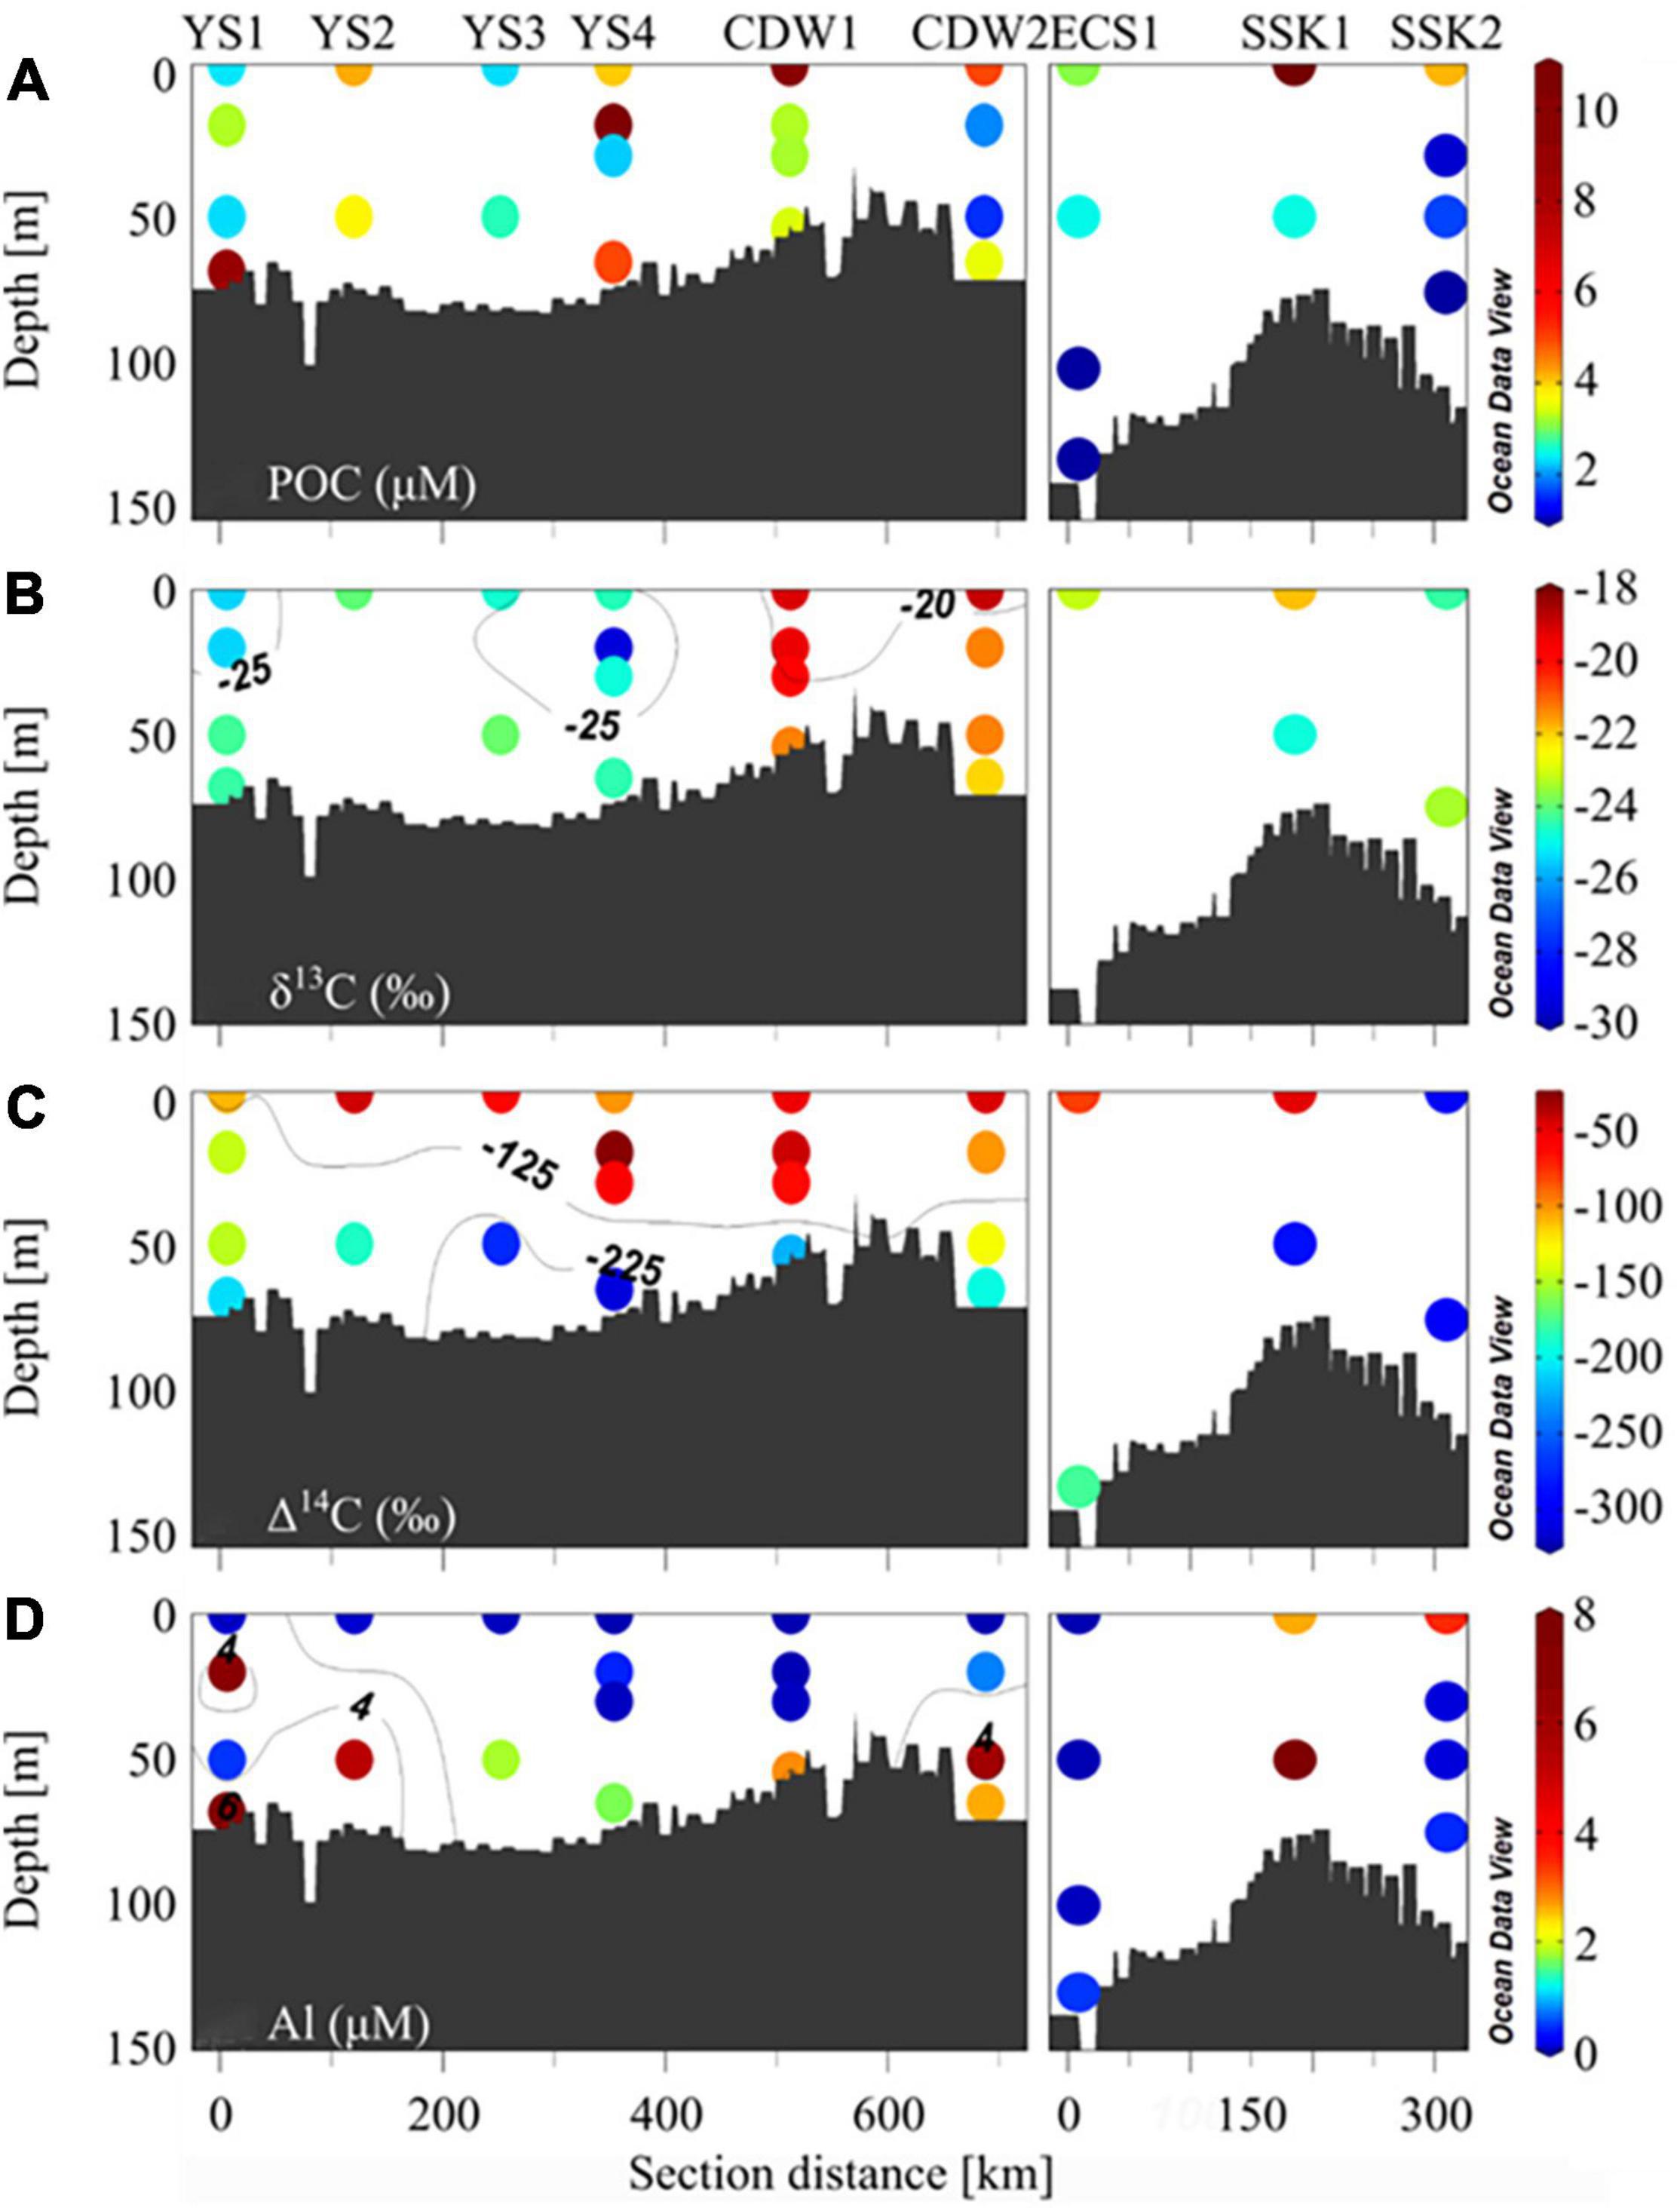
Figure 4. Distributions of (A) POC concentration, (B) δ13C, (C) Δ14C, and (D) particulate Al concentration, along the transect shown in Figure 1.
The δ13C values of POC ranged from –29.4 to –18.9‰. The vertical variation at a given station (up to 3.2‰) was much smaller than the variation between stations (up to 11.0‰) (Figure 4B). δ13C values at the CDW stations were much higher than those at other stations. The Δ14C values of POC ranged from –312 to –28‰ (Figure 4C). Δ14C was generally lower in the bottom layer, except for the SSK2 station, where the surface value was also very low. The Δ14C values in the bottom layer were lower than the range observed in the continental shelf regions of the Atlantic (–120 to –50‰) (Bauer et al., 2001; Raymond and Bauer, 2001). The Δ14C values in the surface layer (–146 to –28‰) were also much lower than those of the dissolved inorganic carbon (DIC) observed in this region (–8‰—+12‰, n = 3; Oh and Hwang, 2021, unpublished results).
Particulate Al concentrations (0.7–51 μm size) ranged from 0.01 to 8.14 μM (Figure 4D). Al concentrations in the bottom layer were much higher than in the overlying water column. A similar range (< 5 μM) has been reported previously in this region (Hsu et al., 1998), but these Al concentrations are higher than those typically found in other shelf regions such as the Gulf of Maine and the South Atlantic Bight (1–100 nM) (Windom and Gross, 1989; Weinstein and Moran, 2004).
In surface waters, the Δ14C value of POC should be the same as that of DIC if fresh biological production is the only source of POC (Druffel et al., 1992). However, in the surface layer of the study region, the Δ14C values of POC (–146 to –28‰) were much lower than those expected from the Δ14C values of DIC, indicating inputs of aged POC, either from land or underlying sediments. High concentrations of POC in the bottom layer, together with low Δ14C values (–312 to –180‰), indicate a considerable contribution of resuspended sediments to the water column. This is expected in light of the shallow bottom depths and active tidal regime in this region. The δ13C values at the YS stations (–25.5 to –23.9‰) were lower than at the other stations, implying a larger contribution of terrestrial POC. At the ECS stations, δ13C values (–22.0 to –18.9‰) were close to the marine signature, indicating a dominant contribution from in situ production, presumably via utilization of the nutrients supplied by the Changjiang (Kwon et al., 2018).
To evaluate the respective contributions of POC from in situ production, sediment resuspension, and riverine input, we used a dual-isotope, three-endmember model (Drenzek et al., 2007):
where fin situ, fsediment, and friver represent the fraction of POC contributed by in situ production, sediment resuspension, and riverine input, respectively. For this calculation, the mean Δ14C value of DIC in the surface water of this region (0 ± 10‰) was used as the in situ production endmember (Δ14Cin situ). The mean Δ14C value of the surface sediments (–342 ± 82‰) in the ECS and YS regions was used as the sediment endmember (Δ14Csediment) (Bao et al., 2016), and the mean Δ14C value of POC measured from the lower reaches of the Changjiang (–114 ± 13‰) was used as the riverine POC endmember (Δ14Criver) (Wang et al., 2012). The Δ14C of POC measured in the Yellow River was extremely low (–531 ± 102‰) (Wang et al., 2012). The Yellow River was reported to be the major source of the sediment in the central southern YS (Yang et al., 2003). In this sense, the contribution of the Yellow River can be considered to be included in the sediment endmember. Thus, we excluded the Yellow River as a riverine POC source in our calculation (Figure 5). Riverine input represented by the Changjiang also includes the riverine POC from the Korean peninsula. The in situ production value (δ13Cin situ; –19.7‰) was assigned based on the assumed fractionation (–20‰) from the δ13C values of DIC (0.3‰) (Oh and Hwang, 2021, unpublished results). For the riverine POC endmember of δ13Criver, we used the mean δ13C value of the POC (–27.7 ± 1.0‰) measured from the lower reaches of the Changjiang (Zhang et al., 2007; Wang et al., 2012). The mean δ13C value of surface sediment (–22.6 ± 0.72‰) measured in the ECS and YS regions was used as the sediment endmember (δ13Csediment) (Bao et al., 2016). For the values located outside the lines of the three-endmember model (Figure 5), only the influence of the other two endmembers was considered.
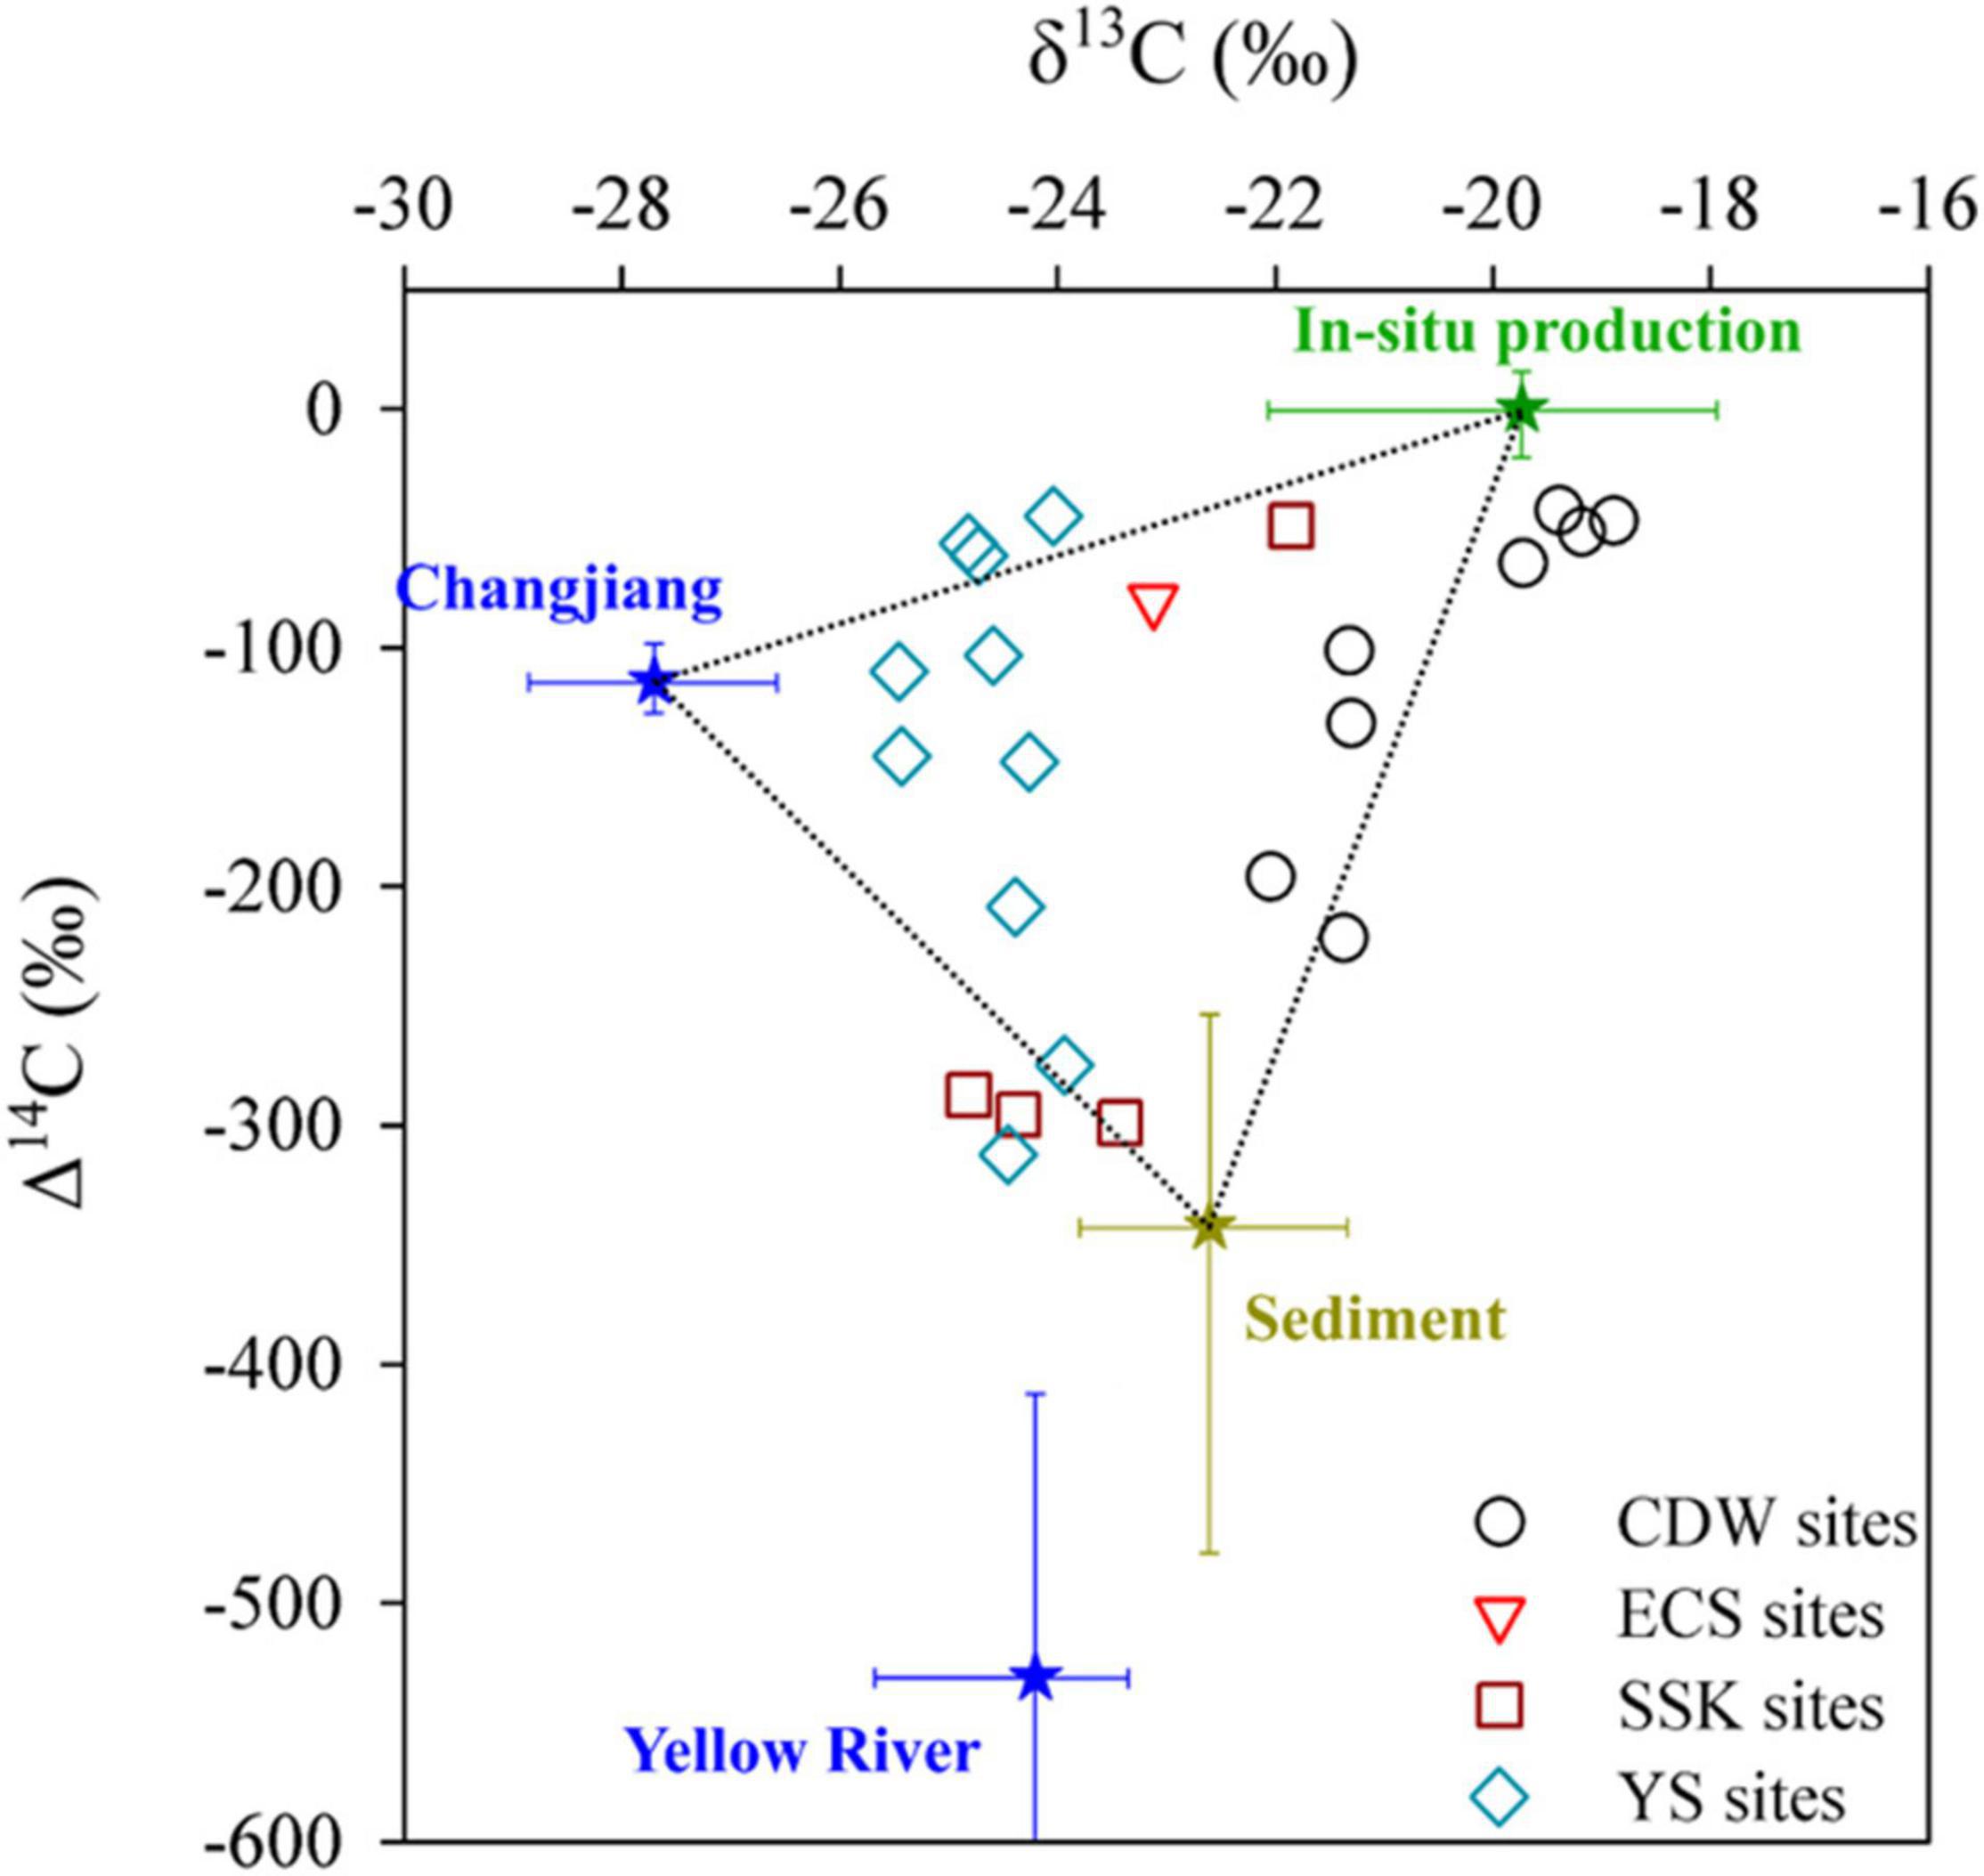
Figure 5. Cross-plot of Δ14C and δ13C values of POC. The endmember values of the Changjiang and the Yellow River are from Zhang et al. (2007) and Wang et al. (2012), respectively. The endmember values of surface sediment are from Bao et al. (2016). The endmember values of in situ production are from the Δ14C, and fractionation-corrected δ13C values of DIC are observed in this region (Oh and Hwang, unpublished, 2021; data).
The mean values of fin situ, fsediment, and friver in the surface layer (0–20 m) were 51 ± 29, 18 ± 18, and 31 ± 25%, respectively (Figure 6). Except for a few samples, POC from in situ production and riverine input accounted for the majority of the POC in this surface layer. In the middle layer (20–50 m), POC contributions from in situ production (51 ± 28%) and riverine input (32 ± 27%) were higher than those from sediment resuspension (17 ± 11%). However, in the bottom layer (below 50 m), the major POC source was sediment resuspension (65 ± 17%), with much lower contributions from in situ production (18 ± 22%) and riverine input (17 ± 13%) (Figure 6). Overall, the contribution of POC from riverine input was highest in the YS region (46 ± 17%), whereas in situ production was most important at the CDW stations (66 ± 22%) (Figure 6). Low contribution of riverine input at the CDW stations is counterintuitive. In situ production at the mouth of the Changjiang and on its path may dilute the riverine POC and thus δ13C value of the suspended POC shifts toward higher values (Wu et al., 2003). It should be noted that the POC of low δ13C values at the YS sites may have been more influenced by the sediment, which is composed mainly of the Yellow River material with a smaller amount of the Changjiang material (Shi et al., 2004). The cyclonic eddy in the southern YS transports the resuspended sediment toward the center along with the bottom layer (Shi et al., 2004). Thus, sediments from the Yellow River with low δ13C values can thus be transported to the YS stations upon resuspension. The extremely small contribution of in situ production at the surface of SSK2 station may have been caused by large riverine input at the time of sampling, suggested by low salinity.
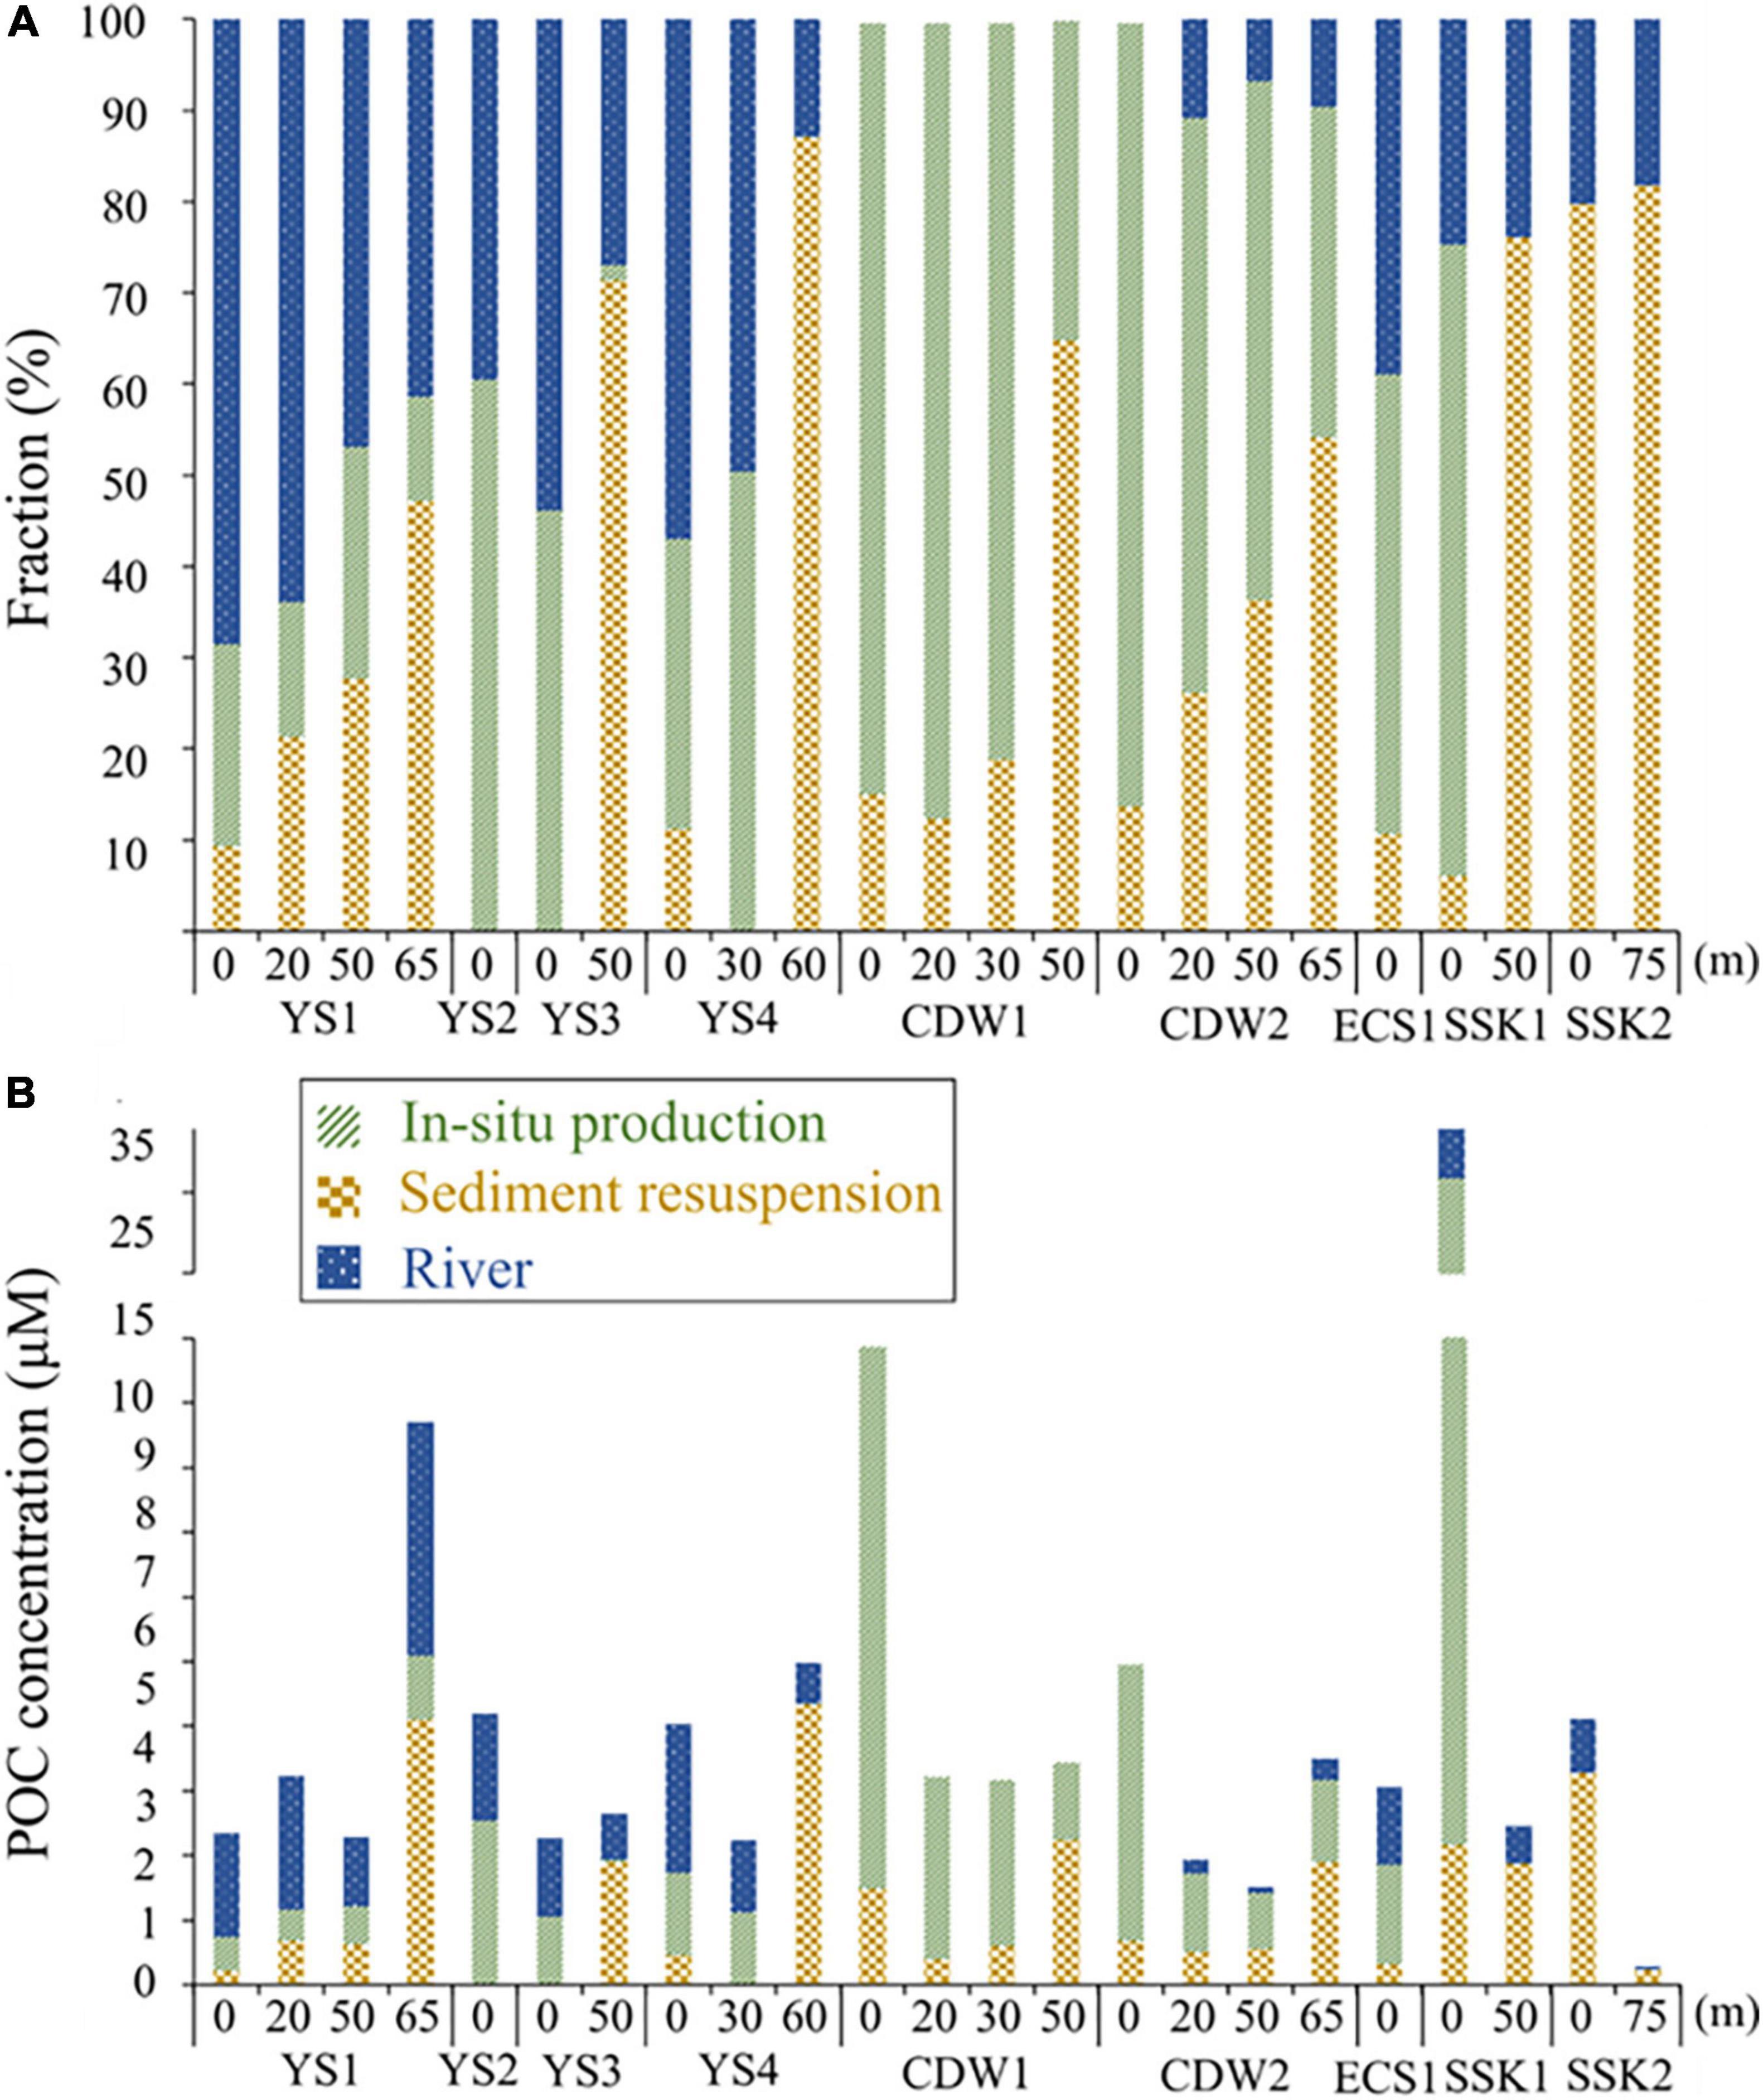
Figure 6. (A) Relative and (B) actual contribution of each source to POC (green = in situ production, yellow hatched = sediment, and blue = riverine input).
There was decoupling between the sediment δ13C values (–22.6 ± 0.72‰; mean ± σ) and the water column δ13C values (–24.2 ± 0.84‰) at the YS stations. Such a phenomenon was also reported for the month of May in the study region (Cai et al., 2003; Shi et al., 2004). This difference of δ13C value between sediment and water column may be associated with episodic riverine inputs, despite the sedimentary POC being controlled mainly by marine sources over longer time scales. Another potential cause could be isotopic fractionation via the selective degradation of organic matter during sedimentation (Bao et al., 2018).
The residence times of 234Thp were determined using 234Th–238U disequilibria. If the advection and diffusion of 234Th are negligible at steady-state, the residence time of 234Thp is expressed as follows (Coale and Bruland, 1987):
where τp (d) is the residence time of 234Thp, AU is the activity of 238U (dpm L–1), and λTh is the decay constant of 234Th (0.0288 d–1). and are the activities of dissolved and particulate 234Th (dpm L–1), respectively. Using this equation, the residence times of 234Thp in the sampled water columns ranged from 1 to 5 days, with an average of 2.6 ± 2.2 days (Figure 3). The residence time was shortest at the CDW stations (∼1 days), implying the efficient removal of 234Thp. Although advection and diffusion of 234Th are important in dynamic coastal waters, our sampling resolution was too low to allow a more complicated model incorporating these components. This simple assumption of negligible advection and diffusion of 234Th is generally valid over a shelf scale (Cai et al., 2008; Chen et al., 2008). The 234Thp residence times in the study region were shorter than those observed in other continental shelf regions such as the Gulf of Mexico and the northeast polynya in Greenland (4–50 days) (Cochran et al., 1995; Baskaran et al., 1996), but similar to those previously determined in this shelf region (0.5–11 days) (McKee et al., 1984). The unusually rapid settling of particles might have resulted from the large volume of riverine particles, intense resuspension, and high biological productivity in the study region, especially in the CDW.
Similarly, the flux of 234Th was calculated based on the following equation (Owens et al., 2015):
where PTh@z is the particulate flux of 234Th, which is integrated to depth z. In this study, we calculated 234Th flux to the seafloor because 234Th-238U disequilibrium was persistent throughout the water column. POC and Al fluxes to the seafloor were then calculated by multiplying the ratio of each component to 234Thp in the particles. The estimated POC settling flux to the seafloor was 47 ± 2, 125 ± 3, 80 ± 10, and 60 ± 1 mmol m–2 d–1 for the YS, CDW, ECS, and SSK stations, respectively. These POC settling fluxes, calculated using 234Th, include POC not only from in situ biological production but also from sediment resuspension and from riverine input. The CDW stations showed the highest POC flux, together with high Δ14C values and short 234Thp residence times, indicating high in situ POC production and rapid settling. The POC fluxes to the seafloor were similar to the net primary production (106 ± 66 mmol C m–2 d–1) based on satellite observations from 12 to 20 August 2020 obtained from NOAA’s Center for Satellite Applications and Research.1 Considering the water column respiration, this observation implies that other processes supply POC to the seafloor as well. This is consistent with our estimate that the in situ POC accounted for ∼50% of the suspended POC based on our dual-isotope mixing model.
High concentrations of Al in the bottom layers of the YS and CDW, and in the entire water column at the SSK1 station, indicate the resuspension of bottom sediments, consistent with the high POC concentrations and low Δ14C values at these locations (Figure 4). Al is the major constituent of clay minerals (Taylor, 1964) and thus can represent fine resuspended sedimentary particles. The settling fluxes of Al were 8.0 ± 0.4, 3.8 ± 0.1, 1.1 ± 0.2, and 5.1 ± 2.1 mmol m–2 d–1 for the YS, CDW, ECS, and SSK stations, respectively. The Al that accumulates in the sediment of the ECS (0.13–1.21 mmol m–2 d–1, an average of 0.52 mmol m–2 d–1) (Fang et al., 2009) should be derived originally from riverine input, given that atmospheric deposition was only 0.08 mmol m–2 d–1 (Uematsu et al., 2003; Figure 7). The net settling flux of Al, based on 234Th, was about eight times higher than the burial rate. Because Al represents lithogenic particles and its loss by dissolution can be ignored, net Al flux to the sediment should be equal to the burial rate unless it is lost by lateral off-shelf transport. Thus, our results imply that the sediments experience several cycles of resuspension and settling before they are buried (Figure 7).
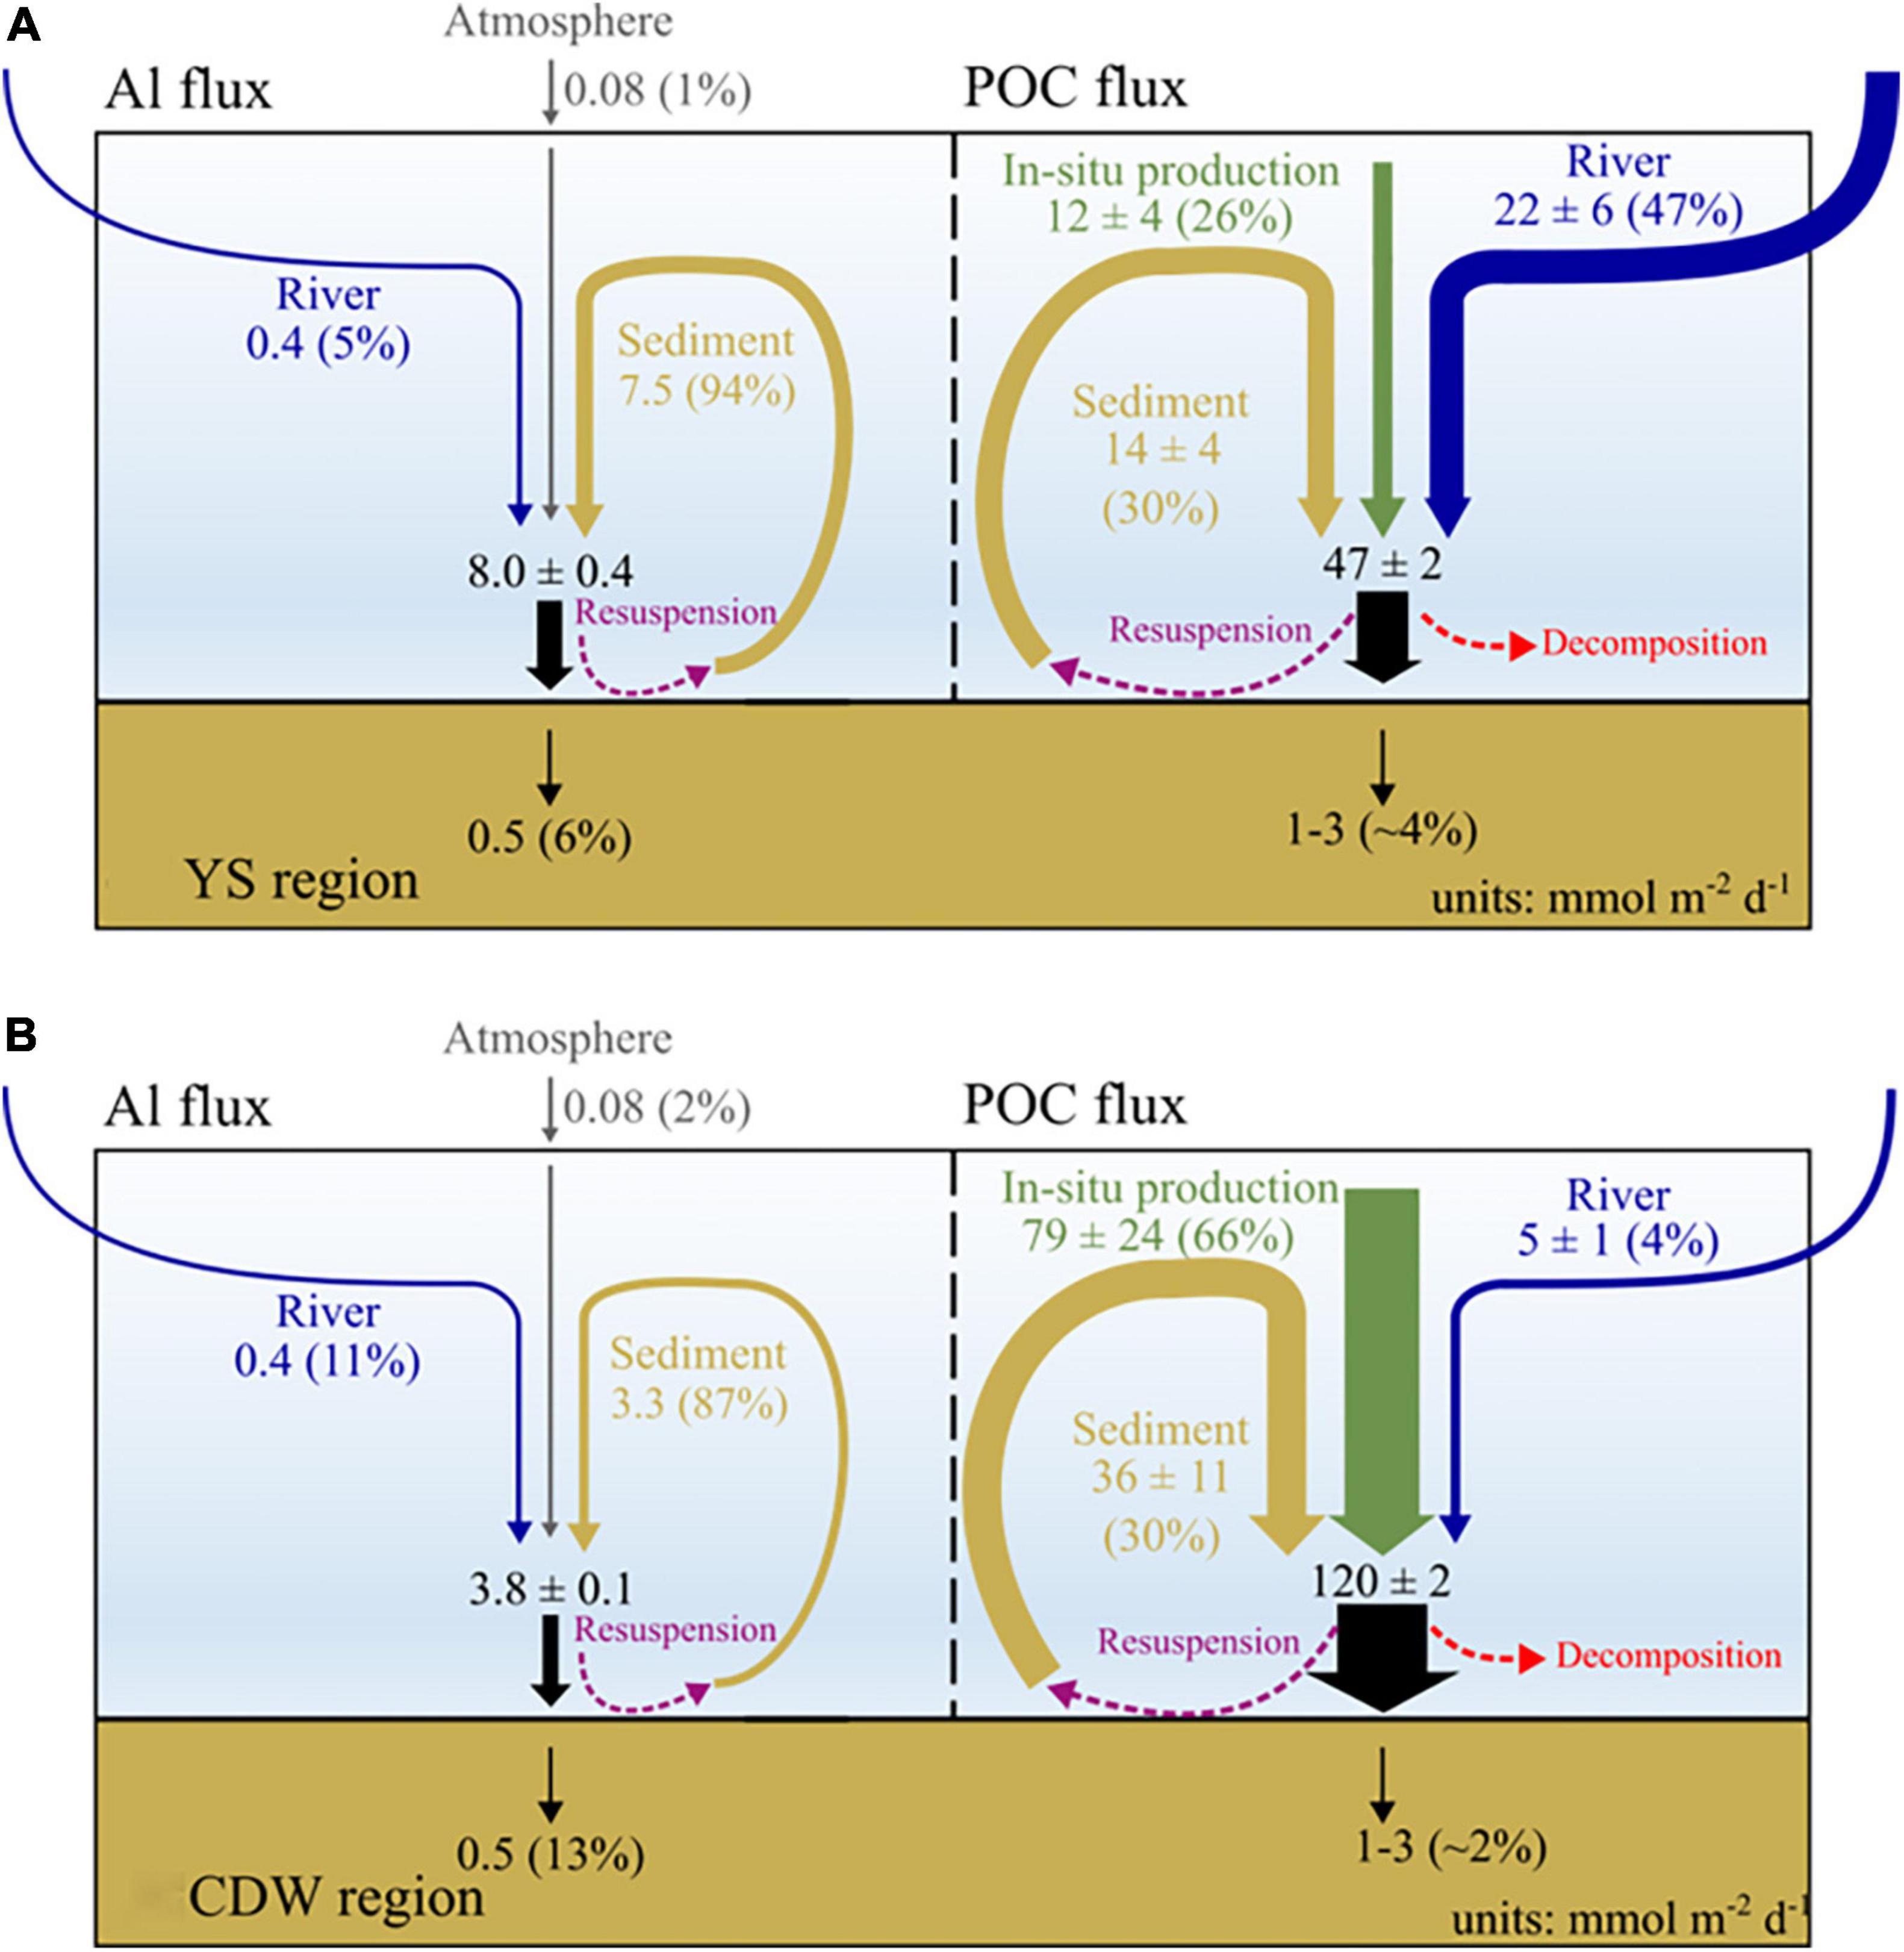
Figure 7. Schematics of Al and POC fluxes in (A) the Yellow Sea (YS) and (B) the Changjiang Diluted Water (CDW) regions. Riverine input of particulate Al was estimated as the difference between the burial flux and atmospheric input. Uncertainties in the in situ production, riverine input, and sediment fluxes are assigned as ± 30%, unless mentioned otherwise, based on the ranges of the endmember values in the source-apportionment calculations.
The net POC settling flux based on 234Th–238U disequilibrium was one to two orders of magnitude higher than the POC burial rates (1–3 mmol m–2 d–1) (Deng et al., 2006; Hu et al., 2016; Figure 7), implying that > 90% of POC that settles to the seafloor is oxidized before burial. Repeated resuspension and settling likely facilitate oxic remineralization, in addition to anoxic microbial processes within the sediment. During this sedimentation process, dissolved organic carbon, fluorescent dissolved organic matter, and inorganic nutrients are released into the water column, as observed in previous studies (Chen and Wang, 1999; Kim et al., 2018; Cho et al., 2019).
We examined the summertime distribution and carbon isotope signatures (δ13C, Δ14C) of POC, together with the concentrations of associated Al and 234Th, in a large continental shelf region that includes the Yellow Sea (YS) and the East China Sea (ECS). POC concentrations ranged from 0.3 to 35 μM, with two-fold higher concentrations present in the bottom layer of the YS and Changjiang Diluted Water (CDW) stations. These higher POC values are caused by the active resuspension of sediments, as evidenced by low Δ14C values and high Al concentrations. Based on a three-endmember model using dual carbon isotope ratios (δ13C, Δ14C), we found that POC was derived mainly from in situ production (51 ± 29%) in the surface layer and sediment resuspension (65 ± 17%) in the bottom layer, respectively. There was a ∼25% POC contribution from riverine input in the entire water column. POC contribution from in situ production was more important in the CDW region, whereas riverine input was more important in the YS region.
A deficiency of 234Th relative to 238U suggested short particle-residence times in the water column (2.6 ± 2.2 days). Using POC:234Th ratios, POC settling fluxes to the seafloor were estimated to be 47–125 mmol m–2 d–1. This POC settling flux was one to two orders of magnitude higher than the POC burial rates, indicating effective oxidation (> 90%) of the settled POC via repeated resuspension/re-deposition cycle before burial.
Overall, our results show that POC in this shelf setting has various sources and undergoes complex processing, including resuspension/re-deposition and extensive decomposition before burial. We were able to identify several sources and quantify their relative contributions to the suspended POC pool in the shelf. The complexity of the studied region demonstrates the necessity of using various tracers to understand the continental shelf systems. The multi-pronged approaches we used may also be applied to other continental shelf systems.
The original contributions presented in the study are included in the article/Supplementary Material, further inquiries can be directed to the corresponding author/s.
JH contributed to the conceptualization of the study. JS performed field sampling and analyses. JH, GK, and JS were involved in the data interpretation and writing of the manuscript. All authors contributed to the article and approved the submitted version.
This work was supported by the project titled “Deep Water Circulation and Material Cycling in the East Sea (20160040),” funded by the Ministry of Oceans and Fisheries, South Korea, and the National Research Foundation of Korea (NRF) grant funded by the Korea government (2018R1A2B3001147).
The authors declare that the research was conducted in the absence of any commercial or financial relationships that could be construed as a potential conflict of interest.
All claims expressed in this article are solely those of the authors and do not necessarily represent those of their affiliated organizations, or those of the publisher, the editors and the reviewers. Any product that may be evaluated in this article, or claim that may be made by its manufacturer, is not guaranteed or endorsed by the publisher.
We thank the cruise participants for their help with sampling, the captain and crew of the R/V Onnuri for help at sea, and the staff at NOSAMS WHOI for carbon isotope analysis.
The Supplementary Material for this article can be found online at: https://www.frontiersin.org/articles/10.3389/fmars.2022.793556/full#supplementary-material
Bao, R., McIntyre, C., Zhao, M., Zhu, C., Kao, S.-J., and Eglinton, T. I. (2016). Widespread dispersal and aging of organic carbon in shallow marginal seas. Geology 44, 791–794.
Bao, R., van der Voort, T. S., Zhao, M., Guo, X., Montluçon, D. B., McIntyre, C., et al. (2018). Influence of hydrodynamic processes on the fate of sedimentary organic matter on continental margins. Glob. Biogeochem. Cycles 32, 1420–1432. doi: 10.1029/2018gb005921
Baskaran, M., Santschi, P. H., Guo, L., Bianchi, T. S., and Lambert, C. (1996). 234Th: 238U disequilibria in the Gulf of Mexico: the importance of organic matter and particle concentration. Cont. Shelf Res. 16, 353–380. doi: 10.1016/0278-4343(95)00016-t
Bauer, J. E., Druffel, E. R., Wolgast, D. M., and Griffin, S. (2001). Sources and cycling of dissolved and particulate organic radiocarbon in the northwest Atlantic continental margin. Glob. Biogeochem. Cycles 15, 615–636. doi: 10.1029/2000gb001314
Black, E. E., Lam, P. J., Lee, J.-M., and Buesseler, K. O. (2019). Insights From the 238U-234Th Method Into the Coupling of Biological Export and the Cycling of Cadmium, Cobalt, and Manganese in the Southeast Pacific Ocean. Glob. Biogeochem. Cycles 33, 15–36. doi: 10.1029/2018gb005985
Buesseler, K. O., Benitez-Nelson, C. R., Moran, S., Burd, A., Charette, M., Cochran, J. K., et al. (2006). An assessment of particulate organic carbon to thorium-234 ratios in the ocean and their impact on the application of 234Th as a POC flux proxy. Mar. Chem. 100, 213–233.
Cai, D., Shi, X., Zhou, W., Liu, W., Zhang, S., Cao, Y., et al. (2003). Sources and transportation of suspended matter and sediment in the southern Yellow Sea: evidence from stable carbon isotopes. Chin. Sci. Bull. 48, 21–29. doi: 10.1007/bf02900936
Cai, P., Chen, W., Dai, M., Wan, Z., Wang, D., Li, Q., et al. (2008). A high-resolution study of particle export in the southern South China Sea based on 234Th:238U disequilibrium. J. Geophys. Res. Oceans 113:C04019.
Chen, C. T. A., and Wang, S. L. (1999). Carbon, alkalinity and nutrient budgets on the East China Sea continental shelf. J. Geophys. Res. Oceans 104, 20675–20686.
Chen, W., Cai, P., Dai, M., and Wei, J. (2008). 234Th/238U disequilibrium and particulate organic carbon export in the northern South China Sea. J. Oceanogr. 64, 417–428.
Cho, H. M., Kim, G., Kwon, E. Y., and Han, Y. (2019). Radium Tracing Cross-shelf fluxes of nutrients in the northwest Pacific Ocean. Geophys. Res. Lett. 46, 11321–11328. doi: 10.1029/2019gl084594
Cifuentes, L. A., Coffin, R. B., Solorzano, L., Cardenas, W., Espinoza, J., and Twilley, R. (1996). Isotopic and elemental variations of carbon and nitrogen in a mangrove estuary. Estuar. Coast. Shelf Sci. 43, 781–800.
Coale, K. H., and Bruland, K. W. (1987). Oceanic stratified euphotic zone as elucidated by 234Th:238U disequilibria 1. Limnol. Oceanogr. 32, 189–200. doi: 10.4319/lo.1987.32.1.0189
Cochran, J. K., Barnes, C., Achman, D., and Hirschberg, D. J. (1995). Thorium-234/uranium-238 disequilibrium as an indicator of scavenging rates and participate organic carbon fluxes in the Northeast Water Polynya, Greenland. J. Geophys. Res. Oceans 100, 4399–4410.
Deng, B., Zhang, J., and Wu, Y. (2006). Recent sediment accumulation and carbon burial in the East China Sea. Glob. Biogeochem. Cycles 20:GB3014.
Drenzek, N. J., Montluçon, D. B., Yunker, M. B., Macdonald, R. W., and Eglinton, T. I. (2007). Constraints on the origin of sedimentary organic carbon in the Beaufort Sea from coupled molecular 13C and 14C measurements. Mar. Chem. 103, 146–162.
Druffel, E. R., Williams, P. M., Bauer, J. E., and Ertel, J. R. (1992). Cycling of dissolved and particulate organic matter in the open ocean. J. Geophys. Res. Oceans 97, 15639–15659.
Eppley, R. W., and Peterson, B. J. (1979). Particulate organic matter flux and planktonic new production in the deep ocean. Nature 282, 677–680.
Fang, T.-H., Li, J.-Y., Feng, H.-M., and Chen, H.-Y. (2009). Distribution and contamination of trace metals in surface sediments of the East China Sea. Mar. Environ. Res. 68, 178–187. doi: 10.1016/j.marenvres.2009.06.005
Gong, G.-C., Wen, Y.-H., Wang, B.-W., and Liu, G.-J. (2003). Seasonal variation of chlorophyll a concentration, primary production and environmental conditions in the subtropical East China Sea. Deep Sea Res. Part II Top. Stud. Oceanogr. 50, 1219–1236. doi: 10.1016/s0967-0645(03)00019-5
Gustafsson, Ö, Buesseler, K. O., Geyer, W. R., Moran, S. B., and Gschwend, P. M. (1998). An assessment of the relative importance of horizontal and vertical transport of particle-reactive chemicals in the coastal ocean. Cont. Shelf Res. 18, 805–829. doi: 10.1016/s0278-4343(98)00015-6
Hedges, J. I., and Stern, J. H. (1984). Carbon and nitrogen determinations of carbonate-containing solids 1. Limnol. Oceanogr. 29, 657–663. doi: 10.4319/lo.1984.29.3.0657
Hsu, S.-C., Lin, F.-J., Jeng, W.-L., and Tang, T. Y. (1998). The effect of a cyclonic eddy on the distribution of lithogenic particles in the southern East China Sea. J. Mar. Res. 56, 813–832. doi: 10.1357/002224098321667387
Hu, L., Shi, X., Bai, Y., Qiao, S., Li, L., Yu, Y., et al. (2016). Recent organic carbon sequestration in the shelf sediments of the Bohai Sea and Yellow Sea, China. J. Mar. Syst. 155, 50–58. doi: 10.1016/j.jmarsys.2015.10.018
Hung, C.-C., Tseng, C.-W., Gong, G.-C., Chen, K.-S., Chen, M.-H., and Hsu, S.-C. (2013). Fluxes of particulate organic carbon in the East China Sea in summer. Biogeosciences 10, 6469–6484. doi: 10.1016/j.envpol.2018.11.059
Hung, J.-J., Chan, C.-L., and Gong, G.-C. (2007). Summer distribution and geochemical composition of suspended-particulate matter in the East China Sea. J. Oceanogr. 63, 189–202. doi: 10.1007/s10872-007-0021-x
Kim, D., Choi, S. H., Kim, K. H., Shim, J., Yoo, S., and Kim, C. H. (2009). Spatial and temporal variations in nutrient and chlorophyll-a concentrations in the northern East China Sea surrounding Cheju Island. Cont. Shelf Res. 291426–1436.
Kim, G., Ryu, J.-W., Yang, H.-S., and Yun, S.-T. (2005). Submarine groundwater discharge (SGD) into the Yellow Sea revealed by 228Ra and 226Ra isotopes: implications for global silicate fluxes. Earth Planet. Sci. Lett. 237, 156–166.
Kim, J., Cho, H.-M., and Kim, G. (2018). Significant production of humic fluorescent dissolved organic matter in the continental shelf waters of the northwestern Pacific Ocean. Sci. Rep. 8, 1–8. doi: 10.1038/s41598-018-23299-1
Kim, M., Hwang, J., Eglinton, T. I., and Druffel, E. R. M. (2020). Lateral Particle Supply as a Key Vector in the Oceanic Carbon Cycle. Glob. Biogeochem. Cycles 34:e2020GB006544.
Kohn, M. J. (2010). Carbon isotope compositions of terrestrial C3 plants as indicators of (paleo) ecology and (paleo) climate. Proc. Natl. Acad. Sci. U. S. A. 107, 19691–19695. doi: 10.1073/pnas.1004933107
Kwon, H. K., Kim, G., Hwang, J., Lim, W. A., Park, J. W., and Kim, T.-H. (2018). Significant and conservative long-range transport of dissolved organic nutrients in the Changjiang diluted water. Sci. Rep. 8, 1–7. doi: 10.1038/s41598-018-31105-1
Liu, K.-K., Atkinson, L., Quiñones, R. A., and Talaue-McManus, L. (2010). “Biogeochemistry of continental margins in a global context,” in Carbon and Nutrient Fluxes in Continental Margins, eds K. K. Liu, L. Atkinson, R. Quiñones, and L. Talaue-McManus (Berlin, Heidelberg: Springer), 3–24.
McKee, B. A., DeMaster, D. J., and Nittrouer, C. A. (1984). The use of 234Th/238U disequilibrium to examine the fate of particle-reactive species on the Yangtze continental shelf. Earth Planet. Sci. Lett. 68, 431–442.
Muller-Karger, F. E., Varela, R., Thunell, R., Luerssen, R., Hu, C., and Walsh, J. J. (2005). The importance of continental margins in the global carbon cycle. Geophys. Res. Lett. 32:L01602.
Ohnemus, D. C., Auro, M. E., Sherrell, R. M., Lagerström, M., Morton, P. L., Twining, B. S., et al. (2014). Laboratory intercomparison of marine particulate digestions including Piranha: a novel chemical method for dissolution of polyethersulfone filters. Limnol. Oceanogr. Methods 12, 530–547.
Owens, S., Pike, S., and Buesseler, K. (2015). Thorium-234 as a tracer of particle dynamics and upper ocean export in the Atlantic Ocean. Deep Sea Res. Part II Top. Stud. Oceanogr. 116, 42–59.
Owens, S. A., Buesseler, K. O., and Sims, K. W. W. (2011). Re-evaluating the 238U-salinity relationship in seawater: implications for the 238U–234Th disequilibrium method. Mar. Chem. 127, 31–39.
Ran, L., Lu, X., Sun, H., Han, J., Li, R., and Zhang, J. (2013). Spatial and seasonal variability of organic carbon transport in the Yellow River, China. J. Hydrol. 498, 76–88.
Raymond, P. A., and Bauer, J. E. (2001). Use of 14C and 13C natural abundances for evaluating riverine, estuarine, and coastal DOC and POC sources and cycling: a review and synthesis. Org. Geochem. 32, 469–485.
Ren, M.-E., and Shi, Y.-L. (1986). Sediment discharge of the Yellow River (China) and its effect on the sedimentation of the Bohai and the Yellow Sea. Cont. Shelf Res. 6, 785–810. doi: 10.1016/j.chemosphere.2020.126846
Seo, J., Seo, H., Hwang, J., and Kim, G. (2021). Rapid and Accurate Method for Determining 234Th in Seawater: Fe Co-precipitation, UTEVA Extraction, and Micro-precipitation. Ocean Sci. J. 56, 378–384.
Shen, Z.-L., and Liu, Q. (2009). Nutrients in the Changjiang River. Environ. Monit. Assess. 153, 27–44.
Shi, X., Chen, Z., Cheng, Z., Cai, D., Bu, W., Wang, K., et al. (2004). Transportation and deposition of modern sediments in the southern Yellow Sea. J. Korean Soc. Oceanogr. 39, 57–71.
Song, J., Qu, B., Li, X., Yuan, H., Li, N., and Duan, L. (2018). Carbon sinks/sources in the Yellow and East China Seas—Air-sea interface exchange, dissolution in seawater, and burial in sediments. Sci. China Earth Sci. 61, 1583–1593.
Taylor, S. (1964). Abundance of chemical elements in the continental crust: a new table. Geochim. Cosmochim. Acta 28, 1273–1285.
Uematsu, M., Wang, Z., and Uno, I. (2003). Atmospheric input of mineral dust to the western North Pacific region based on direct measurements and a regional chemical transport model. Geophys. Res. Lett. 30:1342.
Wang, X., Ma, H., Li, R., Song, Z., and Wu, J. (2012). Seasonal fluxes and source variation of organic carbon transported by two major Chinese Rivers: the Yellow River and Changjiang (Yangtze) River. Glob. Biogeochem. Cycles 26:GB2025.
Weinstein, S. E., and Moran, S. B. (2004). Distribution of size-fractionated particulate trace metals collected by bottles and in-situ pumps in the Gulf of Maine–Scotian Shelf and Labrador Sea. Mar. Chem. 87, 121–135. doi: 10.1016/j.marchem.2004.02.004
Windom, H. L., and Gross, T. F. (1989). Flux of particulate aluminum across the southeastern US continental shelf. Estuar. Coast. Shelf Sci. 28, 327–338. doi: 10.1016/0272-7714(89)90021-8
Wu, Y., Zhang, J., Li, D., Wei, H., and Lu, R. (2003). Isotope variability of particulate organic matter at the PN section in the East China Sea. Biogeochemistry 65,31–49.
Xu, F., Hu, B., Yuan, S., Zhao, Y., Dou, Y., Jiang, Z., et al. (2018). Heavy metals in surface sediments of the continental shelf of the South Yellow Sea and East China Sea: sources, distribution and contamination. CATENA 160, 194–200.
Yang, S. Y., Jung, H. S., Lim, D. I., and Li, C. X. (2003). A review on the provenance discrimination of sediments in the Yellow Sea. Earth-Sci. Rev. 63, 93–120.
Zhai, W., and Dai, M. (2009). On the seasonal variation of air–sea CO2 fluxes in the outer Changjiang (Yangtze River) Estuary, East China Sea. Mar. Chem. 117, 2–10.
Zhang, J., Huang, W., Liu, S., Liu, M., Yu, Q., and Wang, J. (1992). Transport of particulate heavy metals towards the China Sea: a preliminary study and comparison. Mar. Chem. 40, 161–178.
Zhang, J., Wu, Y., Jennerjahn, T. C., Ittekkot, V., and He, Q. (2007). Distribution of organic matter in the Changjiang (Yangtze River) Estuary and their stable carbon and nitrogen isotopic ratios: implications for source discrimination and sedimentary dynamics. Mar. Chem. 106, 111–126.
Keywords: particulate organic carbon, stable carbon isotope, radiocarbon, Th-234, particle settling, sediment resuspension
Citation: Seo J, Kim G and Hwang J (2022) Sources and Behavior of Particulate Organic Carbon in the Yellow Sea and the East China Sea Based on 13C, 14C, and 234Th. Front. Mar. Sci. 9:793556. doi: 10.3389/fmars.2022.793556
Received: 12 October 2021; Accepted: 24 February 2022;
Published: 01 April 2022.
Edited by:
Aaron J. Beck, GEOMAR Helmholtz Center for Ocean Research Kiel, Helmholtz Association of German Research Centres (HZ), GermanyReviewed by:
Selvaraj Kandasamy, Xiamen University, ChinaCopyright © 2022 Seo, Kim and Hwang. This is an open-access article distributed under the terms of the Creative Commons Attribution License (CC BY). The use, distribution or reproduction in other forums is permitted, provided the original author(s) and the copyright owner(s) are credited and that the original publication in this journal is cited, in accordance with accepted academic practice. No use, distribution or reproduction is permitted which does not comply with these terms.
*Correspondence: Jeomshik Hwang, amVvbXNoaWtAc251LmFjLmty
Disclaimer: All claims expressed in this article are solely those of the authors and do not necessarily represent those of their affiliated organizations, or those of the publisher, the editors and the reviewers. Any product that may be evaluated in this article or claim that may be made by its manufacturer is not guaranteed or endorsed by the publisher.
Research integrity at Frontiers

Learn more about the work of our research integrity team to safeguard the quality of each article we publish.