
94% of researchers rate our articles as excellent or good
Learn more about the work of our research integrity team to safeguard the quality of each article we publish.
Find out more
ORIGINAL RESEARCH article
Front. Mar. Sci., 10 February 2022
Sec. Global Change and the Future Ocean
Volume 9 - 2022 | https://doi.org/10.3389/fmars.2022.781876
This article is part of the Research TopicBlue Carbon: Beyond the InventoryView all 17 articles
 Mark Chatting1,2
 Ibrahim Al-Maslamani3*
 Mark Walton4
 Martin W. Skov2
 Hilary Kennedy2
 Y. Sinan Husrevoglu5
 Lewis Le Vay4
Mangroves are important sinks of organic carbon (C) and there is significant interest in their use for greenhouse gas emissions mitigation. Adverse impacts on organic carbon storage potential from future climate change and deforestation would devalue such ambitions, thus global projections of future change remains a priority research area. We modeled the effects of climate change on future C stocks and soil sequestration rates (CSR) under two climate scenarios (“business as usual”: SSP245 and high-emissions: SSP585). Model results were contrasted with CO2 equivalents (CO2e) emissions from past, present and future rates of deforestation on a country specific scale. For C stocks, we found climate change will increase global stocks by ∼7% under both climate scenarios and that this gain will exceed losses from deforestation by the end of the twenty-first century, largely due to shifts in rainfall. Major mangrove-holding countries Indonesia, Malaysia, Cuba, and Nigeria will increase national C stocks by > 10%. Under the high-end scenario, while a net global increase is still expected, elevated temperatures and wider temperature ranges are likely increase the risk of countries’ C stocks diminishing. For CSR, there will likely be a global reduction under both climate change scenarios: 12 of the top 20 mangrove-rich countries will see a drop in CSR. Modeling of published country level mangrove deforestation rates showed emissions have decreased from 141.4 to 6.4% of annual CSR since the 1980’s. Projecting current mangrove deforestation rates into the future resulted in a total of 678.50 ± 151.32 Tg CO2e emitted from 2012 to 2095. Reducing mangrove deforestation rates further would elevate the carbon benefit from climate change by 55–61%, to make the proposition of offsetting emissions through mangrove protection and restoration more attractive. These results demonstrate the positive benefits of mangrove conservation on national carbon budgets, and we identify the nations where incorporating mangrove conservation into their Nationally Defined Contributions offers a particularly rewarding route toward meeting their Glasgow Agreement commitments.
Mangroves, tidal marshes and seagrass meadows accumulate organic rich soils that can often extend to many meters depth and provide long-term storage of organic carbon (C). Termed “blue carbon” ecosystems (BCE), these habitats occupy a relatively small area of the global ocean (∼0.2%), but are major contributors to marine sediment organic carbon burial (Duarte et al., 2013). Mangroves are of particular interest as they store and sequester comparatively high amounts of C in both biomass and soils (Donato et al., 2011; Ezcurra et al., 2016; Almahasheer et al., 2017; Kauffman et al., 2017). Mangroves store up to five times as much organic carbon as tropical upland forests (Donato et al., 2011). A combination of high productivity and slow soil decomposition rates significantly increases mangroves’ ability to capture and store organic carbon, particularly in their soils (Alongi, 2012). Aboveground net primary productivity (NPP) rates in mangroves (8.1 t DW ha–1 yr–1) rival those of highly productive tropical terrestrial forests (11.1 t DW ha–1 yr–1) (Alongi, 2012). In addition, complex mangrove root structures and waterlogged soils trap allochthonous organic material on top of deep carbon rich peat composed mainly of dead root material, sometimes extending up to 10 m depth (McKee et al., 2007); soil carbon can comprise up to 90% of mangrove organic carbon stocks (Cooray et al., 2021). As a result, mangroves have received a great deal of scientific interest as natural systems for offsetting greenhouse gas (GHG) emissions (Donato et al., 2011; Fourqurean et al., 2012).
Historic rates of mangrove deforestation posed a serious risk of significant GHG emissions; since the 1950’s it has been estimated that up to 50% of the world’s mangroves have been deforested, largely due to land-use change (Alongi, 2002). Despite estimates of recent global mangrove loss slowing to 4.0% of global coverage between 1996 and 2016 (Richards et al., 2020), it has been estimated that > 300 million Mg of CO2e were emitted as a result of mangrove deforestation between 2000 and 2012 (Hamilton and Friess, 2018). Between 2000 and 2016, 87% of mangrove loss in the West Coral triangle, where the vast majority of the world’s mangroves organic carbon is stored, was due to mangrove to agri/aquaculture land-use conversion (Adame et al., 2021). Mangrove conservation and restoration programs on a national scale have been identified as an efficient means of offsetting GHG emissions (Murdiyarso et al., 2015; Taillardat et al., 2018; Cameron et al., 2019), although the prevention of further forest loss, by far, outweighs gains from restoration (Kauffman et al., 2017).
While the potential for GHG emissions from mangrove deforestation are well documented (Lovelock et al., 2011; Kauffman et al., 2014; Lang’at et al., 2014; Atwood et al., 2017; Hamilton and Friess, 2018), the effects of climate change on global mangrove C stocks are less frequently addressed (Adame et al., 2021) and are therefore a priority research area for blue carbon science (Macreadie et al., 2019). Sea level rise has been identified as potentially the most significant climate change factor affecting mangrove distribution and C stocks (Macreadie et al., 2019; Lovelock and Reef, 2020). Sea level rise would cause changes to inundation periods and durations, potentially increasing tree mortality (Ward et al., 2016). It has been estimated that 96% of coastal wetlands, which includes mangroves, could be lost in the Middle East this century due to sea level rise (Blankespoor et al., 2014). Where mangroves occur adjacent to human settlements, coastal “squeeze” may occur, between rising sea level and expanding human settlements/agriculture behind the mangrove (Lovelock and Reef, 2020). Worst case estimates have projected lost C sequestration of 3.4 Pg by 2100 due to coastal “squeeze” (Lovelock and Reef, 2020). Change in climatic regimes could also prove a significant factor in changing overall stocks in mangroves through altering forest biomass and productivity and its subsequent contribution to soil C stocks and soil sequestration rates (CSR). Recent evidence from extreme climatic regions of global mangrove distribution (Almahasheer et al., 2017; Kauffman and Bhomia, 2017; Schile et al., 2017; Chatting et al., 2020) shows that under extreme salinity, heat and reduced rainfall, total C stocks and CSR may be reduced when compared to tropical humid mangroves (Sheppard et al., 2010). In addition, it is well established that climate change will not have spatially uniform impacts around the world (Giorgi et al., 2019; Soares et al., 2019). The Asian and American tropics are forecast to experience an increase in the frequency of extreme precipitation events (Giorgi et al., 2019), while reductions in precipitation in northern areas of African tropics suggest that expansion of semi-arid conditions is possible (Soares et al., 2019). Little is known about what the sum effect of these regional changes in temperature and precipitation regimes could be on regional mangrove C stocks or CSR (Wang et al., 2020) and whether any regions are at risk of significant losses in stocks and reductions in CSR.
Here we use predictive models to forecast how climate change and forest degradation singularly and in combination affect future C stocks and CSR in mangroves. Data collated from previously published literature were used to develop predictive models to estimate the difference between current and future global total C stocks (biomass + soil) and CSR. We contrasted the impacts of climate change against GHG emissions from past, present and forecasted future rates of mangrove deforestation to examine the carbon benefits from current conservation efforts on a country-specific scale.
In order to predict mangrove CSR globally and on a country-specific scale, two separate databases of previously published data were compiled. Measured soil C stocks and CSR estimates were compiled from previous work. Keywords “mangrove” AND “soil” OR “sediment” AND “carbon stocks” OR “sequestration rate” OR “burial rate” were searched in Google Scholar1 only, as Google scholar search results are a superset of Web of Science and Scopus, two commonly used search databases in meta-analysis studies (Martín-Martín et al., 2018). In addition, publicly available unpublished datasets were searched in the Centre for International Forestry Research (CIFOR) online repository2 (Sasmito et al., 2019). When studies reported interval measurements of C stocks (e.g., 0–15 cm, 15–30 cm, 30–50 cm and 50–100 cm) from sampled cores, these were used to calculate soil C stocks to 100 cm depth (C100). Individual sampling site measurements were used to maximize the amount of data to later be used in predictive modeling and to reflect the high variability in soil C stocks. When unavailable, however, study means were collated, which is likely to have overestimated C stocks in sites where this was carried out as it does not take into account C decay with soil depth. Moreover, as 31 of the 88 collated studies reported sampled core data, our calculations of C100 are likely to be overestimates. Soil C sequestration rates were obtained from studies using Pb210, Cs137 dating methods or if organic carbon sequestration was calculated from total sediment accretion. When studies reported data graphically, images of graphics were captured and points were digitized in plot digitizer software by manually overlaying points onto graphical points. When soil stocks or characteristics (dry bulk density (DBD) and soil C%) were reported, they were included and soil C stocks were calculated from the following equation then mutliplied by 100 to estimate C100 stocks (Donato et al., 2011):
Where studies’ reported measurement uncertainties (standard deviation with associated n and standard error) as well as DBD to soil C (g cm–3) conversion equation uncertainties, these were included in the database to later be propagated in model development. Site longitude and latitude were extracted from studies when reported. For studies that did not report site coordinates, any maps included were used in combination with Google Earth images to obtain site coordinates. Only intact mature mangroves were included; data from mangroves reported as degraded, newly colonized or planted were excluded from the dataset.
Statistical models were developed to predict mangrove soil organic carbon where it had not been measured. A suite of climatic variables commonly used in species distribution modeling and in previous global mangrove modeling efforts (O’Donnell and Ignizio, 2012; Hutchison et al., 2014; Supplementary Table 1) were calculated from historical climate datasets for all global mangrove points using a global mangrove presence/absence mask reported by Hamilton and Casey (2016). Previous global soil C mangrove modeling studies have incorporated non-climatic predictors, such as tidal range, river discharge and geomorphological setting (Rovai et al., 2018; Sanderman et al., 2018). However, only climatic predictors were used here, given the identified need to better understand how the magnitude of projected climate change will affect future mangrove C stocks and CSR. Global historical climate datasets used were monthly precipitation (Pmean) (from 1901 to 2010), mean monthly air temperatures (Tmean) (from 1901 to 2010), daily maximum temperatures (Tmax) and daily minimum temperatures (Tmin) (from 1979 to 2010). These datasets were obtained from the Global Precipitation Climatology Centre (Schneider et al., 2011) (GPCC) and National Center for Environmental Prediction (NCEP) (Kalnay et al., 1996) and aligned to the period from 1982–2018, the longest concurrent period of all datasets (the last 36 years). Means of the aligned period were then calculated to be used in model development. The ability of climate datasets to explain variation in soil C stocks data was also compared to models that contained non-climate predictors previously used in modeling studies, for example tidal range (Carrere et al., 2013) and river discharge (Fekete et al., 2002).
Parametric (multiple linear regression) and machine learning (random forest) approaches were contrasted to test which better predicted current soil C100 stocks and CSR datasets. Measurement and conversion equation uncertainties that were compiled from literature were included as inverse weights in linear and random forest modeling to account for reported sampling uncertainty. Log10 transformation was performed on response data for linear regression analyses to comply with regression assumptions and predictors were chosen based on stepwise regression. Linear regression multicolinearity was addressed by removing explanatory variables with a variance inflation factor > 3.3 (Kock and Lynn, 2012). Random forest models were built using the randomForest package in R. Random forests are not subject to assumptions of normality and multicolinearity, therefore, all predictors were used and response data were not transformed. Both linear and random forest model out of sample performance was tested by k-fold cross validation using an 80–20% training-test split (Rovai et al., 2018; Masih, 2019). All statistical analyses was performed using R 3.6.2 software.
The global mangrove mask reported by Hamilton and Casey (2016) was assumed to be present day global mangrove coverage. For the purposes of this study, 2012 was selected as it was the latest previously published global mangrove extent map. As the study aimed to estimate national scale stocks and CSR, the original ∼30 × 30 m pixel spatial resolution was converted to ∼3,000 × 3,000 m by resampling points. This level of resolution was selected as it reduced computational time significantly, still represented a high enough detail to discern country level changes in climate and was comparable to previous global and country level mangrove modeling work. For example, Rovai et al. (2018) used a ∼25 km pixel resolution when predicting mangrove soil organic carbon stocks globally, Zeng et al. (2021) used a 1 km spatial resolution when investigating country level emissions in mangroves; and Hutchison et al. (2014) aboveground mangrove biomass to a 30 arc-second (1 km) resolution. Aboveground biomass (Mg ha–1) for all global mangrove pixels was estimated using a previously developed climate predictive model (AGB t ha–1 = 0.295Bio10 + 0.658Bio11 + 0.023Bio16 + 0.195Bio17 - 120.3 (Hutchison et al., 2014). Where Bio 10 and 11 are the mean temperatures of the warmest and coldest quarters of the year, respectively, and Bio16 and 17 are precipitation in the wettest and driest quarters, respectively. Below ground biomass was estimated using a total above to below ground biomass allocation ratio of 0.5 (Hamilton and Friess, 2018). Model residuals reported by Hutchison et al. (2014) were used to propagate aboveground biomass standard errors. Uncertainties were multiplied by 1.96 and either added or subtracted from mean predicted values to calculate upper and lower 95% confidence intervals (CI’s) for above and below ground model outputs (Zuur et al., 2013). Above and below ground tree biomass estimates and CI’s were then converted into above and below ground tree C stock using 0.48 and 0.39 conversion factors, respectively (Schile et al., 2017). Using our newly derived predictive model, soil C100 stocks and CSR and their associated uncertainties were applied to all global mangrove pixels. 95% CI’s were calculated in the same way as aboveground biomass. Hectare level total stocks estimates, CSR and upper and lower confidence bounds were grouped by country. Country level total C stocks and 95% CI’s were then calculated by summing all hectare value estimates within each country.
Constant global mangrove coverage was assumed from 2012 to 2095, to estimate potential change in mangrove C. Future (year 2095) global total mangrove organic carbon stocks, CSR, climate data and associated 95% CI’s were predicted in the same way as present day estimates, however, forecasted climate data for all global mangrove coverage pixels were used instead of historical datasets. To calculate future climate data, the latest Coupled Model Inter-comparison Project phase 6 (CMIP6) climate scenarios were used. Shared Socioeconomic Pathway 2 radiative forcing 4.5 (SSP245) and Shared Socioeconomic Pathway 5 radiative forcing 8.5 (SSP585) were selected as they represent mid and high-level GHG emissions futures, respectively. Scenario SSP245 was selected as it represents a “business as usual” scenario where historical patterns of development are continued and could be compared to a more extreme scenario (SSP585), which forecasts high economic development and increased reliance on fossil fuels, subsequently high GHG emissions (Riahi et al., 2017). Prior to applying C stocks and CSR models to climate data, an ensemble of climate datasets were bias corrected and mean weighted. For each ensemble member, bias correction of future datasets, based on their alignment with historical climate datasets, was performed using the following equations (Luo et al., 2018):
Where Cor Pmeanm,loc, Cor Tmeanm,loc and Cor Tmaxm,loc stand for corrected future precipitation and temperature on the mth month in the locth location. Prefaces Obs and Hist refer to observed historical and hindcasted historical data. Weighting coefficients (Supplementary Table 3) for bias corrected climate data was calculated depending on their ability to hindcast historical observed datasets using the following equation (Muhling et al., 2011):
Where RMS is the model root mean square (RMS) and n is the number of climate forecast models. From weighting coefficients, a bias corrected, mean weighted ensemble climate forecast dataset was then calculated for each predictor (Pmean, Tmean, Tmax, Ts and Tmin). The ensemble was selected where climate forecasts (and hindcast data) for each scenario (SSP245 and SSP585) and each predictor were available. Datasets were downloaded from the World Climate Research Program.3 Global mangrove biomass C stocks, soil C stocks and soil sequestration rates were then predicted from the mean weighted climate forecast using the same predictive models as present day from 2059 to 2095 (36 years, as was done for present day). Future estimates of total C stocks (biomass C and soil C100), CSR and 95% CI’s were then, subtracted from current (2012) estimates on a pixel basis. The resulting differences per pixel and CI’s were then summed per country to express change in total C stocks or soil sequestration rates on a country level with uncertainty levels. The resulting values were split into two groups depending on whether the country was forecasted to experience a net gain or loss in total mangrove C (factor: gain vs. loss). A binomial Generalized Linear Model (GLM, gain vs. loss in total mangrove C stock) was then used for each climate predictor to test for the probability of increase in a countries’ total C stock with the associated change in climate predictor.
Global and country level mangrove coverage for the years 1980, 1990, and 2000 were obtained from a previously published Food and Agricultural Organization of the UN report (FAO, 2007). Data in this report were gathered by a combination of questionnaires distributed worldwide to members of the International Society for Mangrove Ecosystems (ISME) and satellite imagery (FAO, 2007). From 2000 to 2010, high resolution (∼30 m) satellite imagery has been used to estimate global mangrove coverage (Giri et al., 2011; Hamilton and Casey, 2016). Our pre 2000 estimates are based on the 2007 FAO report (FAO, 2007), however, there is much debate about the uncertainties surrounding these data (Friess and Webb, 2014). Even determining the trend of mangrove coverage in some countries during this period is difficult (FAO, 2007). However, this period represents peak rates of global mangrove deforestation, some estimates of mangrove loss during this period are up to 30–50% (Alongi, 2002; Duke et al., 2007). In addition, the present report is the most comprehensive historical record of global mangrove coverage prior to 2000. As such, estimates of coverage change, and therefore emissions, from 2000 should be considered more accurate than prior to 2000 estimates as post-2000 estimates are based on high resolution satellite imagery. Estimates of country level mangrove coverage and deforestation from 2000 to 2012 were obtained from Hamilton and Casey (2016) using the Mangrove Forests of the World dataset (MFW) (Giri et al., 2011). A constant reference deforestation rate was assumed for the period 2012–2095 (Adame et al., 2018). Rates of loss were based on previous country specific rates for the period 2011–2012.
Mean present day hectare level C stocks and 95% CI’s for each country were calculated and multiplied by the number of hectares lost for each decadal period from 1980 to 2095 (Atwood et al., 2017). The current study assumed that deforestation of 1 hectare of mangrove results in 43% loss in soil C in addition to all tree C (Atwood et al., 2017; Adame et al., 2018), which was then divided by 10 to calculate an annual lost C over a 10 year period. Lost C from mangrove deforestation and change in C stocks from climate change were summed to calculate total potential change in C stocks in the twenty-first century from climate change and mangrove deforestation. To compare C stocks changes and emissions from mangrove deforestation, C was converted to CO2 equivalents (CO2e) by multiplying C stocks by 3.67 (Atwood et al., 2017; Adame et al., 2018; Hamilton and Friess, 2018). Emissions can be a number of gasses, CO2e is the standard unit of measure of GHG emissions for mangrove deforestation (Atwood et al., 2017; Adame et al., 2018; Hamilton and Friess, 2018).
The literature search resulted in 785 data points of soil C100 stocks from 87 individual studies conducted in 44 countries and 105 data points of soil C sequestration rates (CSR) from 31 individual studies in 17 countries (Supplementary Datasets 1, 2). Data points were available for seven out of the top ten countries reported by Sanderman et al. (2018) to hold the largest mangrove areas. Papua New Guinea, Myanmar and Cuba were the only countries in this list that lacked data.
Linear modeling only captured 27% of the variation in the soil C stocks (C100) data [Regression: F(3, 635) = 79.21, p < 0.01, R2 = 0.27, standardized to 1 m depth], whereas random forest modeling captured over double that variation (R2 = 65%). The most important predictor was precipitation of the coldest quarter, which when dropped, accounted for 17.15% increase in the model’s mean squared error (MSE, Supplementary Figure 1A). The final model selected to predict soil C100 stocks was the random forest model as cross validation revealed it outperformed the linear model in making out of sample predictions (CV Random forest: R2 = 0.65, RMSE = 98.53 Mg C ha–1; CV Linear model: R2 = 0.32, RMSE = log10(0.24) Mg C ha–1). Inclusion of tidal range and river discharge did not improve model performance (CV Random forest: R2 = 0.65, RMSE = 98.85 Mg C ha–1). The linear model captured 45% of the variation in the CSR data [Regression: F(2, 91) = 13.89, p < 0.01, R2 = 0.45], whereas random forest modeling captured less of the variation in CSR (R2 = 31%). However, the random forest model outperformed the linear model in making out of sample predictions (CV Random forest: R2 = 0.69, RMSE = 113.44 g C m2 yr–1; Linear model: R2 = 0.46, RMSE = log10(0.30) g C m2 yr–1). Therefore, the random forest model was selected to predict CSR. The most important predictor was precipitation of the wettest month, which accounted for a 7.64% increase in the model MSE (Supplementary Figure 1B).
We estimated mean per hectare total C stocks (biomass + soil) of 472.7 ± 56.4 Mg C (mean ± 1 standard error). The highest per hectare total C stocks were around Southeast Asia, particularly Indonesia and the Philippines (Figures 1A,B). Indonesia alone accounted for almost a quarter of current global C stocks (24.27 ± 0.61%), while the top 5 mangrove holding countries (Indonesia, Australia, the Philippines, Brazil and Mexico) held > 50% of the world’s mangrove C stocks (Table 1). Similar to C stocks, the highest CSR were found in Southeast Asia (Figure 1C). The median predicted soil sequestration rate was 172.5 C m2 yr–1 (95% confidence interval: 101.4–321.7 C m2 yr–1). Indonesia again accounted for the majority of global annual mangrove CSR (23.72 ± 0.09%, Table 2).
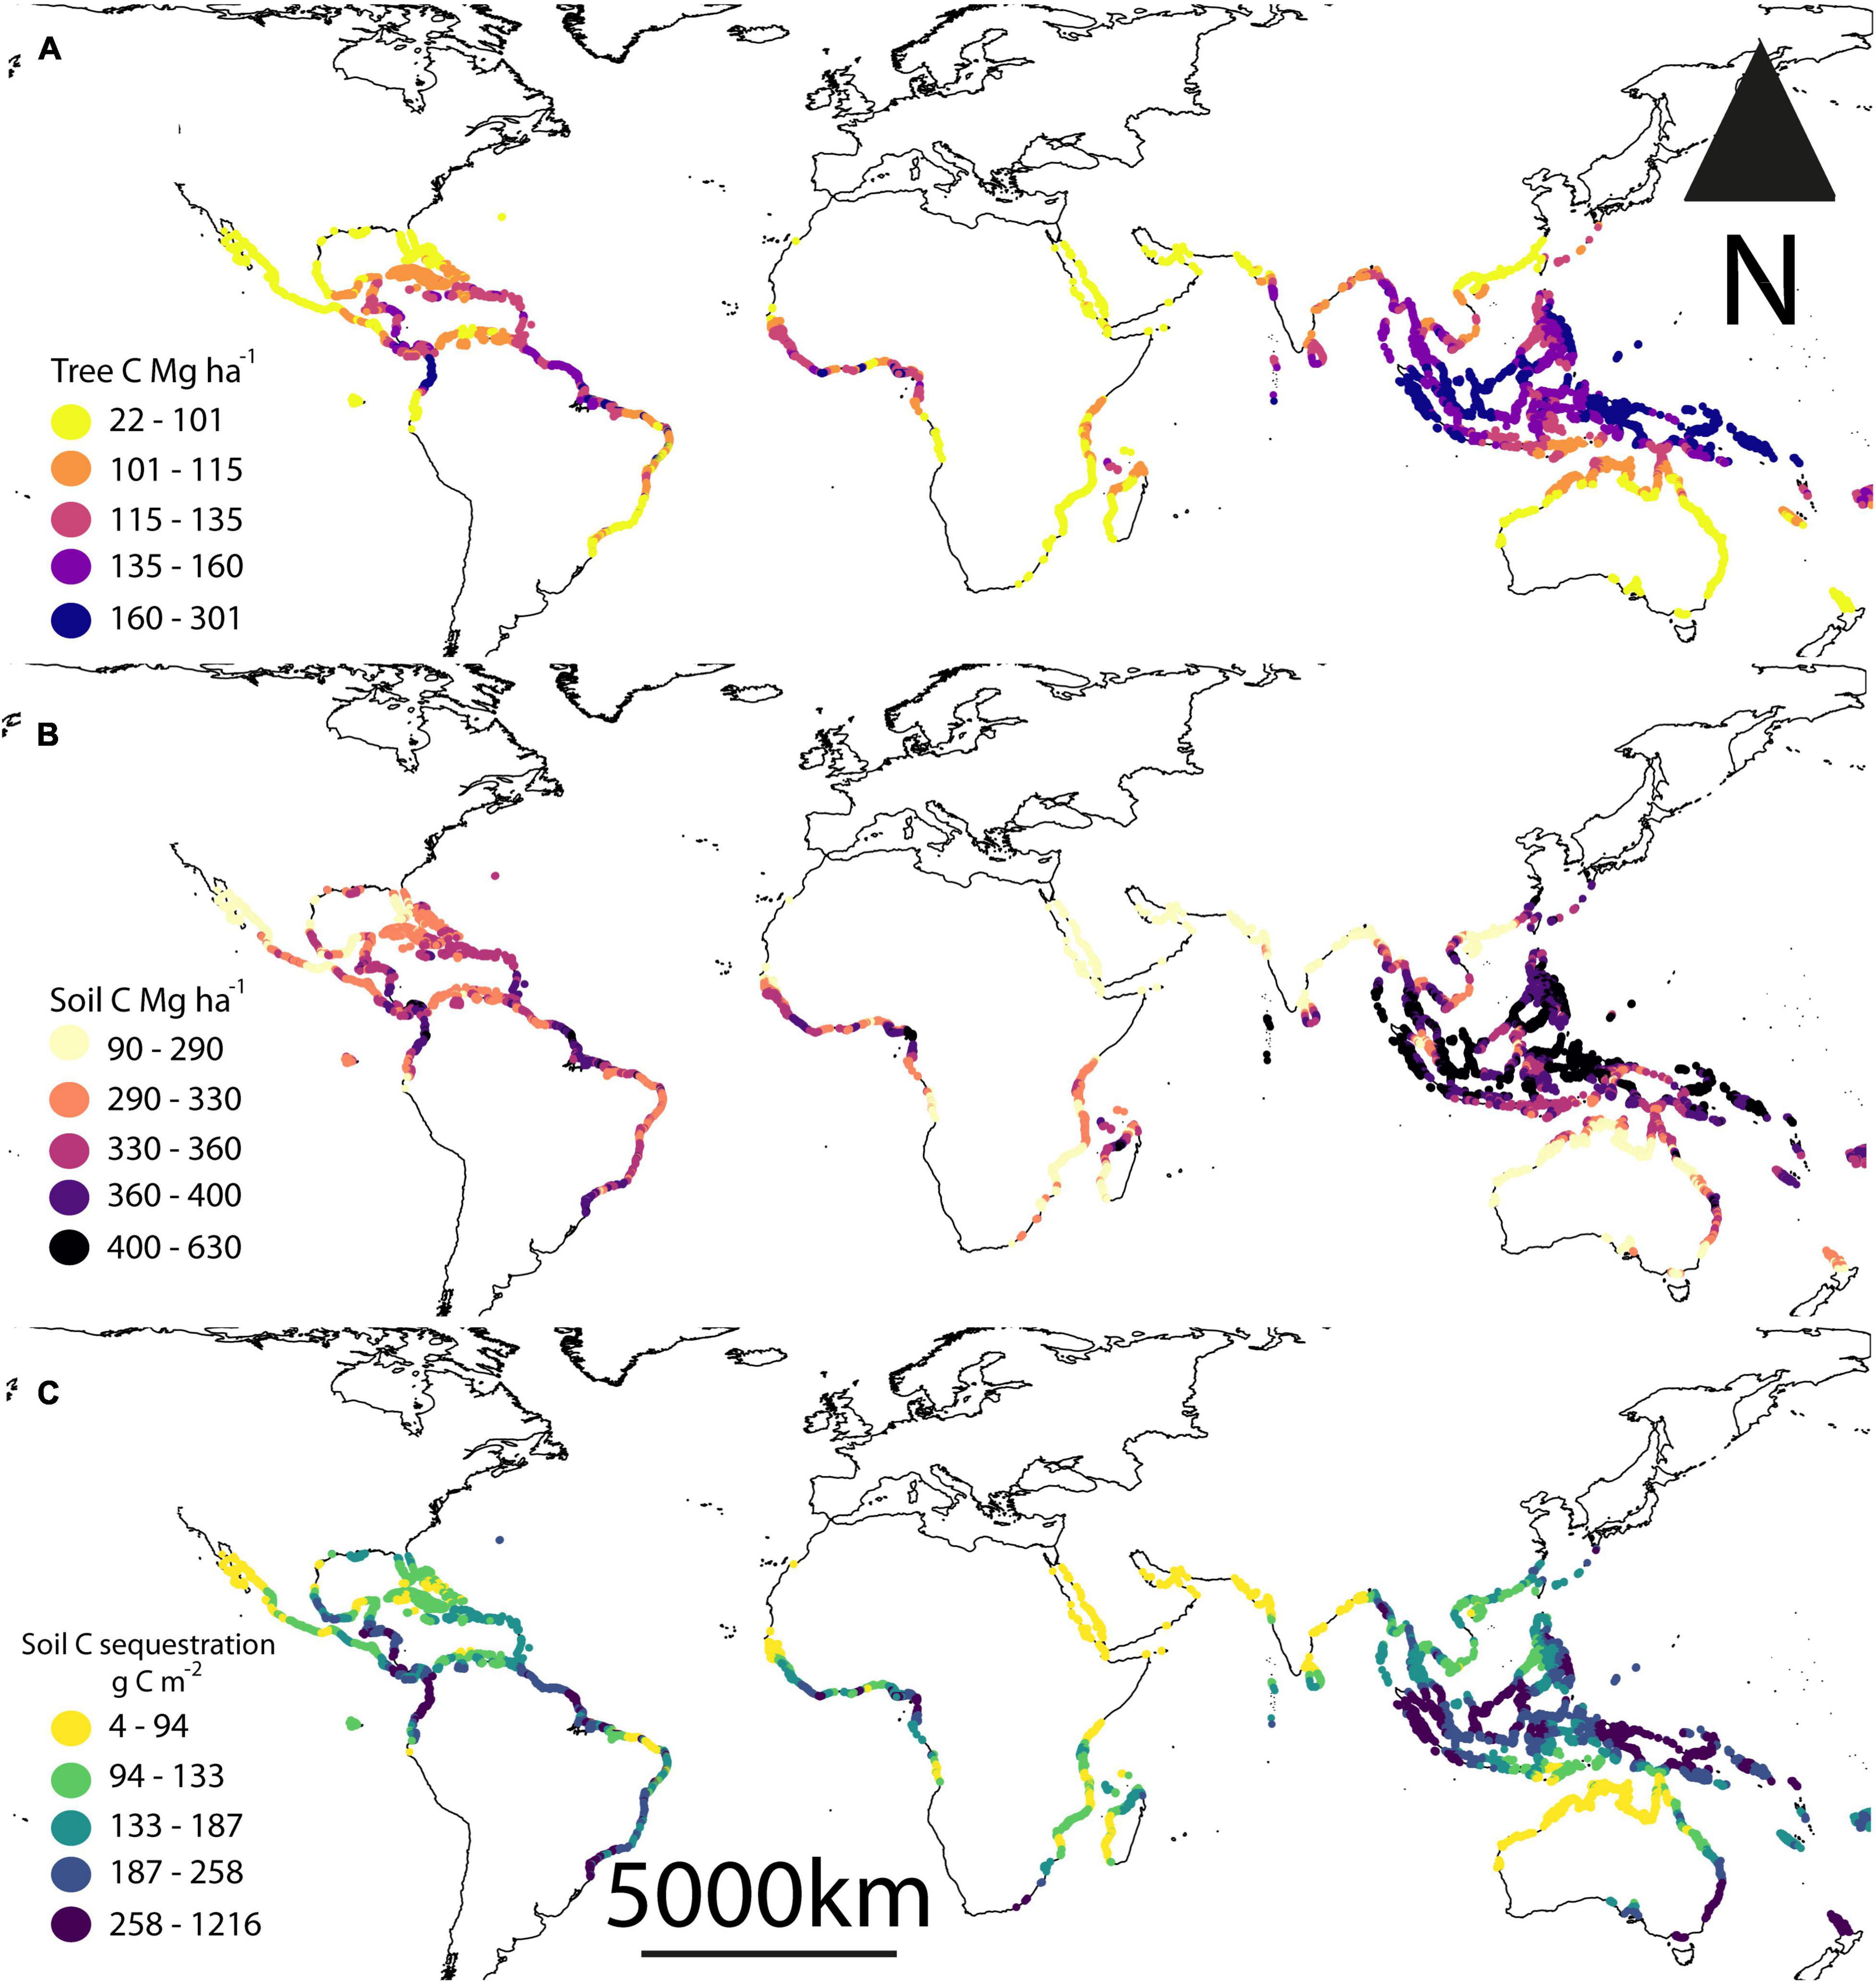
Figure 1. Estimated current global C stocks in mangrove (A) trees, (B) soils to 1 m depth, and (C) mangrove soil sequestration rates. Data presented are mean predicted values from present day climate datasets. Tree carbon was estimated from a model developed by Hutchison et al. (2014) and the soil carbon and sequestration rates estimates were from modeling performed by the current study.
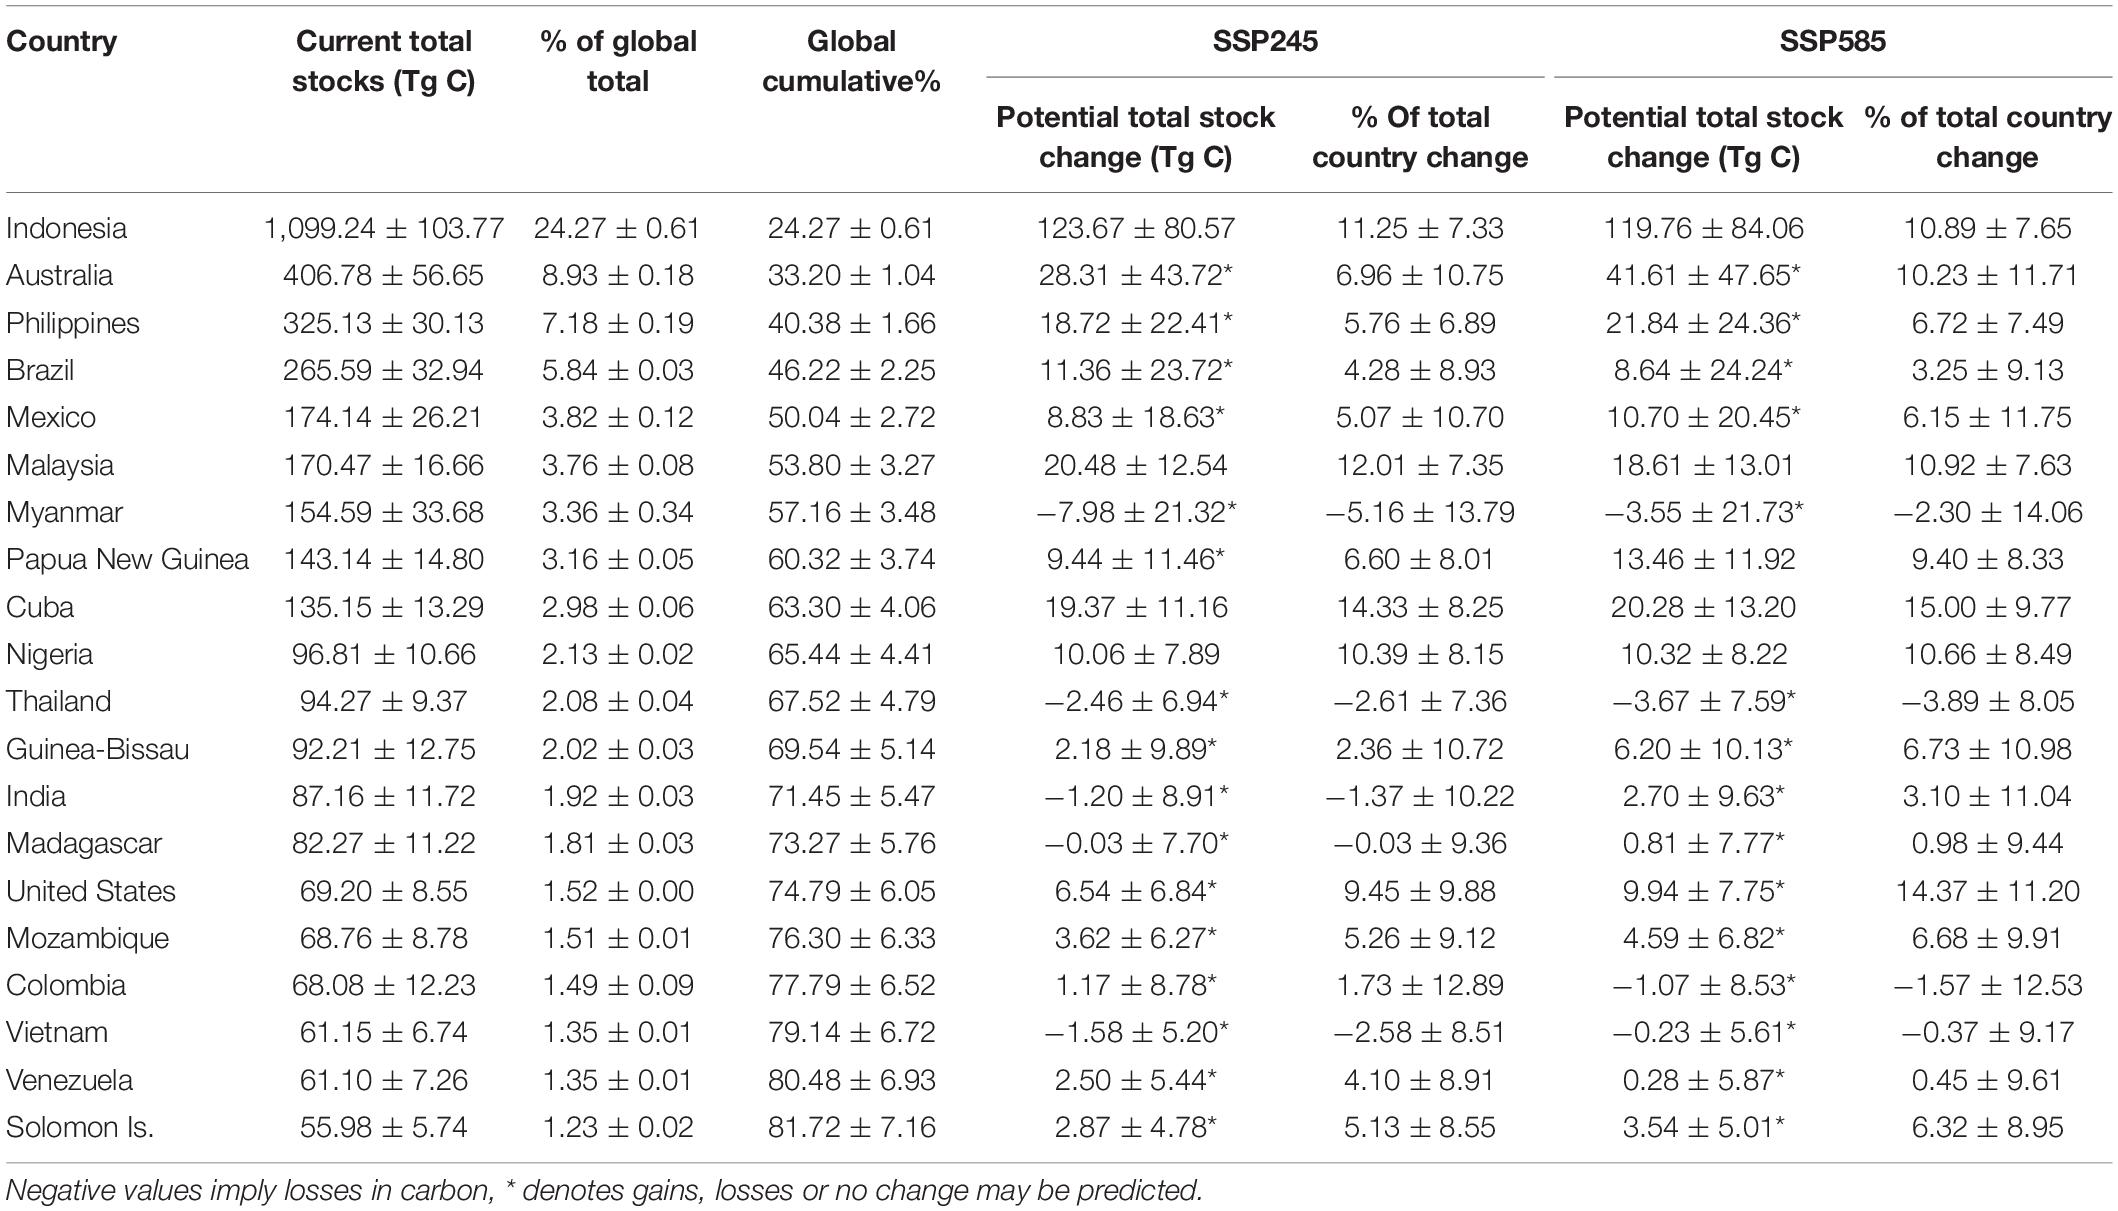
Table 1. Mean ± 2 standard errors mangrove C stocks held by the 20 most mangrove-rich countries, and their forecasted gains under two climate scenarios (SSP245 and SSP585) based on bias-corrected and means-weighted forecasted climate data.
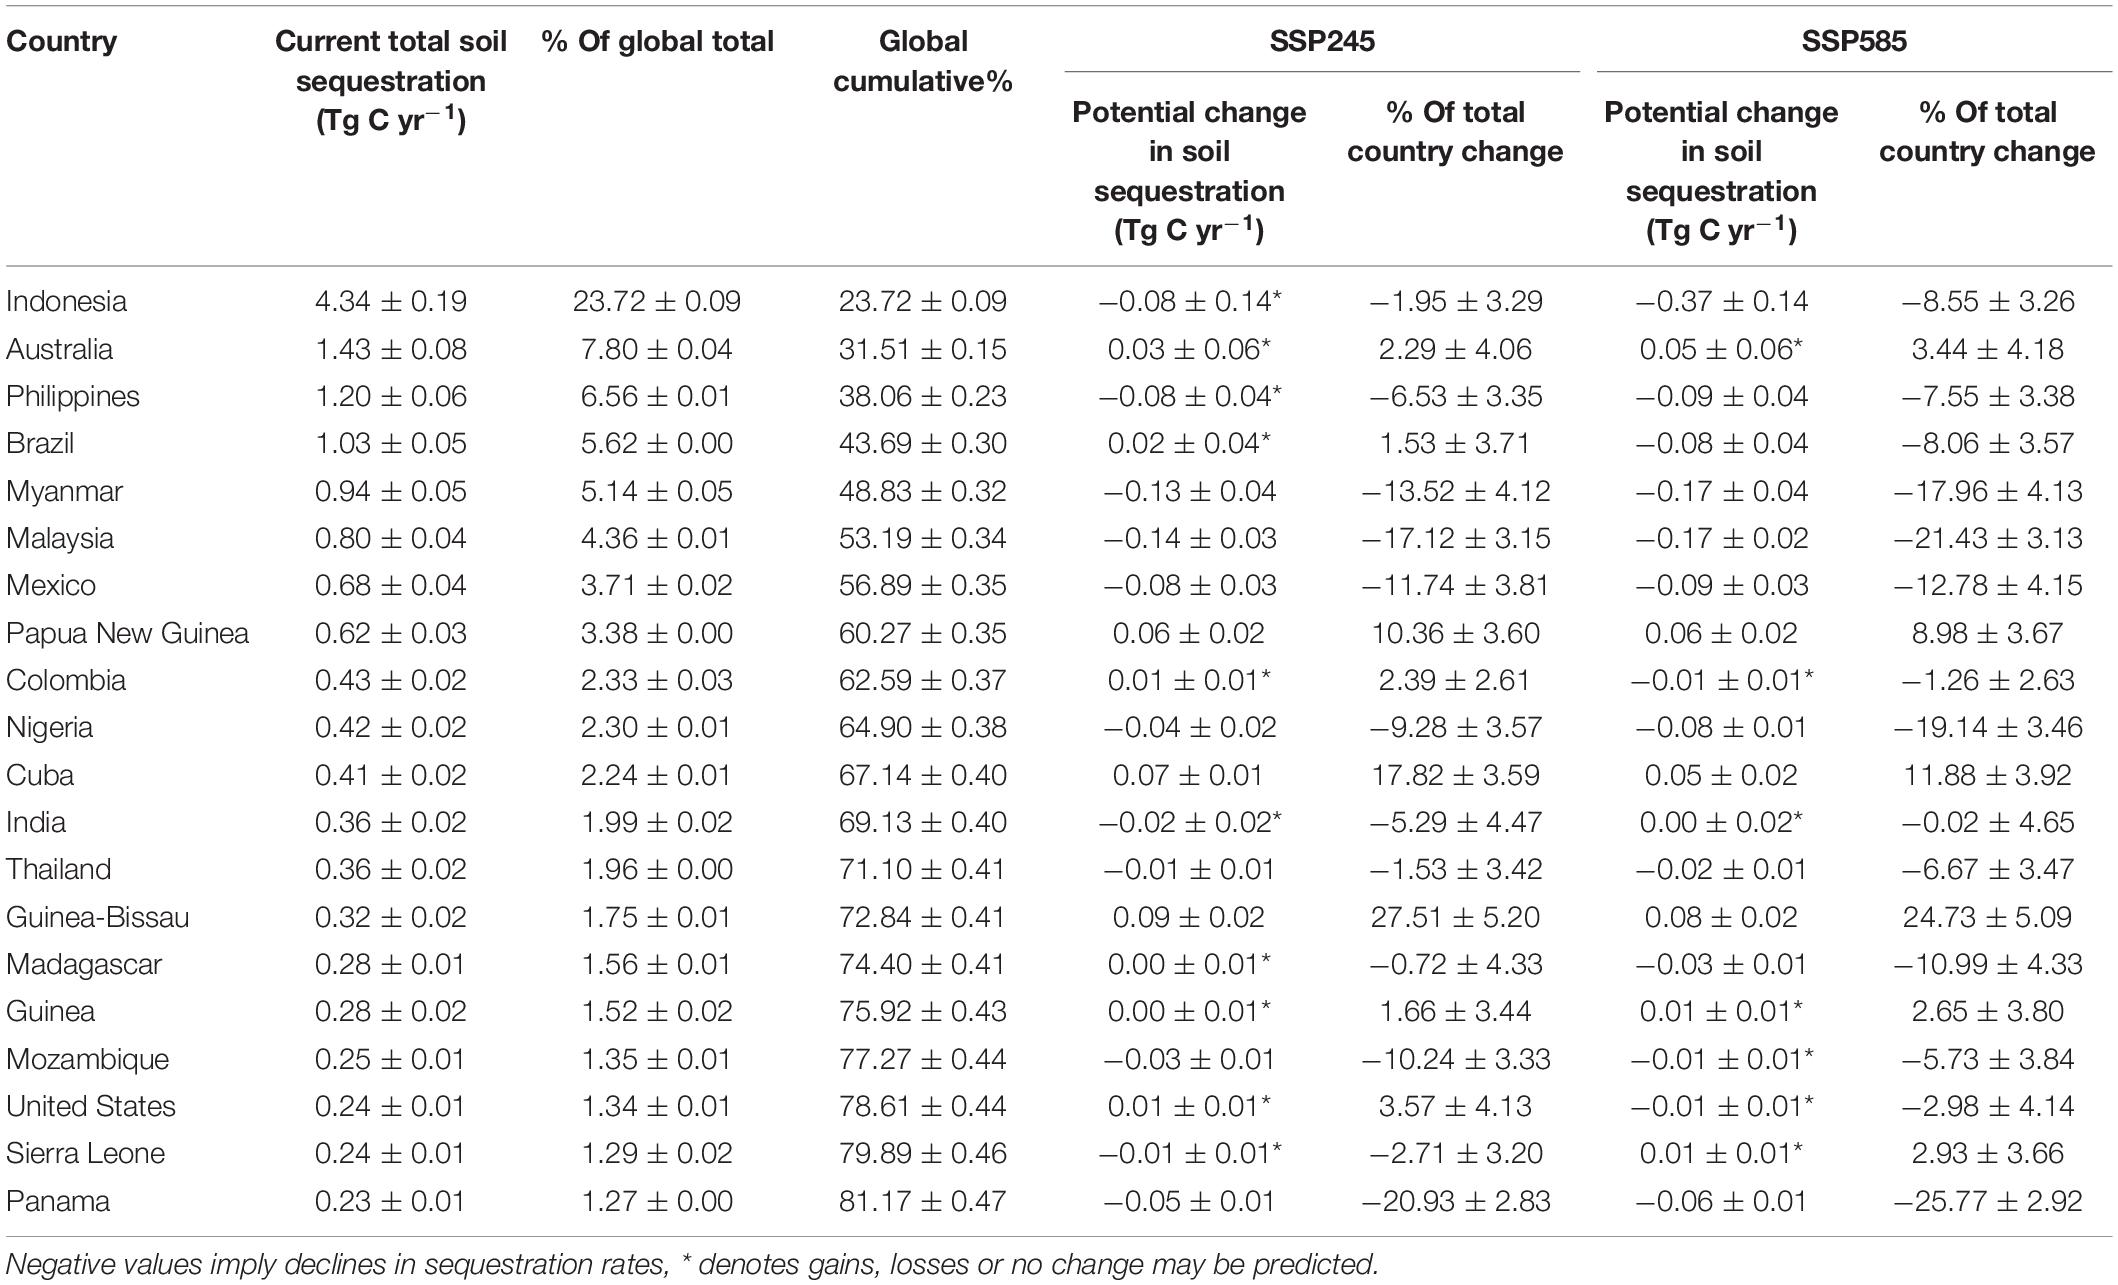
Table 2. Mean ± 2 standard errors mangrove C sequestration rates of the 20 highest sequestering countries, and their forecasted gains under two climate scenarios (SSP245 and SSP585) based on bias-corrected and means-weighted forecasted climate data.
When aggregated by country, the changes in total C stocks were spatially heterogeneous for both climate scenarios (SSP245 and SSP585). Under the business as usual scenario, reductions in total C stocks were predicted in countries that saw declines in precipitation. Decreases in precipitation of the wettest quarter (Binomial GLM: SE = 0.003, p = 0.01, Figure 2A) and the wettest month (Binomial GLM: SE = 0.001, p = 0.01, Figure 2B) were significant predictors of declines in countries’ total C stocks. Egypt, Taiwan and Myanmar were predicted to have the three greatest reductions in precipitation in the wettest month of the year (−197.76, −172.58, and −166.66 mm, respectively) and wettest quarter of the year (−446.83, −224.82, and −576.60 mm, respectively). Under a high-end scenario (SSP585), it was an elevation in mean temperature or temperature ranges that caused the greatest reduction in C stocks. Countries forecast to experience significant increases in temperature seasonality (Binomial GLM: SE = 0.43, p = 0.02, Figure 2C) and higher mean annual temperatures (Binomial GLM: SE = 0.08, p = 0.01, Figure 2D) were also predicted to have diminished C stocks by 2095. Qatar, Bahrain and Sudan were predicted to have the three greatest changes in temperature seasonality (1.14, 1.08, and 0.94°C, respectively), with New Zealand, South Africa and Morocco experiencing the greatest increases in mean annual temperatures (7.77, 5.07, and 4.25°C, respectively). Changes in CSR were spatially heterogeneous and declines under scenario SSP245 were experienced in countries with predicted decreases in mean temperatures of the wettest quarter of the year (Binomial GLM: SE = 0.18, p = 0.05, Figure 2E).
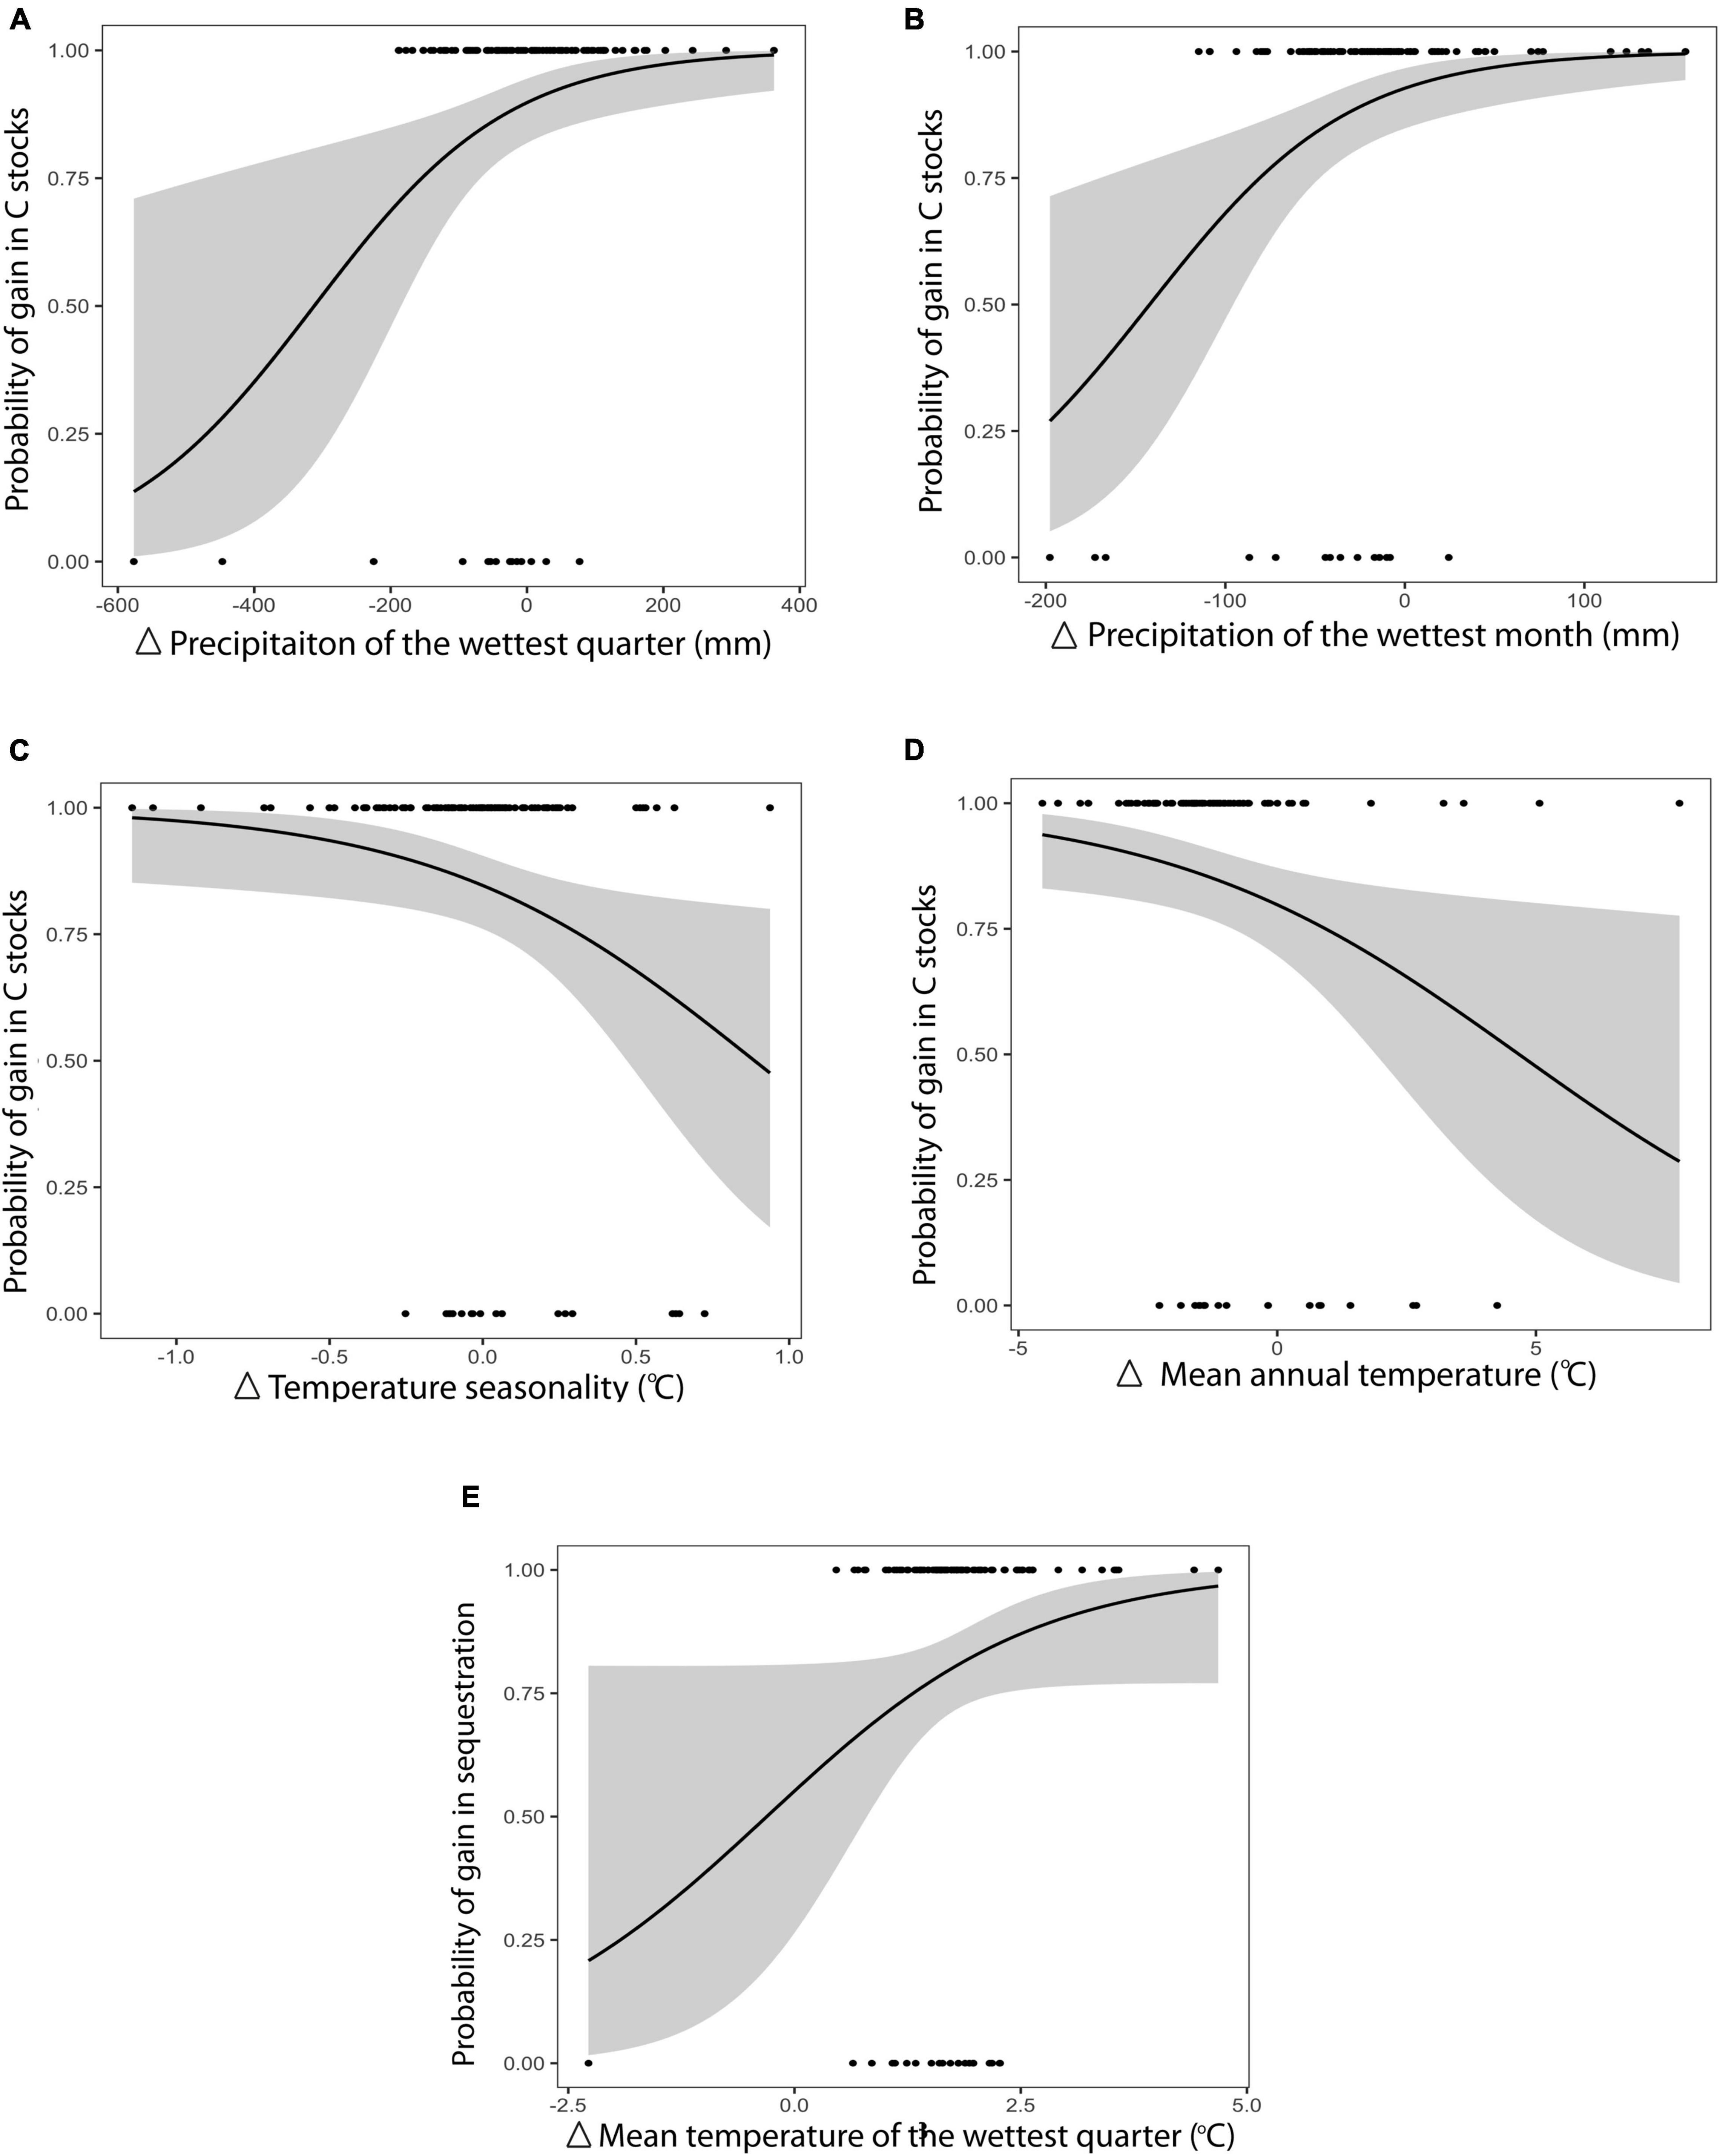
Figure 2. Probability of countries experiencing gains in mangrove C stocks with change in twenty-first century climate. (A,B) Refer to significant differences under the “business as usual” scenario (SSP245), (C,D) refer to significant differences under the high emissions scenario (SSP585) and (E) refers to sequestration rates. Temperature seasonality refers to the annual variation of temperature. Black lines are the mean probability, while shaded areas represent 95% confidence intervals.
Global emissions from mangrove deforestation from 1980 to 2000 were more than three-times higher than those estimated from 2000 onward (Figure 3). Annual rates of mangrove deforestation dropped from 0.99% in the 1980’s to 0.83% from in the 1990’s, resulting in global emissions of 193.2 ± 44.4 Tg CO2e yr–1 and 149.6 ± 33.3 Tg CO2e yr–1, respectively (Figures 3A,B). Emissions then dropped to 8.8 ± 2.0 Tg CO2e yr–1 (0.24% annual deforestation) between 2000 and 2010 (Figure 3C). To put that value into perspective, annual emissions from mangrove deforestation from 2000 to 2010 were 5.44–11.97% of total present day CSR. If countries continue current rates of mangrove deforestation (global average of 0.19%) from 2012 to 2095, a total of 678.50 ± 151.32 Tg CO2e will be emitted due to mangrove deforestation, equivalent to mean global emissions of 8.18 ± 1.83 Tg CO2e yr–1. From 2012 to 2095, the top 23 emitting countries could account for over 90% of predicted global emissions from mangrove deforestation (Supplementary Table 1), with four countries (Indonesia, Brazil, Papua New Guinea and Malaysia) accounting for over 50% of all future emissions (Supplementary Table 2).
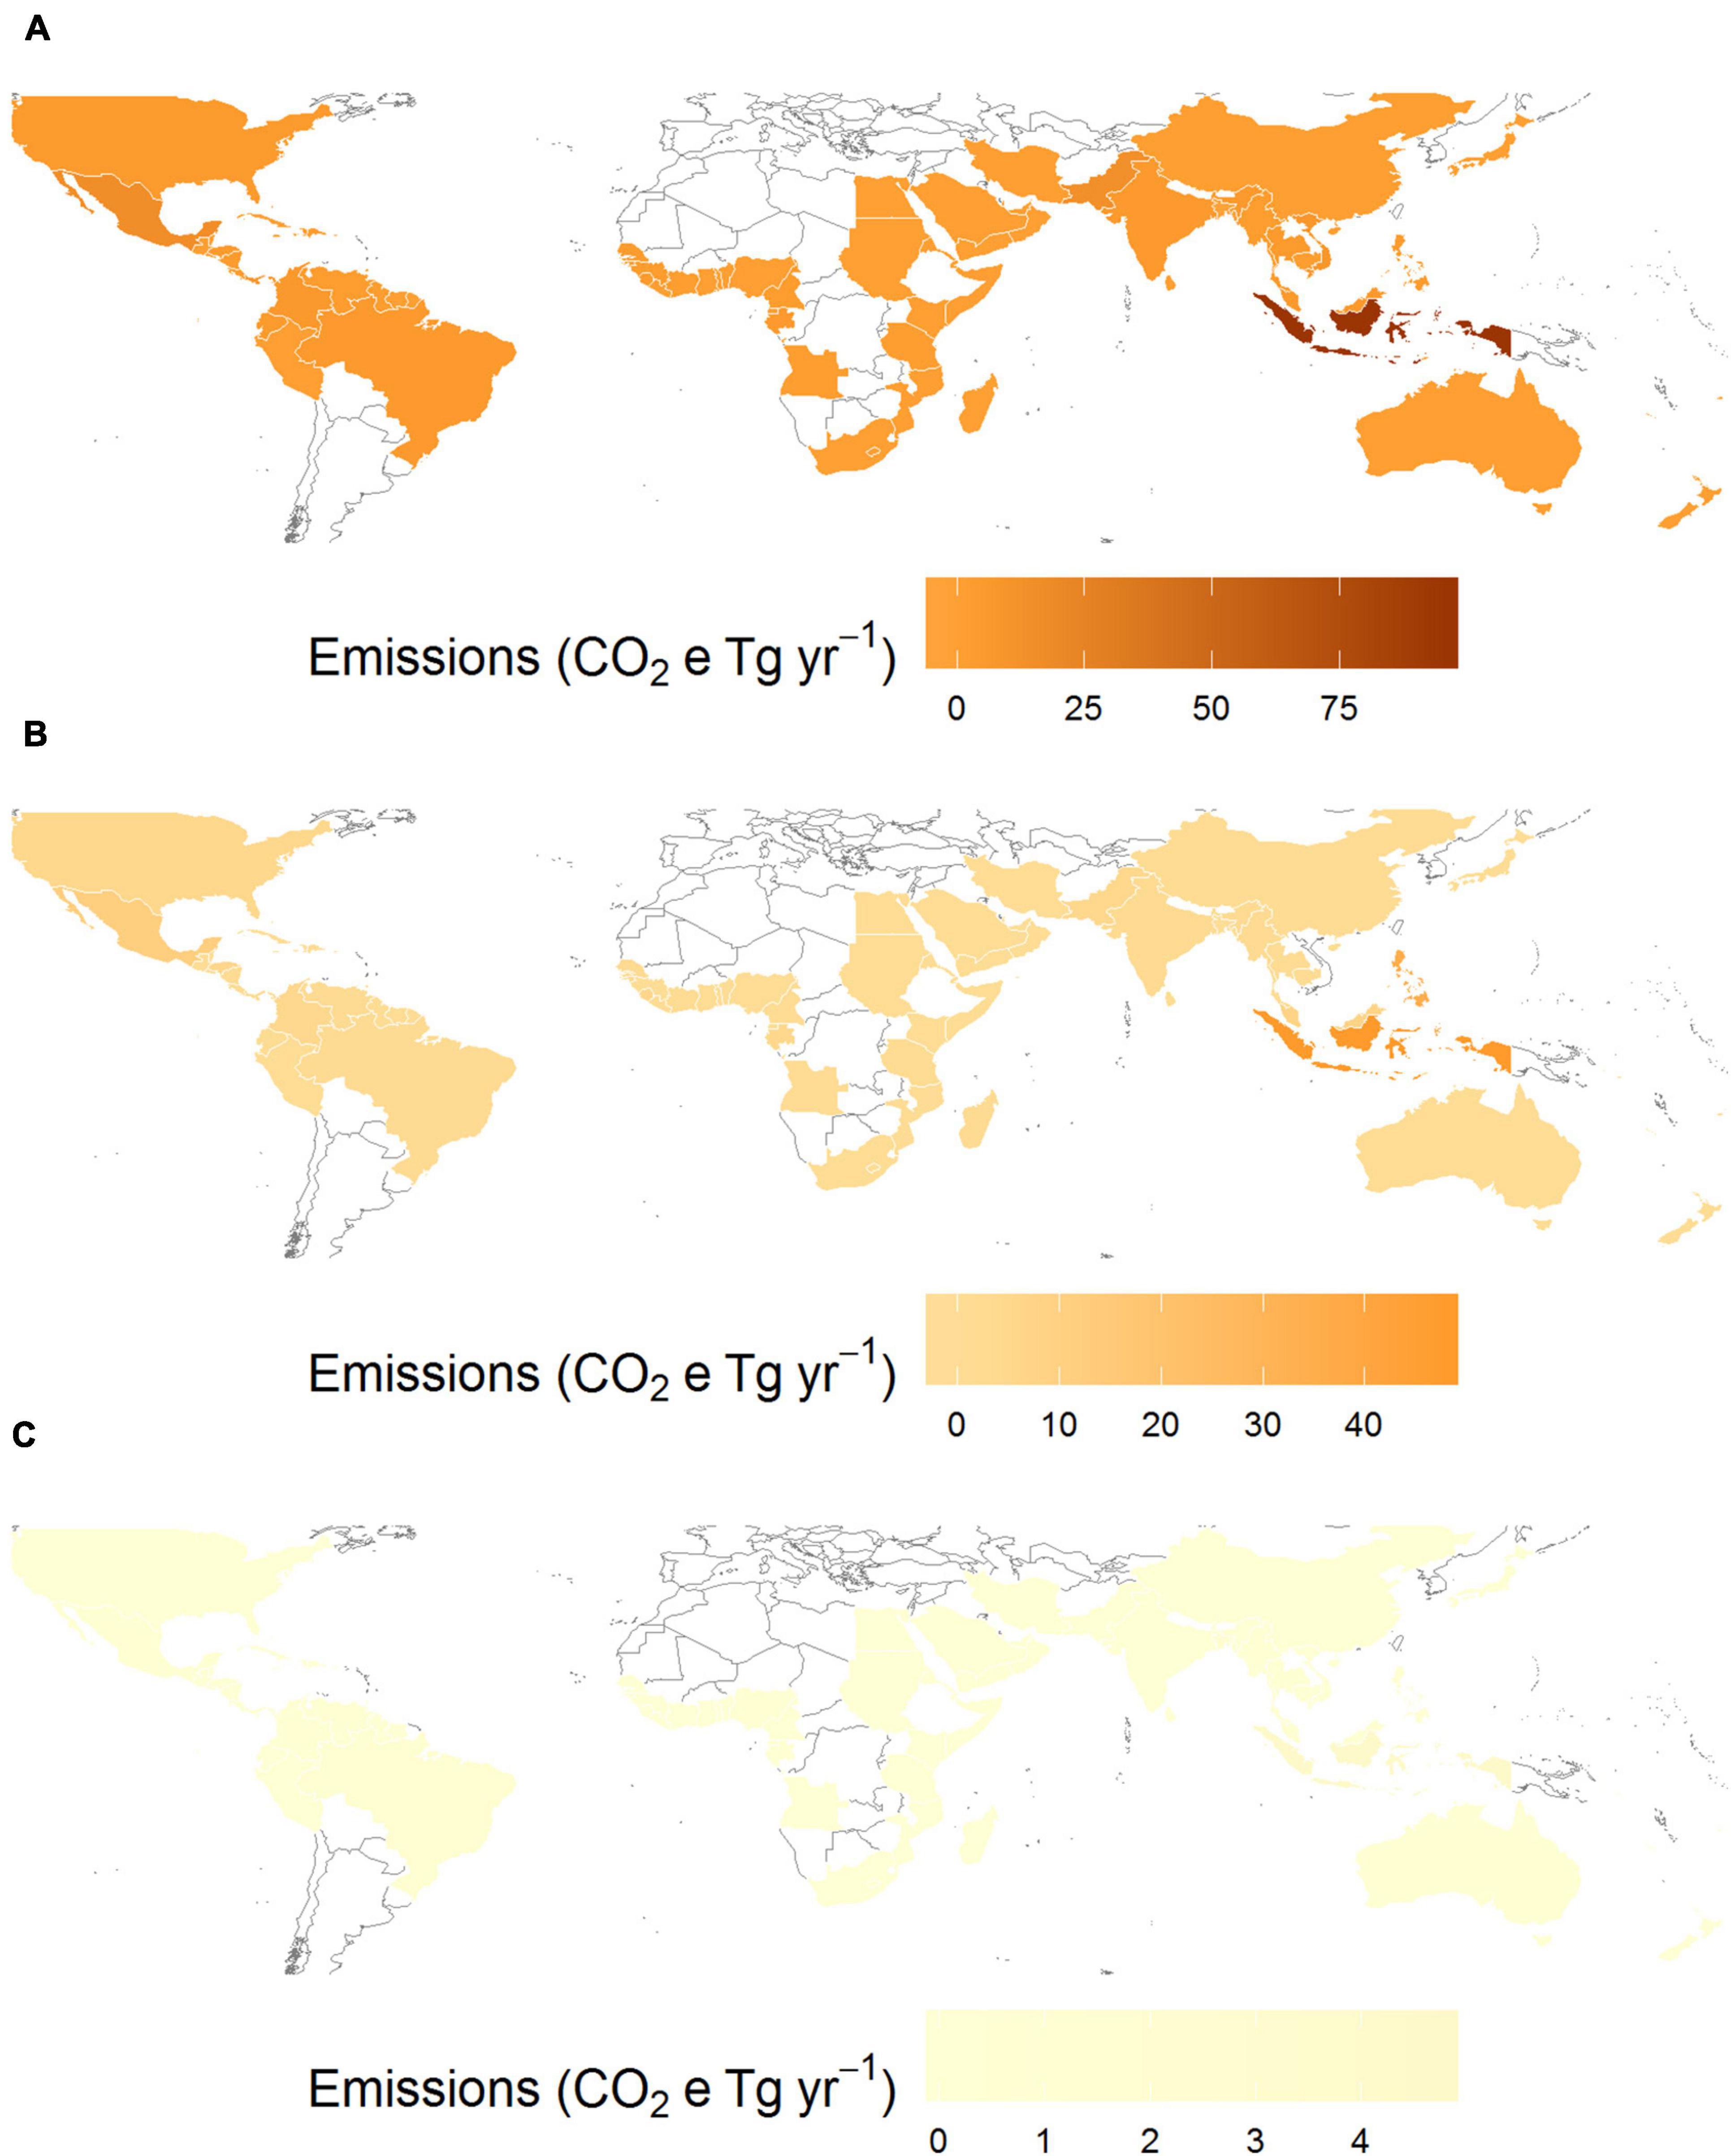
Figure 3. Decadal global CO2e emissions from mangrove deforestation from (A) 1980; (B) 1990 and (C) 2000.
Our projections showed that, globally, increases in total C stocks (biomass + soil) induced by climate change would exceed emissions from mangrove deforestation between 2012 and 2095 (Table 3). Under a “business as usual” climate scenario these net gains represent an increase of 7.05 ± 7.89% (SSP245) or 7.71 ± 9.47% under a high-end scenario (SSP585) of present day global total C stocks. Total global losses from mangrove deforestation from 2012 to 2095 (Table 1) were estimated to be 61.4 ± 10.1% (SSP245) or 55.6 ± 9.1% (SSP585) of the potential gains in C stocks due to climate change. In contrast, CSR were forecast to decline by 2.60 ± 3.57% under scenario SSP245 and by 6.44 ± 3.63% under scenario SSP585 (Table 1).
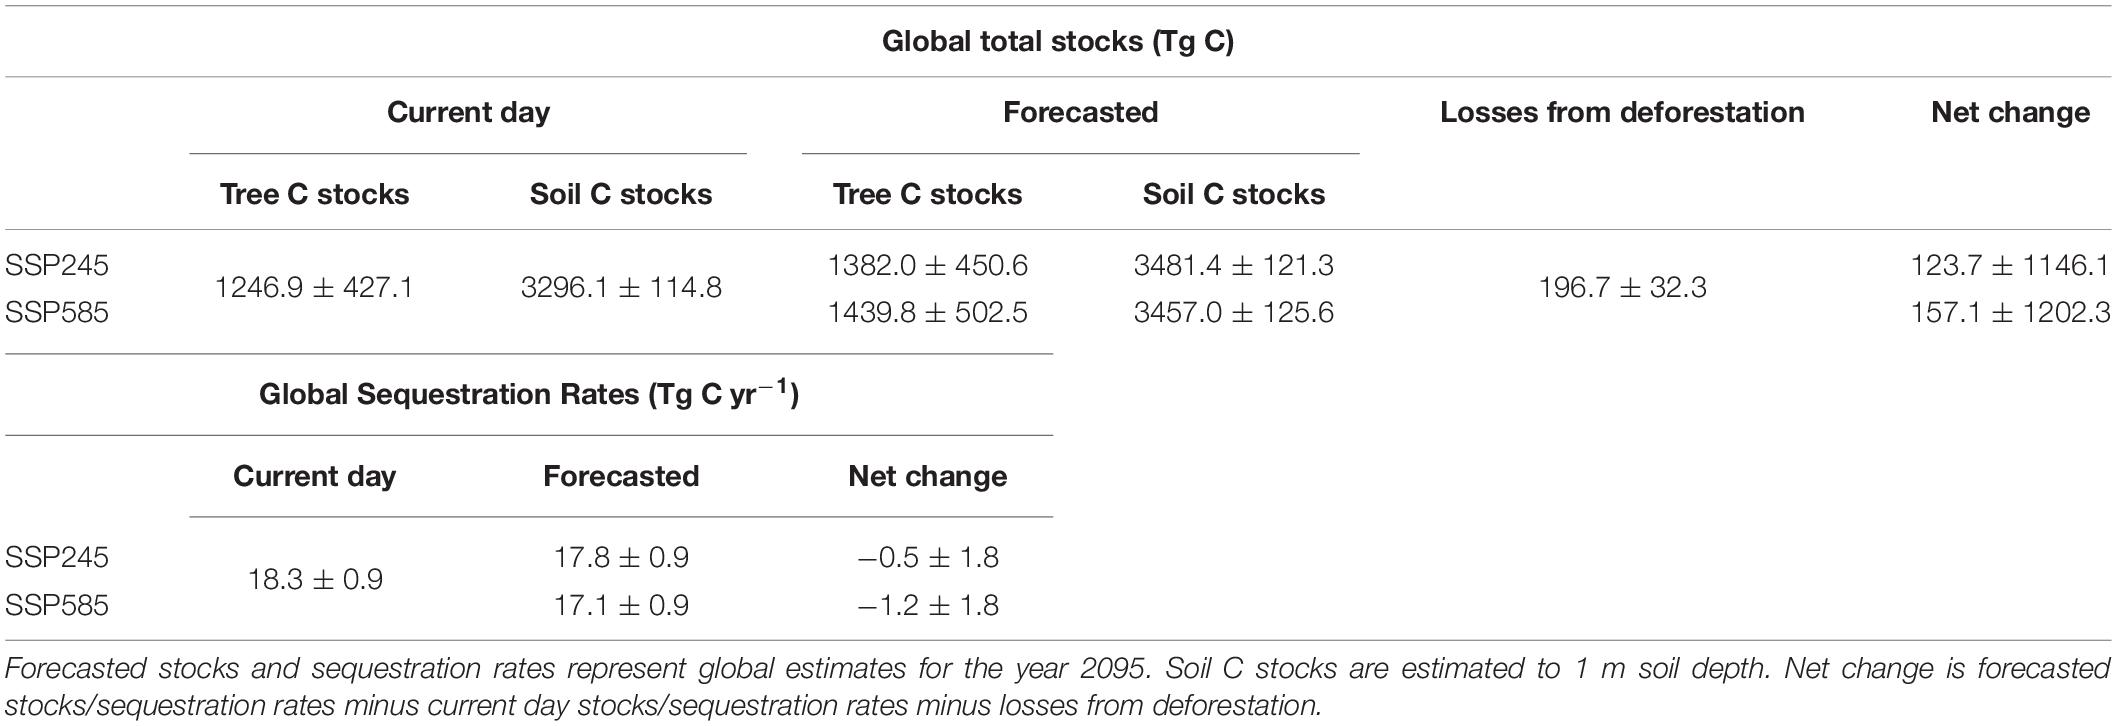
Table 3. Mean ± 2 standard errors of the net effects of climate change and mangrove deforestation on total global mangrove carbon stocks and sequestration rates.
Our study predicted a global net increase in mangrove C stocks under two climate projections (SSP245 and SSP585). Predicted climate change in Mainland Southeast Asia and southern Brazil resulted in lower C stocks, whilst higher C stocks were predicted in the Caribbean, the Malay Archipelago, Australia, and West and East Africa (Supplementary Figure 2). Our results identify particularly mangrove C rich countries where significant gains will occur and can reinforce the value of mangroves as a practical tool for offsetting emissions to national governments. Under a “business as usual” scenario (SSP245), Indonesia, Malaysia, Cuba and Nigeria, all of which are currently in the top 10 mangrove holding countries (Hamilton and Casey, 2016), could hold > 10% higher C stocks than at present (Table 2). Under the high emissions scenario (SSP585), these countries plus the United States and Australia would have > 10% higher total C stocks (Table 2). These nations’ C stocks would also see significant benefit from reduced mangrove deforestation. The Malay Archipelago in particular, could emit 774.1 Tg CO2e by 2100 from mangrove clearing and conversion to agri/aquaculture (Adame et al., 2021). Projections of C stocks in the current study are only to 1 m soil depth and are likely to be underestimates. Global mangrove soil C stocks to 2 m soil depth have been estimated to be almost double that of 1 m depth (Sanderman et al., 2018). Hence emissions from mangrove deforestation reported here (678.50 ± 151.32 Tg CO2e from 2012 to 2095) are also likely to be underestimated. Other studies have projected up to 3,392 Tg CO2e emissions by 2100, with 712 Tg CO2e being lost in the West Coral Triangle alone (Adame et al., 2021).
Despite an overall gain in C stocks, a likely decrease in global soil sequestration rates (CSR) was predicted under both climate projections (SSP245 and SSP585), with a different spatial distribution to predicted gains in C stocks; depressed CSR were mainly forecast in the Malay Archipelago and the Southern Caribbean (Supplementary Figure 2). More than half of the top 20 mangrove holding countries would experience decreases in CSR. Some of these losses will be significant, Panama’s annual CSR could reduce by 20.93 ± 2.83% under SSP245 or over a quarter (25.77 ± 2.92%) under SSP585 (Table 2). These reductions may be compounded by emissions from erosion, which is expected to be the main driver for mangrove losses on the Caribbean coast of Panama by 2100 (Adame et al., 2021). Malaysia and Myanmar could experience total reductions in CSR by 17.43 and 21.96%, respectively (Table 2). These two countries’ future emissions from mangrove losses are also expected to be largely driven by land-use change to agri/aquaculture (Adame et al., 2021) and would exacerbate the climate driven reductions in CSR. On a more positive note, even though overall reductions in global CSR were predicted, our study suggests global mangrove CSR has previously been underestimated. Our estimate of CSR (18.3 Tg C yr–1) is more than double that of the most recent previous estimate (Alongi, 2020), which used the same global mangrove extent as us (8.6 Tg C yr–1, mangrove extent: ∼83,000 km2). Alongi (2020) used a median CSR value (103 gC m2 a–1) obtained from a literature study and multiplied this by the global coverage as opposed to our spatial modeling approach. The approach used by Alongi (2020) assumed all mangroves will have the same CSR, even though it has been shown to vary widely (1.0–1,722 gC m2 a–1) (Alongi, 2020). When global mangrove extent is standardized to 83,000 km2, our CSR calculation is higher than most previous estimates (range: 8.3–18.8 Tg C yr–1) (Chmura et al., 2003; Bouillon et al., 2008; McLeod et al., 2011; Breithaupt et al., 2012; Alongi, 2020). Mangroves have the ability to increase soil elevation, thus increasing soil C stores and, up to a point, keep pace with sea level rise (Ezcurra et al., 2016). Coastal wetlands that experienced rapid relative sea level rise (RSLR) during recent millennia have significantly greater soil organic carbon density than coastlines where relative sea level was stable (Rogers et al., 2019) and RSLR is considered to be an important driver in predicted increases in wetland soil organic carbon accumulation rates (Wang et al., 2020). Even though sediment accretion and increased surface elevation may reduce coastal flooding as a result of climate change driven sea level rise, accretion rates in mangroves are not likely to compensate for increases in sea level of greater than 6.1 mm yr–1 (Saintilan et al., 2020). As a result of the approach we used, we have been able to capture spatial variation in CSR and produce country-specific estimates, including those where CSR data are currently unavailable. Generally, model predictions have been shown to vary considerably from the IPCC’s default estimates of greenhouse gas inventories, likely as a result of applying model predictions to locations where in situ measurements have not been taken, as opposed to applying a mean across all global mangroves.
Recent work has suggested higher temperatures would have “minimal impact” on organic carbon stocks (Macreadie et al., 2019). Our study showed that, under a high-emissions scenario, temperature increases would be high enough in some countries to impact national scale total C stocks and CSR. Under a business as usual scenario, temperature increases were not significant enough to detriment national scale mangrove C stocks. Peak photosynthesis productivity reduces above 38°C and increased temperatures would also increase evaporation rates which will in turn increase salinity stress (Clough and Rews, 1982). Our modeling showed, under SSP585, mean annual air temperatures could increase from 29.7 to 32.5°C, while maximum temperature of the warmest month could be as high as 44.2°C. Increases in mean temperatures and their annual variability, under the high-end scenario (SSP585), significantly increases the probability of a country experiencing losses in mangrove C stocks (Figures 2C,D). This is likely as a result of our study giving mangrove C stocks from arid regions at the climatic extremes of global mangrove distribution greater representation than previous modeling efforts. Apart from Sanderman et al. (2018), data from arid regions such as those of North Africa and the Arabian Peninsula, where mangroves have low organic carbon stocks and CSR (Eid and Shaltout, 2016; Almahasheer et al., 2017; Schile et al., 2017; Chatting et al., 2020), have not been incorporated into global models (Jardine and Siikamäki, 2014; Rovai et al., 2018).
Model predictions that global C stocks will increase while CSR will decrease may seem contradictory. However, total C stocks here are only quantified for the top 1 m of soil depth, in effect a measure of soil C density, with any change being the balance of gain by sequestration and losses by erosion and mineralization. Hence modeled C stocks may increase if climatic conditions result in increased soil C density, even if CSR declines. Over and above this effect, stocks throughout the whole soil depth profile could still increase substantially over time as more soil is accreted, even with lower sequestration rates (Alongi, 2012, 2015). Differences in estimates of global total mangrove C stocks and CSR largely arise from different methods calculating global mangrove extent (Breithaupt et al., 2012; Hamilton and Friess, 2018; Sanderman et al., 2018; Alongi, 2020). When projecting soil C stocks globally, our approach assumed pixels either had 100 or 0% mangrove coverage, similarly to Sanderman et al. (2018). However, this is unlike Hamilton and Friess (2018), where mangrove coverage was estimated to range from 0 to 100% per pixel. Global CSR estimates have ranged from 8.6 to 38.0 Tg C yr–1 (Twilley et al., 1992; Jennerjahn and Ittekkot, 2002; Chmura et al., 2003; Duarte et al., 2005; Bouillon et al., 2008; Alongi, 2009, 2020; Breithaupt et al., 2012), where differences are mainly due to varying global mangrove extents used in calculation. Additional uncertainties arise when estimating change in C stocks and CSR at the end of the twenty first century. Our study assumed constant mangrove coverage from 2012 to 2095, however, on a global scale, mangroves in temperate regions have been forecast to expand to higher latitudes (Saintilan et al., 2014). Also, the interaction between sea level rise and coastal human development will likely influence mangroves ability to migrate landward in response to sea level rise (Lovelock and Reef, 2020). Moreover, by subtracting future from present day C stocks and CSR and not incorporating estimated mangrove deforestation rates, this study assumed a constant rate of change from 2012 to 2095 and will lead to overestimates of C stocks and CSR. While this approach may be an oversimplification of the complex process by which mangroves sequester and store C, calculations of future estimates apply the same logic as has been performed for numerous estimates of present day C stocks (Hutchison et al., 2014; Hamilton and Friess, 2018; Rovai et al., 2018; Sanderman et al., 2018).
In addition to higher soil sequestration rates, our estimates of C emissions from mangrove deforestation between 2000 and 2010 are at the lower end of the 6.60–29.80 Tg CO2e yr–1 previously reported (Hamilton and Friess, 2018; Sanderman et al., 2018). A combination of higher global soil C sequestration rates than previously reported, coupled with comparatively low emissions estimates associated with mangrove deforestation (0.24% annually), largely due to significant reductions in deforestation rates, means that C emissions from mangrove deforestation are now < 12% of global annual soil sequestration rates. By contrast, in the 1980’s global emissions from mangrove deforestation were almost three-times global mangrove annual soil C sequestration (Figure 3). Despite the great uncertainties surrounding historical estimates of mangrove deforestation rates (Friess and Webb, 2014), this decrease since the 1980’s is a noteworthy success for mangrove conservation globally. Moreover, at a national level, our estimates show that, for many countries, rates of C sequestration in mangrove soils could be higher than previously thought, so that governments may choose to place greater value on their mangroves as a means of offsetting emissions. The outcomes of this modeling study demonstrate the positive effect of future mangrove protection and restoration on national C budgets, providing governments useful data on their mangrove soil sequestration rates in comparison to likely emissions and C stocks, which have not previously been available. Reducing emissions from mangrove deforestation is an achievable way to help countries meet their Nationally Determined Contributions (NDC’s) to the 2021 UN Climate Change Conference (COP26) and reach carbon neutrality. Indonesia has pledged almost 60% of their unconditional emissions reductions by 2030 to come from the forestry and other land use sector (Ministry of Environment and Forestry Directorate General of Climate Change, 2021). Globally, emissions from mangrove deforestation have been estimated to be as high as 19% of global total deforestation emissions (Pendelton et al., 2012) and blue carbon ecosystem restoration is estimated to be 3% of annual global fossil fuel emissions (Macreadie et al., 2021). Financing of mangrove conservation is a viable option for offsetting emissions where countries cannot directly reduce their own emissions (Zeng et al., 2021). Selling carbon credits gained from avoided mangrove deforestation in voluntary carbon markets has been shown to have similar returns on investment to investing in traditional asset classes (Cameron et al., 2019). Mangroves alone will not mitigate fully against climate change, however, their conservation can be used as a practical tool to facilitate countries moving toward carbon neutrality, as well as securing additional co-benefits through the enhancement of mangrove-derived ecosystem services.
The original contributions presented in the study are included in the article/Supplementary Material, further inquiries can be directed to the corresponding author/s.
MC, LL, MW, MWS, and IA-M conceived the study. MC and YSH performed all the modeling and statistical analyses. MC, LL, MW, MWS, HK, and IA-M wrote the manuscript draft. LL, MW, MWS, HK, and IA-M contributed to design of the work and critical evaluation of the manuscript during the extensive drafting process. All authors helped write and edit the final version of the manuscript.
MC, LL, MW, MWS, IA-M, HK, and YSH were supported by the Qatar National Research Fund, National Priorities Research Program (NPRP) (Grant No. 7–1302–1–242), “Ecological processes underlying ecosystem function in arid mangroves.”
The authors declare that the research was conducted in the absence of any commercial or financial relationships that could be construed as a potential conflict of interest.
All claims expressed in this article are solely those of the authors and do not necessarily represent those of their affiliated organizations, or those of the publisher, the editors and the reviewers. Any product that may be evaluated in this article, or claim that may be made by its manufacturer, is not guaranteed or endorsed by the publisher.
MC would like to thank the Environmental Science Centre at Qatar University for their continued support of his research endeavors.
The Supplementary Material for this article can be found online at: https://www.frontiersin.org/articles/10.3389/fmars.2022.781876/full#supplementary-material
Supplementary Figure 1 | Random forest variable importance and their % increase in MSE. These values refer to the % increase in the model mean squared error (MSE) when each predictor is excluded from the dataset for (A) soil C stocks and (B) soil C sequestration rates.
Supplementary Figure 2 | Estimated change in global C stocks in mangrove (A) trees and (B) soils, and sequestration rates (C) by the year 2095. As predicted from mean values from means weighted forecast climate datasets. Tree C was estimated from the predictive model developed by Hutchison et al. (2014), and the soil C and sequestration estimates were from modeling by the current study.
Supplementary Data Sheet 1 | Secondary literature data of soil carbon used in modeling analysis.
Supplementary Data Sheet 2 | Secondary literature data of soil sequestration rates used in modeling analysis.
Adame, M. F., Brown, C. J., Bejarano, M., Herrera-Silveira, J. A., Ezcurra, P., Kauffman, J. B., et al. (2018). The undervalued contribution of mangrove protection in Mexico to carbon emission targets. Conserv. Lett. 11:e12445. doi: 10.1111/conl.12445
Adame, M. F., Connolly, R. M., Turschwell, M. P., Lovelock, C. E., Fatoyinbo, T., Lagomasino, D., et al. (2021). Future carbon emissions from global mangrove forest loss. Glob. Chang. Biol. 27, 2856–2866. doi: 10.1111/gcb.15571
Almahasheer, H., Serrano, O., Duarte, C. M., Arias-Ortiz, A., Masque, P., and Irigoien, X. (2017). Low Carbon sink capacity of Red Sea mangroves. Sci. Rep. 7:9700. doi: 10.1038/s41598-017-10424-9
Alongi, D. M. (2002). Present state and future of the world’s mangrove forests. Environ. Conserv. 29, 331–349. doi: 10.1017/S0376892902000231
Alongi, D. M. (2009). The Energetics of Mangrove Forests. New York: Springer Science & Business Media, doi: 10.1007/978-1-4020-4271-3
Alongi, D. M. (2012). Carbon sequestration in mangrove forests. Carbon Manag. 3, 313–322. doi: 10.4155/cmt.12.20
Alongi, D. M. (2015). The Impact of Climate Change on Mangrove Forests. Curr. Clim. Chang. Rep. 1, 30–39. doi: 10.1007/s40641-015-0002-x
Alongi, D. M. (2020). Global Significance of Mangrove Blue Carbon in Climate Change Mitigation (Version 1). Science 2:57. doi: 10.3390/sci2030057
Atwood, T. B., Connolly, R. M., Almahasheer, H., Carnell, P. E., Duarte, C. M., Lewis, C. J. E., et al. (2017). Global patterns in mangrove soil carbon stocks and losses. Nat. Clim. Chang. 7, 523–528. doi: 10.1038/nclimate3326
Blankespoor, B., Dasgupta, S., and Laplante, B. (2014). Sea level rise and coastal wetlands. Ambio 43, 996–1005. doi: 10.17226/10590
Bouillon, S., Borges, A. V., Castañeda-Moya, E., Diele, K., Dittmar, T., Duke, N. C., et al. (2008). Mangrove production and carbon sinks: a revision of global budget estimates. Global Biogeochem. Cycles 22, 1–12. doi: 10.1029/2007GB003052
Breithaupt, J. L., Smoak, J. M., Smith, T. J., Sanders, C. J., and Hoare, A. (2012). Organic carbon burial rates in mangrove sediments: strengthening the global budget. Global Biogeochem. Cycles 26:GB3011. doi: 10.1029/2012GB004375
Cameron, C., Hutley, L. B., Friess, D. A., and Brown, B. (2019). High greenhouse gas emissions mitigation benefits from mangrove rehabilitation in Sulawesi, Indonesia. Ecosyst. Serv. 40:101035. doi: 10.1016/j.ecoser.2019.101035
Carrere, L., Lyard, F., Cancet, M., Guillot, A., and Roblou, L. (2013). FES 2012: a new global tidal model taking advantage of nearly 20 years of altimetry. 20 Years Prog. Radar Altimetry 710:13.
Chatting, M., Le Vay, L., Walton, M., Skov, M. W., Kennedy, H., Wilson, S., et al. (2020). Mangrove carbon stocks and biomass partitioning in an extreme environment. Estuar. Coast. Shelf Sci. 244:106940. doi: 10.1016/j.ecss.2020.106940
Chmura, G. L., Anisfeld, S. C., Cahoon, D. R., and Lynch, J. C. (2003). Global carbon sequestration in tidal, saline wetland soils. Global Biogeochem. Cycles 17:1111. doi: 10.1029/2002gb001917
Clough, B. F., and Rews, T. J. (1982). “Physiological Processes in Mangroves,” in Mangrove Ecosystems in Australia: Structure, Function and Management, ed. B. F. Clough (Canberra: Australian Institute of Marine Science in Association with Australian Natural University Press), 195–300.
Cooray, P. L. I. G. M., Kodikara, K. A. S., Kumara, M. P., Jayasinghe, U. I., Madarasinghe, S. K., Dahdouh-Guebas, F., et al. (2021). Climate and intertidal zonation drive variability in the carbon stocks of Sri Lankan mangrove forests. Geoderma 389:114929.
Donato, D. C., Kauffman, J. B., Murdiyarso, D., Kurnianto, S., Stidham, M., and Kanninen, M. (2011). Mangroves among the most carbon-rich forests in the tropics. Nat. Geosci. 4, 293–297. doi: 10.1038/ngeo1123
Duarte, C. M., Losada, I. J., Hendriks, I. E., Mazarrasa, I., and Marbà, N. (2013). The role of coastal plant communities for climate change mitigation and adaptation. Nat. Clim. Chang. 3, 961–968. doi: 10.1038/nclimate1970
Duarte, C. M., Middelburg, J. J., and Caraco, N. (2005). Major role of marine vegetation on the oceanic carbon cycle. Biogeosciences 2, 1–8. doi: 10.5194/bg-2-1-2005
Duke, N. C., Meynecke, J. O., Dittmann, S., Ellison, A. M., Anger, K., Berger, U., et al. (2007). A World Without Mangroves? Science 317, 41b–42b. doi: 10.1126/science.317.5834.41b
Eid, E. M., and Shaltout, K. H. (2016). Distribution of soil organic carbon in the mangrove Avicennia marina (Forssk.) Vierh. along the Egyptian Red Sea Coast. Reg. Stud. Mar. Sci. 3, 76–82. doi: 10.1016/j.rsma.2015.05.006
Ezcurra, P., Ezcurra, E., Garcillán, P. P., Costa, M. T., and Aburto-Oropeza, O. (2016). Coastal landforms and accumulation of mangrove peat increase carbon sequestration and storage. Proc. Natl. Acad. Sci. 113, 4404–4409. doi: 10.1073/pnas.1519774113
Fekete, B. M., Vörösmarty, C. J., and Grabs, W. (2002). High-resolution fields of global runoff combining observed river discharge and simulated water balances. Global Biogeochem. Cycles 16, 15–11. doi: 10.1029/1999gb001254
Fourqurean, J. W., Duarte, C. M., Kennedy, H., Marbà, N., Holmer, M., Mateo, M. A., et al. (2012). Seagrass ecosystems as a globally significant carbon stock. Nat. Geosci. 5, 505–509. doi: 10.1038/ngeo1477
Friess, D. A., and Webb, E. L. (2014). Variability in mangrove change estimates and implications for the assessment of ecosystem service provision. Glob. Ecol. Biogeogr. 23, 715–725. doi: 10.1111/geb.12140
Giorgi, F., Raffaele, F., and Coppola, E. (2019). The response of precipitation characteristics to global warming from climate projections. Earth Syst. Dyn. 10, 73–89. doi: 10.5194/esd-10-73-2019
Giri, C., Ochieng, E., Tieszen, L. L., Zhu, Z., Singh, A., Loveland, T., et al. (2011). Status and distribution of mangrove forests of the world using earth observation satellite data. Glob. Ecol. Biogeogr. 20, 154–159. doi: 10.1111/j.1466-8238.2010.00584.x
Hamilton, S., and Casey, D. (2016). Creation of a high spatiotemporal resolution global database of continuous mangrove forest cover. Glob. Ecol. Biogeogr. 25, 729–738.
Hamilton, S. E., and Friess, D. A. (2018). Global carbon stocks and potential emissions due to mangrove deforestation from 2000 to 2012. Nat. Clim. Chang. 8, 240–244. doi: 10.1038/s41558-018-0090-4
Hutchison, J., Manica, A., Swetnam, R., Balmford, A., and Spalding, M. (2014). Predicting global patterns in mangrove forest biomass. Conserv. Lett. 7, 233–240. doi: 10.1111/conl.12060
Jardine, S. L., and Siikamäki, J. V. (2014). A global predictive model of carbon in mangrove soils. Environ. Res. Lett. 9:104013. doi: 10.1088/1748-9326/9/10/104013
Jennerjahn, T. C., and Ittekkot, V. (2002). Relevance of mangroves for the production and deposition of organic matter along tropical continental margins. Naturwissenschaften 89, 23–30. doi: 10.1007/s00114-001-0283-x
Kalnay, E., Kanamitsu, M., Kistler, R., Collins, W., Deaven, D., Gandin, L., et al. (1996). The NCEP/NCAR 40-year reanalysis project. Bull. Am. Meteorol. Soc. 77, 437–495. doi: 10.1175/1520-04771996077<0437:TNYRP<2.0.CO;2
Kauffman, B. J., Arifanti, V. B., Hernández Trejo, H., Jesús García, M. D. C., Norfolk, J., Cifuentes, M., et al. (2017). The jumbo carbon footprint of a shrimp: carbon losses from mangrove deforestation. Front. Ecol. Environ. 15, 183–188. doi: 10.1002/fee.1482
Kauffman, J. B., and Bhomia, R. K. (2017). Ecosystem carbon stocks of mangroves across broad environmental gradients in West-Central Africa: global and regional comparisons. PLoS One 12:e0187749. doi: 10.1371/journal.pone.0187749
Kauffman, J. B., Heider, C., Norfolk, J., and Payton, F. (2014). Carbon stocks of intact mangroves and carbon emissions arising from their conversion in the Dominican Republic. Ecol. Appl. 24, 518–527. doi: 10.1890/13-0640.1
Kock, N., and Lynn, G. S. (2012). Lateral collinearity and misleading results in variance-based SEM: an illustration and recommendations. J. Assoc. Inf. Syst. 13, 546–580. doi: 10.17705/1jais.00302
Lang’at, J. K. S., Kairo, J. G., Mencuccini, M., Bouillon, S., Skov, M. W., Waldron, S., et al. (2014). Rapid losses of surface elevation following tree girdling and cutting in tropical mangroves. PLoS One 9:e0118334. doi: 10.1371/journal.pone.0107868
Lovelock, C. E., and Reef, R. (2020). Variable Impacts of Climate Change on Blue Carbon. One Earth 3, 195–211. doi: 10.1016/j.oneear.2020.07.010
Lovelock, C. E., Ruess, R. W., and Feller, I. C. (2011). Co2 efflux from cleared mangrove peat. PLoS One 6:e21279. doi: 10.1371/journal.pone.0021279
Luo, M., Liu, T., Meng, F., Duan, Y., Frankl, A., Bao, A., et al. (2018). Comparing bias correction methods used in downscaling precipitation and temperature from regional climate models: a case study from the Kaidu River Basin in Western China. Water 10:1046. doi: 10.3390/w10081046
Macreadie, P., Costa, M., Atwood, T., Friess, D., Kelleway, J., Kennedy, H., et al. (2021). Blue carbon as a natural climate solution. Nat. Rev. Earth Environ. 2, 826–839. doi: 10.1038/s43017-021-00224-1
Macreadie, P. I., Anton, A., Raven, J. A., Beaumont, N., Connolly, R. M., Friess, D. A., et al. (2019). The future of Blue Carbon science. Nat. Commun. 10:3998. doi: 10.1038/s41467-019-11693-w
Martín-Martín, A., Orduna-Malea, E., Thelwall, M., and Delgado López-Cózar, E. (2018). Google Scholar, Web of Science, and Scopus: a systematic comparison of citations in 252 subject categories. J. Informetr. 12, 1160–1177. doi: 10.1016/j.joi.2018.09.002
Masih, A. (2019). “Application of Random Forest Algorithm to Predict the Atmospheric Concentration of NO2,” in Conference: 2019 Ural Symposium on Biomedical Engineering, Radioelectronics and Information Technology (USBEREIT), (Piscataway: IEEE), 252–255. doi: 10.1109/USBEREIT.2019.8736679
McKee, K. L., Cahoon, D. R., and Feller, I. C. (2007). Caribbean mangroves adjust to rising sea level through biotic controls on change in soil elevation. Glob. Ecol. Biogeogr. 16, 545–556. doi: 10.1111/j.1466-8238.2007.00317.x
McLeod, E., Chmura, G. L., Bouillon, S., Salm, R., Björk, M., Duarte, C. M., et al. (2011). A blueprint for blue carbon: toward an improved understanding of the role of vegetated coastal habitats in sequestering CO2. Front. Ecol. Environ. 9, 552–560. doi: 10.1890/110004
Ministry of Environment and Forestry Directorate General of Climate Change (2021). Updated Nationally Determined Contribution Republic of Indonesia 2021. Gedung Manggala: Ministry of Environment and Forestry Directorate General of Climate Change.
Muhling, B., Lee, S., Lamkin, J., and Liu, Y. (2011). Predicting the effects of climate change on bluefin tuna (Thunnus thynnus) spawning habitat in the Gulf of Mexico. ICES J. Mar. Sci. 68, 1051–1062. doi: 10.1093/icesjms/fsr008
Murdiyarso, D., Purbopuspito, J., Kauffman, J. B., Warren, M. W., Sasmito, S. D., Donato, D. C., et al. (2015). The potential of Indonesian mangrove forests for global climate change mitigation. Nat. Clim. Chang. 5, 1089–1092. doi: 10.1038/nclimate2734
O’Donnell, M. S., and Ignizio, D. A. (2012). Bioclimatic Predictors for Supporting Ecological Applications in the Conterminous United States. U.S. Geol. Surv. 691:10. doi: 10.1016/j.mimet.2011.04.001
Pendelton, L., Donato, D. C., Murray, B. C., Crooks, S., Jenkins, A. W., Sifleet, S., et al. (2012). Estimating Global “Blue Carbon” Emissions from Conversion and Degradation of Vegetated Coastal Ecosystems. PLoS One 7:e43542. doi: 10.1371/journal.pone.0043542
Riahi, K., van Vuuren, D. P., Kriegler, E., Edmonds, J., O’Neill, B. C., Fujimori, S., et al. (2017). The Shared Socioeconomic Pathways and their energy, land use, and greenhouse gas emissions implications: an overview. Glob. Environ. Chang. 42, 153–168. doi: 10.1016/j.gloenvcha.2016.05.009
Richards, D. R., Thompson, B. S., and Wijedasa, L. (2020). Quantifying net loss of global mangrove carbon stocks from 20 years of land cover change. Nat. Commun. 11:4260. doi: 10.1038/s41467-020-18118-z
Rogers, K., Kelleway, J. J., Saintilan, N., Megonigal, J. P., Adams, J. B., Holmquist, J. R., et al. (2019). Wetland carbon storage controlled by millennial-scale variation in relative sea-level rise. Nature 567, 91–95. doi: 10.1038/s41586-019-0951-7
Rovai, A. S., Twilley, R. R., Castañeda-Moya, E., Riul, P., Cifuentes-Jara, M., Manrow-Villalobos, M., et al. (2018). Global controls on carbon storage in mangrove soils. Nat. Clim. Chang. 8, 534–538. doi: 10.1038/s41558-018-0162-5
Saintilan, N., Khan, N. S., Ashe, E., Kelleway, J. J., Rogers, K., Woodroffe, C. D., et al. (2020). Thresholds of mangrove survival under rapid sea level rise. Science 368, 1118–1121. doi: 10.1126/science.aba2656
Saintilan, N., Wilson, N. C., Rogers, K., Rajkaran, A., and Krauss, K. W. (2014). Mangrove expansion and salt marsh decline at mangrove poleward limits. Glob. Chang. Biol. 20, 147–157. doi: 10.1111/gcb.12341
Sanderman, J., Hengl, T., Fiske, G., Solvik, K., Adame, M. F., Benson, L., et al. (2018). A global map of mangrove forest soil carbon at 30 m spatial resolution. Environ. Res. Lett. 13:055002. doi: 10.1088/1748-9326/aabe1c
Sasmito, S. D., Silanpää, M., Hayes, M. A., Bachri, S., Saragi-Sasmito, M. F., Sidik, F., et al. (2019). SWAMP Dataset-Mangrove Soil Carbon-West Papua-2019, V2. Bogor: Center for International Forestry Research (CIFOR). doi: 10.17528/CIFOR/DATA.00192
Schile, L. M., Kauffman, J. B., Crooks, S., Fourqurean, J. W., Glavan, J., and Megonigal, J. P. (2017). Limits on carbon sequestration in arid blue carbon ecosystems. Ecol. Appl. 27, 859–874. doi: 10.1002/eap.1489
Schneider, U., Becker, A., Finger, P., Meyer-Christoffer, A., Rudolf, B., and Ziese, M. (2011). GPCC Full Data Reanalysis Version 6.0 at 0.5°: Monthly Land-Surface Precipitation from Rain-Gauges Built on GTS-Based and Historic Data. doi: 10.5676/DWD_GPCC/FD_M_V7_050
Sheppard, C., Al-Husiani, M., Al-Jamali, F., Al-Yamani, F., Baldwin, R., Bishop, J., et al. (2010). The Gulf: a young sea in decline. Mar. Pollut. Bull. 60, 13–38. doi: 10.1016/j.marpolbul.2009.10.017
Soares, P. M. M., Careto, J. A. M., Cardoso, R. M., Goergen, K., and Trigo, R. M. (2019). Land-Atmosphere Coupling Regimes in a Future Climate in Africa: from Model Evaluation to Projections Based on CORDEX-Africa. J. Geophys. Res. Atmos. 124, 11118–11142. doi: 10.1029/2018JD029473
Taillardat, P., Friess, D. A., and Lupascu, M. (2018). Mangrove blue carbon strategies for climate change mitigation are most effective at the national scale. Biol. Lett. 14:2018025. doi: 10.1098/rsbl.2018.0251
Twilley, R. R., Chen, R. H., and Hargis, T. (1992). Carbon sinks in mangroves and their implications to carbon budget of tropical coastal ecosystems. Water Air Soil Pollut. 64, 265–288. doi: 10.1007/BF00477106
Wang, F., Sanders, C. J., Santos, I. R., Tang, J., Schuerch, M., Kirwan, M. L., et al. (2020). Global blue carbon accumulation in tidal wetlands increases with climate change. Natl. Sci. Rev. 8:nwaa296. doi: 10.1093/nsr/nwaa296
Ward, R. D., Friess, D. A., Day, R. H., and Mackenzie, R. A. (2016). Impacts of climate change on mangrove ecosystems: a region by region overview. Ecosyst. Heal. Sustain. 2:e01211. doi: 10.1002/ehs2.1211
Zeng, Y., Friess, D. A., Sarira, T. V., Siman, K., and Koh, L. P. (2021). Global potential and limits of mangrove blue carbon for climate change mitigation. Curr. Biol. 31, 1737.e–1743.e. doi: 10.1016/j.cub.2021.01.070
Keywords: mangrove carbon stocks, mangrove sequestration rates, blue carbon, soil carbon, mangrove deforestation, mangrove emissions, climate change
Citation: Chatting M, Al-Maslamani I, Walton M, Skov MW, Kennedy H, Husrevoglu YS and Le Vay L (2022) Future Mangrove Carbon Storage Under Climate Change and Deforestation. Front. Mar. Sci. 9:781876. doi: 10.3389/fmars.2022.781876
Received: 23 September 2021; Accepted: 12 January 2022;
Published: 10 February 2022.
Edited by:
Iris Eline Hendriks, Spanish National Research Council (CSIC), SpainReviewed by:
Frida Sidik, Ministry for Marine Affairs and Fisheries of the Republic of Indonesia, IndonesiaCopyright © 2022 Chatting, Al-Maslamani, Walton, Skov, Kennedy, Husrevoglu and Le Vay. This is an open-access article distributed under the terms of the Creative Commons Attribution License (CC BY). The use, distribution or reproduction in other forums is permitted, provided the original author(s) and the copyright owner(s) are credited and that the original publication in this journal is cited, in accordance with accepted academic practice. No use, distribution or reproduction is permitted which does not comply with these terms.
*Correspondence: Ibrahim Al-Maslamani, YWxtYXNsYW1hbmlAcXUuZWR1LnFh
Disclaimer: All claims expressed in this article are solely those of the authors and do not necessarily represent those of their affiliated organizations, or those of the publisher, the editors and the reviewers. Any product that may be evaluated in this article or claim that may be made by its manufacturer is not guaranteed or endorsed by the publisher.
Research integrity at Frontiers
Learn more about the work of our research integrity team to safeguard the quality of each article we publish.