 Anna Linhoss
 Paul Mickle
- 1Department of Biosystems Engineering, Auburn University, Auburn, AL, United States
- 2Northern Gulf Institute, Mississippi State University, Starkville, MS, United States
This work presents the development and validation of a spatially and temporally variable oyster habitat suitability model for the western Mississippi Sound, northern Gulf of Mexico. In the work, we (1) develop an oyster habitat suitability model based on existing conditions in 1 year, (2) forecast habitat suitability throughout the same location in following years, and (3) validate the model using independent data describing field counts of live and recent dead oysters in those following years. The model uses four environmental factors to determine habitat suitability, namely: maximum annual temperature, maximum annual salinity, minimum annual salinity, and minimum annual dissolved oxygen. Overall, the model does not discriminate well between good and poor habitat when the habitat suitability score is less than 0.2; however, when the habitat suitability score is greater than 0.2, there is a high confidence that are more live than recent dead oysters. The results also show that habitat suitability varies by up to 0.45 in any single location (one standard deviation; on a scale from 0 to 1). This is important for evaluating which areas will be most resilient for oyster habitat under a variety of conditions. This study presents the first validated statistical model of temporally and spatially varying oyster habitat suitability.
Introduction
Oysters are a dominant species, an ecosystem engineer, and a foundation species. Oysters provide many ecosystem services including filtration; coupling benthic and pelagic habitats; and creating refugia, feeding and nesting habitat (Coen et al., 2007). Oysters also form an economic industry, and their reefs protect shorelines. Many oyster restoration projects are underway in the United States and throughout the world (Zhang et al., 2018). To promote the resilience and sustainability of these restoration projects, it is important to locate restoration sites in suitable oyster habitat. New restoration sites should be in areas that are environmentally suitable for oyster growth and reproduction. This is especially relevant in areas where external anthropogenic drivers such as water diversions and flood control structures alter natural hydrology and water quality. In these cases, historic oyster reefs may no longer be viable because of changes in water quality and new locations for oyster restoration need to be identified.
Numerous studies have investigated environmental factors that are important for oyster habitat. The most common environmental factors that have been evaluated for oyster growth and reproduction include depth, salinity, temperature, and dissolved oxygen. These environmental factors are both independently and interactively important for oyster habitat suitability (Cake, 1983). The eastern oyster, Crassostrea virginica, is subtidal as well as intertidal and inhabit depths down to 8.0 m (NOAA Fisheries Eastern Oyster Biological Review Team, 2007). C. virginica grow normally in salinities from 12 to 27, grow slowly in salinities from 7 to 12, and are stressed at salinities below 6 (Butler, 1954; Cake, 1983; Kennedy et al., 1996). Respiration and feeding are disturbed at temperatures greater than 32°C and feeding may stop at temperatures below 6°C (Kennedy et al., 1996). Furthermore, mortality may occur at temperatures between 32 and 34°C (Austin et al., 1993). C. virginica prefer at least 20% oxygen saturation, but can survive for up to 5 days in oxygen with less than 1.0 mg/l (Sparks et al., 1958). The optimal temperature and salinity combination for C. virginica in Louisiana is 17.1°C and 12.4 (Lowe et al., 2017). The same study showed that oyster mortality is a function of linear temperature, linear salinity, and a quadratic term for salinity (Lowe et al., 2017). C. virginica in Louisiana consumes four times as much oxygen in the summer compared to the winter and oyster valves are most open in salinities between 6 and 25 (Casas et al., 2018). Casas et al. (2018) concluded that there is a need for more studies on the optimal ranges and thresholds of environmental factors determining oyster habitat suitability.
Habitat suitability models use species preferences for environmental factors to determine where and when a species will grow and reproduce successfully. A number of habitat suitability models have been developed for oysters (Cake, 1983; Soniat and Brody, 1988; Barnes et al., 2007; Linhoss et al., 2016; Theuerkauf and Lipcius, 2016; Puckett et al., 2018; Chowdhury et al., 2019). Several oyster habitat suitability models have been independently validated based on field data (Theuerkauf and Lipcius, 2016; Puckett et al., 2018; Chowdhury et al., 2019). Most habitat suitability models rely on literature values or scientific studies to describe the ranges of optimal environmental and/or biotic variables. The ranges are then applied to the geometric means of measurements or modeled outputs to identify suitable habitat. Linhoss et al. (2016) developed an oyster habitat suitability model for Bay St Louis, in the Mississippi Sound, using MaxEnt, a statistical model that describes the probability of species occurrence from presence only data and environmental factors. To date, there has been no oyster habitat suitability model described in the literature that was field validated over temporally varying environmental conditions.
The objective of this study is to develop an oyster habitat suitability model based on existing conditions in 1 year, forecast habitat suitability throughout the same location in following years, and independently validate the model using statistics of alive and recent dead oyster counts. This model uses four weighted environmental factors to determine habitat suitability, namely: maximum annual temperature, maximum annual salinity, minimum annual salinity, and minimum annual dissolved oxygen. This statistical model is based on principles of maximum entropy.
Materials and Methods
Study Site: Western Mississippi Sound
The study site is the western Mississippi Sound, located in the northern Gulf of Mexico, United States (Figure 1). This is an important area for understanding oyster restoration for two reasons. First, this site encompasses Mississippi’s largest and most profitable commercial oyster reefs. Second, oyster die offs in this area have been reported in recent years (Gledhill et al., 2020; Pace et al., 2020). These die off events allow a simulation of temporally varying habitat suitability within one study area.
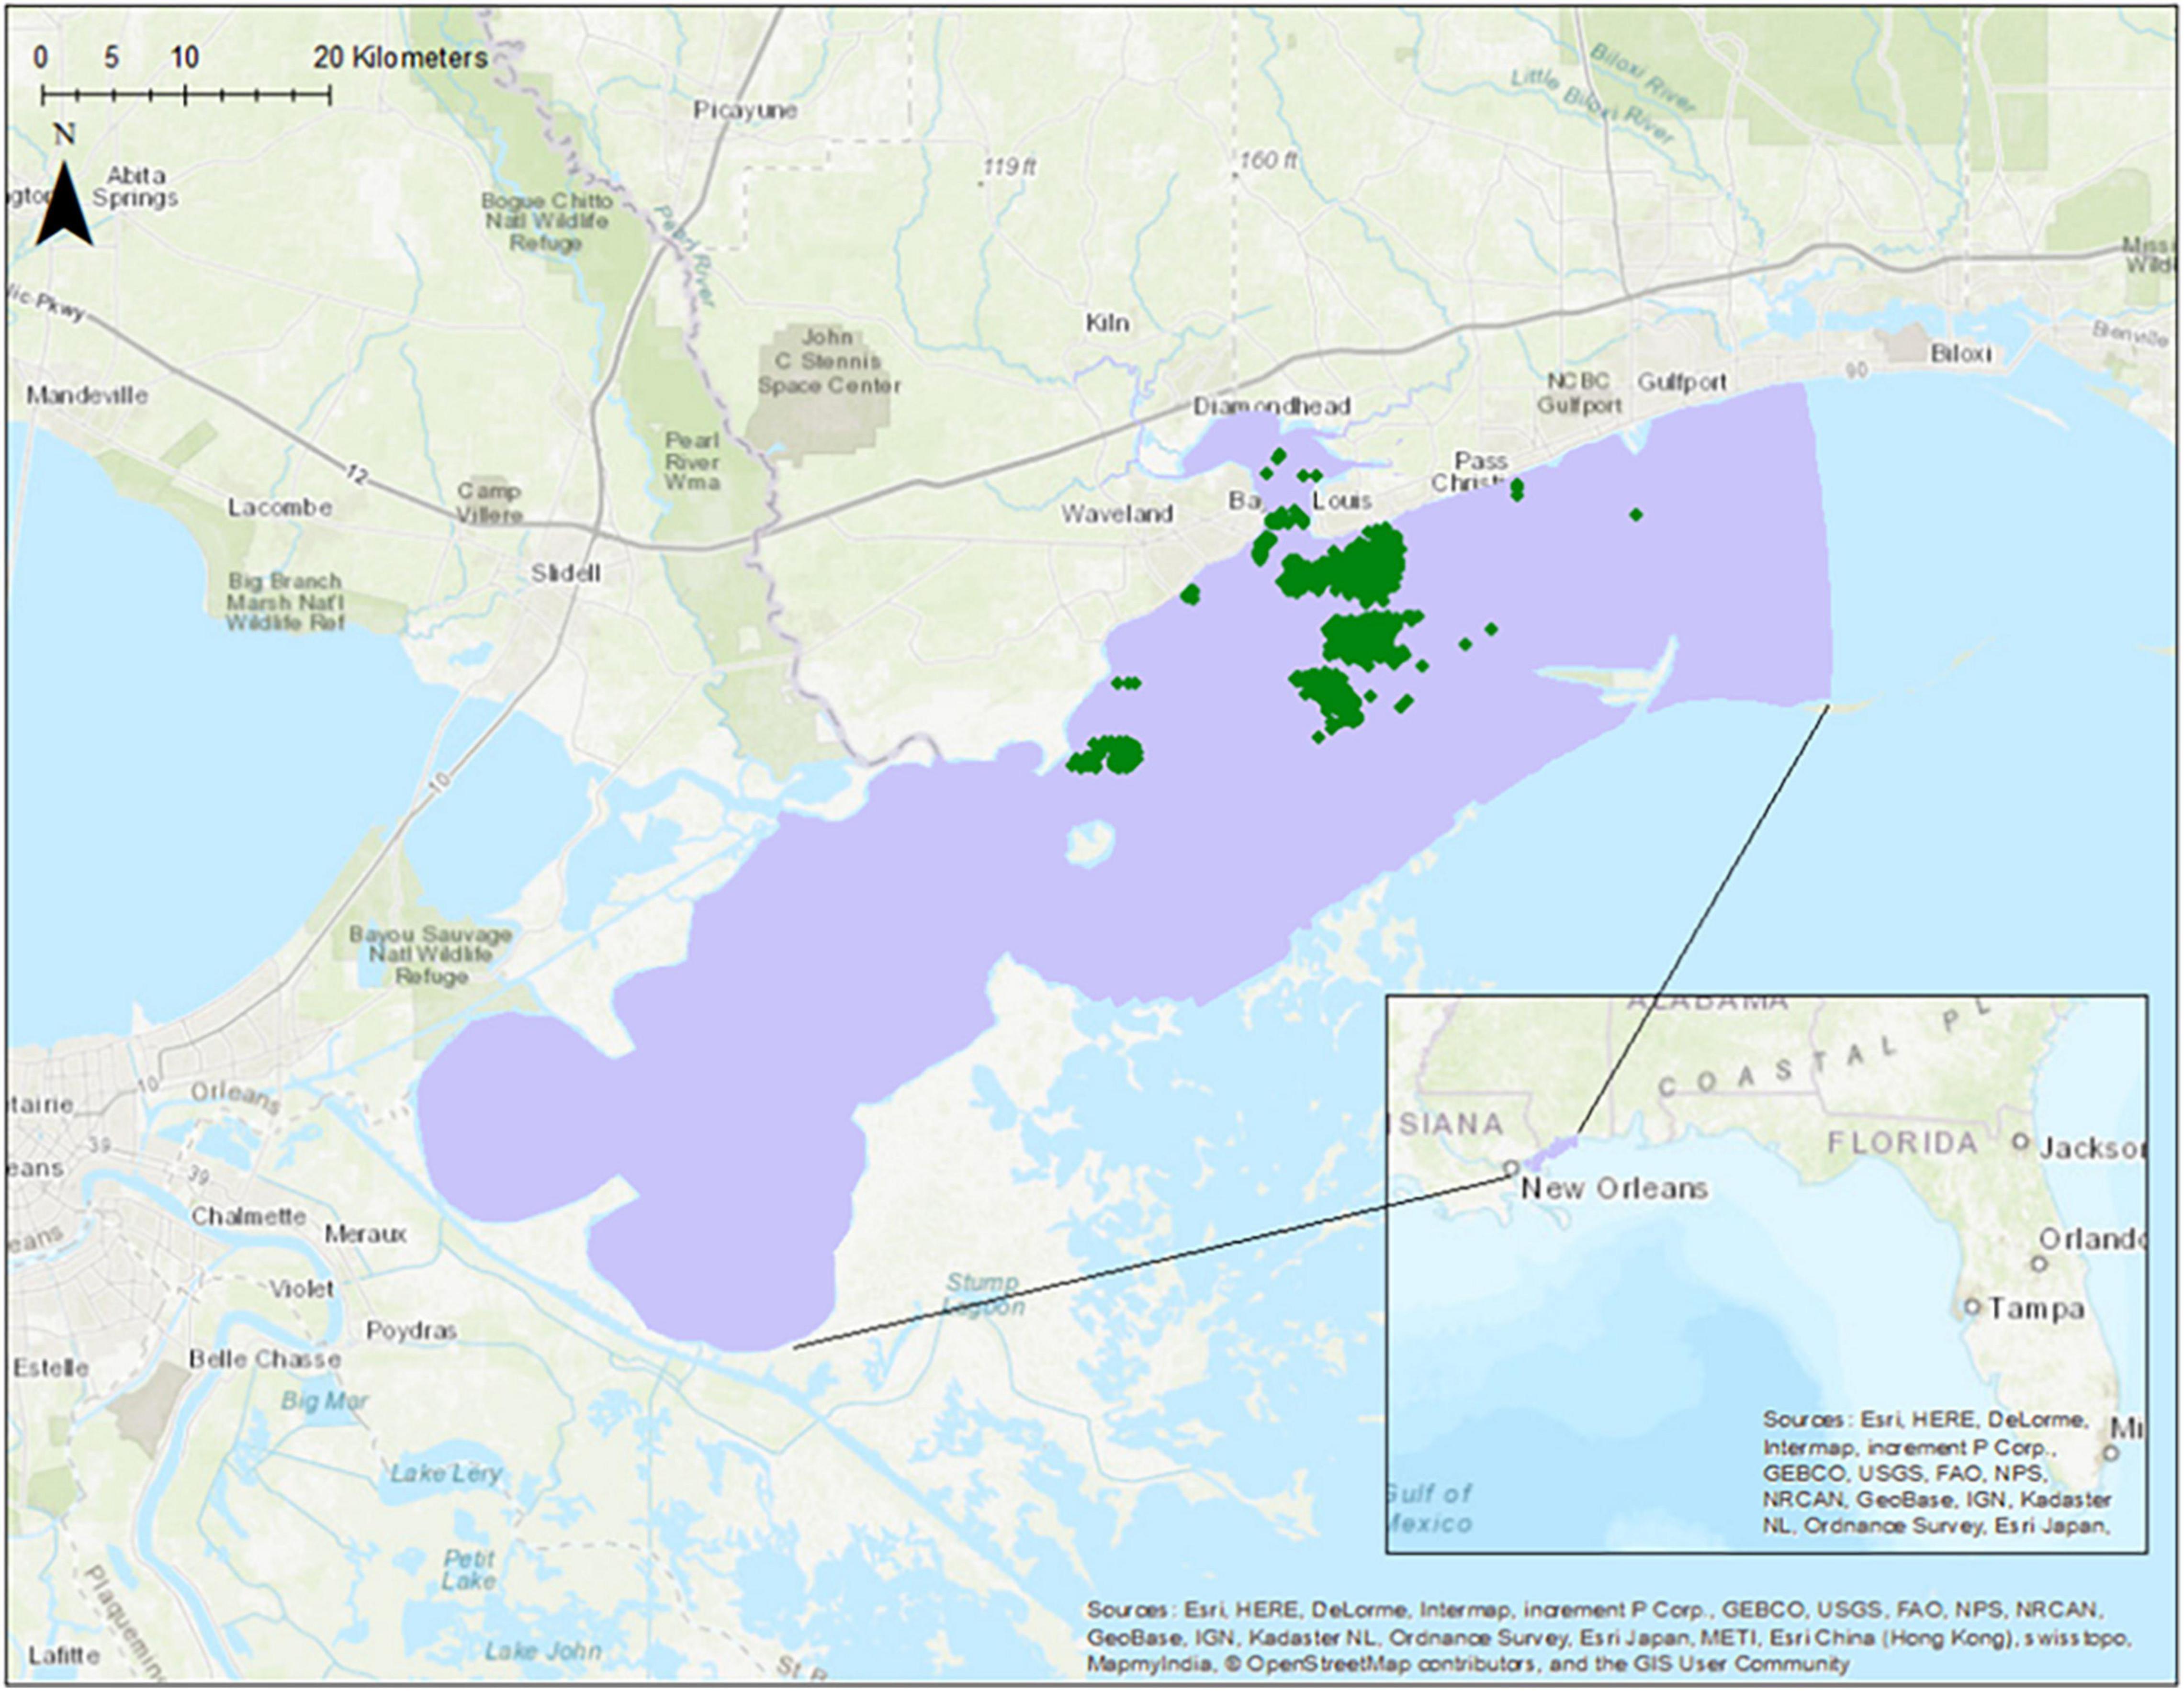
Figure 1. A site map showing the location of the study area in purple and oyster reefs (oyster presence data) in green.
Data
The study is divided by oyster years with September through August encompassing each oyster year. Simulations were made from the 2009/2010 through the 2016/2017 oyster years.
The environmental data used in this study include bathymetry, maximum temperature, minimum dissolved oxygen, maximum salinity, and minimum salinity. It is important to note that these environmental factors are correlated. As such, the response curve and analysis of variable contribution results have no biological significance. The presentation of these results only serves to demonstrate how the model works.
Bathymetry data was obtained from the USGS topobathymetric DEM dataset (USGS, 2021). All other environmental factors were obtained from a hydrodynamic and water quality model of the western Mississippi Sound (Armandei et al., 2021; Bazgirkhoob et al., 2022). The hydrodynamic model simulates water surface elevation, temperature, and salinity from 2009 through 2017 throughout the western Mississippi Sound using vEFDC (Armandei et al., 2021). It is composed of 2,943 horizontal cells and 4 vertical layers. The water quality model was built on top of the hydrodynamic model in vEDFC and simulates nutrients, algae, and dissolved oxygen (Bazgirkhoob et al., 2022). The maximum temperature, minimum dissolved oxygen, maximum salinity, and minimum salinity environmental factors were aggregated by the oyster year (September–August). Daily average values for each environmental factor were obtained from each model gird cell per year. Modeled temperature showed some numerical errors on the grid edges and so the maximum temperature was capped at 33°C.
Maps of the environmental factors for each oyster year are shown in Figures 2–5. Maximum daily salinity ranged between 0 and 43. Minimum daily salinity ranged between 0 and 16. Maximum daily temperature ranged between 27 and 33°C. Minimum daily dissolved oxygen ranged between 0 and 6.5 mg/l.
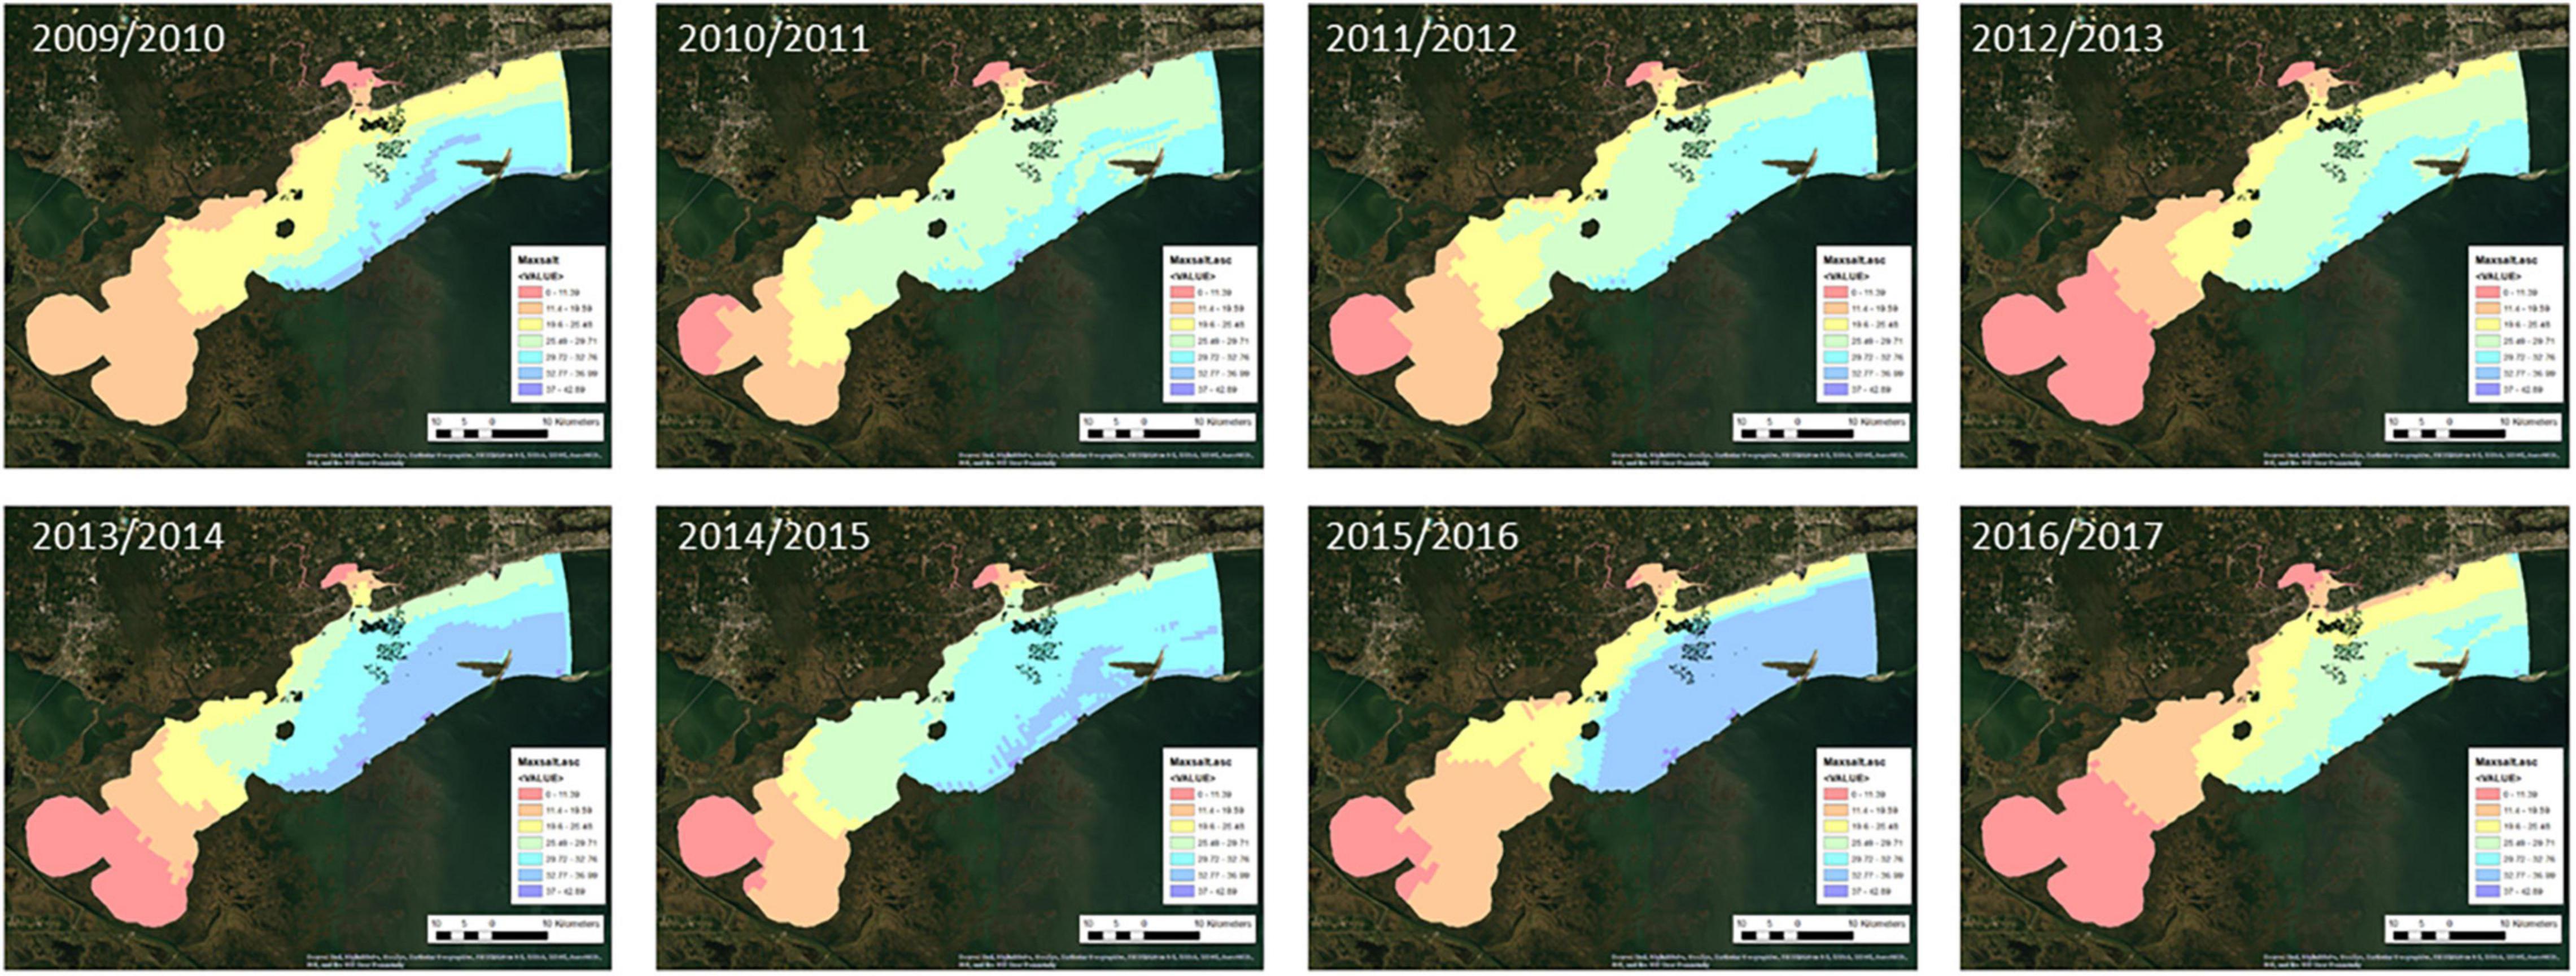
Figure 2. Maximum daily salinity per oyster year.
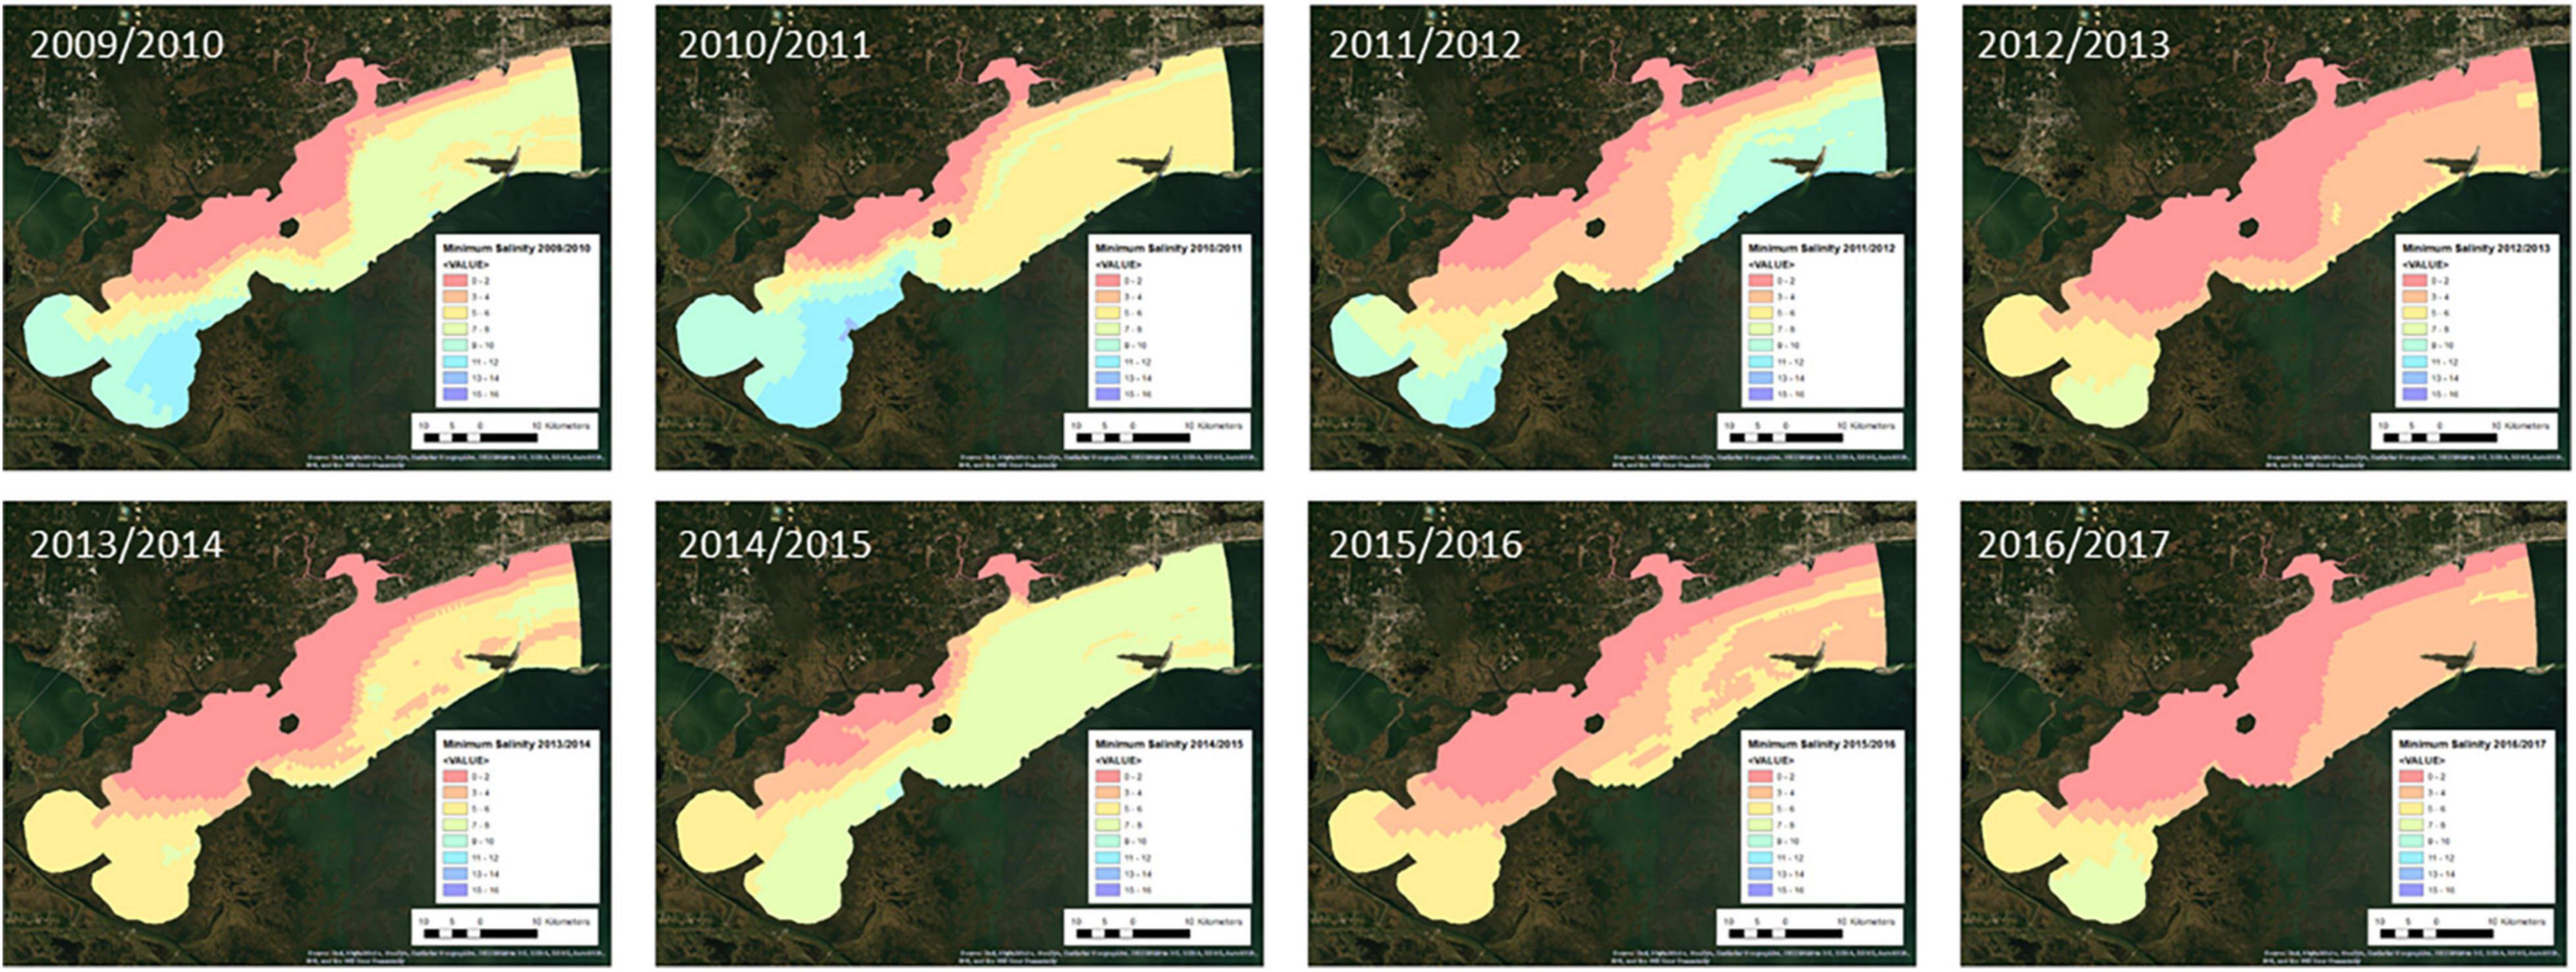
Figure 3. Minimum daily salinity per oyster year.
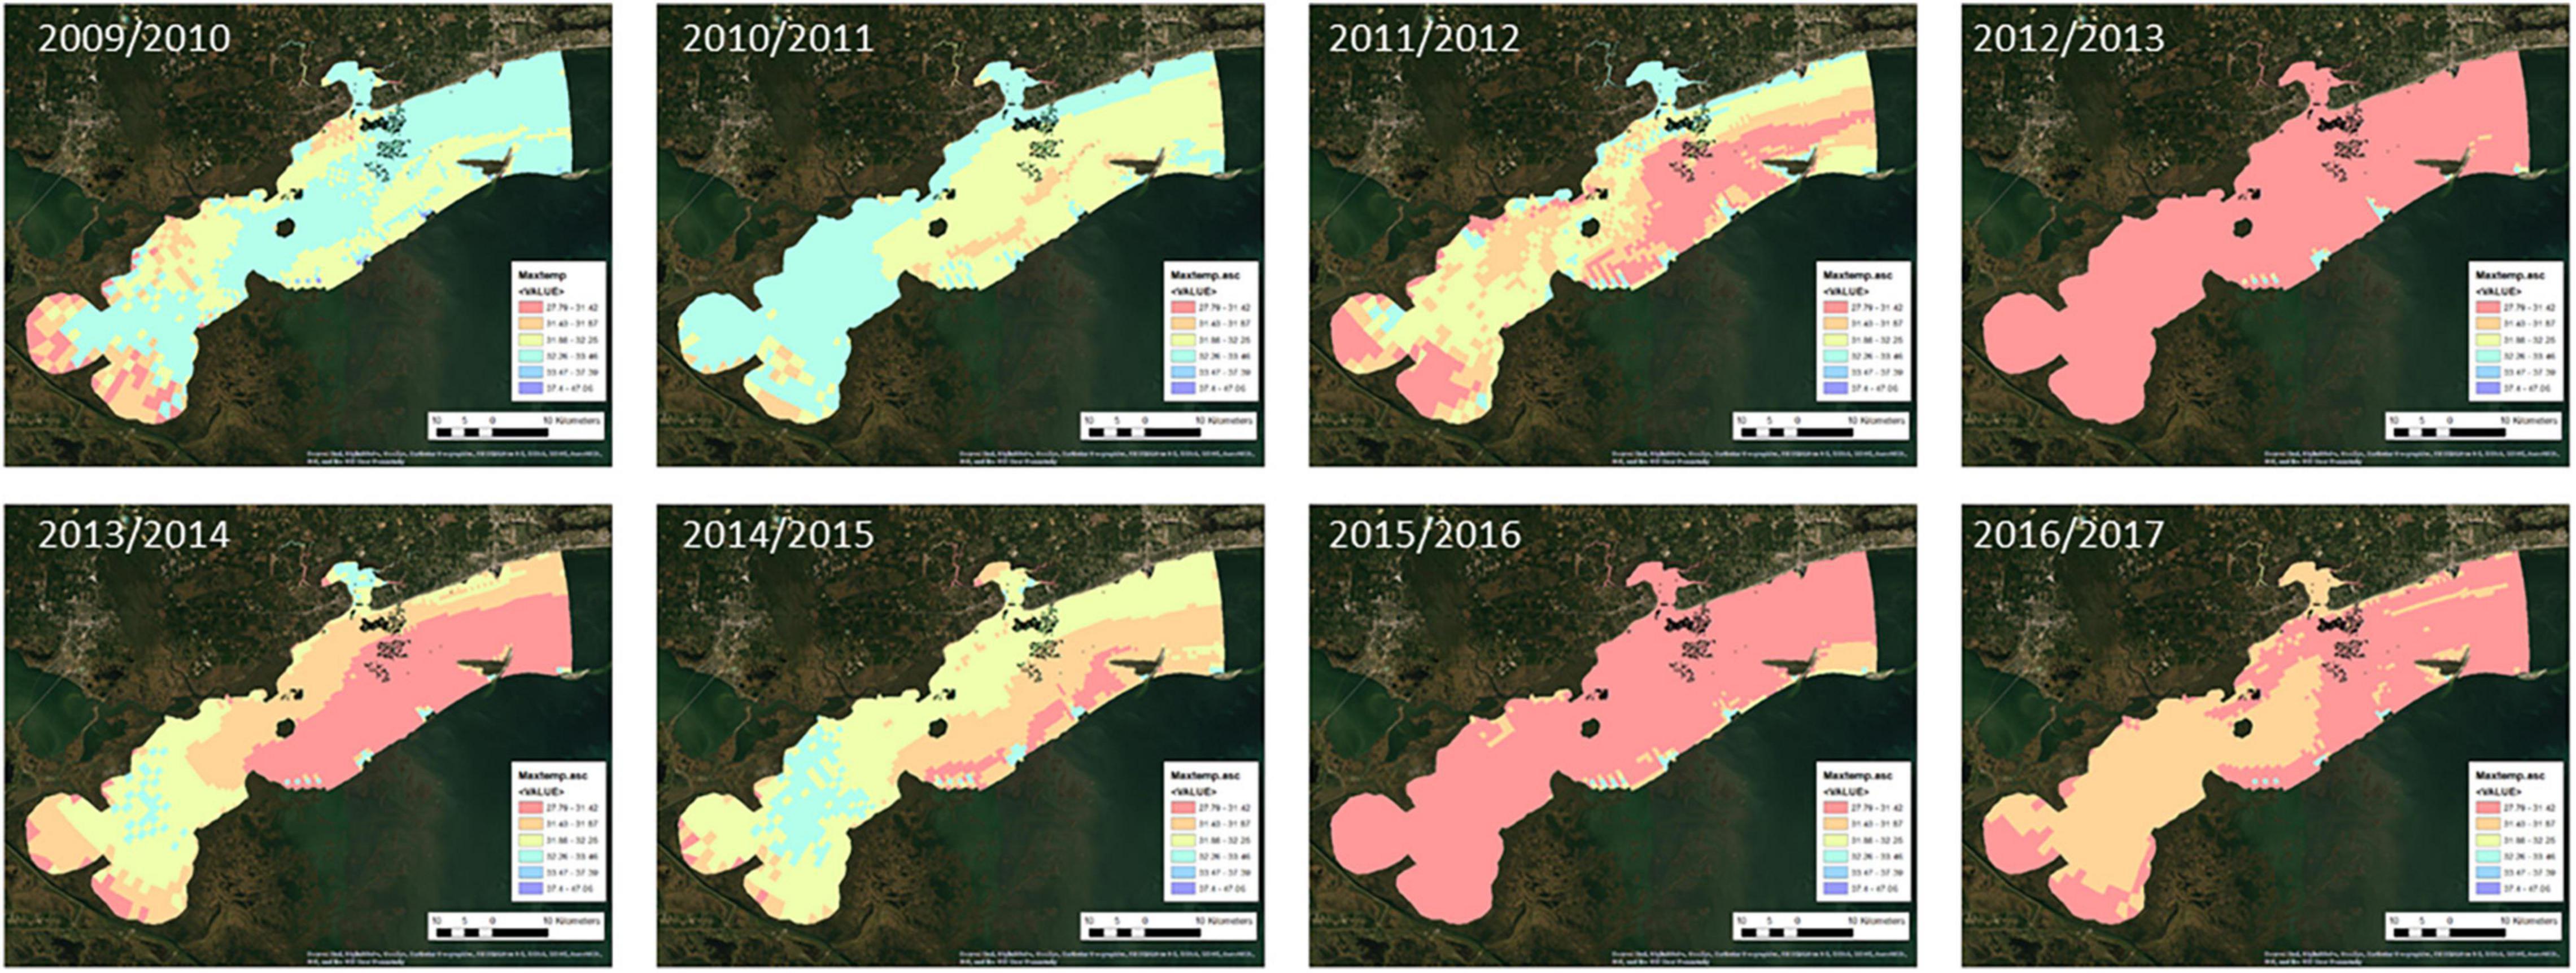
Figure 4. Maximum daily temperature per oyster year.
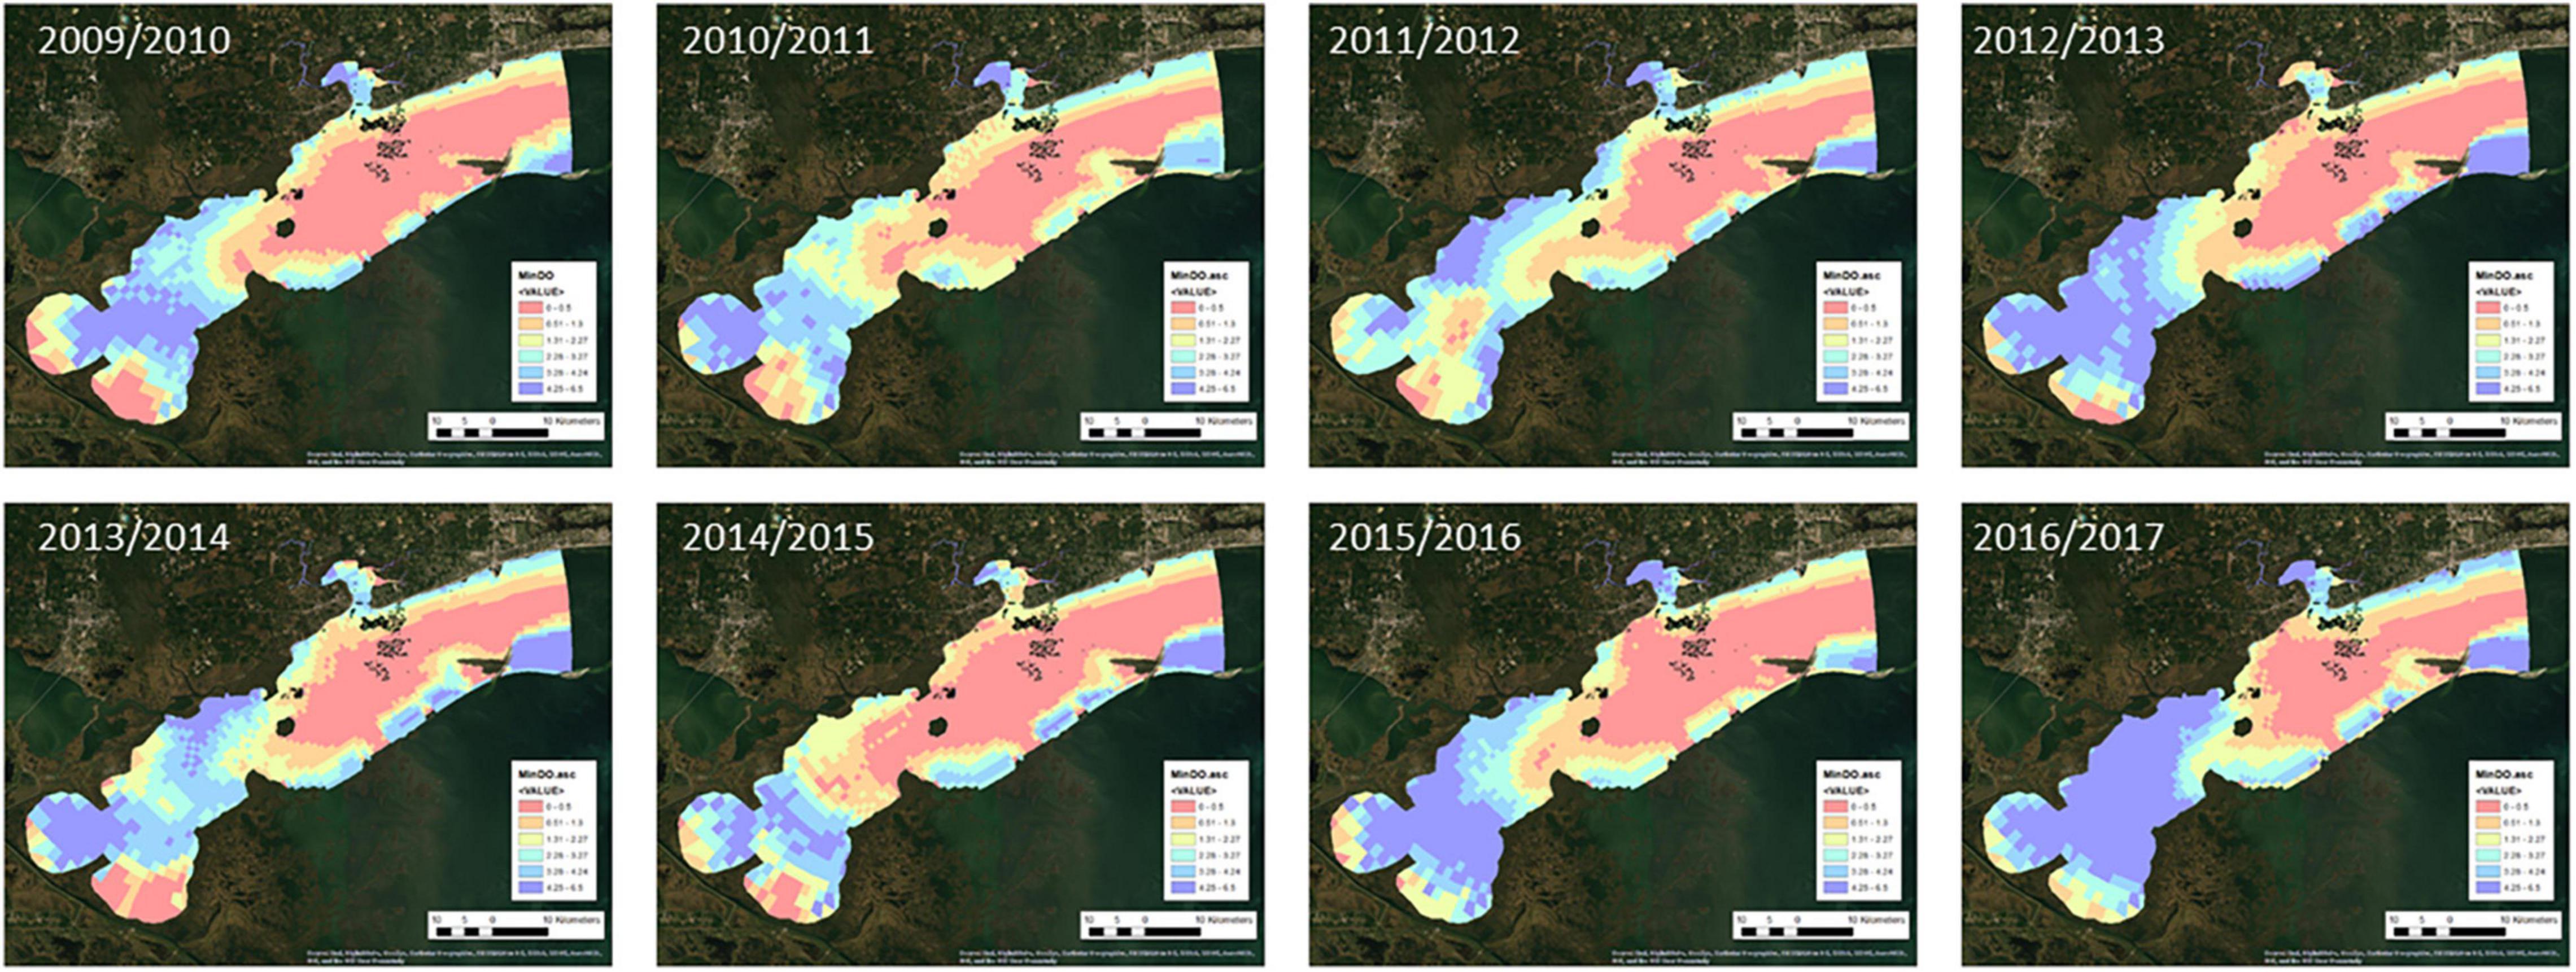
Figure 5. Minimum daily dissolved oxygen per oyster year.
Two independent types of oyster data were used in the development of this model: oyster presence data and oyster count data. The oyster presence data were used to set up the model. These presence data were compiled from surveys of existing reefs conducted by the Mississippi Department of Marine Resources (MDMR) and the National Oceanic and Atmospheric Association (NOAA). Presence data were developed to map existing commercial oyster reefs (Figure 1). Validation data were obtained from an independent dataset of field collected MDMR counts of oysters between 2009 and 2017 by square meter dive transects within the study area. Each record includes a count of live oysters (by size class), past dead oysters, recent dead oysters, and total oysters. Each record is geolocated and timestamped. All oyster sampling followed the Gulf wide standardized sampling protocol described in the Oyster Habitat Restoration Monitoring and Assessment Handbook (Baggett et al., 2014).
Maxent Model
This study used the MaxEnt model to simulate oyster habitat suitability. MaxEnt is a statistical model that calculates the conditional probability of a species’ occurrence based on presence only point data and spatially explicit environmental data (Phillips et al., 2006; Elith et al., 2011). MaxEnt creates response curves that show how the probability of presence changes with each environmental dataset. MaxEnt’s analysis of variable contributions assigns the relative contribution of each environmental factor to the developed MaxEnt model. Maxent outputs values for habitat suitability vary from 0 (worst habitat) to 1 (best habitat).
In this study we used MaxEnt to simulate spatially and temporally varying habitat suitability of C. virginicain in the western Mississippi Sound which is located in the northern Gulf of Mexico. For each year, the model used 10-fold cross-validation and the resulting figures show the mean of each of the 10 runs. The model is evaluated using the Area Under the Receiving Operator Characteristic Curve (AUC) (Phillips et al., 2006). The AUC characterizes the performance of the model using a single number that is independent of thresholds. The AUC varies from 0.5 to 1 with a 0.5 indicating a bad fit and 1 indicating an excellent fit.
Hydrodynamic and water quality model outputs from the 2009/2010 oyster year along with oyster presence data were used for the MaxEnt model setup and to develop the response curves. The response curves were then applied to the 2010/2011 through 2016/2017 oyster years to predict the variability in habitat suitability in the later years. This set up was based on the fact that the 2009/2010 oyster year was the most productive year between 2009 and 2017 (MDMR, 2021), which were the years of simulation.
Results
The results of the MaxEnt model gave an average AUC for the 10 replicate runs in 2009/2010 of 0.895, with a standard deviation of 0.012.
Response Curves
The response curves demonstrate how each environmental factor affects the MaxEnt prediction based on the 2009/2010 data (Figure 6). As mentioned previously, because of the correlation between the environmental factors, these response curves should not be considered biologically relevant.
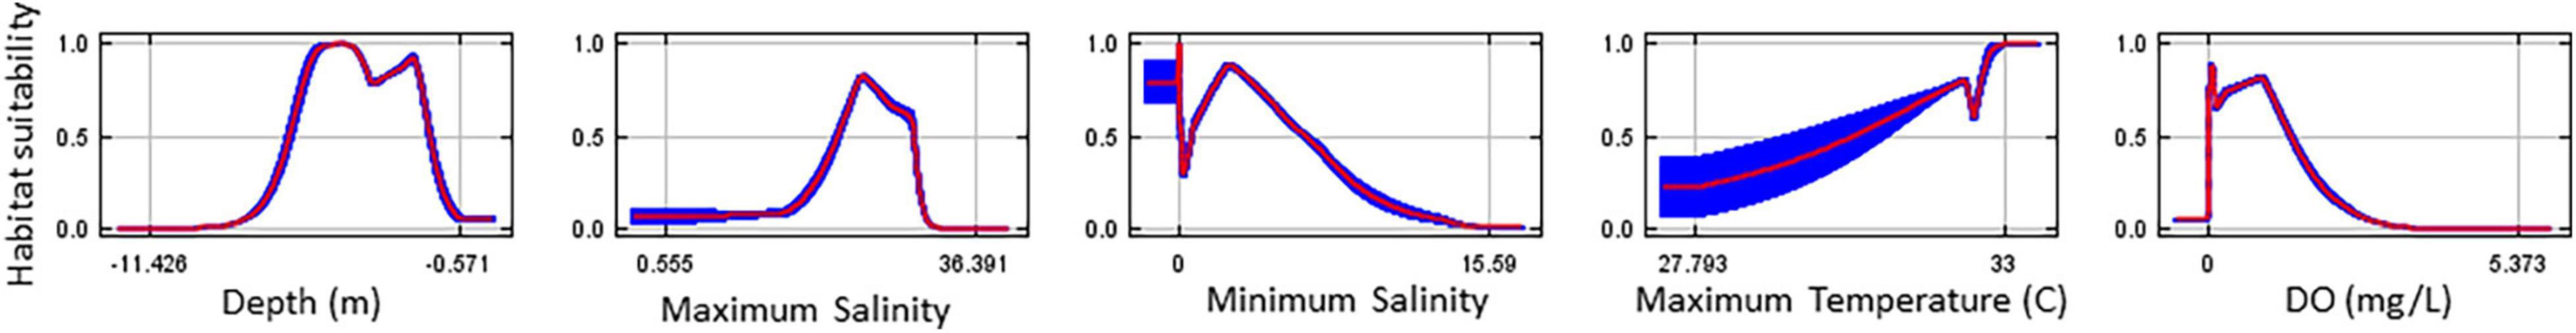
Figure 6. Response curves for the environmental factors from the 10 replicant model runs. DO, dissolved oxygen. Red represents the mean and blue represents one standard deviation.
Analysis of Variable Contributions
The analysis of variable contributions shows the relative contributions of each environmental variable to the 2009/2010 oyster habitat suitability model (Table 1). These results show that minimum dissolved oxygen, maximum salinity, and minimum salinity were the most important environmental factors in the model. Bathymetry and maximum temperature each contributed to less than 10% of the model output.
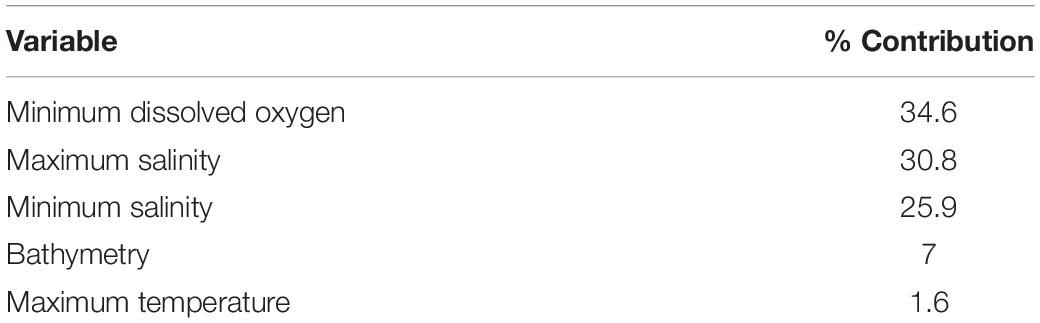
Table 1. Analysis of variable contributions.
Mapped Habitat Suitability
Figure 7 presents the annual habitat suitability maps for each oyster year. Note that the model and response curves were developed using environmental data from 2009/2010. The response curves were then applied to the subsequent years to develop the maps for 2010/2011 through 2016/2017. Figure 8 gives the average annual habitat suitability map for all years: 2009/2010 through 2016/2017. This figure shows that average habitat suitability ranged between 0 and 0.84. Figure 9 gives the standard deviation of the habitat suitability for all years. The standard deviation ranges between 0.27 and 0.45. This figure shows that there is important variability in habitat suitability between the years at this site. Figure 10 gives the minimum habitat suitability map for all years. This figure shows that minimum habitat suitability ranged between 0 and 0.4 with most cells having a minimum habitat suitability less than 0.15.

Figure 7. Habitat suitability model results by each oyster year (2009/2010 through 2016/2017).
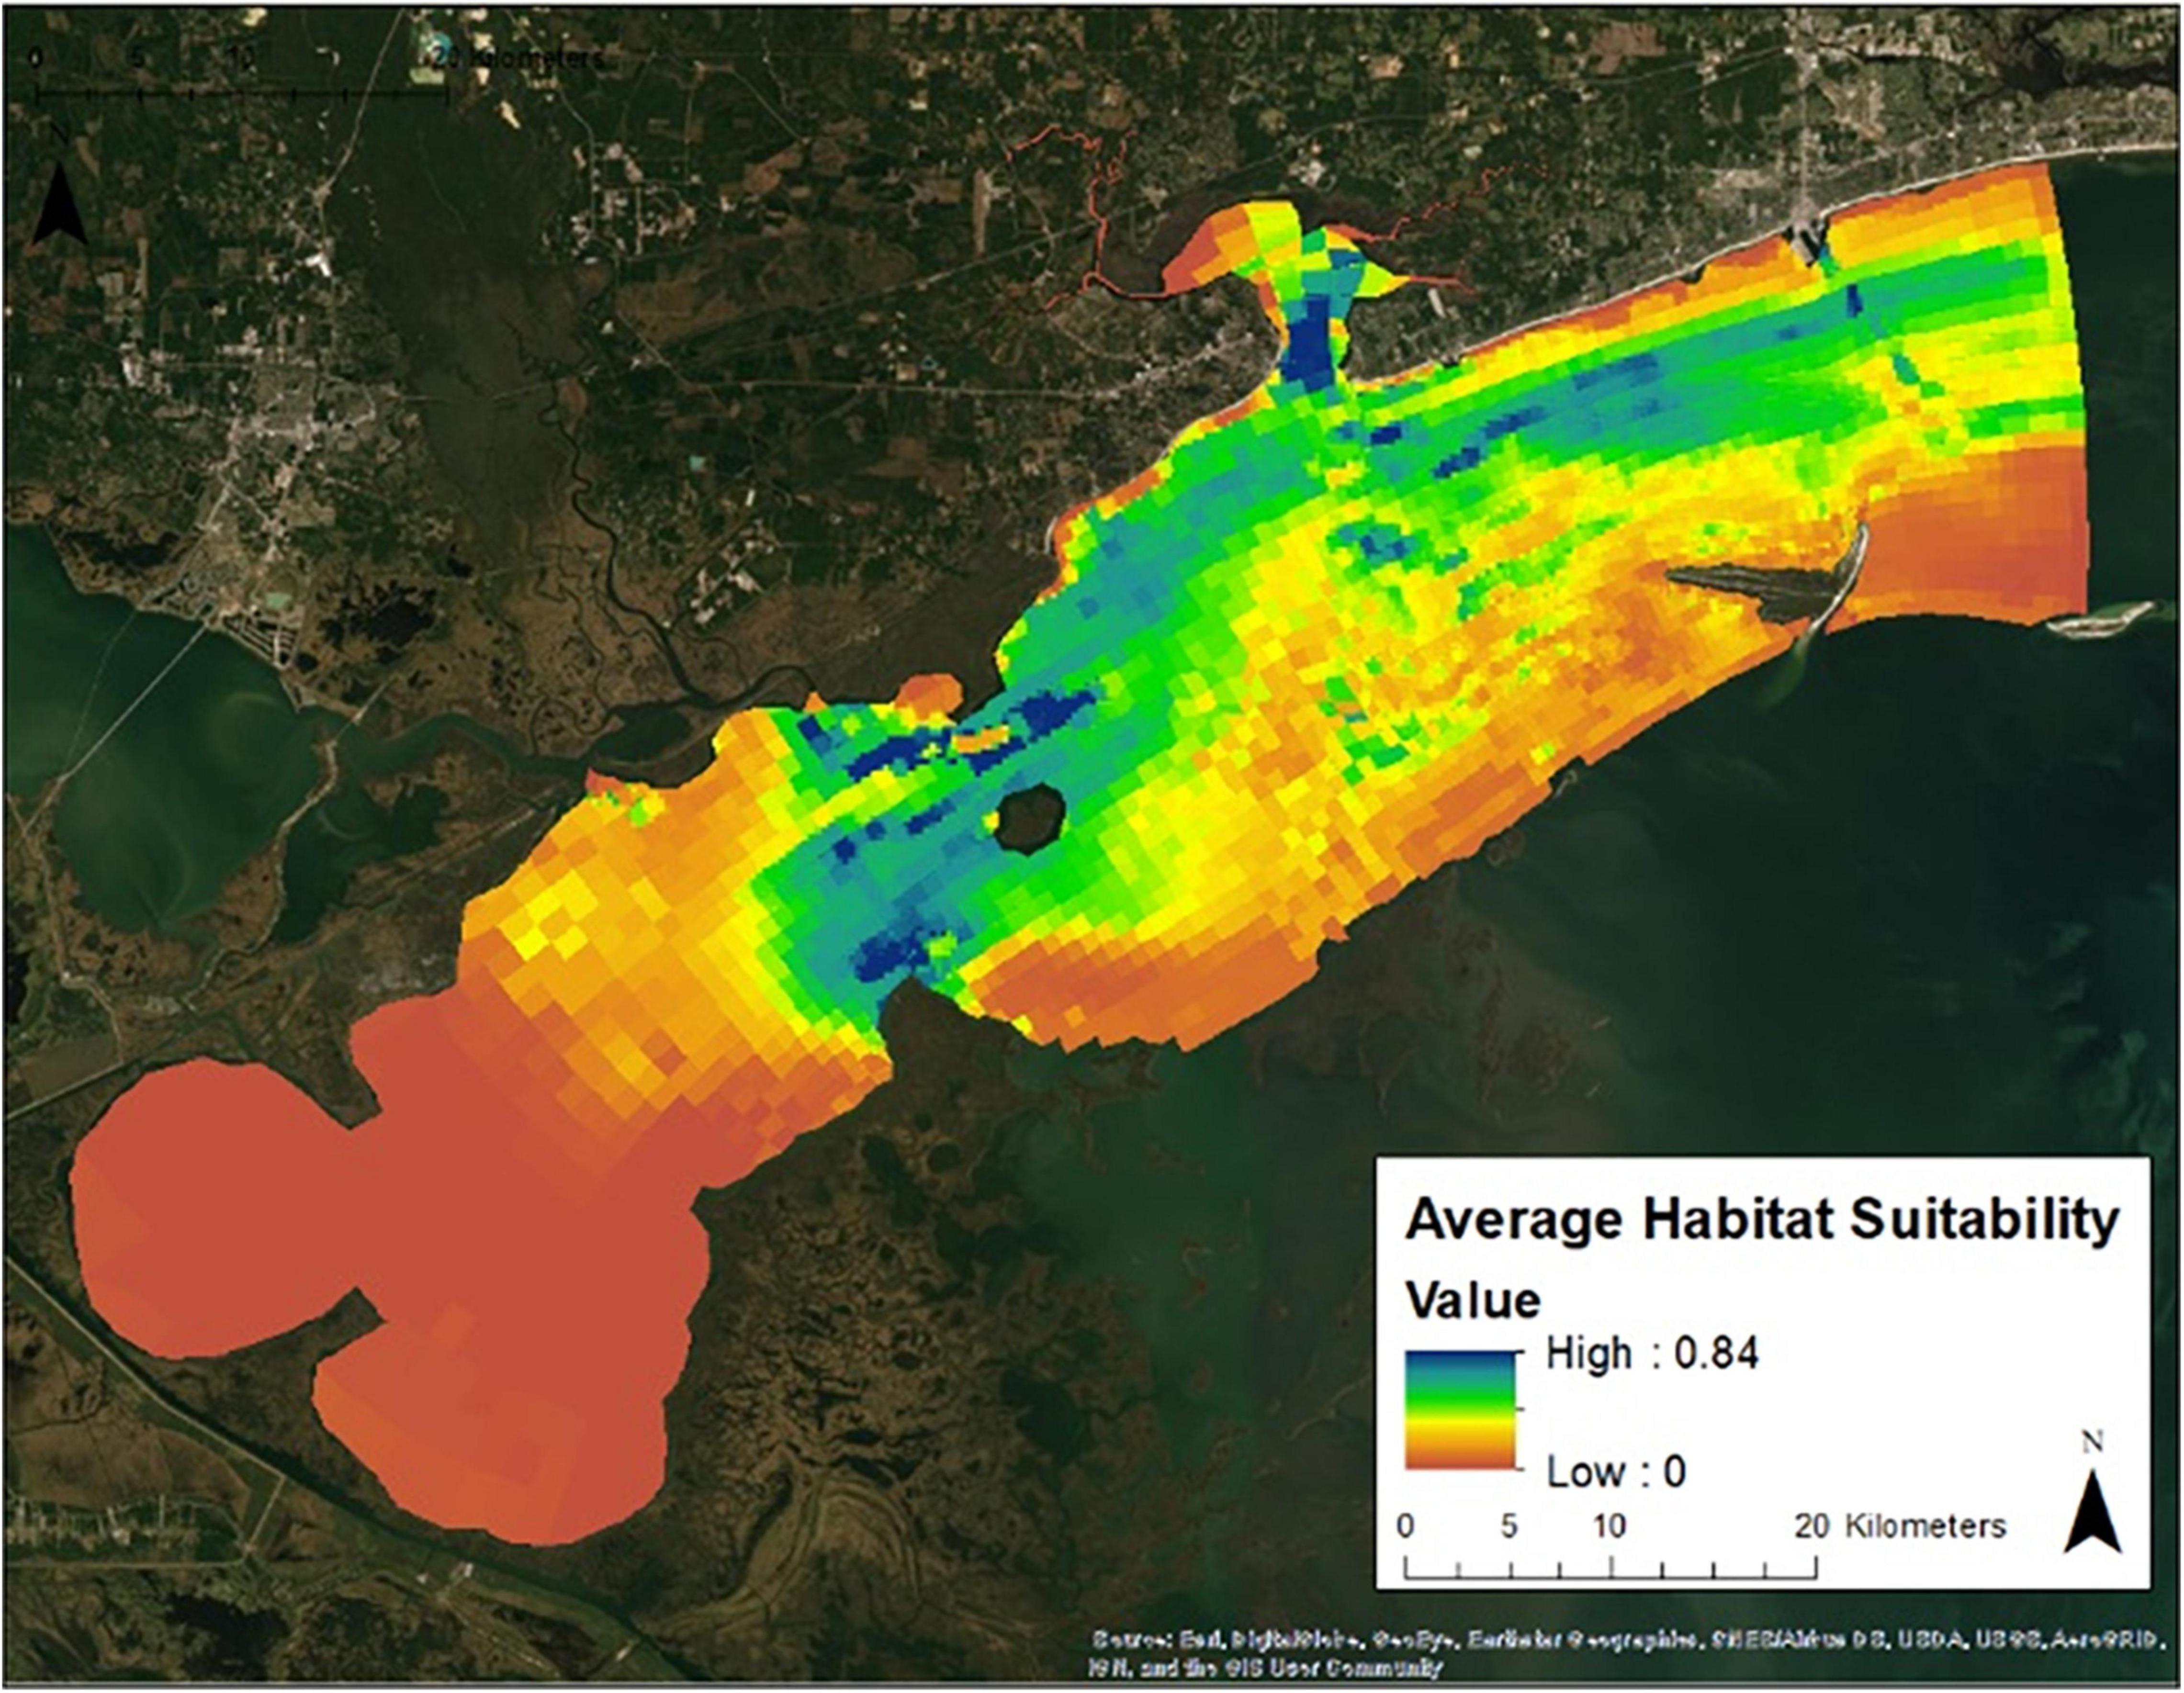
Figure 8. Average habitat suitability between the 2009/2010 and 2016/2017 oyster years.
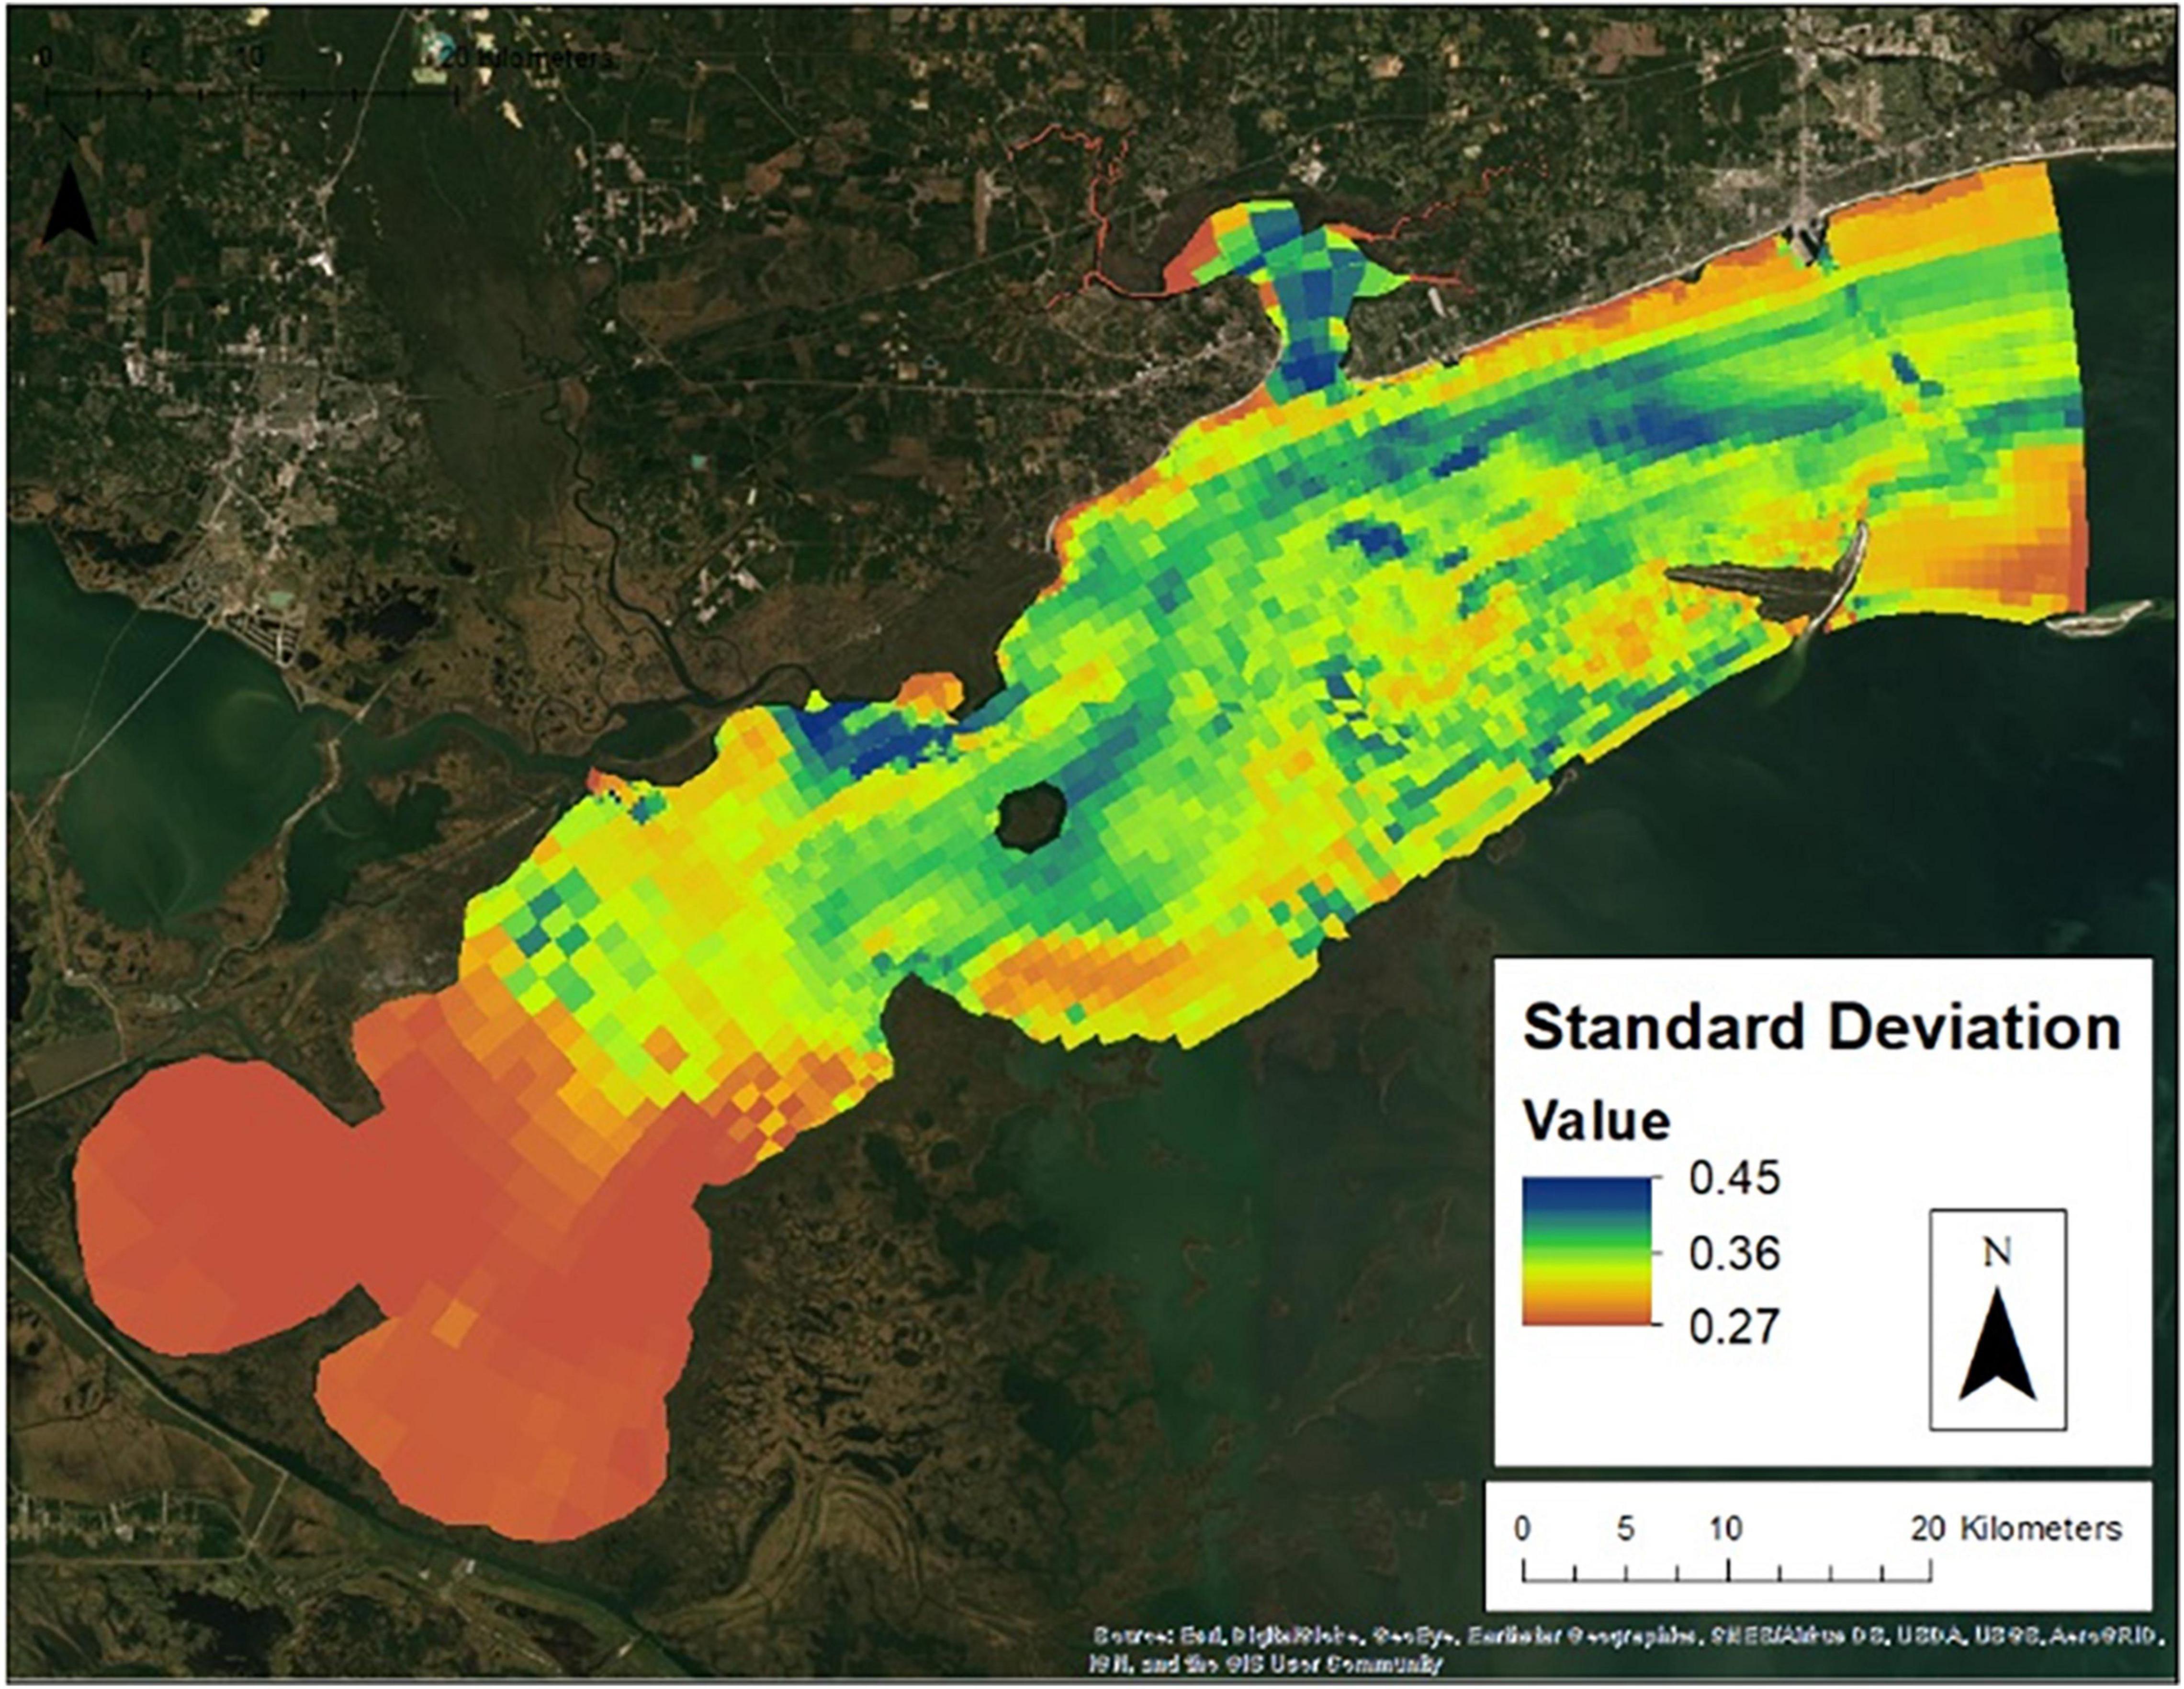
Figure 9. Standard deviation of habitat suitability between the 2009/2010 and 2016/2017 oyster years.
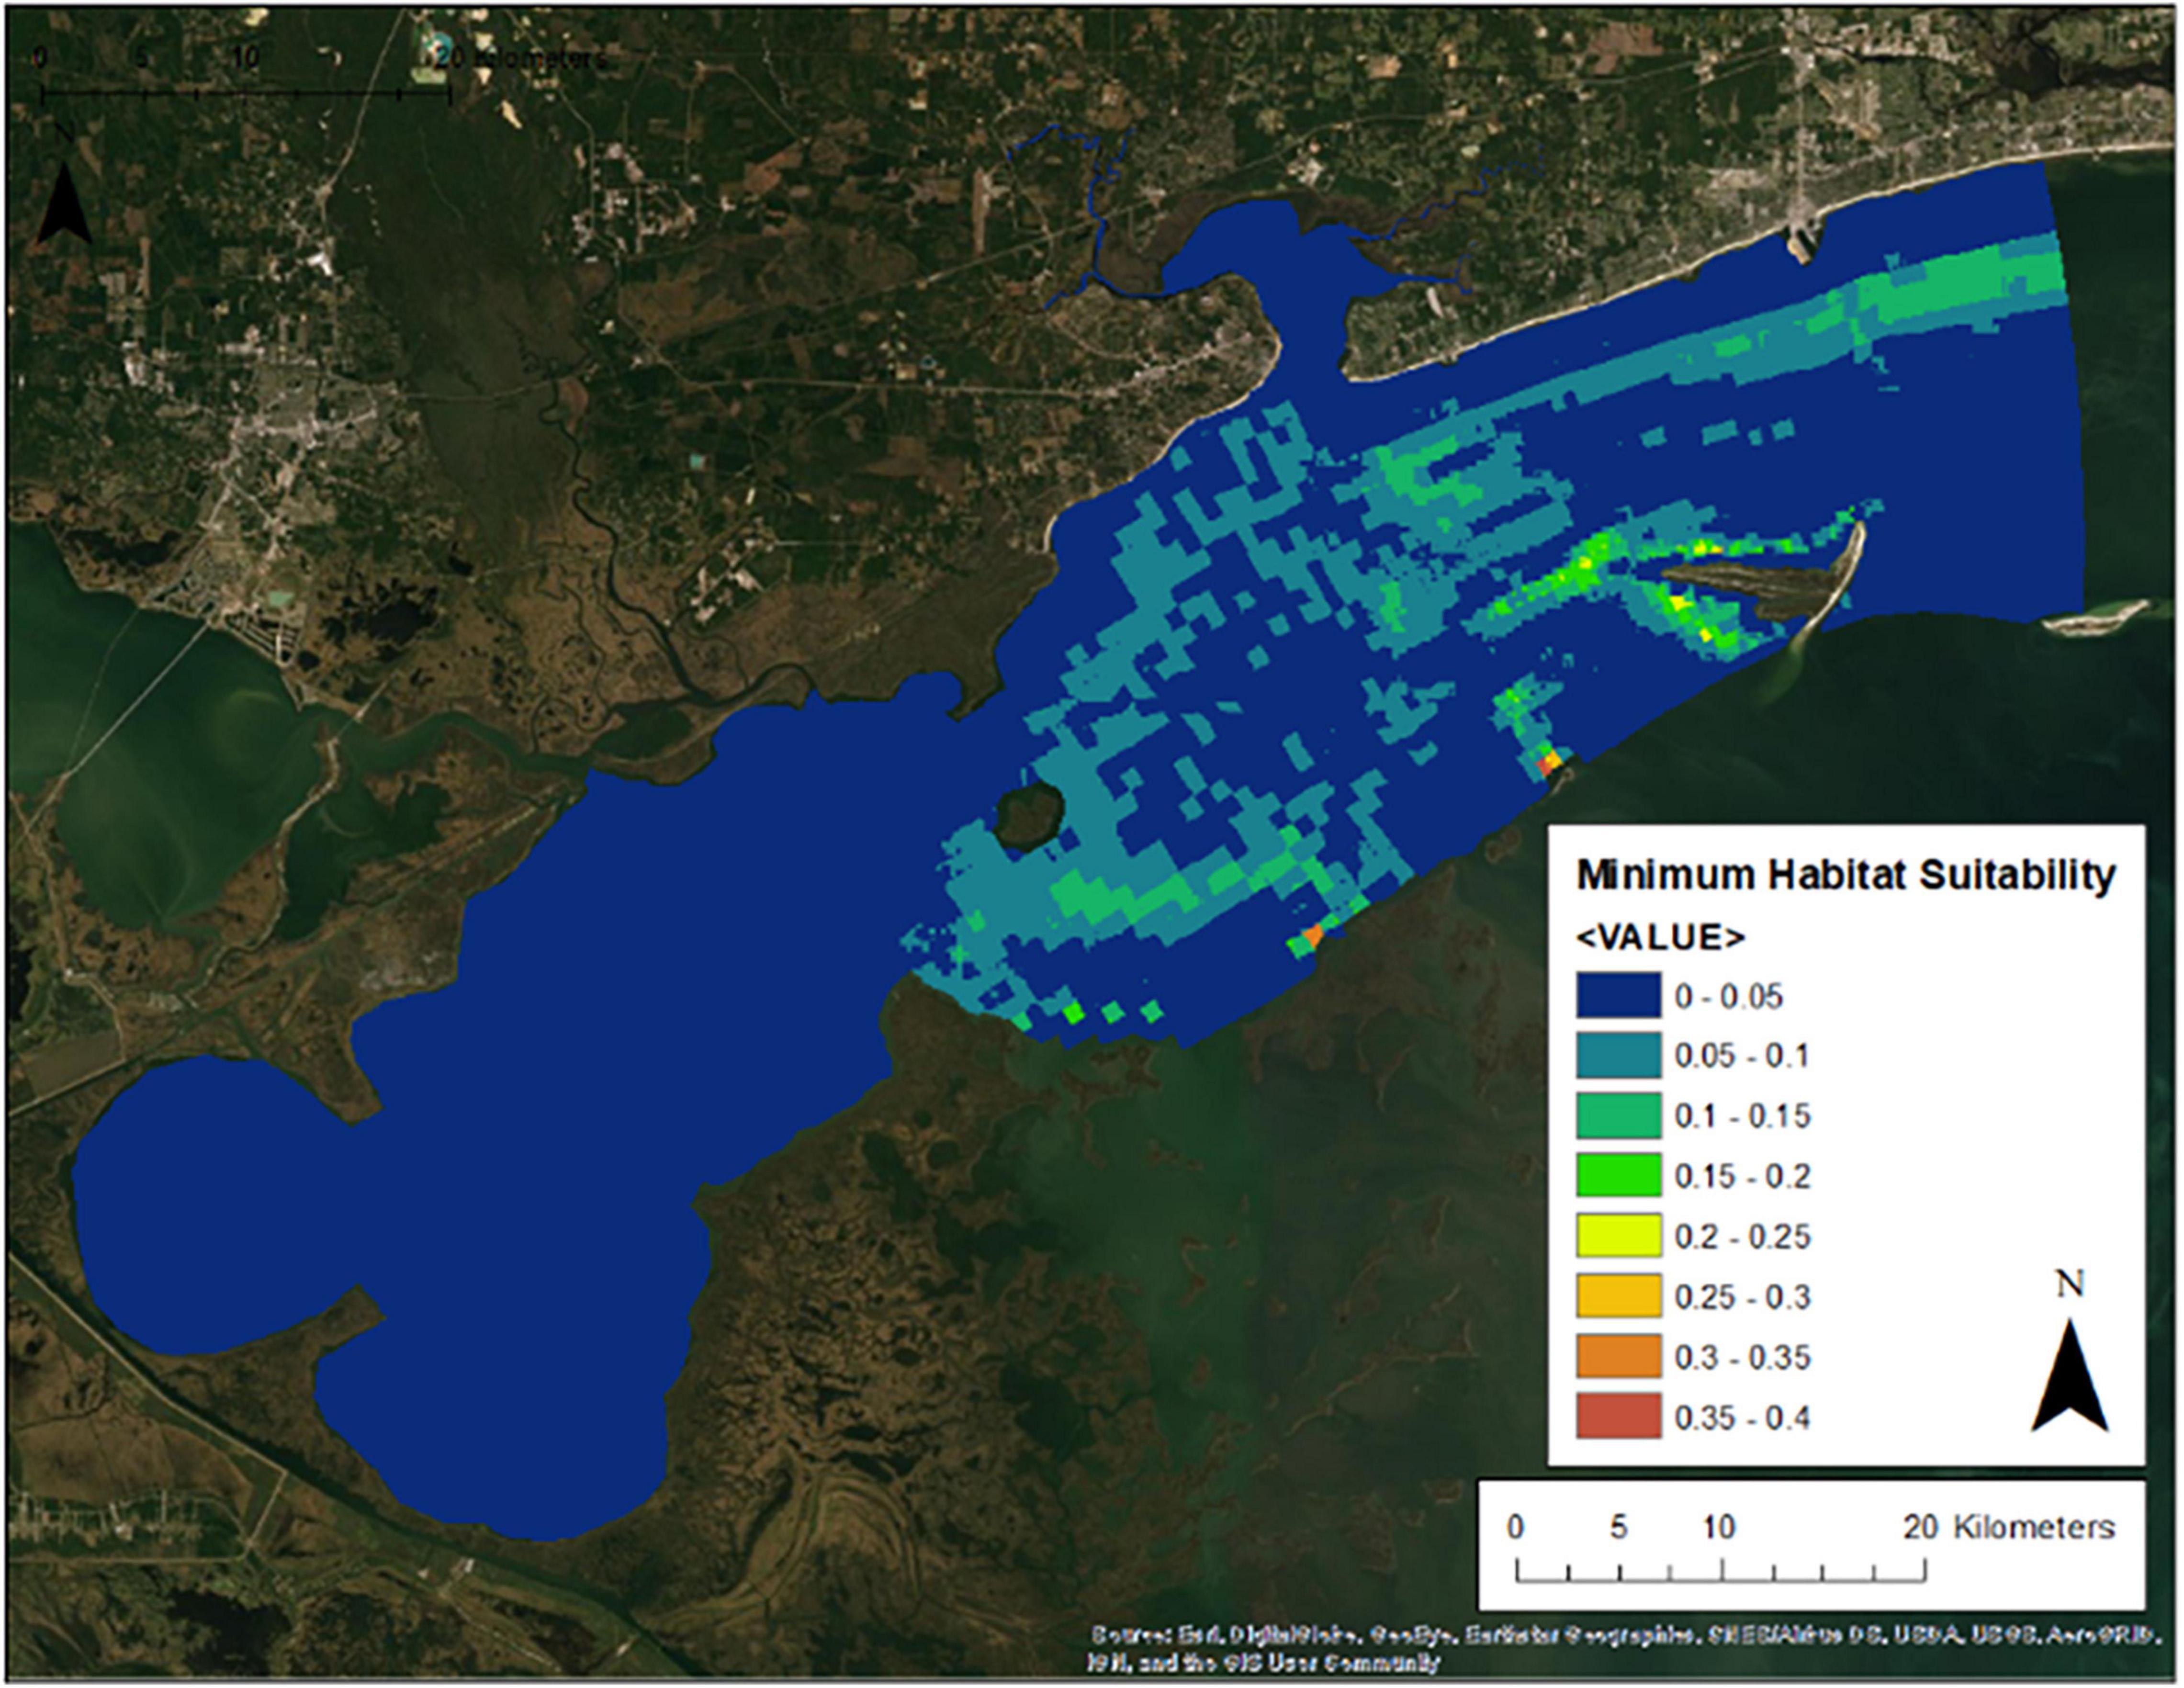
Figure 10. Minimum habitat suitability between the 2009/2010 and 2016/2017 oyster years.
Figure 11 shows how the average habitat suitability varies over Merrill Shell Bank, which is the most important commercial oyster reef in Mississippi and the study area. This figure shows that the maximum habitat suitability at Merrill Shell Bank occurred in the 2009/2010 oyster year with an average of 0.72. The minimum habitat suitability at Merrill Shell Bank occurred in the 2013/2014 oyster year with an average of 0.05. The average habitat suitability score at the Merrill Shell Bank throughout the time of simulation was 0.33.
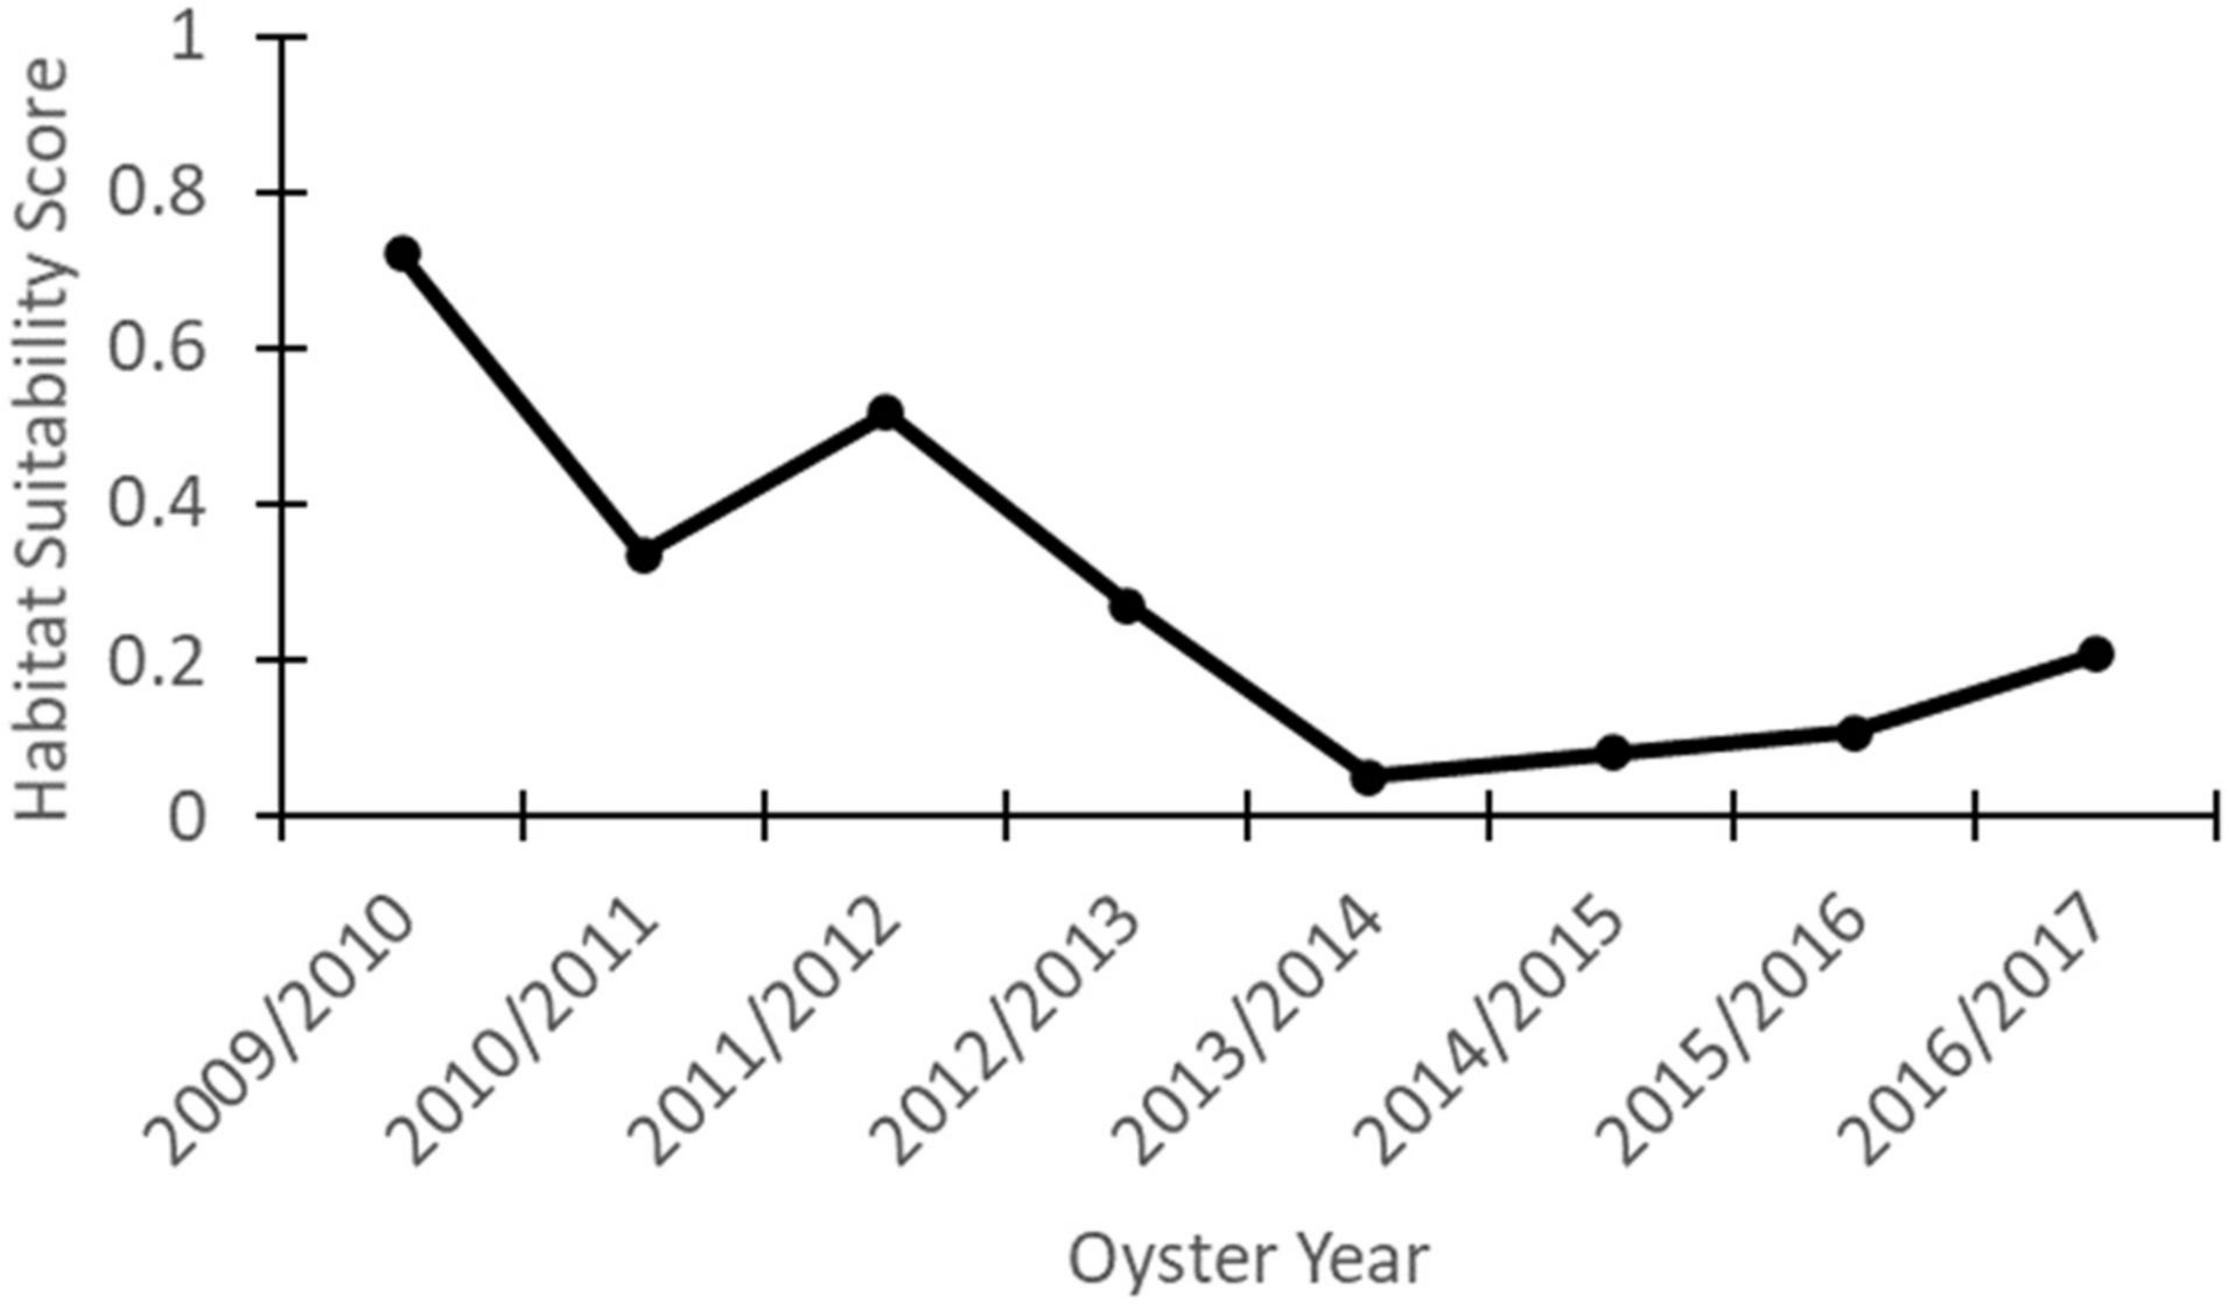
Figure 11. Average habitat suitability over time at the Merrill Shell oyster reef.
Oyster Validation Data
There were 815 records of dive oyster counts within the study site between the years of 2009/2010 and 2016/2017 that were used for model validation. The ratios of live, past dead, and recent dead oysters were highly variable by sample and by year (Figure 12) with trends of increasing annual mortality occurring between 2012 and 2017 (Figure 12). To validate the model, the simulated habitat suitability for each record’s location and oyster year was extracted. This resulted in a table with each oyster count record having one simulated habitat suitability value.
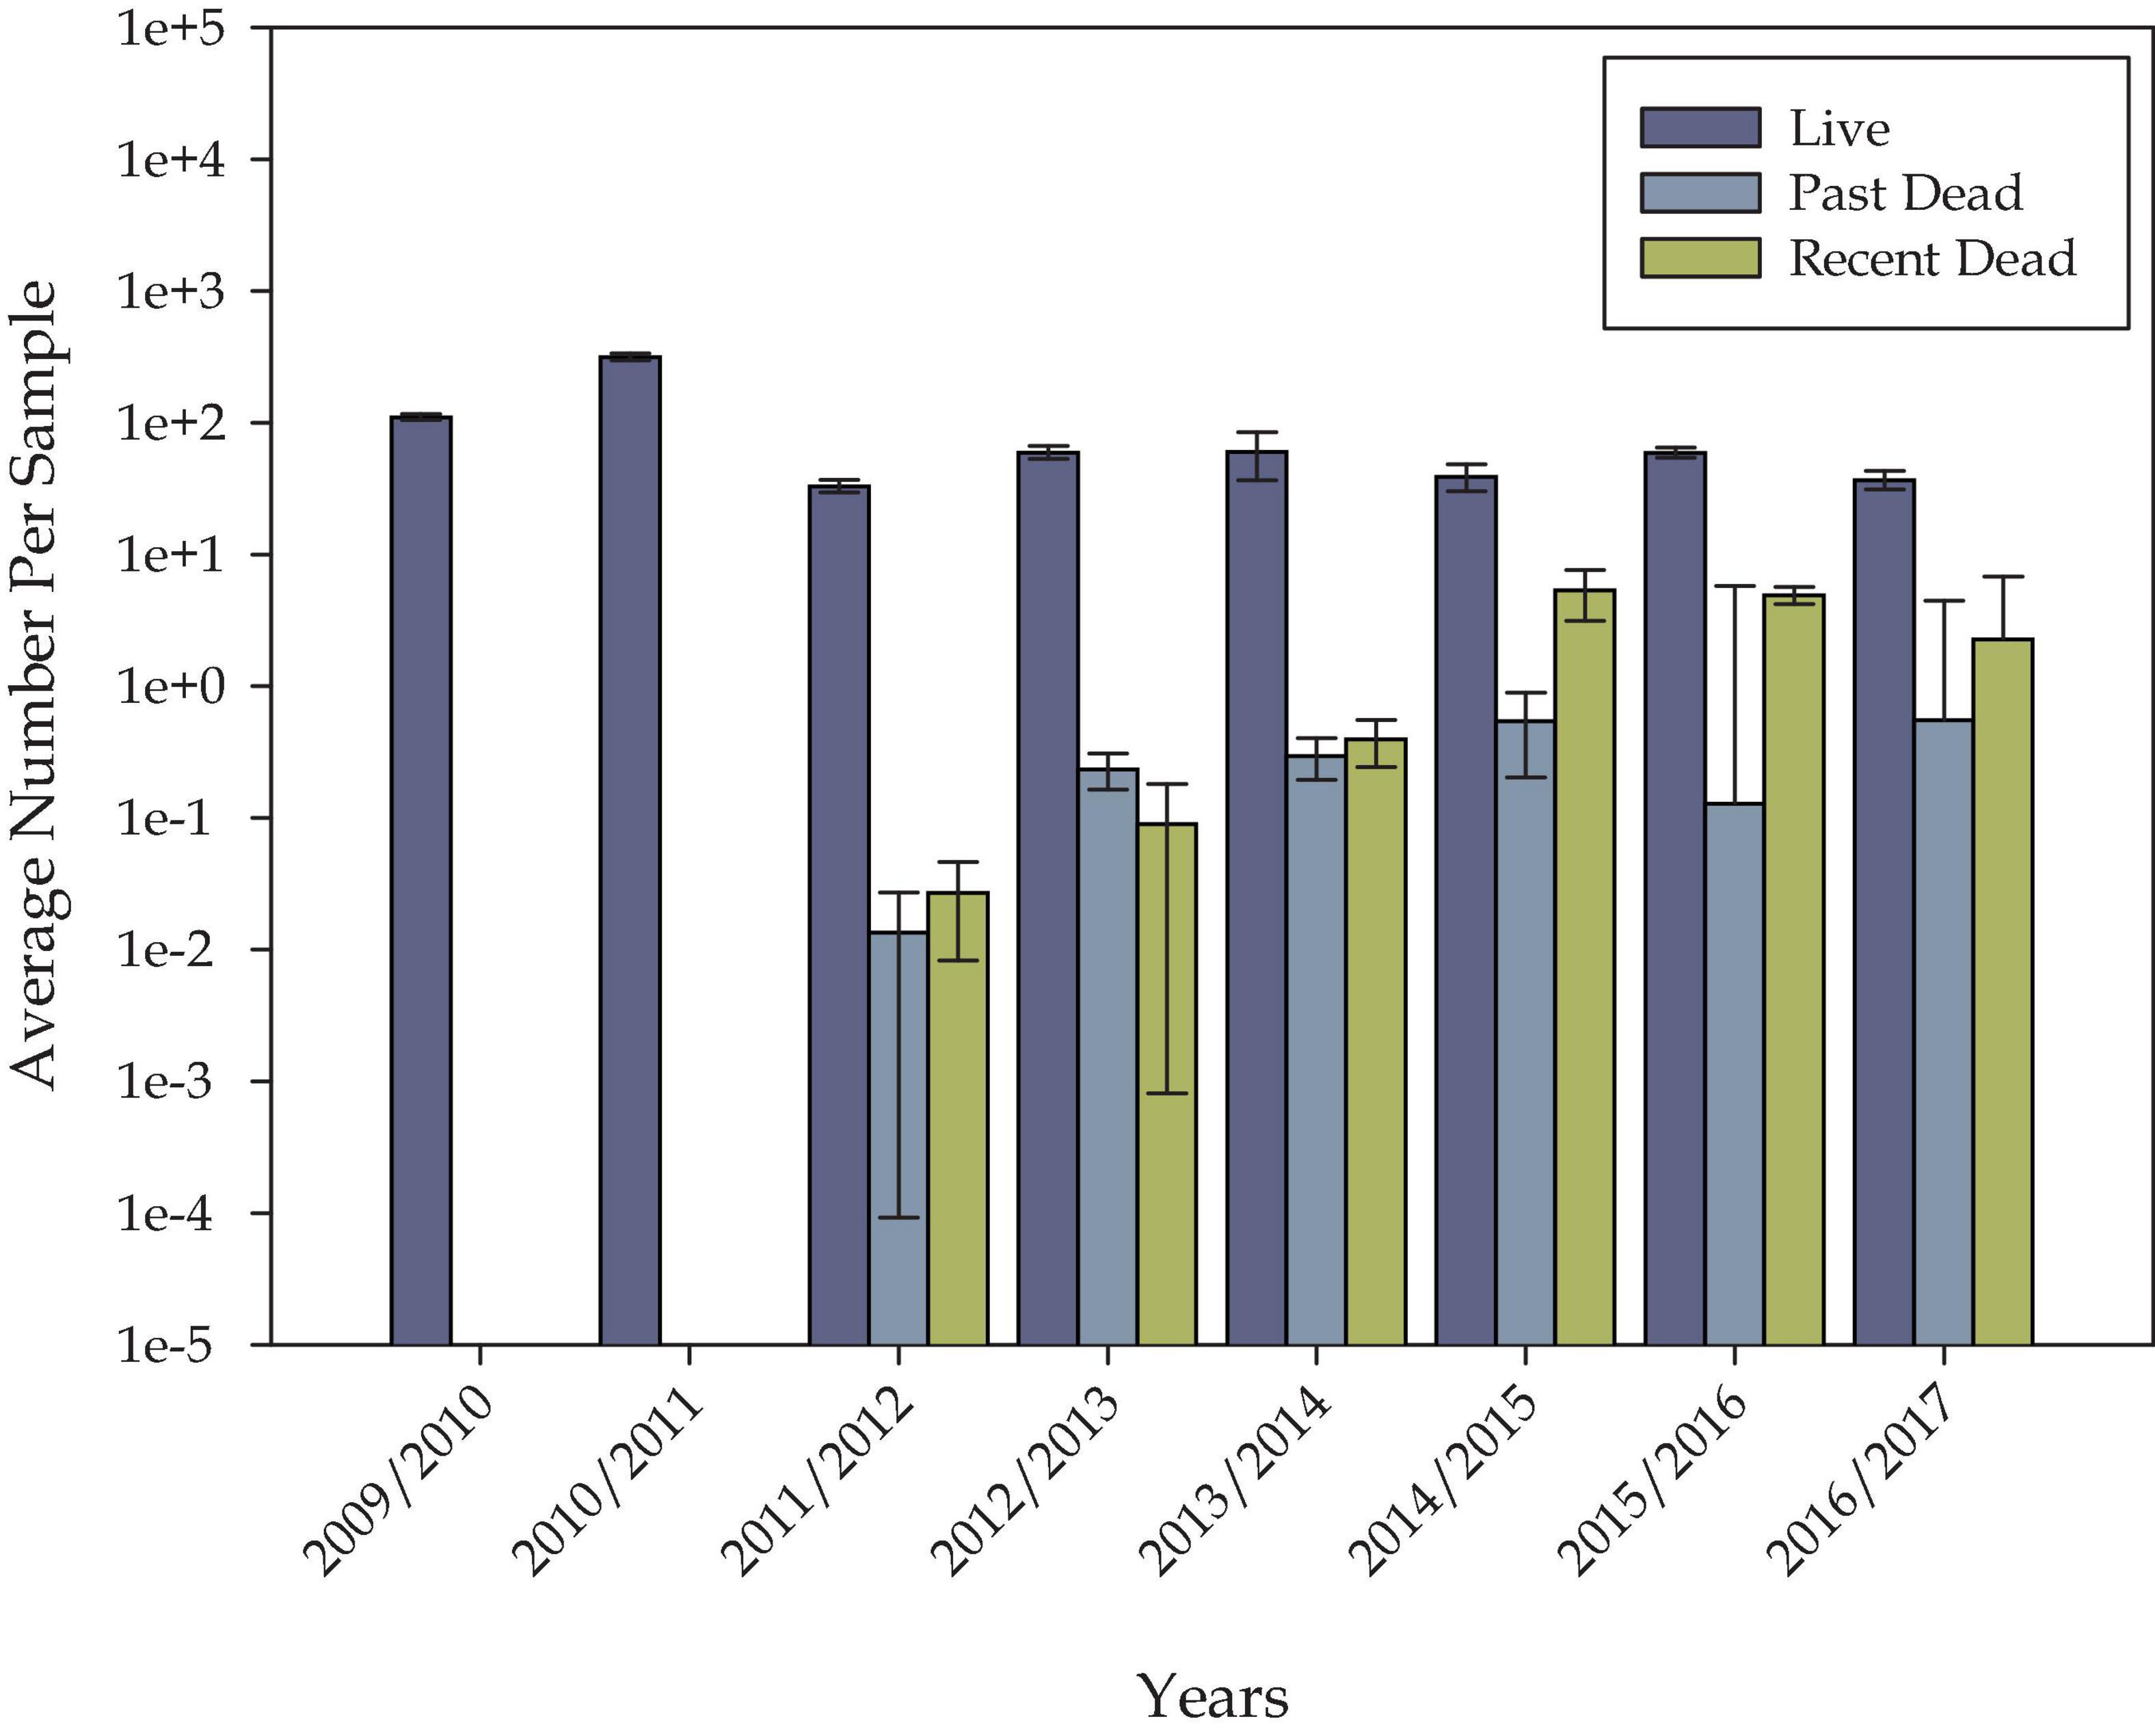
Figure 12. Total counts of past dead, recent dead, and live oysters in each oyster year within the study site. The y-axis is on a logarithmic scale to show relative numbers in each year.
Validation
Results of the validation are presented separately for dive and dredge samples (Figure 13). Validation results are also shown separately for counts of recent dead oysters and the ratio between recent dead oysters and live oysters (Figure 13). These results show that counts of recent dead oysters are generally higher when habitat suitability is below 0.2 (Figure 13A). Similarly, the ratio of recent dead/live oysters is generally below 1 when habitat suitability is greater than 0.2 for both the diver and dredge data (Figure 13B). This means that are usually more live oysters than recent dead oysters when the habitat suitability score is greater than 0.2. Specifically, for the dive data, out of 6 cases where habitat suitability is greater than 0.2, there are no cases where there are more dead oysters than live oysters. For the dredge data, out of 18 cases where habitat suitability is greater than 0.2, there are only two cases where there are more dead oysters than live oysters. Overall, the model does not discriminate well between good and poor habitat when the habitat suitability score is less than 0.2; however, when the habitat suitability score is greater than 0.2, there is a high confidence that are more live than recent dead oysters.
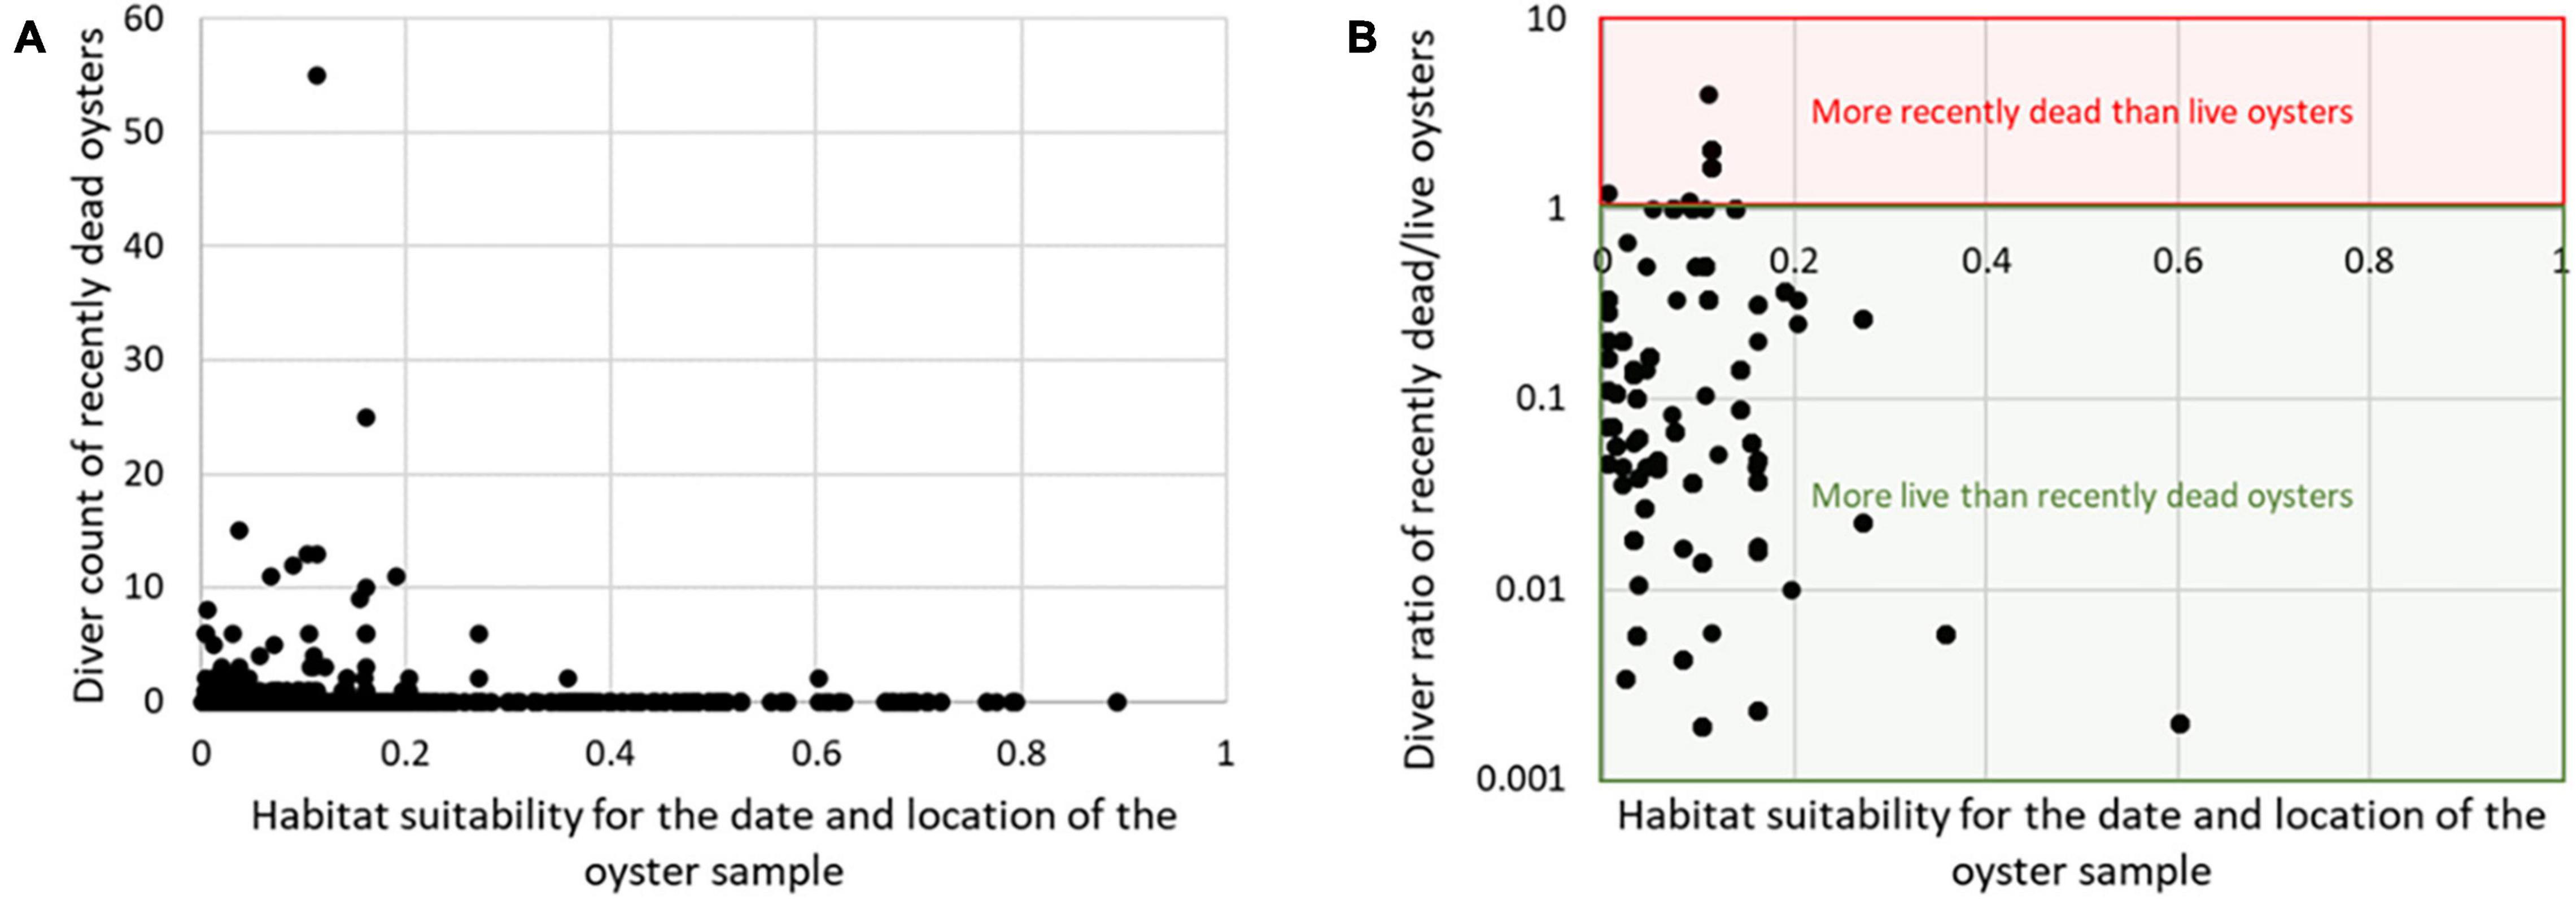
Figure 13. Validation of habitat suitability in each date and location of each oyster sample. Results are shown for absolute counts of recent dead oysters (A) and the ratio between recent dead and live oysters (B).
Temporal trends between modeled outputs and field data further support validation as increases in annual oyster mortality was parallel with annual mean values of habitat suitability (Figures 7, 11).
Discussion and Conclusion
This study presents the first validated model of temporally and spatially varying oyster habitat suitability. The model results show that when the habitat suitability score is greater than 0.2, there is a high confidence that are more live than recent dead oysters.
The model also shows that habitat suitability varies by up to 0.45 in any single location over the period of study. The identification of this temporal variability in habitat suitability is important in understanding oyster population dynamics and identifying restoration strategies. Coastal areas are dynamic and experience changes due to sea-level rise, climate change, storms, and anthropogenically engineered freshwater flows. Habitat suitability in these dynamic systems should consider both the temporal and the spatial range of environmental conditions that any species may encounter. This is a real management priority in the western Mississippi Sound and other areas. After an event that causes an oyster die off, managers are tasked with identifying resilient locations for reef restoration. Resiliency inherently involves considering the temporal dynamics of the system.
Merrill Shell Bank is the most important commercial oyster reef in Mississippi and the study area. Figure 11 shows habitat suitability at Merrill Shell varying from 0.72 to 0.05. This is a large range for habitat suitability at one location. Not surprisingly, the highest habitat suitability score at Merrill Shell occurred in 2009/2010. This is the year that the model was based upon with the assumption that habitat suitability at the mapped oyster reefs was highest in 2009/2010 because this was the most productive year between 2009 and 2017 (MDMR, 2021).
Other studies have also validated oyster habitat suitability models. Soniat and Brody (1988) developed an oyster habitat suitability model for Galveston Bay, Texas. They assumed that the habitat suitability was correlated with oyster density. They achieved an R2 of 0.72 between log-transformed oyster densities and their environmental factors (percent of bottom covered with suitable cultch, mean summer water salinity, mean abundance of living oysters, historic mean water salinity, frequency of killing floods, and substrate firmness). It is important to note that the Soniat and Brody (1988) study did not use independent data for validating model results. Theuerkauf and Lipcius (2016) validated a habitat suitability model using independent data of high and low vertical relief reefs. They found that live oyster counts were related to the habitat suitability index via a sigmoidal function. Chowdhury et al. (2019) developed and validated an oyster habitat suitability model for upper south-eastern coast of Bangladesh. They used measurements of oyster density, shell height, and a condition index to validate their model. They found that oysters were not observed in sites with a habitat suitability index of less than 0.27. Puckett et al. (2018) validated an oyster habitat suitability model in in Pamlico Sound, North Carolina, United States. They engaged stakeholders in identifying environmental factors to use in their model. They used oyster density, normalized by reef age, to validate their model. They found that habitat suitability indices at 10 existing oyster sanctuaries ranged between 0.26 and 0.66.
Disease and predation prevalence is another indicator similar to oyster density that can be a potential correlation to HSI index values. Multiple studies investigating oyster diseases and HSI have shown findings suggesting when oysters are stressed from decreased water quality (inordinate high/low water temperature and salinity) disease and predation are more prevalent (Butler, 1954; Kennedy et al., 1996; Barnes et al., 2007; Soniat et al., 2009). Within the study area of this investigation, multiple other studies looking at oyster drills (predators) and dermo have linked increase mortality rates when water quality conditions are decreased and pathogen densities are above mean levels (Cake, 1983). There are several limitations of this study. First, oyster presence data is derived largely from commercial oyster reefs. The Mississippi Department of Marine Resources only surveys commercial reefs. Other reefs exist in the area which are not mapped. Second, the study does not consider bottom substrate. Much of the substrate in the Mississippi Sound is soft and not suitable for oyster reefs. However, off-bottom oyster reefs can be successfully deployed in these areas. Third, the environmental factors including temperature, salinity, dissolved oxygen, and bathymetry are all correlated. In fact, because of the medium of water, it is virtually impossible to find spatially explicit aquatic environmental factors that are not correlated. This limits how the response curves and analysis of variable contributions can be interpreted; however, it does not limit the application of the model results.
Data used for model development was derived largely from a hydrodynamic and water quality model [described in Armandei et al. (2021), Bazgirkhoob et al. (2022)]. Maximum temperature, maximum salinity, minimum salinity, and minimum dissolved oxygen were all modeled outputs. Bathymetry was not modeled. There are advantages and disadvantages to using modeled data to represent the environmental factors. The advantage is that values for the environmental factors are available throughout the model space and time and are not limited to a small number of field-collected samples. This, in turn, allows for the suitability maps to be developed throughout the parametric space without gaps in space or time. The disadvantage is that inputs derived from the models are less reliable than field measurements. Any uncertainty or error in the hydrodynamic and water quality modeled data will cascade through to the habitat suitability model.
Overall, this model developed style of HSI and our findings suggest that with increased water quality variability in estuaries, there are potential compounded factors that may impact oyster survival resulting in the need for more complex management strategies. The usefulness of this new technique, looking at HSI spatially and temporally, can help managers compare spatial areas where historic production was successful and new candidate areas that may have not been viable in the past. With managers identifying new areas that produce higher HSI index values, conventional restoration techniques such as adding contusive substrate (clutching), seeding, and relaying adult oysters to areas may be successful toward increasing production. With climate change and conditional migration, this tool as well as others will be critical for managers to use in concert with monitoring and research to conserve and sustain marine resources in estuaries.
Data Availability Statement
The original contributions presented in the study are included in the article/supplementary material, further inquiries can be directed to the corresponding author.
Author Contributions
All authors contributed to the research, methods, and writing.
Funding
This material is based upon work that was supported by the National Institute of Food and Agriculture, U.S. Department of Agriculture, Multi-State Hatch project under Project Number MIS01 and Multistate Number W4133.
Conflict of Interest
The authors declare that the research was conducted in the absence of any commercial or financial relationships that could be construed as a potential conflict of interest.
Publisher’s Note
All claims expressed in this article are solely those of the authors and do not necessarily represent those of their affiliated organizations, or those of the publisher, the editors and the reviewers. Any product that may be evaluated in this article, or claim that may be made by its manufacturer, is not guaranteed or endorsed by the publisher.
Acknowledgments
We gratefully acknowledge the Mississippi Department of Environmental Quality (MDEQ) and the National Foundation of Wildlife and Fishery (NFWF) for organizing and funding this project (NFWF MDEQ Project Funding Agreement Number 49981). We would also like to thank the Mississippi Department of Marine Resources for sharing their oyster count data.
References
Armandei, M., Linhoss, A. C., and Camacho, R. A. (2021). Hydrodynamic modeling of the western Mississippi sound using a linked model system. Reg. Stud. Mar. Sci. 44:101685. doi: 10.1016/j.rsma.2021.101685
Austin, H., Haven, D. S., and Moustafa, M. S. (1993). The relationship between trends in a condition index of the American oyster, Crassostrea virginica, and environmental parameters in three Virginia estuaries. Estuaries 16, 362–374. doi: 10.2307/1352508
Baggett, L. P., Powers, S. P., Brumbaugh, R., Coen, L. D., DeAngelis, B., Green, J., et al. (2014). Oyster Habitat Restoration Monitoring and Assessment Handbook. Arlington, VA: The Nature Conservancy, 96.
Barnes, T. K., Volety, A. K., Chartier, K., Mazzotti, F. J., and Pearlstine, L. (2007). A habitat suitability index model for the eastern oyster (Crassostrea virginica), a tool for restoration of the Caloosahatchee Estuary, Florida. J. Shellfish Res. 26, 949–959.
Bazgirkhoob, H., Linhoss, A., and Armandei, M. (2022). A numerical tool for dissolved oxygen simulation in the western. J. Coast. Res. (in press). doi: 10.1016/j.jenvman.2017.03.020
Butler, P. A. (1954). Summary of our knowledge of the oyster in the Gulf of Mexico. U.S. Fish Wildl. Serv. 55, 479–489.
Cake, E. Jr. (1983). Habitat Suitability Index Models: Gulf of Mexico Eastern Oyster. Washington, DC: US Fish Wildl. Serv.
Casas, S. M., Lavaud, R., La Peyre, M. K., Comeau, L. A., Filgueira, R., and La Peyre, J. F. (2018). Quantifying salinity and season effects on eastern oyster clearance and oxygen consumption rates. Mar. Biol. 165:90.
Chowdhury, M. S. N., Wijsman, J. W. M., Hossain, M. S., Ysebaert, T., and Smaal, A. C. (2019). A verified habitat suitability model for the intertidal rock oyster, Saccostrea cucullata. PLoS One 14:e0217688. doi: 10.1371/journal.pone.0217688
Coen, L. D., Brumbaugh, R. D., Bushek, D., Grizzle, R., Luckenbach, M. W., Posey, M. H., et al. (2007). Ecosystem services related to oyster restoration. Mar. Ecol. Prog. Ser. 341, 303–307.
Elith, J., Phillips, S. J., Hastie, T., Dudík, M., Chee, Y. E., and Yates, C. J. (2011). A statistical explanation of MaxEnt for ecologists. Divers. Distrib. 17, 43–57.
Gledhill, J. H., Barnett, A. F., Slattery, M., Willett, K. L., Easson, G. L., Otts, S. S., et al. (2020). Mass mortality of the eastern oyster Crassostrea virginica in the western Mississippi sound following unprecedented Mississippi river flooding in 2019. J. Shellfish Res. 39, 235–244.
Kennedy, V. S., Newell, R. I. E., and Shumway, S. (1996). “Natural environmental factors,” in The Eastern Oyster Crassostrea virginica, eds V. S. Kennedy, R. I. E. Newell, and A. F. Eble (College Park, MD: Maryland Sea Grant College), 467–513.
Linhoss, A. C., Camacho, R., and Ashby, S. (2016). Oyster habitat suitability in the northern Gulf of Mexico. J. Shellfish Res. 35, 841–849. doi: 10.2983/035.035.0412
Lowe, M. R., Sehlinger, T., Soniat, T. M., and La Peyre, M. K. (2017). Interactive effects of water temperature and salinity on growth and mortality of eastern oysters, Crassostrea virginica: a meta-analysis using 40 years of monitoring data. J. Shellfish Res. 36, 683–697.
MDMR (2021). DMR Shellfish Bureau. 2021. Available online at: https://dmr.ms.gov/shellfish/ (accessed May 5, 2021).
NOAA Fisheries Eastern Oyster Biological Review Team (2007). Status review of the eastern oyster (Crassostrea virginica) report to the National Marine Fisheries Service, Northeast Regional Office. East Oyster Biol. Rev. 115. Available online at: https://spo.nmfs.noaa.gov/sites/default/files/TMSPO88.pdf
Pace, S. M., Poussard, L. M., Powell, E. N., Ashton-Alcox, K. A., Kuykendall, K. M., Solinger, L. K., et al. (2020). Dying, decaying, and dissolving into irrelevance: first direct in-the-field estimate of Crassostrea virginica shell loss—a case history from Mississippi sound. J. Shellfish Res. 39, 245–256. doi: 10.2983/035.039.0206
Phillips, S. J., Anderson, R. P., and Schapire, R. E. (2006). Maximum entropy modeling of species geographic distributions. Ecol. Model. 190, 231–259. doi: 10.1016/j.ecolmodel.2005.03.026
Puckett, B. J., Theuerkauf, S. J., Eggleston, D. B., Guajardo, R., Hardy, C., Gao, J., et al. (2018). Integrating larval dispersal, permitting, and logistical factors within a validated habitat suitability index for oyster restoration. Front. Mar. Sci. 5:76. doi: 10.3389/fmars.2018.00076
Soniat, T. M., and Brody, M. S. (1988). Field validation of a habitat suitability index model for the American oyster. Estuaries 11, 87–95. doi: 10.2307/1351995
Soniat, T. M., Hofmann, E. E., Klinck, J. M., and Powell, E. N. (2009). Differential modulation of eastern oyster (Crassostrea virginica) disease parasites by the El-Ni o-Southern Oscillation and the North Atlantic Oscillation. Int. J. Earth Sci. 98, 99–114. doi: 10.1007/S00531-008-0364-6
Sparks, A. K., Boswell, J. L., and Mackin, J. G. (1958). Studies on the comparative utilization of oxygen by living and dead oysters. Proc. Natl. Shellfish. Assoc. 48, 92–102. doi: 10.2307/j.ctv1zm2v56.18
Theuerkauf, S. J., and Lipcius, R. N. (2016). Quantitative validation of a habitat suitability index for oyster restoration. Front. Mar. Sci. 3:64. doi: 10.3389/fmars.2016.00064
USGS (2021). 2014 USGS CoNED Topobathymetric DEM (1888 to 2013): Northern Gulf of Mexico 2021. Available online at: https://coast.noaa.gov/htdata/raster2/elevation/Louisiana_Coned_Topobathy_DEM_2014_4958/ (accessed May 5, 2021).
Keywords: Crassostrea virginica, Mississippi Sound, hydrodynamic model, water quality model, habitat suitability model
Citation: Linhoss A and Mickle P (2022) A Field Validated Model of Temporal Variability in Oyster Habitat Suitability. Front. Mar. Sci. 9:778936. doi: 10.3389/fmars.2022.778936
Received: 17 September 2021; Accepted: 10 January 2022;
Published: 18 February 2022.
Edited by:
Angel Pérez-Ruzafa, University of Murcia, SpainReviewed by:
Romuald Lipcius, College of William & Mary, United StatesGorka Bidegain, University of the Basque Country, Spain
Copyright © 2022 Linhoss and Mickle. This is an open-access article distributed under the terms of the Creative Commons Attribution License (CC BY). The use, distribution or reproduction in other forums is permitted, provided the original author(s) and the copyright owner(s) are credited and that the original publication in this journal is cited, in accordance with accepted academic practice. No use, distribution or reproduction is permitted which does not comply with these terms.
*Correspondence: Anna Linhoss, YWxpbmhvc3NAYXVidXJuLmVkdQ==