 Yongchuang Shi
 Xiaomin Zhang3
- 1Key Laboratory of East China Sea and Oceanic Fishery Resources Exploitation and Utilization, Ministry of Agriculture, East China Sea Fisheries Research Institute, Chinese Academy of Fishery Sciences, Shanghai, China
- 2Key and Open Laboratory of Oceanic Laboratory of Remote Sensing Information Technology in Fishing Resource, East China Sea Fisheries Research Institute, Chinese Academy of Fishery Sciences. Shanghai, China
- 3Shandong Provincial Key Laboratory of Restoration for Marine Ecology, Shandong Marine and Fishery Research Institute, Yantai, China
- 4College of Marine Culture and Law, Shanghai Ocean University, Shanghai, China
Chub mackerel (Scomber japonicus), Pacific saury (Cololabis saira), and Pacific sardine (Sardinops sagax) are key economic and ecological species in the Northwest Pacific Ocean (NPO). In recent years, there have been some interannual changes in their catches due to the increasing number of fishing vessels and climate change. With the establishment of the North Pacific Fisheries Commission (NPFC) to better manage these three species, it is particularly important to develop an accurate understanding of the stock status of those fisheries resources. According to the production statistics of Chub mackerel, Pacific saury, and Pacific sardine in the NPO, the length-based Bayesian evaluation (LBB) method was adopted to conduct a stock assessment on the three fisheries in this study. Research results show that the asymptotic length of Chub mackerel in the NPO Linf is 37.54 cm, with the parameter ratios of Lc/Lc_opt = 1.10, F/M = 0.57, B/B0 = 0.65, and B/BMSY = 1.10. The asymptotic length of Pacific saury in the NPO Linf is 33.24 cm, with the ratios of Lc/Lc_opt = 1.10, F/M = 0.14, B/B0 = 0.82, and B/BMSY = 2.10. While the asymptotic length of Pacific sardine Linf is 39.33 cm, with the ratios of Lc/Lc_opt = 1.20, F/M = 0.20, B/B0 = 0.77, and B/BMSY = 2.20. At present, the three species in the NPO are in a healthy state and have not yet been overfished. Body length bin may affect the estimation of some parameters without compromising the estimation of stock status. Our study indicates that the LBB model serves as an efficient method to evaluate the fisheries resources in the NPO, especially when length frequencies are the only available data. Hopefully, the results in this study can provide technical support for the conservation and management of Chub mackerel, Pacific saury, and Pacific sardine in the NPO.
Introduction
Chub mackerel (S. japonicus), Pacific saury (C. saira), and Pacific sardine (S. sagax) are the ecologically and commercially important species inhabiting the Northwest Pacific Ocean (NPO) (Tian et al., 2004; Yukami et al., 2009). Japanese fishermen were pioneers to exploit these species, and in recent years, the major countries and island constituencies harvesting these three species include Japan, China, Chinese Taipei, Russia, and Korea (Kawai et al., 2002; Ueno et al., 2017). The annual catches of Chub mackerel, Pacific saury, and Pacific sardine recorded in 2019 were about 64,364, 51,400, and 24,773 tons in China, which accounted for 14.00, 12.26, and 11.08% of the global production, respectively (FAO, 2019). Influenced by an increasing number of fishing vessels under the global development of these fisheries, coupled with marine climate and environmental change, these resources fluctuated, and their harvest has gone through interannual changes (Shi et al., 2020). Since 2015, Chub mackerel and Pacific saury have been listed among the priority fish species by the North Pacific Fisheries Commission (NPFC), and the Pacific sardine is also considered as one of the species to be managed in the future (North Pacific Fisheries Commission [NPFC], 2017). Due to their increasing commercial and ecological values, the research and management of these three small pelagic species in the NPO have gained much interest and concern in the field of fishery science (Arnold and Heppell, 2014).
According to the report of FAO (2016, 2019), only about 11% of fisheries in the world are assessed by sophisticated models or have been properly managed. A precise stock assessment will contribute to the stock management, sustainable development, and oceanic ecosystem studies of target fisheries (Jiao et al., 2011; Punt, 2011; Guan et al., 2016). However, the scarcity of long series of age structure data and stock abundance indices is unavailable in data-limited fisheries, which makes it incredibly tough to assess the stock status using conventional models (Magnusson and Hilborn, 2007; Wang et al., 2016). Chub mackerel, Pacific saury, and Pacific sardine fisheries are typical data-limited fisheries in the NPO. They have the biological characteristics of a short life cycle and a long migration route, and their populations are extremely sensitive to large-scale climatic events and regional environmental changes in the NPO (Watanabe and Yatsu, 2004; Yatsu et al., 2005; Iwahashi et al., 2006). At present, there are some stock assessment studies on these three species. For instance, Shi et al. (2018) carried out the stock assessment and risk analyses of different management strategies for the Pacific saury using a Bayesian Schaefer surplus production model, wherein they identified the stock status as “good” and immune to overfishing or overfished. North Pacific Fisheries Commission [NPFC] (2017) used the Bayesian state-space model to assess the stock dynamics of the Pacific saury in the NPO. Guan et al. (2014) simulated two subpopulations of Chub mackerel based on the meta-population concept by setting up 12 scenarios. Although certain research results have been obtained, there are still some uncertainties in the estimation of parameters and biological reference points (Wetzel and Punt, 2011). For example, these studies are based on the surplus production model, in which the population growth, mortality, and recruitment converge are in one equation. Therefore, errors in individual growth are inevitably ignored in the stock assessment. Besides, the effects of environmental factors and process errors are not considered, which may bring uncertainty to the model results. Hence, it is essential to conduct effective stock assessments, and scholarly attention needs to be devoted to the sustainable use and fishery management (Ma et al., 2021). As attaining high-quality fisheries statistics within a short period of time can be a challenging task, the data-poor approach has attracted more and more attention from RFMOs. In recent years, in order to meet the increasing demand for scientific management of data-limited fisheries, various data-limited methods have been developed to perform the stock assessment for these fisheries, which are also the hot spot of current fisheries stock assessment (MacCall, 2009; Dick and MacCall, 2011; Martell and Froese, 2013; Hordyk et al., 2015; Froese et al., 2018; Rudd and Thorson, 2018). The length-based data-limited methods, such as Length-Based Spawning Potential Ratio (LBSPR) model, Length-Based Integrated Mixed Effects (LIME) model, and Length-Based Bayesian (LBB) model, have become popular due to their easy availability of the length-frequency (LF) data (Klaer et al., 2012; Chong et al., 2020). Among them, the LBB method can be applied to estimate the related parameters and biological reference points by Bayesian Monte Carlo Markov Chain (MCMC) approach based on the size composition data from commercial catches (Froese et al., 2018). Its main assumption is that recruitment, growth, and mortality are constant, and the LF data can be representative of that exploited stock (Froese et al., 2018). The LBB model has been used to evaluate the sock status of some data-limited stocks. For example, Wang et al. (2020) assessed eight common and commercially important marine fishes using the LBB method. Liang et al. (2020) applied this model to 14 fish and invertebrate stocks in the coastal waters of China to estimate their growth, lengths at first capture, and current relative biomass from the LF data. Those researches indicated that the LBB model can provide reliable results for the stock status estimation of data-limited fisheries.
In this study, the LBB approach was used to analyze the three populations of small pelagic species captured by the Chinese commercial fishing vessels operating in the NPO. The objectives of this research were to: (1) identify life history parameters and explore the biomass depletion levels of these three species populations caused by fishing, (2) investigate the impact of different length bins on the estimated results of the LBB model, and (3) compare the stock assessment results of these three species between LBB model and previous researches. Results of this study could provide technical support for the sustainable use and scientific management of these three fisheries.
Materials and Methods
Data Resources
The study area was distributed between 35–50°N and 145–170°E covering the main fishing ground of these three species in the NPO. According to the existing data, the LF data of Chub mackerel were obtained from commercial fishing in the NPO from 2016 to 2018. The LF data of Pacific saury and Pacific sardine were derived from commercial fishing in the NPO in 2017. The length and weight were measured for each specimen, and the number of measured specimens for all three species ranged from 872 to 6,091, with sizes including both small- and large-sized individuals, representing a wide size range. In this study, the LF data of three species were obtained from commercial fishing in China, and each fishery had only one kind of fishing gear instead of multiple kinds of fishing gears, which meet the requirements of the LBB model. The basic information of three small pelagic species used in this study is shown in Table 1.
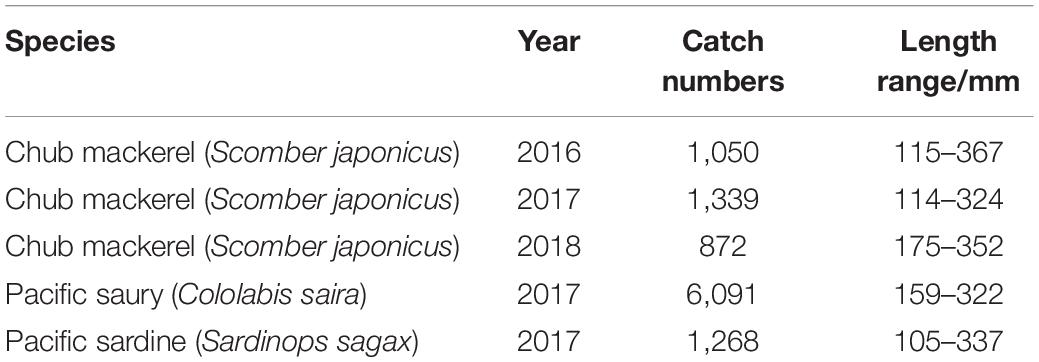
Table 1. Summary of year, the size range, and the number of individuals measured of three species collected in the Northwest Pacific Ocean (NPO).
Length-Based Bayesian Evaluation Model
The LBB model is a fast and simple approach for assessing stock status using the LF databases on the MCMC approach (Froese et al., 2018). The species that are suitable for the LBB method are those that continue to grow throughout their lives, for instance, invertebrates and commercial fishes (Pons et al., 2020). In the LBB model, only the LF data of a fishery representing the true population structure are required as input since these use prespecified priors on parameters. While, sometimes, required prior parameters including the asymptotic length (Linf), mean length at first capture (Lc), and relative natural mortality (M/K) may be input manually by users if they have good estimates of these parameters from independent studies (Carruthers et al., 2016). LBB estimates several parameters of target species, including Lc, Linf, relative fishing mortality (F/M), and M/K. In this study, we just listed the basic information and formulas [refer to Froese et al. (2018) for more details].
The growth function of von Bertalanffy (1938) was used in the LBB model for describing the growth in size (Pauly, 1998).
where Lt is the length when the age is t, K is the rate by which Linf is approached (year–1), and t0 is the theoretical age when the length is zero (Froese et al., 2018).
If there were no mortality, most species would approach Linf, which is expressed as follows:
where Nt1 represents the population number at t1, and Nt2 is the population number at t2. Z indicates the instantaneous rate of total mortality, including fishing and natural mortality (Pauly, 1998). For each species, the lengths affected by partial selection are given by the ogive function expressed as follows:
where SL means the fraction of individuals that are retained by the gear at length L, and α describes the steepness of the ogive (Quinn and Deriso, 1999; Froese et al., 2018).
The combination and rearrangement of Eqs 1–3 lead to the following equations:
where NLi is the individual number when the length is Li, NLi–1 represents the number of individuals at length Li–1, and CLi is the number of individuals vulnerable to the gear when the length is Li. In the LBB model, the ratios F/M and M/K are output, i.e., F/M = (F/K)/(M/K), which can be deduced by fitting Eq. 4 to the LF data.
Relative yield-per-recruit (Y’/R) can be computed by the following equation (Froese et al., 2018):
Assuming catch per unit effort (CPUE) proportional to biomass, Eq. 6 divided by F/M gives the following equation:
The relative biomass in the potentially exploited phase of the population is expressed as follows when the stock is unexploited:
where B0 is the unexploited biomass, and the ratio B/B0 is obtained from Eqs 7, 8 as follows:
Meanwhile, we have the following equation:
where Lopt is the length when a cohort of fish has its peak biomass (Holt, 1958). The optimal length at first capture Lc_opt is obtained from the following equation:
A proxy for relative biomass maximum sustainable yield (MSY; BMSY/B0) can be obtained by means of rerunning Eqs 6–9 with F/M = 1 and Lc = Lc_opt. Based on these parameters, the current relative stock size (B/BMSY) was estimated, which was converted into qualifiers of fisheries status (Palomares et al., 2018). According to the values of estimated B/B0 and B/BMSY, we can classify the stocks as described by Palomares et al. (2018). The results of the LBB model can directly be used in the provisional management of data-limited fisheries populations based on the two basic and simple rules: if the relative stock size B/B0 < BMSY/B0, catches of this species should be reduced; and if Lc < Lc_opt, fishing would better start from larger sizes.
In this study, the LF data obtained for each species were sampled for at least 1 year, with a wide range of sample sizes representing the population structure. In addition, to reduce uncertainty in LBB results, apart from LF data, species having asymptotic lengths obtained from prior studies were also included in the input information database (Suyama et al., 1992; Watanabe et al., 1995; Shiraishi et al., 2008). Data analyses in this study were performed using the LBB software, which is installed in the R-core environment.
Sensitivity Analysis
To fully consider the influence of length bin on the evaluation results of the LBB model, the body length of three species was grouped by the length bins of 5, 10, and 15 mm, respectively, and the results of three scenarios were then compared. The scenario of length bin equal to 10 mm was used for the base case, and the other scenarios were sensitive analysis scenarios. The goodness-of-fit coefficient (R2) was used to evaluate the fitting goodness as follows.
where y is the relative frequency, is the predicted relative frequency, is the mean of y, and i is the number of the relative frequency data. The length bin and the prior value of LBB parameters of the three species are shown in Table 2.
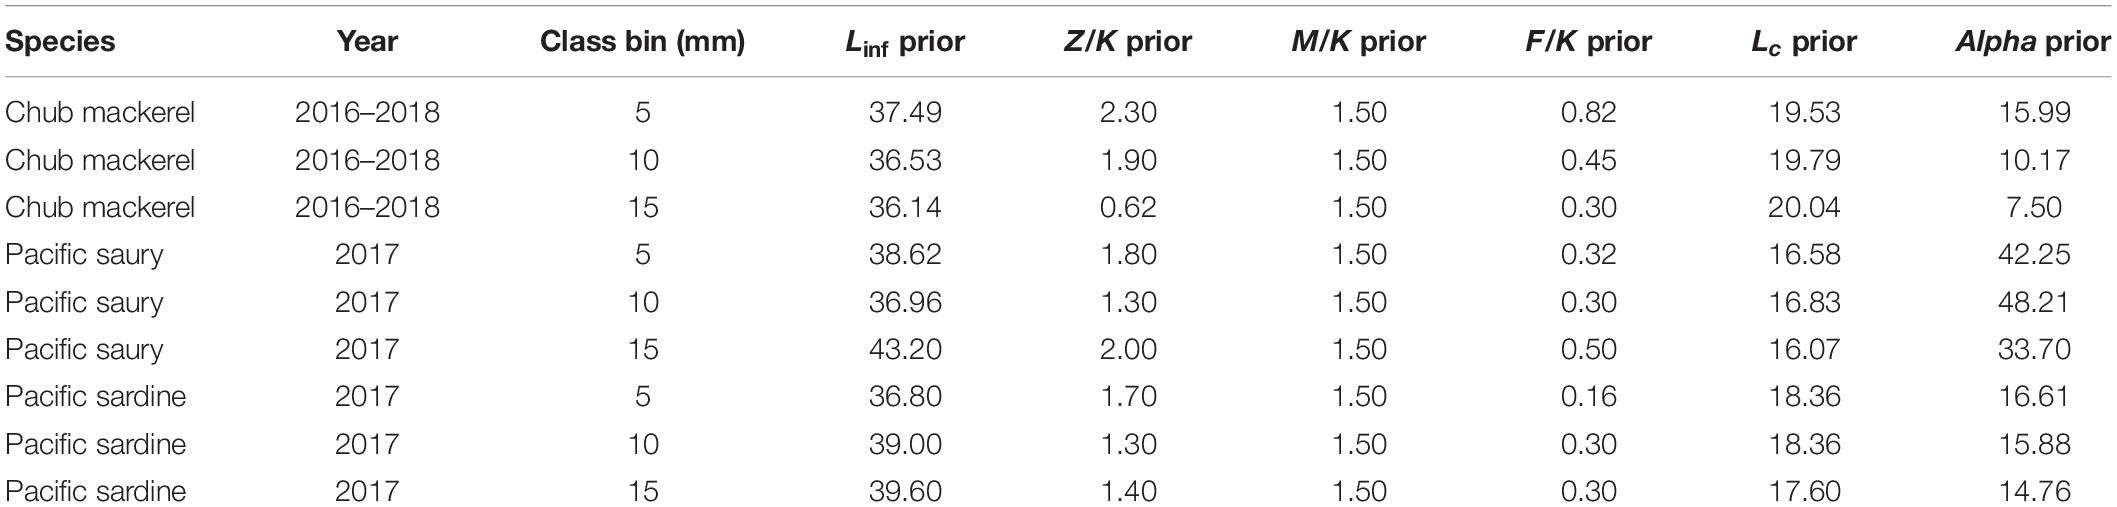
Table 2. Scenarios and priors of three species used in this study.
Results
Stock Status of Chub Mackerel
Figure 1 shows the estimated results of the LBB model under different length bins. According to the goodness-of-fit measurements, the R2 values of three length bins were 0.698, 0.732, and 0.683, respectively, which means that the length bin of 10 mm made the analysis fit better. Chub mackerel, which reaches a maximum length of 37.54 cm under the base case (Figure 1B), is widely distributed in the NPO. The estimate of F/M = 0.57 indicates that Chub mackerel fishery was not subject to increasing fishing pressure; meanwhile, the estimate parameters of B/B0 = 0.65, and B/BMSY = 1.10 confirm that the stock of Chub mackerel is in a good state in the NPO. The estimate of Lc/Lc_opt = 1.10 implies that large fishes are still present (Figure 1 and Table 3).

Figure 1. Assessment results of the length-based Bayesian (LBB) method to Chub mackerel in the Northwest Pacific Ocean (NPO).
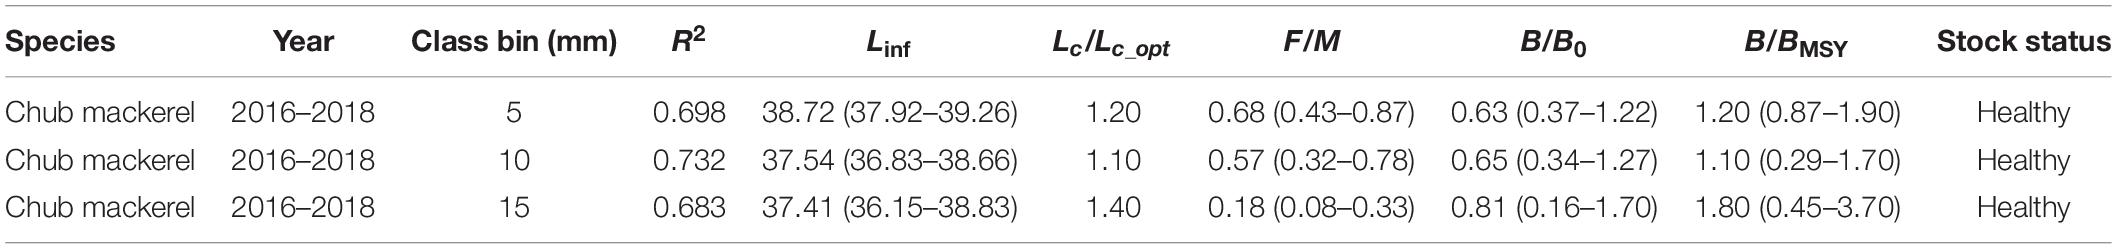
Table 3. Summary of the length-based Bayesian (LBB) results for Chub mackerel.
Stock Status of Pacific Saury
Figure 2 shows the stock assessment results for Pacific saury using the LBB method. The R2 values of three length bins were 0.779, 0.796, and 0.700, respectively. Therefore, the scenario of length bin equal to 10 mm can be used for the stock status estimation of Pacific saury. Pacific saury is wildly distributed in the international waters of the NPO ranging from subarctic to subtropical region. This species reaches a maximum length of 33.24 cm under the base case (Figure 2B), and in this study, the parameter F/M = 0.14 indicates that the current fishing pressure will not damage the stock of Pacific saury. The ratios B/B0 = 0.82 and B/BMSY = 2.10 suggest that its biomass is at a high level. According to the result of ratio Lc/Lc_opt in this study, the value is above unity, implying the presence of large specimens (Figure 2 and Table 4).
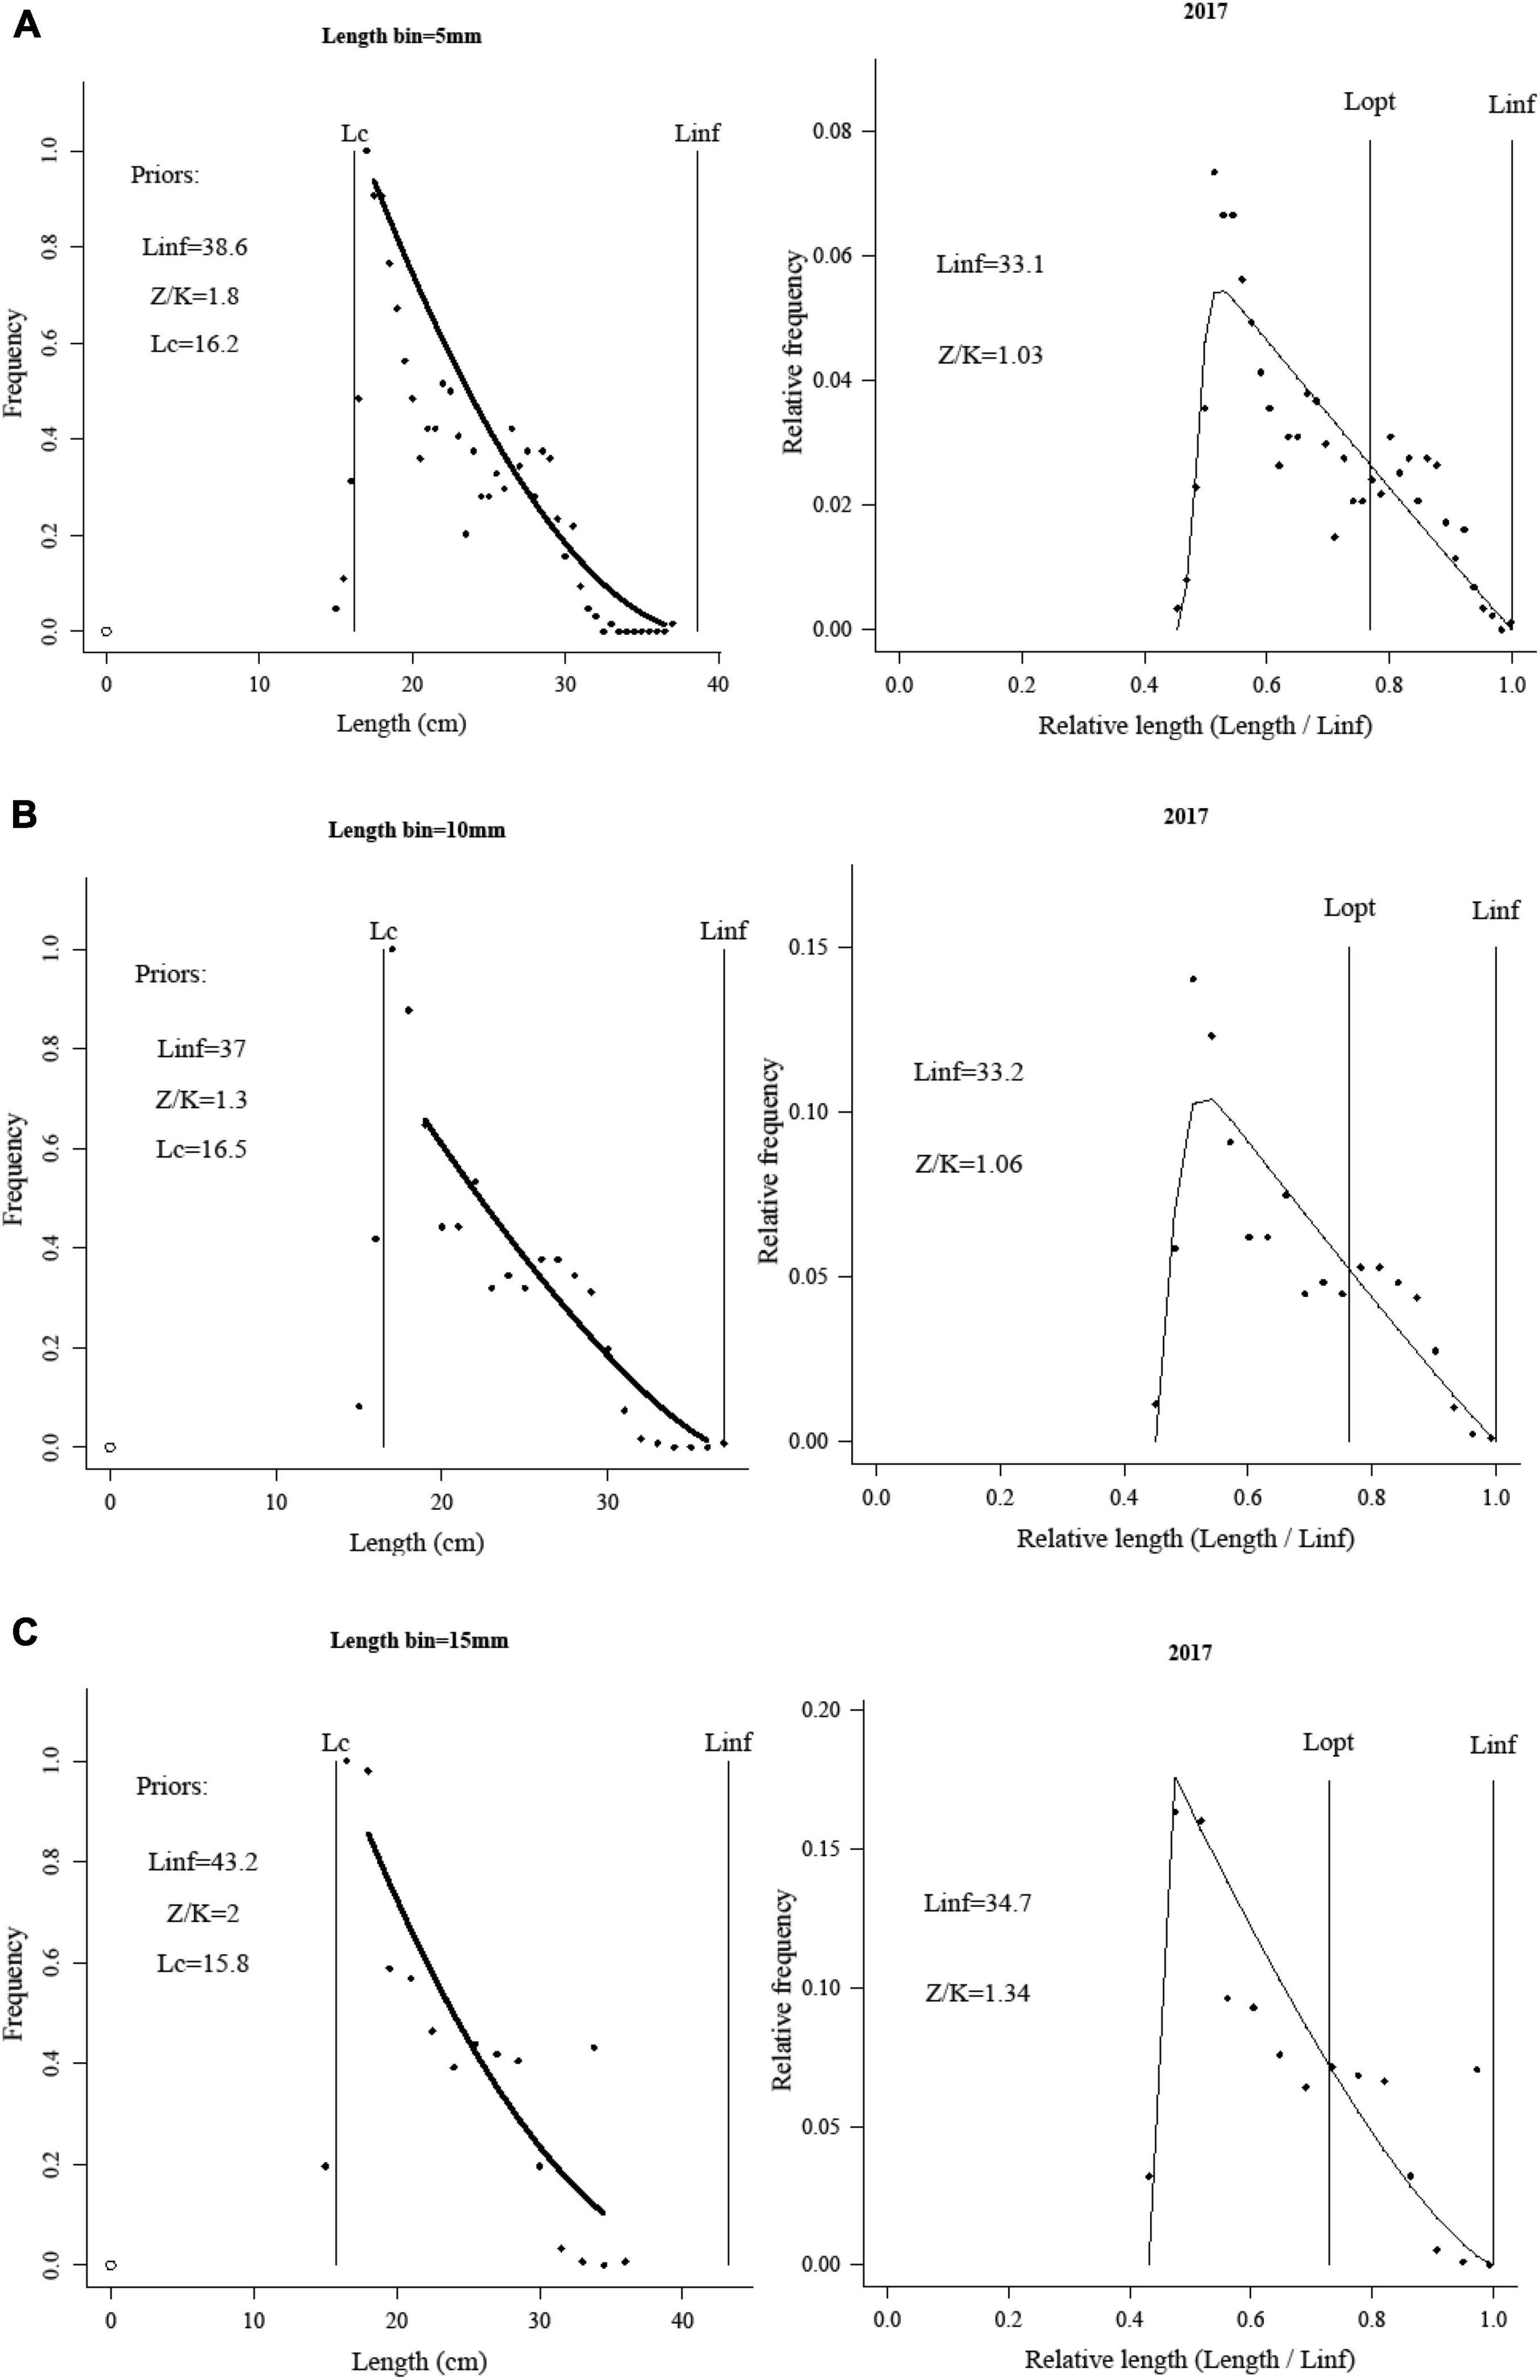
Figure 2. Assessment results of length-based Bayesian (LBB) method to Pacific saury in the Northwest Pacific Ocean (NPO).
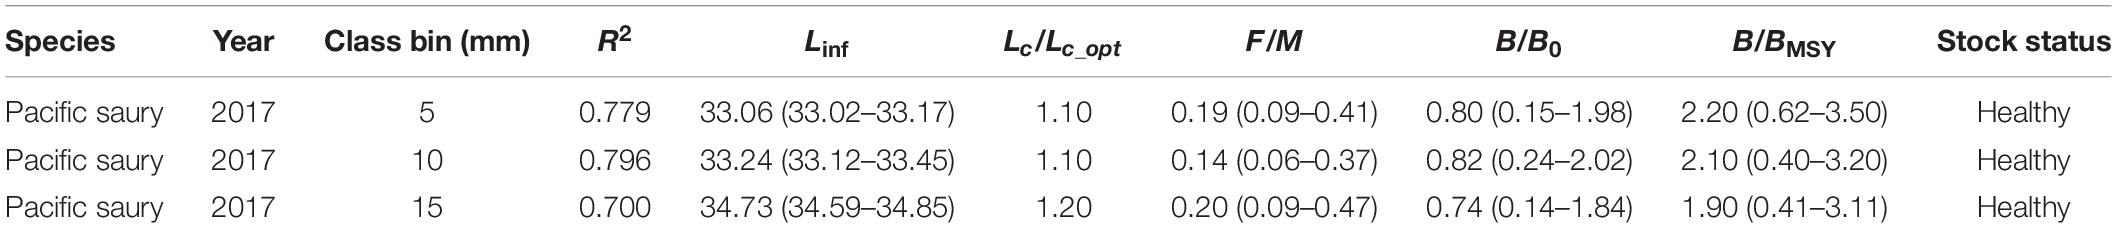
Table 4. Summary of length-based Bayesian (LBB) results for Pacific saury.
Stock Status of Pacific Sardine
The scenario of length bin equal to 10 mm was chosen to evaluate the stock status of Pacific sardine according to the R2 value (R2 of length bin 5 mm is 0.892, R2 of length bin 10 mm is 0.910, and R2 of length bin 15 mm is 0.865). The stock of Pacific sardine, which reaches a maximum length of 39.33 cm under the base case, is in a good state in the NPO (Figure 3B). The parameters F/M = 0.20, B/B0 = 0.77, and B/BMSY = 2.20 indicate that the stock status of Pacific sardine is healthy and the fishing pressure may not be the major cause for the fluctuation in the biomass of this species. In addition, there are still a large number of big specimens in the stock of Pacific sardine (Lc/Lc_opt > 1) (Figure 3 and Table 5).
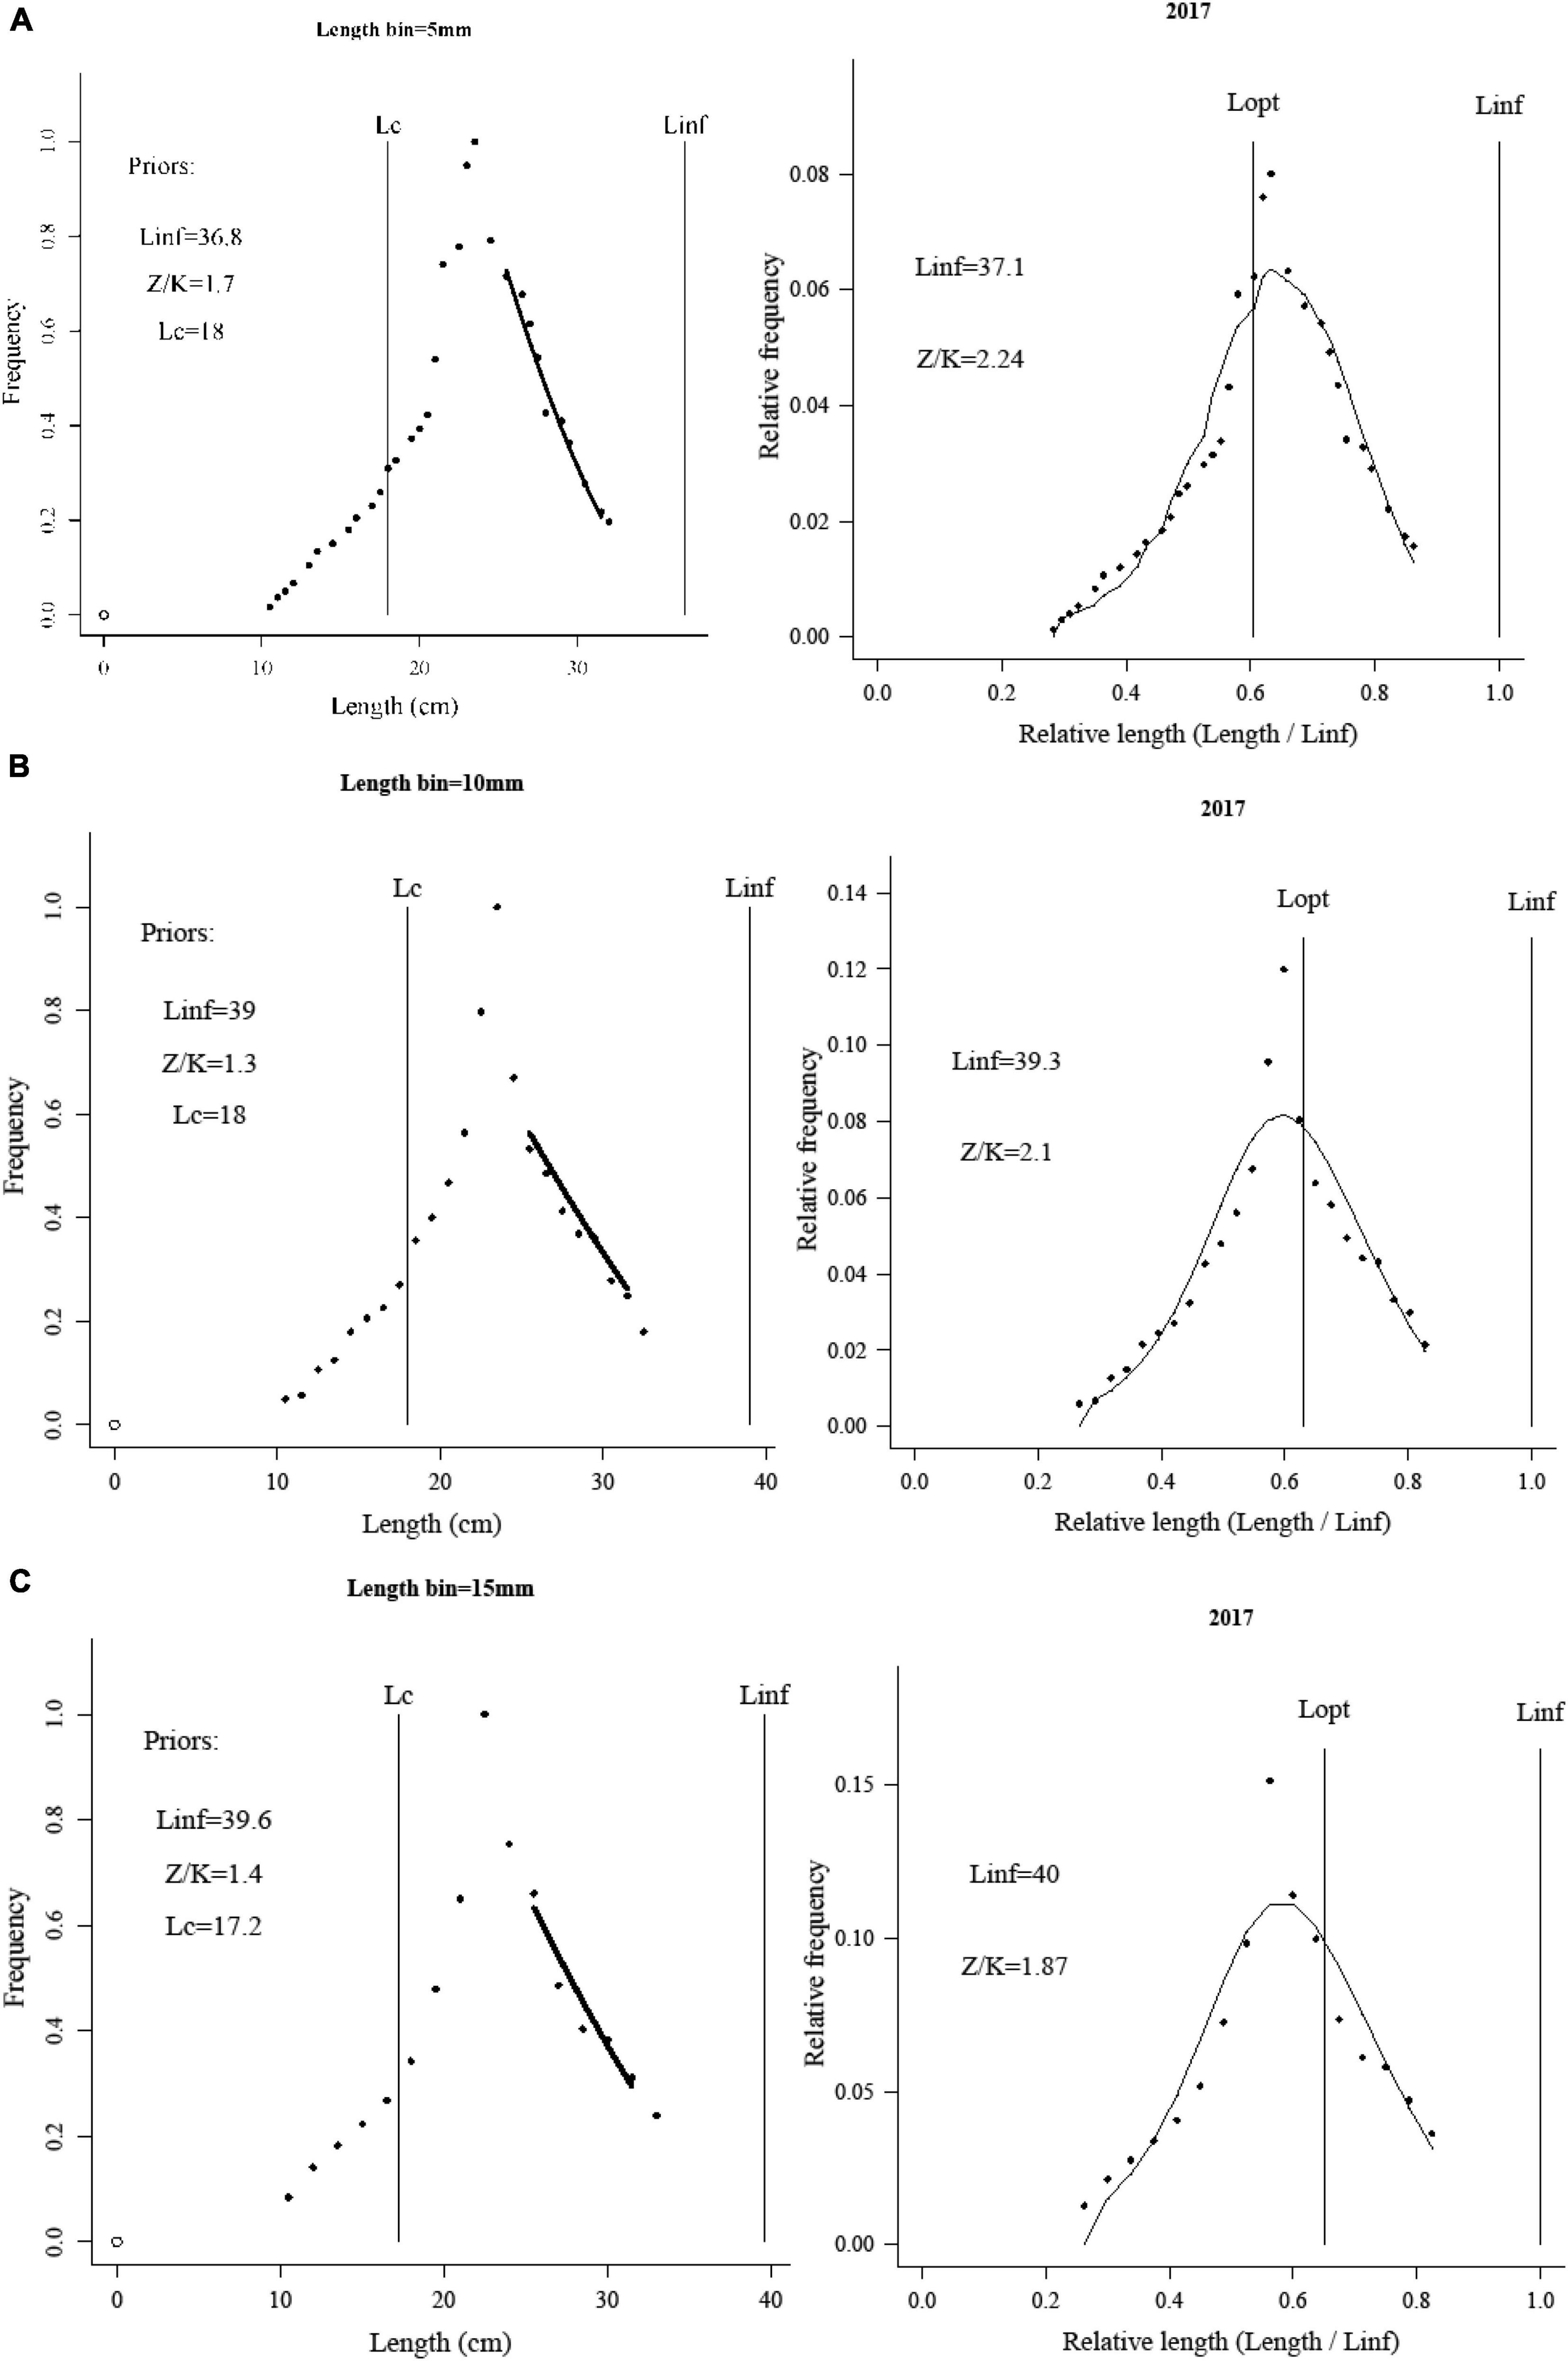
Figure 3. Assessment results of length-based Bayesian (LBB) method to Pacific sardine in the Northwest Pacific Ocean (NPO).
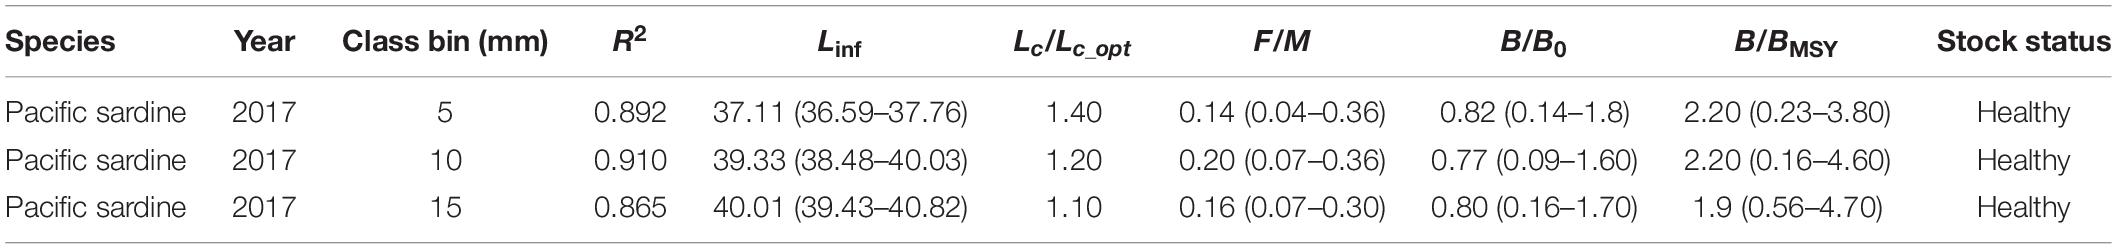
Table 5. Summary of length-based Bayesian (LBB) results for Pacific sardine.
Sensitivity Analysis
Three levels of length bins were applied to analyze the influence of the length bin on the evaluated results of the LBB model. Figure 4 shows the estimated key parameters based on different length bins. For Chub mackerel, the estimated Lc/Lc_opt ratios varied from 1.10 to 1.40 with the length bin, and the F/M ratios ranged from 0.68 to 0.18. When the length bin varied from 5 to 15 mm, the B/B0 ratios varied from 0.63 to 0.81, with their B/BMSY ratios varying from 1.2 to 1.8 (Figure 4A). For Pacific saury, Lc/Lc_opt ratios ranged from 1.1 to 1.2 with the changes of length bin, and the F/M ratios ranged from 0.14 to 0.20. The B/B0 ratios ranged from 0.74 to 0.82, with their B/BMSY ratios varying from 1.9 to 2.2 (Figure 4B). For Pacific sardine, the estimated Lc/Lc_opt ratios ranged from 1.10 to 1.40, and the F/M ratios ranged from 0.14 to 0.20. The B/B0 ratios ranged from 0.77 to 0.82, with their B/BMSY ratios varying from 1.9 to 2.2 (Figure 4C). On comparing the effects of different length bins on the estimated key parameters, it was discovered that although the parameter values had a certain change, the change range was not noticeable.
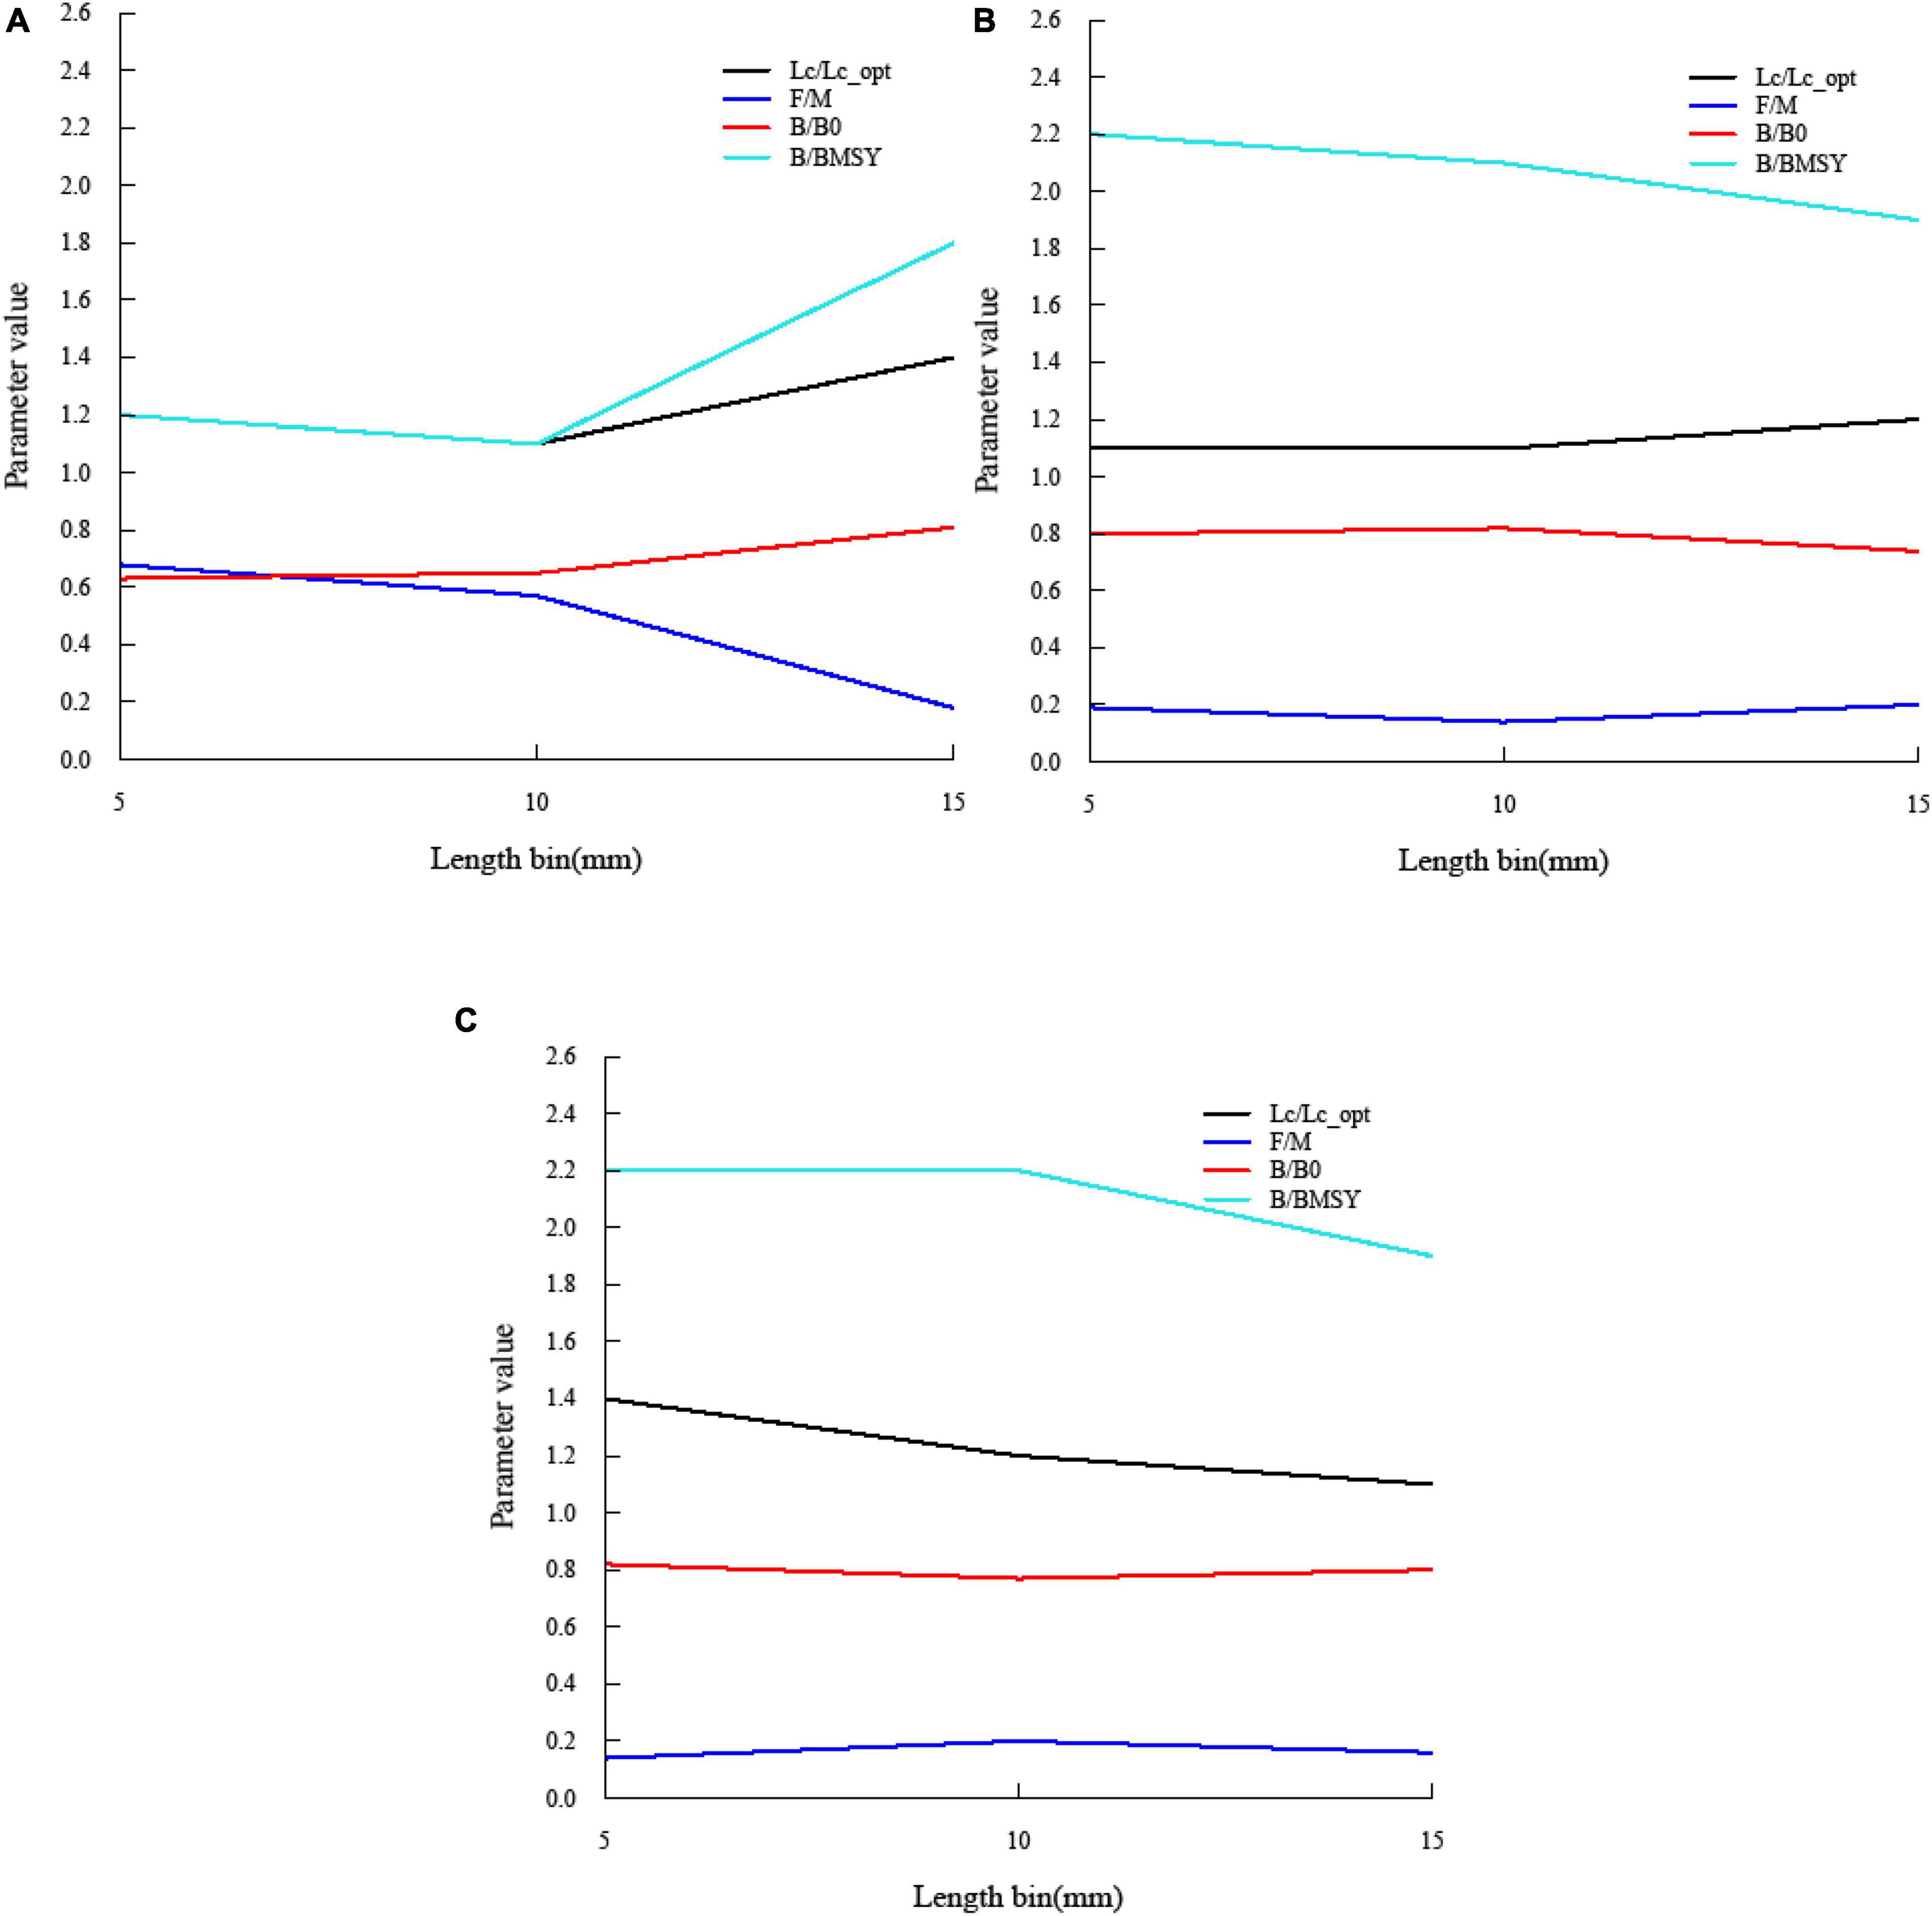
Figure 4. Estimated key parameters based on different length bins.
Discussion
The LBB model was recommended as a new supplement to the stock assessment approach for the data-limited stocks that have very limited or unreliable catch data (Kindong et al., 2020). Compared with similar length-based models (e.g., LBSPR and LIME), the LBB model does not need any information on age, mortality, growth, and recruitment, which only requires the LF data that can represent the stock from commercial fisheries (Froese et al., 2016). Froese et al. (2018) indicated that the LBB method will perform poorly if the LF data cannot represent the length structure of the exploited stock. Chub mackerel, Pacific saury, and Pacific sardine that have a short life span tend to exhibit marked population fluctuations (Sakurai et al., 2000). Previous studies have stated that the fishing grounds and biomass of short-lived species are affected by oceanographic factors, such as sea surface temperature (SST) and sea surface height (SSH) (Watanabe et al., 2006; Kuroda and Yokouchi, 2017). Due to insufficient long-term series of age-structured data and fisheries-independent data, the application of a full stock assessment model in data-limited circumstances might be challenging and questionable (Guan et al., 2013; Wang et al., 2016; Geng et al., 2021). The LBB model has been well applied in several data-limited fisheries (Kindong et al., 2020; Liang et al., 2020; Wang et al., 2020). In this study, the LF data of three species were derived from commercial gear for at least 1 year and represented the length composition of the target species, therefore meeting all the demands of the LBB model (Froese et al., 2018). In addition, the results of the LF data for three populations fit presented asymmetric patterns, which mean that the LF data were appropriate to be analyzed by this model (Froese et al., 2018). Therefore, it is reasonable and feasible to assess the stock status for the three small pelagic species in the NPO using the LBB model.
The length bin of 10 mm was chosen to estimate the stock status for three species based on the goodness-of-fit measurements. According to the estimation of the LBB model, the ratio Lc/Lc_opt of Chub mackerel was above unity, which means that there were still a considerably large amount of specimens in the population. The estimation of ratio B/BMSY was bigger than one, suggesting that the stock of Chub mackerel is not being overfished. As few studies on the stock assessment of Chub mackerel in NPO were conducted in previous research, the study area was mainly concentrated on the coastal waters of China and Japan (Yatsu et al., 2002; Zhang et al., 2009; Yan et al., 2010). Yan et al. (2010) adopted the Virtual Population Analysis (VPA) to assess the stock of Chub mackerel. Their results suggested that the stock of Chub mackerel in the western East China Sea could remain relatively steady, which corroborates with the results presented in this study. Reports by Ichikawa and Okamura (2016) were also consistent with this study, and they applied the autoregressive state-space models to estimate the Chub mackerel stock status. For Pacific saury, the estimated ratios Lc/Lc_opt and B/BMSY were above unity, which suggests that a great quantity of large individuals were still present and the stock status of Pacific saury was healthy. Shi et al. (2018, 2020) indicated that the stock of Pacific saury was at a high level, which was corroborated by our findings to show that the population is immune to overfishing or overfished of this stock in the NPO. Reports of North Pacific Fisheries Commission [NPFC] (2017) agreed with the results in this study as well. Although few models have been applied to assess the stock of Pacific sardine, Demer and Zwolinski (2014) still reported that current catches would not damage the stock of Pacific sardine. These authors insisted that new data should be collected in advance for the future assessment of Pacific sardine, which will facilitate the scientific management of this fishery.
The development and utilization of the three kinds of fisheries resources have been paid attention to by the RFMOs. At present, Chub mackerel and Pacific sardine are listed among the priority fish species by NPFC, and the Pacific sardine is also among one of the species to be managed in the future (Hua et al., 2020). China, Japan, and Russia have conducted a preliminary stock assessment for Chub mackerel in the NPO based on the Age-Structured Assessment Program (ASAP), VPA, and State-space Assessment Model (SAM), respectively. However, they indicated that the stock assessment results and model performance were highly influenced by the availability and quality of data for Chub mackerel and suggested that more basic biological research and scientific resource investigation should be carried out. The stock of Pacific saury was assessed using the Bayesian state-space biomass dynamic model (BSSPM) by the members of NPFC. Results of China pointed out that the current biomass of Pacific saury was bigger than BMSY and the stock was in good condition. Chinese Taipei indicated that the stock of Pacific saury did not appear to be overfished and overfishing. The stock assessment results of Japan concluded that the biomass level is currently above the level of MSY for any scenarios (North Pacific Fisheries Commission [NPFC], 2017). In addition, the fundamental fisheries research of Pacific sardine has been carried out by NPFC for future stock assessment.
In this study, three different length bin scenarios were set up to evaluate the impact of the body length bin on the estimation of the LBB model. According to the sensitivity analysis, there is a minimal fluctuation of key parameters depending on the length bin, which means that the length bin has a limited impact on the estimation of the LBB model. This conclusion was consistent with the study by Froese et al. (2018). Hordyk et al. (2018) stated that the LBB master equation is incomplete because it fails to correct for the pile-up effect due to aggregating length measurements into length bins. However, Froese et al. (2019) responded that the assumptions of the pile-up effect mentioned by Hordyk et al. (2018) are not realistic for most sampling schemes and stocks. This study indicated that although the body length bins may affect the parameter estimation of the LBB model, it will not affect the estimation result of stock status (Tables 3–5).
Compared with similar length-based methods [e.g., LBSPR, catch-curve stock reduction analysis(CC-SRA), and LIME], the LBB model has some advantages in assessing the stock in data-limited situations. For instance, compared with LBSPR, the LBB method does not need to include the information about length-fecundity parameters or maturation schedules. It considers the issue of knife-edge assumption and calculates M/K and Linf based on the available data. The main difference between the LBB method and the CC-SRA model is that the CC-SRA model requires age-structured data, which are often scarce in the data-limited fisheries. The input data of the LIME method are similar to the LBB model, but the former still requires the life history data such as maturation, growth, and natural mortality. Froese et al. (2018) suggested that the stock estimated depletion of the LBB model was closer to independent estimates and thus recommended that it can be used as preliminary guidance and priors for the stock assessment and management of data-limited stocks. However, some uncertainties in the LBB model should be considered. LF data in this study were derived from the fishery-dependent data, which might lead to some potential bias. For instance, the LF data may not be representative if the sample sites were not widely distributed in the main fishing ground, and the selection and measurement error of the sample might have some impacts on the results of the LBB model. Therefore, basic biological research of these three fisheries should be strengthened in future research in order to provide the database for fishery stock assessment and management.
In this study, the LF data we used were derived from the main type of fishing gears in commercial fisheries, which can represent all body length groups of these stocks. Besides, the LF samples of three populations showed asymmetric plot patterns, thus meeting the requirement of the LBB model (Froese et al., 2018). Therefore, the results of this study could provide valuable information for the fisheries management of these three species. Besides, this study also indicated that the LBB model can be a good selection for the stock status estimation of data-limited fisheries. In order to make better use of and conserve these three fishery stocks, the collection of various types of data and the long-term systematic biological research need to be actively carried out. Alternative approaches (e.g., age-structured model) to assess the stock status of these species are the important area for future research.
Data Availability Statement
The original contributions presented in the study are included in the article/supplementary material, further inquiries can be directed to the corresponding author.
Author Contributions
YS contributed to the conception and design of this study, acquisition of data, visualization, software, and writing—original draft. XZ contributed to the investigation and resources. YH and WF contributed to writing—review and editing. FT contributed to acquisition of data and writing—original draft. All authors contributed to the article and approved the submitted version.
Funding
This study was supported by the National Key R&D Program of China (2019YFD0901405), the Central Public-Interest Scientific Institution Basal Research Fund, ECSFR, CAFS (2021T04), and the Central Public-Interest Scientific Institution Basal Research Fund, ECSFR, CAFS (2021M06).
Conflict of Interest
The authors declare that the research was conducted in the absence of any commercial or financial relationships that could be construed as a potential conflict of interest.
Publisher’s Note
All claims expressed in this article are solely those of the authors and do not necessarily represent those of their affiliated organizations, or those of the publisher, the editors and the reviewers. Any product that may be evaluated in this article, or claim that may be made by its manufacturer, is not guaranteed or endorsed by the publisher.
Acknowledgments
We gratefully acknowledge the help of our colleagues in the Key and Open Laboratory of Oceanic Laboratory of Remote Sensing Information Technology in Fishing Resource. We are also grateful to the developer of the LBB method, Rainer Froese. We would like to thank all the reviewers for their valuable comments and advice.
References
Arnold, L. M., and Heppell, S. S. (2014). Testing the robustness of data-poor assessment methods to uncertainty in catch and biology: a retrospective approach. ICES J. Mar. Sci. 72, 243–250. doi: 10.1093/icesjms/fsu077
Carruthers, T. R., Kell, L. T., Butterworth, D. D. S., Maunder, M. N., Geromont, H. F., Walters, C. et al. (2016). Performance review of simple management procedures. ICES J. Mar. Sci. 73, 464–482. doi: 10.1093/icesjms/fsv212
Chong, L., Mildenberger, T. K., Rudd, M. B., Marc, H., Taylor, M. H., Cope, J. M., et al. (2020). Performance evaluation of data-limited, length-based stock assessment methods. ICES J. Mar. Sci. 77, 97–108. doi: 10.1093/icesjms/fsz212
Demer, D. A., and Zwolinski, J. P. (2014). Optimizing Fishing Quotas to Meet Target Fishing Fractions of an Internationally Exploited Stock of Pacific Sardine. North Am. J. Fish Manage 34, 1119–1130. doi: 10.1080/02755947.2014.951802
Dick, E. J., and MacCall, A. D. (2011). Depletion-based stock reduction analysis: A catch-based method for determining sustainable yields for data-poor fish stocks. Fish Res. 110, 331–341. doi: 10.1016/j.fishres.2011.05.007
FAO (2016). Report of the FAO/CECAF Working Group on the Assessment of Small Pelagic Fish-Subgroup South. CECAF/ECAF SERIES 12/74. Rome: FAO.
Froese, R., Winker, H., Gascuel, D., Sumaila, U. R., and Pauly, D. (2016). Minimizing the impact of fishing. Fish Fish 17:785802. doi: 10.1111/faf12146
Froese, R., Winker, H., Coro, G., Demirel, N., Tsikliras, A. C., Dimarchopoulou, D., et al. (2018). A new approach for estimating stock status from length frequency data. ICES J. Mar. Sci. 75, 2004–2015. doi: 10.1016/j.eururo.2011.11.040
Froese, R., Winker, H., Coro, G., Demirel, N., Tsikliras, A. C., Dimarchopoulou, D., et al. (2019). On the pile-up effect and priors for Linf and M/K: response to a comment by hordyk et al. on “A new approach for estimating stock status from length-frequency data. ICES J. Mar. Sci. 76, 461–465. doi: 10.1093/icesjms/fsy199
Geng, Z., Wang, Y., Richard, K., Zhu, J. F., and Dai, X. J. (2021). Demographic and harvest analysis for blue shark (Prionace glauca) in the Indian Ocean. Reg. Stud. Mar. Sci. 41:101453. doi: 10.1016/j.rsma.2020.101583
Guan, W. J., Gao, F., Li, G., and Chen, X. J. (2014). Risk evaluation for meta-population management:a case study using chub mackerel. Acta Ecologica Sinica 34, 3682–3692.
Guan, W. J., Tang, L., Zhu, J. F., Tian, S. Q., and Xu, L. X. (2016). Application of a Bayesian method to data-poor stock assessment by using Indian Ocean albacore (Thunnus alalunga) stock assessment as an example. Acta Oceanol. Sin. 35, 117–125. doi: 10.1007/s13131-016-0814-0
Guan, W. J., Tian, S. Q., Zhu, J. F., and Chen, X. J. (2013). A review of fisheries stock assessment models. J. Fish. Sci. China. 20, 1112–1120. doi: 10.3724/sp.j.1118.2013.01112
Hua, C. X., Li, F., Zhu, Q. C., and Meng, L. W. (2020). Habitat suitability of Pacific saury (Cololabis saira) based on a yield-density model and weighted analysis. Fish Res. 221:105408. doi: 10.1016/j.fishres.2019.105408
Holt, S. J. (1958). “The evaluation of fisheries resources by the dynamic analysis of stocks, and notes on the time factors involved,” in International Commission for the Northwest Atlantic Fisheries. Vancouver: ICNAF Special Publication, 77–95.
Hordyk, A. R., Prince, J. D., Carruthers, T. R., and Walters, C. J. (2018). Comment on “A newapproach for estimating stock status from length frequency data” by Froese et al. (2018). ICES J. Mar. Sci. 76, 457–460. doi: 10.1093/icesjms/fsy168
Hordyk, A., Ono, K., Valencia, S. R., Loneragan, N., and Prince, J. (2015). A novel length-based empirical estimation method of spawning potential ratio (SPR), and tests of its performance, for small-scale, data-poor fisheries. ICES J. Mar. Sci. 72, 217–231. doi: 10.1093/icesjms/fsu004
Ichikawa, M., and Okamura, H. (2016). Modeling of fishery with autoregressive state-space models for quantifying management effectiveness in the Pacific Chub Mackerel fishery. Proc. Inst. Stat. Math. 64, 59–75. doi: 10.1890/14-1216.1
Iwahashi, M., Isoda, Y., Ito, S., Oozeki, Y., and Suyama, S. (2006). Estimation of seasonal spawning ground locations and ambient sea surface temperatures for eggs and larvae of Pacific saury (Cololabis saira) in the western North Pacific. Fish Oceanogr. 15, 125–138. doi: 10.1111/j.1365-2419.2005.00384.x
Jiao, Y., Cortés, E., Andrews, K., and Guo, F. (2011). Poor-data and data-poor species stock assessment using a Bayesian hierarchical approach. J. Appl. Ecol. 21, 2691–2708. doi: 10.1890/10-0526.1
Kawai, H., Yatsu, A., Watanabe, C., Mitani, T., Katsukawa, T., and Matsuda, H. (2002). Recovery policy for chub mackerel stock using recruitment-per-Spawning. Fish. Sci. 68, 963–971. doi: 10.1046/j.1444-2906.2002.00520.x
Kindong, R., Gao, C. X., Pandong, N. A., Ma, Q. Y., Tian, S. Q., Wu, F., et al. (2020). Stock status assessments of five small pelagic species in the Atlantic and Pacific Oceans using the Length-Based Bayesian estimation (LBB) method. Front. Mar. Sci. 7:592082. doi: 10.3389/fmars.2020.592082
Klaer, N. L., Wayte, S. E., and Fay, G. (2012). Anevaluation of the performance of a harvest strategy that uses an average-length-based assessment method. Fish Res. 134-136, 42–51. doi: 10.1016/j.fishres.2012.08.010
Kuroda, H., and Yokouchi, K. (2017). Interdecadal decrease in potential fishing areas for Pacific saury off the southeastern coast of Hokkaido, Japan. Fish. Oceanogr. 26, 439–454. doi: 10.1111/fog.12207
Liang, C., Xian, W., Liu, S., and Pauly, D. (2020). Assessments of 14 exploited fish and invertebrate stocks in Chinese waters using the LBB method. Front. Mar. Sci. 7:314. doi: 10.3389/fmars.2020.00314
Ma, Q. Y., Tian, S. Q., Han, D. Y., Richard, K., Gao, C. X., and Liu, W. C. (2021). Growth and maturity heterogeneity of three croaker species in the East China Sea. Reg. Stud. Mar. Sci. 41:101483. doi: 10.1016/j.rsma.2020.101483
MacCall, A. D. (2009). Depletion-corrected average catch: A simple formula for estimating sustainable yields in data-poor situations. ICES J. Mar. Sci. 66, 2267–2271. doi: 10.1093/icesjms/fsp209
Magnusson, A., and Hilborn, R. (2007). What makes fisheries data informative? Fish. Fish. 8, 337–358. doi: 10.1111/j.1467-2979.2007.00258.x
Martell, S., and Froese, R. (2013). A simple method for estimating MSY from catch and resilience. Fish. Fish. 14, 504–514. doi: 10.1111/j.1467-2979.2012.00485.x
North Pacific Fisheries Commission [NPFC] (2017). NPFC Yearbook 2017. Vancouver, BC: North Pacific Fisheries Commission, 385.
Palomares, M. L. D., Froese, R., Derrick, B., Nöel, S. L., Tsui, G., and Woroniak, J. (2018). “A preliminary global assessment of the status of exploited marine fish and invertebrate populations,” in A Report Prepared by the Sea Around Us for OCEANA. Washington, DC: OCEANA, 64.
Pauly, D. (1998). Beyond our original horizons: the tropicalization of Beverton and Holt. Rev. Fish Biol. Fish. 8, 307–334.
Pons, M., Cope, J. M., and Kell, L. T. (2020). Comparing performance of catch-based and length-based stock assessment methods in data-limited fisheries. Can. J. Fish. Aquat. Sci. 77, 1026–1037. doi: 10.1139/cjfas-2019-0276
Punt, A. E. (2011). Extending production models to include process error in the population dynamics. Can. J. Fish. Aquat. Sci. 60, 1217–1228.
Quinn, T. J., and Deriso, R. B. (1999). Quantitative Fish Dynamics. New York, NY: Oxford University Press.
Rudd, M. B., and Thorson, J. T. (2018). Accounting for variable recruitment and fishing mortality in length-based stock assessments for data-limited fisheries. Can. J. Fish. Aquat. Sci. 75, 1019–1035. doi: 10.1139/cjfas-2017-0143
Sakurai, Y., Kiyofuji, H., Saitoh, S., Goto, T., and Hiyama, Y. (2000). Changes in inferred spawning areas of Todarodes pacificus (Cephalopoda: Ommastrephidae) due to changing environmental conditions. ICES J. Mar. Sci. 57, 24–30. doi: 10.1006/jmsc.2000.0667
Shi, Y. C., Hua, C. X., Zhu, Q. C., Huang, S. L., and Feng, H. L. (2020). Applying the Catch-MSY model to the stock assessment of the northwest Pacific saury Cololabis Saira. J. Oceanol. Limnol. 38, 1945–1955. doi: 10.1007/s00343-019-9156-z
Shi, Y. C., Zhu, Q. C., Huang, S. L., and Hua, C. X. (2018). Stock Assessment of Pacific Suary (Cololabis Saira) in the Northwest Pacific Using a Bayesian Schaefer Model. Prog. Fish. Sci. 40, 1–10.
Shiraishi, T., Okamoto, K., Yoneda, M., Sakai, T., Ohshimo, S., Onoe, S., et al. (2008). Age validation, growth and annual reproductive cycle of chub mackerel Scomber japonicus, off che waters of northern Kyushu and in the East China Sea. Fish. Sci. 74, 947–954. doi: 10.1111/j.1444-2906.2008.01612.x
Suyama, S., Sakurai, Y., Meguro, T., and Shimazaki, K. (1992). Estimation of the age and growth of Pacific saury Cololabis saira in thr central North Pacific Ocean determined by otolith daily growth increments. Nippon Suisan Gakkaishi. 58, 1607–1614. doi: 10.2331/suisan.58.1607
Tian, Y. J., Akamine, T., and Suda, M. (2004). Modeling the influence of oceanic-climatic changes on the dynamics of Pacific saury in the northwestern Pacific using a life cycle model. Fish. Oceanogr. 13, 125–137. doi: 10.1111/j.1365-2419.2004.00314.x
Ueno, Y., Suyama, S., Nakagami, M., Naya, M., Sakai, M., and Kurita, Y. (2017). Direct estimation of stock abundance of Pacific saury Cololabis saira in the northwestern Pacific Ocean using a mid-water trawl. Fish. Sci. 83, 23–33.
von Bertalanffy, L. (1938). A quantitative theory of organic growth (inquiries on growth laws. II.). Hum. Biol. 10, 181–213.
Wang, J. T., Yu, W., Chen, X., and Chen, Y. (2016). Stock assessment for the western winter-spring cohort of neon flying squid (Ommastrephes bartramii) using environmentally dependent surplus production models. Sci. Mar. 80, 69–78.
Wang, Y., Wang, Y., Liu, S., Liang, C., Zhang, H., and Xian, W. (2020). Stock Assessment Using LBB Method for Eight Fish Species from the Bohai and Yellow Seas. Front. Mar. Sci. 7:164. doi: 10.3389/fmars.2020
Watanabe, C., and Yatsu, A. (2004). Effects of density-dependence and sea surface temperature on interannual variation in length-at-age of chub mackerel (Scomber japonicus) in the Kuroshio-Oyashio area during 1970-1997. Fish. Bull. 102, 196–206.
Watanabe, K., Tanaka, E., Yamada, S., and Kitakado, T. (2006). Spatial and temporal migration modeling for stock of Pacific saury Cololabis saira (Brevoort), incorporating effect of sea surface temperature. Fish. Sci. 72, 1153–1165. doi: 10.1111/j.1444-2906.2006.01272.x
Watanabe, Y., Zenitani, H., and Kimura, R. (1995). Population decline of the Japanese sardine Sardinops melanostictus owing to recruitment failures. J. Can. Sci. Halieutiques Aquat. 52, 973–983.
Wetzel, C. R., and Punt, A. E. (2011). Model performance for the determination of appropriate harvest levels in the case of data-poor stocks. Fish Res. 110, 342–355. doi: 10.1016/j.fishres.2011.04.024
Yan, L. P., Li, J. S., Ling, J. Z., Ye, S. Z., and Zhang, H. L. (2010). Assessment on the biomass of Scomber japonicas resources in the western East China Sea by length-structure VPA. Prog. Fish. Sci. 31, 16–22.
Yatsu, A., Mitani, T., Watanabe, C., Nishida, H., Kawabata, A., and Matsuda, H. (2002). Current stock status and management of chub mackerel, Scomber japonicas, along the Pacific coast of Japan an example of allowable biological catch determination. Fish. Sci. 68, 93–96. doi: 10.2331/fishsci.68.sup1_93
Yatsu, A., Watanabe, T., Ishida, M., Sugisaki, H., and Jacobson, L. D. (2005). Environmental effects on recruitment and productivity of Japanese sardine Sardinops melanostictus, and chub mackerel Scomber japonicus, with recommendations for management. Fish Oceanogr. 14, 263–278. doi: 10.1111/j.1365-2419.2005.00335.x
Yukami, R., Ohshimo, S., Yoda, M., and Hiyama, Y. (2009). Estimation of the spawning grounds of chub mackerel Scomber japonicus and spotted mackerel Scomber australasicus in the East China Sea based on catch statistics and biometric data. Fish. Sci. 75, 167–174. doi: 10.1007/s12562-008-0015-7
Keywords: small pelagic species, length-frequency data, LBB method, stock assessment, Northwest Pacific Ocean
Citation: Shi Y, Zhang X, He Y, Fan W and Tang F (2022) Stock Assessment Using Length-Based Bayesian Evaluation Method for Three Small Pelagic Species in the Northwest Pacific Ocean. Front. Mar. Sci. 9:775180. doi: 10.3389/fmars.2022.775180
Received: 13 September 2021; Accepted: 20 January 2022;
Published: 16 February 2022.
Edited by:
Simone Libralato, Istituto Nazionale di Oceanografia e di Geofisica Sperimentale, ItalyReviewed by:
Vita Gancitano, Institute for Biological Resources and Marine Biotechnology, National Research Council (CNR), ItalyJin Gao, Memorial University of Newfoundland, Canada
Copyright © 2022 Shi, Zhang, He, Fan and Tang. This is an open-access article distributed under the terms of the Creative Commons Attribution License (CC BY). The use, distribution or reproduction in other forums is permitted, provided the original author(s) and the copyright owner(s) are credited and that the original publication in this journal is cited, in accordance with accepted academic practice. No use, distribution or reproduction is permitted which does not comply with these terms.
*Correspondence: Fenghua Tang, Zi1oLXRhbmdAMTYzLmNvbQ==