 Christopher Gardner1*
 Daniel R. Goethel2,3
 Mandy Karnauskas2
 Matthew W. Smith2Larry Perruso2
 John F. Walter III2
- 1Riverside Technologies, Southeast Fisheries Science Center, National Marine Fisheries Service, National Oceanic and Atmospheric Administration, Panama City, FL, United States
- 2Southeast Fisheries Science Center, National Marine Fisheries Service, National Oceanic and Atmospheric Administration, Miami, FL, United States
- 3Auke Bay Laboratories, Alaska Fisheries Science Center, National Marine Fisheries Service, National Oceanic and Atmospheric Administration, Juneau, AK, United States
Marine artificial structures provide important ecosystem benefits, but the extent to which commercially valuable reef fish species and their associated fisheries utilize artificial structures is still undetermined. However, the increasing implementation of onboard Vessel Monitoring Systems (VMS) now enables precise identification of catch and effort locations that can be linked via satellite coordinates to seafloor habitat maps. To better understand the distribution of fishing effort across artificial and natural reef types in the Gulf of Mexico, we present the first attempt to link VMS data from commercial reef fish vessels with high resolution habitat maps for an iconic species, red snapper (Lutjanus campechanus). By allocating landings from VMS-linked individual fishing trips to habitat type (i.e., natural reef, artificial structure, or uncharacterized bottom) and overlaying these with previously developed red snapper biomass distributions, we are able to develop one of the first fine-scale spatial maps of exploitation across the entire Gulf of Mexico. Results indicated that nearly half (46%) of commercial red snapper landings were extracted from artificial structures. The degree of exploitation was highly heterogeneous with several localized hotspots on natural reefs along the continental shelf break and offshore areas of the Northeast Gulf of Mexico. Similarly, there were distinct regional differences in fishing patterns: a majority of the landings from the state of Florida (∼91%) came from natural reefs, whereas ∼75% of landings were from artificial structures from all other Gulf of Mexico states combined. These results indicate that the potential for localized depletion exists for red snapper. The exploitation maps developed here can directly aid fisheries managers by highlighting specific habitats and locations that should be carefully monitored as catch limits continue to increase.
Introduction
Recently, the implementation of Vessel Monitoring Systems (VMS), which provide regular Global Positioning System (GPS) coordinates of fishing vessel locations, have allowed analysis of fishing sites at extremely fine spatiotemporal scales (Gerritsen and Lordan, 2011). VMS data sets represent a rich resource that can help understand fishing dynamics, but the diversity of information that can be gleaned from analyzing them is still being discovered (Watson et al., 2018; Birchenough et al., 2021). A wide array of approaches exist for analyzing VMS data to discriminate steaming compared to fishing events, thus enabling the identification of spatially explicit fishing locations (O’Farrell et al., 2017; Muench et al., 2018). Precise fishing sites can then be compared or simultaneously mapped with spatiotemporal distributions of oceanographic conditions, habitat maps, or biomass (Bueno-Pardo et al., 2017; Cimino et al., 2019). Thus, a more mechanistic understanding of factors driving fishing patterns can be uncovered, while also identifying spatiotemporal patterns in exploitation, essential fish habitat areas of concern, and potential operational oceanographic or habitat variables to aid in dynamic ocean management (Deng et al., 2005; Maxwell et al., 2015; Cimino et al., 2019; Birchenough et al., 2021).
In the United States territorial waters of the Gulf of Mexico, over 20,000 known (and innumerable unofficial and uncounted) artificial structures have been created in the last half century (Shipp and Bortone, 2009; Schulze et al., 2020). The proliferation of artificial structures has been driven by expansive reef building and enhancement programs, which have been used as de facto management tools aimed at rebuilding the resource (Shipp and Bortone, 2009; Cowan et al., 2011). However, a fundamental, and largely still unanswered, question associated with artificial structures is whether they serve as focal points for fishing mortality (i.e., attraction of effort) or if they actually increase recruitment by providing additional settlement habitat (i.e., increased production), thereby allowing for increased fishing opportunities (Bohnsack, 1989; Bortone, 1998; Cowan et al., 2011). The impact and role of artificial structures is highly nuanced, often depending on the species of interest, the rate of exploitation, the density of occupancy at existing habitats, and the complexity of the existing natural and new artificial structure habitat (Wilson et al., 2001; Cowan et al., 2011; Smith et al., 2015; Paxton et al., 2020). For red snapper (Lutjanus campechanus), an iconic species that has been heavily exploited for over a century and a half by both commercial and recreational fisheries in the Gulf of Mexico (Porch et al., 2007; Fitzhugh et al., 2020), artificial structures are believed to endow generally positive effects by providing additional habitat and protection (Arney et al., 2017; Streich et al., 2017a,b). These positive effects could be offset by decreased foraging opportunities (Schwartzkopf et al., 2017; Garner et al., 2019) or reduced habitat quality on artificial structures, which might be associated with lower reproductive potential (Glenn et al., 2017). Moreover, red snapper demonstrate complex ontogenetic shifts in habitat preference over their lifespan and utilize artificial structure differentially by life history stage (Gallaway et al., 2009). Newly settled individuals prefer shell and sandy bottom, then shift to more complex, vertical relief habitat (i.e., artificial and natural reefs) as juveniles and young adults become larger. Eventually, large adult red snapper move back towards less structured bottom as they become essentially invulnerable to predation (Powers et al., 2018; Dance and Rooker, 2019).
Despite the uncertainties related to the biological benefits of artificial structures, it has been well documented that high densities of red snapper exist on artificial habitat in the Gulf of Mexico (Karnauskas et al., 2017; Dance and Rooker, 2019). Compared to natural reefs, it is estimated that artificial structures support 4–8 fold higher densities of red snapper (e.g., Streich et al., 2017c; Powers et al., 2018). But, artificial structures only make up a small percentage of the total habitat area in the Gulf of Mexico and are estimated to harbor a relatively small percentage of the total red snapper population (14% in terms of number; Karnauskas et al., 2017). Similarly, the recent congressionally funded Great Red Snapper Count (GRSC) estimated that only ∼9% of red snapper were located on artificial structures and pipelines, while almost 2/3rds of the resource was estimated to reside on uncharacterized (i.e., mud, sand, and shell; also termed unconsolidated or unstructured) bottom where they are only lightly exploited by fisheries (Stunz et al., 2021).
Red snapper are an important target species for commercial fisheries and a critical component of the local economic landscape for coastal communities bordering the Gulf of Mexico, contributing an estimated $8.2 billion in sales, income, and value added impacts across all five Gulf States (National Marine Fisheries Service [NMFS], 2017). In the Gulf of Mexico, the commercial reef fish fishery, which is the primary commercial fishery sector that targets red snapper when quota is available, is conducted with vertical hook and line (i.e., handline) gear, with a small proportion of landings (∼4% in recent years) coming from the longline fleet (Southeast Regional Office [SERO], 2020). In 2019, 437 commercial vessels landed red snapper (Southeast Regional Office [SERO], 2020). The commercial fishery constitutes approximately 50% of red snapper removals with the remaining catch coming from the recreational sector (Southeast Data Assessment and Review [SEDAR], 2018). VMS transponders have been required since 2007 on all commercial fishing vessels permitted in the reef fish fishery (O’Farrell et al., 2017). Considerable analyses have been undertaken using this VMS data to first identify fishing events and locations and then link these to fishermen’s self-reported logbooks and dealer landings reports, which has uncovered interesting spatiotemporal patterns in fishing activity and CPUE (e.g., O’Farrell et al., 2017; Ducharme-Barth et al., 2018; Watson et al., 2018).
Historically, the large-scale distribution of fishing effort is well documented, with commercial fishing being concentrated on large-scale natural features in the late 19th and early 20th centuries. In the latter half of the 20th century, both commercial and recreational fisheries shifted towards artificial structures as reef building programs proliferated (Shipp and Bortone, 2009). However, to date, there has been no systematic and high-resolution mapping of fishery removals by reef type. It is apparent that artificial structures have significantly modified how the red snapper resource is distributed across space and habitat over the last half century (Gallaway et al., 2009; Karnauskas et al., 2017). Additionally, given that many artificial structures are installed explicitly for the purpose of increasing fishing opportunities, these structures have become hot spots for red snapper removals by aggregating both fish and fishermen (Bohnsack, 1989; Karnauskas et al., 2017). Ultimately, whether attraction and associated development of fishing hotspots are detrimental or net neutral in terms of population productivity depends on the degree of redistribution of the resource after artificial reef implementation, as well as, the redistribution of fishing activities across the full array of inhabited reef and other substrates (Powers et al., 2003; Smith et al., 2015). Similarly, the role of artificial structures in shaping the population also depends on the feedback between biological processes and fleet behavior (e.g., how depleted a given area has to become before catch rates are depressed and the fleet diverts to other areas).
The impact of artificial structures on the population dynamics of red snapper is a key uncertainty for fisheries management in the Gulf of Mexico, which, given the diversity of interests and fishing sectors (e.g., recreational and commercial) involved in red snapper extraction, has proven difficult and contentious (Cowan et al., 2011; Gallaway et al., 2020). Understanding population rebuilding rates and potential sustainable exploitation levels remain hindered by basic knowledge gaps regarding both the dynamics of red snapper and the behavior of the fleets targeting the species. Additionally, new information on red snapper abundance from the GRSC (i.e., population estimates that are three-fold higher than from recent stock assessments; Stunz et al., 2021) raises further questions as to the potential roles of production vs. attraction on artificial structures, particularly in relation to potential future increases in red snapper quotas due to these increased abundance estimates. Mainly, if quotas are increased, where will the increased effort be concentrated and how might it impact the large fraction of the red snapper resource that appears to be located on unstructured habitat? High fishing pressure on known reefs could potentially increase production by reducing density and competition, thereby opening further habitat suitable for recruitment. Conversely, density reduction on known reefs may attract fish from unstructured bottom, where they are currently inaccessible to exploitation, resulting in increased exploitation on the entire population. A better understanding of the proportion of landings being extracted by the commercial fishery from the three primary habitats in the Gulf of Mexico (i.e., natural reef, artificial structures, and unstructured bottom) would enable a better assessment of the ecosystem and socioeconomic benefits of artificial structures, while also ascertaining the likelihood of localized depletion due to fishing hotspots.
Determining the source (i.e., habitat type) of fishery removals is a prerequisite for developing a mechanistic understanding of the linkages among production and attraction of artificial structures and the potential implications of allowing increased fishing pressure on the population. As a step towards addressing this knowledge gap, we combine the results of the most comprehensive reef and sediment mapping of the Gulf of Mexico to date with the existing database of VMS fishing locations and landings for commercial fishing trips targeting red snapper (i.e., O’Farrell et al., 2017). We then overlay these precise estimates of removals by habitat type with a high-resolution red snapper biomass distribution map (developed by Karnauskas et al., 2017) to provide spatial estimates of relative exploitation across the entire Gulf of Mexico. By identifying spatial fishing patterns, insight is provided regarding where current resource extraction is highest, the likely impacts of exploitation on the Gulf-wide resource, and the distribution of commercial catches across artificial structures and natural reefs. Additionally, the results of this study will help inform the production vs. attraction debate associated with artificial structures by providing spatially explicit landings data by reef type that can be utilized in future spatially- and habitat-explicit research stock assessment models.
Materials and Methods
Our approach to identify commercial red snapper exploitation by habitat type involved five steps (see Figure 1 for a diagram of the workflow): (1) collate and filter the data on VMS fishing locations, landings, and habitat; (2) link the VMS data to trip information on red snapper landings; (3) develop a spatial selection process to assign VMS fishing locations to habitat based on an optimal buffer size around each habitat patch; (4) extrapolate to only reef types and scale by total commercial landings based on the observed proportions of VMS landings from each habitat type; (5) develop a spatially explicit index of relative exploitation by overlaying the spatial distribution of landings from the VMS data with spatially explicit maps of biomass distribution from Karnauskas et al. (2017) scaled by current estimates of population size from two sources (i.e., the most recent stock assessment and the Great Red Snapper Count). The resultant exploitation maps provide insight into focal extraction locations for the commercial fleet relative to biomass, while the maps of landings by reef type provides a detailed spatial analysis of relative contributions of natural compared to artificial structures in terms of red snapper removals. Between these two mapping exercises, our analysis allows a synoptic assessment of commercial exploitation across the entire Gulf of Mexico by habitat type.
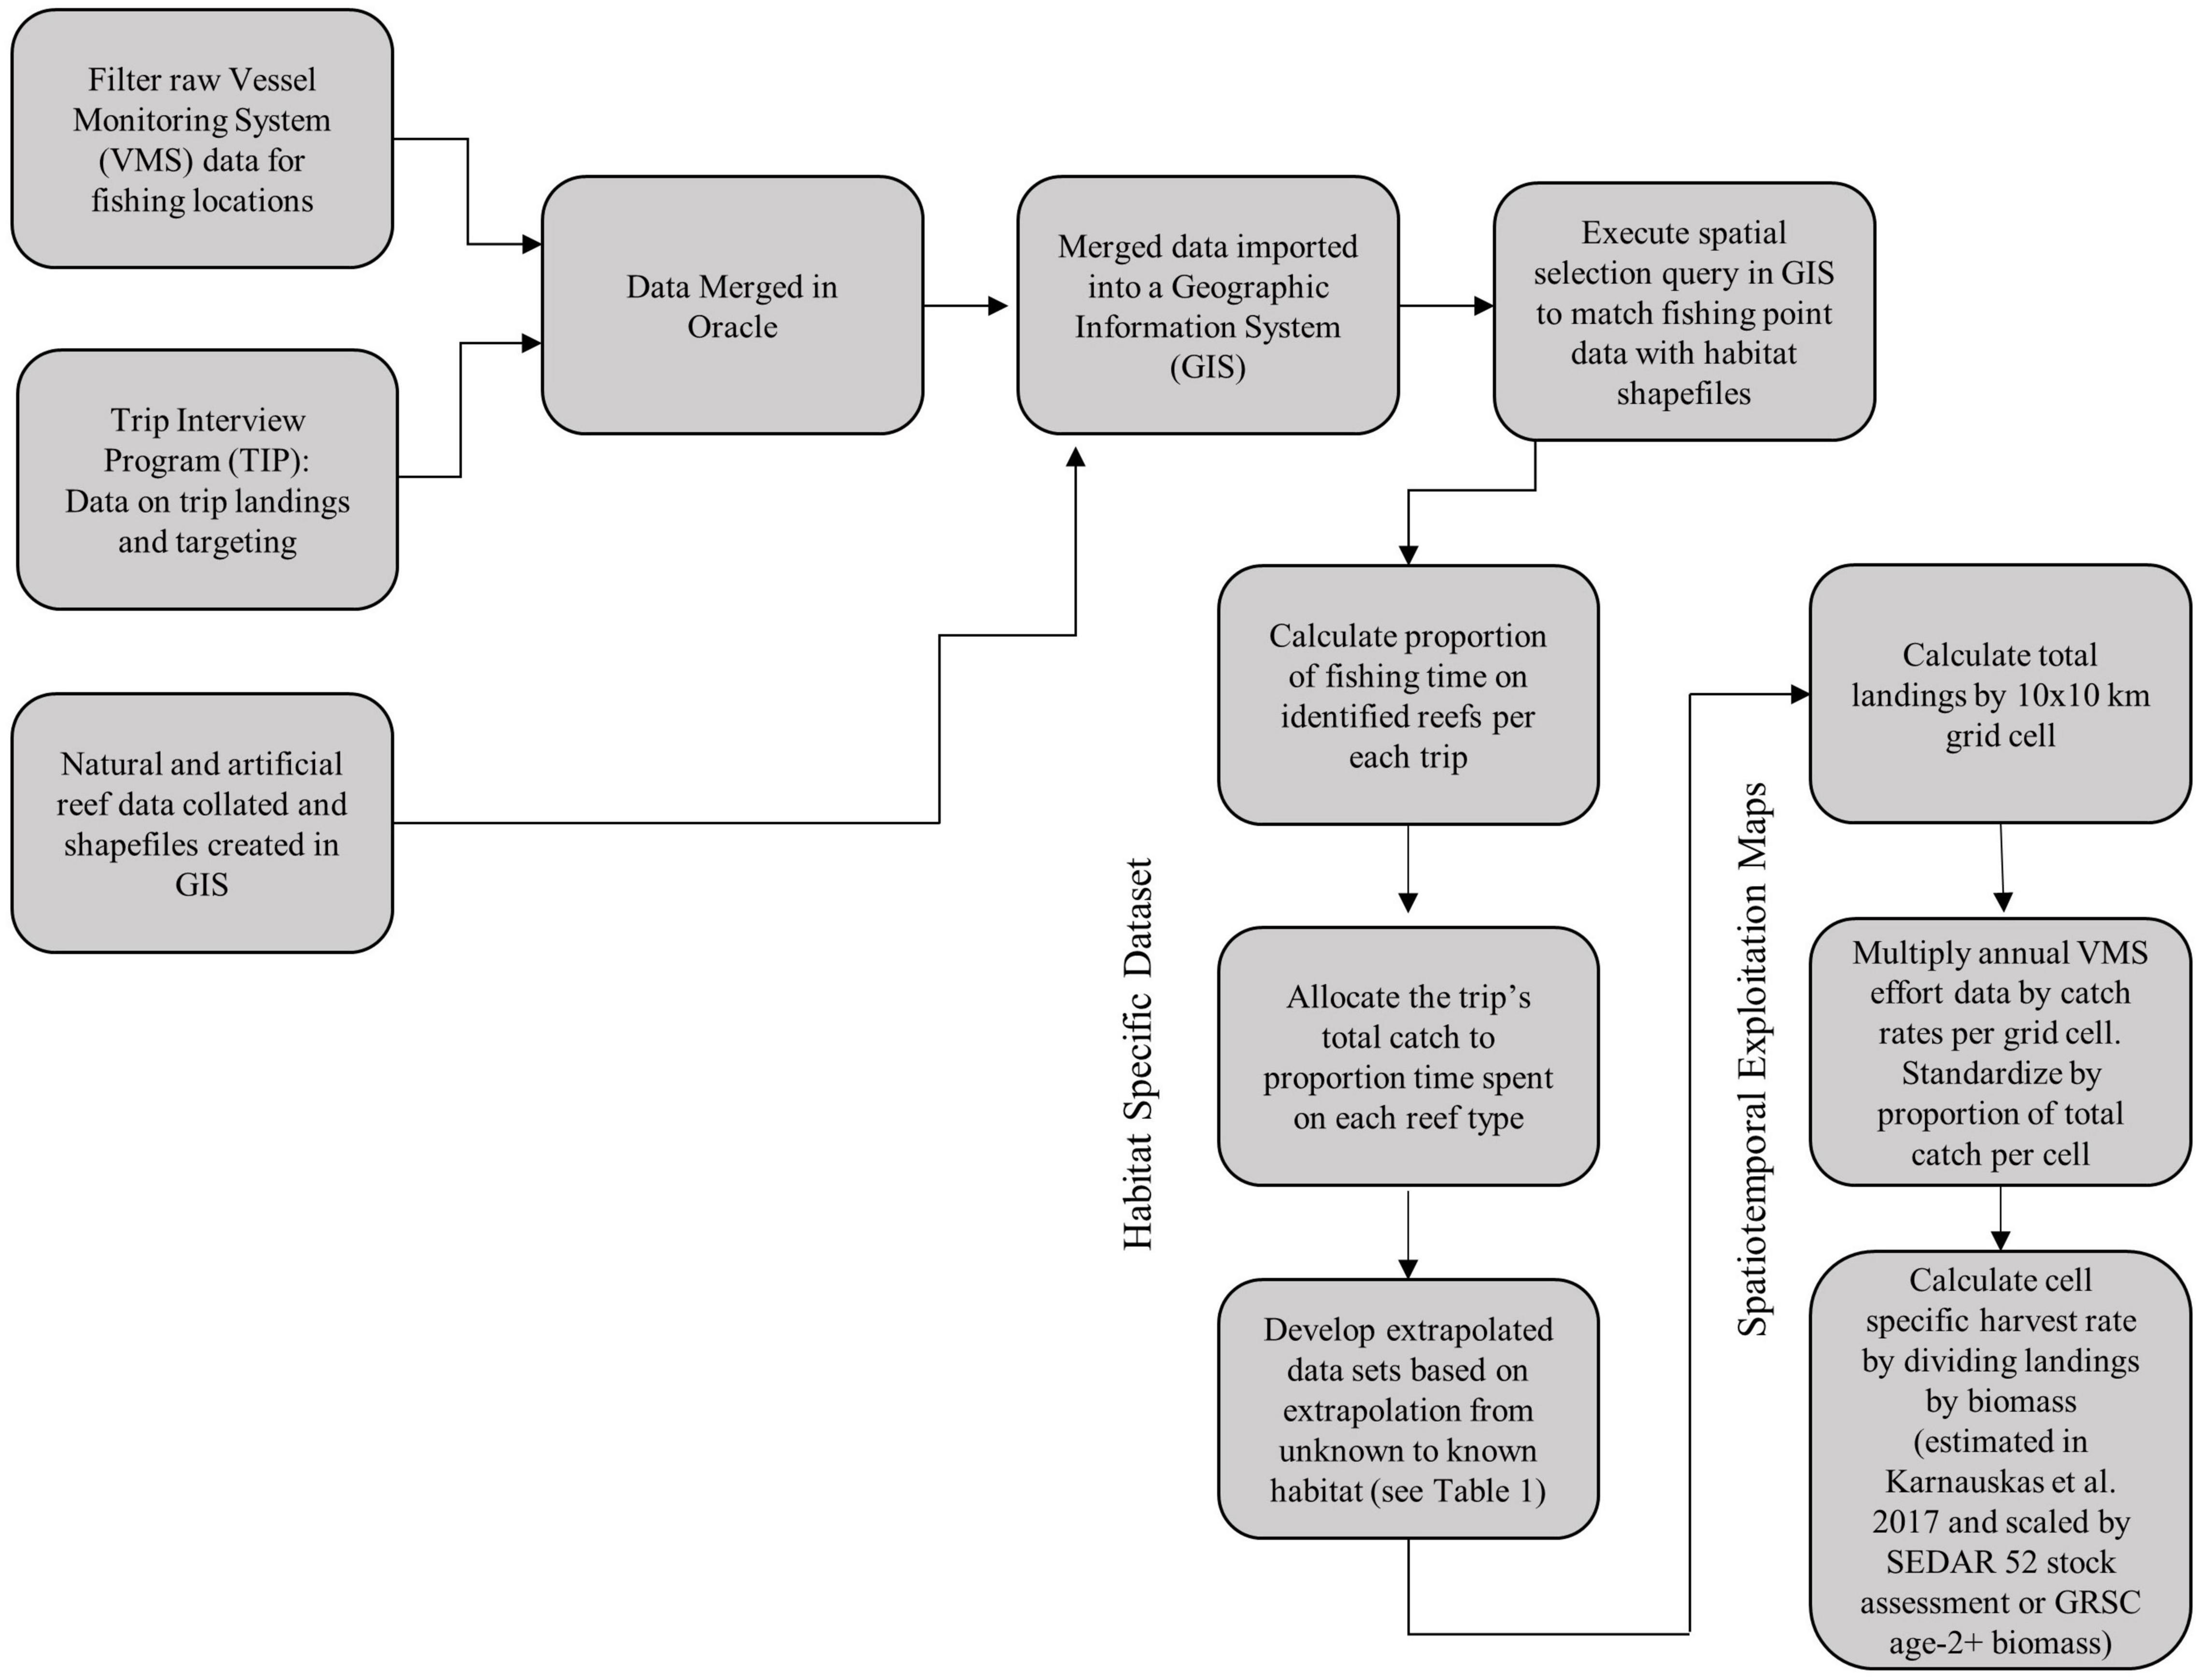
Figure 1. Workflow of main analytical steps.
Identifying Fishing Locations and Habitat Data Collation
Given the broad geographic area, limited observer coverage, and the large number of ports and vessels in the Gulf of Mexico reef fish fishery, understanding spatiotemporal removal patterns is hampered by the availability of any single data set that provides all the necessary georeferenced information. However, two primary fisheries-dependent data sets were combined and utilized for this study to allow full spatial analysis of removals: VMS data for Gulf of Mexico vertical line commercial fishing vessels, and NOAA Trip Interview Program (TIP) reports. The VMS data provided predicted fishing locations with a predictive accuracy of 88% and fine-scale geospatial resolution through a minimum of hourly global positioning system (GPS) locations (O’Farrell et al., 2017). The TIP database, which randomly port samples the commercial fishing fleet to collect information on total landings, allowed filtering VMS trips (i.e., defined as an individual vessel departing and returning to port after fishing where a trip could span a single or multiple days) for those targeting red snapper and for which landings data were available. A unique trip identification number, which is assigned to each vessel and trip date, allowed linking trips from the VMS and TIP databases in Oracle 12.2 (Oracle Database Sql Language Reference, 2021). The TIP data is collected by port agents with a mandate to obtain representative samples from federally managed species and provides detailed information from a subset of commercially permitted vessels, including weight of catch landed and a random subset of lengths and ages at the trip level (Saari, 2013). Utilizing the VMS-TIP linked data allows for broad coverage across the fisheries, while providing high spatial resolution, albeit necessitating a number of assumptions to fill data gaps. The first step in the filtering process was to identify trips that landed red snapper based on the TIP data.
After the landings data for trips that targeted red snapper were collated from the TIP database, these trips were linked to the VMS data using the unique trip identifiers. The combined VMS-TIP dataset was further filtered to include only the years 2011, 2012, 2018, and 2019. Years prior to the 2010 Deepwater Horizon Oil Spill were excluded to focus on more recent patterns in fishing behavior. At this time, these are the only recent years available to the authors for which VMS data has been analyzed and filtered to discriminate known fishing activities and associated locations from steaming and other non-fishing activities. Using the VMS filtering methods outlined in O’Farrell et al. (2017), VMS data were subset to only GPS locations classified as actively “fishing” at a resolution of approximately 10 m (National Oceanographic and Atmospheric Administration [NOAA], 2022) based on algorithms developed from patterns in fishing behavior using a feature engineering approach to differentiate fishing and steaming locations. The resultant filtered VMS data provided accurate estimates of latitude, longitude, time, and date of fishing locations. The combined VMS-TIP data set thus had trips associated with identified fishing locations targeting red snapper along with the associated landings in weight from these trips.
To determine whether known VMS fishing locations occurred on structured habitat (i.e., natural or artificial structures), habitat maps were developed based on all known available sources, including: NOAA’s National Center for Environmental Information (National Centers for Environmental Information [NCEI], 2020), NOAA obstruction databases (National Oceanographic and Atmospheric Administration [NOAA], 2020), NOAA’s Southeast Fisheries Science Center side scan and multibeam sonar data (M. Campbell and K. Overly, National Marine Fisheries Service [NMFS], personal communication), Florida Fish and Wildlife Research Institute side scan data (Keenan et al., 2022), the University of South Florida’s multibeam sonar datasets (University of South Florida [USF], 2020), Bureau of Ocean Energy Management (Bureau of Ocean Energy Management [BOEM], 2020), individual Gulf State artificial reef programs (Alabama Marine Resources Division [AL MRD], 2019; Florida Fish and Wildlife Conservation Commission [FWC], 2019; Louisiana Department of Wildlife and Fisheries [LDWF], 2019; Texas Parks and Wildlife [TPWD], 2019; Mississippi Department of Marine Resources [MS DMR], 2020), and oil and gas pipeline databases (Bureau of Ocean Energy Management [BOEM], 2020). Datasets were collated using ESRI’s ArcMap 10.6 GIS software (Environmental Systems Research Institute [ESRI], 2017) and very detailed shapefiles, with a resolution of ∼2 m, were created to encompass currently known natural and artificial structures (Figure 2). These maps were distributed to a number of Gulf of Mexico scientists (state, federal, and academic) at a NOAA RESTORE (Gulf Coast Ecosystem Restoration Science, Observation, Monitoring, and Technology Program) meeting (February 2020) to comment on missing data sources. The combined dataset is considered the most comprehensive collection of Gulf of Mexico reef fish habitat information known to the authors. The resultant repository of Gulf of Mexico reef structures includes additional attributes, such as data source, collection instrument, year deployed (artificial), and year removed (i.e., for some oil platforms). In the case of removed platforms, analysis was only performed on dates before extraction unless portions of the platform were left as artificial reef material. The complete database is available from the authors upon request.
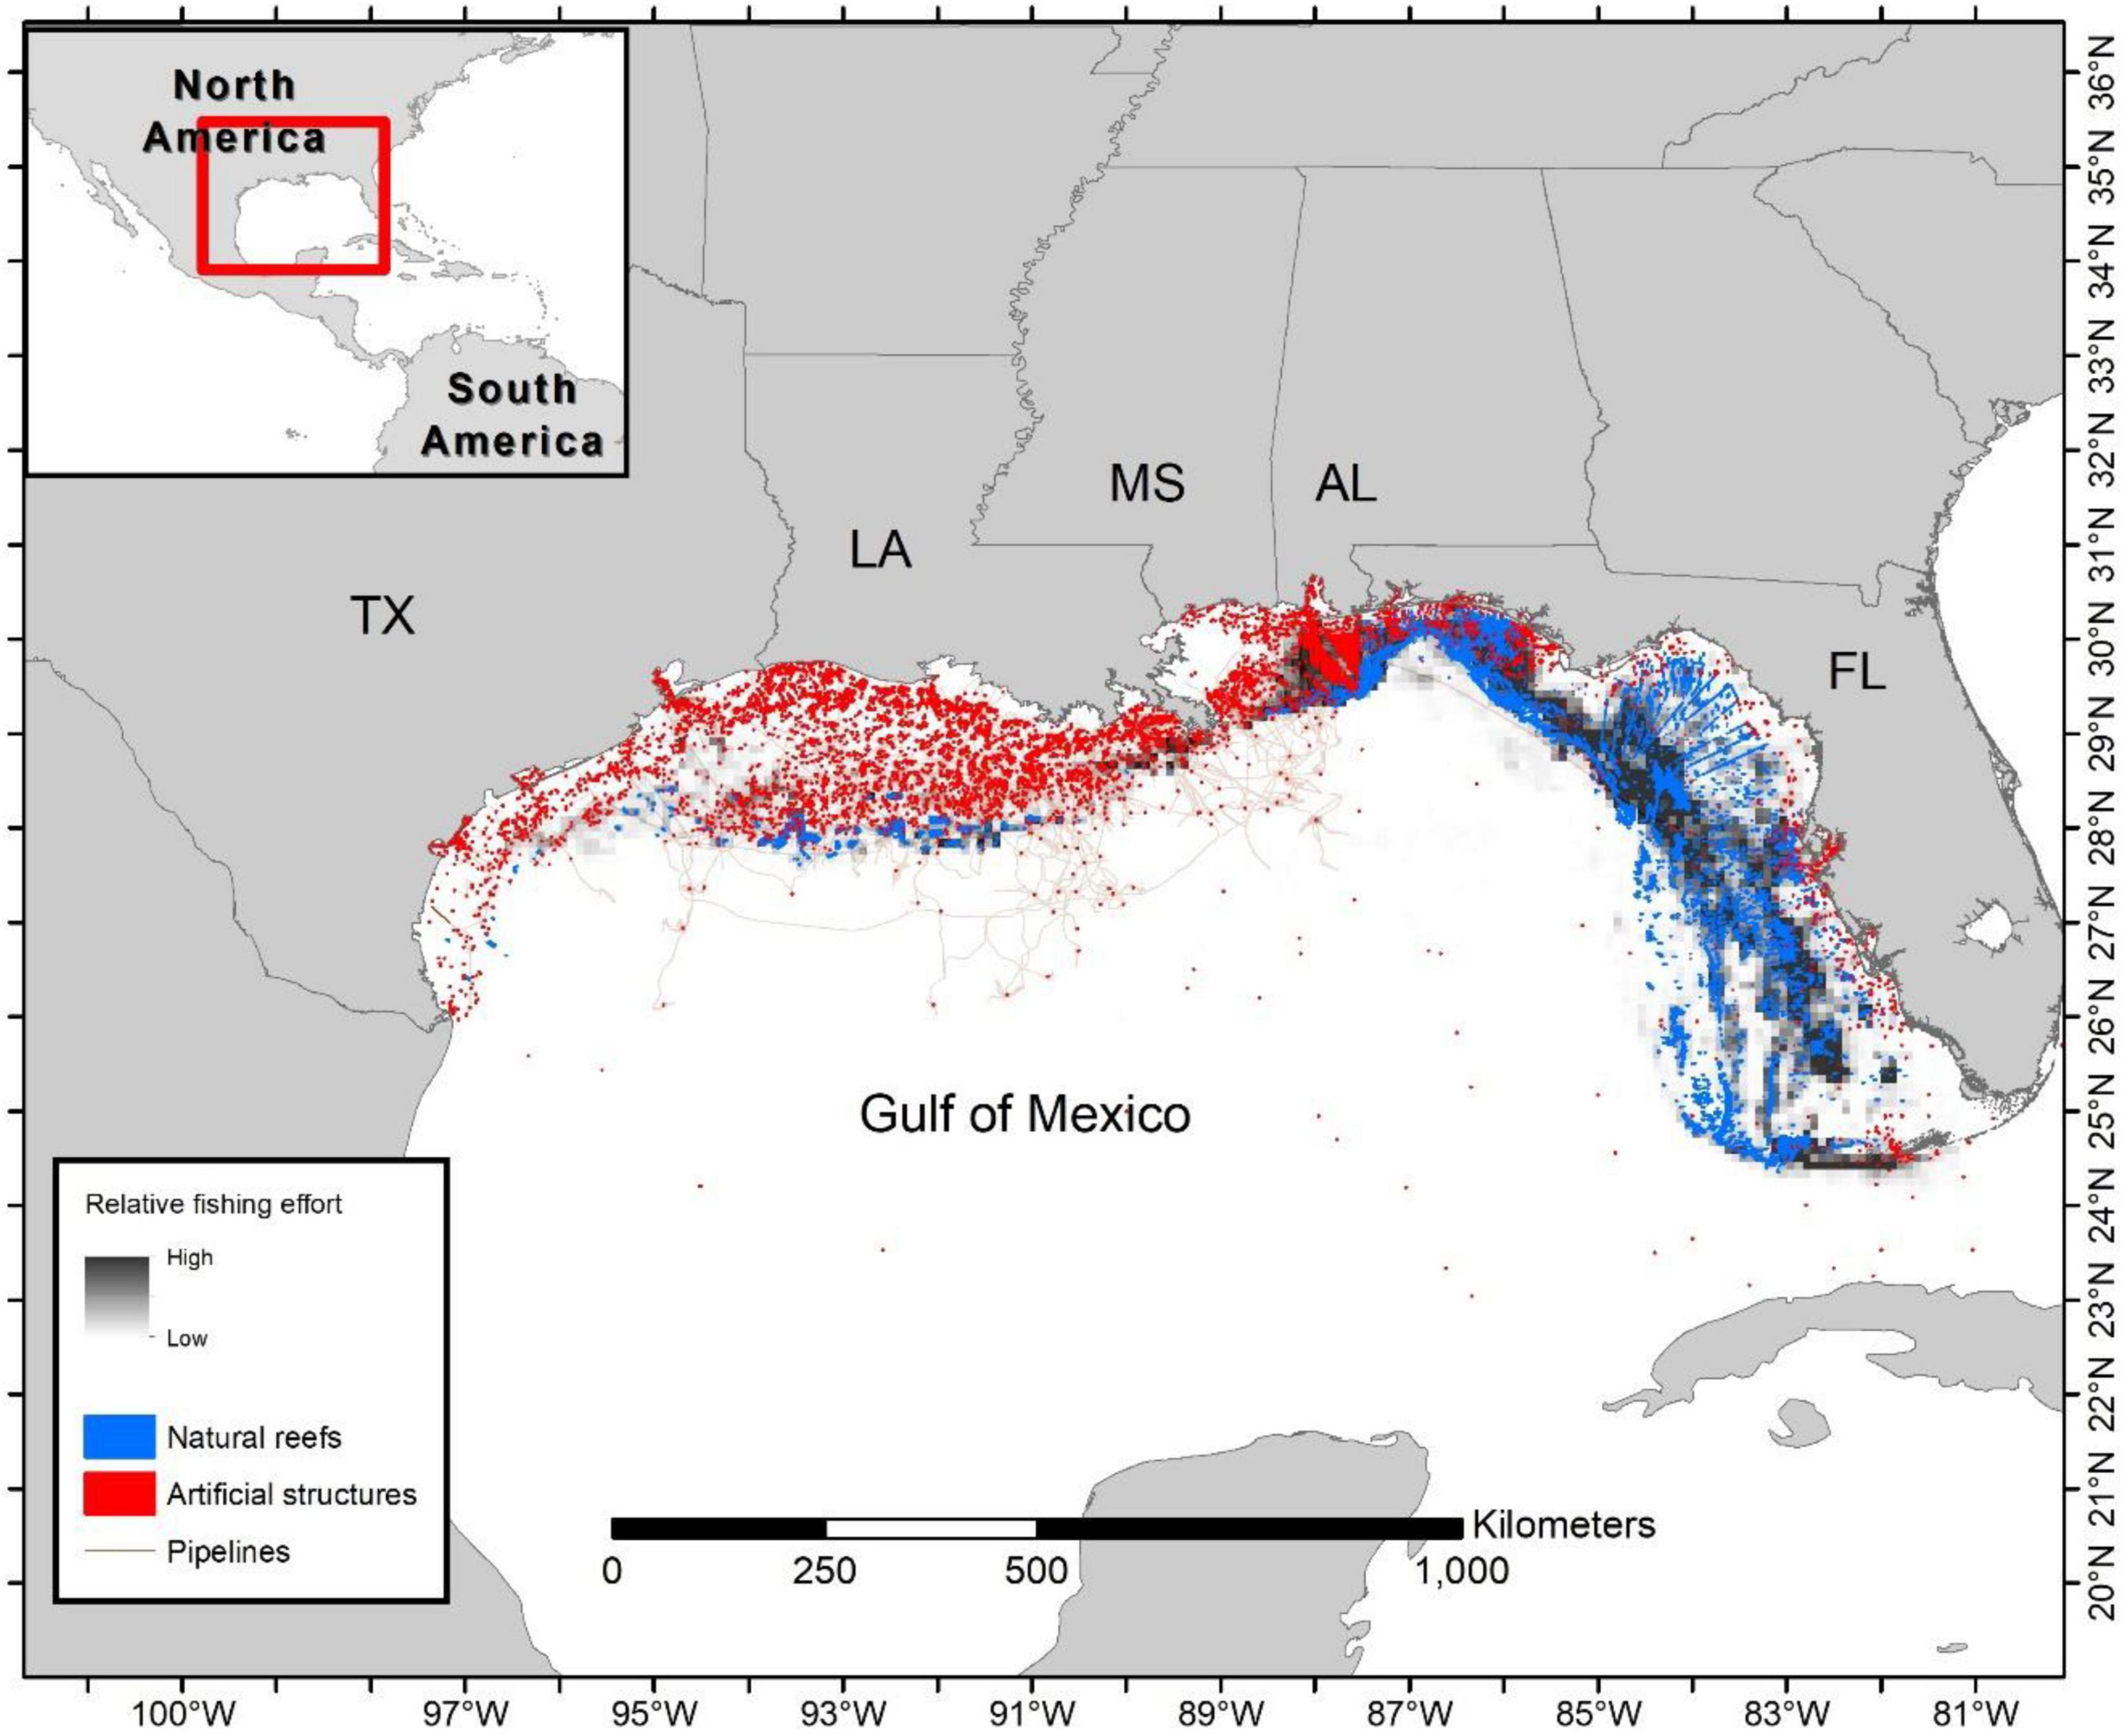
Figure 2. Habitat mapping of known natural reefs, artificial structures (including oil and gas platforms), and pipelines in the United States Gulf of Mexico along with a relative scale of commercial vertical line fishing density from VMS data aggregated across years by mean values per 10 × 10 km cells. Point data in this example are aggregated to a 2 km scale due to confidentiality concerns. Note that habitat points are enlarged and not drawn to scale to enable viewing of individual structures.
We also developed coverage ratios for natural and artificial structures across the Gulf of Mexico (i.e., the percent of bottom composed of a given reef type) by state or region (i.e., East or West of the Mississippi River). For artificial structures without specific size data, state specific size estimates were applied based on average size associated with each type (i.e., oil platform, reef ball, large shipwreck, small shipwreck, etc.). Coverage estimates were calculated in ArcMAP 10.6. The calculated coverage ratios were necessarily a minimum estimate given that not all bottom habitat has been mapped and many artificial structures have not been publicly deployed.
Linking Fishing Locations to Habitat
The filtered VMS fishing locations were overlaid on the habitat maps in ArcMAP. A spatial selection procedure was then performed to assign each fishing location to natural reef (NR), artificial structure (AS), or unknown habitat (UNK). Around oil and gas platforms red snapper are often found in high densities up to 100 m away from the structure (Reynolds, 2015), while most fishermen target structured bottom using precise GPS coordinates, sonar, and local or traditional ecological knowledge. Thus, it can be reasonably assumed that fishing locations within close proximity to an identified reef structure were targeting that structure. Therefore, we incorporated a buffer around identified reef structures to account for small scale spatial imprecision, thereby assigning fishing locations to the associated reef structure if they were within the predefined spatial buffer zone. Various sizes of buffers were explored (i.e., 100, 250, 500, and 1000 m) to reduce uncertainty in habitat assignment by minimizing the rate of assignment of a given fishing location to multiple habitat types. A buffer of 100 m led to low assignment rates of fishing locations to habitat type and were likely overly stringent given that most red snapper fishermen are known to target structured reef habitat. Increasing the buffer from 100 to 250 m doubled the number of assignments to structure, while maintaining a multiple classification rate (i.e., more than one type of habitat assigned per fishing location) rate of <1%. Buffers larger than 250 m did not greatly increase the number of fishing locations assigned to habitat, but increased multiply classified habitats (i.e., multiple classification rates by buffer size were: 250 m < 1%; 500 m = 2%; and 1000 m = 5%). Thus, a buffer size of 250 m was determined to provide an adequate balance between maximizing identification, while minimizing ambiguous assignments. Individual fishing location data were also assigned to depth strata (i.e., in 10 m bins from 0 to 100 m, with larger bin sizes at depths greater than 100 m, based on NOAA bathymetric charts) and state-level locations.
Most trips were composed of multiple fishing activities or locations (as determined by the analysis of VMS data), yet only total landings from the entire trip were recorded dockside (in the TIP database). Thus, an assumption about the percentage of landings occurring during each identified fishing event within a given trip was necessary. Due to lack of more refined data to assess how much red snapper were landed during each fishing event, it was assumed that each event resulted in equivalent landings. The associated TIP landings from a given trip were thus equally allocated to all fishing locations from a trip, then the percent of landings from each habitat was calculated based on the number of habitat-linked fishing events and associated assigned landings. The resultant VMS-TIP non-extrapolated dataset (see Table 1 for a definition of each data set) provided landings by exact fishing location and assigned to artificial structure, natural reef, and unknown habitat for all trips in the filtered VMS-TIP database.
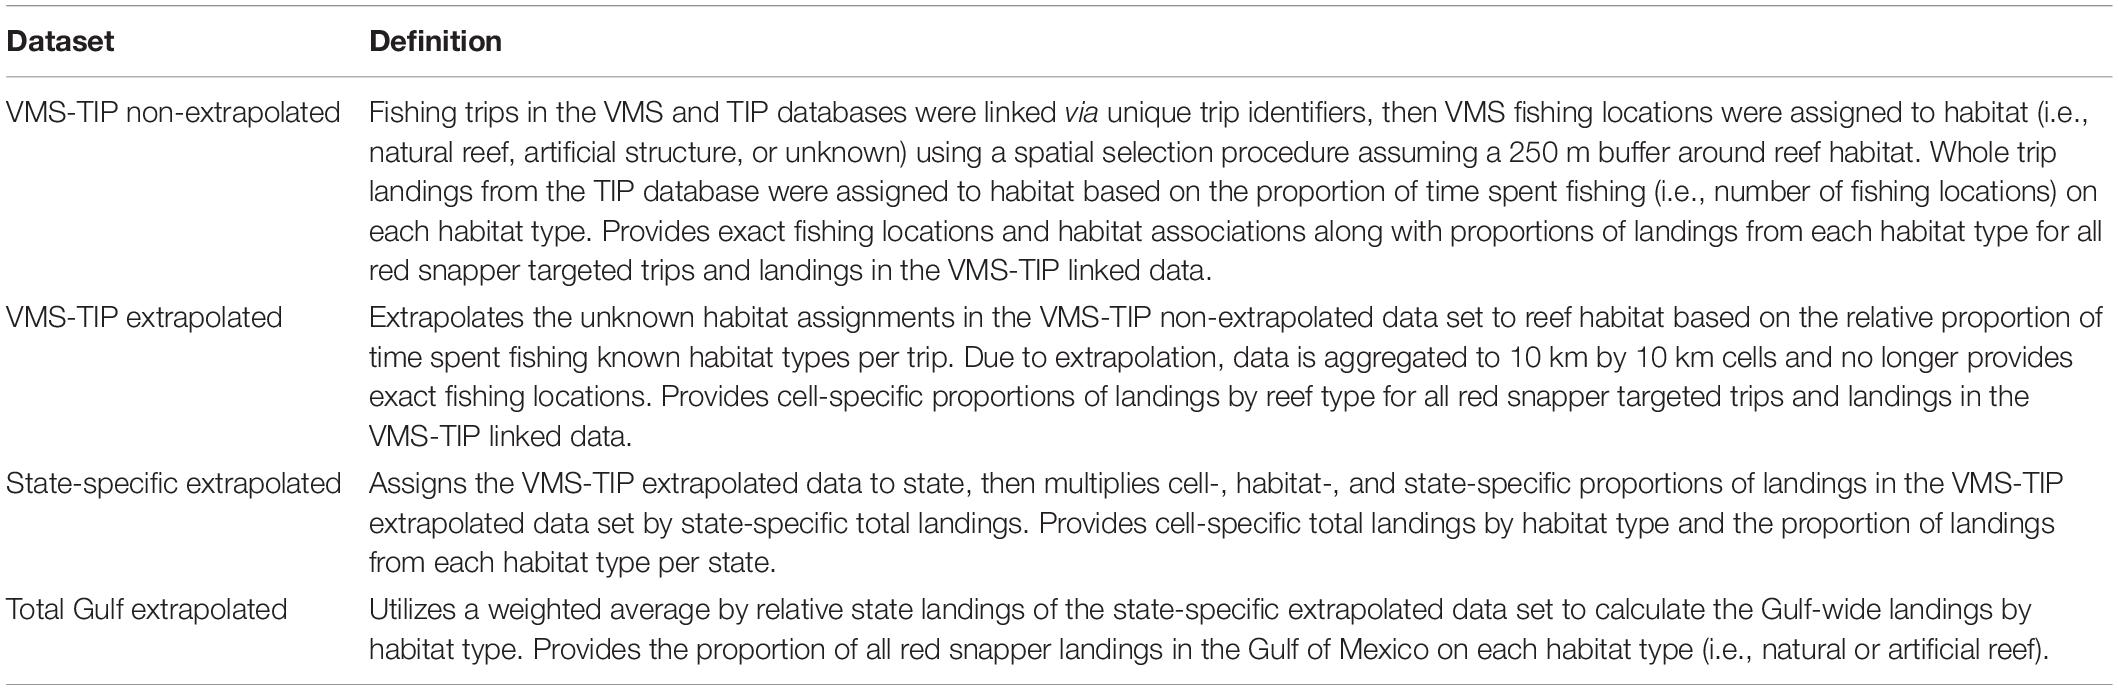
Table 1. Definitions and methods for developing each dataset in the study.
Extrapolating to Total Commercial Landings
The VMS-TIP linked data represents a limited subset of total commercial fishing activity and much of the habitat in the Gulf of Mexico remains unmapped, even though a majority of the unknown habitat that is actively fished upon is likely to be some type of structured bottom (i.e., either undocumented personal artificial structures or unmapped natural structures). Therefore, from the VMS-TIP non-extrapolated dataset described above, three additional datasets were developed based on various extrapolation assumptions for each year of available data (see Table 1): VMS-TIP landings extrapolated to only reef habitat, state-specific landings extrapolated to only reef habitat, and total Gulf landings extrapolated to only reef habitat. The VMS-TIP extrapolated dataset provides results from only observed VMS-TIP linked trips, but extrapolates landings from all unknown structure to a specific reef type based on the proportion of fishing locations on a given trip that occur on each habitat type. The state-specific extrapolated dataset utilized the VMS-TIP extrapolated proportions of landings by habitat type and multiplied these by the state-specific commercial landings. Finally, the total Gulf extrapolated dataset scaled the state-specific extrapolated landings proportions by reef type by the total Gulf of Mexico commercial red snapper landings, thereby providing an estimate of the proportion of all landings from artificial or natural reefs.
The primary assumption underlying the VMS-TIP extrapolated dataset was that all unknown structure was actually unidentified natural or artificial structures. It is reasonable, given common fishing behavior as noted previously, to assume that fishing on unknown structure is likely, in a majority of instances, to be fishing on structured habitat that has not yet been mapped. To account for this, the extrapolated dataset assigned landings from unknown structure to artificial or natural reefs based on the proportion of fishing locations (with unknown structure now removed) for each trip on each structure type. For example, if our methodology indicated that a trip landed 1000 lbs of red snapper and there was one fishing location identified on a natural reef, three fishing locations on artificial structures, and four fishing locations on unknown habitat, then the VMS-TIP extrapolated data set would include 250 lbs extracted from natural reefs and 750 lbs from artificial structures. However, because the extrapolated data sets inferred what habitat fishing occurred on, they could not be used to identify exploitation on individual reefs (i.e., because they were no longer explicitly linked to individual fishing locations). Therefore, the extrapolations were done at the scale of 10 square km grid cells, which allowed retention of fine-scale spatial information, albeit not at the individual reef scale. Landings by cell and reef type were obtained by extrapolating all landings from a given trip to predicted fishing locations on identified reef types (as described above); landings were then summed across trips in a given year by the corresponding 10 × 10 km cell based on the latitude and longitude of each fishing location and the associated reef type. The final VMS-TIP extrapolated data set provided cell-specific proportions of catch (i.e., from the VMS-TIP database) from only reef habitat.
To better understand how total Gulf of Mexico commercial landings were likely distributed across habitat types, state-specific commercial landings (i.e., based on trips within a given state as attributed in the annual state landings and where a majority of fish from that trip were landed; Southeast Regional Office [SERO], 2020) were then assigned to habitat based on the proportions from the VMS-TIP extrapolated dataset. In other words, the cell-specific catch proportions by habitat type in the VMS-TIP extrapolated data were assigned to a state, then the total state-specific catch was multiplied by the proportion of catch in the VMS-TIP extrapolated data set from that state, cell, and habitat type. The weighted average (i.e., by landings) of the proportion of catch from each habitat type across all cells associated with a given state was then taken to develop the final state-specific extrapolated data set. Finally, the total Gulf extrapolated data set took the weighted average by state of the catch proportions by habitat type and multiplied this by the total Gulf of Mexico commercial red snapper landings, which provided a general depiction of how landings were distributed across the entire management area. For the state and Gulf-wide extrapolated data sets, the states of Alabama and Mississippi were combined to retain consistency with NOAA reporting of Gulf-wide red snapper landings (Southeast Data Assessment and Review [SEDAR], 2018).
Spatially Explicit Index of Relative Exploitation
Finally, to understand patterns in fishery removals relative to red snapper biomass distributions, we compared the annual removals by cell from the state-specific extrapolated data set (i.e., prior to aggregating across cells and performing the weighted average) to the spatial distribution of red snapper. For this analysis, the total cell-specific landings were calculated by summing across all reef types within a given cell (i.e., after total state-specific landing had been assigned to cell and habitat). If no fishing locations were identified in a cell, landings were imputed based on the average of all adjacent cells. Totals for all cells were scaled to reported landings. Imputations were rare, with 88% of all imputed values occurring in nearshore waters where the commercial fleet does not typically operate and commercial removals are low, so imputing had relatively limited impact on overall catch assignment to cell.
At present, one of the most comprehensive, high resolution spatial maps of red snapper distribution available in the Gulf of Mexico is a Gulf-wide statistical model providing predictions at a 10 × 10 km cell resolution (i.e., matching the cell grid used here to extrapolate landings; Karnauskas et al., 2017; Figure 3). The Karnauskas et al. (2017) analysis used extensive synoptic sampling from the 2011 Congressional Supplemental Sampling Program, and has previously been recognized as the best scientific information available for determining red snapper distribution across the Gulf of Mexico (Gulf of Mexico Fishery Management Council [GMFMC], 2019). The static spatial distributions of red snapper from Karnauskas et al. (2017) were utilized to assign two different estimates of biomass to each cell: (1) the terminal year (i.e., 2016; the terminal year from the assessment was chosen as these biomass estimates are deemed more reliable than projected values for 2019) regional age-2+ (i.e., age 2 and older) biomass estimate from the most recent SEDAR 52 red snapper stock assessment (Southeast Data Assessment and Review [SEDAR], 2018); and (2) the 2019 state specific age-2+ biomass estimate from The Great Red Snapper Count (Stunz et al., 2021; abundance from the GRSC was converted to weight based on regional weight-at-age relationships reported in the SEDAR 52 assessment). Age-2+ biomass was utilized given that this was a common metric reported in both studies. Both estimates of population size were utilized because the SEDAR52 value is currently used as the basis of management advice, whereas the GRSC estimate is believed to better account for biomass in unstructured bottom (i.e., areas that are typically not exploited or sampled and thus are not well represented in the stock assessment estimates). Biomass, B, in each grid cell, i, was determined by scaling the total age-2+ biomass estimate (i.e., either from SEDAR 52 or the GRSC), Btotal, by the proportion of red snapper from the Karnauskas et al. (2017) study in each grid cell, xi:
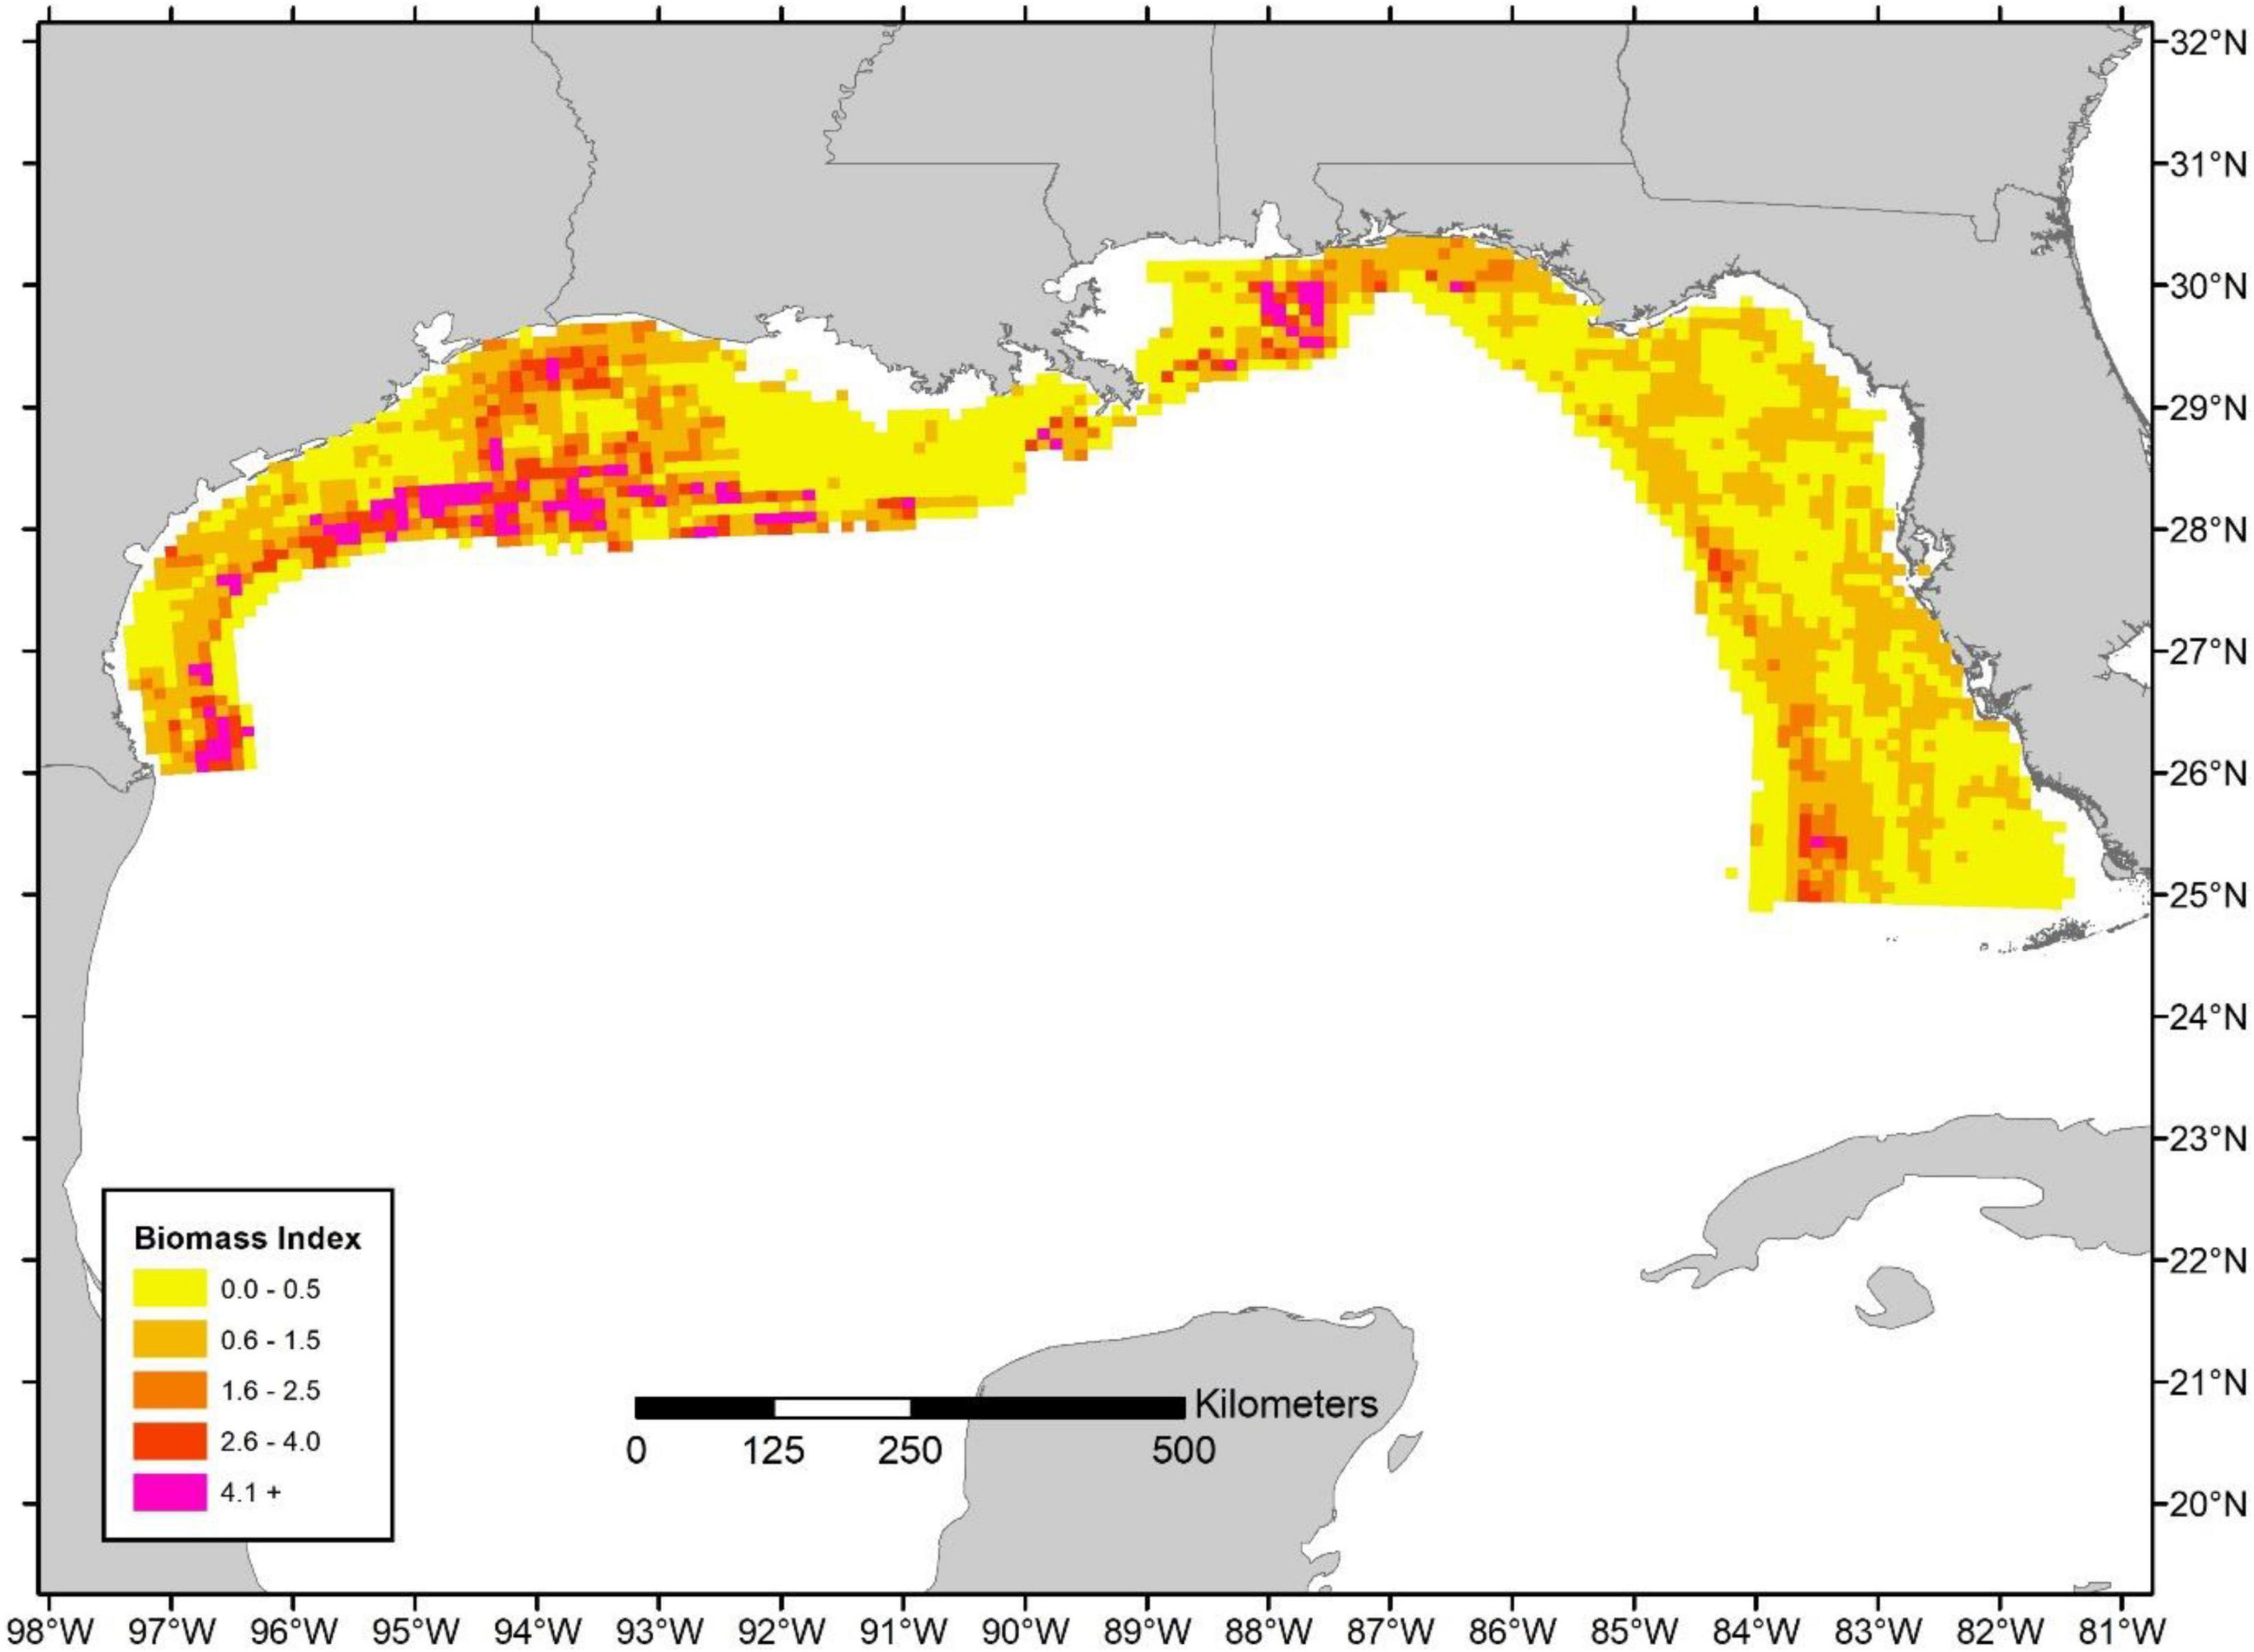
Figure 3. Relative biomass index based on results of Karnauskas et al. (2017).
These biomass values reflect different years (i.e., 2016 and 2019 for the SEDAR 52 assessment and the GRSC, respectively) and do not match the year from which the distribution maps were generated (i.e., based on 2011 data). However, they provide a general overview of the relative size of the population from two sources and demonstrate bounds on likely exploitation when compared to the spatial distribution of landings (i.e., given that the GRSC estimates exceed the SEDAR 52 estimates by approximately three-fold). Additionally, given that limited movement of adult red snapper is often observed from tagging studies (Patterson, 2007), it is unlikely that the distribution of biomass has altered drastically since the Karnauskas et al. (2017) analysis was completed (i.e., assuming patterns in recruitment have not changed).
The resultant overlaid spatially explicit data provided relative landings for a given year and relative red snapper biomass at the same spatial resolution. We then calculated an index of relative red snapper exploitation by dividing landings in each 10 × 10 km cell by the static relative biomass in each cell. Ultimately, the index represents an approximate or relative exploitation rate by cell given the handful of assumptions that were required. For instance, removals were greater than abundance in a limited number of cells and years, which could be a result of the landings imputation overestimating removals, failure of the species distribution model to account for fine-scale features driving red snapper abundance, or interannual variability that was not accounted for in the static biomass distributions. When removals exceeded biomass, the index value was capped at 1.0. Additionally, we assumed that landings were primarily age-2+ to match the biomass estimates, which is generally reasonable given that there are effectively no landings of age-1 fish in the commercial fishery. Finally, the temporal mismatch between the biomass distributions and landings implies that the exploitation index does not reflect any particular year, but rather provides a general overview of recent exploitation. The index was developed for each year that VMS data were available (i.e., 2011, 2012, 2018, and 2019; see the Supplementary Material for Results from years prior to 2019) and for each biomass source (i.e., the 2019 GRSC and the SEDAR 52 terminal year, 2016, estimate).
Finally, to summarize exploitation across the entire Gulf of Mexico by the commercial fishery, we calculated the proportion of biomass that experienced different levels of relative exploitation. Cell-specific exploitation index values were binned relative to the exploitation rate proxy for the fishing mortality at maximum sustainable yield (i.e., FMSY, which is approximated by the exploitation rate that maintains a spawning potential ratio, SPR, of 26%). The delineations of exploitation were: none – no catch; low – exploitation index equal to or less than 0.5⋅FMSY proxy; medium – exploitation index greater than 0.5⋅FMSY proxy but less than or equal to FMSY proxy; high – exploitation index greater than the FMSY proxy. The FMSY proxy for age-2+ fish landed only by the commercial fishery was equivalent to a harvest rate (landed weight of age-2+ fish / biomass of age-2+ fish) of 0.084 based on the SEDAR 52 assessment (Southeast Data Assessment and Review [SEDAR], 2018) and 0.122 based on the GRSC biomass estimate (National Marine Fisheries Service [NMFS], 2021). Given the assumptions utilized to develop the relative exploitation proxy, comparison to an absolute estimate of FMSY may not be optimal, but we believe that these relative comparisons provide a useful measure of the level of exploitation across the red snapper resource.
Results
Gulf of Mexico Reef Coverage
Aggregation of the available habitat datasets resulted in an extremely detailed and fine-scale mapping of over 135,000 natural reefs, 22,900 artificial structures, and approximately 87,000 linear km of oil and gas pipelines (many of which are fully or partially buried; Figure 2). Not surprisingly, the western Gulf of Mexico, where most oil platforms and pipelines are located, is dominated by artificial structures. Conversely, the eastern Gulf of Mexico, especially the West Florida shelf, consists primarily of natural reefs with numerous smaller scale artificial structures. However, much of the Gulf of Mexico consists of unstructured bottom, such as sand, shell, or mud (>78%; Parker et al., 1983). The remaining 22% is estimated to contain structures such as rocky reefs, corals and sponges, consolidated sediments, and artificial structures. We estimate that natural reefs constitute approximately 98% by area of the structured habitat and artificial structures represent the remaining 2% (note that in Figure 2 reef sizes are not to scale to enable visibility of each structure, which may provide an unrealistic portrayal of the area occupied by artificial structures). Natural features are generally much larger in scale than artificial structures, while, given limitations in identifying and mapping small-scale “private” (i.e., deployed by individual fishermen) artificial structures, the amount of artificial reef habitat is necessarily an underestimate in our analysis.
Analysis of Vessel Monitoring Systems Data and Linkage of Fishing Activity to Habitat
A total of 759,979 VMS time stamped events from commercial reef fish vessels were identified as presumed fishing activities within the four years of available VMS data. These data were collected from 605 reef fish vessels accounting for 34,030 individual trips. When the VMS data were filtered to include only trips that were linked with TIP landings reports and that also landed red snapper, a total of 1866 trips were retained of which 94% included at least one habitat associations. The availability of linked data per region (i.e., east or west Gulf of Mexico) was heavily influenced by TIP sampler coverage, where 959 (51%) of trips originated in Florida, 341 (18%) in Alabama or Mississippi, 424 in Louisiana (23%), and 142 (8%) in Texas. For red snapper targeted trips averaged across all four years of VMS data, 47% of VMS fishing locations were matched to a specific habitat, including 32% (±1%) on natural reefs and 15% (±7%) on artificial structures (Table 2). The states in the central Gulf of Mexico (i.e., Alabama, Mississippi, and Louisiana) demonstrated similar patterns with greater than 64% of trips associated with known habitat (∼35% on natural reefs and ∼30% on artificial structures). Texas had slightly lower classification success (47%), with a higher concentration of trips on artificial (30%) compared to natural (17%) reefs. Conversely, Florida had low classification success (32%) with almost all trips focused on natural reefs (29%) and limited fishing on artificial structures (3%).
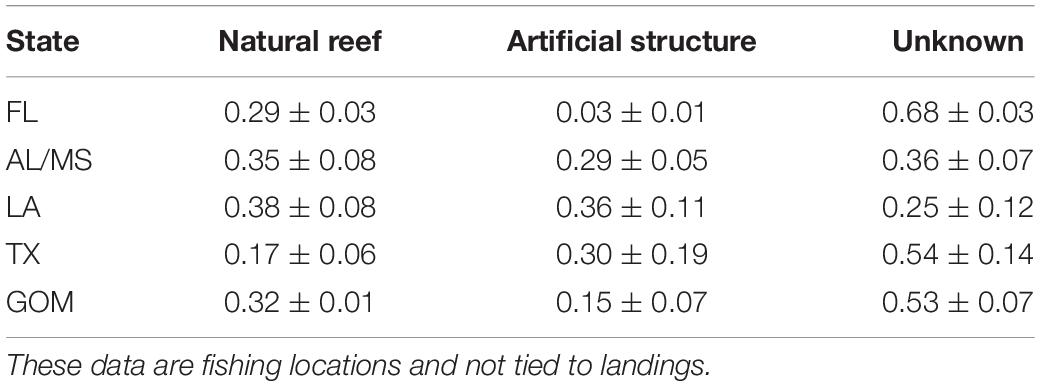
Table 2. Mean proportion of habitat linked to fishing events by vessels landing red snapper ( ± 95% confidence intervals) from the Vessel Monitoring Systems (VMS) dataset, provided by state and also averaged across the entire Gulf of Mexico (GOM).
When landings were linked to individual fishing locations (i.e., the VMS-TIP non-extrapolated data set), then aggregated across years and states, the breakdown of mean red snapper landings by weight across the Gulf of Mexico was 22% from natural reefs, 25% from artificial structures, and 53% from unknown habitat (Table 3). When the data from unknown habitats was then extrapolated to reef habitat based on trip level proportions (i.e., the VMS-TIP extrapolated data set), roughly equal exploitations were derived across reef types (i.e., 54% from natural reefs and 46% from artificial structures; Table 3). Although yearly variation was present, fluctuations were generally less than 5% by reef type (Table 3).
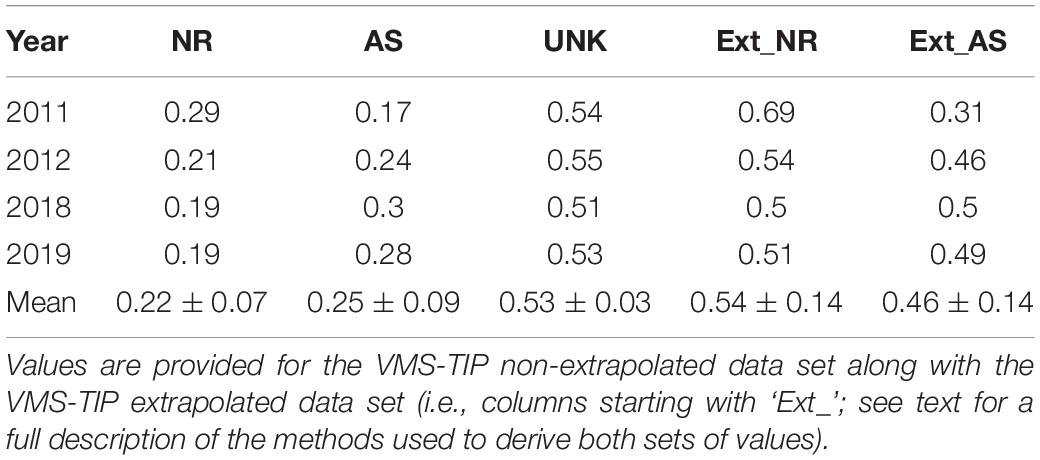
Table 3. Annual Gulf-wide estimates of red snapper proportional landings by habitat type (NR = Natural Reef, AS = Artificial Structure, UNK = Unknown) along with mean proportion (averaged across all years) of catch per habitat from the VMS-TIP linked trips (% confidence intervals are provided for mean values).
Extrapolating to Total Commercial Landings
Marked differences between the eastern vs. central and western Gulf of Mexico were apparent from the state-specific extrapolated landings by habitat type (Table 4). Notably, Florida had the most landings on natural reefs (i.e., mean of 91%), with the rest of the Gulf States displaying higher landings from artificial structures (i.e., means of 69–78%; Table 4). Natural reefs in Florida displayed the largest proportion of landings followed by artificial structures in Texas and Louisiana (Table 4). In general, landings were similar across habitat types when averaged across the entire Gulf of Mexico (i.e., the total Gulf extrapolated data set; Table 4 and Supplementary Figure 3).
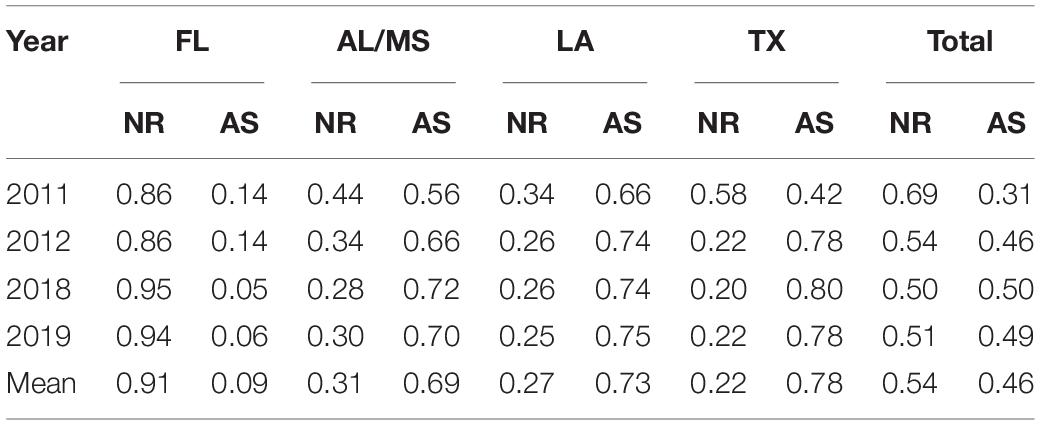
Table 4. Annual proportion of extrapolated landings by state and structure (i.e., the state-specific extrapolated landings data set; see text for a full description of the Methods used to derive extrapolated values) along with mean proportion (averaged across all years) of catch per habitat.
Spatially Explicit Index of Relative Exploitation
The 10 × 10 km resolution maps of landings and relative exploitation rate indicate that fishing is highly heterogeneous and that heavy fishing pressure and high landings occur in localized hotpots, particularly in the Eastern Gulf of Mexico (Figures 4–6). There was little temporal variation (see Supplementary Figures 5–10 for exploitation maps for 2011, 2012, and 2018). However, patterns in landings (Figure 4) compared to relative exploitation (Figures 5, 6) differed spatially due to the distribution of biomass. For instance, the highest landings were calculated nearshore around the Florida panhandle and also in offshore waters of Texas along the continental shelf break (Figure 4). However, given the relatively high levels of biomass in the western Gulf of Mexico and, in particular, the offshore areas of Texas, the relative exploitation patterns were typically lower in the western Gulf despite high landings in a number of cells (Figures 5, 6). Overall, relative exploitation rates were much higher in the Eastern Gulf, especially around the Florida panhandle and a handful of offshore areas of Alabama and Mississippi (Figures 5, 6).
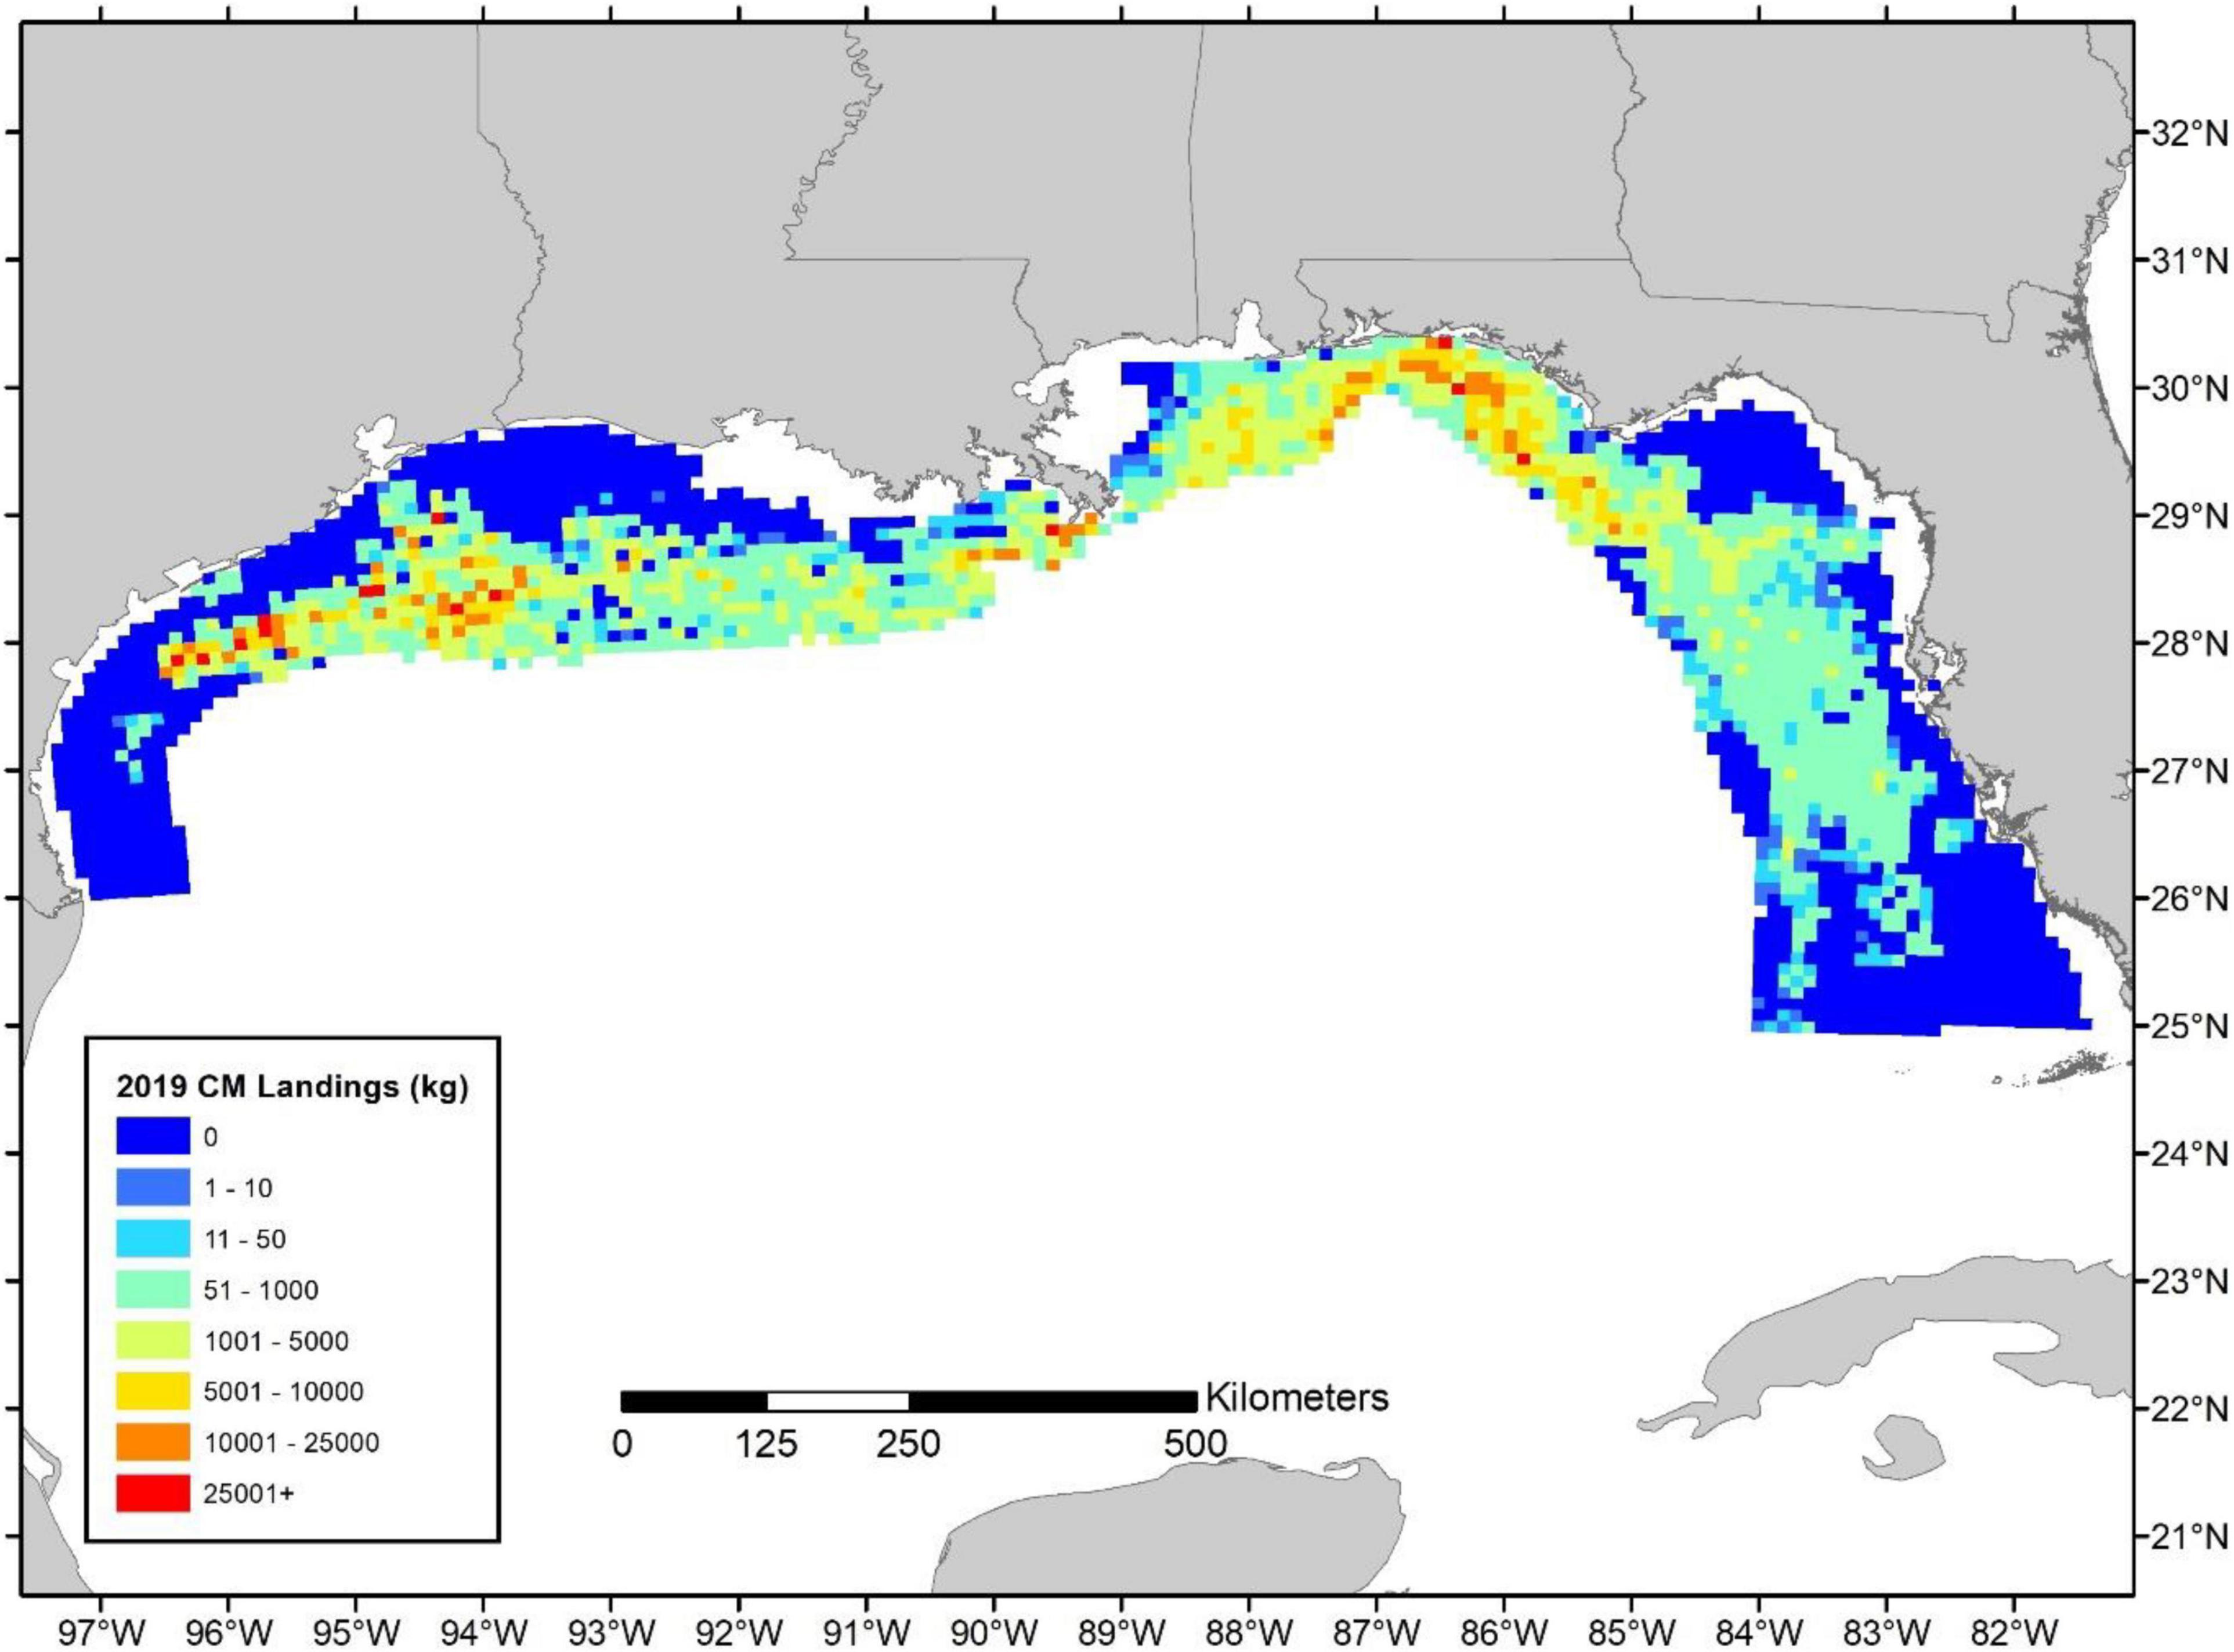
Figure 4. 2019 red snapper estimated commercial landings (kg) per 10 × 10 km grid cell.
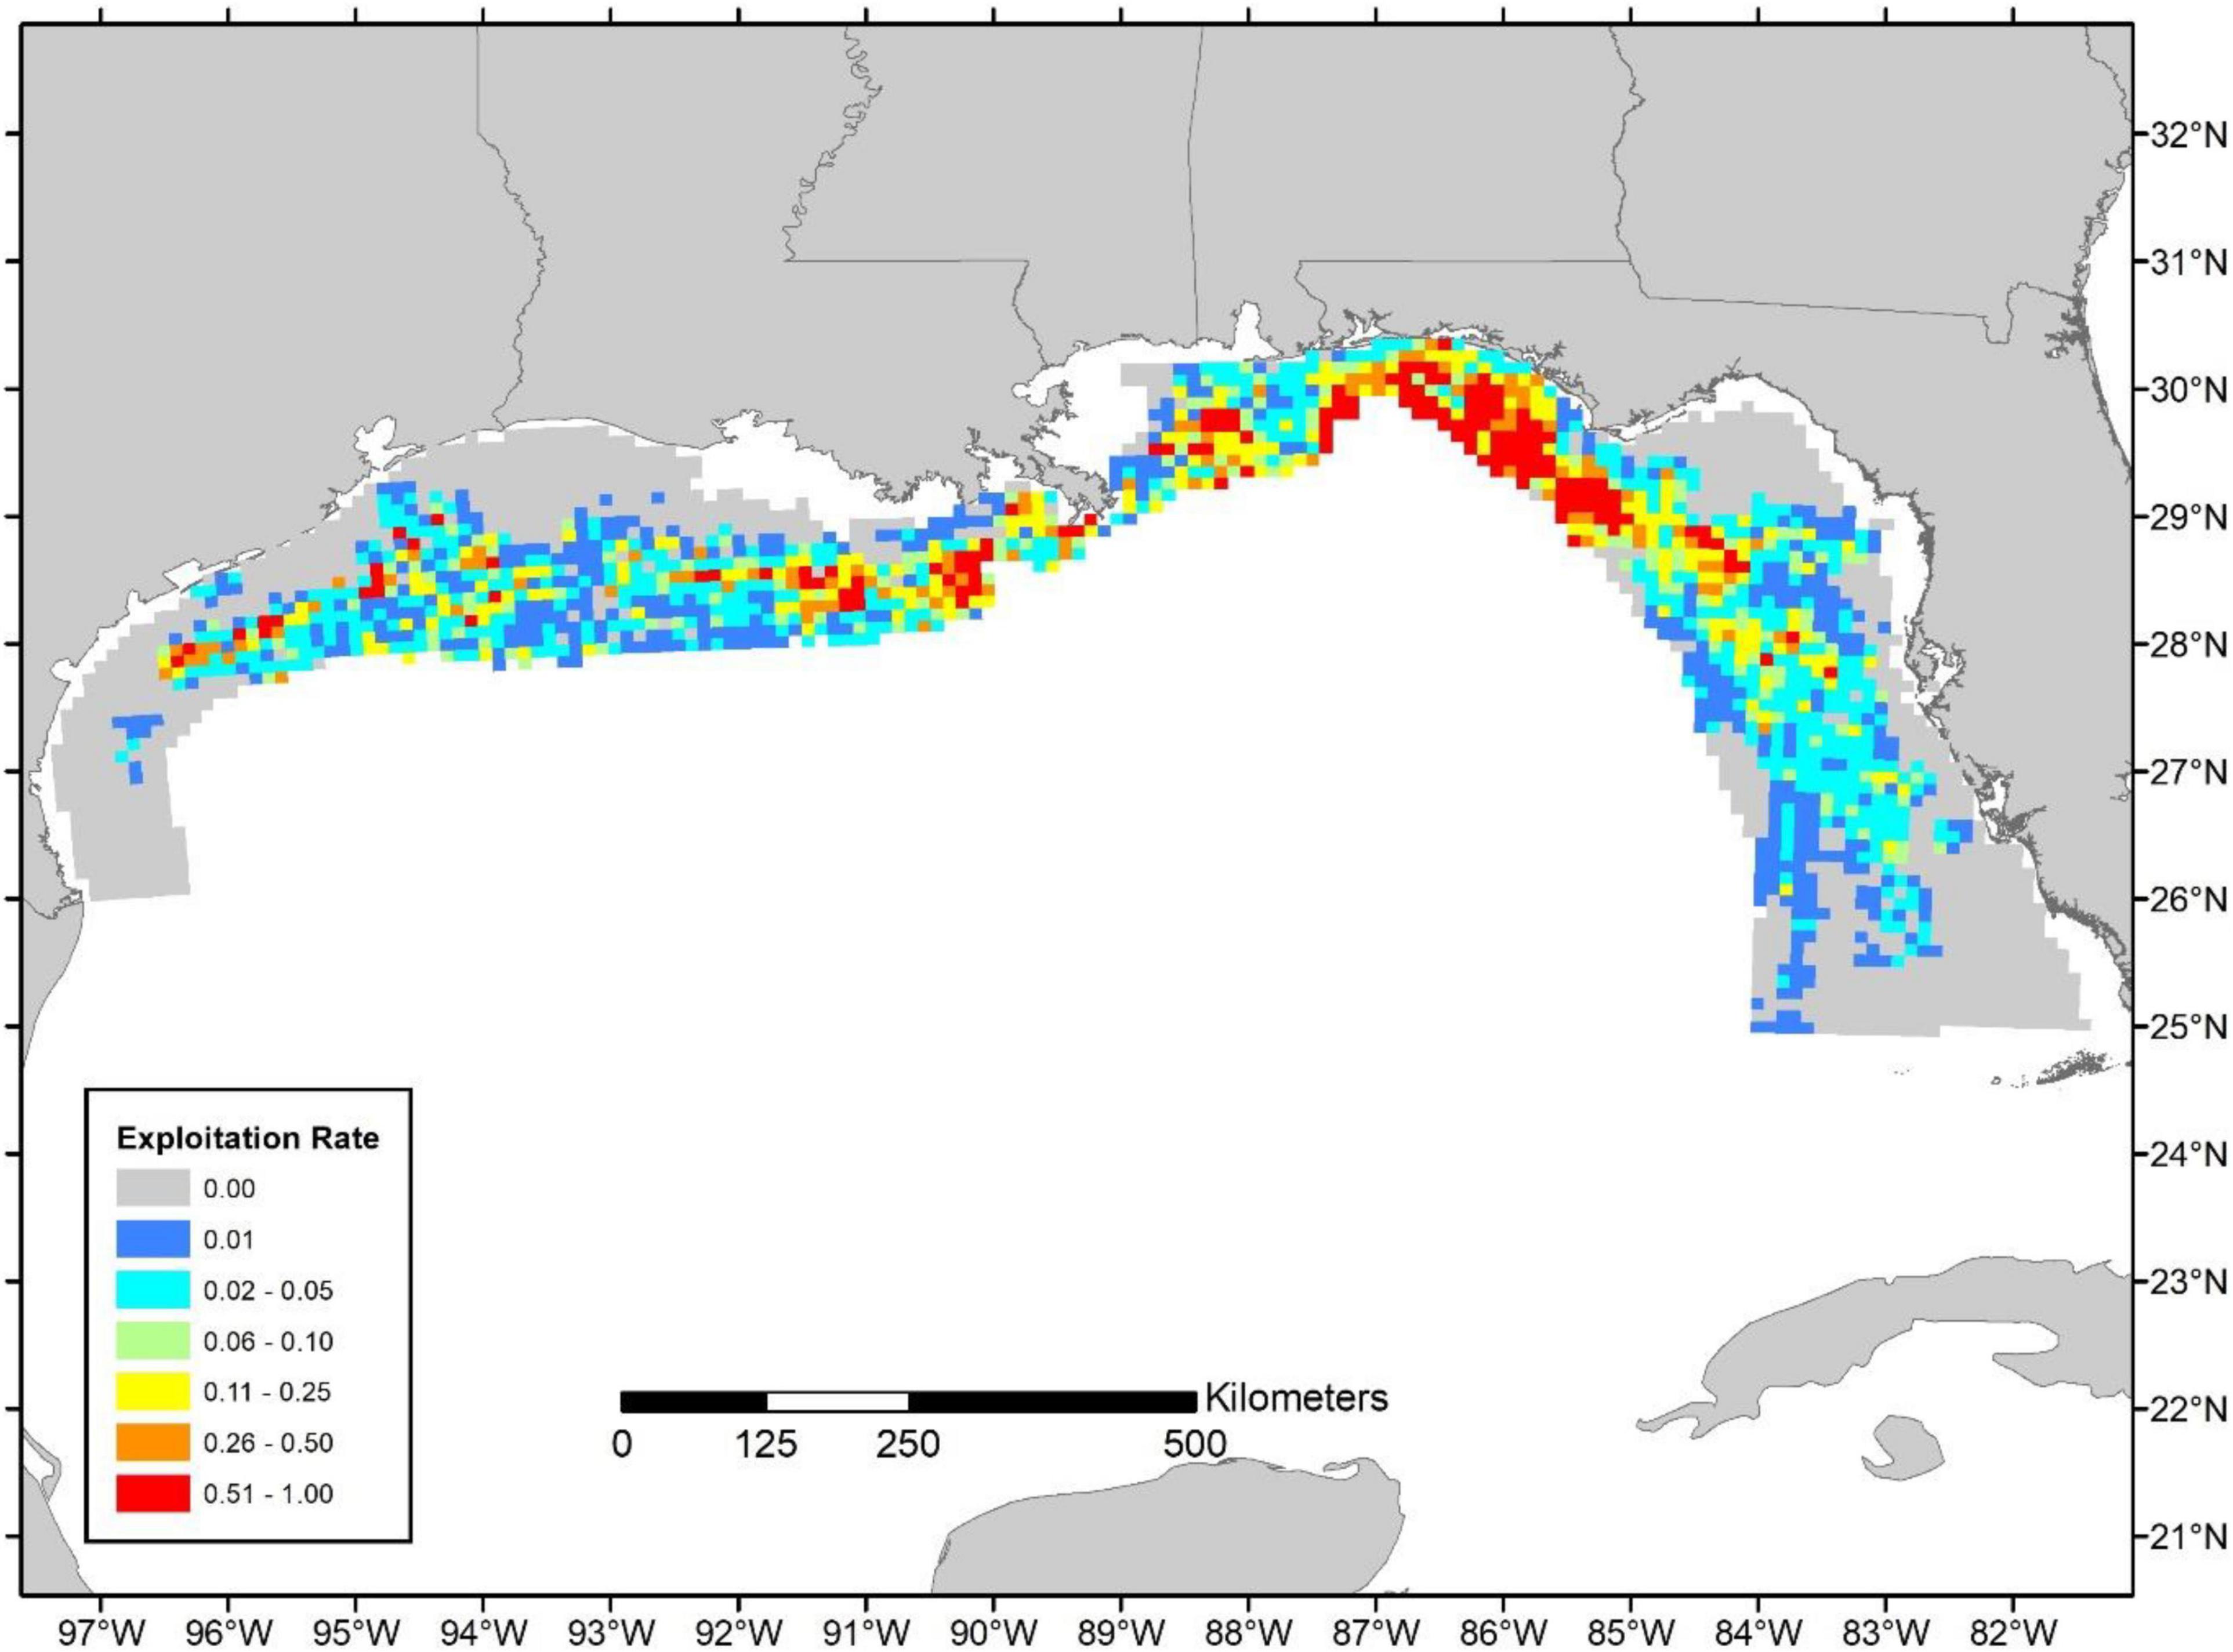
Figure 5. Relative exploitation index based on the 2019 commercial landings. Estimates of age-2+ biomass are from the terminal year of the SEDAR 52 stock assessment (i.e., 2016) and distributed according to Karnauskas et al. (2017; Figure 3).
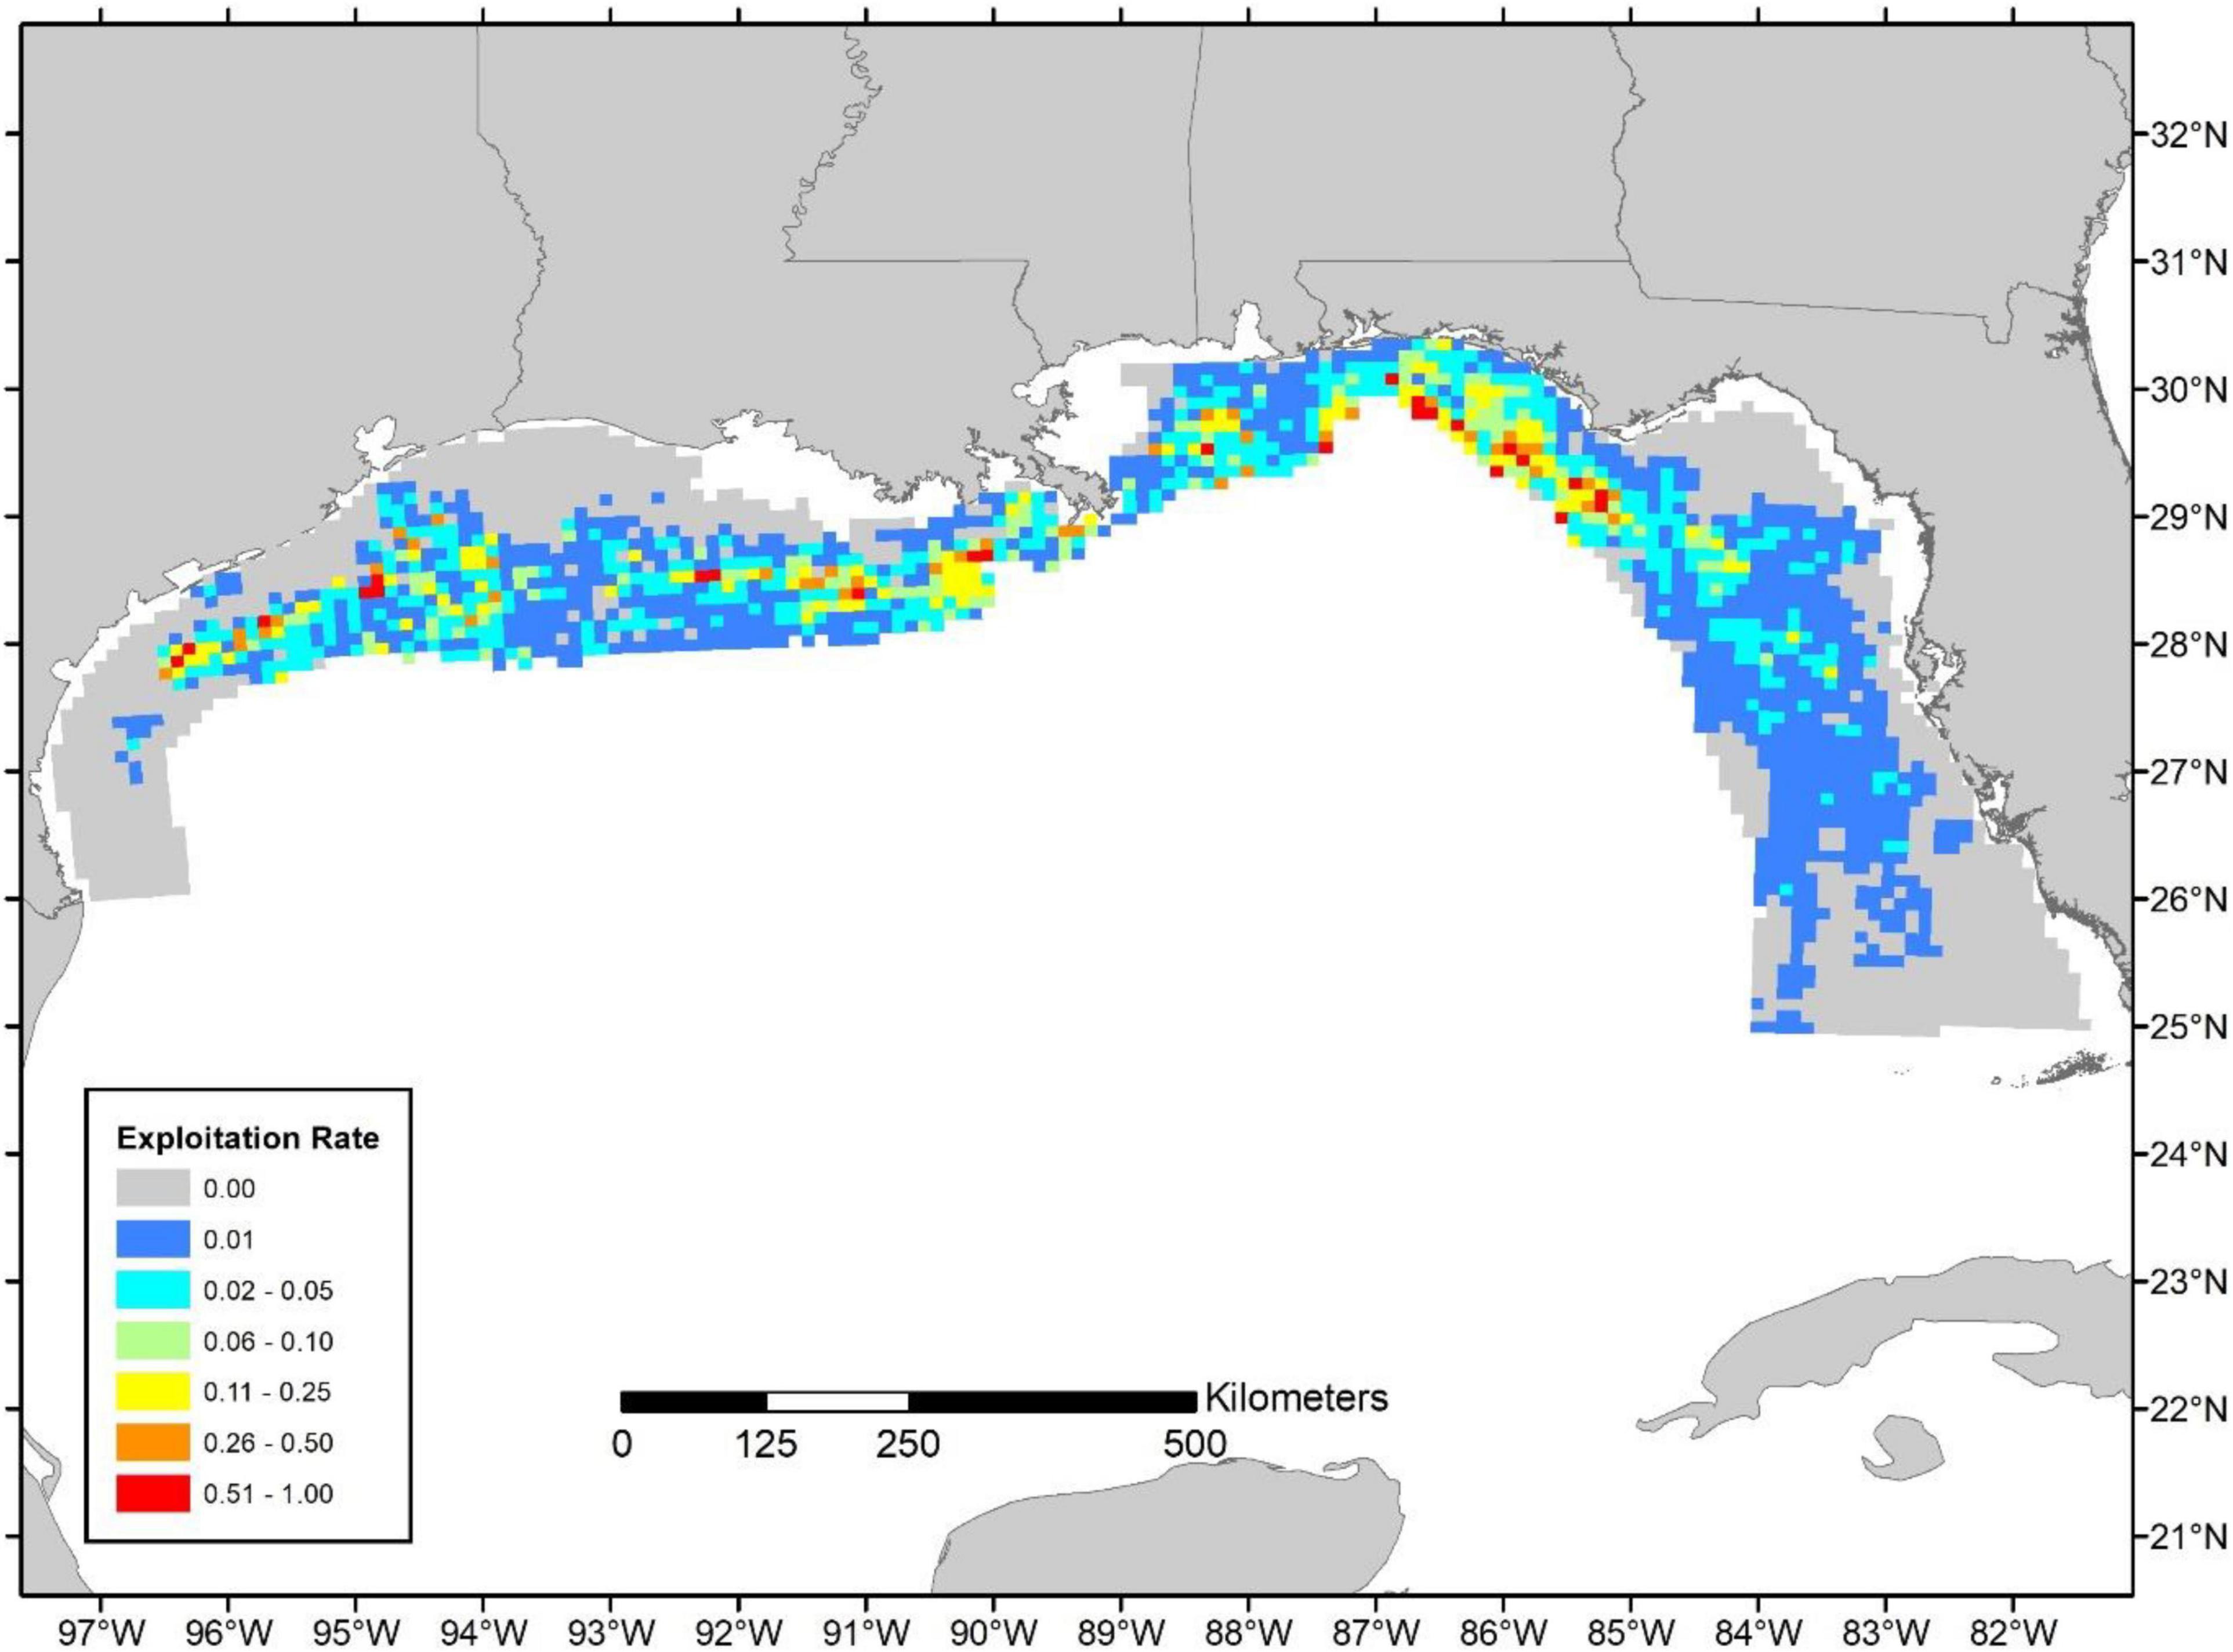
Figure 6. Relative exploitation index based on the 2019 commercial landings. Estimates of age-2+ biomass are from the 2019 Great Red Snapper Count and distributed according to Karnauskas et al. (2017; Figure 3).
Because the source of the biomass estimates (i.e., the SEDAR 52 assessment or the GRSC) differed in magnitude, but were applied to the same spatial biomass distribution, general patterns are similar and differ only in their magnitude of exploitation (Figures 5, 6). When the SEDAR 52 biomass estimates were utilized the mean relative exploitation (i.e., Eastern region harvest rate of 0.100 and Western region harvest rate of 0.067) was 2–5 fold higher than when the GRSC biomass estimates were used (i.e., Eastern region harvest rate of 0.024 and Western region harvest rate of 0.031; Figure 7). The lower mean exploitation index in the eastern Gulf of Mexico compared to western Gulf when using the GRSC biomass is due to a more even distribution of biomass across regions and a higher total biomass compared to the SEDAR 52 estimates.
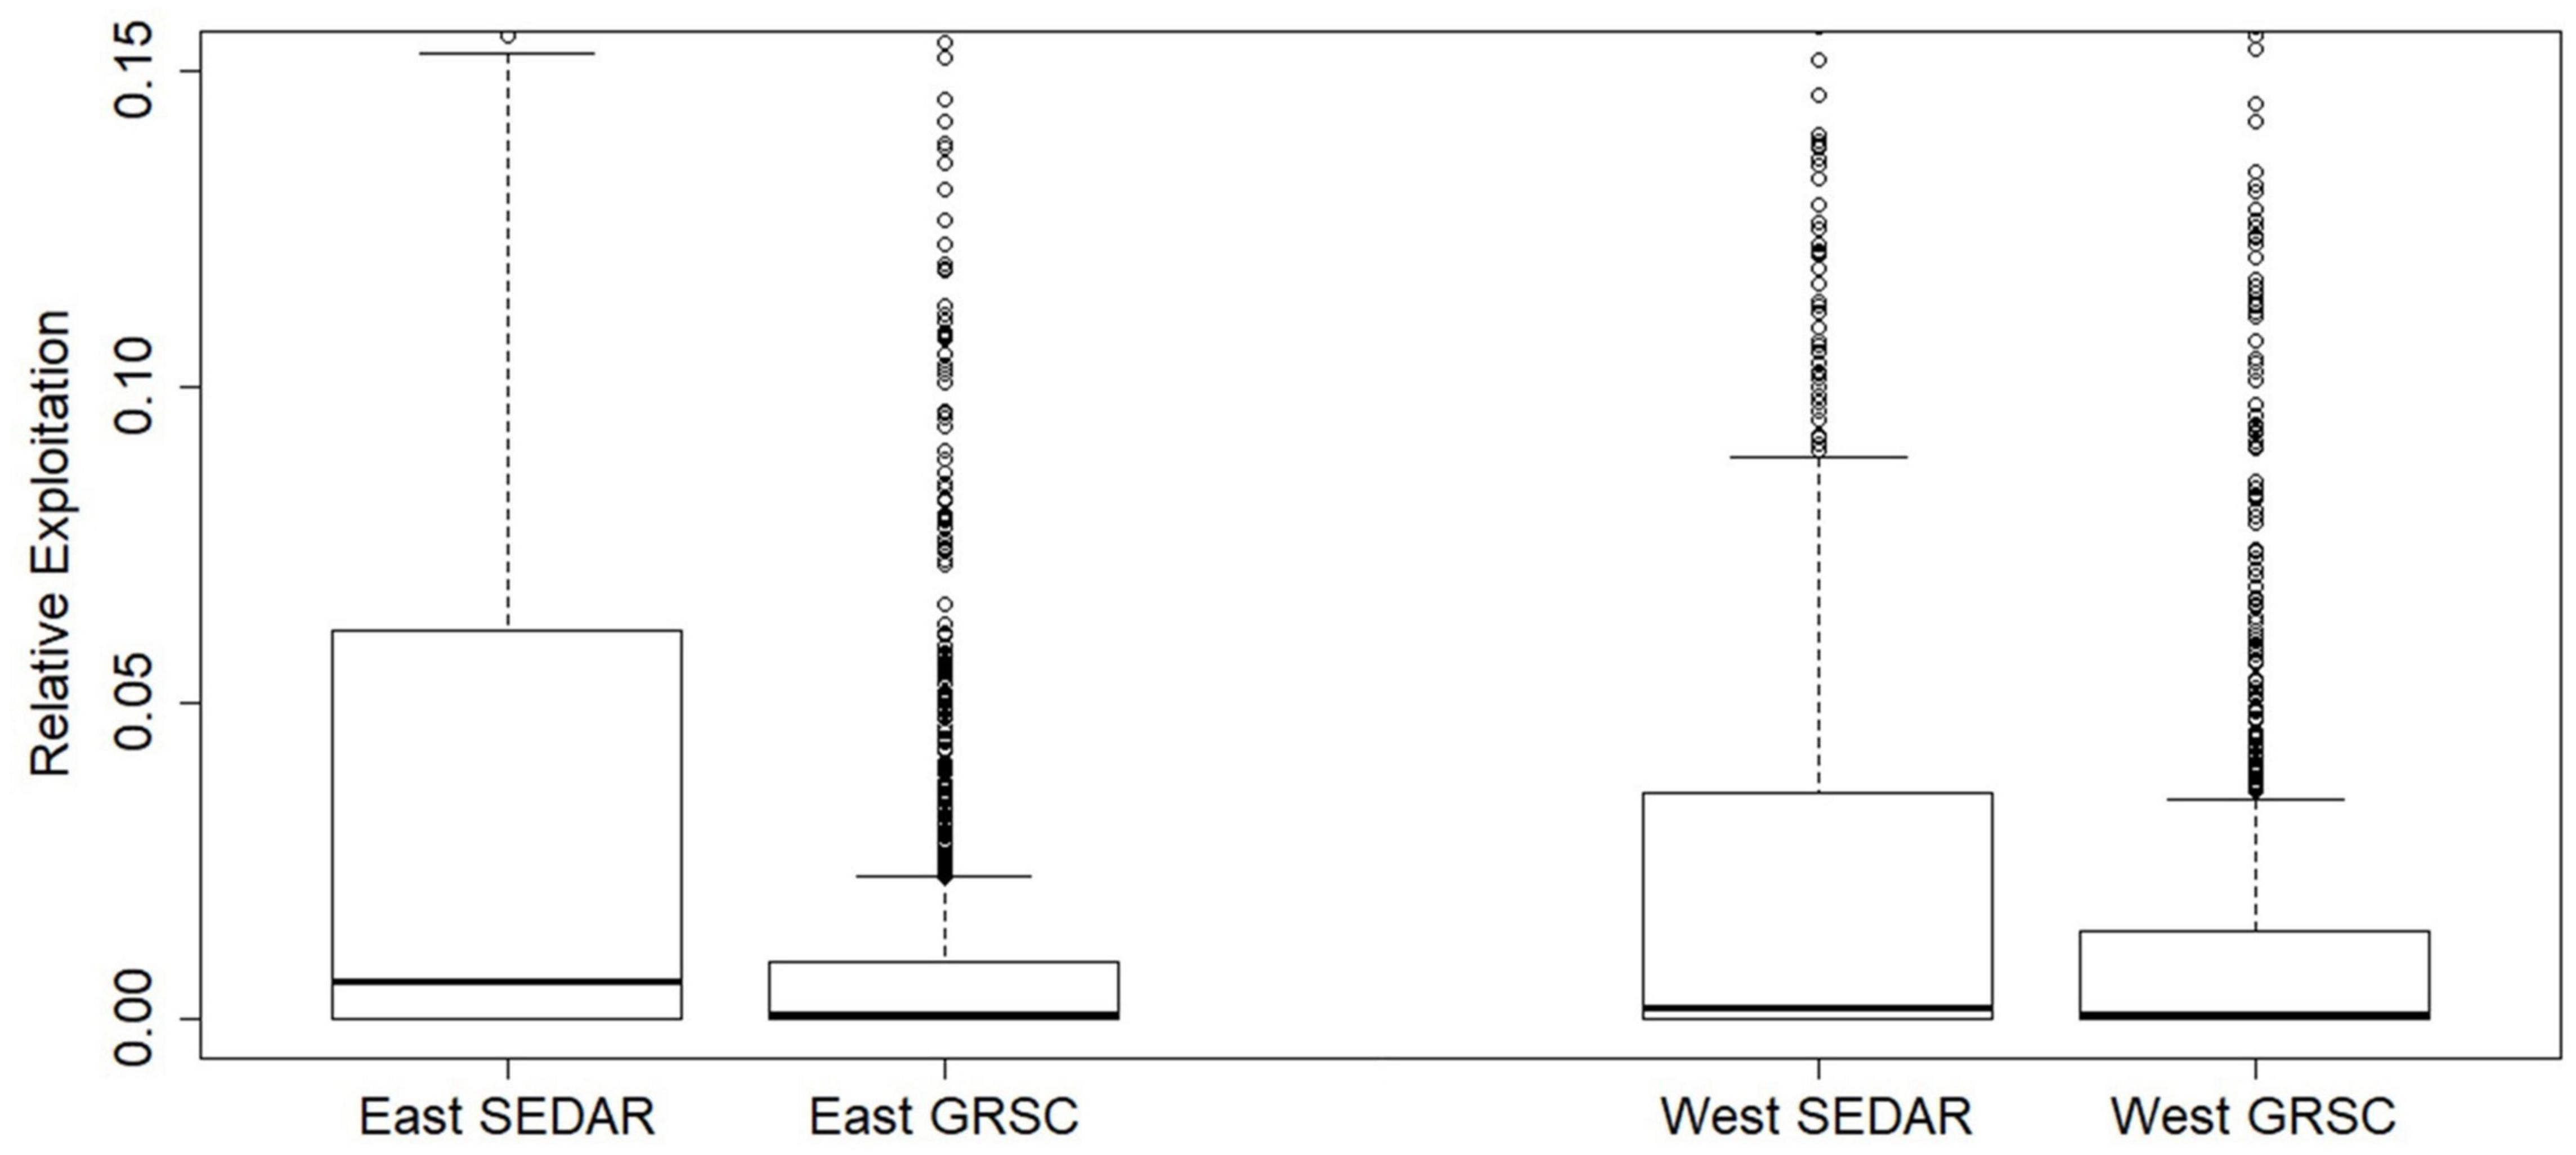
Figure 7. Box plot of relative exploitation by cell delineated by the Eastern and Western Gulf of Mexico based on the age-2+ biomass estimates from the terminal year (2016) of the SEDAR 52 assessment model and the GRSC. Boxes represent the interquartile range, the heavy black line is the median, whiskers represent the 95% intervals, and individual plotted points represent outliers.
In the Western Gulf, the highest exploitation rates appear to occur in deep waters, primarily associated with offshore oil platforms and offshore banks near the continental shelf break (Figure 8). In the Eastern Gulf, heavy exploitation occurs just off the Alabama and Mississippi coast in the Alabama Artificial Reef Zone (AARZ) along with the deeper waters (i.e., natural reefs) off Florida’s Panhandle (Figure 9). In contrast, throughout the West Florida Shelf (Middle Grounds and South to the Dry Tortugas) the highest exploitation rates are further inshore, with some localized hotspots along the shelf break (Figures 5, 6).
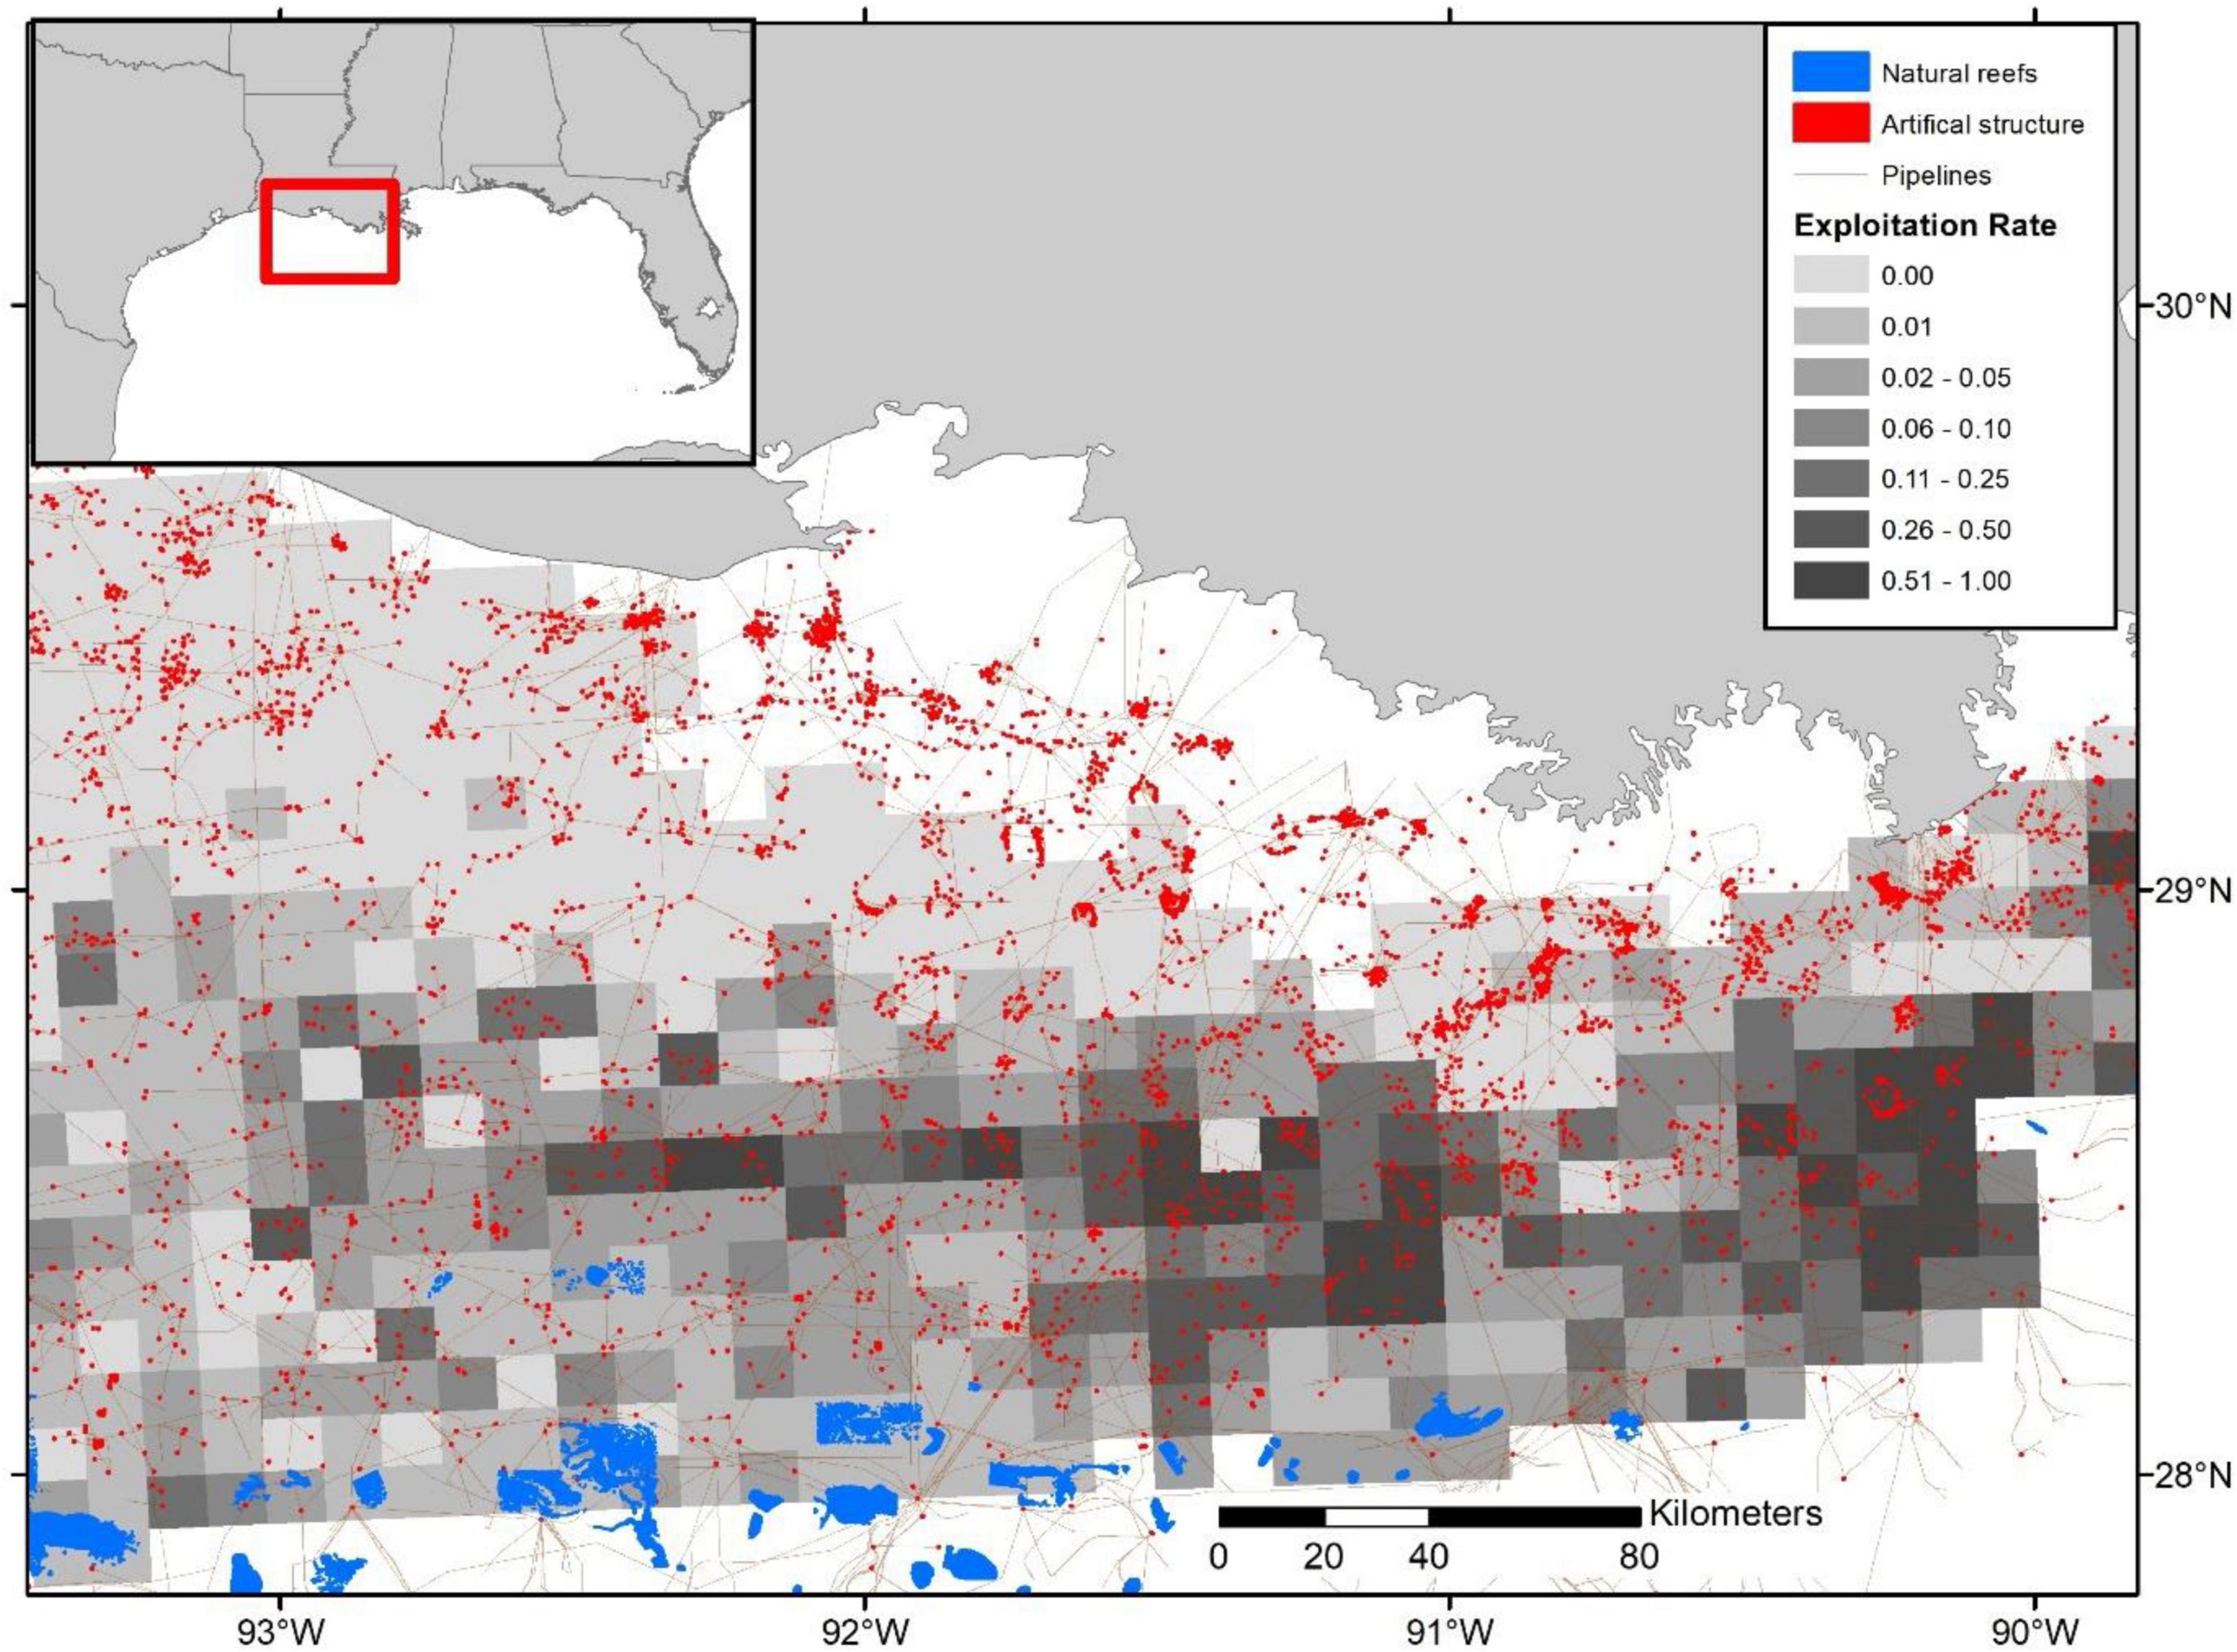
Figure 8. Relative exploitation index per 10 × 10 km grid cells from offshore Louisiana based on the terminal year (i.e., 2016) SEDAR 52 stock assessment age-2+ biomass estimates. Habitat structure sizes are exaggerated and are not plotted to scale.
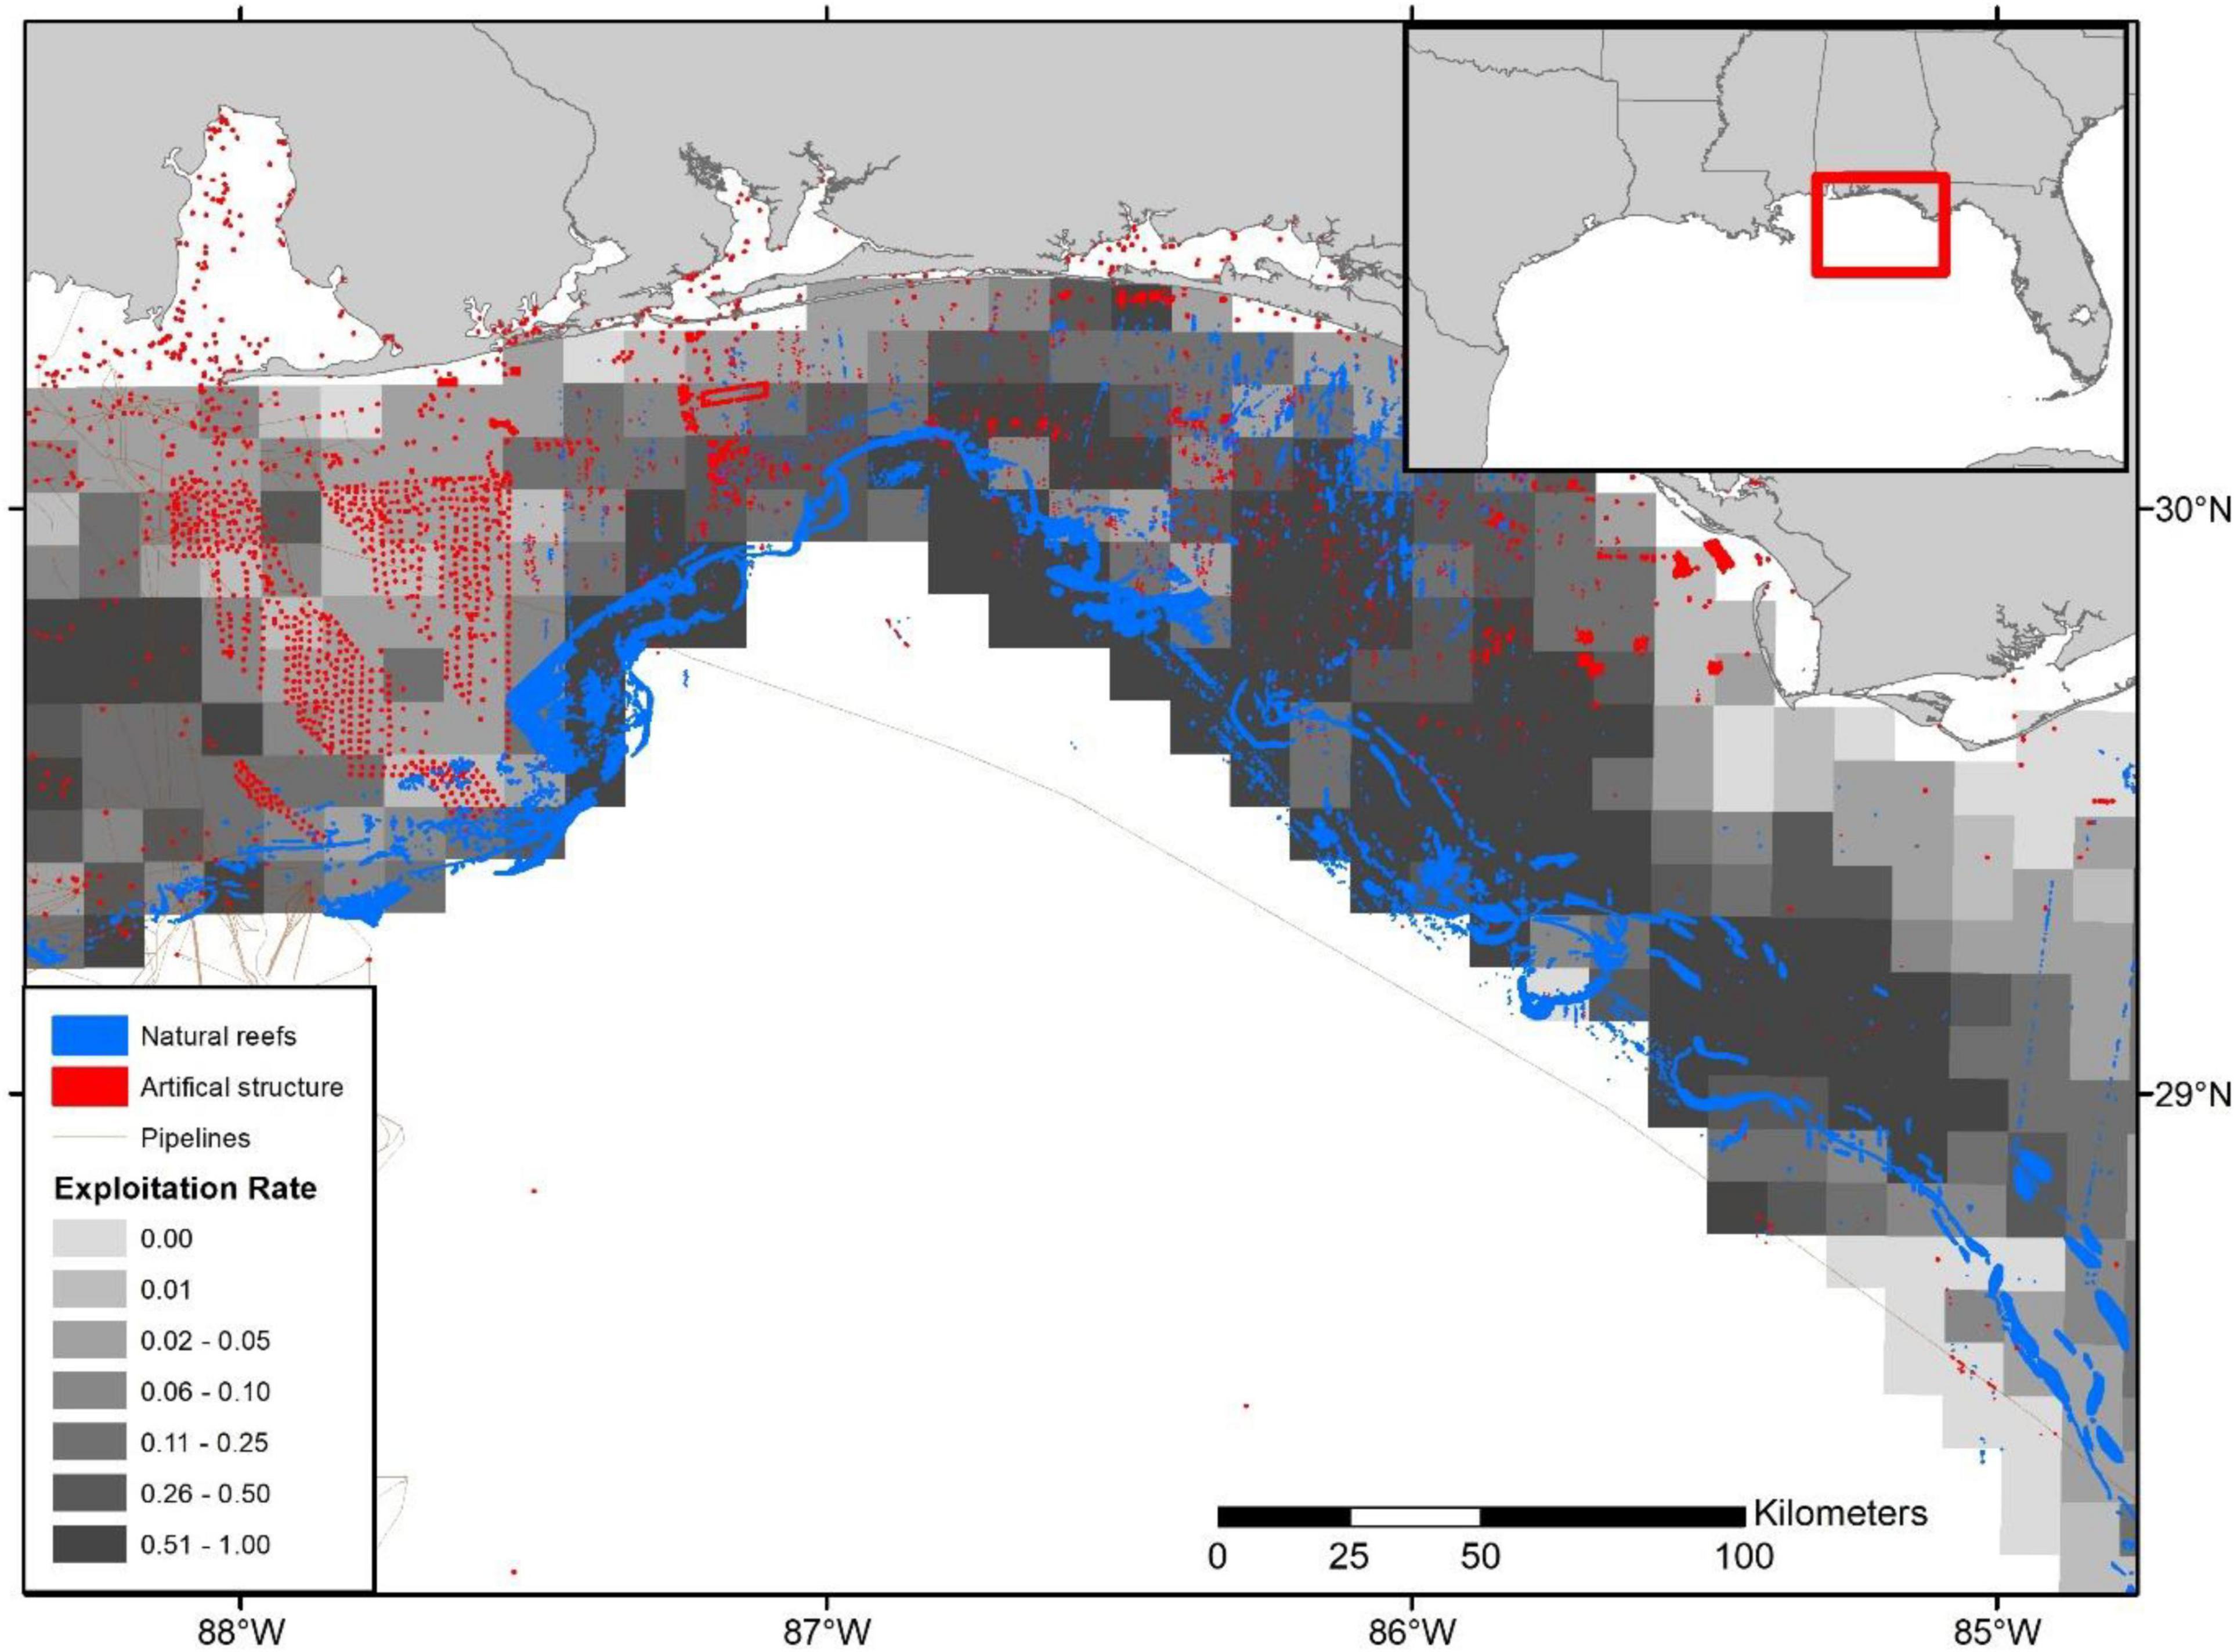
Figure 9. Relative exploitation index per 10 × 10 km grid cells along offshore shelf break and artificial structure zones for the Florida Panhandle and Alabama waters. Relative exploitation index is based on the terminal year (i.e., 2016) SEDAR 52 stock assessment age-2+ biomass estimates. Habitat structure sizes are exaggerated and are not plotted to scale.
Using the SEDAR 52 age-2+ biomass estimates, approximately 83% of the biomass appears to have little or no exploitation (i.e., exploitation index less than 0.5⋅FMSY proxy) from the commercial fishery, while 6.7% has moderate relative exploitation (i.e., exploitation index between 0.5⋅FMSY proxy and the FMSY proxy), and 10% has a high relative exploitation rate (i.e., exploitation index greater than the FMSY proxy; Figure 10). Exploitation based on the GRSC age-2+ biomass estimates indicated that approximately 96% of the biomass undergoes little or no commercial exploitation, 2.5% encounters medium relative exploitation, and 1.5% experiences high relative exploitation (Figure 10).
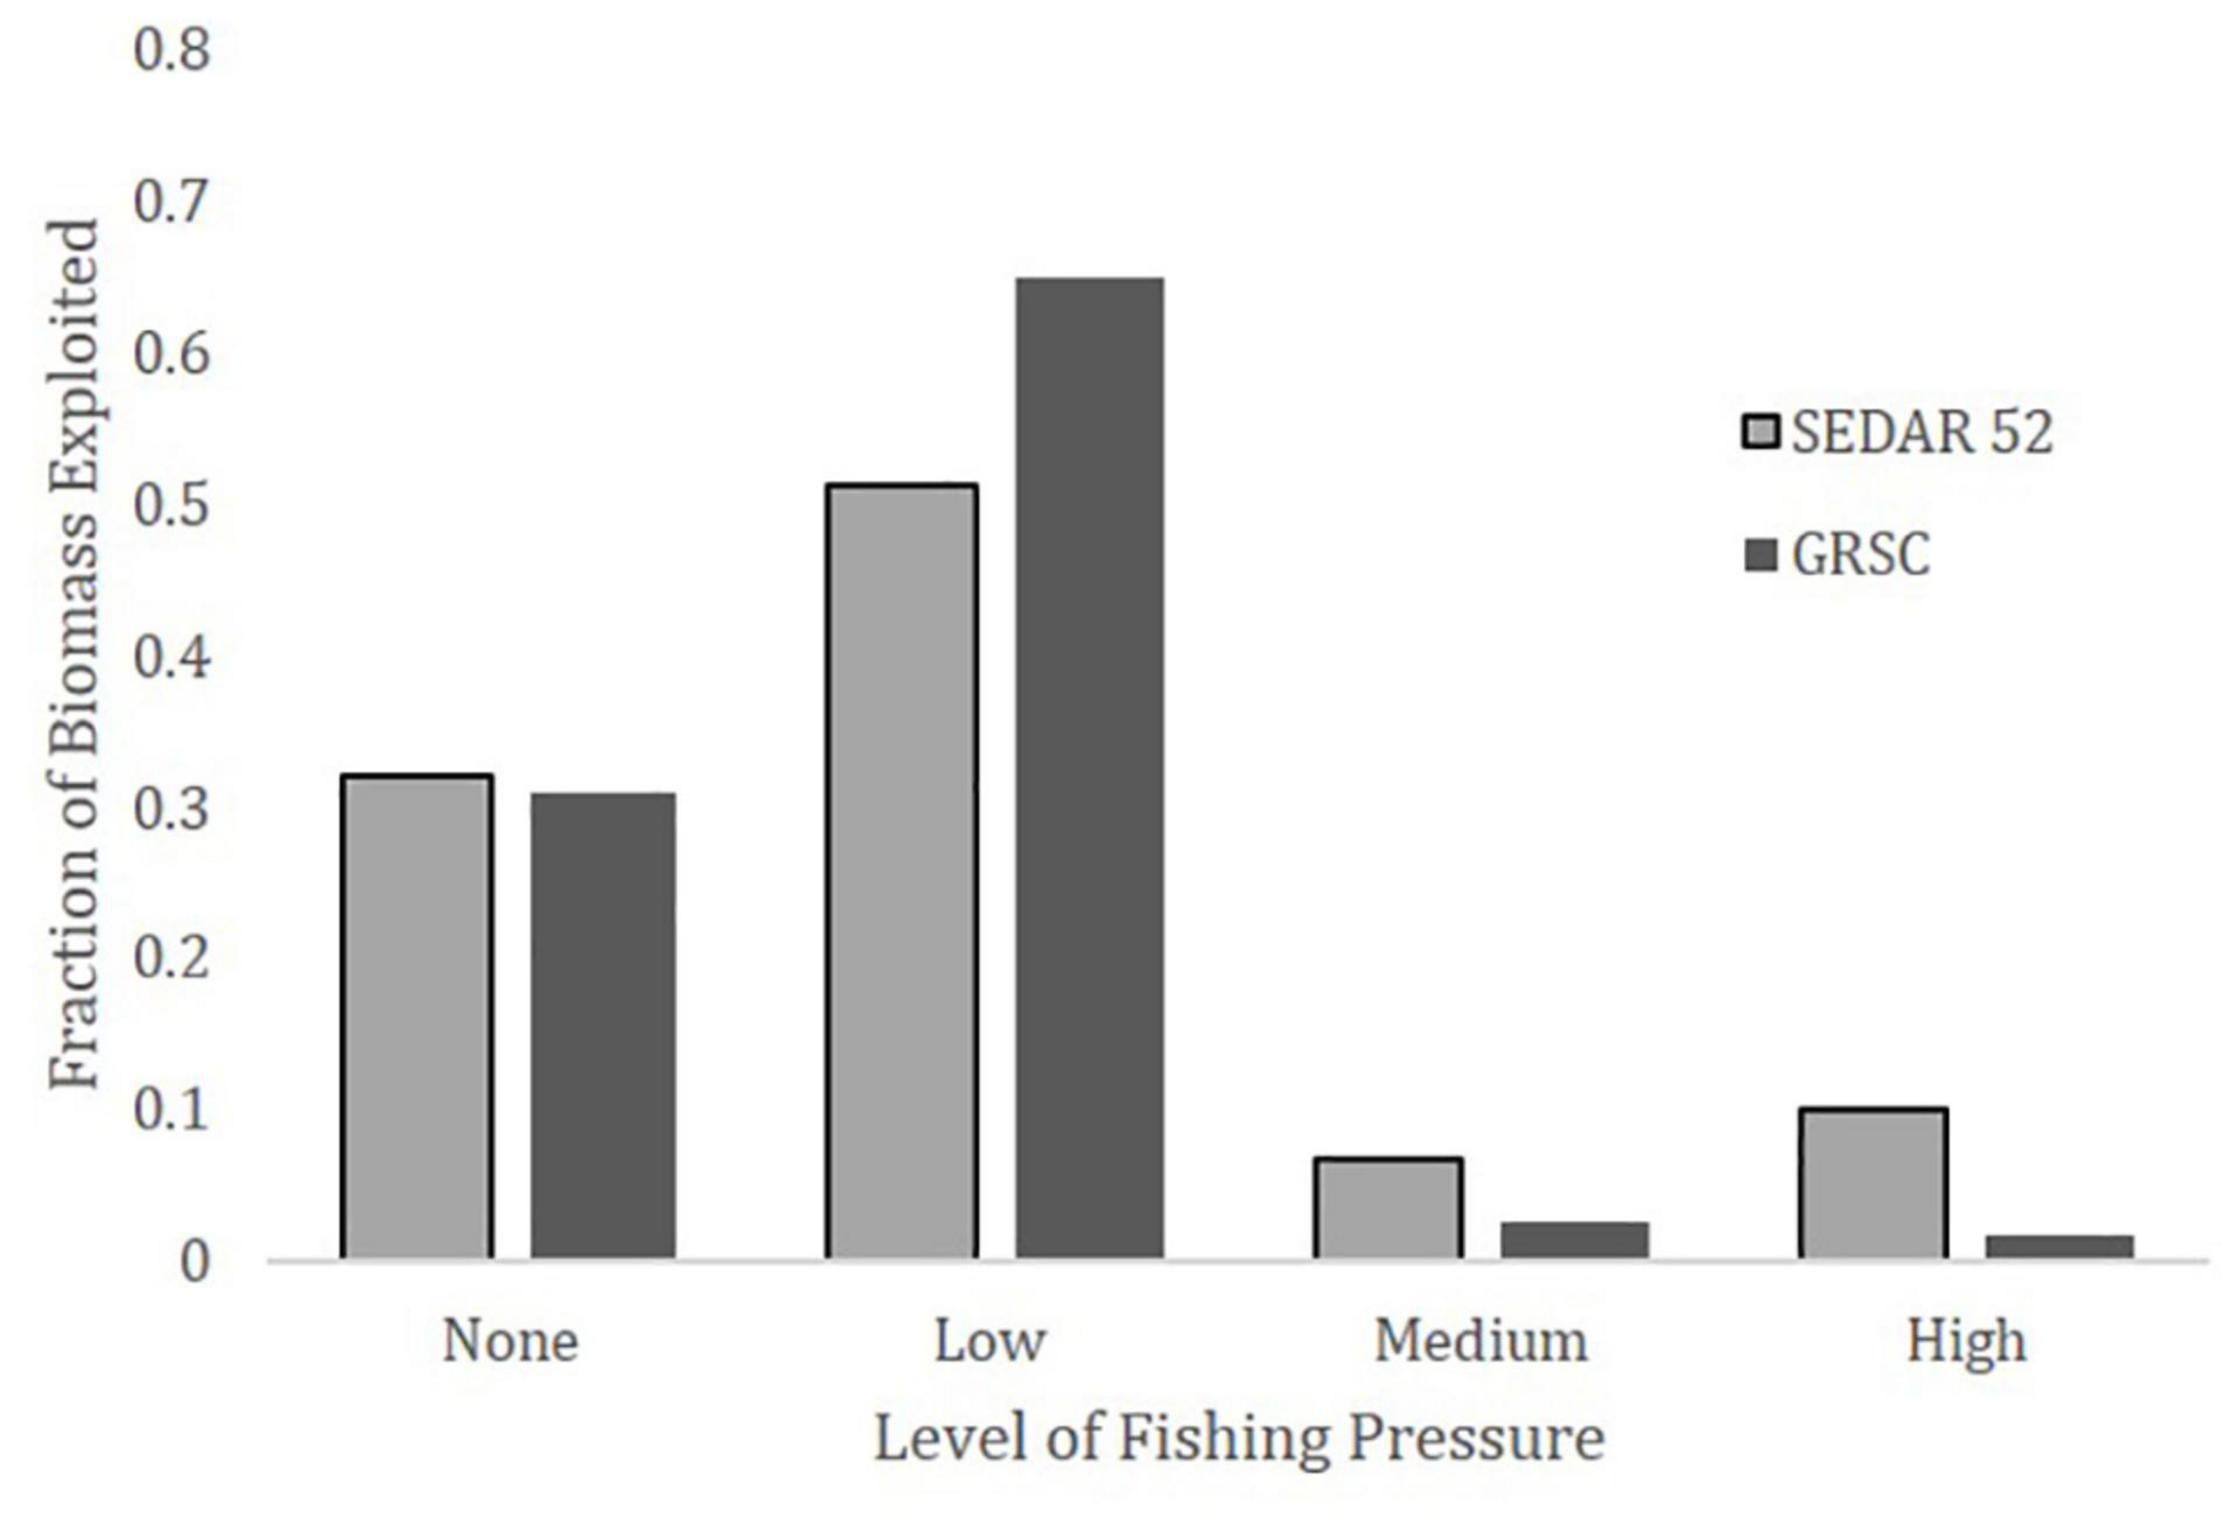
Figure 10. Histograms of the proportion of total red snapper biomass exploited at various fractions of the target exploitation rate proxy (i.e., FMSY as approximated by a spawner potential ratio, SPR, of 26%) by the Gulf of Mexico Commercial fishery in 2019 using SEDAR 52 and The Great Red Snapper Count age-2+ biomass estimates. The groupings are: none–no catch; low–exploitation index equal to or less than 0.5⋅FMSY proxy; medium–exploitation index greater than 0.5⋅FMSY proxy but less than or equal to FMSY proxy; high–exploitation index greater than the FMSY proxy. The biomass-based exploitation rate proxy for FMSY associated with only commercial landings of age-2+ fish is 0.084 for the SEDAR dataset (Southeast Data Assessment and Review [SEDAR], 2018) and 0.122 for the GRSC dataset (National Marine Fisheries Service [NMFS], 2021).
Discussion
Our fine-scale analysis of habitat information combined with fishing location data resulted in a high-resolution map of exploitation rates and reveals a number of interesting spatial patterns in the red snapper commercial fishery. Prior to the wide scale deployment of artificial structures, historical red snapper landings were necessarily taken from offshore large-scale banks and natural reefs (Porch et al., 2007; Fitzhugh et al., 2020) with pockets of high catches in mud or sand (i.e., unstructured) bottom (Moe, 1963). However, in recent decades it appears that there has been a strong shift towards artificial structure (Shipp and Bortone, 2009). Our results suggest that nearly half (46%, based on extrapolation from unknown habitat) of commercially landed red snapper in the United States Gulf of Mexico are being exploited from artificial structures. Changes in habitat targeting are not surprising, given that artificial structures tend to provide similar, if not higher, catch-per-unit effort (CPUE) as natural reefs (Powers et al., 2018). Additionally, many fishermen are known to deploy “personal” artificial structures (Jaxion-Harm and Szedlmayer, 2015), the location of which is known only to the deployer, providing private fishing locations with reduced crowding and competition by other fishermen. Thus, targeting artificial structure may provide greater catches compared to more well-known and, historically, highly exploited large natural reefs. Given the preponderance of private artificial structures and the lack of associated public documentation, there is also an expectation that the proportion of commercial exploitation from artificial structures is likely to be underestimated in our study.
The importance of the shift in commercial removals towards artificial structure becomes increasingly salient given that our habitat mapping indicates a sharp contrast in the areal extent of reef types based on the portion of the Gulf of Mexico that has been mapped to date. We estimate that, by area, approximately 98% of the known reef structure in the Gulf of Mexico consists of natural reefs with artificial structures consisting of only 2%. Additionally, the recreational fishery accounts for ∼50% of the total Gulf of Mexico red snapper catch (Southeast Data Assessment and Review [SEDAR], 2018), and it is believed that a high proportion of recreational fishing occurs on artificial structures (Shipp and Bortone, 2009; Cowan et al., 2011). Therefore, when taken in concert with the removals from artificial structure in the commercial fishery and the comparatively low areal coverage of artificial structure in the Gulf of Mexico, we expect that recreational removals may further exacerbate exploitation on nearshore artificial structures. For instance, areas that support high recreational fishing effort as well as relatively high commercial fishing effort, such as the AARZ and FL Panhandle (Figure 9), may be particularly vulnerable to overexploitation and localized depletion (Figures 5, 6).
But, there may also be indications of spatiotemporal segregation by sector. Commercial fishermen appear to favor deeper fishing grounds (Figure 2), which are often less accessible to most recreational fishermen. Similarly, commercial trips generally avoid nearshore artificial structures (Figures 8, 9), perhaps due to overcrowding and lower CPUE at heavily exploited inshore artificial structure sites. Analysis of data from trips with scientific observers in the commercial fishery support the contention that offshore areas near the shelf break, including the Florida panhandle extending to eastern Louisiana along with areas off central Texas and western Louisiana, provide consistently high red snapper CPUE (Scott-Denton et al., 2011). Conversely, inshore areas associated with well-known artificial structures appear to be less productive for commercial trips (Scott-Denton et al., 2011). Given that high relief rocky reefs are present along the continental shelf break throughout the Gulf (Putt et al., 1986; Figure 1), it is not surprising that commercial trips would target these potentially productive offshore natural reefs and similarly productive offshore oil and gas platforms. Additionally, the higher proportion of natural reefs along the West Florida Shelf explains the increased rate of removals from natural reefs in Florida compared to other states. In particular, it has been estimated that there is over fifteen times the amount of hard bottom reef between Key West and Pensacola, FL compared to the rest of the Gulf of Mexico combined (Parker et al., 1983). Florida is also the only Gulf State without oil and gas drilling platforms, on which much of the commercial fishing effort is concentrated in the Western Gulf of Mexico.
Despite previous studies providing thorough analysis of spatiotemporal patterns in the dynamics of the Gulf of Mexico reef fish fishery using logbook, observer, and VMS data (e.g., Scott-Denton et al., 2011; Cockrell, 2018; Ducharme-Barth, 2018), our results provide the first analysis focused solely on red snapper trips and which is able to assign removals to specific habitat types. Although this analysis is largely descriptive, these types of VMS and habitat mapping exercises are useful for identifying potential relationships between fishing locations and ecosystem or environmental covariates (e.g., Cimino et al., 2019). It is expected that by elucidating these types of potential mechanistic relationships, population or fishery drivers will eventually be discovered, and insight will be provided for developing more refined dynamic spatial management (e.g., by identifying extraction hotspots or population components at risk of localized depletion; Maxwell et al., 2015; Birchenough et al., 2021). Additionally, the results provide tangible steps towards achieving a better mechanistic understanding of the production vs. attraction debate regarding the role of artificial structures, while also developing a useful management tool, which could be updated on a yearly basis, for identifying areas of high extraction that may warrant careful monitoring.
Furthermore, our analysis highlighted a potential novel use of VMS data from reef fisheries: identification of unmapped and unclassified reef sites based on patterns or density of VMS fishing locations with no known associated habitat. Using VMS data to identify potential habitat structure can be an extremely cost-effective method to develop targeted bottom mapping, and represents a unique approach for groundtruthing assumptions associated with fishery-dependent VMS data analyses using fishery-independent data (e.g., camera drops or sonar mapping). To aid understanding of bottom structure in the Gulf of Mexico and to improve future analyses of VMS data by reducing the need for extrapolation to habitat types, we have future plans to map specific target locations in the Gulf of Mexico based on our analysis of VMS data. We expect that as increasing percentages of the ocean floor continue to be mapped, the results of our analyses will be refined, classification percentages will increase, and accuracy will be improved.
Impacts of Exploitation and Potential for Localized Depletion
The primary question that arises from our analysis is whether the historical shift (i.e., increase) in the proportion of removals from artificial structures is likely to be detrimental to the red snapper resource. The discrepancy in the areal extent of reef type (i.e., 98% natural to 2% artificial), as well as the increasing affinity for unstructured bottom as fish grow, indicates that only a small fraction of red snapper biomass (i.e., ∼14% according to Karnauskas et al., 2017) occurs on artificial structures in the Gulf of Mexico (Streich et al., 2017c; Dance and Rooker, 2019). Thus, given that much of the red snapper resource does not appear to reside on artificial structure, the increasing exploitation on artificial structures is unlikely to be a major concern to the sustainability of the Gulf of Mexico population.
However, our relative exploitation index provides insight into the potential for hotspots of localized depletion. For instance, there are a handful of areas identified in our study where high removals occur, especially in comparison to estimated biomass. Mainly, the shelf break areas off the Florida panhandle, Alabama, and Mississippi, primarily associated with natural reefs, along with a handful of more inshore areas along the Florida and Alabama coasts, consisting of a mixture of artificial and natural reefs, appear particularly vulnerable (Figure 9). Similarly, localized depletion is plausible in areas off the eastern Louisiana and central Texas coast associated with artificial structure and oil platforms (Figures 5, 6, 8). Conversely, despite high landings in many offshore areas of Texas, exploitation appears relatively low given the assumed high biomass concentrations.
The increased number of locations with high exploitation in the eastern Gulf of Mexico from our study, taken in concert with the disparity in productivity among regions (i.e., ∼60% of new recruits are estimated to settle in the western region; Southeast Data Assessment and Review [SEDAR], 2018), indicate that the eastern stock region may merit careful monitoring. Our results support the latest stock assessment (Southeast Data Assessment and Review [SEDAR], 2018), which warned that, despite strong rebuilding of the red snapper resource, comparatively higher exploitation and lower productivity in the eastern stock could potentially lead to localized depletion. Additionally, biophysical modeling suggests that parts of the eastern stock are highly reliant on self-recruitment; the West Florida Shelf receives approximately 93% of its larvae locally, which would limit the population’s ability to rebuild following depletion (Karnauskas and Paris, 2021). The high levels of recreational fishing in the eastern Gulf of Mexico, which is not accounted for in our study, provides further impetus to consider implementation of more precautionary management in the eastern region. But, generally, it appears that exploitation rates across the Gulf of Mexico remain at or below FMSY and the fraction of biomass being heavily exploited by the commercial fleet is around 10% based on recent stock assessment estimates of age-2+ biomass (Figure 10). Moreover, the GRSC has indicated that biomass estimates may be on the order of three magnitudes greater than those estimated in the 2018 stock assessment, because the latter incorporates only limited data from unstructured bottom where a majority of red snapper appear to reside (Stunz et al., 2021). Additionally, the GRSC indicated an approximately equal distribution of biomass across regions (Stunz et al., 2021), compared to an estimated 70% of biomass in the western region from the 2018 stock assessment (Southeast Data Assessment and Review [SEDAR], 2018).
Despite discrepancies in biomass estimates and distributions between the SEDAR 52 assessment and the GRSC, similar patterns in hot spots of exploitation resulted (Figures 5, 6). However, the GRSC led to lower estimates with only 1.5% of the total Gulf of Mexico age-2+ biomass encountering exploitation rates by the commercial fishery greater than FMSY (Figure 10). Regardless of the true biomass level, we believe that the spatial patterns in exploitation are important to consider as the red snapper resource rebuilds and quotas increase, because landings are unlikely to broadly redistribute outside of existing concentrated hot spots. In particular, the more easily accessible nearshore areas of the eastern Gulf of Mexico along with large-scale natural reefs, which may provide increased habitat quality (i.e., improved productivity potential, predation protection, or prey quality; Glenn et al., 2017; Schwartzkopf et al., 2017) compared to artificial counterparts, should be closely monitored for signs of depletion.
Considerations Associated With Attraction vs. Production on Artificial Structure
New management approaches for red snapper, whether those described here or more generally, need to be considered within the context of the ongoing production vs. attraction debate regarding the source of fish on artificial structures. Although the analysis of VMS data does not directly provide evidence for either argument, the increase in and currently high level of landings from artificial structure confirms previous analyses demonstrating that artificial structures support high densities of red snapper and sustain high catch rates (e.g., Streich et al., 2017c; Powers et al., 2018). Given the high proportion of biomass observed on unstructured bottom in the GRSC study and the ever increasing number of artificial structures in the Gulf of Mexico, it seems unlikely that attraction is the sole source of fish populating new artificial structures. However, connectivity and dispersal among different reef types is an important aspect of the metapopulation dynamics of red snapper that are not well understood. Dispersal among reefs represent an important missing link in defining the production argument for artificial structure, especially if strong source-sink dynamics exist between highly productive natural reefs and new, less complex artificial structures. The impacts of heavy depletion of nearshore areas would likely be net neutral if new artificial structures are essentially self-sustaining (i.e., provide sufficient new, successfully settled recruits into the Gulf of Mexico population to replace any fish originally attracted to the reef). But, if strong attraction is occurring without associated reproductive benefits, then it would be expected that reef building programs might increase net exploitation by “pulling” (i.e., attracting) fish from the large swathes of lightly exploited unstructured bottom. Of course, the potential for increased survival and growth for younger fish living on structured vs. unstructured bottom must also be weighed against the increased exploitation on artificial structures. Ultimately, spatially explicit modeling frameworks, which can account for variation in growth, reproduction, and survival by habitat and location, are warranted to more fully address attraction vs. production debates (e.g., Smith et al., 2015; Roa-Ureta et al., 2019). The results of this study represent a first step towards developing a fully spatial dataset that includes habitat type for red snapper fishery-dependent and independent data. Once the collation of data is accomplished, future work will aim to develop and apply a research based spatially stratified stock assessment model for red snapper that can directly estimate both productivity and mortality on artificial, natural, and unstructured habitat across the Gulf of Mexico. However, a key limitation in this process is a data driven analysis of spatial location and habitat type of recreational removals, which will require increasing utilization of unique data collection methodology, such as electronic self-reporting applications (e.g., Midway et al., 2020).
Until more spatially explicit models can be developed, our exploitation maps provide a useful guide to managers to help understand where extraction is likely highest and may potentially lead to localized depletion. We also believe that these exploitation maps could be used to develop adaptive spatiotemporal dynamic ocean management approaches. For instance, they could be utilized to implement spatiotemporal closures that weigh habitat quality vs. exploitation rates on natural compared to artificial reefs. We are working with the Gulf of Mexico Fisheries Management Council and Science and Statistical Committee (SSC) to ensure that the exploitation maps and habitat exploitation analysis developed here can become a consistently updated data source available to assessment scientists and managers to understand where harvest is occurring. However, limited availability of synoptic red snapper fishery-independent abundance surveys may impede getting consistent updates on biomass distributions.
Modeling Caveats
There were a handful of limitations to our analysis that likely led to unquantifiable levels of uncertainty in spatial estimates of red snapper exploitation, including: habitat mapping coverage in the Gulf of Mexico, TIP coverage rates, the assumption that time spent fishing directly equated to red snapper landings, the use of a spatial buffer around structures to assign fishing locations to habitat type, habitat extrapolation assumptions within the extrapolated datasets, and the limited time series of VMS data along with the lack of time-varying estimates of biomass distributions.
Based on the data we have collated, only about 10% of the United States Gulf of Mexico out to 200 m has been mapped with high resolution sonar data. Additionally, identifying and mapping small-scale “private” (i.e., deployed by individual fishermen) artificial structures is extremely difficult. Thus, assignment rates to habitat are clearly underestimated (motivating the development of the extrapolated data sets). Fortunately, mapping emphasis is placed on the continental shelf break, which coincides with areas of high commercial fishing effort (i.e., the high relief shelf break habitat). Additionally, the large-scale artificial structures in the Western Gulf (i.e., oil platforms, pipelines, and reefed rigs) are well documented. Therefore, the distribution of mapping and known artificial structures leads to higher intercepts of fishing activity on known habitat than if all mapping was completely random. Similarly, the distribution of TIP sampling is not even across states or proportional to landings. Thus, differential sampling effort by state could alter interpretations of the proportion of landings from each habitat, given that there appear to be state-specific differences in fishing practices. However, we do not expect that the distribution of habitat mapping or TIP sampling led to any systematic bias in our results, though we acknowledge that both factors led to unquantified uncertainty in the analysis.
An important, yet unvalidated, assumption used in this study was that time spent fishing on a reef (i.e., VMS fishing location linked to reef habitat) equates to landings of red snapper. Obviously, not all fishing events result in positive catch, but commercial fishermen attempt to optimize their time, such that limited effort is spent fishing on unproductive habitat. Given the complexities of modeling fishing behavior and decision-making, we simply assumed that all effort is equally productive and proportionally split the total landings from a trip by the number of fishing locations on each habitat type encountered. In the future, it may be worth using observer data or stakeholder interviews to elucidate assignation of red snapper catch to structure within trips and, similarly, to better understand species specific targeting behaviors.
Similarly, the use and determination of the optimal spatial buffer around a given habitat type to assign a fishing location to habitat led to uncertainty in assignation rates. Red snapper typically exist in high densities to at least a distance of 100 m from large-scale artificial structures (Reynolds, 2015), while fishermen report similar, though slightly larger, distances around which they typically fish a structure when targeting red snapper with hook and line gear (J. Brusher, NMFS, personal communication). We explored a range of circular buffer sizes, which were essentially equivalent to assigning fishing locations to habitat based on closest linear distance measures, but also accounted for the biological (and associated fishing behavior) expectation that fish and fishing effort decreased rapidly with distance from structure. In other words, a maximum linear distance cutoff was needed to avoid overclassification of fishing locations too far from structure to be realistically fishing on that structure. The 250 m buffer was utilized, because it provided a balance between maximizing habitat assignment, minimizing multiple habitat classifications for a single fishing location, and was a reasonable distance from structure around which both fish and fishermen are known to aggregate. This buffer also helped account for spatial inaccuracies resulting from combining datasets of various resolutions and precisions.
As noted, habitat mapping and TIP sampling are both limited in coverage. Therefore, in an effort to better understand the likely distribution of all Gulf of Mexico red snapper landings across habitat types, we developed the extrapolated data sets. We believe the extrapolation from unknown to known habitat is a reasonable approximation given that it is widely accepted that a majority of red snapper landings have historically been associated with high relief structure (Moe, 1963; Shipp and Bortone, 2009). In the future, it would be helpful to refine the study to better delineate fishing on unstructured bottom from that on unknown (i.e., unmapped) reef types. Improved bottom mapping would help reduce the proportion of fishing locations on unknown habitat, while better identifying exploitation on known unstructured bottom.
Given that the biomass distributions were assumed to be static based on Karnauskas et al. (2017; Figure 3), it is likely that cell specific exploitation patterns could be biased due to fish movement, changes in productivity, and redistribution due to rebuilding of the resource. However, general patterns in the distribution of biomass from Karnauskas et al. (2017) have been subsequently supported by Dance and Rooker (2019) and the GRSC (Stunz et al., 2021). Thus, due to the relative stability in the spatial patterns of landings (Supplementary Figures 2–4) and limited large-scale movements of red snapper (Patterson, 2007), it is unlikely that the patterns in exploitation intensity are likely to alter in the near term. Additionally, a longer time series of filtered VMS data is required to determine whether the observed patterns in removals by habitat type vary across years, but the four years analyzed demonstrated little interannual variability (Supplementary Figures 5–10). Ultimately, a longer time series of data along with a deeper analysis of both biological and socioeconomic factors is required to determine the mechanistic drivers influencing fishing locations. For instance, individual fisherman decision-making is driven by a complex suite of factors (e.g., resource distribution, quota availability, ontogenetic migration patterns, weather, environment, fuel price, fishing vessel capacity, distance to port, depth, distribution of other target species, social factors within the fleet, and spatiotemporal management measures), which could impact the distribution of effort in a given year (Naranjo-Madrigal et al., 2015; Thorson et al., 2017; Collins et al., 2021). Although beyond the scope of this study and the expertise of the analysts, the results of the current study could help inform more detailed biosocioeconomic studies of fishery patterns and behavior in the Gulf of Mexico reef fish fleet.
Conclusion
Our analysis of VMS data from Gulf of Mexico commercial reef fisheries targeting red snapper have highlighted that a large proportion of removals are extracted from artificial structures. However, both fine- and broad-scale spatial patterns emerged. For instance, a high proportion of commercial landings appear to be extracted from offshore habitat. In the central and western Gulf of Mexico, landings are predominately taken on large-scale offshore oil and gas platforms, whereas in Florida, where there is more extensive natural reef coverage, landings are primarily from natural reefs. Artificial structures appear to be attracting high levels of fishing pressure, especially when accounting for recreational fishing effort that tends to aggregate on nearshore artificial structures, despite extremely low total bottom coverage across the Gulf of Mexico (i.e., less than 2% of known reefs are artificial). Although this raises concerns about the potential for localized depletion in areas of high artificial reef concentrations and high fishery removals, less than 15% of the total red snapper biomass is estimated to reside on artificial structure. Thus, it appears that the increasing removals from artificial structures is unlikely to be detrimental to the population. When considered in tandem with the results of the GRSC, which suggests that biomass levels are orders of magnitude larger than previously estimated and predominately resides on uncharacterized bottom where little exploitation occurs, the impacts of increasing removals from artificial structures appears even less detrimental. However, as the red snapper resource continues to rebuild and quotas increase, current fishing hotspots should be carefully monitored for signs of extensive localized depletion.
We envision that analyses such as this that provide fine-scale information on where fisheries are operating and obtaining catch are essential information for informed and comprehensive marine spatial planning for a number of emerging uses such as aquaculture (Lester et al., 2018) and offshore wind development (Haggett et al., 2020; Methratta et al., 2020). The analyses in this paper have informed recent decision making on the fraction of red snapper biomass currently fished by the commercial fishery, a key consideration for setting the current overfishing limit (Gulf of Mexico Fishery Management Council [GMFMC], 2021). Furthermore, analyses such as this provide essential context for identifying and mitigating conflicts between multiple ocean uses, a critical component of achieving sustainable development of a diverse Blue Economy.
Data Availability Statement
The original contributions presented in the study are included in the article/Supplementary Material, further inquiries can be directed to the corresponding author/s.
Author Contributions
DG, JW, MK, and MS contributed to conception and design of the study. LP organized the VMS dataset and provided vessel behavior analysis. CG organized the natural and artificial reef datasets and performed the analysis. MK provided the biomass distribution maps and estimates of biomass of age 2+ red snapper as well as FMSY estimates. CG and DG wrote the first draft of the manuscript. DG and MK wrote additional sections of the manuscript. DG, MK, JW, and LP provided insight and direction for analysis as the manuscript progressed. All authors contributed to manuscript revision, read, and approved the submitted version.
Funding
Funding was provided by NOAA Fisheries under MARFIN grant 19MFIH005.
Author Disclaimer
The scientific results and conclusions, as well as any views or opinions expressed herein, are those of the authors and do not necessarily reflect those of NOAA or the U.S. Department of Commerce.
Conflict of Interest
The authors declare that the research was conducted in the absence of any commercial or financial relationships that could be construed as a potential conflict of interest.
Publisher’s Note
All claims expressed in this article are solely those of the authors and do not necessarily represent those of their affiliated organizations, or those of the publisher, the editors and the reviewers. Any product that may be evaluated in this article, or claim that may be made by its manufacturer, is not guaranteed or endorsed by the publisher.
Acknowledgments
We acknowledge the numerous data providers, commercial fishermen, and TIP agents that made this work possible. Many individuals contributed to the digitized habitat maps, specifically Sean Keenan, Ted Switzer, Eric Weather, and the FL FWRI Fisheries Independent Monitoring program; Brandi Noble and Matt Campbell of the NOAA Fisheries Pascagoula Lab; and Katherine Overly and Isabella Masarik of the NOAA Fisheries Panama City Lab. Shirley Kasser of the Panama City lab was instrumental in creating the matched databases in Oracle. Shay O’Farrell provided predicted fishing locations using machine learning algorithms for the VMS data. John Brusher provided valuable insight into the red snapper fishery. We would like to thank Brendan Turley, two reviewers, and the associate editor for their insightful comments on earlier versions of the manuscript.
Supplementary Material
The Supplementary Material for this article can be found online at: https://www.frontiersin.org/articles/10.3389/fmars.2022.772292/full#supplementary-material
References
Alabama Marine Resources Division [AL MRD] (2019). Alabama’s Artificial Reefs. Available online at: https://www.outdooralabama.com/sites/default/files/fishing/Saltwater/Artificial-Reefs/Reef_Brochure.pdf (accessed December 20, 2019).
Arney, R. N., Froehlich, C. Y. M., and Kline, R. J. (2017). Recruitment patterns of juvenile fish at an artificial reef area in the Gulf of Mexico. Mar. Coast. Fish. 9, 79–92. doi: 10.1080/19425120.2016.1265031
Birchenough, S. E., Cooper, P. A., and Jensen, A. C. (2021). Vessel monitoring systems as a tool for mapping fishing effort for a small inshore fishery operating within a marine protected area. Mar. Policy. 124:104325. doi: 10.1016/j.marpol.2020.104325
Bohnsack, J. A. (1989). Are high densities of fishes at artificial structures the result of habitat limitation or behavioral preference? Bull. Mar. Sci. 44, 631–645.
Bortone, S. A. (1998). Resolving the attraction-production dilemma in artificial reef research: some yeas and nays. Fisheries 23, 6–10.
Bueno-Pardo, J., Ramalho, S. P., García-Alegre, A., Morgado, M., Vieira, R. P., Cunha, M. R., et al. (2017). Deep-sea crustacean trawling fisheries in Portugal: quantification of effort and assessment of landings per unit effort using a Vessel Monitoring System (VMS). Sci. Rep. 7:40795. doi: 10.1038/srep40795
Bureau of Ocean Energy Management [BOEM] (2020). GOMR Geographic Information System (GIS) Data and Maps. Available online at: https://www.boem.gov/oil-gas-energy/mapping-and-data/gomr-geographic-information-system-gis-data-and-maps (accessed February 5, 2020).
Cimino, M. A., Anderson, M., Schramek, T., Merrifield, S., and Terrill, E. J. (2019). Towards a fishing pressure prediction system for a Western Pacific EEZ. Sci. Rep. 9:461. doi: 10.1038/s41598-018-36915-x
Cockrell, M. L. (2018). Spatial Dynamics and Productivity of a Gulf of Mexico Commercial reef Fish Fishery Following Large Scale Disturbance and Management Change Ph.D. thesis. St. Petersburg, FL: University of South Florida.
Collins, C., Nuno, A., Benaragama, A., Broderick, A., Wijesundara, I., Wijetunge, D., et al. (2021). Ocean-scale footprint of a highly mobile fishing fleet: social-ecological drivers of fleet behavior and evidence of illegal fishing. People Nat. 3, 740–755. doi: 10.1002/pan3.10213
Cowan, J. H. Jr., Grimes, C. B., Patterson, W. F. III, Walters, C. J., Jones, A. C., Lindberg, W. J., et al. (2011). Red snapper management in the Gulf of Mexico: science or faith-based? Rev. Fish Biol. Fish 21, 187–204.
Dance, M. A., and Rooker, J. R. (2019). Cross-shelf habitat shifts by red snapper (Lutjanus campechanus) in the Gulf of Mexico. PLoS One 14:e0213506. doi: 10.1371/journal.pone.0213506
Deng, R., Dichmont, C., Milton, D., Haywood, M., Vance, D., Hall, N., et al. (2005). Can vessel monitoring system data also be used to study trawling intensity and population depletion? The example of Australia’s northern prawn fishery. Can. J. Fish. Aquat. Sci. 62, 611–622. doi: 10.1139/F04-219
Ducharme-Barth, N. D. (2018). Using Vessel Monitoring System Data to Understand the Spatial and Temporal Dynamics of the Commercial Vertical line Fishery for Reef Fish in the Gulf of Mexico. Ph.D. thesis. Gainesville, FL: University of Florida.
Ducharme-Barth, N. D., Shertzer, K. W., and Ahrens, R. N. M. (2018). Indices of abundance in the Gulf of Mexico reef fish complex: a comparative approach using spatial data from vessel monitoring systems. Fish. Res. 198, 1–13. doi: 10.1016/j.fishres.2017.10.020
Environmental Systems Research Institute [ESRI] (2017). ArcGIS Desktop: Release 10.6. Redlands, CA: Environmental Systems Research Institute.
Fitzhugh, G. R., Kline, W. C., Porch, C. E., and Gardner, C. L. (2020). “. Chapter 11 - Improving the historical baseline of the Gulf of Mexico red snapper fishery,” in Red Snapper Biology in a Changing World, eds S. Szedlmayer and S. Bortone (Boca Raton, FL: CRC Press), 201–231.
Florida Fish and Wildlife Conservation Commission [FWC] (2019). Artificial Reefs. Available online at: https://myfwc.com/fishing/saltwater/artificial-reefs/ (accessed December 20, 2019).
Gallaway, B. J., Raborn, S. W., Picariello, L., and Putman, N. F. (2020). Changes in shrimping effort in the Gulf of Mexico and the impacts to red snapper. iScience 23:101111. doi: 10.1016/j.isci.2020.101111
Gallaway, B. J., Szedlmayer, S. T., and Gazey, W. J. (2009). A life history review for red snapper in the Gulf of Mexico with an evaluation of the importance of offshore petroleum platforms and other artificial structures. Rev. Fish. Sci. 17, 48–67. doi: 10.1080/10641260802160717
Garner, S. B., Boswell, K. M., Lewis, J. P., and Tarnecki, J. H. (2019). Effect of reef morphology and depth on fish community and trophic structure in the northcentral Gulf of Mexico. Estuar. Coast. Shelf Sci. 230:106423. doi: 10.1016/j.ecss.2019.106423
Gerritsen, H., and Lordan, C. (2011). Integrating vessel monitoring systems (VMS) data with daily catch data from logbooks to explore the spatial distribution of catch and effort at high resolution. ICES J. Mar. Sci. 68, 245–252. doi: 10.1093/icesjms/fsq137
Glenn, H. D., Cowan, J. H., and Powers, J. E. (2017). A comparison of red snapper reproductive potential in the Northwestern Gulf of Mexico: natural versus artificial habitats. Mar. Coast. Fish. 9, 139–148.
Gulf of Mexico Fishery Management Council [GMFMC] (2019). State Management Program for Recreational Red Snapper: Final Amendment 50A to the Fishery Management Plan for the Reef Fish Resources of the Gulf of Mexico. Available online at: https://media.fisheries.noaa.gov/dam-migration/state_management_program_for_red_snapper_deis_121418.pdf (accessed July 5, 2021).
Gulf of Mexico Fishery Management Council [GMFMC] (2021). Framework Action to the Fishery Management Plan for Reef Fish Resources of the Gulf of Mexico: Modification of Annual Catch Limits for Gulf of Mexico Red Snapper. Available online at: https://gulfcouncil.org/wp-content/uploads/Tab-B-Reef-Fish-Committee-Report-Apr-04152021_FinalREV.pdf (accessed December 11, 2021).
Haggett, C., ten Brink, T., Russell, A., Roach, M., Firestone, J., Dalton, T., et al. (2020). Offshore wind projects and fisheries: conflict and engagement in the United Kingdom and the United States. Oceanography 33, 38–47. doi: 10.5670/oceanog.2020.404
Jaxion-Harm, J., and Szedlmayer, S. T. (2015). Depth and artificial reef type effects on size and distribution of red snapper in the northern Gulf of Mexico. N. Am. J. Fish. Manag. 35, 86–96. doi: 10.1080/02755947.2014.982332
Karnauskas, M., and Paris, C. B. (2021). A Lagrangian Biophysical Modeling Framework Informs Stock Structure and Spawning-Recruitment of Red Snapper (Lutjanus campechanus) in the Northern Gulf of Mexico. SEDAR74-SID-02. North Charleston, SC: SEDAR, 9.
Karnauskas, M., Walter, J. F. III, Campbell, M. D., Pollack, A. G., Drymon, J. M., and Powers, S. (2017). Red snapper distribution on natural habitats and artificial structures in the Northern Gulf of Mexico. Mar. Coast. Fish. 9, 50–67. doi: 10.1080/19425120.2016.1255684
Keenan, S. F., Switzer, T. S., Knapp, A., Weather, E. J., and Davis, J. (2022). Spatial dynamics of the quantity and diversity of natural and artificial hard bottom habitats in the eastern Gulf of Mexico. Cont. Shelf Res. 233:104633. doi: 10.1016/j.csr.2021.104633
Lester, S. E., Stevens, J. M., Gentry, R. R., Kappel, C. V., Bell, T. W., Costello, C. J., et al. (2018). Marine spatial planning makes room for offshore aquaculture in crowded coastal waters. Nat. Commun. 9:945. doi: 10.1038/s41467-018-03249-1
Louisiana Department of Wildlife and Fisheries [LDWF] (2019). Artificial Reefs. Available online at: https://www.wlf.louisiana.gov/page/artificial-reefs (accessed December 20, 2019).
Maxwell, S. M., Hazen, E. L., Lewison, R. L., Dunn, D. C., Bailey, H., Bograd, S. J., et al. (2015). Dynamic ocean management: defining and conceptualizing real-time management of the ocean. Mar. Policy 58, 42–50. doi: 10.1016/j.marpol.2015.03.014
Methratta, E. T., Hawkins, A., Hooker, B. R., Lipsky, A., and Hare, J. A. (2020). Offshore wind development in the Northeast US shelf large marine ecosystem: ecological, human, and fishery management dimensions. Oceanography 33, 16–27. doi: 10.5670/oceanog.2020.402
Midway, S. R., Adriance, J., Banks, P., Haukebo, S., and Caffey, R. (2020). Electronic self-reporting: angler attitudes and behaviors in the recreational red snapper fishery. N. Am. J. Fish. Manag. 40, 1119–1132. doi: 10.1002/nafm.10472
Mississippi Department of Marine Resources [MS DMR] (2020). Artificial Reef Bureau. Available online at: https://dmr.ms.gov/artificial-reef/ (accessed January 24, 2020).
Moe, M. A. Jr. (1963). A survey of Offshore Fishing in Florida. Professional Papers Series Number 4, Florida State Board of Conservation. St. Petersburg, FL: Marine Laboratory.
Muench, A., DePiper, G. S., and Demarest, C. (2018). On the precisions of predicting fishing location using data from the vessel monitoring system (VMS). Can. J. Fish. Aquat. Sci. 75, 1036–1047. doi: 10.1139/cjfas-2016-0446
Naranjo-Madrigal, H., van Putten, I., and Norman-Lopez, A. (2015). Understanding socio-ecological drivers of spatial allocation choice in a multi-species artisanal fishery: a Bayesian network modeling approach. Mar. Policy. 62, 102–115. doi: 10.1016/j.marpol.2015.09.003
National Centers for Environmental Information [NCEI] (2020). NOAA Bathymetric Data Viewer, 2020. Available online at: https://www.ncei.noaa.gov/maps/bathymetry/ (accessed February 2, 2020).
National Marine Fisheries Service [NMFS] (2017). Fisheries Economics of the United States, 2015. U.S. Dept. of Commerce, NOAA Tech. Memo. NMFS-F/SPO-170. Washington, DC: NOAA, 247.
National Marine Fisheries Service [NMFS] (2021). Interim Catch Advice for the Gulf of Mexico Red Snapper Stock Derived from Estimates of Absolute Abundance Produced as Part of the Great Red Snapper Count. NMFS Southeast Fisheries Science Center, Sustainable Fisheries Division. Available online at: https://gulfcouncil.org/wp-content/uploads/04.-GRSC-Interim-assessment-report-RS-1.pdf (accessed July 5, 2021).
National Oceanographic and Atmospheric Administration [NOAA] (2022). NOAA Fisheries Type-Approved VMS Units. Available online at: https://www.fisheries.noaa.gov/national/enforcement/noaa-fisheries-type-approved-vms-units#commercial-reef-fish-fishery-of-the-gulf-of-mexico (accessed, January 20, 2022).
National Oceanographic and Atmospheric Administration [NOAA] (2020). Wrecks and Obstructions database. Available online at: https://nauticalcharts.noaa.gov/data/wrecks-and-obstructions.html (accessed February 2, 2020).
O’Farrell, S., Sanchirico, J. N., Chollett, I., Cockrell, M., Murawski, S. A., Watson, J. T., et al. (2017). Improving detection of short-duration fishing behavior in vessel tracks by feature engineering of training data. ICES J. Mar. Sci. 74, 1428–1436.
Oracle Database Sql Language Reference (2021). 12c Release 2 (12.2). Available online at: https://docs.oracle.com/en/database/oracle/oracle-database/12.2/sqlrf/index.html (accessed February 18, 2021).
Parker, R. O., Colby, D. R., and Willis, T. D. (1983). Estimated Amount of Reef habitat on a Portion of the U.S. South Atlantic and Gulf of Mexico Continental Shelf. Bull. Mar. Sci. 33, 935–940.
Patterson, W. F. III (2007). A review of movement in Gulf of Mexico red snapper: implications for population structure. Am. Fish. Soc. Symp. 60, 221–235.
Paxton, A. B., Shertzer, K. W., Bacheler, N. M., Kellison, G. T., Riley, K. L., and Taylor, J. C. (2020). Meta-analysis reveals artificial reefs can be effective tools for fish community enhancement but are not one-size-fits-all. Front. Mar. Sci. 7:282. doi: 10.3389/fmars.2020.00282
Porch, C. E., Turner, S. C., and Schirripa, M. J. (2007). “Reconstructing the commercial landings of red snapper in the Gulf of Mexico from 1872–1963,” in Proceedings of the Red Snapper Ecology and Fisheries in the US Gulf of Mexico. American Fisheries Society, symposium 60, eds W. F. Patterson, J. H. Cowan Jr., G. R. Fitzhugh and D. L. Nieland Bethesda, MD, 337–354.
Powers, S. P., Drymon, J. M., Hightower, C. L., Spearman, T., Bosarge, G. S., and Jefferson, A. (2018). Distribution and age composition of red snapper across the inner continental shelf of the north-central Gulf of Mexico. Trans. Am. Fish. Soc. 147, 791–805. doi: 10.1002/tafs.10081
Powers, S., Grabowski, J., Peterson, C., and Lindberg, W. (2003). Estimating enhancement of fish production by offshore artificial structures: uncertainty exhibited by divergent scenarios. Mar. Ecol. Progr. Ser. 264, 265–278.
Putt, R. E., Gettleson, D. A., and Phillips, N. W. (1986). Fish assemblages and benthic biota associated with natural hard-bottom areas in the Northwestern Gulf of Mexico. Northeast Gulf Sci. 8, 51–63.
Reynolds, E. M. (2015). Fish Biomass and Community Structure Around Standing and Toppled Oil and Gas Platforms in the Northern Gulf of Mexico using Hydroacoustic and Video Surveys. Master’s thesis. Baton Rouge: Louisiana State University.
Roa-Ureta, R. H., Santos, M. N., and Leitao, F. (2019). Modelling long-term fisheries data to resolve the attractions versus production dilemma of artificial reefs. Ecol. Model. 407:108727. doi: 10.1016/j.ecolmodel.2019.108727
Saari, C. (2013). Sampling History of the King Mackerel Commercial Fisheries in the Southeastern United States by the Federal Trip Interview Program (TIP). SEDAR38-DW-09. North Charleston, SC: SEDAR, 13.
Schulze, A., Erdner, D. L., Grimes, C. J., Holstein, D. M., and Miglietta, M. P. (2020). Artificial reefs in the northern Gulf of Mexico: community ecology and the “ocean sprawl”. Front. Mar. Sci. 7:447. doi: 10.3389/fmars.2020.00447
Schwartzkopf, B. D., Langland, T. A., and Cowan, J. H. (2017). Habitat selection important for red snapper feeding ecology in the Northwestern Gulf of Mexico. Mar. Coast. Fish. 9, 373–387.
Scott-Denton, E., Cryer, P. F., Gocke, J. P., Harrelson, M. R., Kinsella, D. L., Pulver, J. R., et al. (2011). Descriptions of the U.S. Gulf of Mexico reef fish bottom longline and vertical line fisheries based on observer data. Mar. Fish. Rev. 73, 1–26.
Shipp, R. L., and Bortone, S. A. (2009). A perspective of the importance of artificial habitat on the management of red snapper in the Gulf of Mexico. Rev. Fish. Sci. 17, 41–47.
Smith, J. A., Lowry, M. B., and Suthers, I. M. (2015). Fish attraction to artificial structures not always harmful: a simulation study. Ecol. Evol. 5, 4590–4602. doi: 10.1002/ece3.1730
Southeast Data Assessment and Review [SEDAR] (2018). SEDAR 52 Red Snapper Stock Status Summary. North Charleston, SC: SEDAR, 434.
Southeast Regional Office [SERO] (2020). Gulf of Mexico Red Snapper Individual Fishing Quota Report (2019 Update). Atlanta, GA.: National Marine Fisheries Service, Southeast Regional Office.
Streich, M., Ajemian, M. J., Wetz, J. J., Williams, J. A., Shively, J. D., Shipley, J. B., et al. (2017a). Effects of a new artificial reef complex on red snapper and the associated fish community: an evaluation using a before-after control-impact approach. Mar. Coast. Fish. 9, 404–418. doi: 10.1080/19425120.2017.1347116
Streich, M., Ajemian, M. J., Wetz, J. J., Williams, J. A., Shipley, J. B., and Stunz, G. W. (2017b). A comparison of size structure, age, and growth of red snapper from artificial and natural habitats in the Western Gulf of Mexico. Trans. Am. Fish. Soc. 146, 762–777.
Streich, M., Ajemian, M. J., Wetz, J. J., and Stunz, G. W. (2017c). A comparison of fish community structure at mesophotic artificial reefs and natural banks in the western Gulf of Mexico. Mar. Coast. Fish. 9, 170–189. doi: 10.1080/19425120.2017.1282897
Stunz, G. W., Patterson, W. F. III, Powers, S. P., Cowan, J. H. Jr., Rooker, J. R., Ahrens, R. A., et al. (2021). Estimating the Absolute Abundance of Age-2+ Red Snapper (Lutjanus campechanus) in the U.S. Gulf of Mexico. Ocean Springs, MS: NOAASeaGrant, 439.
Texas Parks and Wildlife [TPWD] (2019). Texas Artificial Reefs. Available online at: https://tpwd.texas.gov/gis/ris/artificialreefs/ (accessed December 23, 2019).
Thorson, J. T., Fonner, R., Haltuch, M. A., Ono, K., and Winker, H. (2017). Accounting for spatiotemporal variation and fisher targeting when estimating abundance from multispecies fishery data. Can. J. Fish. Aquat. Sci. 74, 1794–1807. doi: 10.1139/cjfas-2015-0598
University of South Florida [USF] (2020). West Florida Shelf Data- Mapping Compilation. Available online at: https://www.marine.usf.edu/scamp/data-products/west-florida-shelf-data-mapping-compilation-2/ (accessed April 14, 2020).
Watson, J., Haynie, A., Sullivan, P., Perruso, L., O’Farrell, S., Sanchirico, J., et al. (2018). Vessel monitoring systems (VMS) reveal an increase in fishing efficiency following regulatory changes in a demersal longline fishery. Fish. Res. 207, 85–94.
Keywords: vessel monitoring systems, habitat mapping, fisheries management, artificial structures, spatial modeling, red snapper
Citation: Gardner C, Goethel DR, Karnauskas M, Smith MW, Perruso L and Walter JF III (2022) Artificial Attraction: Linking Vessel Monitoring System and Habitat Data to Assess Commercial Exploitation on Artificial Structures in the Gulf of Mexico. Front. Mar. Sci. 9:772292. doi: 10.3389/fmars.2022.772292
Received: 07 September 2021; Accepted: 21 January 2022;
Published: 14 February 2022.
Edited by:
Simone Libralato, Istituto Nazionale di Oceanografia e di Geofisica Sperimentale, ItalyReviewed by:
Anna Nora Tassetti, Institute for Biological Resources and Marine Biotechnology, National Research Council (CNR), ItalyIrida Maina, Hellenic Centre for Marine Research, Greece
Copyright © 2022 Gardner, Goethel, Karnauskas, Smith, Perruso and Walter. This is an open-access article distributed under the terms of the Creative Commons Attribution License (CC BY). The use, distribution or reproduction in other forums is permitted, provided the original author(s) and the copyright owner(s) are credited and that the original publication in this journal is cited, in accordance with accepted academic practice. No use, distribution or reproduction is permitted which does not comply with these terms.
*Correspondence: Christopher Gardner, Y2hyaXMuZ2FyZG5lckBub2FhLmdvdg==