 Yanxu Sun1
 Seok-Hyun Youn2
 Yejin Kim1
 Jae Joong Kang1
 Dabin Lee1
 Kwanwoo Kim1
 Hyo Keun Jang1
 Naeun Jo1
 Mi Sun Yun3
 Sang-Keun Song4
 Sang Heon Lee1*
- 1Department of Oceanography, Pusan National University, Busan, South Korea
- 2Oceanic Climate and Ecology Research Division, National Institute of Fisheries Science, Busan, South Korea
- 3College of Marine and Environmental Sciences, Tianjin University of Science and Technology, Tianjin, China
- 4Department of Earth and Marine Sciences, Jeju National University, Jeju, South Korea
The relative importance of interannual environmental changes in shaping phytoplankton community structure remains unclear in the East China Sea (ECS), which is the largest marginal sea in the western North Pacific Ocean. Based on high-performance liquid chromatography (HPLC) analysis of a variety of photosynthetic pigments, we investigated spatiotemporal variations in the phytoplankton community in the northern East China Sea (NECS) from 2018 to 2020 to understand biomass and compositional responses to environmental conditions in a complex current system. Correlation heatmaps and generalized additive models (GAMs) were used to explore the variations in major phytoplankton groups and their relationships to temperature, salinity, depth, and nutrients. The results indicated that the phytoplankton community structure was significantly different between 2018/2019 and 2020. Under the conditions of high dissolved inorganic nitrogen (DIN) and low dissolved inorganic phosphate (DIP) concentrations in winter 2020, cryptophytes replaced diatoms as the dominant species and were observed for the first time in this study area. Dinoflagellates predominated throughout the euphotic zone in spring 2020, and statistical analysis showed that dinoflagellates tended to prevail at low DIP and high DIN conditions compared with diatoms. Summer was the only season with strong water stratification that reoccurred every year, and diatoms were mainly concentrated at nutrient-enriched 1% light depths in the summers of 2018/2019. However, a large amount of Changjiang River Diluted Water (CDW) from the surface and western part of the study area affected all sampling sites eastward to 126°E in 2020, allowing diatoms to be dominant at 100% and 30% light depths in the westernmost stations in the NECS. In autumn 2020, diatoms decreased significantly because of DIP-limited environmental conditions and were replaced by small phytoplankton. Under expected warming ocean scenarios with human-induced nutrient inputs, small phytoplankton will become dominant, while spring dinoflagellate blooms will occur more frequently in the NECS. International monitoring programs for marine ecosystems are currently needed in the ECS.
Introduction
Phytoplankton play an important role in both the global carbon cycle and marine ecosystems and are responsible for approximately 50% of global primary production today (Smith and Sakshaug, 1990; Sommer, 1994; Falkowski and Raven, 2013). The influence of environmental factors on phytoplankton community structure and abundance has been well established (Kilham and Hecky, 1988; Olsen et al., 2001). With climate change and other anthropogenic impacts, a major topic that requires further investigation is future scenarios for phytoplankton in ocean ecosystems (Boyce et al., 2010; Anderson et al., 2012). The East China Sea (ECS) is a typical sea and is influenced greatly by global warming (Wang and Wu, 2021) and large hydraulic engineering construction (e.g., Three Gorges Dam) (Kong et al., 2019). Global warming could cause a decrease in the abundance of the warm-temperate zooplankton species and could not be fully offset by warm-water species increasing in the same period, reducing the pressure on phytoplankton grazing which could destabilize the dynamics balance of zooplankton and phytoplankton (Cai and Tan, 2010). Consequently, these could change result in frequent harmful algal blooms (HABs) formation and appearance in the ECS (Cai et al., 2016). The long-term observation of the ECS by the Chinese State Oceanic Administration (CSOA) confirmed that the occurrence of HABs in the ECS after 2000 was more frequent than that in the period of 1977–1999 (Zhao et al., 2004; Liu et al., 2013). Therefore, phytoplankton community structure variations in the Northern East China Sea (NECS) can be a useful indicator to detect potential responses of offshore ecosystems to anthropogenic changes in the ECS.
The ECS is a highly dynamic sea that is strongly influenced by several different hydrographic waters, including Changjiang River Diluted Water (CDW), Taiwan Warm Current Water (TWCW), Yellow Sea Cold Water (YSCW), and Kuroshio Water (KW) (Gong et al., 1996; Yoon et al., 2015). These water masses show very high spatiotemporal variations, have different hydrographic characteristics and provide a large amount of nutrients for the growth of phytoplankton (Ning et al., 1998; Furuya et al., 2003; Chen, 2009). Different water masses cause the environmental conditions to vary from east to the west and vertically in the ECS. Therefore, the ECS is an ideal region for investigating the associations and responses of different phytoplankton communities to environmental factors.
Previous studies on the phytoplankton community in the ECS have focused on the Changjiang (Yangtze) River estuary and adjacent waters (Furuya et al., 2003; Zhou et al., 2008; Guo C. et al., 2014; Liu et al., 2016) but have been limited in the NECS. Several previous studies on phytoplankton community structure in the NECS focused primarily on short-term seasonal variations (Yoon, 2003; Park et al., 2008; Kim et al., 2020) or long-term interannual variations in summer when water mass stratification is well established (Xu et al., 2019). To date, no studies have been performed on the interannual variations in phytoplankton communities encompassing the entire euphotic zone in all seasons in the NECS. In terms of the phytoplankton community composition, previous studies have focused on large phytoplankton groups, such as diatoms and dinoflagellates, that had large contributions to the total chlorophyll-a concentration, confirming that diatoms were generally the most dominant groups in the ECS (He et al., 2009; Zhao et al., 2010; Guo S. et al., 2014; Liu et al., 2016). However, small phytoplankton represented by cryptophytes, cyanobacteria, and prymnesiophytes are usually ignored because of their small contributions to phytoplankton communities or difficulty fixing these cells with standard methods (Mackey et al., 1996).
Based on pigment analysis through High Performance Liquid Chromatography (HPLC), in this study, we used correlation heatmaps and generalized additive models (GAMs) to explore the interannual variations in major phytoplankton groups and their relationships to environmental factors in the NECS. Compared with previous studies on the variations in phytoplankton community structure in this study area, (1) spatially, we studied three different light depths in the euphotic zone, (2) temporally, we studied all four seasons from 2018 to 2020, and (3) for different phytoplankton groups, we were not limited to the study of large phytoplankton but also focused on cryptophytes, cyanobacteria, and prymnesiophytes, which were rarely considered in previous studies. The major aim of this study is to investigate a more mechanistic explanation for how interannual variability in environmental factors impacts phytoplankton community structure in the NECS ecosystem.
Materials and Methods
Sampling Sites and Water Sampling
Sixteen cruises were carried out in the NECS from February 2018 to November 2020 (Table 1). Figure 1 shows the sampling sites for these cruises, which cover the eastern part of the continental shelf area and all seasons in 2018 to 2020 in the East China Sea. To assess phytoplankton pigments and environmental factors (temperature, salinity, and major nutrients; NH4, NO2 and NO3, PO4, and SiO2) at all euphotic depths, water samples were collected at three different light depths (100%, 30%, and 1% penetration of surface irradiance, PAR), using a CTD/rosette sampler fitted with Niskin bottles. The light depths were determined at each station using a Secchi disk based on Lambert–Beer’s law described in Poole and Atkins (1929). Vertical hydrographic measurements (temperature and salinity) were collected using SBE9/11 CTD (Sea-Bird Electronics, Bellevue, WA, United States) sensors.
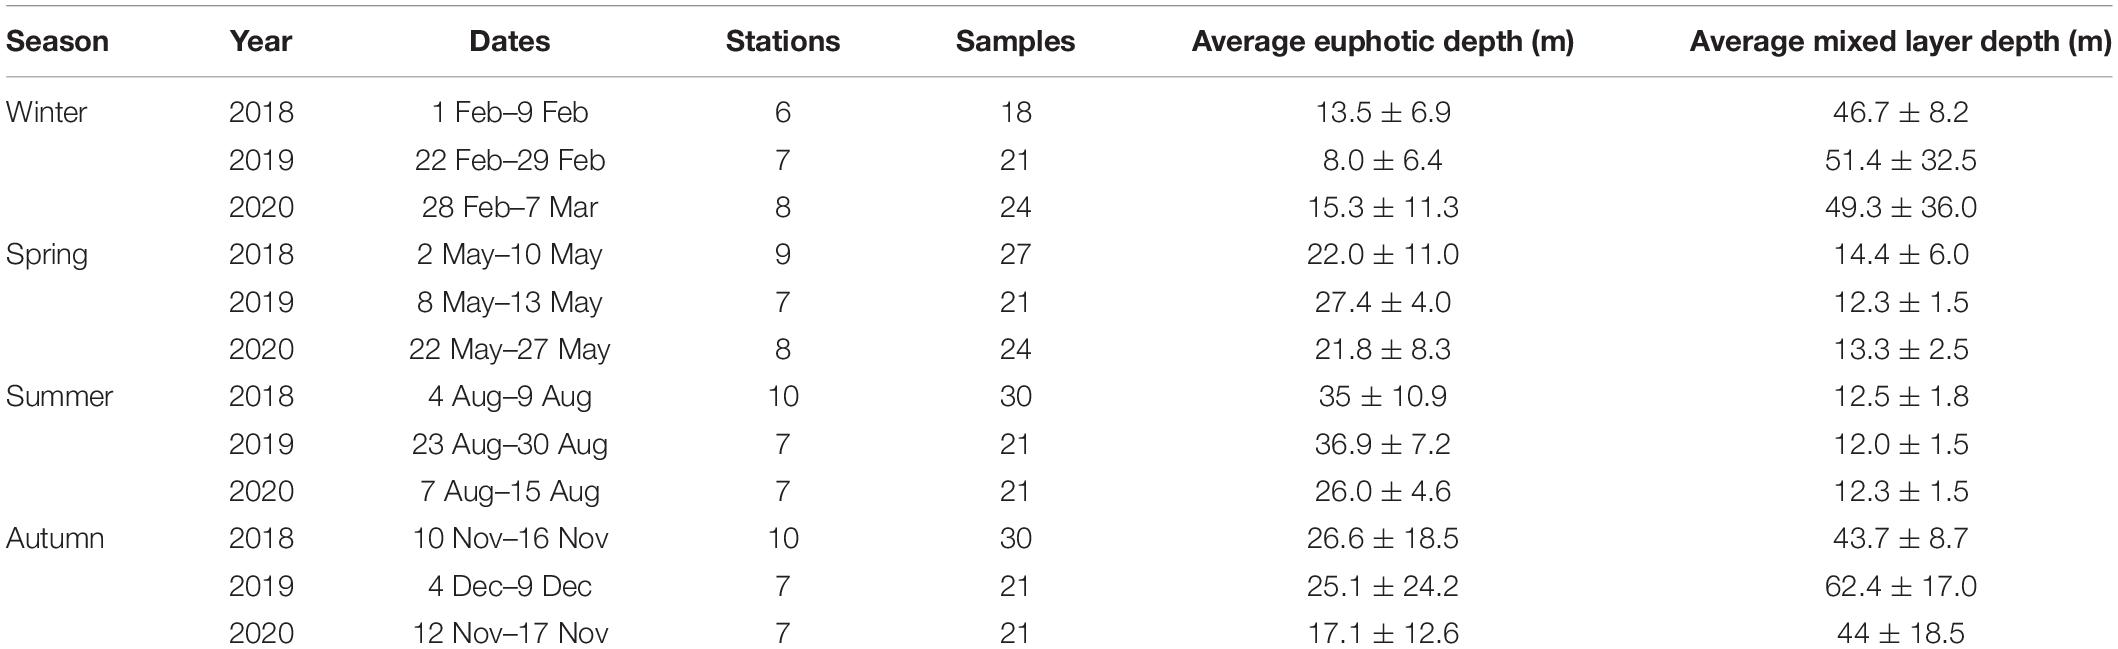
Table 1. Summary of samples collected during each cruise period, 2018∼2020.
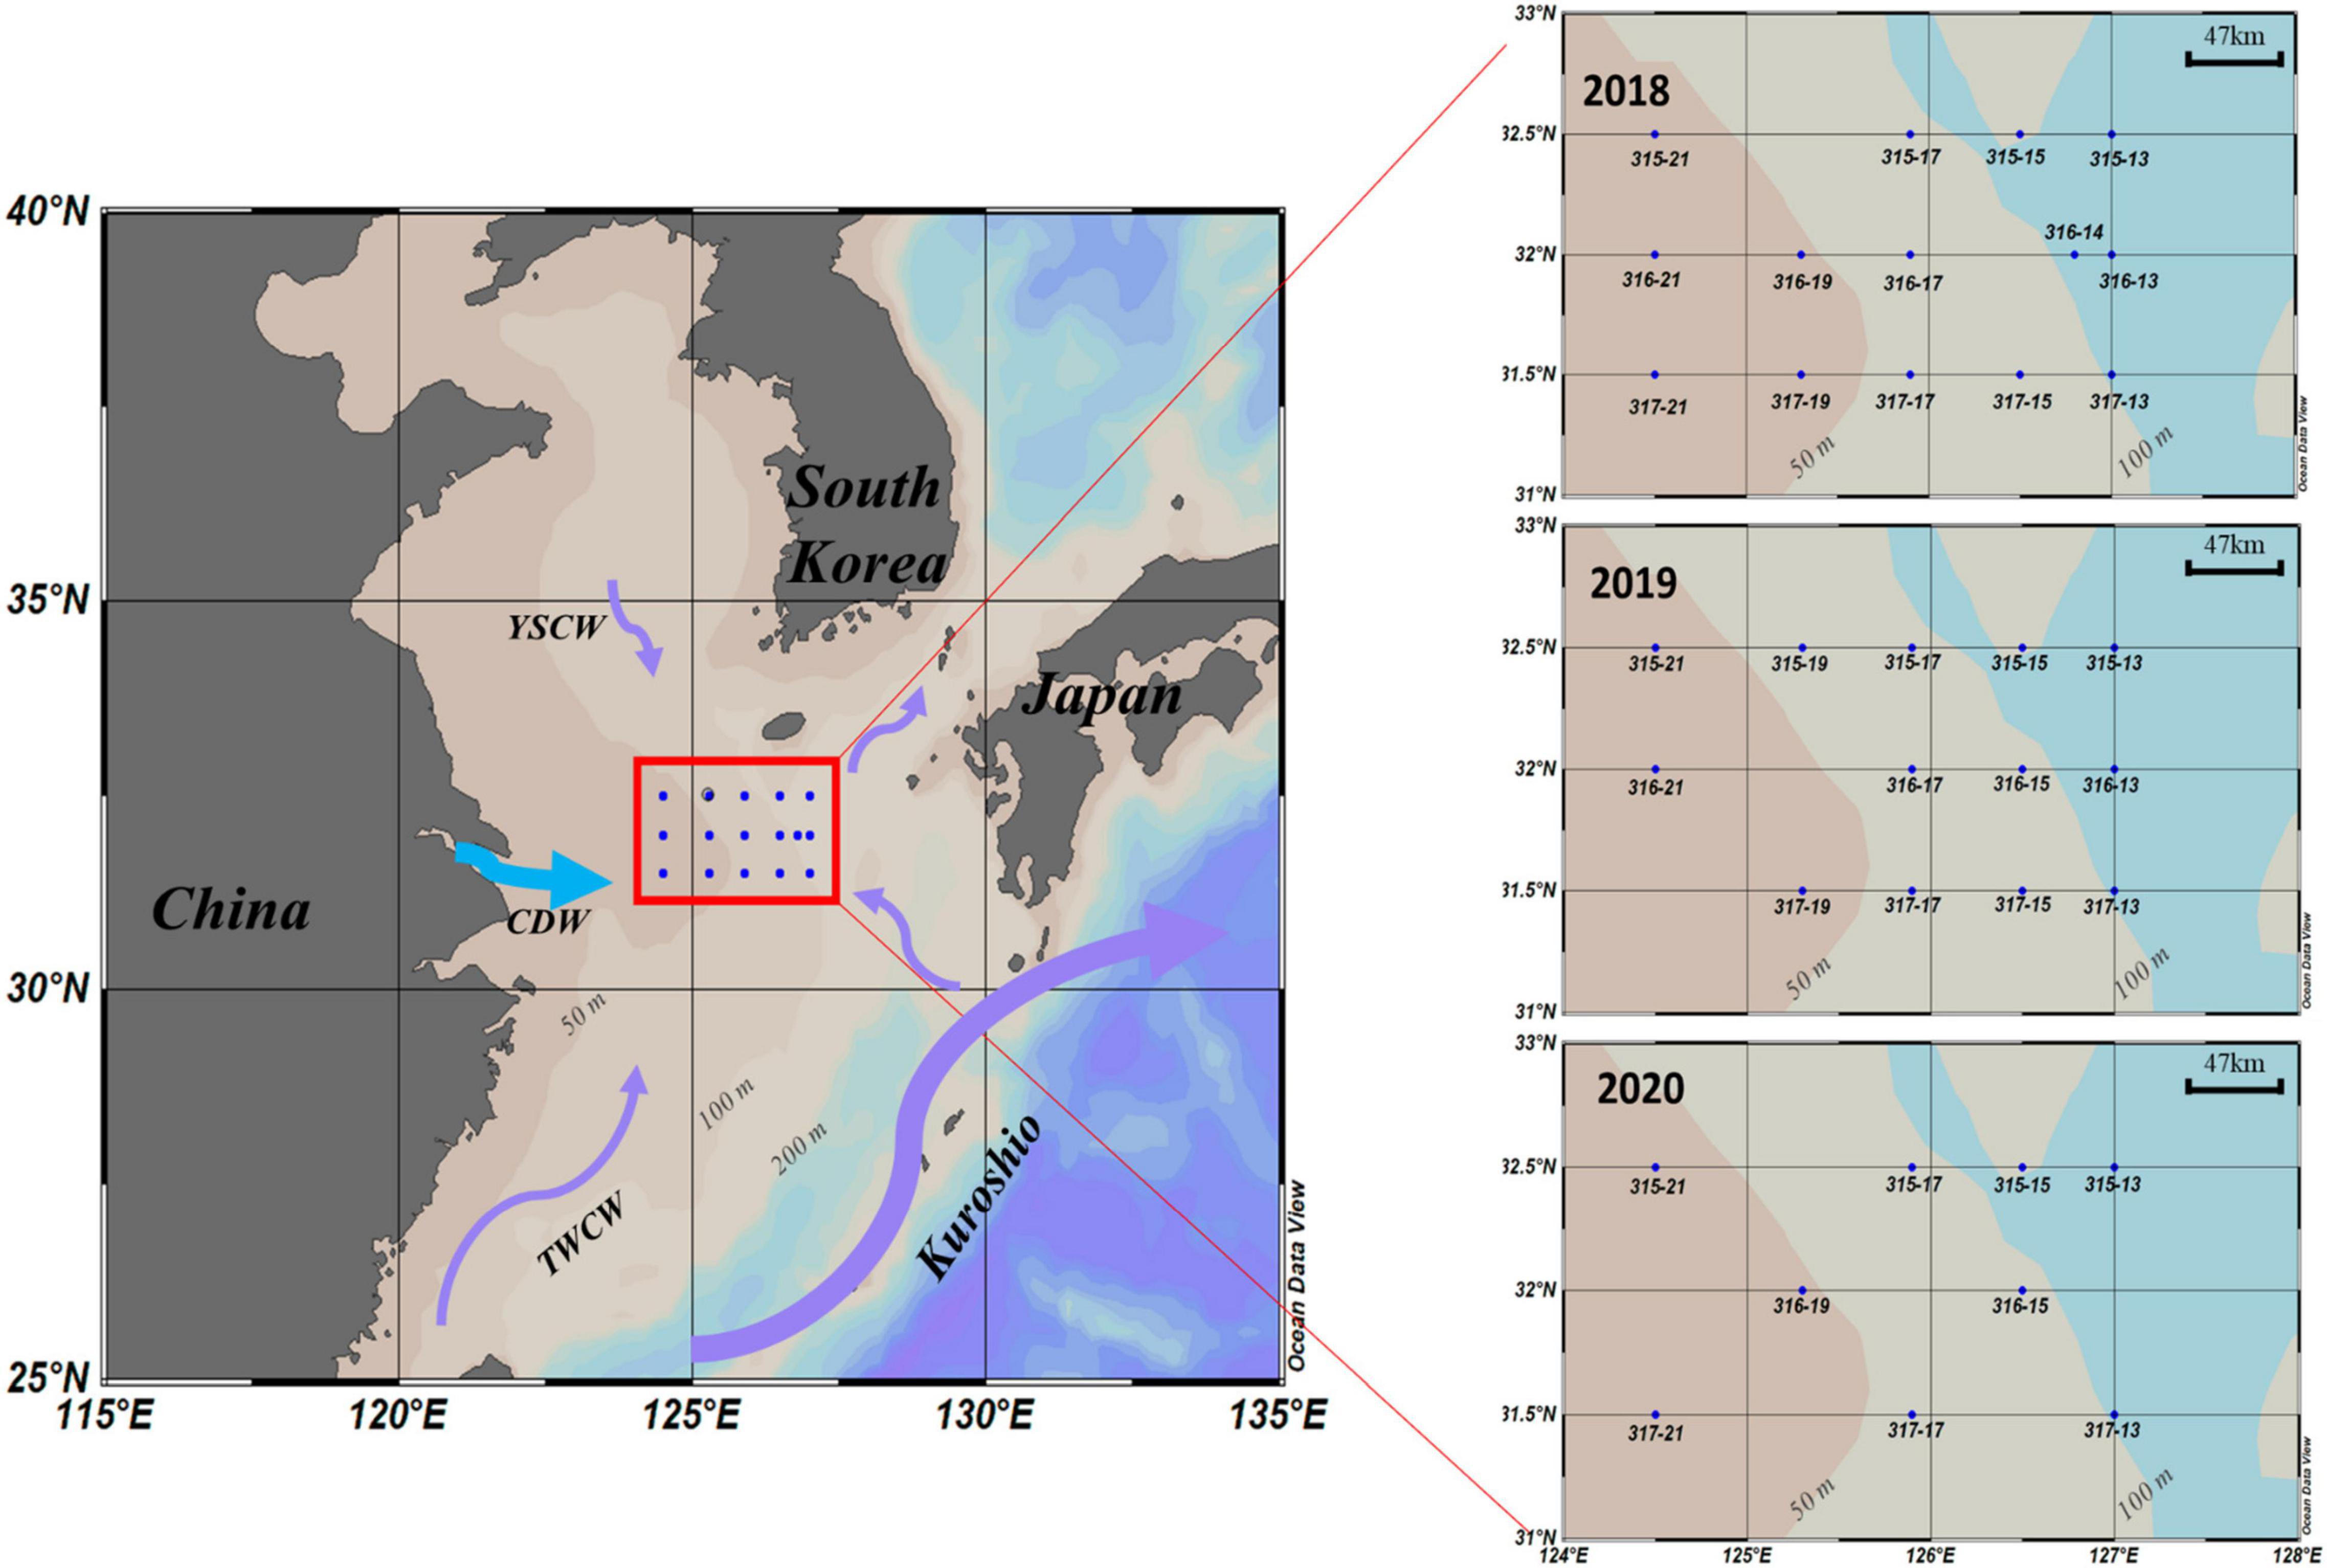
Figure 1. Sampling stations in the Northern East China Sea (NECS), 2018∼2020.
Nutrient samples for all cruises were filtered onboard immediately after collection through GF/F filters (Whatman, Maidstone, United Kingdom; 07 μM) for analysis of dissolved inorganic nutrient concentrations and transferred under frozen conditions (–80°C) to the laboratory for analysis using an automatic analyzer (Quaatro, Bran + Luebbe, Germany) belonging to the National Institute of Fisheries Science (NIFS), Korea. Dissolved inorganic nutrients, including dissolved inorganic nitrogen (NH4, NO2 and NO3), dissolved inorganic phosphorus (PO4) and silica (SiO2), were abbreviated as DIN, DIP and Si, respectively. DIN concentrations were calculated as the sum of NH4, NO2 and NO3.
To verify DIN or DIP limitation conditions, excess nitrate (ExN) in nutrient samples was calculated using the formula ExN = DIN-(DIP*R) (Wong et al., 1998), where R is the Redfield N:P ratio of 16 (Redfield, 1934). Therefore, an ExN value < 0 indicates DIP enrichment, while an ExN > 0 indicates DIN enrichment. Density-mixed layer depth (or Isopycnal layer depth, MLD) were calculated by a formula described in de Boyer Montégut et al. (2004).
In addition, because water samples were collected from three different light depths (100%, 30%, and 1%), the average concentrations of all the nutrients in this study are the average values from 100%, 30%, and 1% light depths.
High Performance Liquid Chromatography Pigment and CHEMTAX Analysis
Seawater samples for phytoplankton pigment analysis were filtered through a 47 mm GF/F filter. Pigment samples were stored in a deep freezer (–80°C) during the cruise and transferred to the laboratory immediately after the cruise. Acetone-extracted phytoplankton pigments were separated and characterized by the method described in Kim et al. (2009, 2020) and Kang et al. (2018). The pigment analysis was completed within 1 month after the cruise. Phytoplankton pigment concentrations were measured using an HPLC (Agilent Infinite 1260, Santa Clara, CA, United States) system fitted with a 5 μm Eclipse XDB-C8 column (4.6*150 mm, Agilent Technologies, Waldbronn, Germany) using a modified version of the method of Zapata et al. (2000) and Lee et al. (2011) to complete the separation of pigments. Quantification was performed using standards from DHI water (Denmark), and the following pigments were detected and quantified: chlorophyll-a, peridinin (perid), 19’-butanoyloxy-fucoxanthin (19but), fucoxanthin (fuco), 19’-hexanoyloxy-fucoxanthin (19hex), neoxanthin (neo), prasinoxanthin (prasin), violaxanthin (viola), alloxanthin (allo), lutein, zeaxanthin (zea), and chlorophyll-b (chl_b) (Table 2).
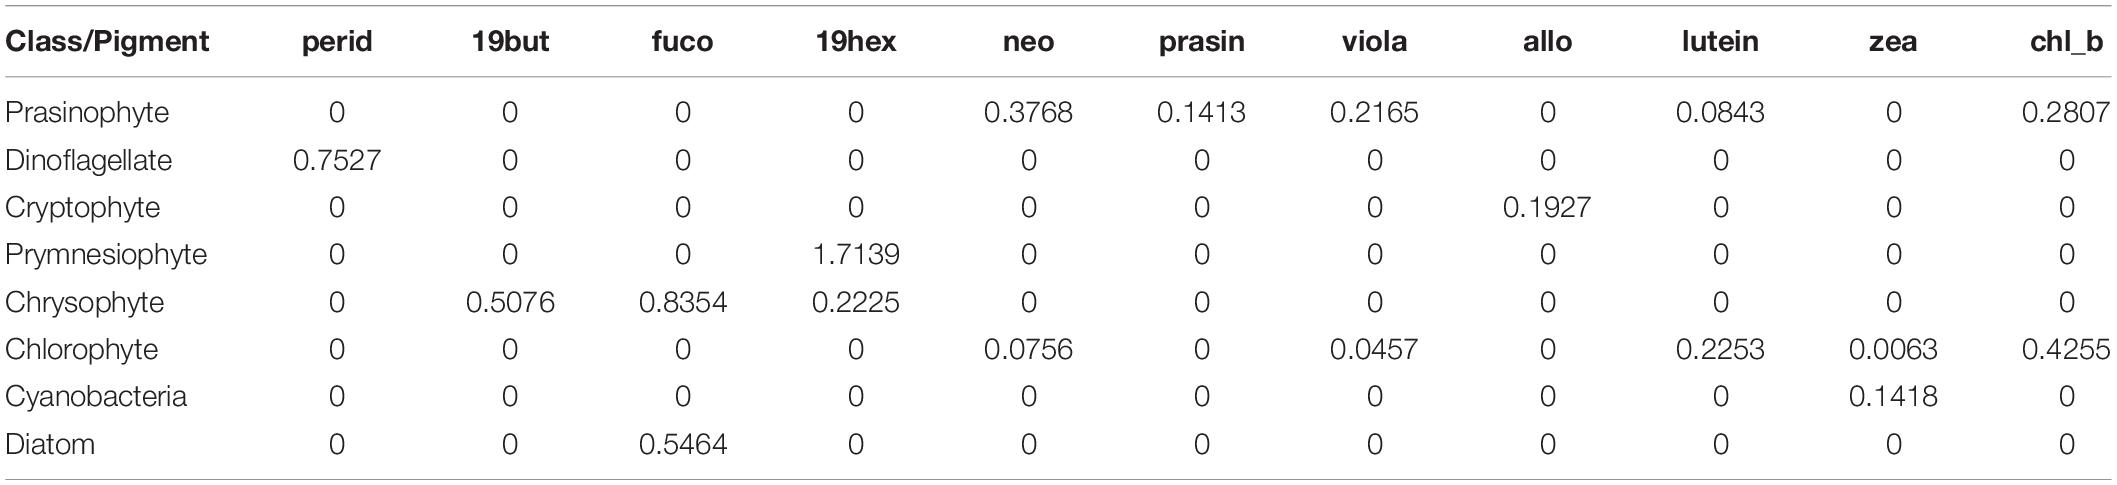
Table 2. Pigment ratios to the total chlorophyll-a for eight taxonomic groups based on CHEMTAX analysis.
The contributions of different phytoplankton communities were calculated from pigment concentration data using CHEMTAX (Mackey et al., 1996). CHEMTAX was run in MATLAB using an iteration and steepest descent algorithm to find the best fit (minimum residual) of the data to an initial pigment ratio matrix of chlorophyll a ratios for each phytoplankton community (Mackey et al., 1997). The input pigment ratio matrix (Table 2) used in the CHEMTAX calculation was based on the Korean Peninsula pigment ratio (Lee et al., 2011). To derive the most accurate phytoplankton groups, 60 further pigment ratio matrices were generated by multiplying each cell of the initial ratio matrix by a randomly determined factor F, where F = 1 + S* (R-0.5), S is a scaling factor, and R is a random number between 0 and 1 (Wright et al., 2009). This procedure was conducted using CHEMTAX (version 1.95) provided by the Australian Antarctic Division. After completing 60 runs (S = 0.7) for each of the 60 matrices, the smallest RMS error’s 10% of ratio matrices were chosen, and their average ratio was used as the second initial ratio matrix to provide a new initial matrix. Then, 60 completed runs were conducted one more time (S = 0.4), and the average value of the smallest RMS error’s 6 ratio matrices from the result was used for phytoplankton group calculation (Wright and Jeffrey, 2006). As the seasonal and annual variation in phytoplankton communities in the East China Sea is considerable (Xu et al., 2019; Kim et al., 2020), CHEMTAX was run on each dataset according to the different seasons and years for our samples to obtain the ‘best’ ratio matrix.
Statistical Analysis
A correlation matrix (based on Pearson correlation) was also produced between environmental factors and phytoplankton community structure and visualized as a heatmap. All statistical analyses were performed using the function “corrplot” in R (R Core Team, 2019). Temperature, salinity, depth, DIN, DIP, Si and ExN were included as environmental factors. To determine the effectiveness in addressing the non-linear relationship between response variables (phytoplankton community structure changes) and explanatory variables (environmental factors), response curves for generalized additive models (GAMs) with Gaussian distributions were generated (Hastie and Tibshirani, 2017). As previous studies indicated that seasonal variations in phytoplankton communities in the East China Sea are considerable, and some of these environmental factors are closely related to each other, we used only one influential factor at a particular time to avoid an ambiguous interpretation. The GAMs formations were as follows: Y = α + s(X), where Y represents the contribution of five dominant phytoplankton groups – diatoms, cryptophytes, dinoflagellates, cyanobacteria, and prymnesiophytes to the total chlorophyll-a, X represents environmental factors, α is the grand mean of dominant phytoplankton group contribution, and s is a smooth function of each parameter. Under the premise of avoiding over-fitting, random factor-smooth (fs) was used for each smoother function in order to get the highest deviance explanations rate (Wood and Wood, 2015). The maximum of basic dimension (k) was constrained within 5, except for cryptophyte to ExN. Cryptophyte was not significantly correlated with ExN until the number of basic dimension (k) was increased to 13. These calculations were based on previous studies (Chen et al., 2014; Liu et al., 2016). The GAMs modeling function from the “mgcv” package (Wood and Wood, 2015) was used in this study, and correlations with p < 0.05 were regarded as significant for all GAMs analyses.
Results
The Physical Environment and Dissolved Inorganic Nutrient Concentrations
The winter average temperature was highest at 15.56 ± 2.79°C in 2019, and the salinity was lowest at 33.50 ± 0.92‰ in 2020. DIN concentrations and ExN in 2020 were 10.65 μM and 4.38 μM, respectively, which were slightly higher than those in 2018 and 2019 (Table 3).
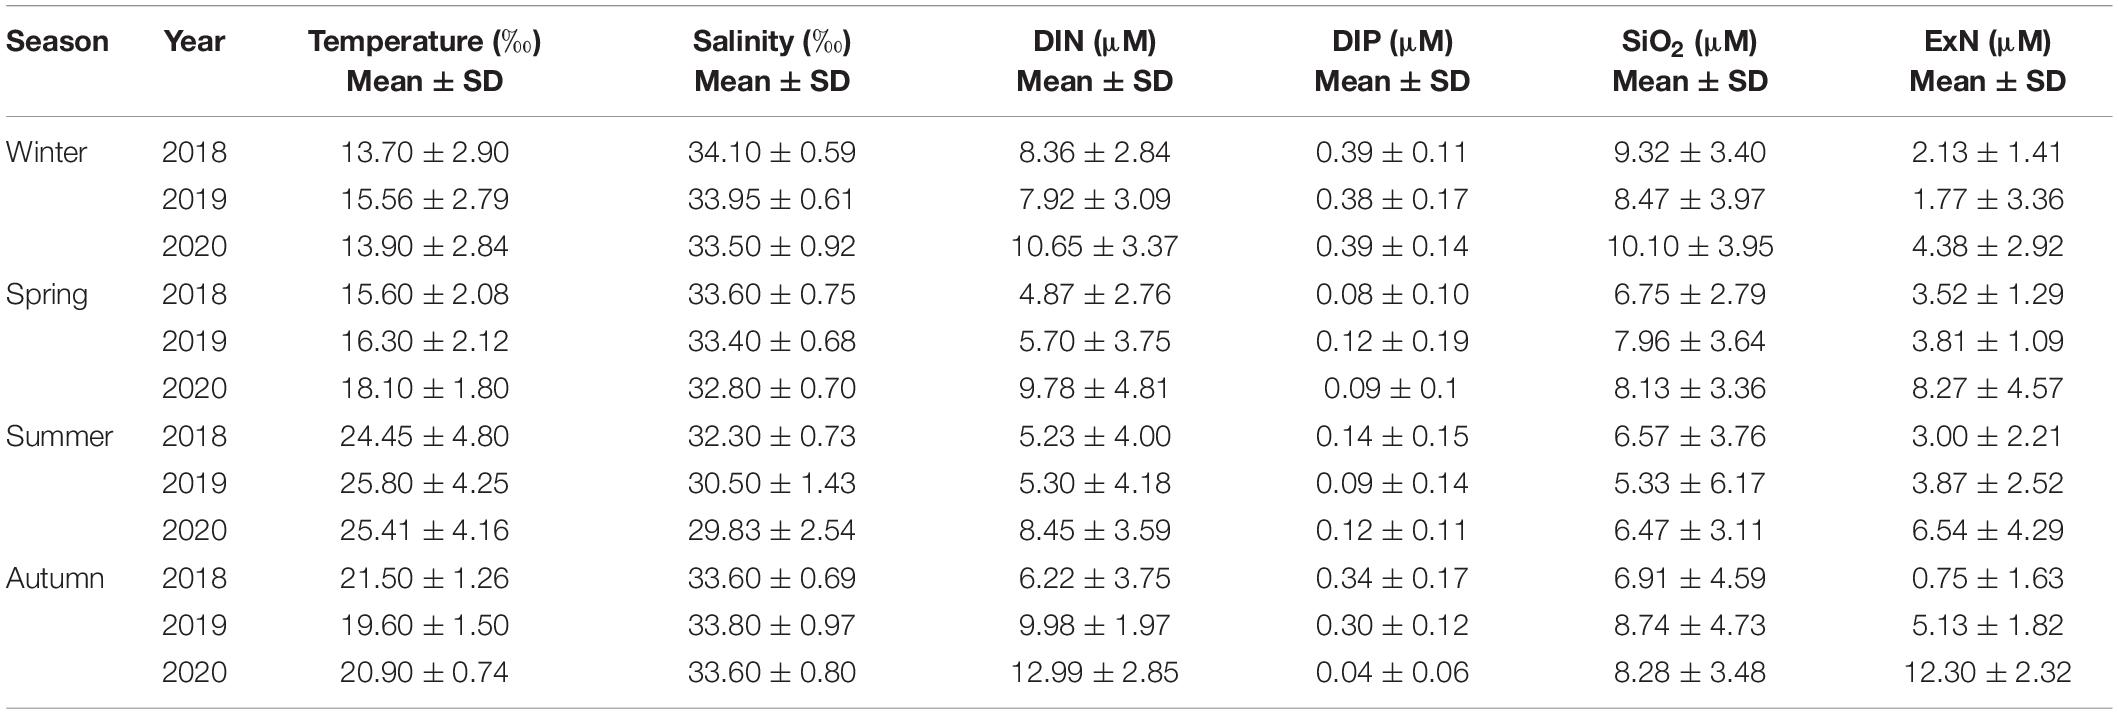
Table 3. Temperature, salinity and dissolved inorganic nutrient concentrations at the euphotic depths (100%, 30%, and 1%) of the water column in the Northern East China Sea (NECS), 2018∼2020.
The horizontal distributions of temperature, salinity and nutrients in the euphotic zone from winters in 2018–2020 are shown in Figure 2. In the 2018–2020 winters, the water temperature and salinity decreased from the eastern part toward the western part in the NECS, but all of the nutrients (DIN, DIP, and SiO2) showed a reverse trend. Low salinity (< 33 ‰) and high DIN (> 12 μM) waters appeared in the southwestern part of our study area in 2020, and they spread eastward to 126°E. DIP and SiO2 had no significant interannual differences in their horizontal distribution.
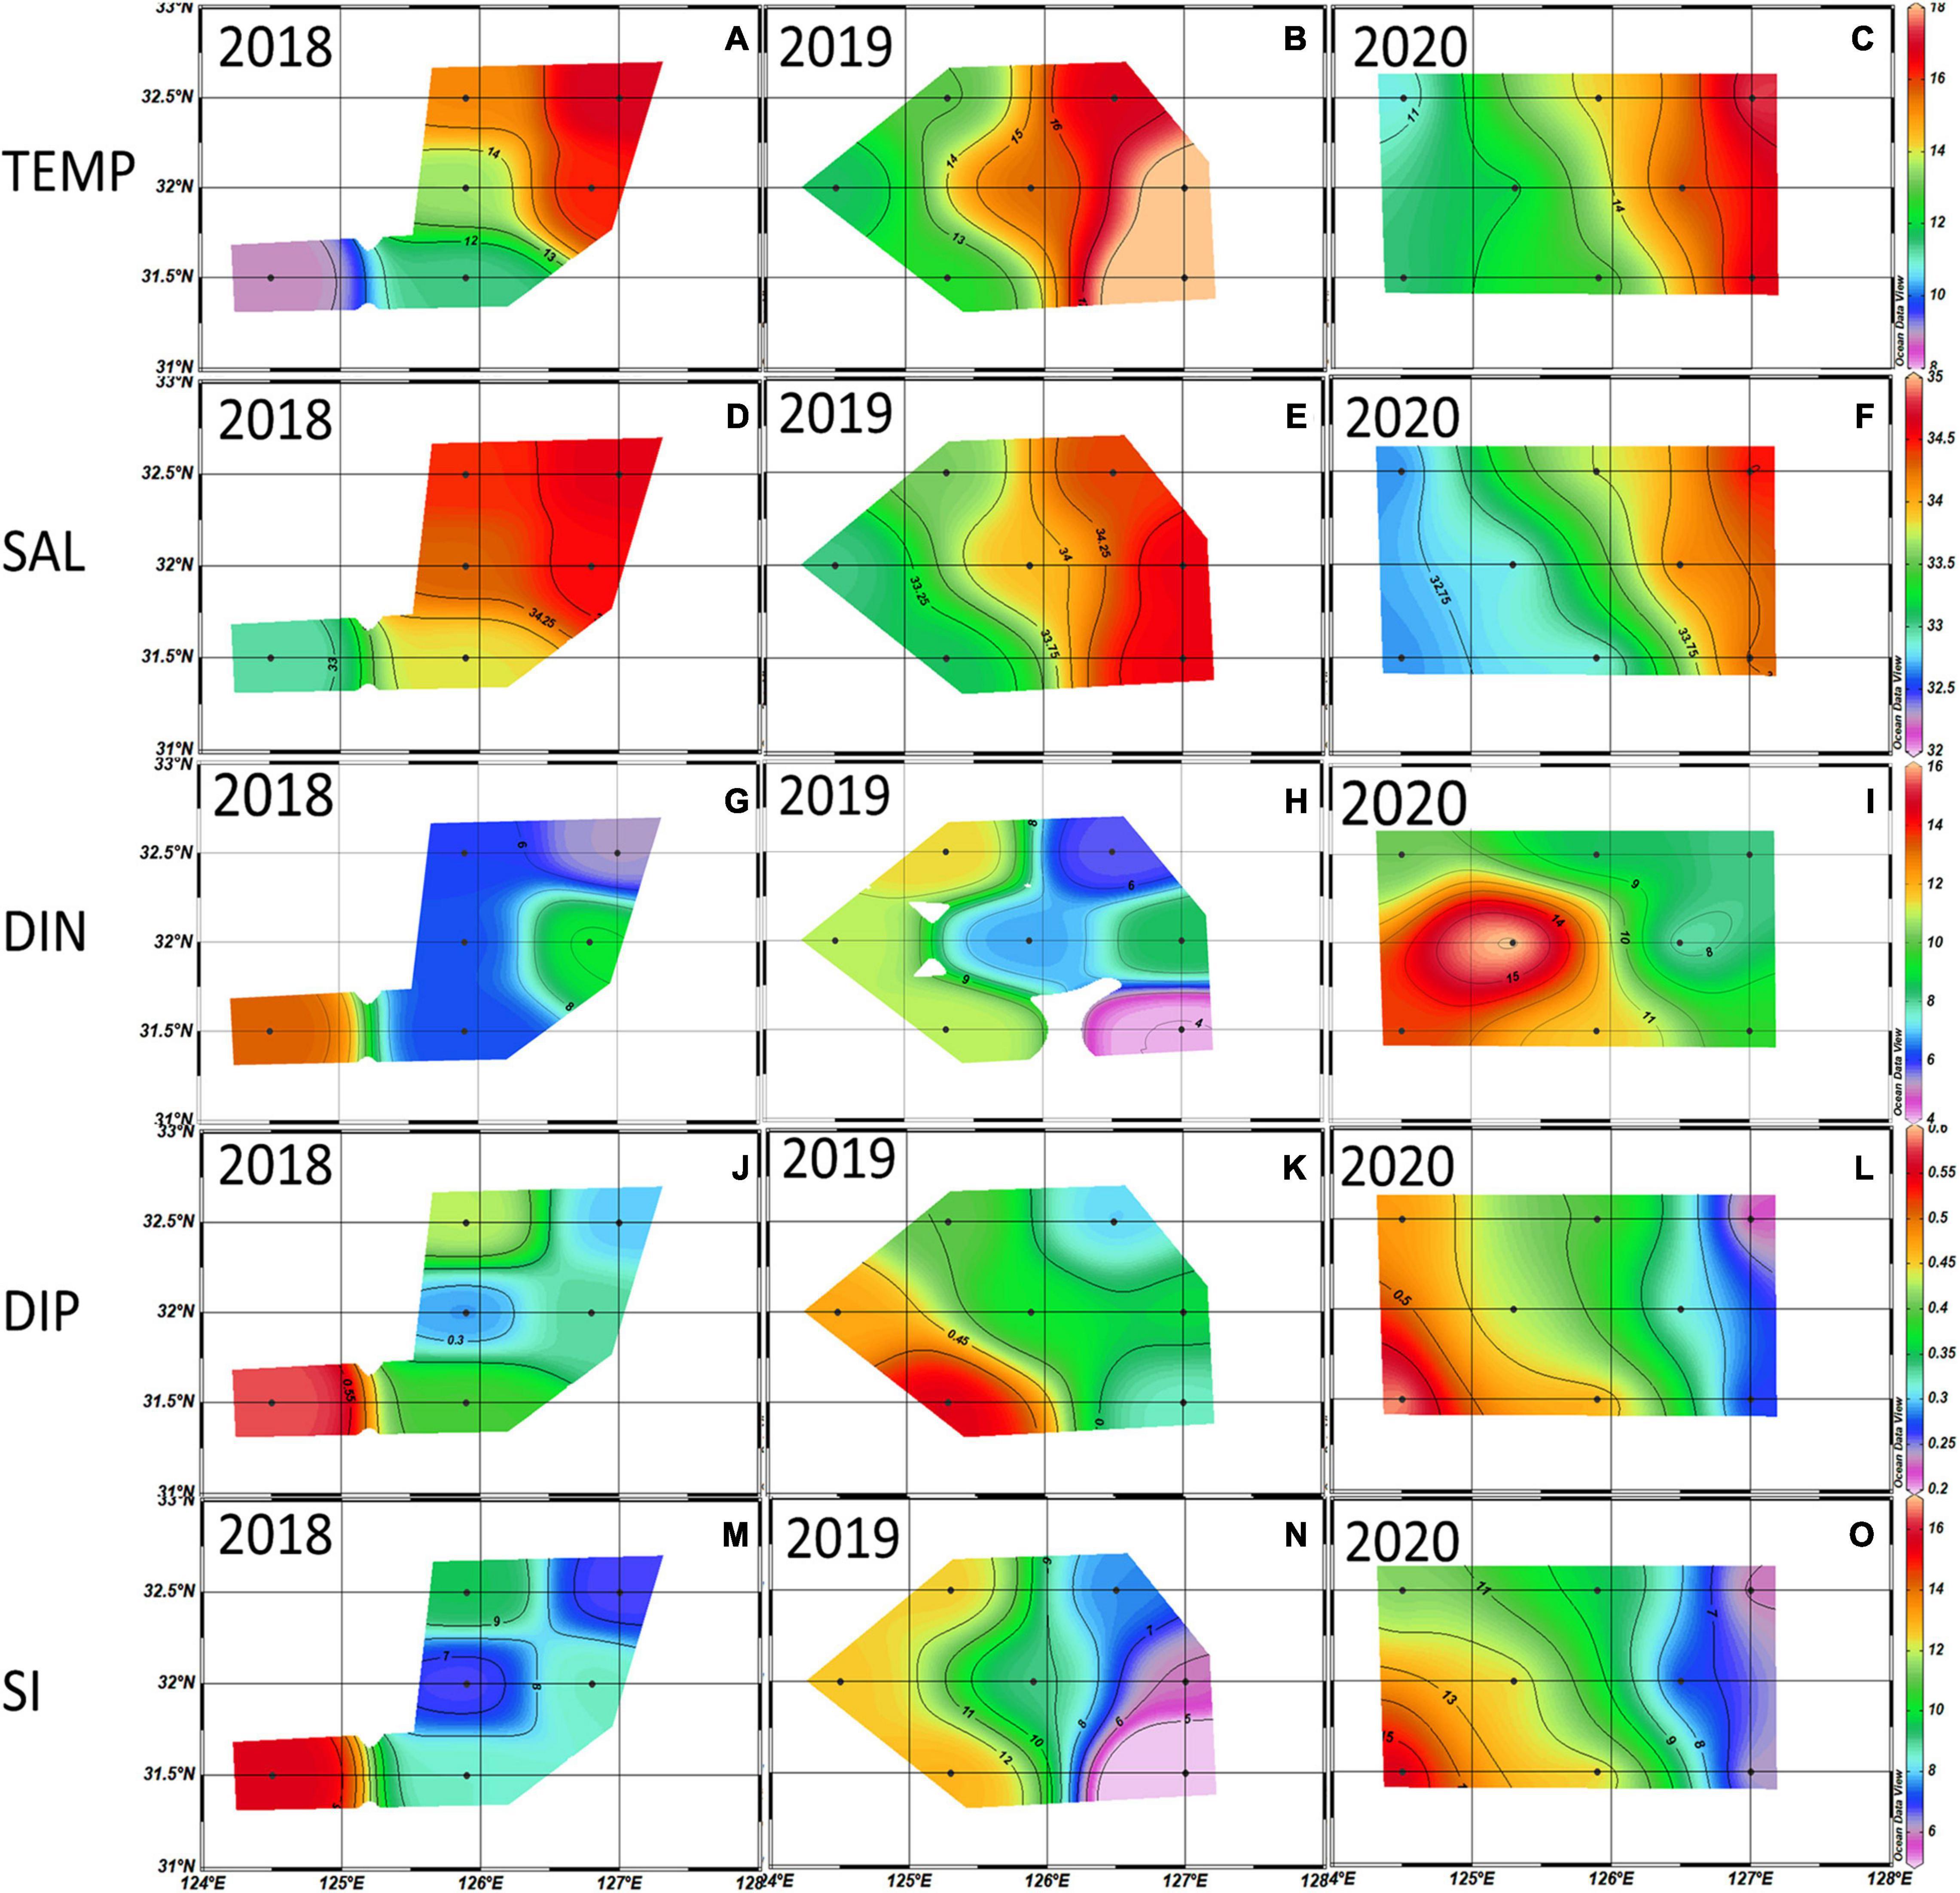
Figure 2. Distributions of temperature (°C) (A–C), salinity (‰) (D–F), dissolved inorganic nitrogen (DIN) (μM) (G–I), dissolved inorganic phosphate (DIP) (μM) (J–L), and Si (μM) (M–O) averaged from the euphotic depth (100%, 30%, and 1%) in the 2018∼2020 winter. Black dots are the sampling stations.
The average spring temperature was highest at 18.10 ± 1.80°C, and the salinity was lowest at 32.80 ± 0.70‰ in 2020. The DIN concentrations and ExN in 2020 were almost twice those in 2018/2019, which were 9.78 μM and 8.27 μM, respectively (Table 3). The observed horizontal distributions in temperature and salinity at the euphotic depth shown in Figure 3, were also relatively higher in the eastern part compared to the western part. Furthermore, the temperature and DIN in the entire study area are higher (but not significantly) in 2020 than in 2018 and 2019, and the salinity in the western part is lower in 2020 than in the previous two years. DIP concentrations were somewhat lower in the western part in 2020 than in 2018 and 2019.
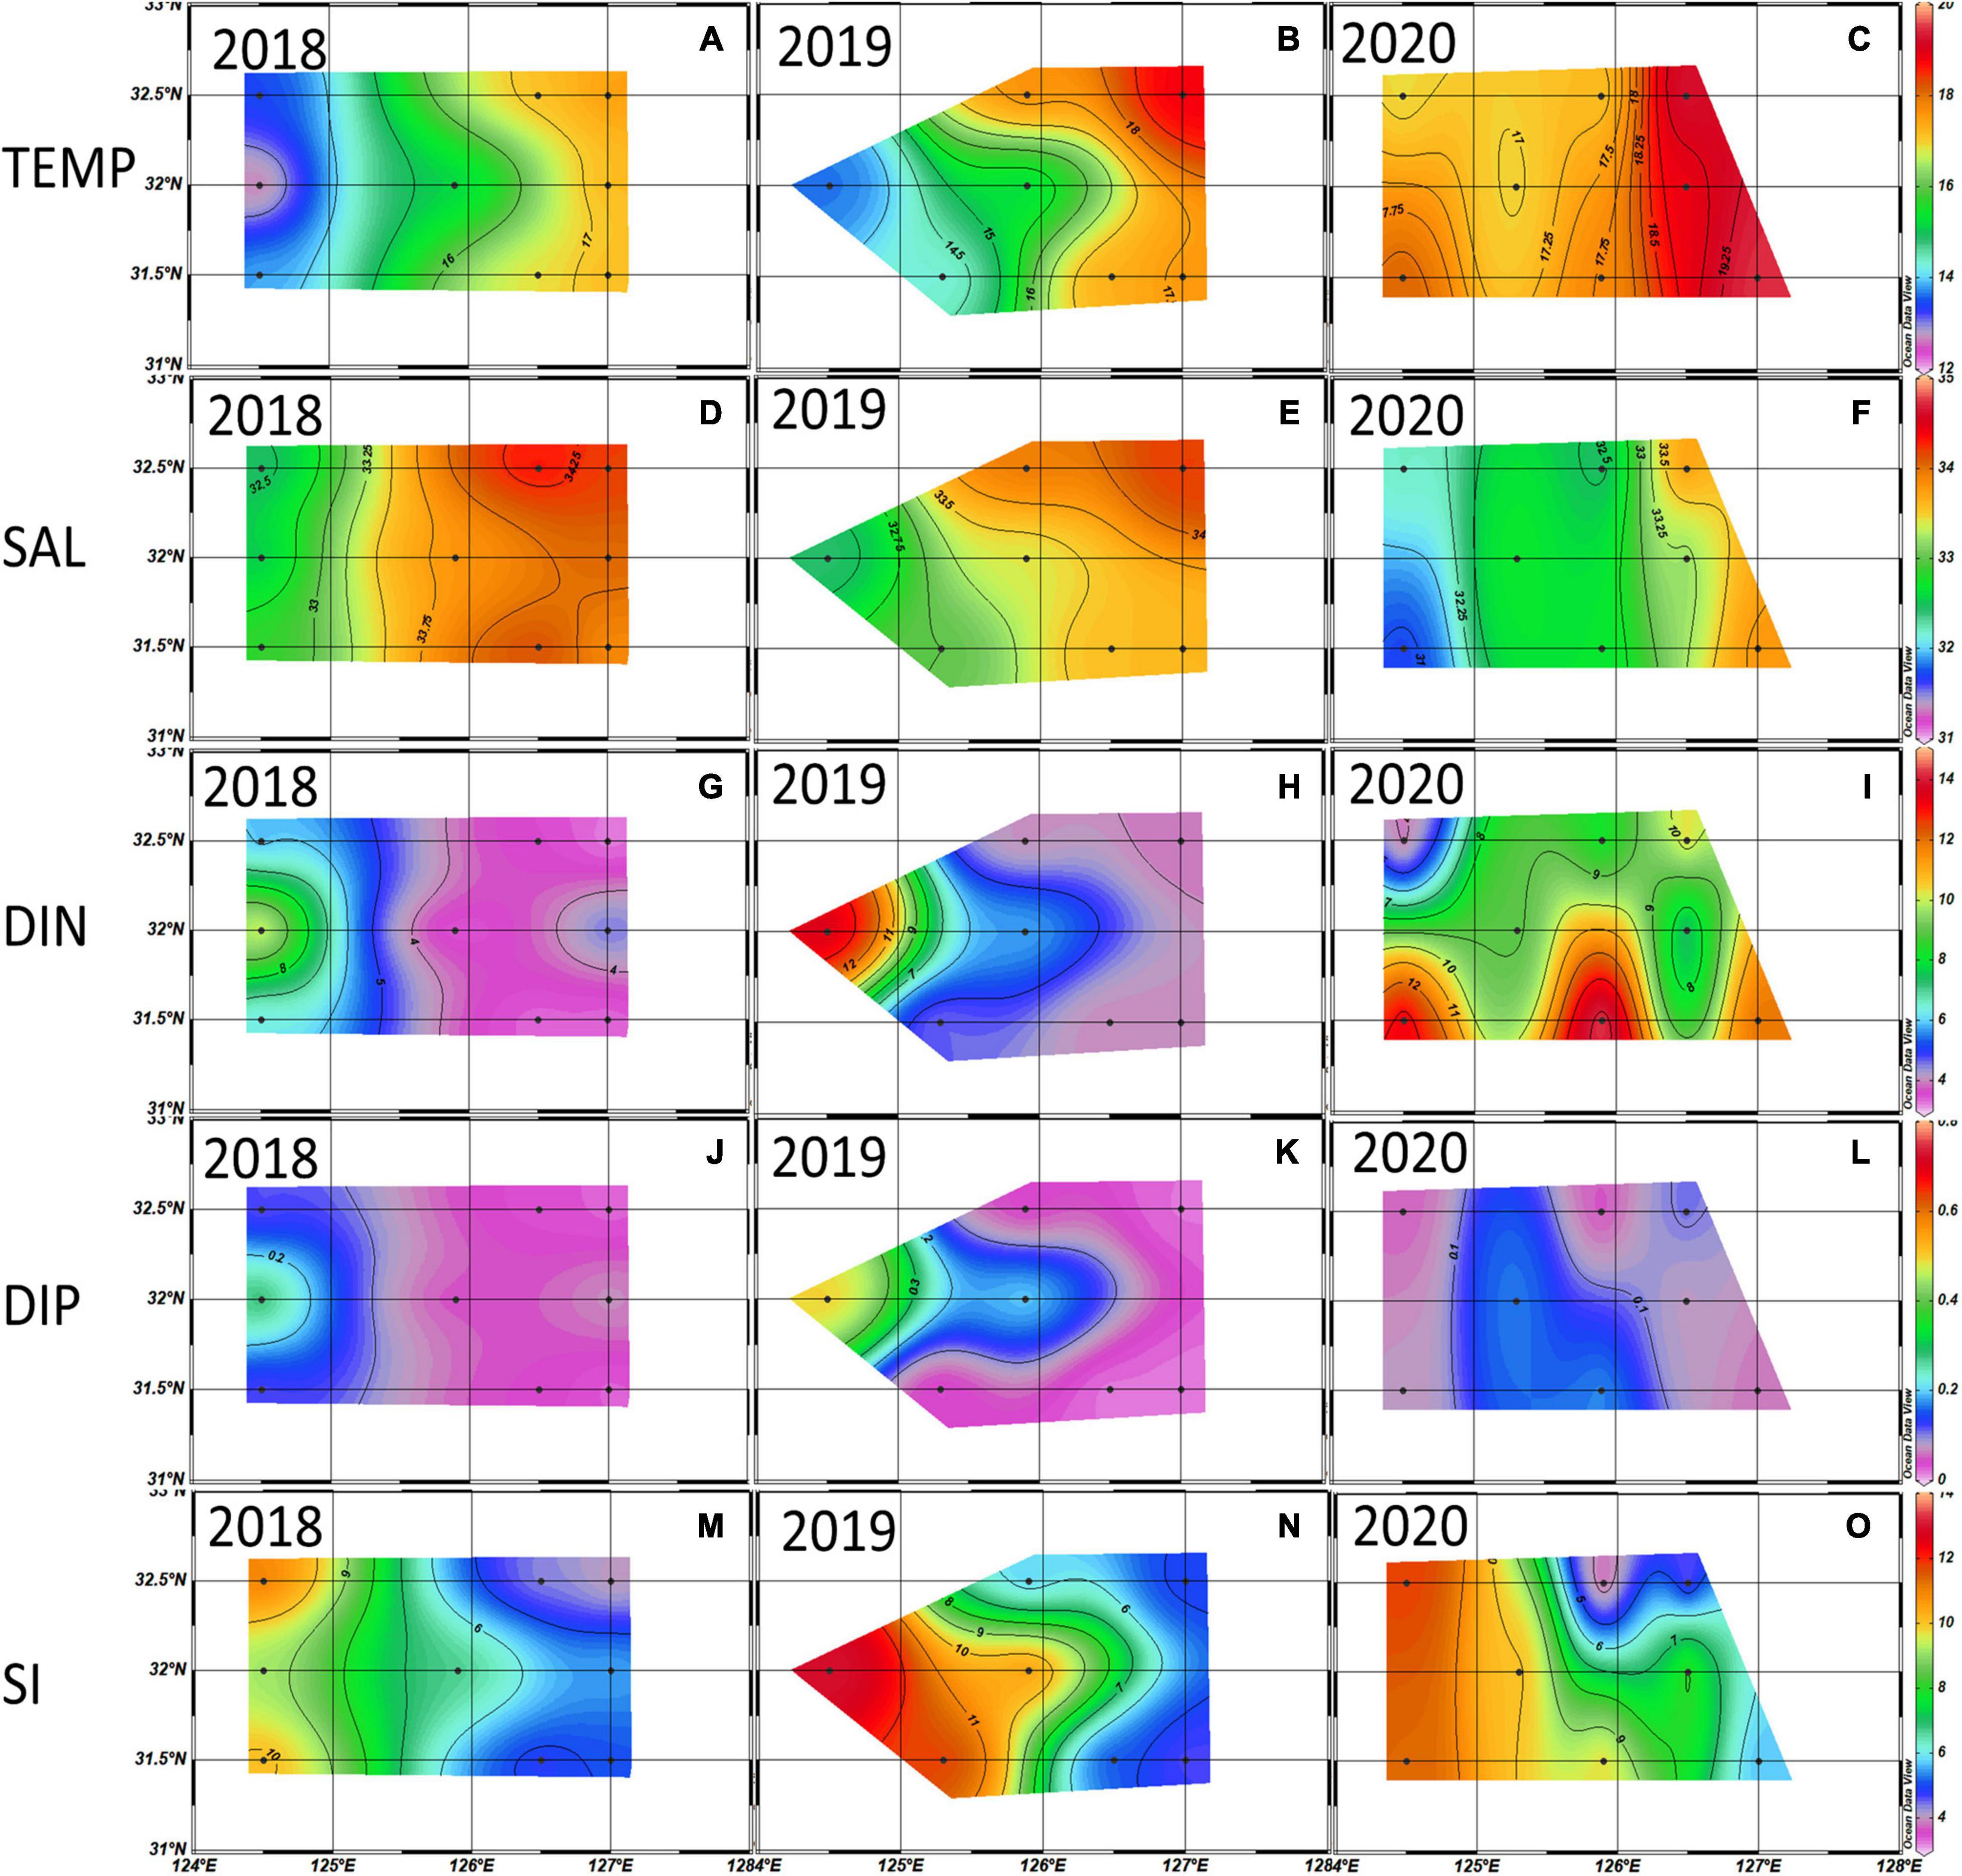
Figure 3. Distributions of temperature (°C) (A–C), salinity (‰) (D–F), dissolved inorganic nitrogen (DIN) (μM) (G–I), dissolved inorganic phosphate (DIP) (μM) (J–L), and Si (M–O) (μM) averaged from the euphotic depth (100% 30% 1%) in the 2018∼2020 spring. Black dots are the sampling stations.
The average summer temperature was lowest at 24.45 ± 4.80°C, and salinity was highest in 2018 (32.30 ± 0.73 ‰) among the 3 years. The lowest average salinity was 29.83 ± 2.54 ‰ in 2020. DIN concentrations and ExN were highest in 2020 among the three years at 8.45 μM and 6.54 μM, respectively (Table 3).
The average summer temperature at the euphotic depth east of 125°E was lower in 2018 than in 2019 and 2020 (Figure 4). As observed in the vertical distributions of temperature and salinity in Figures 5A–C, the cold-water masses were mainly distributed at the 1% light depth below the thermocline. Meanwhile, surface water salinity in 2018 was higher than in the other two years (Figures 5D–F). During the summer of 2020, a low salinity (< 31 ‰) and high DIN concentration water mass that came from the surface western part was associated with Changjiang diluted water (Figures 4F, 5F), bringing a large amount of DIN to most of the study area (Figure 4I). The average DIP concentrations were consistently low during the 2018–2020 summer, and a high SiO2 concentration was observed in the northern part of the study area in 2018.
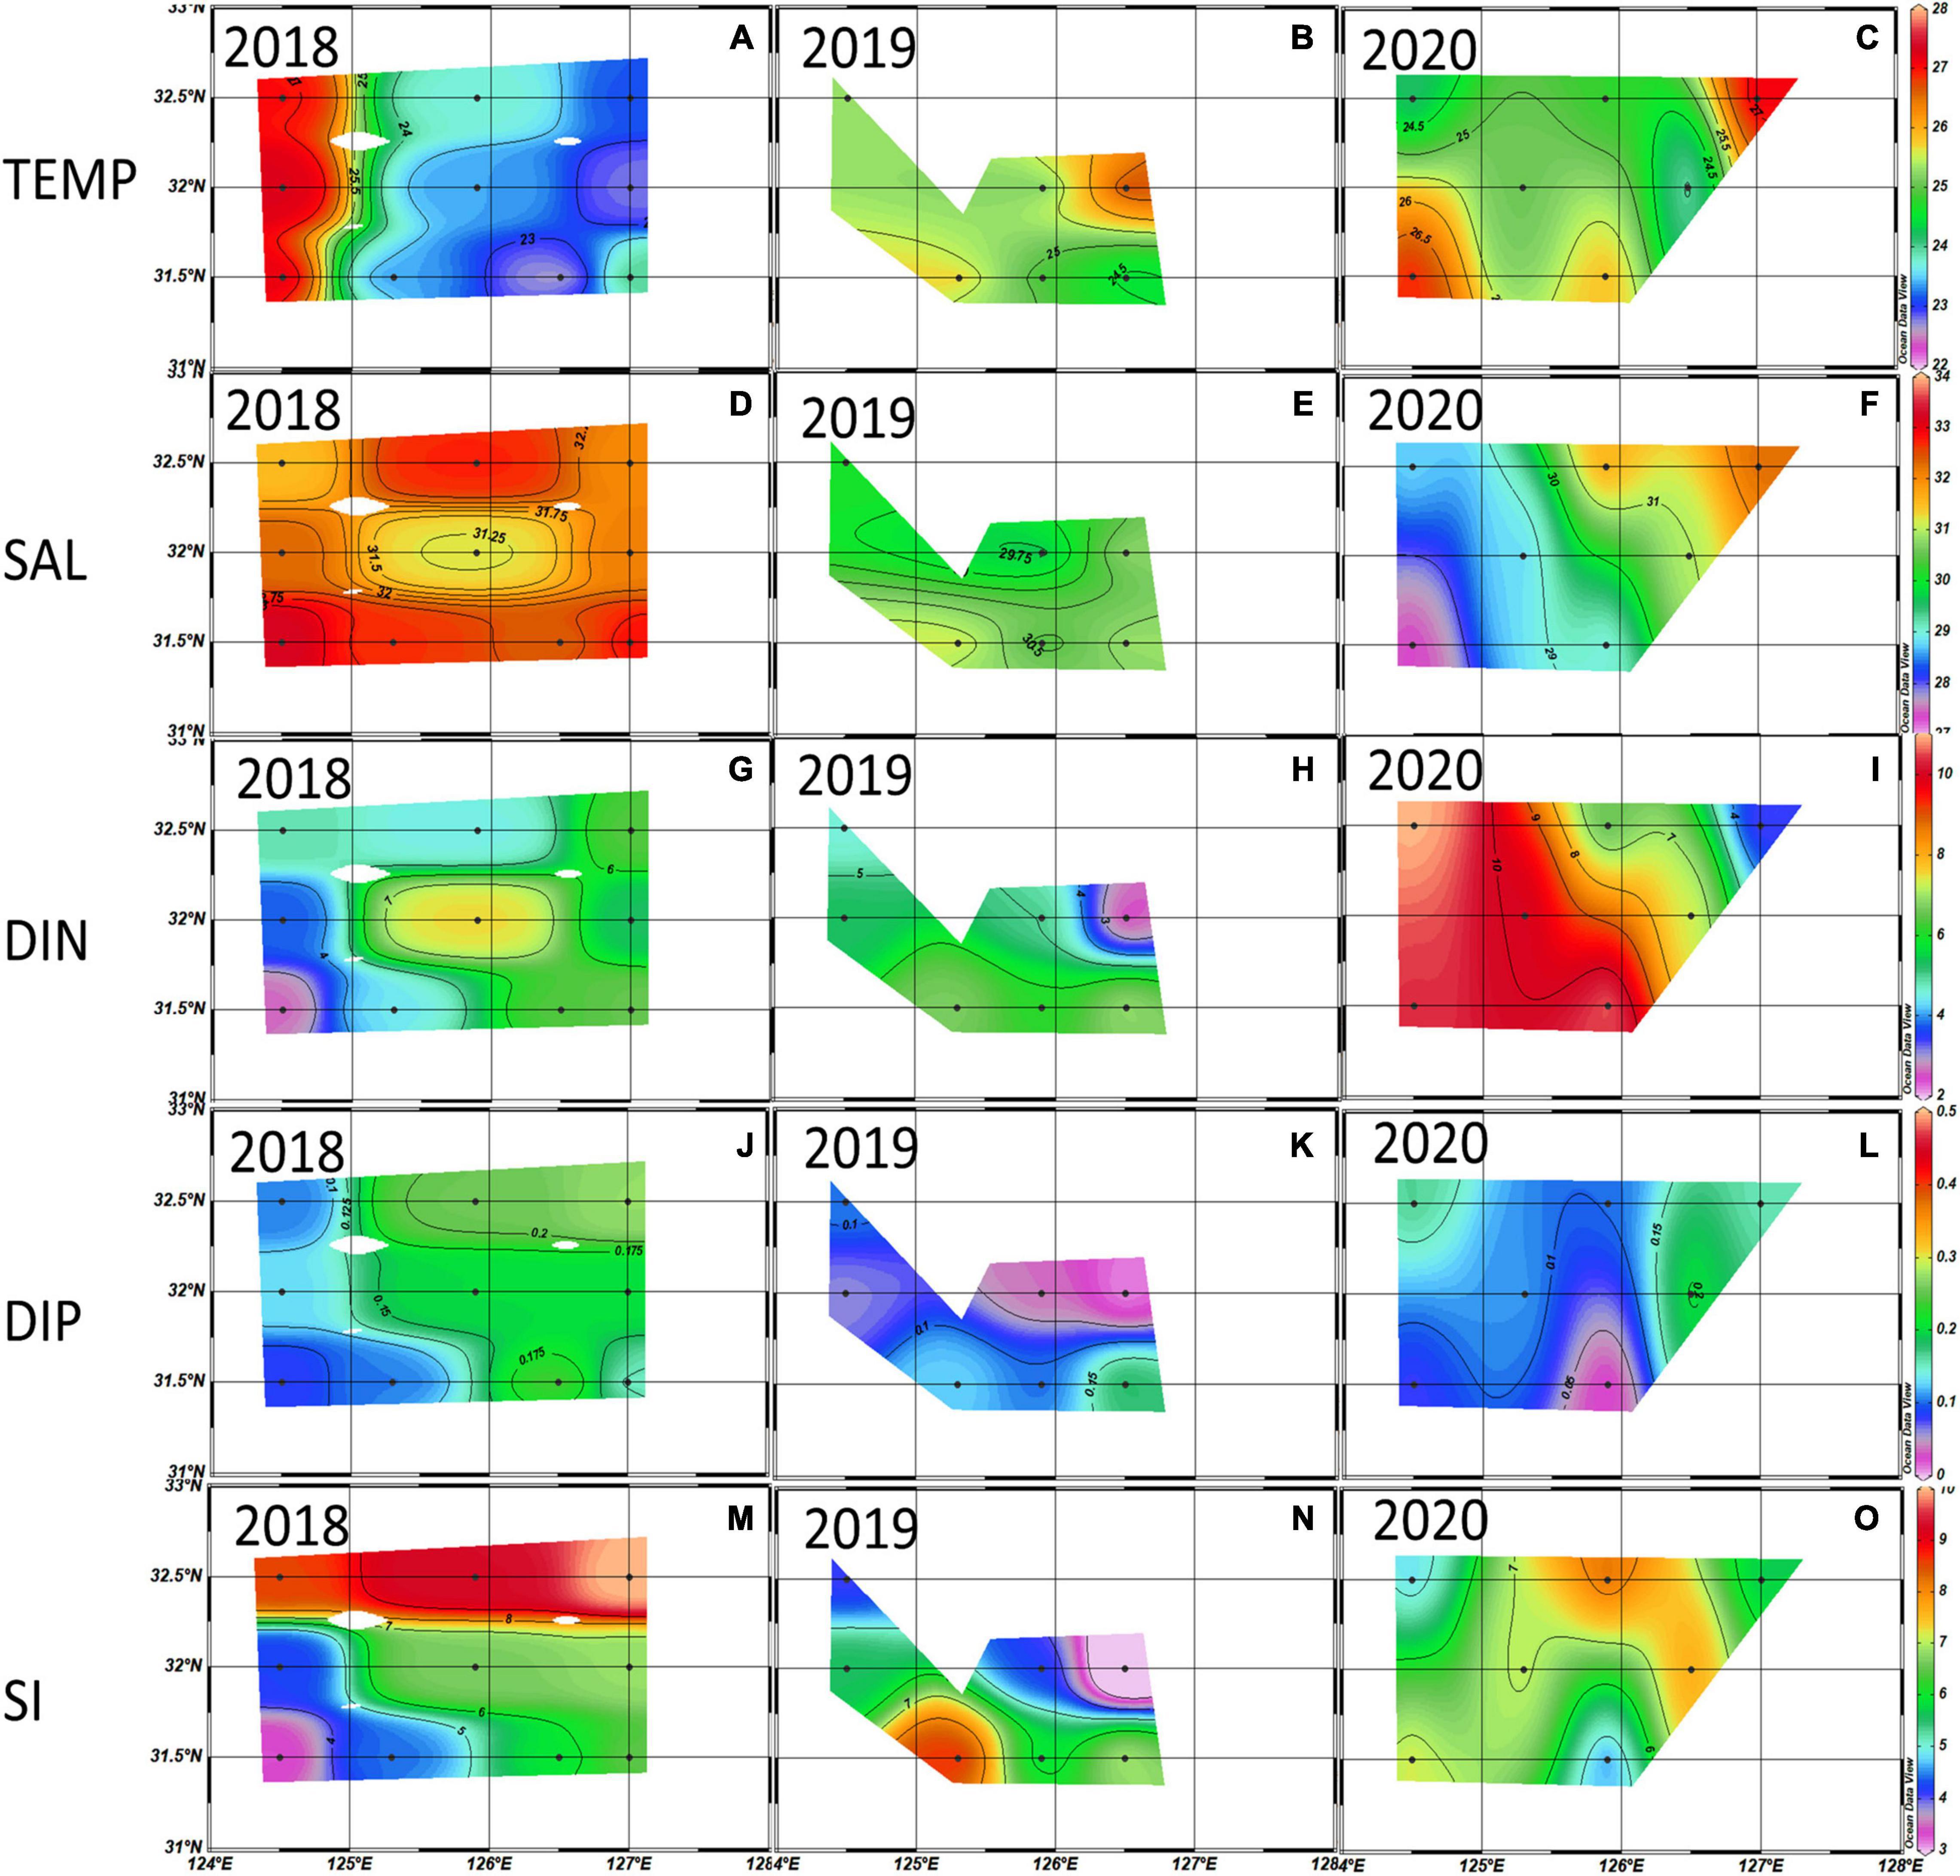
Figure 4. Distributions of temperature (°C) (A–C), salinity (‰) (D–F), dissolved inorganic nitrogen (DIN) (μM) (G–I), dissolved inorganic phosphate (DIP) (μM) (J–L), and Si (μM) (M–O) averaged from the euphotic depth (100%, 30%, and 1%) in the 2018∼2020 summer. Black dots are the sampling stations.
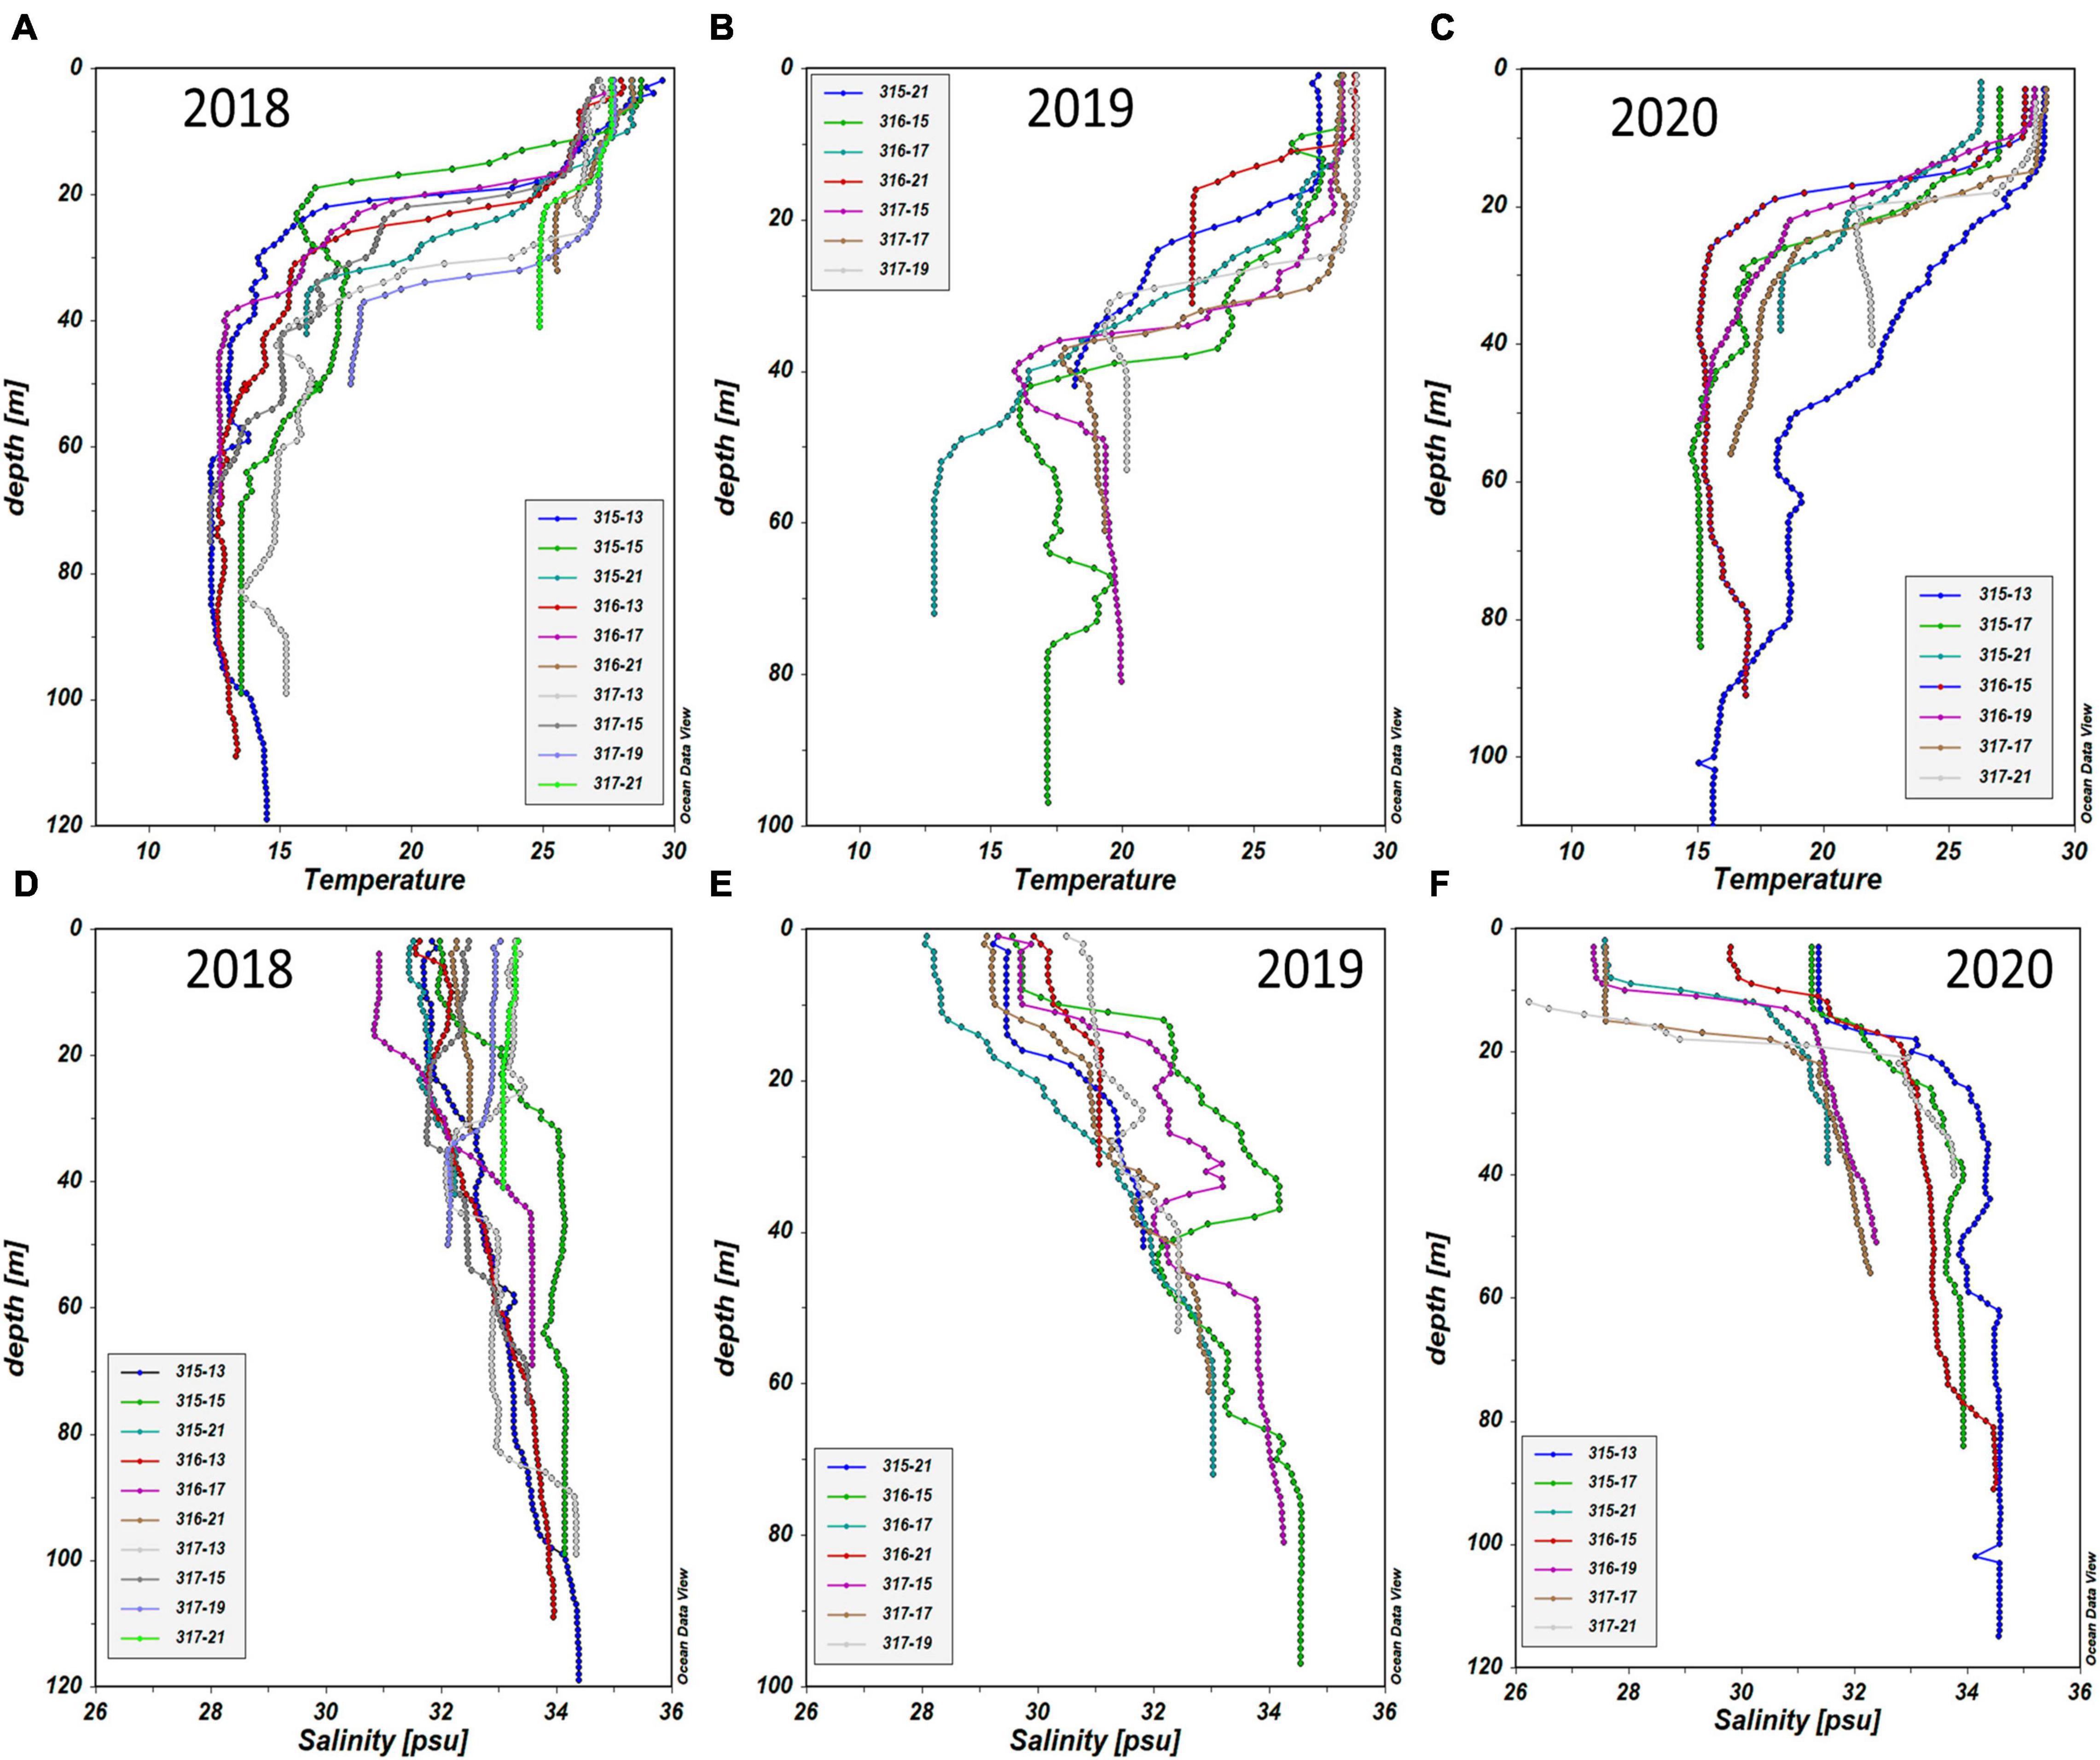
Figure 5. Vertical profiles of temperature and salinity in the Northern East China Sea (NECS), 2018∼2020 summer. (A) 2018, (B) 2019, (C) 2020 for temperature, (D) 2018, (E) 2019, and (F) 2020 for salinity.
The average autumn temperature was highest at 21.50 ± 1.26°C in 2018 and lowest at 19.60 ± 1.50°C in 2019, and the average salinity had no significant interannual differences among the three years. The average DIN concentration (12.99 μM) and ExN (12.30 μM) in autumn 2020 were higher than those in 2018/2019 (Table 3).
The water temperature and salinity in autumn were relatively higher in the eastern part and lower in the western part, and they had no significant interannual differences in their horizontal distributions. Comparing all the nutrient concentration distributions (DIN, DIP and SiO2) in 2018 and 2019, which showed a trend of west-high and east-low, a high DIN concentration was also observed east of 126°E, but the DIP concentrations were nearly depleted in the entire study area during the autumn of 2020 (Figure 6).
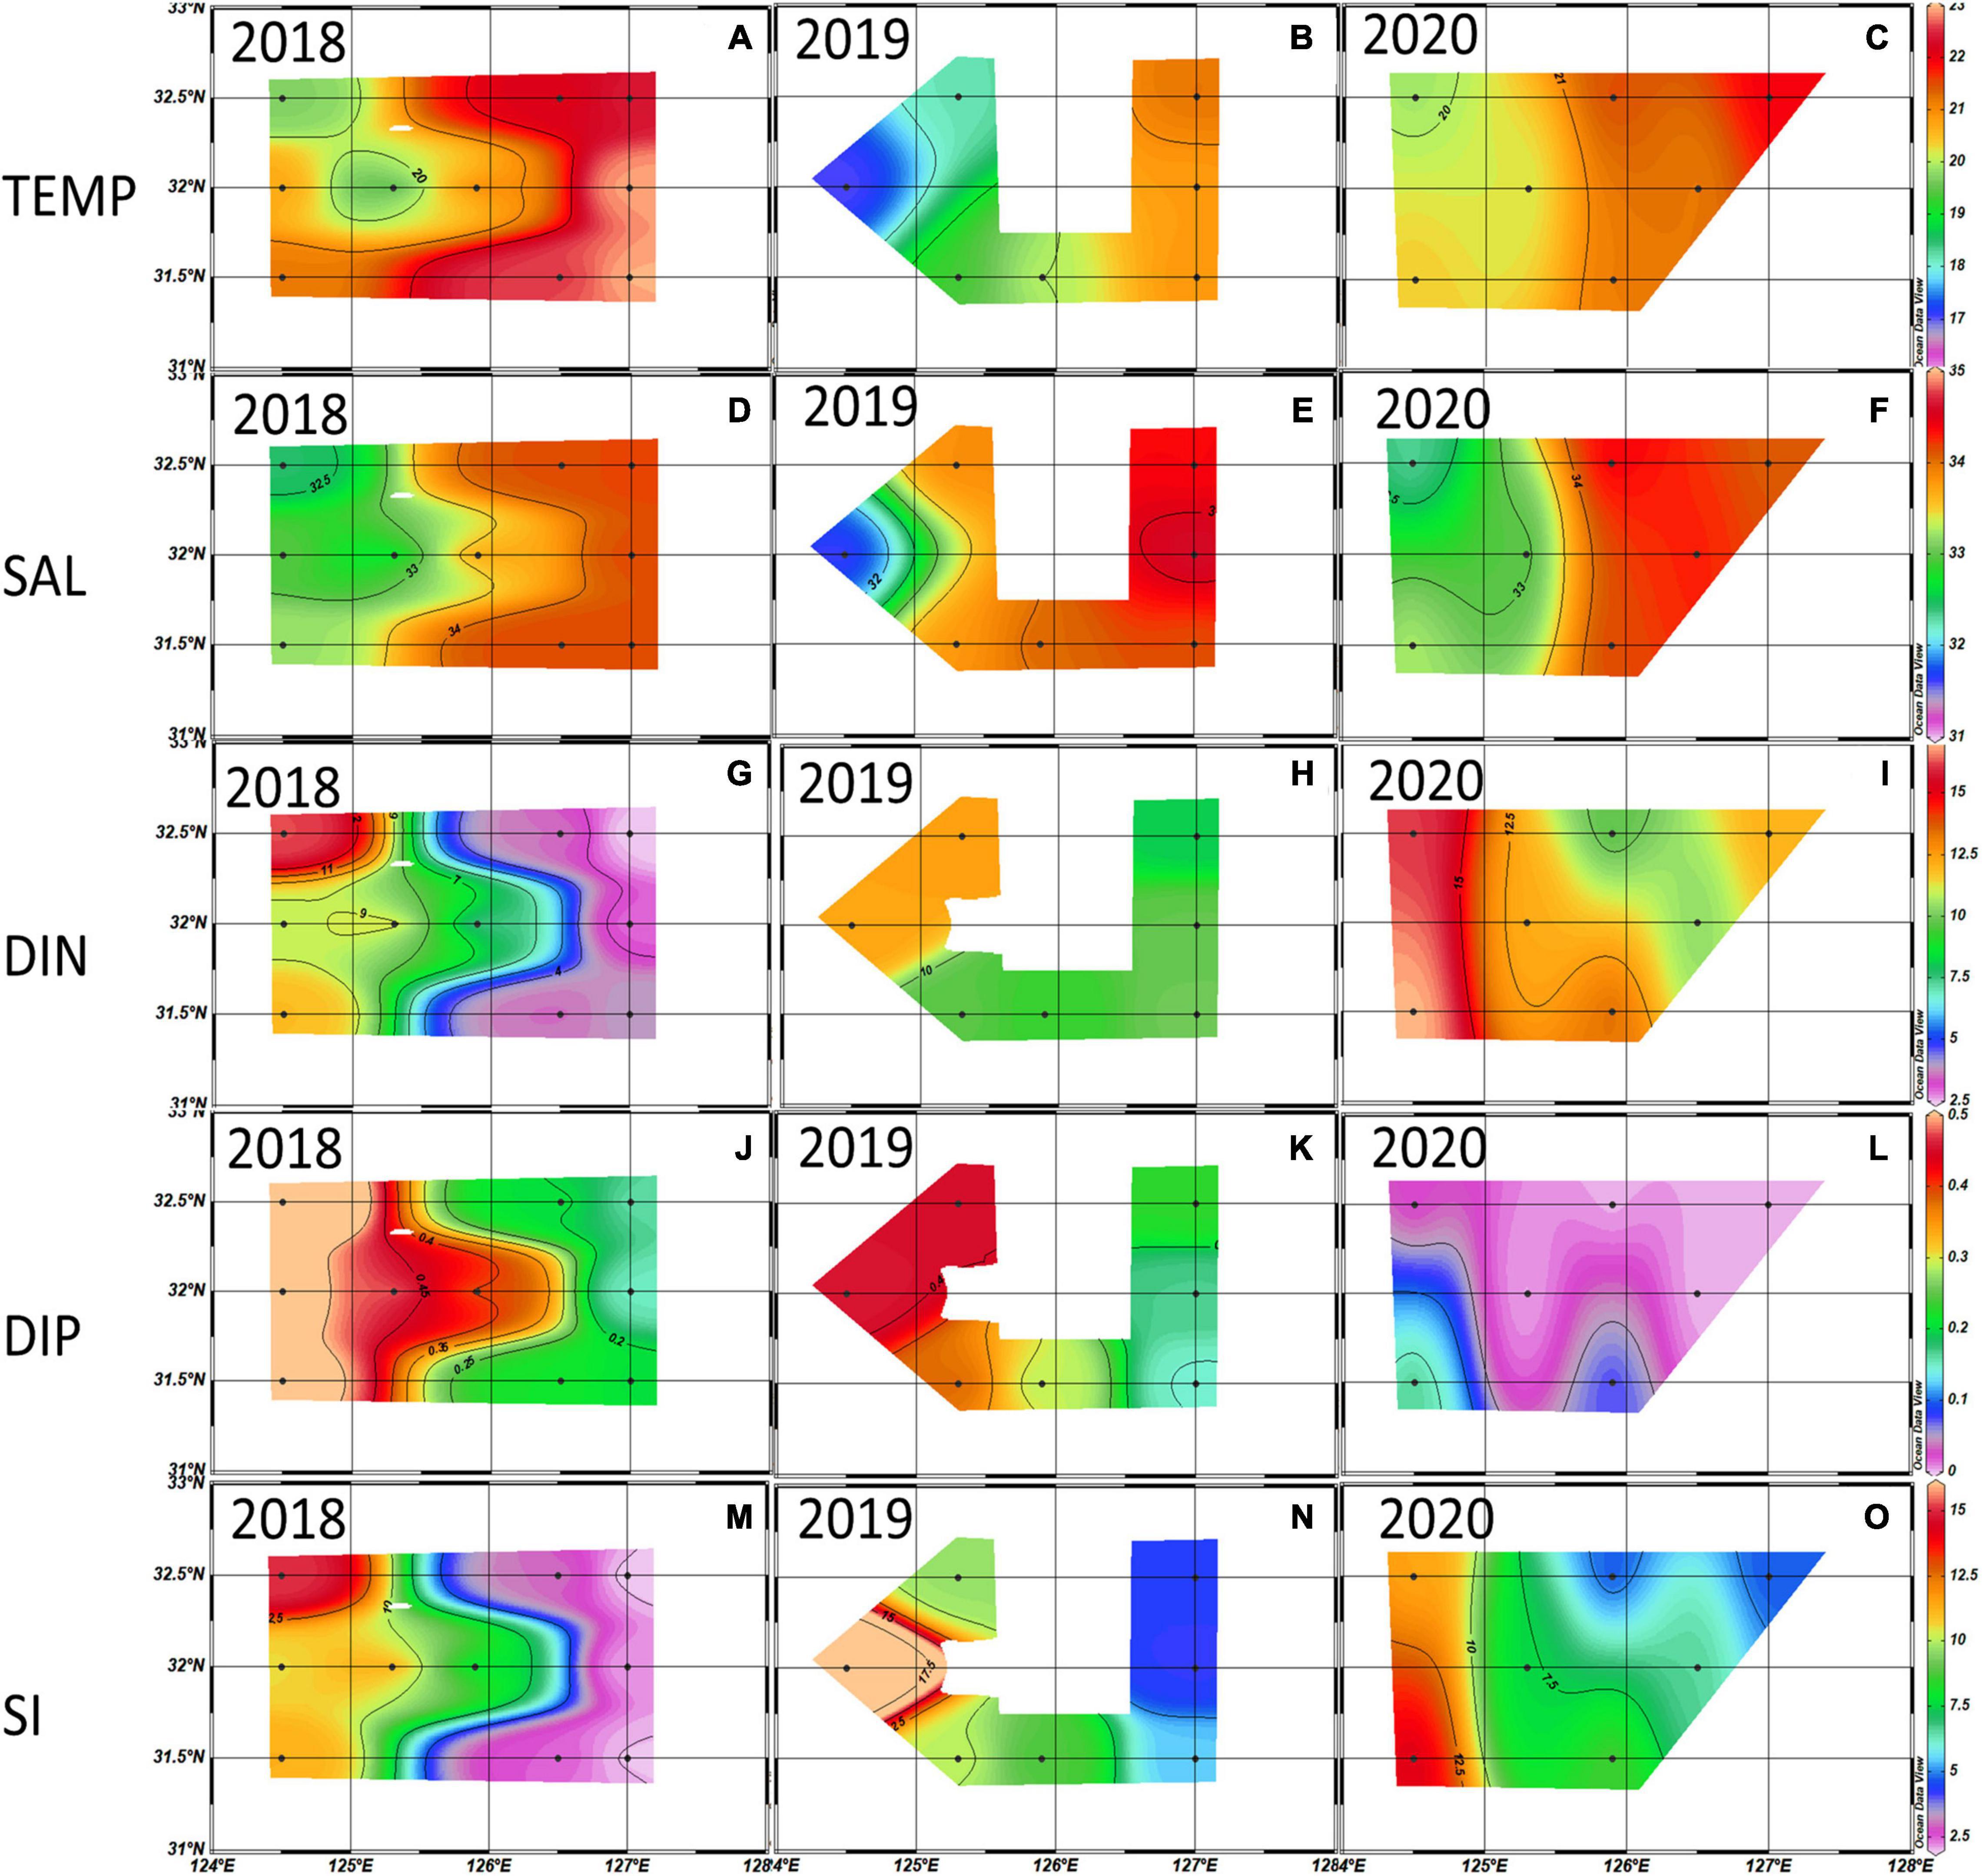
Figure 6. Distributions of temperature (°C) (A–C), salinity (‰) (D–F), dissolved inorganic nitrogen (DIN) (μM) (G–I), dissolved inorganic phosphate (DIP) (μM) (J–L), and Si (μM) (M–O) averaged from the euphotic depth (100%, 30%, and 1%) in 2018∼2020 autumn. Black dots are the sampling stations.
Phytoplankton Biomass Distribution and Community Structure
From 2018 to 2020, the monthly averaged chlorophyll-a concentration averaged from 100 to 1% light depths was highest in spring and lowest in winter (Figure 7B).
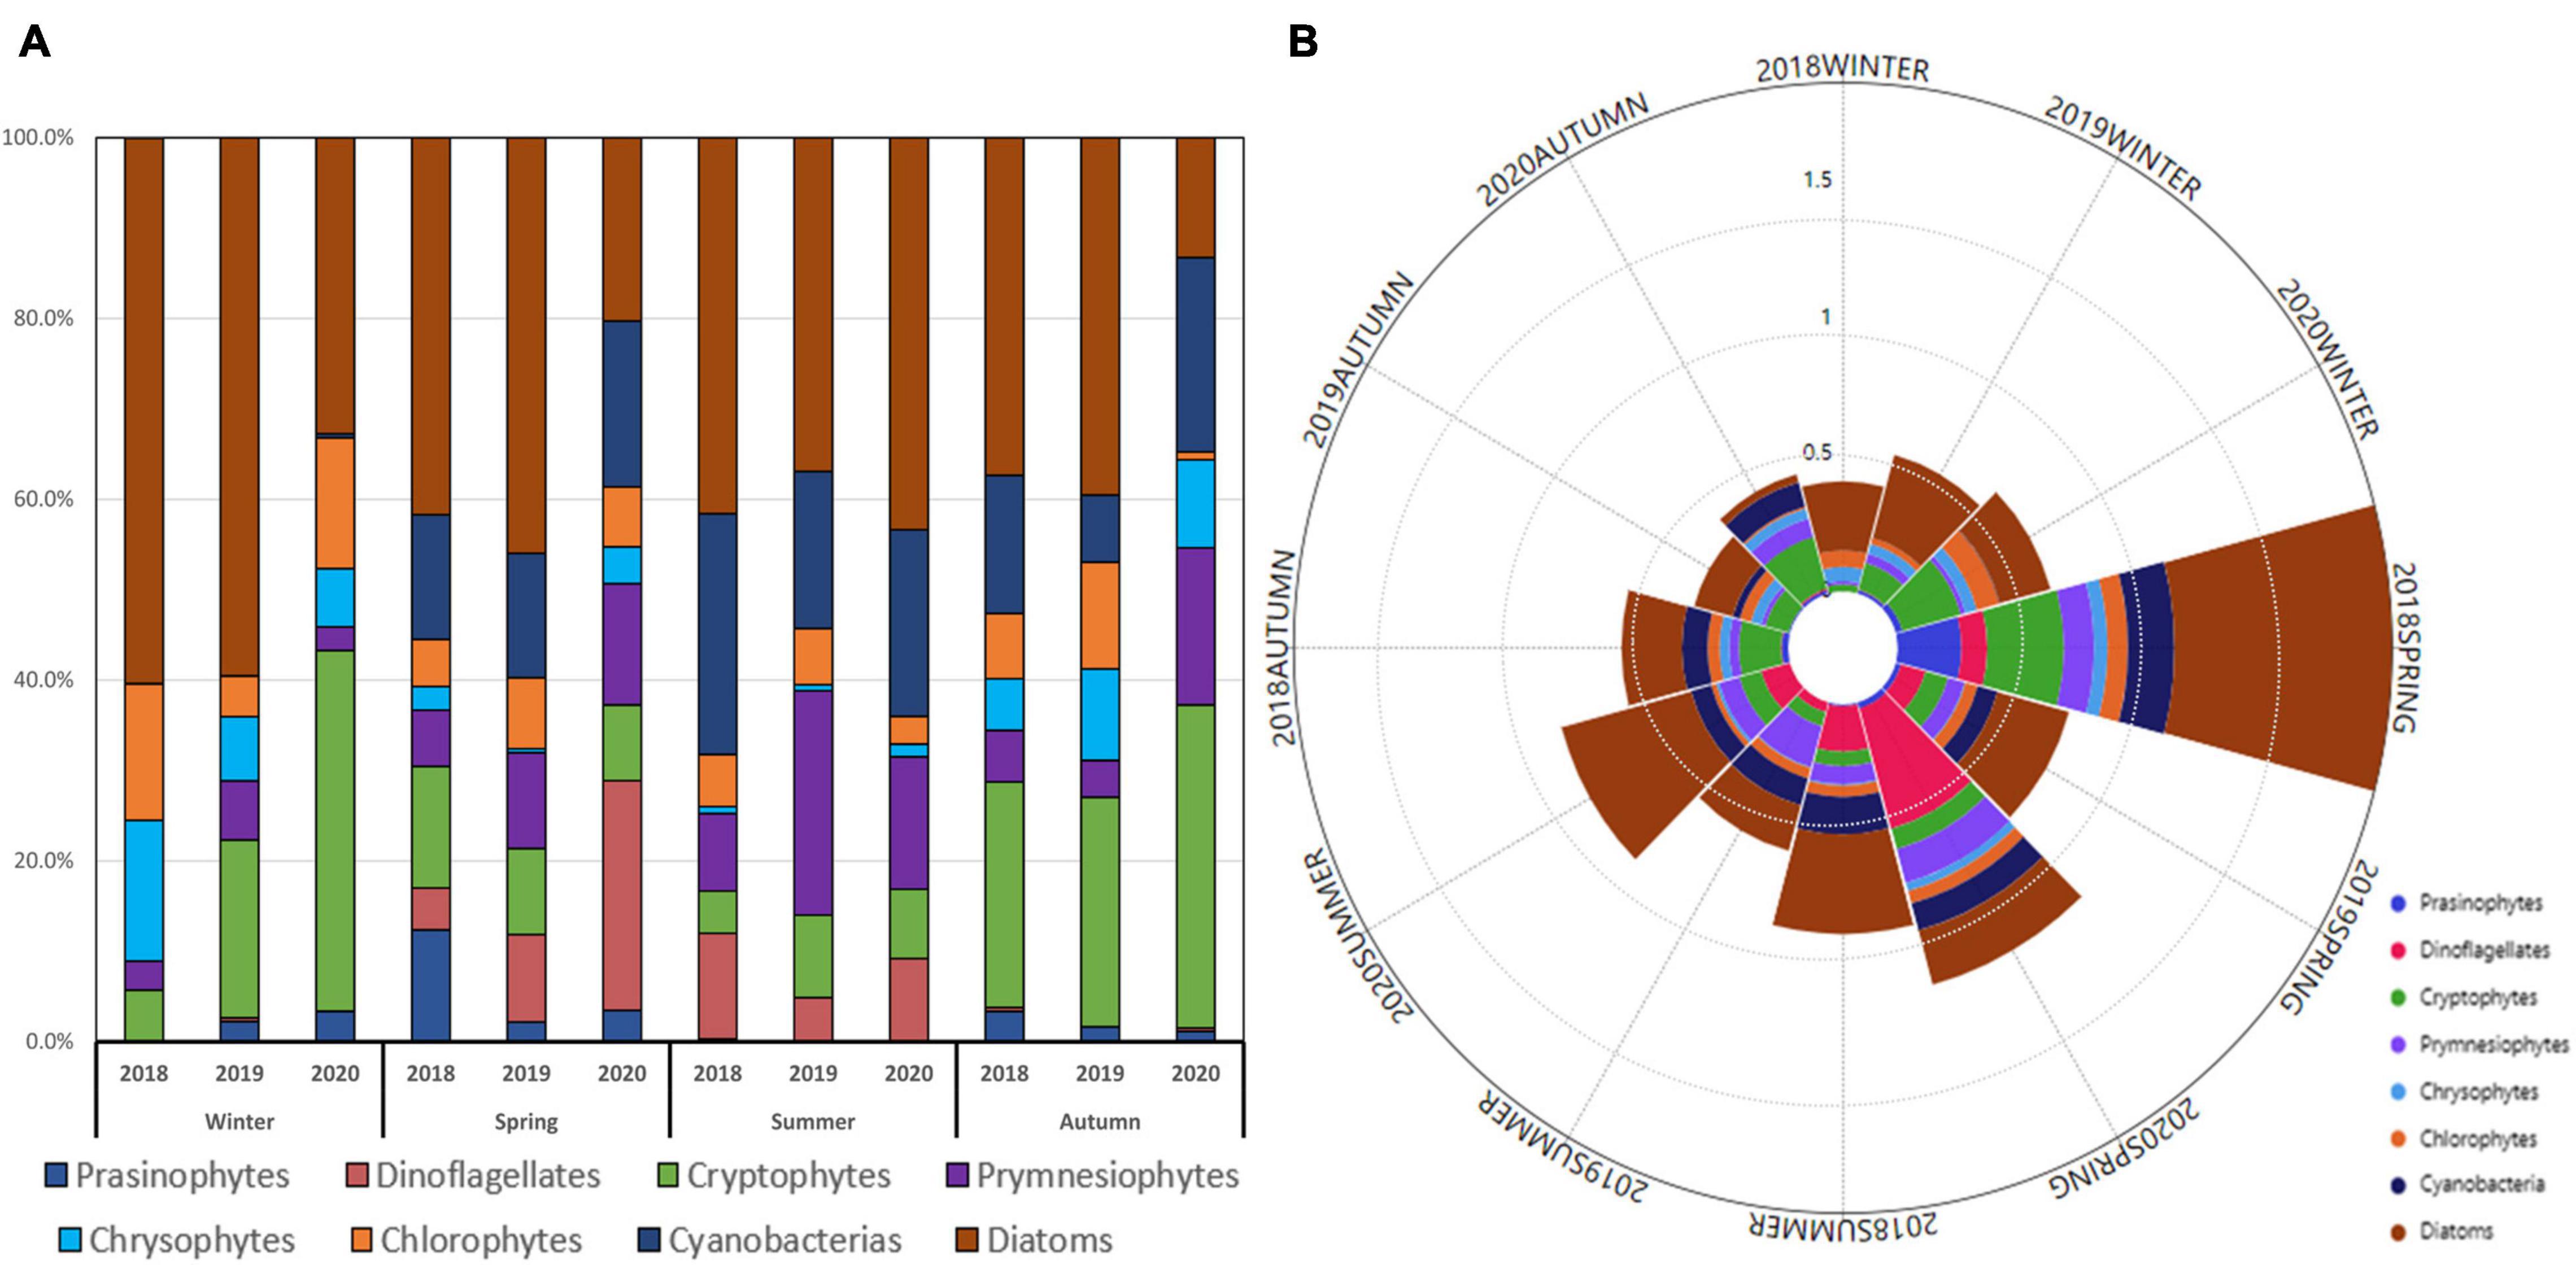
Figure 7. Seasonal contributions of phytoplankton communities (A) and phytoplankton communities and chlorophyll-a concentrations (μg/L) (B) averaged from all the stations for each cruise period in the Northern East China Sea (NECS), 2018∼2020.
The average contributions of different phytoplankton groups in all seasons from 2018 to 2020 were 39.4%, 17.0%, 12.9%, 9.8%, 7.4%, 5.6%, 5.4%, and 2.5% for diatoms, cryptophytes, cyanobacteria, prymnesiophytes, chlorophytes, dinoflagellates, chrysophytes, and prasinophytes, respectively.
The averaged chlorophyll-a concentrations were relatively higher in the winter of 2020 than in 2018 and 2019 (Figure 8). Figure 7 indicates the major phytoplankton community composition. Diatoms were predominant in 2018 (60.3 ± 25%) and 2019 (59.5 ± 13.4%) and decreased by one-third in 2020 (32.8 ± 18%); cryptophytes replaced diatoms as the dominant species (39.9 ± 11%) in winter 2020.
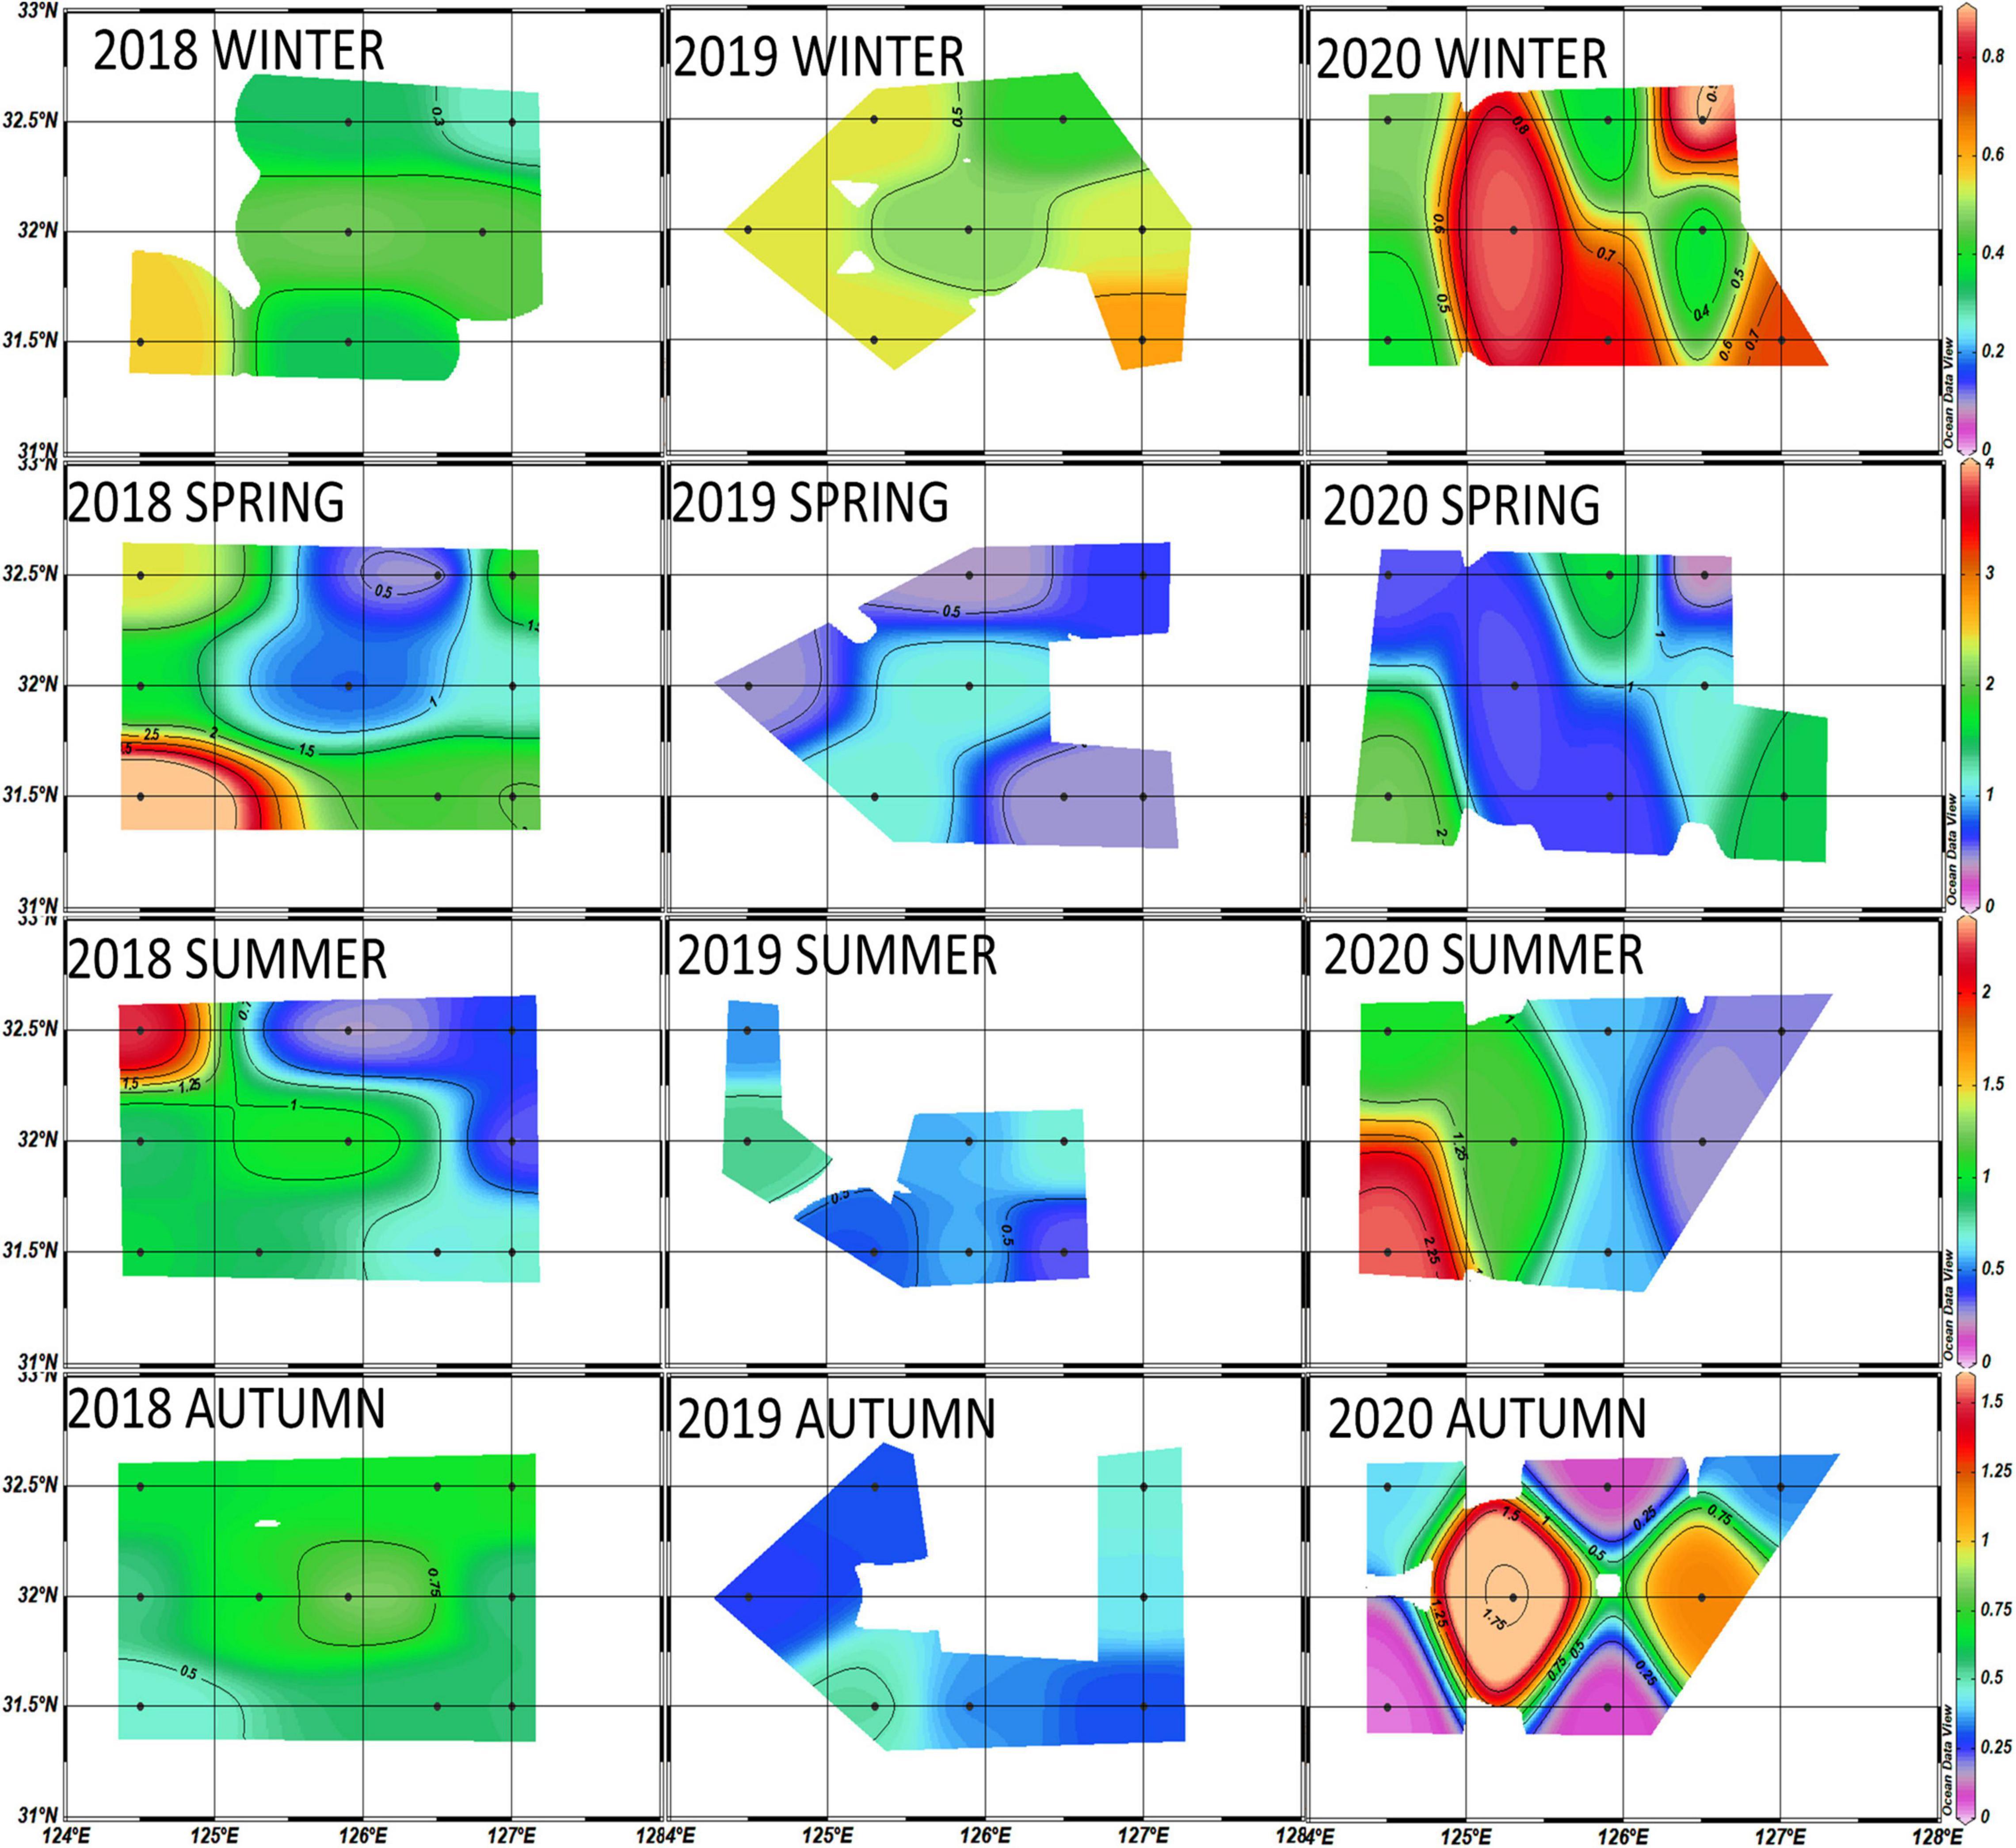
Figure 8. Horizontal distributions of chlorophyll-a concentrations (μg/L) averaged from the euphotic depth (100%, 30%, and 1%) in the Northern East China Sea (NECS), 2018∼2020 all seasons.
In spring, the chlorophyll-a concentration for the entire study area was relatively higher in 2018 than in 2019 and 2020 (Figure 7B), and the highest concentrations of chlorophyll-a (>4 μg L–1) from 2018 to 2020 were observed at the westernmost site (317-21) in spring 2018. Diatoms were the dominant species in 2018 (41.7 ± 24%) and 2019 (46 ± 20%) but dropped significantly in 2020 (20 ± 12%) when dinoflagellates (25 ± 22%) predominated in 2020 (Figure 7A).
Noticeable differences in chlorophyll-a concentrations between the eastern and western parts were observed in the summers of 2018 and 2020 (Figure 8). Diatoms predominated in the entire NECS in 2018 (41.6 ± 24%), 2019 (36.9 ± 26%), and 2020 (43 ± 29%) (Figure 7A). In the westernmost part of the study area (including sites 315-21, 316-21, and 317-21), significantly more diatoms were observed in 2020 (74 ± 20%) than in 2018 (43.6 ± 18%) and 2019 (41.3 ± 27%). Vertically, diatoms were mainly distributed at 1% light depths in the first two years and moved up to 100% and 30% light depths in 2020 (Figure 9).
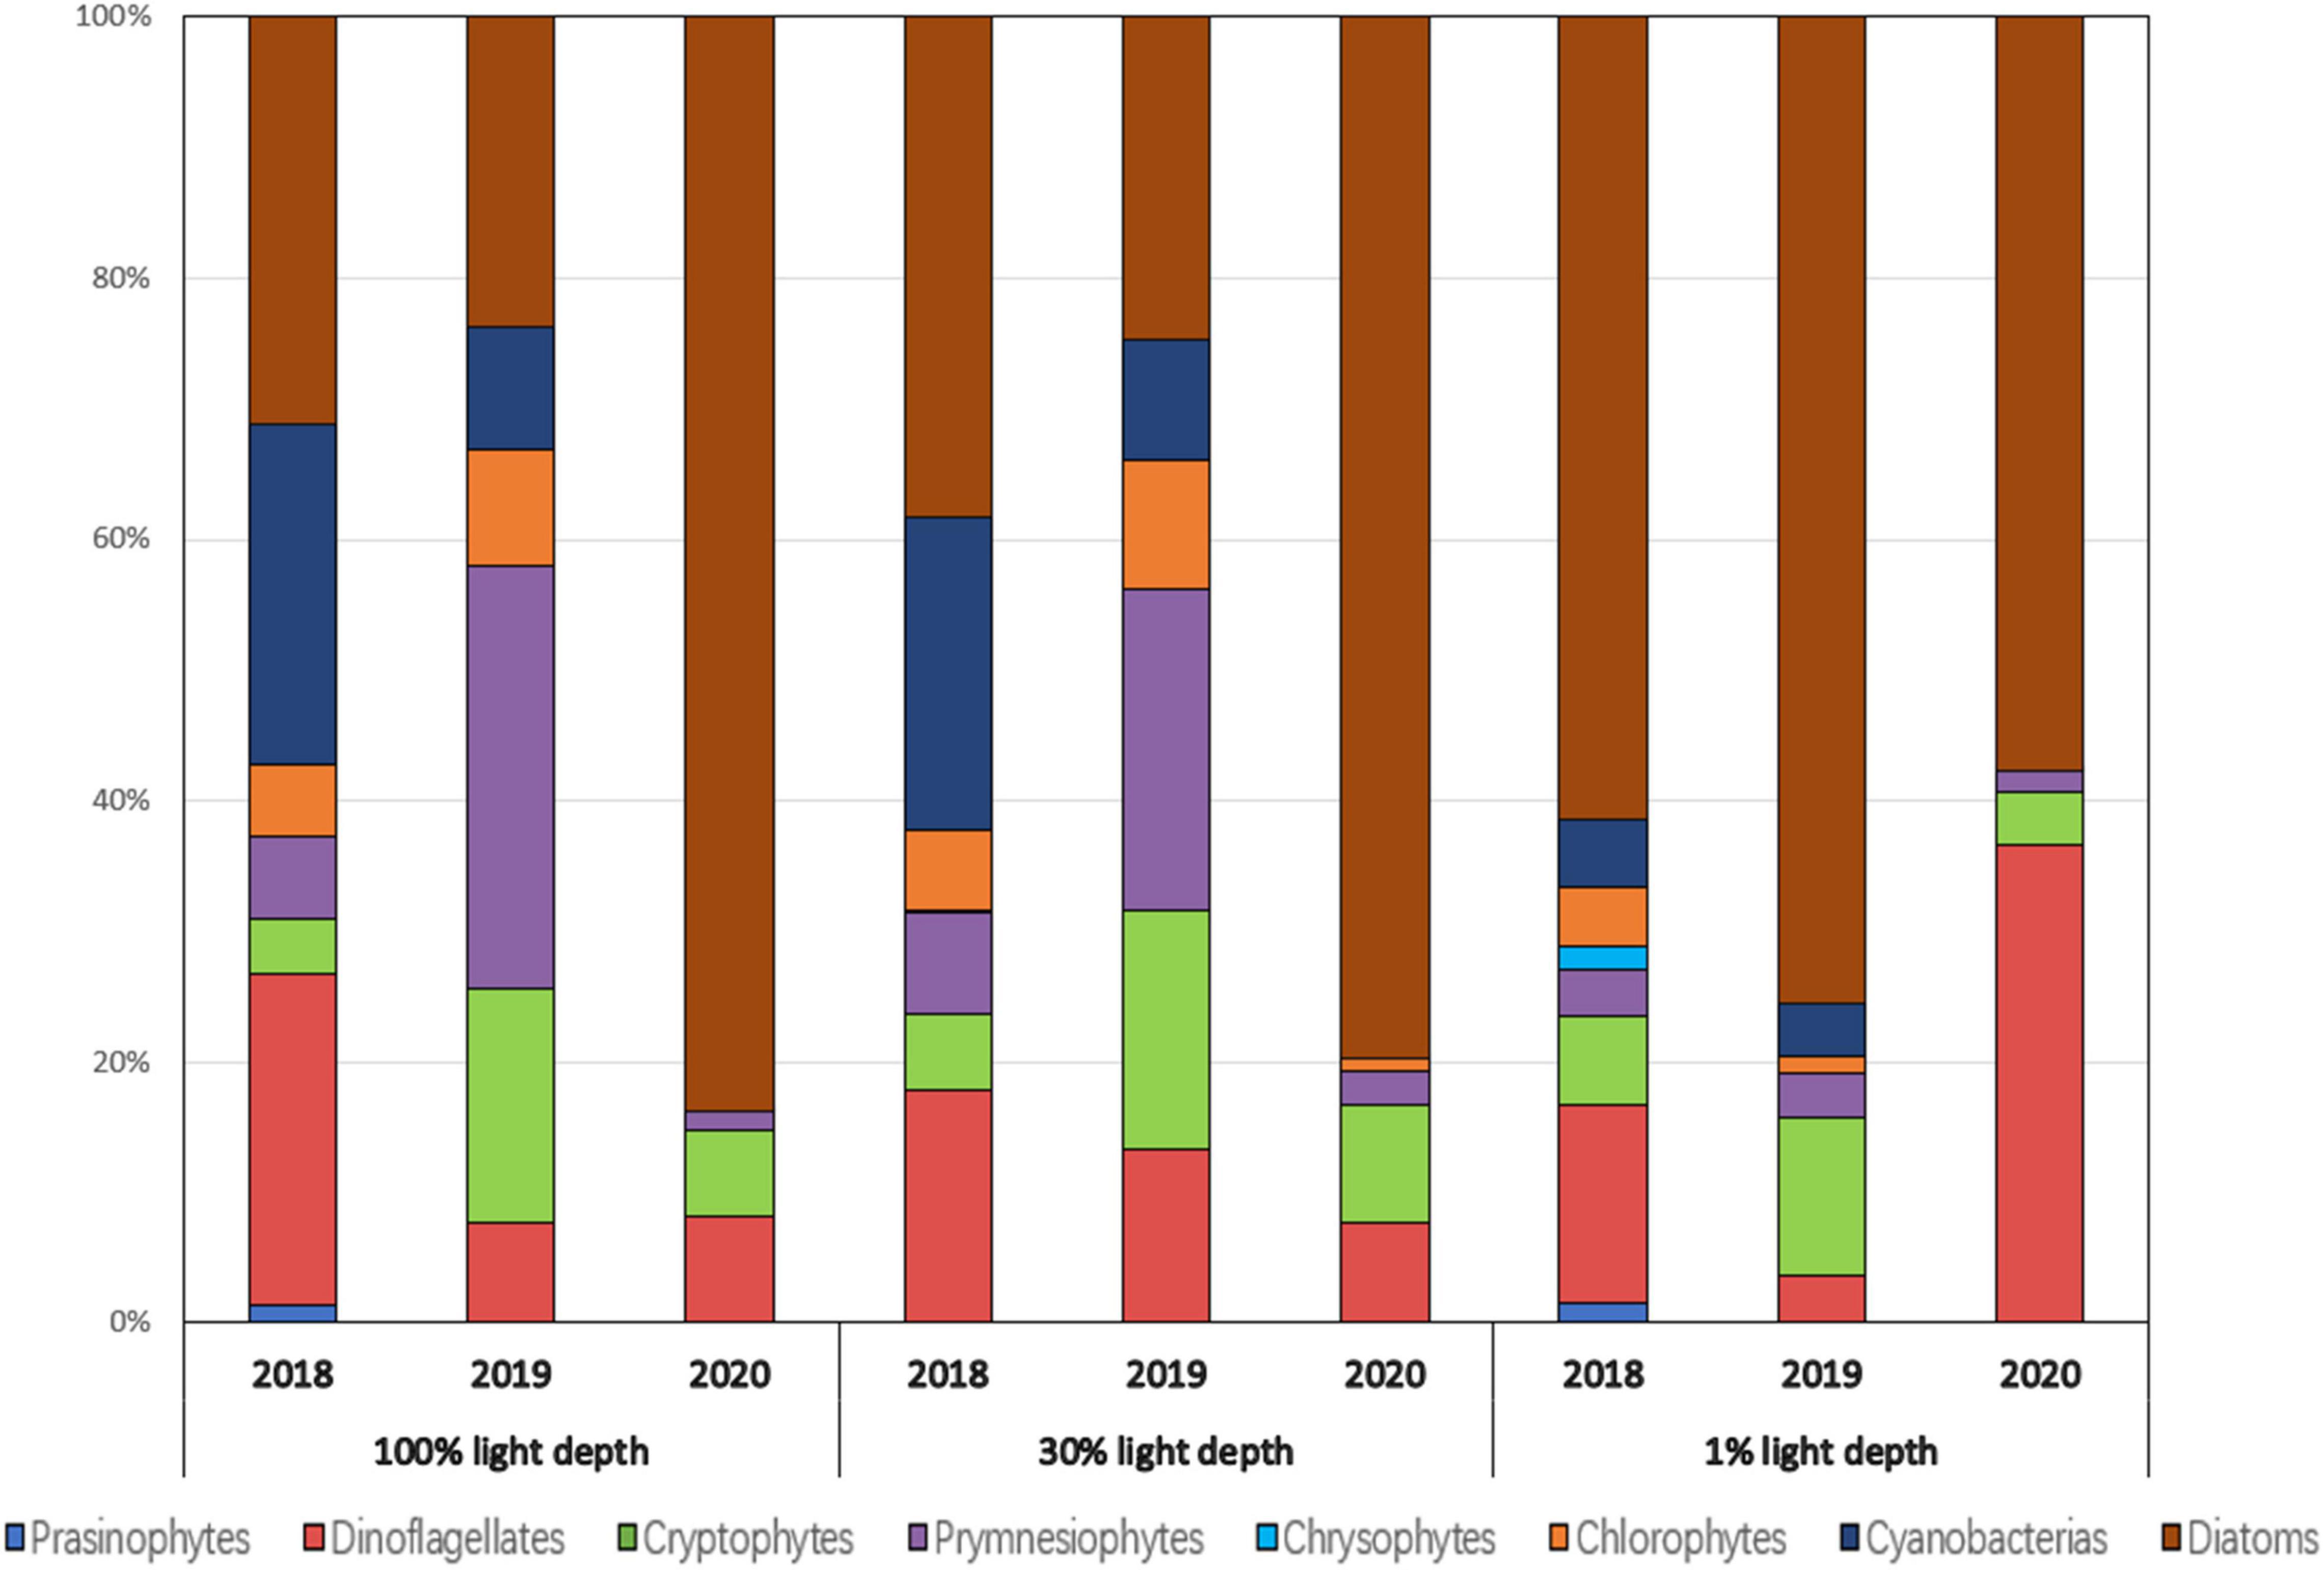
Figure 9. Contributions of phytoplankton communities averaged from the euphotic depth (100%, 30%, and 1%) from the stations (including sites 315-21, 316-21, and 317-21) in the westernmost part of the Northern East China Sea (NECS), 2018∼2020 summer.
For autumn from 2018 to 2020, the highest chlorophyll-a concentrations (> 1 μg L–1) were observed at 30°N latitude in autumn 2020 (Figure 8). Diatoms, as the dominant species in 2018 (37.3 ± 29%) and 2019 (39.5 ± 24%), decreased significantly in 2020 (13.3 ± 13%) and were replaced by cryptophytes (35.7 ± 18%). Cyanobacteria (21.5 ± 9%) and prymnesiophytes (17.4 ± 6%) also showed a sharp increase and became the second and third most dominant species during autumn 2020 compared to those in the previous two years (Figure 7A).
Relationship Between Phytoplankton Biomass and Environmental Factors
The correlation coefficients between the major phytoplankton communities and environmental drivers for each season are presented in Figure 10.
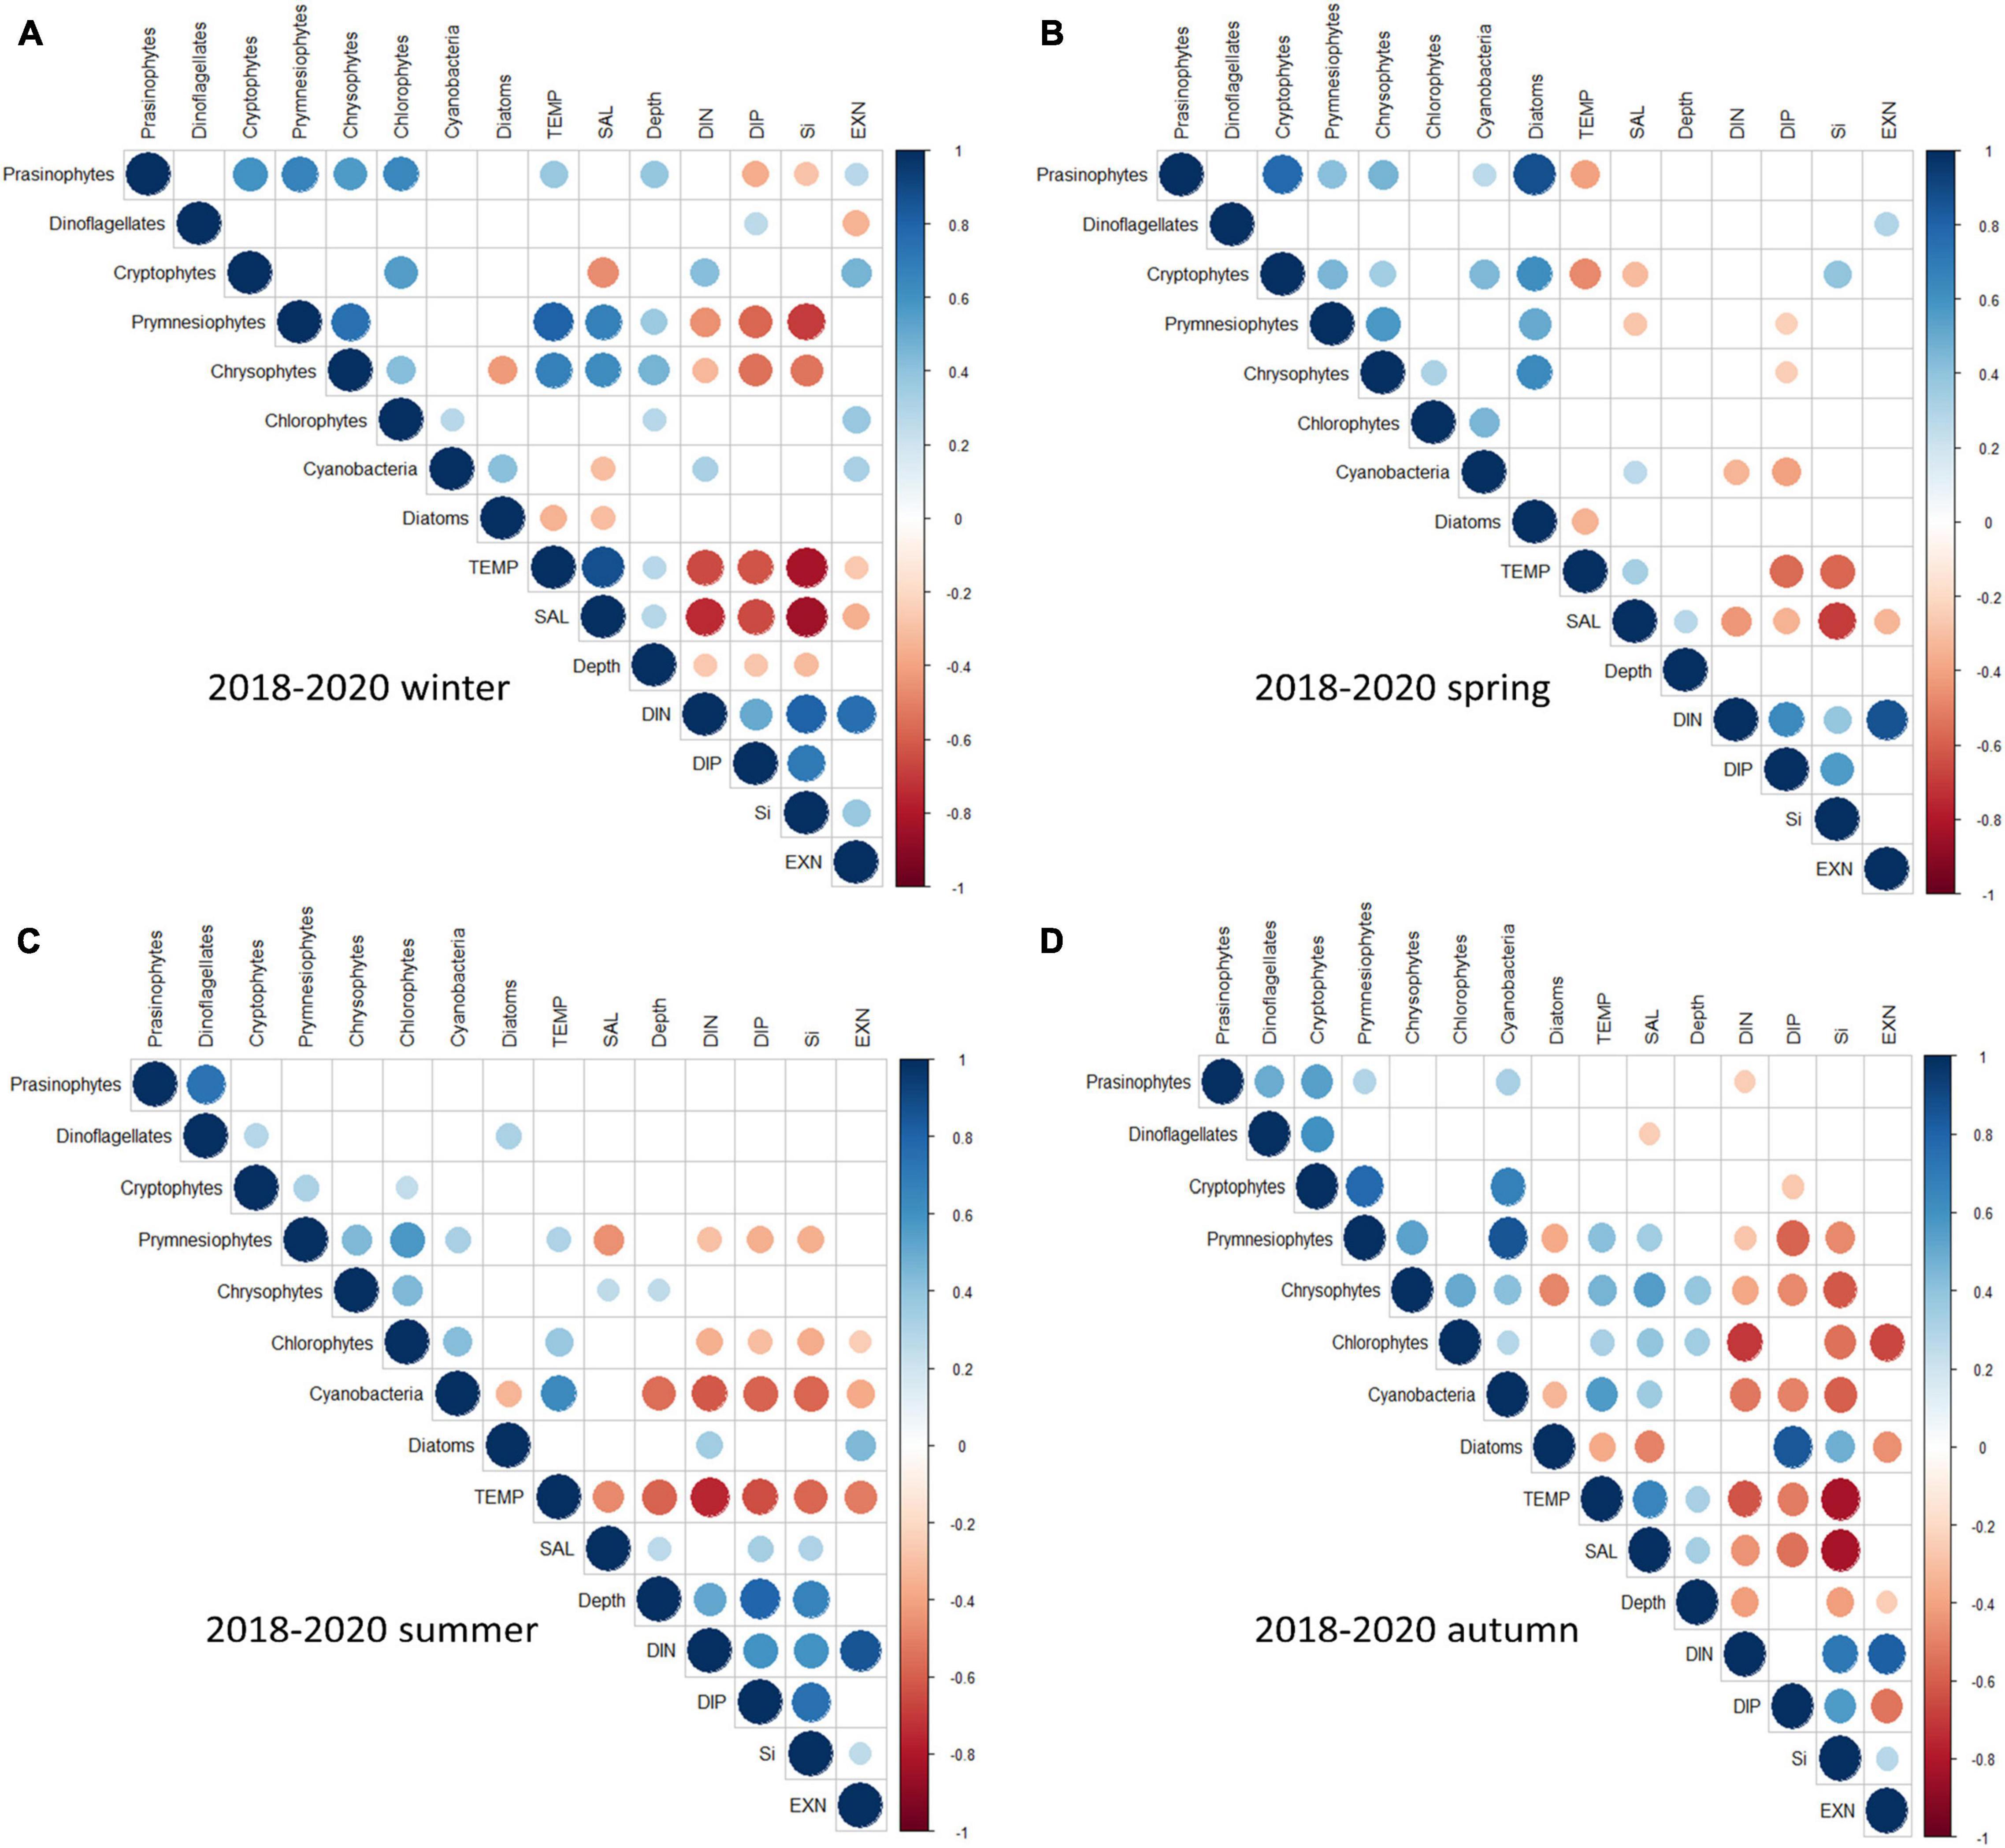
Figure 10. Heatmap of the correlation coefficients between the major phytoplankton communities and environmental drivers each cruise period in the Northern East China Sea (NECS), 2018∼2020 (A) winter (B) spring (C) summer (D) autumn. Only significant coefficients and absolute correlation coefficients (if >0.10) are indicated. The size of a circle indicates the absolute correlation coefficient.
In winters, 2018–2020, diatoms showed weak negative correlations with temperature (r =–0.34, P < 0.01, n = 59) and salinity (r =–0.31, P < 0.05, n = 59), whereas cryptophytes had positive correlations with DIN (r = 0.43, P < 0.001, n = 59) and ExN (r = 0.46, P < 0.001, n = 59) and negative correlations with salinity (r =–0.47, P < 0.001, n = 59) (Figure 10A). In spring, diatoms showed weak negative correlations with temperature (r =–0.34, P < 0.01, n = 71) and had no significant correlation with any nutrient driver, whereas dinoflagellates had weak positive correlations with ExN (r = 0.29, P < 0.05, n = 71) (Figure 10B). In summer, cyanobacteria had a positive correlation with temperature (r = 0.64, P < 0.001, n = 69) and negative correlations with all nutrients (–0.65 < r <–0.55, P < 0.001, n = 69) and depths (r =–0.56, P < 0.001, n = 69). Prymnesiophytes had similar correlations with environmental drivers, except depth and ExN. In comparison, diatoms had positive correlations with DIN (r = 0.34, P < 0.01, n = 69) and ExN (r = 0.45, P < 0.001, n = 69) (Figure 10C). In autumns, 2018–2020, diatoms showed strong positive correlations with DIP (r = 0.84, P < 0.001, n = 67) and SiO2 (r = 0.49, P < 0.001, n = 67), and negative correlations with temperature (r =–0.37, P < 0.01, n = 67), salinity (r =–0.5, P < 0.001, n = 67) and ExN (r =–0.46, P < 0.001, n = 67). In comparison, cyanobacteria and prymnesiophytes had negative correlations with all nutrients (–0.59 < r <–0.27, P < 0.05, n = 67) and positive correlations with temperature (r = 0.56 and 0.41, P < 0.001, n = 67) and salinity (r = 0.35 and 0.34, P < 0.05, n = 67). Cryptophytes had a weak negative correlation with DIP (r =–0.27, P < 0.05, n = 67) and strong positive correlations with prymnesiophytes (r = 0.73, P < 0.001, n = 67) and cyanobacteria (r = 0.67, P < 0.001, n = 67) (Figure 10D).
In GAMs, the phytoplankton species that had high interannual changes in the phytoplankton communities among these three years were compared separately according to season. Only data with significant differences (p < 0.01, t-test) after fitting with GAMs were used to ensure high accuracy of the comparison between phytoplankton species and environmental factors. The results indicated that the contribution of diatoms to chlorophyll-a increased significantly (p < 0.01, t-test) with DIP concentration in autumn and winter from 2018 to 2020, while cryptophytes did not show a clear trend. The intersection of the diatom and cryptophyte contribution curves occurred when the DIP concentration was between 0.2 and 0.3 μM. The effects of ExN on the contributions of diatoms and cryptophytes also showed a difference, although both of them had wide 95% confidence intervals when ExN < 0 μM. Cryptophytes increased (p < 0.01, t-test) and diatoms decreased (p < 0.01, t-test) with an increase in ExN in the overall trend, which became obvious after ExN > 8 μM (Figures 11A,B).
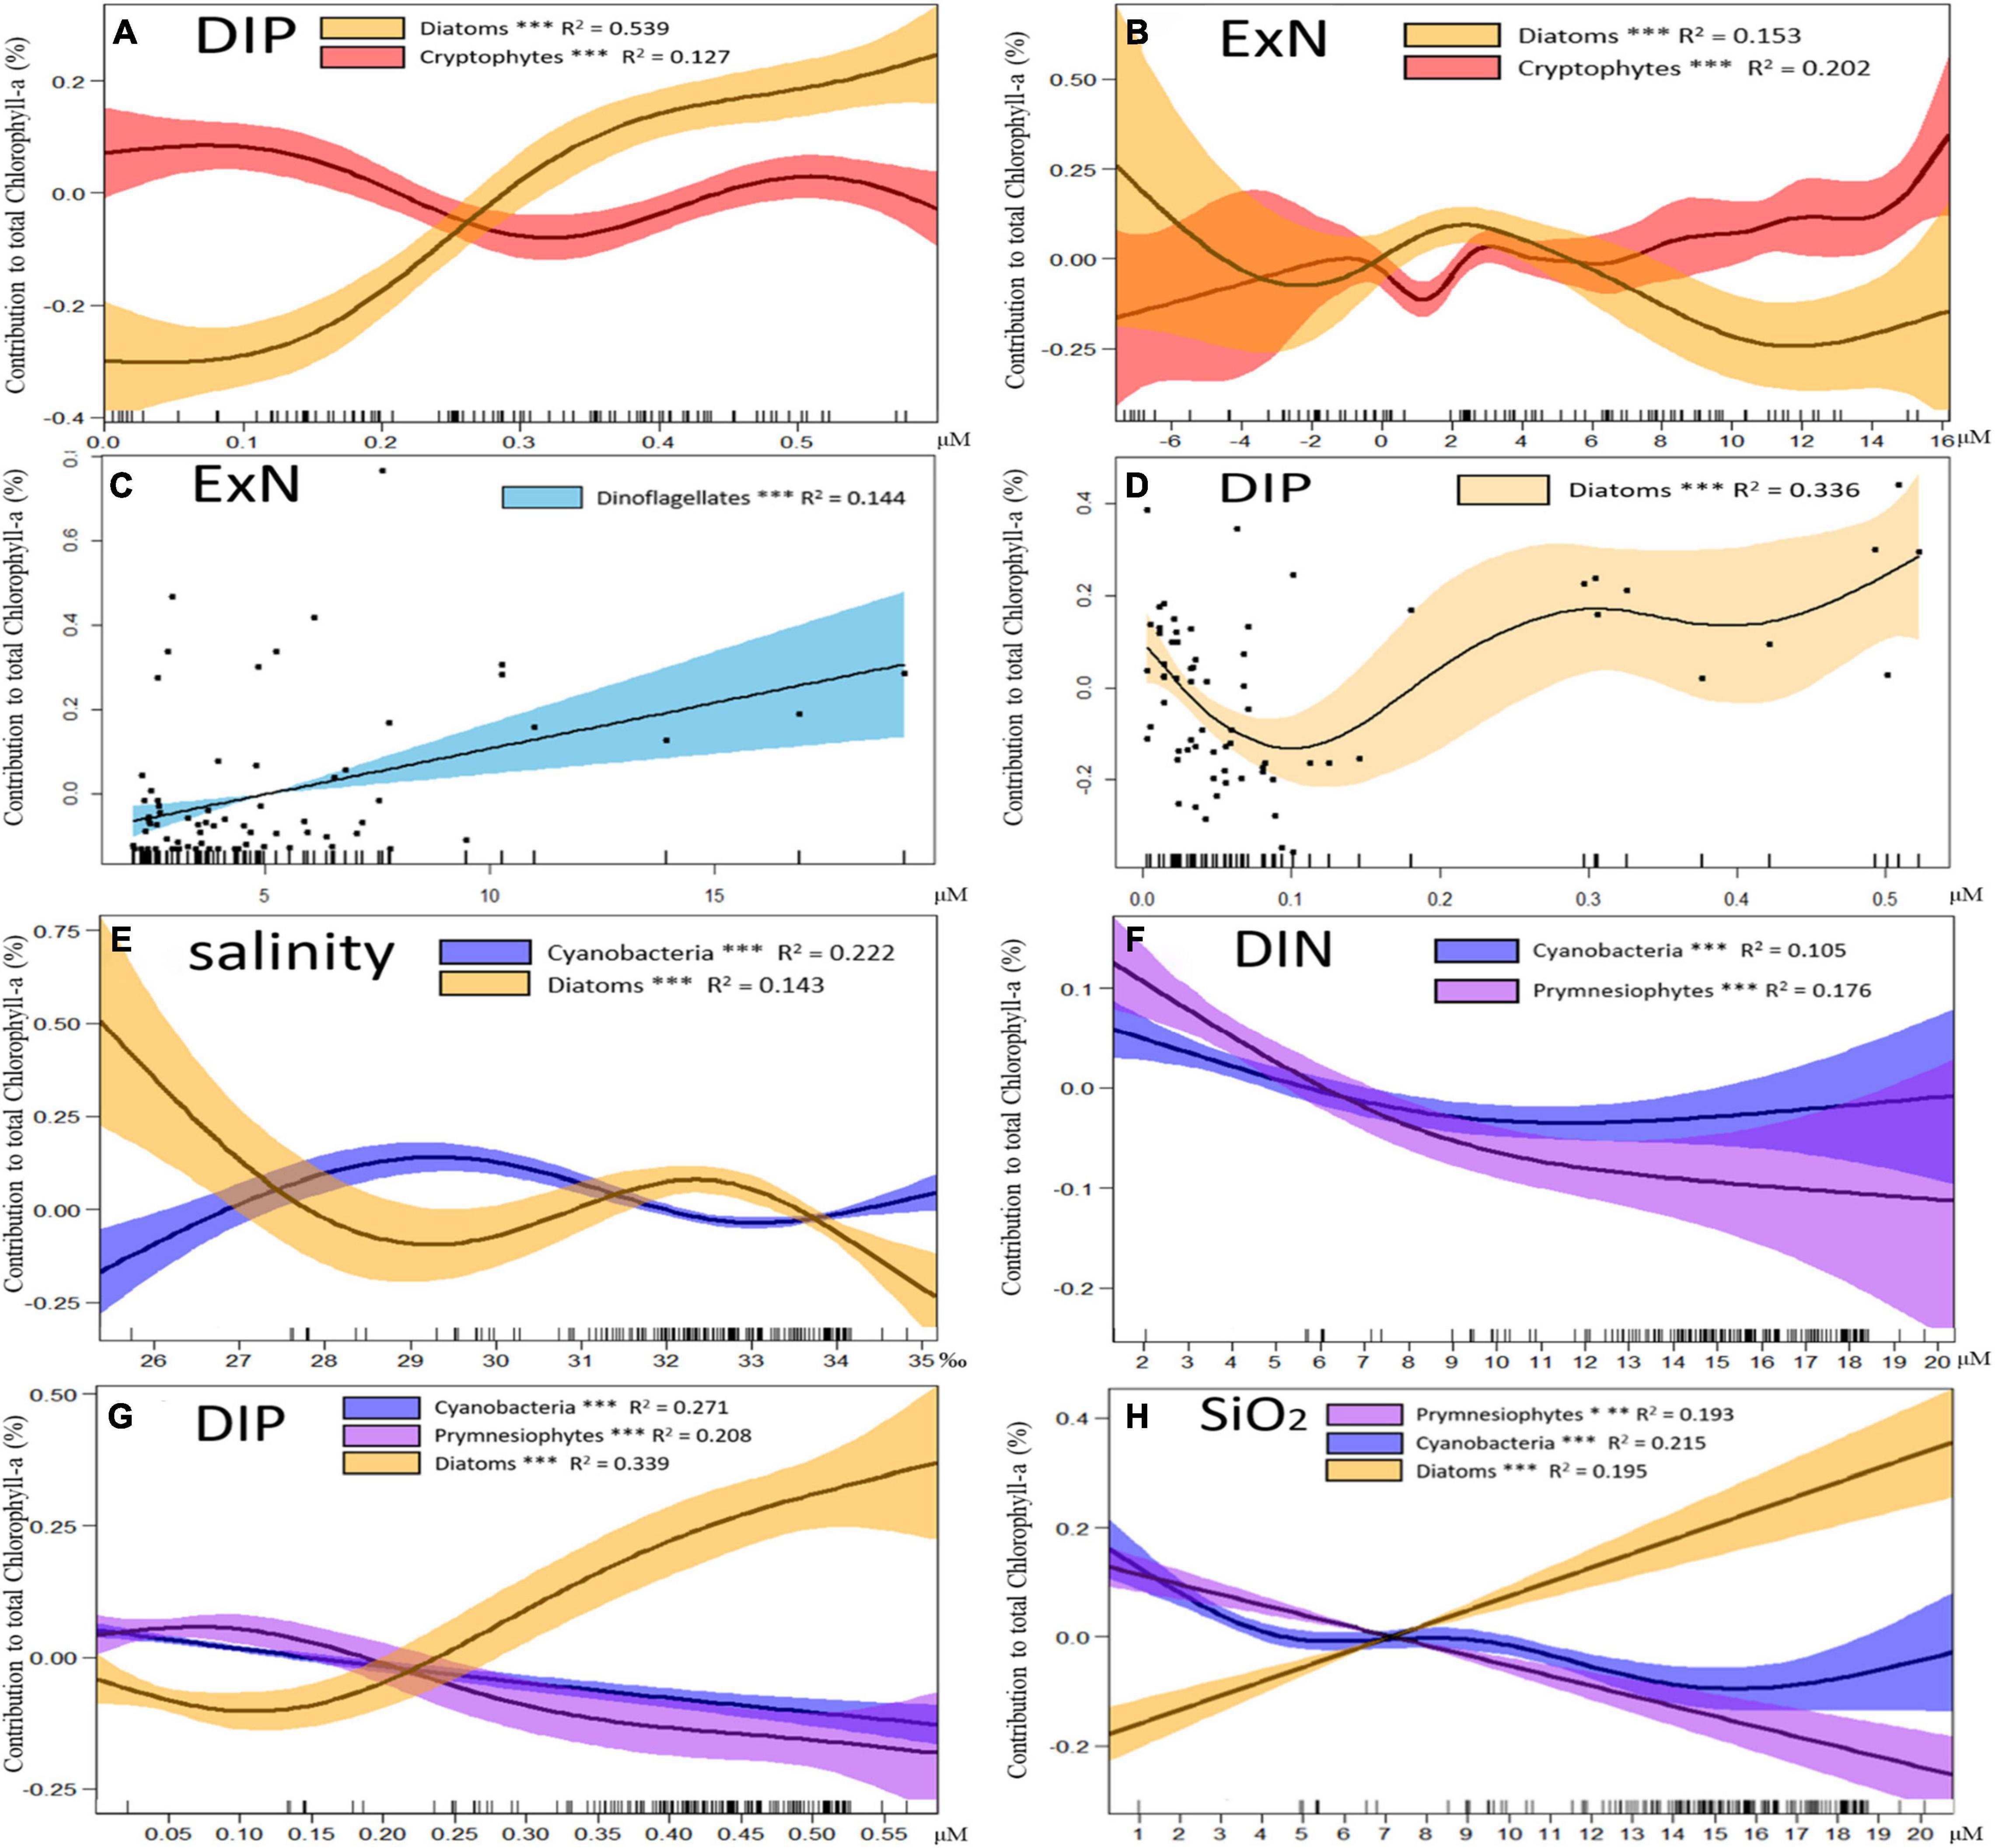
Figure 11. Results of generalized additive models (GAMs) describing the contributions of major phytoplankton to chlorophyll-a with environmental factors in different seasons. Changes in cryptophyte and diatom contributions with (A) dissolved inorganic phosphate (DIP) and (B) excess nitrate (ExN) in 2018∼2020 autumn and winter. Changes in dinoflagellate and diatom contributions with (C) ExN and (D) DIP in the 2018∼2020 spring. Changes in diatom cyanobacteria and prymnesiophyte contributions with (E) salinity, (F) dissolved inorganic nitrogen (DIN), (G) DIP, and (H) SiO2 in 2018∼2020 spring, summer, and autumn in the Northern East China Sea (NECS). The contributions of different phytoplankton communities to chlorophyll-a are plotted as differences between concentrations and mean values (Y axis). Solid lines with significant relationships (p < 0.01) represent smoothing lines from GAMs, and shaded areas indicate 95% confidence intervals. The inward tick marks on the X axis and points in (C) and (D) show data distributions.
In the spring of 2018–2020, the contribution of dinoflagellates only had a positive correlation (p < 0.01, t-test) with ExN, and diatoms were the most correlated with DIP concentrations among all the environmental factors. The diatom contribution decreased significantly (p < 0.01, t-test) when the DIP concentration was low (0–0.1 μM) but increased when DIP > 0.1 μM (Figures 11C,D).
The contributions of diatoms, cyanobacteria, and prymnesiophytes had large annual and seasonal variations in all seasons except winter in 2018–2020 (Figure 8A). Relatively high cyanobacterial contributions occurred within the salinity range of 28–31 ‰, whereas the correlation between salinity and diatoms was negative (Figure 11E). The contributions of cyanobacteria and prymnesiophytes showed the same patterns, which were negatively correlated with all nutrients, and the decline in the contribution of prymnesiophytes occurred with an increase in DIN, DIP and Si concentrations and was greater than that of cyanobacteria. The diatom contribution to chlorophyll-a increased with increasing DIP and Si concentrations (Figures 11E–H).
Discussion
Previous Studies and a New Method
The NECS is a highly dynamic sea that receives strong influences from several different hydrographic waters. Previous studies have proved that the main nutrient sources in the NECS are KW, TWCC (extension of Taiwan Strait Current), and CDW (Chen and Wang, 1999; Chung et al., 2001; Zhang et al., 2007; Guo et al., 2013) (Figure 1). Yellow Sea Cold Water is mainly observed at the bottom layer (> 50 m) in summer in the NECS, YSCW is characterized by low temperature (< 14.5°C), but its N:P ratio of 16 is not different from general seawaters (Gong et al., 1996; Yoon et al., 2015). Changjiang River Diluted Water is the main source of low salinity water input from the western surface layer in the ECS, increasing from spring and being highest in summer (Zuo-sheng et al., 1983). The N/P ratio of CDW is around 100 to 200 or even higher, which is much higher than the bio-utilization ratio of 16 (Li et al., 2007; Zhang et al., 2007). The excess nitrate from Changjiang (Yangtze) River makes the ECS a P-limited environment (Huang et al., 2019). TWCC flows into the ECS from the surface layer like the CDW. It was observed at 0∼30 m depth in summer and 0∼50m depth in autumn, respectively (Yoon et al., 2015). The DIN and Si transport in TWCC is of the same order as those from the CDW, but the DIP transport is much higher in TWCC than CDW (Huang et al., 2019). Kuroshio Water flows into the ECS through the eastern part of Taiwan Island and moves northeast along the continental shelf to 30°N latitude (Yoon et al., 2015). Kuroshio Water is characterized by high salinity and high nutrient concentration, but its input does not resolve the P-limiting problem in the ECS because its N:P ratio is close to 16 (Chen et al., 1995; Huang et al., 2019). These water masses provide most of the nutrients for the growth of phytoplankton in the NECS (Furuya et al., 2003; Chen, 2009).Therefore, separate analyses after dividing water masses according to temperature and salinity, have become mainstream in previous studies in the ECS (Guo S. et al., 2014; Yoon et al., 2015; Liu et al., 2018; Xu et al., 2019). This approach led to ideal results for short-term seasonal variations in phytoplankton community structure (Liu et al., 2016; Kim et al., 2020) and the long-term interannual variations in summer when the water mass was well stratified (Xu et al., 2019). However, the different water mass-based analyses were not applicable to this study because in all of the seasons, except summer, the water column was mixed during this study period from 2018 to 2020. Therefore, the goal of this study was to (I) analyze the horizontal distributions of all environmental factors (including temperature, salinity, DIN, DIP, and Si concentrations) and chlorophyll-a concentrations based on seasonal observations from 2018 to 2020 in the NECS, (II) find independent relationships between chlorophyll-a concentrations of all phytoplankton communities that were calculated by the CHEMTAX program and the environmental factors at all light depths using correlation heatmaps, and finally (III) establish GAMs for understanding the relative contributions of particular phytoplankton groups responding to the environmental factors. The influences of environmental factors on the distributions of phytoplankton communities are discussed in the following sections.
Interannual Variations in the Major Phytoplankton Groups in the Northern East China Sea
Diatoms and Cryptophytes
Diatoms and cryptophytes were the dominant species in autumn and winter during this study period. The contribution of cryptophytes always increased markedly with decreasing diatoms, which was most obvious in winter 2020 (Figure 7A). Both diatom concentration and their contribution to total chlorophyll-a were greatly decreased in the winter and autumn of 2020 (Figure 7B). Analysis of the interannual variations in total chlorophyll-a concentration show that high chlorophyll-a concentrations were found in the entire study area in winter 2020 and at 30°N latitude in autumn 2020 (Figure 8), when the phytoplankton communities mainly consisted of cryptophytes. The regions where cryptophytes replaced diatoms as the dominant species were characterized by high DIN and low DIP concentrations (Figures 2I,L, 6I,L, 8), which was also verified in correlation analysis (Figures 10A,D). In GAMs, cryptophytes were significantly higher than their average contribution rates when ExN > 8 μM, while diatoms began to decline sharply (Figure 10B). Previous studies have suggested that CDW is the main reason for the DIP-limited conditions in spring and summer in the ECS because DIP is rapidly consumed by phytoplankton blooms from the Changjiang Estuary (Wang and Wang, 2007; Chen, 2008). However, the results of this study indicated that DIP-limited conditions also occurred in the autumn and winter when Changjiang (Yangtze) River discharge is low (Yang et al., 1983). When the DIP concentrations were higher than 0.3 μM, diatoms replaced cryptophytes as the dominant species (Figure 10A).
In previous studies on the phytoplankton community in the ECS, the importance of cryptophytes was usually ignored because of difficulties in identifying cryptophytes to the species level by light microscopy, and the delicacy of their cell structures makes it difficult to fix these cells using standard methods (Mackey et al., 1996). Cryptophytes contribute to total chlorophyll-a concentrations and are mainly distributed in coastal areas of the ECS (Gao and Song, 2005). However, in recent studies, cryptophytes were found in the entire ECS (Liu et al., 2016) and were confirmed as one of the main contributors in autumn and winter 2018 (Kim et al., 2020). In this study, we first observed that cryptophytes replaced diatoms in the NECS and were the dominant species in autumn and winter 2020. This recent pattern could be related to the overall nutrient transitions from N-deficient to P-deficient environmental conditions caused by anthropogenic nitrogen inputs in the NECS observed from 1980 to 2016 (Moon et al., 2021). Our result showed that the P-limitation indicated by ExN > 0 μM existed in all seasons from 2018 to 2020 (Table 3). Previous studies indicated that the effect of macronutrients- N, P, Si limitation on diatoms was particularly obvious, which is mainly manifested as P-limitation in NECS (Wong et al., 1998). This is mainly because diatoms as large cell phytoplankton are typically R-strategists (species tolerant of shear/stress forces in physically disturbed water masses) and tend to have high maximum carbon-specific nutrient uptake rates (Alves-De-Souza et al., 2008; Edwards et al., 2012; Xiao et al., 2018). It makes diatoms growth will greatly be limited under the conditions of nutrient deficiency (Smayda and Reynolds, 2001). Previous studies in NECS indicated that diatom will be limited when ExN values are much higher than 0 μM, which was consistent with our results (Xu et al., 2019; Kim et al., 2020). For cryptophytes, a new study in the Yeongil Bay on the southeastern coast of Korea proved that cryptophytes positively responded to DIN levels and were resistant to P-limitation whereas the dominance of diatoms declined with both DIP and P-limitation, DIN whereas cryptophytes benefited more from increased DIN especially NH4 (Kang et al., 2021). The species research on the two cosmopolitan cryptophytes, Teleaulax amphioxeia, and Plagioselmis prolonga, also proved that their significant correlation with DIN (Altenburger et al., 2020). This study also pointed out that the bloom of these two cryptophytes in the cold season might be because of their phycobiliproteins function as light-harvesting complexes, capturing light energy and transferring it onto the chlorophylls during photosynthesis, This allows they can bloom in temperate winters when the light condition is not good but the inorganic nutrients are abundant (Spear-Bernstein and Miller, 1989; Walter et al., 2017; Altenburger et al., 2020). These two cryptophyte species were observed widely in the ECS in previous studies (Xing et al., 2008; Yoo et al., 2017). A DIP-limited environment could cause diatoms to be at a disadvantage in terms of competition with cryptophytes in cold seasons, while higher DIN concentrations in the NECS may be suitable for cryptophytes. This trend has also been observed in the Gulf of Mexico, which is heavily influenced by human activities, similar to the ECS (Chakraborty and Lohrenz, 2015; Anglès et al., 2019). Therefore, cryptophyte blooms may occur more frequently in the future during autumn and winter.
Diatoms and Dinoflagellates
The phytoplankton communities in spring were mainly dominated by diatoms and dinoflagellates in our study period (Figure 7A). In 2018, the highest concentrations of chlorophyll-a (> 4 μg L-1) were observed in the surface water of the westernmost site (317-21), of which over 50% was contributed by diatoms (Figure 7B). Low salinity water masses (< 32 ‰) were observed at western Station 317-21 in 2020, while DIN levels throughout the study area were higher in 2020 than in 2018 and 2019 (Figure 3). In addition, dinoflagellates replaced diatoms as the dominant species at all stations with high chlorophyll-a concentrations (> 2 μg L-1) in 2020, and the dinoflagellates were mainly concentrated at the 1% light depth (> 20 m) in 2018 and 2019, except Station 317-21 where dinoflagellates predominated throughout all three light depths. Compared to diatoms, dinoflagellates showed a positive correlation with ExN in spring both in the correlation analysis and GAMs (Figures 10, 11). Diatoms decreased in spring when the DIP concentration was low (0–0.1 μM) but increased when the DIP was > 0.1 μM. The decrease in diatoms at low DIP levels was primarily due to the increasing contributions of dinoflagellates. According to a previous study on diatoms and dinoflagellates in the ECS, diatoms lean to higher nutrient concentrations and lower temperature, while dinoflagellates are less sensitive to nutrient concentrations and temperature but prefer low DIP and high N:P ratios conditions (Xiao et al., 2018), which is consistent with the results of this study. In addition, the temperature in the entire area was higher in 2020 than in 2018 and 2019, and the water column was strongly stratified in 2020; this is also consistent with the result from Xiao et al. (2018), who found that the effect of warming resulting from increasing stratification promoted dinoflagellates over diatoms. Dinoflagellates and diatoms are two typical harmful phytoplankton groups that can adversely affect human health as well as marine fisheries and aquaculture (Moore et al., 2008; Anderson et al., 2012). They account for 75% and 5% of all 70 harmful phytoplankton species, respectively (Smayda and Reynolds, 2001). Previous studies in the ECS indicated that the dominant dinoflagellate species associated with spring blooms were Prorocentrum dentatum, Scrippsiella trochoidea, and Gymnodinium lohmanni, and the dominant species of diatoms were mostly chain-forming diatoms such as Seudonitzschia delicatissima, Thalassionema nitzschioides, and Paralia sulcata (Guo S. et al., 2014). A previous study on interannual changes in phytoplankton communities from 2009 to 2013 in the NECS reported that the nutrient requirements for dinoflagellates and diatoms are similar, but that the biomass of dinoflagellates never exceeded that of diatoms (Xu et al., 2019). Phytoplankton communities from 2006 to 2012 showed that dinoflagellate blooms generally occurred in spring in coastal waters (Liu et al., 2016). These previous findings were evidently different from the results in this study where dinoflagellate replaced diatoms as the dominant species in the NECS, which was distant from the coastal waters in 2020. Based on previous and this studies, we predict that spring blooms phytoplankton groups in the ECS would gradually change from diatoms to dinoflagellates both in coastal waters and the NECS. The main reasons for this prediction are based on (1) the overall nutrient transitions from N-deficient to P-deficient environmental conditions in the NECS in recent decades (Moon et al., 2021) and (2) increasing thermal stratification of marine waters as a consequence of global warming, which will inhibit nutrient inputs especially DIP inputs from waters below the mixed layer (Xiao et al., 2018). Such long-term environmental changes are more conducive to dinoflagellates than diatoms, which is consistent with model-based conservative forecasts for that diatoms will decrease by 60% and dinoflagellates will increase by 70% of the surface water in the ECS by the year 2100 (Xiao et al., 2018).
Small-Sized Cyanobacteria and Prymnesiophytes and Large-Sized Diatoms
The major interannual variations in phytoplankton communities were driven by three phytoplankton species, cyanobacteria, prymnesiophytes, and diatoms, during our study period. The large increase in prymnesiophytes in summer 2019 and the large decrease in diatoms in autumn 2020 were accompanied by an increase in small phytoplankton represented by cyanobacteria and prymnesiophytes (Figure 7A). High chlorophyll-a concentrations occurred in summer, which is second only to spring during the three-year study period and showed a spatial trend with high concentrations in the west and low concentrations in the east, horizontally. Vertically (Figure 8), a strong water stratification occurred every year in summer (Figure 5). The MLD did not have significant changes in summer from 2018 to 2020. The average MLD from 2018 to 2020 were 12.5 ± 1.8 m, 12.0 ± 1.5 m and 12.3 ± 1.5 m, respectively (Table 1). A strong positive correlation between all nutrients and water depth was found in summer based on the correlation heatmap (Figure 10C). Therefore, diatoms were mainly concentrated at 1% light depths in this study, which is consistent with the finding in a previous study (Kim et al., 2020). Contrary to diatoms, cyanobacteria were concentrated at 100% and 30% light depths, which is consistent with the resource competition theory (Tilman, 1982) indicating that picophytoplankton are favored over larger phytoplankton in nutrient-limited conditions because of their higher nutrient affinity associated with their small size. Thus, small cyanobacteria and prymnesiophytes were predominant at the nutrient-deficient surface layer in summer. However, this was not the case in summer 2020 when CDW water (salinity < 30 ‰, DIN > 10 μM) came from the surface western part of the study area and affected all sites eastward to 126°E. This allowed diatoms to dominate at the 100% and 30% light depths of the westernmost stations of the NECS (317-21) with high chlorophyll-a concentrations (> 3 μg L–1). According to a recent study, summer 2020 rainfall along the Changjiang (Yangtze) River was highest since 1961; this was caused by warming in the Indian Ocean forcing an anomalous anticyclone in the lower troposphere over the Indo-Northwest Pacific region and intensifying the upper-level westerly jet over East Asia (Zhou et al., 2021). Surprisingly, the direct impact of such a large amount of CDW on the phytoplankton community was very regionally limited, and the strong physical difference between the western and eastern parts in 2020 summer caused the total chlorophyll-a to only slightly increase compared to values in 2018 and 2019 summers (Figures 7B, 8). In GAMs, we observed that the contributions of cyanobacteria were higher than those of diatoms in the surface waters in the summers of 2019 and 2020, where salinities were 28–31 ‰. This is consistent with previous findings in the NECS during 2009–2011 (Tseng et al., 2014; Xu et al., 2019) when the CDW caused strong stratification resulting in the surface DIP being rapidly consumed by phytoplankton; this caused a predominance of smaller phytoplankton such as cyanobacteria (Tseng et al., 2014; Xu et al., 2019). Previously, two distinct phytoplankton communities were identified in two major water masses with different nutrient conditions in mid-shelf ECS in summer: (1) deep DIP-rich Kuroshio intermediate water (KIW) from the west was characterized by a low ExN value leading to diatom domination and (2) surface DIP-deficient CDW from the east was characterized by high ExN values leading to the domination of small-sized phytoplankton such as cyanobacteria (Xu et al., 2019; Kim et al., 2020). However, we did not find similar relationships during our observation period. This was probably due to the presence of different water masses, such as the DIP-rich TWCC and YSCW, which brought nutrients to the NECS (Gong et al., 1996; Zhu et al., 2009; Yoon et al., 2015). In autumn 2020, as noted above, the growth of diatoms was severely limited by low DIP conditions, so that small phytoplankton represented by cryptophytes, cyanobacteria, and prymnesiophytes replaced diatoms as the dominant species. Cyanobacteria and prymnesiophytes showed negative correlations with all nutrients, and the contribution of prymnesiophytes decreased faster than that of cyanobacteria with an increase in nutrients in this study (Figure 10). Cyanobacteria and prymnesiophytes are commonly described as oceanic phytoplankton and generally prevail in open oligotrophic oceans (Zhu et al., 2009; Jiang et al., 2015; Meyer et al., 2017). There are currently few studies on the differential responses between cyanobacteria and prymnesiophytes to environmental factors. Some studies have shown a special symbiotic relationship between prymnesiophytes and the unicellular diazotrophic cyanobacteria UCYN-A in the open ocean (Thompson et al., 2012) and in the coastal waters of Japan (Hagino et al., 2013). Although UCYN-A is not the main cyanobacteria species in the DIN-rich ECS, UCYN-A has a strong correlation with Synechococcus in the North Pacific Ocean (Gradoville et al., 2020), which is known to be the dominant summertime cyanobacterial species in coastal waters of the ECS (Jiao et al., 2005; Lee et al., 2014). The different responses of cyanobacteria and prymnesiophytes to environmental factors requires further research.
Summary and Conclusion
This study is the first to investigate interannual variations in phytoplankton biomass and community structure for three depths in the euphotic zone and four seasons in the NECS. The combination of direct field observations, correlation heatmaps, and GAMs revealed strong relationships between the phytoplankton community structure and nutrient stoichiometry in the NECS. Diatoms, as the dominant species in the NECS throughout 2018 and 2019 in this study, decreased significantly in 2020 in all seasons. Diatoms were found to prefer low temperatures and high DIP concentrations based on correction heatmaps and GAMs analysis in this study. High DIN concentrations and DIP-limited environments in 2020 caused dinoflagellates and small phytoplankton groups such as cryptophytes, cyanobacteria, and prymnesiophytes to be more competitive than diatoms. In particular, cryptophytes were first observed as the dominant species in autumn/winter 2020 in the NECS, which could be related to increasing anthropogenic nitrogen inputs in the study area (Moon et al., 2021). Moreover, dinoflagellates, which predominated in spring 2020, tended to bloom at low phosphorus and high ExN conditions compared with diatoms. Cyanobacteria and prymnesiophytes, belonging to the small phytoplankton group, were also important contributors to total chlorophyll-a concentrations at the nutrient-deficient surface layer in the NECS for all seasons except winter. The different responses of various phytoplankton groups to environmental factors requires further research.
Under expected warming ocean scenarios and the increasing influx of anthropogenic nutrients induced by coastal human activities, we predict that the phytoplankton community structure in the NECS will gradually change from large phytoplankton represented by diatoms to small phytoplankton represented by cryptophytes, cyanobacteria, and prymnesiophytes, while dinoflagellates will bloom more frequently in spring in the future. Future research should combine changes in primary productivity with observational studies of phytoplankton species through microscopic methods because different phytoplankton species have their own specific primary productivities and respond differently to environmental changes.
Data Availability Statement
The original contributions presented in the study are included in the article/supplementary material, further inquiries can be directed to the corresponding author.
Author Contributions
YS, S-HY, YK, and SL contributed to the conception and design of the study. YK, JK, DL, KK, and HJ were performed by material preparation and data collections. YS, S-KS, and YK performed the data analysis. YS wrote the first draft of the manuscript. SL reviewed and edited previous versions of the manuscript. All authors contributed to manuscript writing, revision, read, and approved the submitted version.
Funding
This research was supported by the National Research Foundation of Korea (NRF) grant funded by the Korea government (MSIT; NRF-2019R1A2C1003515) and supported by the National Institute of Fisheries Science (NIFS; R2018067), South Korea. Financial support for S-KS was provided by Basic Science Research Program through the National Research Foundation of Korea (NRF) funded by the Ministry of Science, ICT and Future Planning (2020R1A2C2011081).
Conflict of Interest
The authors declare that the research was conducted in the absence of any commercial or financial relationships that could be construed as a potential conflict of interest.
Publisher’s Note
All claims expressed in this article are solely those of the authors and do not necessarily represent those of their affiliated organizations, or those of the publisher, the editors and the reviewers. Any product that may be evaluated in this article, or claim that may be made by its manufacturer, is not guaranteed or endorsed by the publisher.
References
Altenburger, A., Blossom, H. E., Garcia-Cuetos, L., Jakobsen, H. H., Carstensen, J., Lundholm, N., et al. (2020). Dimorphism in cryptophytes—The case of Teleaulax amphioxeia/Plagioselmis prolonga and its ecological implications. Sci. Adv. 6:eabb1611. doi: 10.1126/sciadv.abb1611
Alves-De-Souza, C., González, M. T., and Iriarte, J. L. (2008). Functional groups in marine phytoplankton assemblages dominated by diatoms in fjords of southern Chile. J. Plankton Res. 30, 1233–1243. doi: 10.1093/plankt/fbn079
Anderson, D. M., Cembella, A. D., and Hallegraeff, G. M. (2012). Progress in understanding harmful algal blooms: paradigm shifts and new technologies for research, monitoring, and management. Ann. Rev. Mar. Sci. 4, 143–176. doi: 10.1146/annurev-marine-120308-081121
Anglès, S., Jordi, A., Henrichs, D. W., and Campbell, L. (2019). Influence of coastal upwelling and river discharge on the phytoplankton community composition in the northwestern Gulf of Mexico. Prog. Oceanogr. 173, 26–36. doi: 10.1016/j.pocean.2019.02.001
Boyce, D. G., Lewis, M. R., and Worm, B. (2010). Global phytoplankton decline over the past century. Nature 466, 591–596. doi: 10.1038/nature09268
Cai, R., and Tan, H. (2010). Influence of interdecadal climate variation over East Asia on offshore ecological system of China. J. Ocean. Taiwan Strait. 29, 173–183.
Cai, R., Tan, H., and Qi, Q. (2016). Impacts of and adaptation to inter-decadal marine climate change in coastal China seas. Int. J. Climatol. 36, 4670–4683. doi: 10.1002/joc.4591
Chakraborty, S., and Lohrenz, S. E. (2015). Phytoplankton community structure in the river-influenced continental margin of the northern Gulf of Mexico. Mar. Ecol. Prog. Ser. 521, 31–47. doi: 10.3354/meps11107
Chen, B., Liu, H., Huang, B., and Wang, J. (2014). Temperature effects on the growth rate of marine picoplankton. Mar. Ecol. Prog. Ser. 505, 37–47. doi: 10.3354/meps10773
Chen, C. T. A. (2008). Distributions of nutrients in the East China Sea and the South China Sea connection. J. Oceanogr. 64, 737–751. doi: 10.1007/s10872-008-0062-9
Chen, C. T. A. (2009). Chemical and physical fronts in the Bohai, Yellow and East China seas. J. Mar. Syst. 78, 394–410. doi: 10.1016/j.jmarsys.2008.11.016
Chen, C. T. A., Ruo, R., Paid, S. C., Liu, C. T., and Wong, G. T. F. (1995). Exchange of water masses between the East China Sea and the Kuroshio off northeastern Taiwan. Cont. Shelf Res. 15, 19–39. doi: 10.1016/0278-4343(93)E0001-O
Chen, C. T. A., and Wang, S. L. (1999). Carbon, alkalinity and nutrient budgets on the East China Sea continental shelf. J. Geophys. Res. Ocean. 104, 20675–20686. doi: 10.1029/1999jc900055
Chung, S. W., Jan, S., and Liu, K. K. (2001). Nutrient fluxes through the Taiwan Strait in spring and summer 1999. J. Oceanogr. 57, 47–53. doi: 10.1023/A:1011122703552
de Boyer Montégut, C., Madec, G., Fischer, A. S., Lazar, A., and Iudicone, D. (2004). Mixed layer depth over the global ocean: an examination of profile data and a profile-based climatology. J. Geophys. Res. C Ocean. 109:C12003. doi: 10.1029/2004JC002378
Edwards, K. F., Thomas, M. K., Klausmeier, C. A., and Litchman, E. (2012). Allometric scaling and taxonomic variation in nutrient utilization traits and maximum growth rate of phytoplankton. Limnol. Oceanogr. 57, 1903–1912. doi: 10.4319/lo.2012.57.2.0554
Falkowski, P. G., and Raven, J. A. (2013). Aquatic Photosynthesis. Princeton, NJ: Princeton University Press.
Furuya, K., Hayashi, M., Yabushita, Y., and Ishikawa, A. (2003). Phytoplankton dynamics in the East China Sea in spring and summer as revealed by HPLC-derived pigment signatures. Deep. Res. Part II Top. Stud. Oceanogr. 50, 4355–4367. doi: 10.1016/S0967-0645(02)00460-5
Gao, X., and Song, J. (2005). Phytoplankton distributions and their relationship with the environment in the Changjiang Estuary, China. Mar. Pollut. Bull. 50, 327–335. doi: 10.1016/j.marpolbul.2004.11.004
Gong, G. C., Chen, Y. L. L., and Liu, K. K. (1996). Chemical hydrography and chlorophyll a distribution in the East China Sea in summer: implications in nutrient dynamics. Cont. Shelf Res. 16, 1561–1590. doi: 10.1016/0278-4343(96)00005-2
Gradoville, M. R., Farnelid, H., White, A. E., Turk-Kubo, K. A., Stewart, B., Ribalet, F., et al. (2020). Latitudinal constraints on the abundance and activity of the Cyanobacterium UCYN-A and other marine diazotrophs in the North Pacific. Limnol. Oceanogr. 65, 1858–1875. doi: 10.1002/lno.11423
Guo, C., Liu, H., Zheng, L., Song, S., Chen, B., and Huang, B. (2014). Seasonal and spatial patterns of picophytoplankton growth, grazing and distribution in the East China Sea. Biogeosciences 11, 1847–1862. doi: 10.5194/bg-11-1847-2014
Guo, S., Feng, Y., Wang, L., Dai, M., Liu, Z., Bai, Y., et al. (2014). Seasonal variation in the phytoplankton community of a continental-shelf sea: the East China Sea. Mar. Ecol. Prog. Ser. 516, 103–126. doi: 10.3354/meps10952
Guo, X. Y., Zhu, X. H., Long, Y., and Huang, D. J. (2013). Spatial variations in the Kuroshio nutrient transport from the East China Sea to south of Japan. Biogeosciences 10, 6403–6417. doi: 10.5194/bg-10-6403-2013
Hagino, K., Onuma, R., Kawachi, M., and Horiguchi, T. (2013). Discovery of an endosymbiotic nitrogen-fixing Cyanobacterium UCYN-A in Braarudosphaera bigelowii (Prymnesiophyceae). PLoS One 8:e81749. doi: 10.1371/journal.pone.0081749
He, Q., Sun, J., Luan, Q., and Yu, Z. (2009). Phytoplankton in Changjiang estuary and adjacent waters in winter. Mar. Environ. Sci. 28, 360–365.
Huang, T. H., Chen, C. T. A., Lee, J., Wu, C. R., Wang, Y. L., Bai, Y., et al. (2019). East China Sea increasingly gains limiting nutrient P from South China Sea. Sci. Rep. 9:7895. doi: 10.1038/s41598-019-42020-4
Jiang, Z., Chen, J., Zhou, F., Shou, L., Chen, Q., Tao, B., et al. (2015). Controlling factors of summer phytoplankton community in the Changjiang (Yangtze River) Estuary and adjacent East China Sea shelf. Cont. Shelf Res. 101, 71–84. doi: 10.1016/j.csr.2015.04.009
Jiao, N., Yang, Y., Hong, N., Ma, Y., Harada, S., Koshikawa, H., et al. (2005). Dynamics of autotrophic picoplankton and heterotrophic bacteria in the East China Sea. Cont. Shelf Res. 25, 1265–1279. doi: 10.1016/j.csr.2005.01.002
Kang, J. J., Lee, J. H., Kim, H. C., Lee, W. C., Lee, D., Jo, N., et al. (2018). Monthly variations of phytoplankton community in Geoje-Hansan Bay of the Southern Part of Korea Based on HPLC pigment Analysis. J. Coast. Res. 85, 356–360. doi: 10.2112/SI85-072.1
Kang, Y., Moon, C. H., Kim, H. J., Yoon, Y. H., and Kang, C. K. (2021). Water quality improvement shifts the dominant phytoplankton group from cryptophytes to diatoms in a coastal ecosystem. Front. Mar. Sci. 8:710891. doi: 10.3389/fmars.2021.710891
Kilham, P., and Hecky, R. E. (1988). Comparative ecology of marine and freshwater phytoplankton. Limnol. Oceanogr. 33, 776–795. doi: 10.4319/lo.1988.33.4_part_2.0776
Kim, D., Choi, S. H., Kim, K. H., Shim, J. H., Yoo, S., and Kim, C. H. (2009). Spatial and temporal variations in nutrient and chlorophyll-a concentrations in the northern East China Sea surrounding Cheju Island. Cont. Shelf Res. 29, 1426–1436. doi: 10.1016/j.csr.2009.03.012
Kim, Y., Youn, S. H., Oh, H. J., Kang, J. J., Lee, J. H., Lee, D., et al. (2020). Spatiotemporal variation in phytoplankton community driven by environmental factors in the northern east china sea. Water 12:2695. doi: 10.3390/w12102695
Kong, C. E., Yoo, S., and Jang, C. J. (2019). East China Sea ecosystem under multiple stressors: heterogeneous responses in the sea surface chlorophyll-a. Deep. Res. Part I Oceanogr. Res. Pap. 151:103078. doi: 10.1016/j.dsr.2019.103078
Lee, Y., Choi, J. K., Youn, S., and Roh, S. (2014). Influence of the physical forcing of different water masses on the spatial and temporal distributions of picophytoplankton in the northern East China Sea. Cont. Shelf Res. 88, 216–227. doi: 10.1016/j.csr.2014.08.001
Lee, Y.-W., Park, M.-O., Kim, Y.-S., Kim, S.-S., and Kang, C.-K. (2011). Application of photosynthetic pigment analysis using a HPLC and CHEMTAX program to studies of phytoplankton community composition. Sea 16, 117–124. doi: 10.7850/jkso.2011.16.3.117
Li, M., Xu, K., Watanabe, M., and Chen, Z. (2007). Long-term variations in dissolved silicate, nitrogen, and phosphorus flux from the Yangtze River into the East China Sea and impacts on estuarine ecosystem. Estuar. Coast. Shelf Sci. 71, 3–12. doi: 10.1016/j.ecss.2006.08.013
Liu, J., Liu, J., Zhang, S. H., Liang, J., Lin, H., Song, D., et al. (2018). Novel insights into bacterial dimethylsulfoniopropionate catabolism in the East China Sea. Front. Microbiol. 9:3206. doi: 10.3389/fmicb.2018.03206
Liu, L., Zhou, J., Zheng, B., Cai, W., Lin, K., and Tang, J. (2013). Temporal and spatial distribution of red tide outbreaks in the Yangtze River Estuary and adjacent waters China. Mar. Pollut. Bull. 72, 213–221.
Liu, X., Xiao, W., Landry, M. R., Chiang, K. P., Wang, L., and Huang, B. (2016). Responses of Phytoplankton Communities to Environmental Variability in the East China Sea. Ecosystems 19, 832–849. doi: 10.1007/s10021-016-9970-5
Mackey, M. D., Higgins, H. W., Mackey, D. J., and Wright, S. W. (1997). CHEMTAX User’s Manual: a Program for Estimating Class Abundances from Chemical Markers, Application to HPLC Measurements of Phytoplankton Pigments. Report No: 229, Hobart, Tas: CSIRO Marine Laboratories.
Mackey, M. D., Mackey, D. J., Higgins, H. W., and Wright, S. W. (1996). CHEMTAX - a program for estimating class abundances from chemical markers: application to HPLC measurements of phytoplankton. Mar. Ecol. Prog. Ser. 144, 265–283. doi: 10.3354/meps144265
Meyer, J., Löscher, C. R., Lavik, G., and Riebesell, U. (2017). Mechanisms of P* reduction in the eastern tropical South Pacific. Front. Mar. Sci. 4:1. doi: 10.3389/fmars.2017.00001
Moon, J. Y., Lee, K., Lim, W. A., Lee, E., Dai, M., Choi, Y. H., et al. (2021). Anthropogenic nitrogen is changing the East China and Yellow seas from being N deficient to being P deficient. Limnol. Oceanogr. 66, 914–924. doi: 10.1002/lno.11651
Moore, S. K., Trainer, V. L., Mantua, N. J., Parker, M. S., Laws, E. A., Backer, L. C., et al. (2008). Impacts of climate variability and future climate change on harmful algal blooms and human health. Environ. Health Glob. Access Sci. Source 7(Suppl. 2):S4. doi: 10.1186/1476-069X-7-S2-S4
Ning, X., Liu, Z., Cai, Y., Fang, M., and Chai, F. (1998). Physicobiological oceanographic remote sensing of the East China Sea: satellite and in situ observations. J. Geophys. Res. Ocean. 103, 21623–21635. doi: 10.1029/98JC01612
Olsen, Y., Reinertsen, H., Vadstein, O., Andersen, T., Gismervik, I., Duarte, C., et al. (2001). Comparative analysis of food webs based on flow networks: effects of nutrient supply on structure and function of coastal plankton communities. Cont. Shelf Res. 21, 2043–2053. doi: 10.1016/S0278-4343(01)00041-3
Park, M.-O., Kang, S.-W., Lee, C.-I., Choi, T.-S., and Lantoine, F. (2008). Structure of the phytoplanktonic communities in Jeju Strait and northern East China Sea and dinoflagellate blooms in spring 2004: analysis of photosynthetic pigments. Sea 13, 27–41.
Poole, H. H., and Atkins, W. R. G. (1929). Photo-electric measurements of submarine illumination throughout the year. J. Mar. Biol. Assoc. U.K. 16, 297–324. doi: 10.1017/S0025315400029829
R Core Team (2019). R: A Language and Environment for Statistical Computing. Vienna: R Foundation for Statistical Computing.
Redfield, A. C. (1934). On the Proportions of Organic Derivatives in Sea Water and Their Relation to the Composition of Plankton. Liverpool: University Press of Liverpool.
Smayda, T. J., and Reynolds, C. S. (2001). Community assembly in marine phytoplankton: application of recent models to harmful dinoflagellate blooms. J. Plankton Res. 23, 447–461. doi: 10.1093/plankt/23.5.447
Smith, W. O., and Sakshaug, E. (1990). “Polar phytoplankton,” in Polar Oceanography. Part B: Chemistry, Biology, and Geology, ed. W. O. Smith Jr. (San Diego, CA: Academic Press), 477–525.
Sommer, U. (1994). The impact of light intensity and daylength on silicate and nitrate competition among marine phytoplankton. Limnol. Oceanogr. 39, 1680–1688. doi: 10.4319/lo.1994.39.7.1680
Spear-Bernstein, L., and Miller, K. R. (1989). Unique location of the phycobiliprotein light-harvesting pigment in the cryptophyceae. J. Phycol. 25, 412–419. doi: 10.1111/j.1529-8817.1989.tb00245.x
Thompson, A. W., Foster, R. A., Krupke, A., Carter, B. J., Musat, N., Vaulot, D., et al. (2012). Unicellular Cyanobacterium symbiotic with a single-celled eukaryotic alga. Science 337, 1546–1550. doi: 10.1126/science.1222700
Tilman, D. (1982). Resource competition and community structure. Monogr. Popul. Biol. 17. doi: 10.2307/4549
Tseng, Y. F., Lin, J., Dai, M., and Kao, S. J. (2014). Joint effect of freshwater plume and coastal upwelling on phytoplankton growth off the changjiang river. Biogeosciences 11, 409–423. doi: 10.5194/bg-11-409-2014
Walter, B., Peters, J., and van Beusekom, J. E. E. (2017). The effect of constant darkness and short light periods on the survival and physiological fitness of two phytoplankton species and their growth potential after re-illumination. Aquat. Ecol. 51, 591–603. doi: 10.1007/s10452-017-9638-z
Wang, B., and Wang, X. (2007). Chemical hydrography of coastal upwelling in the East China Sea. Chinese J. Oceanol. Limnol. 25, 16–26. doi: 10.1007/s00343-007-0016-x
Wang, B., and Wu, L. (2021). Sea surface temperature (SST) anomalies of the Yellow and East China Seas in July of 2020. E3S Web Conf. 228:02006. doi: 10.1051/e3sconf/202122802006
Wong, G. T. F., Gong, G.-C., Liu, K. K., and Pai, S. C. (1998). ‘Excess nitrate’in the East China sea. Estuar. Coast. Shelf Sci. 46, 411–418.
Wright, S. W., Ishikawa, A., Marchant, H. J., Davidson, A. T., Van Den Enden, R. L., and Nash, G. V. (2009). Composition and significance of picophytoplankton in Antarctic waters. Polar Biol. 32, 797–808. doi: 10.1007/s00300-009-0582-9
Wright, S. W., and Jeffrey, S. W. (2006). “Pigment markers for phytoplankton production,” in Marine Organic Matter: Biomarkers, Isotopes and DNA, ed. J. K. Volkman (Berlin: Springer), 71–104.
Xiao, W., Liu, X., Irwin, A. J., Laws, E. A., Wang, L., Chen, B., et al. (2018). Warming and eutrophication combine to restructure diatoms and dinoflagellates. Water Res. 128, 206–216. doi: 10.1016/j.watres.2017.10.051
Xing, X. L., Lin, X. Y., Chen, C. P., Gao, Y. H., Liang, J. R., Huang, H. Z., et al. (2008). Observations of several cryptomonad flagellates from China Sea by scanning electron microscopy. J. Syst. Evol. 46, 205–212. doi: 10.3724/SP.J.1002.2008.07073
Xu, Q., Sukigara, C., Goes, J. I., do Rosario Gomes, H., Zhu, Y., Wang, S., et al. (2019). Interannual changes in summer phytoplankton community composition in relation to water mass variability in the East China Sea. J. Oceanogr. 75, 61–79. doi: 10.1007/s10872-018-0484-y
Yang, G., Wang, S., Zhou, R., and Sun, S. (1983). Endemic selenium intoxication of humans in China. Am. J. Clin. Nutr. 37, 872–881. doi: 10.1093/ajcn/37.5.872
Yoo, Y. D., Seong, K. A., Jeong, H. J., Yih, W., Rho, J. R., Nam, S. W., et al. (2017). Mixotrophy in the marine red-tide cryptophyte Teleaulax amphioxeia and ingestion and grazing impact of cryptophytes on natural populations of bacteria in Korean coastal waters. Harmf. Algae 68, 105–117. doi: 10.1016/j.hal.2017.07.012
Yoon, S. C., Youn, S. H., Whang, J. D., Suh, Y. S., and Yoon, Y. Y. (2015). Long-term variation in ocean environmental conditions of the Northern East China Sea. J. Korean Soc. Mar. Environ. Energy 18, 189–206. doi: 10.7846/jkosmee.2015.18.3.189
Yoon, Y. H. (2003). Spatial distribution of phytoplankton community and red tide of dinoflagellate, Prorocentrum donghaience in the East China Sea during early summer. Korean J. Environ. Biol. 21, 132–141.
Zapata, M., Rodríguez, F., and Garrido, J. L. (2000). Separation of chlorophylls and carotenoids from marine phytoplankton: a new HPLC method using a reversed phase C8 column and pyridine-containing mobile phases. Mar. Ecol. Prog. Ser. 195, 29–45. doi: 10.3354/meps195029
Zhang, J., Liu, S. M., Ren, J. L., Wu, Y., and Zhang, G. L. (2007). Nutrient gradients from the eutrophic Changjiang (Yangtze River) Estuary to the oligotrophic Kuroshio waters and re-evaluation of budgets for the East China Sea Shelf. Prog. Oceanogr. 74, 449–478. doi: 10.1016/j.pocean.2007.04.019
Zhao, D., Zhao, L., Zhang, F., and Zhang, X. (2004). Temporal occurrence and spatial distribution of red tide events in China’s coastal waters. Hum. Ecol. Risk Assess. 10, 945–957.
Zhao, R., Sun, J., and Bai, J. (2010). Phytoplankton assemblages in Yangtze River Estuary and its adjacent water in autumn 2006. Mar. Sci. 34, 32–39.
Zhou, M. J., Shen, Z. L., and Yu, R. C. (2008). Responses of a coastal phytoplankton community to increased nutrient input from the Changjiang (Yangtze) River. Cont. Shelf Res. 28, 1483–1489. doi: 10.1016/j.csr.2007.02.009
Zhou, Z. Q., Xie, S. P., and Zhang, R. (2021). Historic Yangtze flooding of 2020 tied to extreme Indian Ocean conditions. Proc. Natl. Acad. Sci. U.S.A. 118:e2022255118. doi: 10.1073/pnas.2022255118
Zhu, Z. Y., Ng, W. M., Liu, S. M., Zhang, J., Chen, J. C., and Wu, Y. (2009). Estuarine phytoplankton dynamics and shift of limiting factors: a study in the Changjiang (Yangtze River) Estuary and adjacent area. Estuar. Coast. Shelf Sci. 84, 393–401. doi: 10.1016/j.ecss.2009.07.005
Keywords: East China Sea, phytoplankton community, interannual variation, HPLC, correlation heatmap, generalized additive models, cryptophytes
Citation: Sun Y, Youn S-H, Kim Y, Kang JJ, Lee D, Kim K, Jang HK, Jo N, Yun MS, Song S-K and Lee SH (2022) Interannual Variation in Phytoplankton Community Driven by Environmental Factors in the Northern East China Sea. Front. Mar. Sci. 9:769497. doi: 10.3389/fmars.2022.769497
Received: 29 September 2021; Accepted: 12 January 2022;
Published: 17 February 2022.
Edited by:
Satya Panigrahi, Indira Gandhi Centre for Atomic Research (IGCAR), IndiaReviewed by:
Alwar Ramanujam Padmavathi, Bhabha Atomic Research Centre (BARC), IndiaBiraja Kumar Sahu, Council of Scientific and Industrial Research (CSIR), India
Copyright © 2022 Sun, Youn, Kim, Kang, Lee, Kim, Jang, Jo, Yun, Song and Lee. This is an open-access article distributed under the terms of the Creative Commons Attribution License (CC BY). The use, distribution or reproduction in other forums is permitted, provided the original author(s) and the copyright owner(s) are credited and that the original publication in this journal is cited, in accordance with accepted academic practice. No use, distribution or reproduction is permitted which does not comply with these terms.
*Correspondence: Sang Heon Lee, c2FuZ2xlZUBwdXNhbi5hYy5rcg==