 Kevin Labrador
 Joseph Dominic Palermo
 Altair Agmata1
 Rachel Ravago-Gotanco
- 1The Marine Science Institute, University of the Philippines Diliman, Quezon City, Philippines
- 2Department of Biological Sciences and Environmental Studies, University of the Philippines Mindanao, Davao City, Philippines
- 3Institute of Environmental Science and Meteorology, University of the Philippines Diliman, Quezon City, Philippines
Stock identification and delineation are important in the management and conservation of marine resources. These were highlighted as priority research areas for Bali sardinella (Sardinella lemuru) which is among the most commercially important fishery resources in the Philippines. Previous studies have already assessed the stocks of S. lemuru between Northern Mindanao Region (NMR) and Northern Zamboanga Peninsula (NZP), yielding conflicting results. Phenotypic variation suggests distinct stocks between the two regions, while mitochondrial DNA did not detect evidence of genetic differentiation for this high gene flow species. This paper tested the hypothesis of regional structuring using genome-wide single nucleotide polymorphisms (SNPs) acquired through restriction site-associated DNA sequencing (RADseq). We examined patterns of population genomic structure using a full panel of 3,573 loci, which was then partitioned into a neutral panel of 3,348 loci and an outlier panel of 31 loci. Similar inferences were obtained from the full and neutral panels, which were contrary to the inferences from the outlier panel. While the full and neutral panels suggested a panmictic population (global FST ∼ 0, p > 0.05), the outlier panel revealed genetic differentiation between the two regions (global FST = 0.161, p = 0.001; FCT = 0.263, p < 0.05). This indicated that while gene flow is apparent, selective forces due to environmental heterogeneity between the two regions play a role in maintaining adaptive variation. Annotation of the outlier loci returned five genes that were mostly involved in organismal development. Meanwhile, three unannotated loci had allele frequencies that correlated with sea surface temperature. Overall, our results provided support for local adaptation despite high levels of gene flow in S. lemuru. Management therefore should not only focus on demographic parameters (e.g., stock size and catch volume), but also consider the preservation of adaptive variation.
Introduction
Stocks are the basic unit of management in fisheries and identifying them is a prerequisite to fisheries assessment and other management measures (Kritzer and Liu, 2014). Stocks can be identified based on genetic variation inferred using molecular markers which may be neutral or non-neutral (i.e., adaptive or outliers) (Kirk and Freeland, 2011; Cadrin et al., 2014). Each marker type provides a different perspective on the evolutionary forces that shape populations. Neutral markers provide insight on the genome-wide effects of gene flow and genetic drift, whereas non-neutral markers are more likely to reveal locus-specific effects of natural selection and how these change local gene pools (Holderegger et al., 2006; Russello et al., 2012; Mariani and Bekkevold, 2014). These markers also have different functionality with regards to stock identification; while neutral markers are used to identify stocks based on the levels of gene flow and demographic independence, non-neutral markers are used to identify genetic groups based on adaptive genetic variation and patterns of local adaptation (Funk et al., 2012; Moore et al., 2014). Consequently, the hierarchical analysis of neutral and non-neutral markers was proposed as a more comprehensive approach to delineating conservation units (Funk et al., 2012). Within this framework, both neutral and non-neutral markers are initially used to delineate evolutionary significant units (ESU) – populations that are reproductively isolated and have adaptive differences. Afterward, neutral markers are used to delineate stocks or management units (MU), and non-neutral markers are used to identify adaptive groups. Previously, genetic assessment using non-neutral markers was difficult most especially for non-model organisms; however, with the advent of next-generation sequencing (NGS), these limitations had been largely overcome (Metzker, 2009; Davey and Blaxter, 2010; Willette et al., 2014; Andrews et al., 2016).
Identifying stocks and determining the extent to which they are connected across space and time are needed to better manage fisheries resources that are facing threats of overexploitation. These include the Bali sardinella (Sardinella lemuru Bleeker, 1853), an important small pelagic fishery resource in the Indo-West Pacific region (Gaughan and Mitchell, 2000; Jaya, 2002; Metillo et al., 2018). This species’ distribution ranges from southern Japan, up to its southern limit in western Australia and westernmost limit in the Andaman Sea (Whitehead, 1985; Willette and Santos, 2013). As with most sardine species, S. lemuru forms shoals in coastal waters over continental shelves not exceeding depths of 200 m (Willette et al., 2011), and is often found in areas of upwelling and regions with high primary productivity (Sartimbul et al., 2010; Villanoy et al., 2011). The species is particularly important in Indonesia as it comprises more than 90% of the total catch in the pelagic fishery of Bali Strait (Sartimbul et al., 2010), where it provides livelihood for the local population (Jaya, 2002). It also constitutes a variable component of the small pelagic fishery in Western Australia, where it has been marketed as bait for the rock lobster fishery (Gaughan and Mitchell, 2000). In addition to its social and economic value, S. lemuru also plays key ecological roles, as substantial decline in its abundance was predicted to have serious consequences on the breeding success of organisms at higher trophic levels (e.g., seabirds; Gaughan and Mitchell, 2000).
In the Philippines, S. lemuru, previously misidentified as Sardinella longiceps (Willette and Santos, 2013), is the most abundant species in the small pelagic fishery and has significantly contributed to the country’s economy by providing billions of pesos to the annual revenue (Willette et al., 2011), as well as serving as a source of food and livelihood (Willette and Santos, 2013; Narvaez, 2017). However, the country’s sardine fishery is considered overexploited (Guanco et al., 2009; Olaño et al., 2009), with reports of age-at-maturity being attained as early as 3.7–6.3 months (Campos et al., 2015). S. lemuru dominates the small pelagic fishery along the northern coast of Mindanao, and efforts in understanding the dynamics and processes involved in the sardine fisheries were heavily focused along this area, covering both the Northern Zamboanga Peninsula (NZP) and Northern Mindanao Region (NMR). These include looking at the influence of oceanographic conditions (e.g., upwelling, primary productivity, temperature, and advection) to sardine productivity (Villanoy et al., 2011, 2015) and variability in larval recruitment (Pata et al., 2021); spatio-temporal patterns in fish catch composition, fishing effort, spawning, and recruitment (De Guzman et al., 2015); mortality at early life stages and sources of recruits (Campos et al., 2015); ontogenetic feeding shifts (Metillo et al., 2018); susceptibility to microplastic pollution (Palermo et al., 2020); and occurrence of endoparasites (Palermo, 2021). Stock connectivity within and between regions were also reported (Luceño et al., 2014; Campos et al., 2015; De Guzman et al., 2015; Pante et al., 2019; Labrador et al., 2021).
Previous stock assessments of S. lemuru suggested regional differentiation between the NZP and NMR despite their adjacent locations along a contiguous coastline spanning around 400 km. These included (1) variations in life history parameters, particularly the earlier onset of spawning in NZP and earlier maturation in NMR (De Guzman et al., 2015); and (2) differences in body shape based on geometric morphometrics (Luceño et al., 2014); while (3) different sardine endoparasites between regions suggest that these could serve as biological tags for source tracking (Palermo, 2021). Larval connectivity models further support the distinction between NZP and NMR, at least for coral reef-associated species of fish (Epinephelus sp.) and invertebrates (Acropora millepora and Tripneustes gratilla) (Pata and Yñiguez, 2019). These observed patterns of regional differentiation could be attributed to the spatiotemporal differences in the hydrographic processes between the two regions. The NZP, located at the eastern boundary of the Sulu Sea, experiences monsoon-driven coastal upwelling during the northeast monsoon (Villanoy et al., 2011), while the NMR, located at the southern boundary of the Bohol Sea System (BSS), exhibits a “double estuarine type” circulation with entrainment in the eastern basin and eddy formation in the southwestern basin (Cabrera et al., 2011). While both regions exhibit high primary productivity to support the sardine fishery, productivity in the NZP is mostly driven by the upwelling system, while productivity in NMR is mostly driven by the large nutrient input from major river systems to the Bohol Sea (De Guzman et al., 2015). Furthermore, the strong signature of upwelling in the NZP makes it more dynamic compared to the NMR. These different oceanographic features between regions could affect spawning and recruitment success (Campos et al., 2015; Metillo et al., 2018) and limit migration (Luceño et al., 2014), which in turn could drive regional adaptive variation. Previous reports have already shown how environmental parameters associated with ocean primary productivity (e.g., sea surface temperature and chlorophyll-a) affect variability in the catch (Sartimbul et al., 2010; Villanoy et al., 2011), distribution and migratory behavior (Sambah et al., 2012), as well as recruitment success (Pata et al., 2021) of S. lemuru.
A previous genetic stock assessment using the mitochondrial DNA (mtDNA) meanwhile reported contrasting patterns indicating the absence of regional genetic differentiation (Labrador et al., 2021). Although minimal yet significant genetic structuring was recovered, such signature was due to genetically distinct haplogroups which occurred in sympatry, with each haplogroup exhibiting panmixia over relatively large spatial scales (Pedrosa-Gerasmio et al., 2015; Labrador et al., 2021). This supports the idea that the sea systems in NMR and NZP are coupled despite the differences in their respective oceanographic features, and that recruits come from the same source (Campos et al., 2015). Such connectivity is expected for S. lemuru due to its high dispersal potential, as was reported for stocks around the Sulu-Celebes Sea (Pedrosa-Gerasmio et al., 2015) and along the coast of Western Australia (Gaughan and Mitchell, 2000). However, the absence of regional genetic differentiation could be attributed to the low resolving power of mtDNA. In general, mtDNA markers may perform poorly at detecting recent genetic divergence, especially in species with large effective population sizes and high dispersal potential (Corander et al., 2013; Pedrosa-Gerasmio et al., 2015; Sukumaran et al., 2016). Furthermore, mtDNA markers are often associated with historical processes and are thus unable to detect adaptive variation occurring at a more contemporary ecological timescale (Conover et al., 2006; Rocha et al., 2007). Genome-wide single nucleotide polymorphisms (SNPs) offer a better alternative in providing the resolving power needed to detect low levels of genetic divergence expected for organisms with high dispersal potential and large effective population sizes (Corander et al., 2013; Sukumaran et al., 2016). Moreover, since local adaptation can still occur despite high levels of genetic connectivity (Hemmer-Hansen et al., 2007a; Nielsen et al., 2009b), concurrent examination of both neutral and non-neutral genetic variation is needed to understand the relative contribution of gene flow, genetic drift, and selection in shaping the population (Funk et al., 2012; Yadav et al., 2019). In this regard, delineating conservation units as proposed by Funk et al. (2012) serves as a good framework in stock delineation of S. lemuru in the Philippines.
This study used genome-wide SNPs to assess S. lemuru populations along the northern coast of Mindanao. Given that phenotypic variation was observed between NMR and NZP despite the species’ high dispersal potential, we tested the hypothesis of genetic differentiation between these two adjacent regions using both neutral and non-neutral (hereafter referred to as outlier) markers. We hypothesized that the former would reveal a panmictic stock, while the latter would show genetic structuring between regions due to adaptive variation. Given the differences in the signature of upwelling between the two regions, we further characterized the outliers to identify genes that drive regional variation and assess their possible association with the environment, focusing on parameters that are associated with primary productivity – sea surface temperature (SST), chlorophyll a (chl-a), and particulate organic carbon (POC).
Materials and Methods
Sample Collection
A total of 48 S. lemuru samples were collected in November 2016 from seven bays representing two regions along the northern coast of Mindanao (Figure 1): NMR (n = 21) included Butuan (BUT), Gingoog (GIN), Macajalar (MAC), and Iligan (ILG); NZP (n = 27) included Dipolog (DIP), Sindangan (SIN), and Patawag (PAT). Identification was initially done using the count of pelvic fin rays (one unbranched, eight branched; Willette and Santos, 2013), and was confirmed using genetic sequences of the mtDNA markers, cytochrome oxidase I (COI) and control region (CR) (Labrador et al., 2021). Appropriate mass (10% w/v) of dorsal muscle tissues excised from freshly caught samples were placed in 1.5 mL microcentrifuge tube containing nucleotide stabilization solution (RNA/DNA Shield, ZymoResearch, United States). Preserved tissue samples were then shipped to Beijing Genomics Institute (BGI), China for DNA extraction, library preparation, and sequencing.
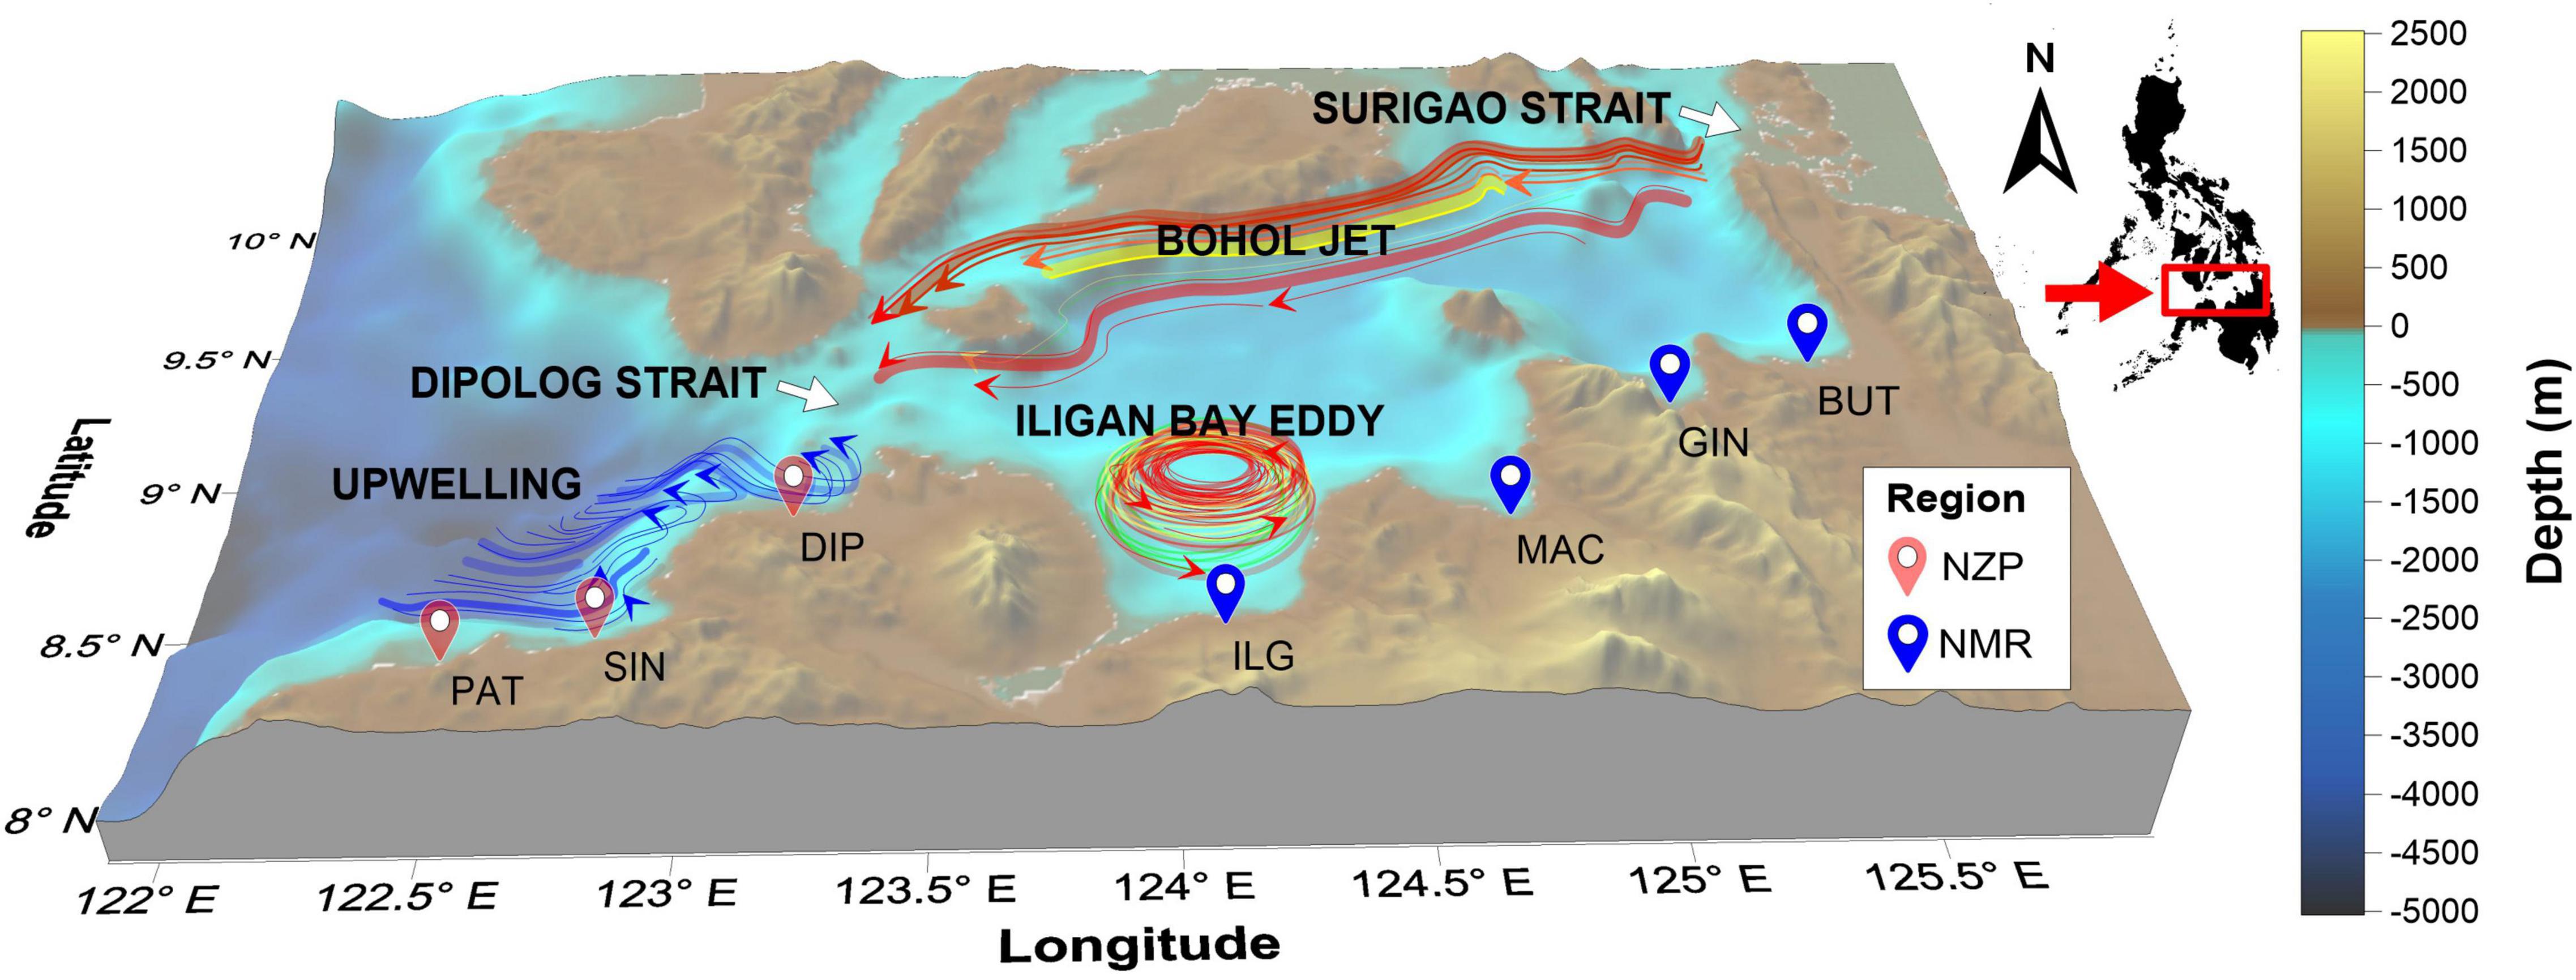
Figure 1. Map of sampling locations. Colors of map markers indicate the geopolitical regions from where the sites belong (NMR, Northern Mindanao Region; BUT, Butuan; GIN, Gingoog; MAC, Macajalar; ILG, Iligan; NZP, Northern Zamboanga Peninsula; DIP, Dipolog; SIN, Sindangan; PAT, Patawag). The location relative to the Philippine archipelago is shown. Also shown are the general location and flow direction of the Bohol Jet and Iligan Eddy in the NMR (Cabrera et al., 2011), and the upwelling region in the NZP (Villanoy et al., 2011).
DNA Extraction, Library Preparation, and Sequencing
DNA extraction, preparation of RAD libraries, and sequencing was done following the protocol of Baird et al. (2008). Genomic DNA (gDNA) was extracted from the tissue samples, the quality and concentration of which were determined using agarose gel electrophoresis and fluorometric quantification (Qubit Fluorometer, Thermo Fisher Scientific, United States). gDNA (0.1–1.0 μg) was then digested using the restriction enzyme EcoRI. After digestion, P1 adaptor, containing the forward PCR primer, Illumina primer, and the sample-specific barcode sequences were ligated to the DNA fragments. The samples were pooled and then sheared using a sonicator. For size selection, sheared samples were electrophoresed on a gel, and fragments ranging from 300 to 500 bp were extracted. The ends were polished using a blunt enzyme and a 3′–dA overhang was added to the blunt end. This overhang was where P2 (Y) adaptors with divergent ends were ligated. Only the fragments containing both P1 and P2 adaptors were amplified in the PCR step, and the resulting amplicons were considered as the RAD library. The library was validated using 2100 Bioanalyzer (Agilent Technologies, United States) and ABI StepOnePlus Real-Time PCR (Thermo Fisher Scientific, United States). Paired-end sequencing was performed on HiSeq 4000 (Illumina, United States). The sequence data was then demultiplexed and assigned back to an individual using the sample-specific barcodes.
Quality Filtering and Parameter Optimization
Low quality reads were removed using the process_radtags module in Stacks v.1.46 (Catchen et al., 2011, 2013), and FastQC (Andrews, 2010) was used to further assess sequence quality. Samples with low read counts (<1.6 × 10⁶) were also removed since including them reduced the number of SNPs that can be genotyped. A reduced dataset for parameter optimization was generated by using the first five samples with the highest read count from each of the six bays (n = 35).
Optimization of the Stacks genotyping pipeline followed the recommendations of Mastretta-Yanes et al. (2014), Paris et al. (2017), and Rochette and Catchen (2017). Optimization was performed using the denovo_map.pl module and focused on the following core parameters: (1) the minimum number of identical filtered reads to create a stack (m; default: 3), (2) the number of mismatches allowed between loci within an individual (M; default: 2), and (3) the number of mismatches allowed between loci among individuals (n; default: 1). The following decision frameworks were implemented in selecting the optimal parameters: (1) the value of m was chosen when all samples had coverage depths ≥10 X, since coverage depths of <10 X for multiple samples lead to genotypes that may be unreliable and biased even after filtering (Rochette and Catchen, 2017); (2) the value of M was chosen when the number of polymorphic loci shared by ≥80% of the samples (i.e., r80 loci) began to plateau; lastly, (3) the value of n was iterated among n = M, n = M + 1, and n = M − 1, and the value that generated the highest number of r80 loci was selected. To do so, several runs were performed; we first iterated the value of m from 1 to 9, while keeping the value of M = n = 2. The m value that met our criteria on coverage depths was then fixed while the value of M = n was iterated from 1 to 9. Afterward, the value of M that met the criteria on r80 loci was fixed, while n was iterated. Output from each run was passed on to Stacks’ populations module; here, we filtered loci that adhered to the following criteria: (1) they were present in all sampling locations (p = 7); and (2) they were found in ≥80% of the samples (r = 0.80). Meanwhile, (3) only the first SNP from each polymorphic locus (write_single_snp) with a minimum minor allele frequency of 5% (min_maf = 0.05) was retained; this is to minimize calling loci that are in linkage disequilibrium and alleles that are extremely rare. Using custom bash scripts, the following information from each run was extracted: (1) the coverage depth, and (2) the number of loci shared by 80% of the samples. Visual diagnostics were done by plotting the core assembly metrics in R v.4.0.4 (R Core Team, 2021).
Single Nucleotide Polymorphism Genotyping
Single nucleotide polymorphisms were genotyped from the full dataset using the optimal parameters in the denovo_map.pl pipeline. Correction was done using the rxstacks module with the following settings: (1) the non-biological haplotypes that were unlikely to occur in the population were pruned out (prune_haplo); and (2) the minimum log likelihood ratio to retain a catalog locus (ln_lim) was set to −10.0. The output of the rxstacks module was then passed on to the populations module using the same criteria during parameter optimization.
Further SNP filtering was performed in R v.4.0.4 (R Core Team, 2021) using the packages adegenet v.2.1.3 (Jombart, 2008; Jombart and Ahmed, 2011) and dartR v.1.8.3 (Gruber et al., 2018). First, loci metrics (e.g., call rates) were calculated. Second, the calculated metrics were used to remove missing data by filtering out (1) individuals with call rates <80%, and (2) loci with call rates <100%. Third, each locus was tested for Hardy–Weinberg Equilibrium (HWE) across all populations using the exact test by Wigginton et al. (2005), and those that showed significant departures from HWE expectations (p < 0.05) after Bonferroni correction were removed. Fourth, to limit the influence of non-independent loci, all loci pairs were tested for Linkage Disequilibrium (LD) as implemented in genetics v.1.3.8.1.3 (Warnes et al., 2021; function called via dartR), and pairs that had R2 > 0.80 were removed (Lee et al., 2018; Mendiola and Ravago-Gotanco, 2021). Finally, to eliminate loci exhibiting extremely high heterozygosity which could be due to false SNP calls or assembly errors, loci with observed heterozygosity (HO) > 0.60 were removed from the dataset (Ackiss et al., 2018; Lee et al., 2018; Mendiola and Ravago-Gotanco, 2021). The SNP panel after post-processing is hereafter referred to as the “full panel.”
Outlier Screening and Panel Preparation
The full panel was screened for loci that were putatively under selection. Five outlier detection methods were used, four of which were FST-based approaches, and one was an individual-based approach. FST-based outlier detection simulates a null distribution from the genetic differentiation between pre-defined groups, and loci that deviate from this distribution are tagged as outliers (Foll and Gaggiotti, 2008; Excoffier et al., 2009). Meanwhile, individual-based approaches no longer calculate FST indices to detect outliers; rather, these approaches utilize multivariate methods and detect outliers not based on how they drive differentiation between groups, but on how they drive genetic structure as a whole (Luu et al., 2017).
FST-based outlier detection included (1) Arlequin v.3.5.2.2 (Excoffier and Lischer, 2010); (2) BayeScan v.2.1 (Foll and Gaggiotti, 2008); and the R packages (3) fsthet (Flanagan and Jones, 2017); and (4) OutFLANK v 0.2 (Whitlock and Lotterhos, 2015). Arlequin utilizes an explicit hierarchical island model in generating the FST null distribution, thereby making outlier detection more robust to uncertainties on the exact number of groups and demes per group in the system (Excoffier et al., 2009). Detecting loci under selection utilized 10 simulated groups with 100 demes per group; this was run for 20,000 simulations, and loci that had p-values ≤ 0.01 beyond the 99% confidence interval were tagged as outliers. BayeScan utilizes a Bayesian approach to estimate the posterior probability that a given locus is under the effect of selection by comparing two alternative models based on the inclusion or exclusion of selection (Foll and Gaggiotti, 2008). Default chain parameters were used in the analysis (sample size = 5,000; thinning interval = 10; pilot runs = 20; pilot run length = 5,000, and additional burn-in = 50,000), and the convergence of the Markov Chain Monte Carlo (MCMC) simulation was assessed using the R package, coda (Plummer et al., 2006). Loci with false discovery rate (FDR) q-value < 0.05 were considered outliers. Fsthet v.1.0.1 (Flanagan and Jones, 2018) calculates smoothed quantiles from the dataset to identify putatively outlier loci with extreme FST values relative to heterozygosity (Flanagan and Jones, 2017). The FST analog, β, was used to calculate genetic differentiation, and loci with β values outside the 95% quantiles of the Fst-Heterozygosity distribution were tagged as outliers. OutFLANK generates the null distribution by trimming extreme FST values from the observed distribution and fitting a modified X2 probability density distribution on the remaining values (Whitlock and Lotterhos, 2015). OutFLANK was executed using default parameters (left and right trim fraction = 0.05; minimum heterozygosity = 0.10), and loci were considered outliers when FDR q-value < 0.05.
The R package, pcadapt, was used as the individual-based outlier detection approach. The method utilizes principal components analysis (PCA) to infer population structure from the genomic dataset, and then uses this information to detect outlier loci. A preliminary screening was done by running PCA several times and determining the largest value of the number of principal components (K) before the screeplot plateaus. Afterward, Mahalanobis distance is calculated for each locus; this test statistic measures up to what extent a SNP is related to K that was used to infer structure (Luu et al., 2017). Loci with Mahalanobis distances that do not follow the distribution of the main bulk of points and have FDR q-value < 0.05 were considered as outliers.
Additional SNP panels were generated based on the results of outlier screening. The neutral panel was generated by removing all loci that were tagged as outliers from the full panel. Meanwhile, the outlier panel was generated by retaining only the loci that were identified as outliers by at least two detection methods.
Genetic Diversity and Population Structure
The following genetic diversity indices were calculated for all SNP panels using the summary function of adegenet: (1) number of alleles (NA), (2) percentage of observed alleles (AO), (3) observed heterozygosity (HO), and (4) expected heterozygosity (HE) under HWE. Calculations were done across various hierarchical groupings of individuals: global, regional, and embayment.
Spatial patterns of genetic structure for all SNP panels were examined using discriminant analysis of principal components (DAPC). This method first utilizes PCA to summarize the overall variation in the genomic dataset in as few dimensions as possible; the appropriate number PC axes is then subjected to discriminant analysis (DA) which maximizes between-group while minimizing within-group variation, thereby achieving the best discrimination of individuals (Jombart et al., 2010). The number of groups assigned as priors to DA was initially identified using K-means clustering, and the optimal number of PCs used for DA was determined using cross-validation with 1,000 iterations.
The magnitude of genetic differentiation was calculated using the FST analog, θ, by Weir and Cockerham (1984). Global FST was calculated using hierfstat v.0.5-7 (Goudet, 2005; Goudet and Jombart, 2020), the significance of which was tested with 1,000 permutations. Pairwise FST among bays were calculated as implemented in dartR; pairwise genetic variation was considered significant when the 95% confidence interval calculated after 1,000 bootstrap replicates did not include FST ≤ 0. Meanwhile, the hypotheses of spatial genetic differentiation within and between regions, as well as those inferred from DAPC and pairwise FST, were tested using hierarchical analysis of molecular variance (AMOVA; Excoffier et al., 1992). This was done using the wrapper function of poppr v.2.9.0 (Kamvar et al., 2014, 2015), which in turn carries out AMOVA as implemented in ade4 v.1.7-16 (Dray and Dufour, 2007); calculation of variance within individuals was excluded from the analysis, and the significance of the calculated statistics was tested using 1,000 permutations.
Identifying Candidate Genes Under Selection
The associated RAD sequences of all loci under the outlier panel were extracted from the Stacks catalog and were identified using NCBI-Basic Local Alignment Search Tool (BLAST1). The sequences were queried in the nucleotide collection (nr/nt) database using only Actinopterygii sequences (taxid: 7898). The search was optimized for somewhat similar sequences (blastn) with the E-value set to 0.001. Functional annotation of the identified sequences was done using the UniProt database.2
Moreover, the association between the outlier loci and environmental parameters were elucidated by correlating allele frequencies with remotely sensed oceanographic parameters. Only the loci that had loadings which contributed greater than 75% to the explained variation along the first discriminant axis in the DAPC ordination of the outlier panel were considered. SST (°C), chl-a (mg m–3), and POC (mg m–3) from January 2014 to December 2016 were processed as described in Palermo (2021). All these remotely sensed parameters were downloaded and compiled on a 4-km grid scale from the NASA Goddard Space Flight Center Distributed Active Archive Center.3 The gridded data were extracted and binned average in SeaDAS per demarcated sardine fishing ground. Spatial variation between NMR and NZP was assessed using t-test, with p-values adjusted for multiple comparisons using Bonferroni correction. Prior to t-test, environmental parameters were transformed using the ordered quantile normalization technique implemented in the bestNormalize package (Peterson and Cavanaugh, 2020). The mean values of the oceanographic parameters were then correlated with the mean focal allele frequencies using Spearman’s rho (ρ), with p-values also adjusted using Bonferroni correction.
R Packages
In addition to R packages already mentioned, the following were used for data analyses. Data wrangling and other miscellaneous functions were from dplyr v.1.0.6 (Wickham et al., 2021), factoextra v.1.0.7 (Kassambara and Mundt, 2020), forcats v.0.5.1 (Wickham, 2021a), magrittr v.2.0.1 (Bache and Wickham, 2020), purrr v.0.3.4 (Henry and Wickham, 2020), reshape2 v.1.4.4 (Wickham, 2007), rstatix v.0.7.0 (Kassambara, 2021), tictoc v.1.0 (Izrailev, 2014), and tidyr v.1.1.3 (Wickham, 2021b). Plotting and visualization functions utilized cowplot v.1.1.1 (Wilke, 2020), ggplot2 v.3.3.3 (Wickham, 2016), ggpubr v.0.4.0 (Kassambara, 2020), ggrepel v.0.9.1 (Slowikowski, 2021), gridExtra v.2.3 (Auguie, 2017), and scales v.1.1.1 (Wickham and Seidel, 2020). Genomic analyses and formatting genomic dataset utilized ape v.5.5 (Paradis and Schliep, 2019), diveRsity v1.9.90 (Keenan et al., 2013), mmod v.1.3.3 (Winter, 2012), pegas v.0.14 (Paradis, 2010), poppr v.2.9.0 (Kamvar et al., 2014), and zvau v.0.27 (Lustrik and Skrbinsek, 2016).
Results
De novo Assembly Parameter Optimization
From a total of 239,995,133 reads obtained from restriction site-associated DNA sequencing (RADseq), the process_radtags program removed 264,906 (0.11%) low quality reads. Based on the remaining reads, the RAD dataset had an average of 4,994,380 (±3,283,774 SD) reads ranging from 347,394 to 14,363,982 (Figure 2A), with read lengths ranging from 92 to 96 bases. Since samples with low number of reads tend to decrease the number of loci that can be genotyped from the dataset, we dropped six samples that had read counts <1.6 × 10⁶. The first five samples with the highest read count per bay were then used to optimize the parameters for Stacks de novo assembly (denovo_map.pl).
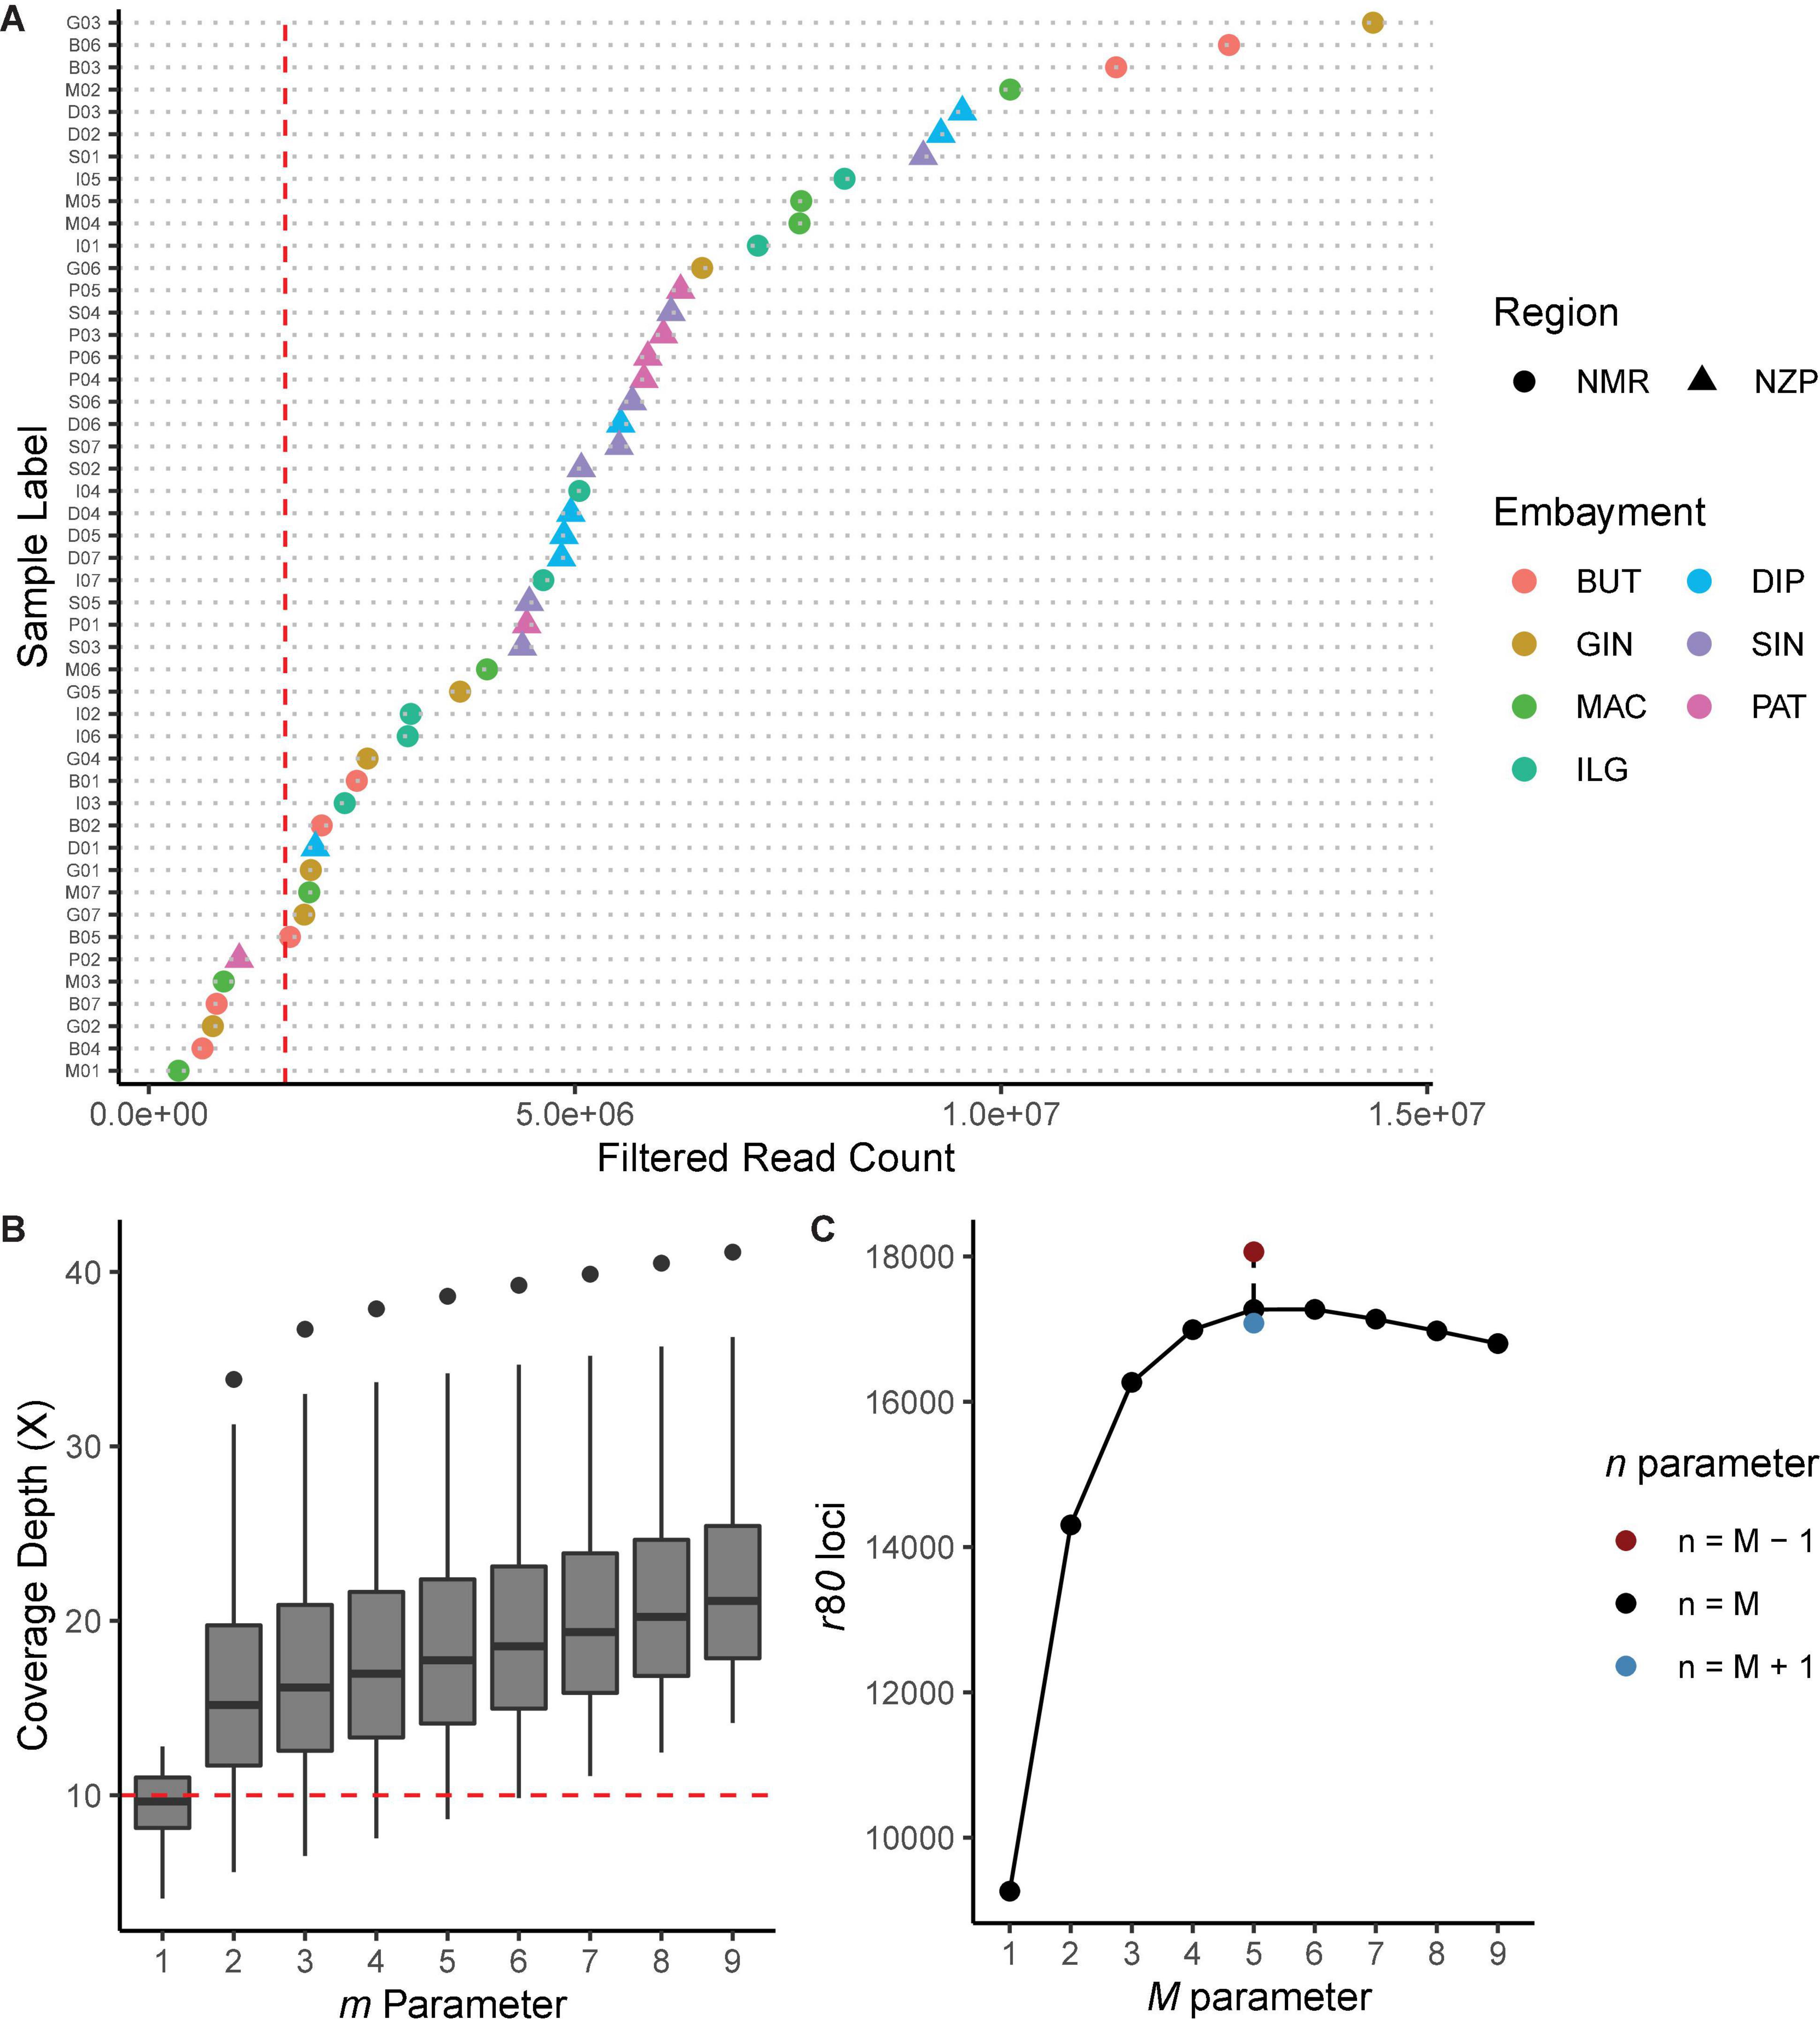
Figure 2. Diagnostic plots for Stacks de novo assembly. (A) Filtered read count per sample. Shapes indicate the region, while colors indicate the bays from where the samples were collected. Samples with read count <1.6 × 10⁶ (vertical red line) were removed from the analysis. (B) Coverage depth (X) for every iteration of the m parameter, while holding the other core parameters constant (M = n = 2). The lowest m value where all samples had X ≥ 10 (horizontal red line) was chosen. (C) Number of loci shared by ≥80% of the samples (i.e., r80 loci) for every iteration of M and n core parameters, while holding m 6 constant. Parameter values that generated the highest number of r80 loci were selected.
Iteration of the m parameter while holding M and n constant showed that increasing m values led to the overall increase in coverage depths (Figure 2B). We have selected m = 6 since this is the lowest parameter value with samples having coverage depths ≥10 X; at this value, the resulting average coverage depth was 20 X (± 7.58 SD). Meanwhile, increasing the value of M while holding m and n constant resulted in the increase in the number of r80 loci. This peaked at M = 5 (nloci = 17,268), and then decreased at succeeding parameter values (Figure 2C). Lastly, iterating n while holding the other two parameters constant showed that n = 4 further increased the number of r80 loci (nloci = 18,063). Based on our criteria, the optimal parameters for denovo_map.pl were m = 6, M = 5, and n = 4.
Genotyping and Outlier Detection
Using the optimal de novo assembly parameters on the full dataset with 42 samples, a total of 11,075 SNPs were genotyped with Stacks. From these, five samples and 7,400 SNPs did not pass the thresholds for call rates and were thus removed. From the remaining 3,675 SNPs, 20 deviated from HWE, 74 showed high levels of LD, and eight had HO > 0.60; these loci were thus consequently removed. The remaining 37 samples and 3,573 SNPs were used to generate the full panel.
Three of the five methods used were able to detect putatively outlier loci from the full panel. While BayeScan and OutFLANK were unable to detect any outliers, Arlequin detected 64 with FST values ranging from 0.12 to 0.27, fsthet detected 173 with β values ranging from −0.03 to 0.27, and pcadapt detected 21 with Mahalanobis distances ranging from 26.44 to 74.82 (Figure 3A). All 225 loci tagged as putative outliers were removed from the full panel to generate a neutral panel of 3,348 SNPs. Meanwhile, out of all the outlier loci, 31 were common to both Arlequin and fsthet, while pcadapt had no common outliers with the other two methods (Figure 3B); these 31 loci were thus used to generate the outlier panel.
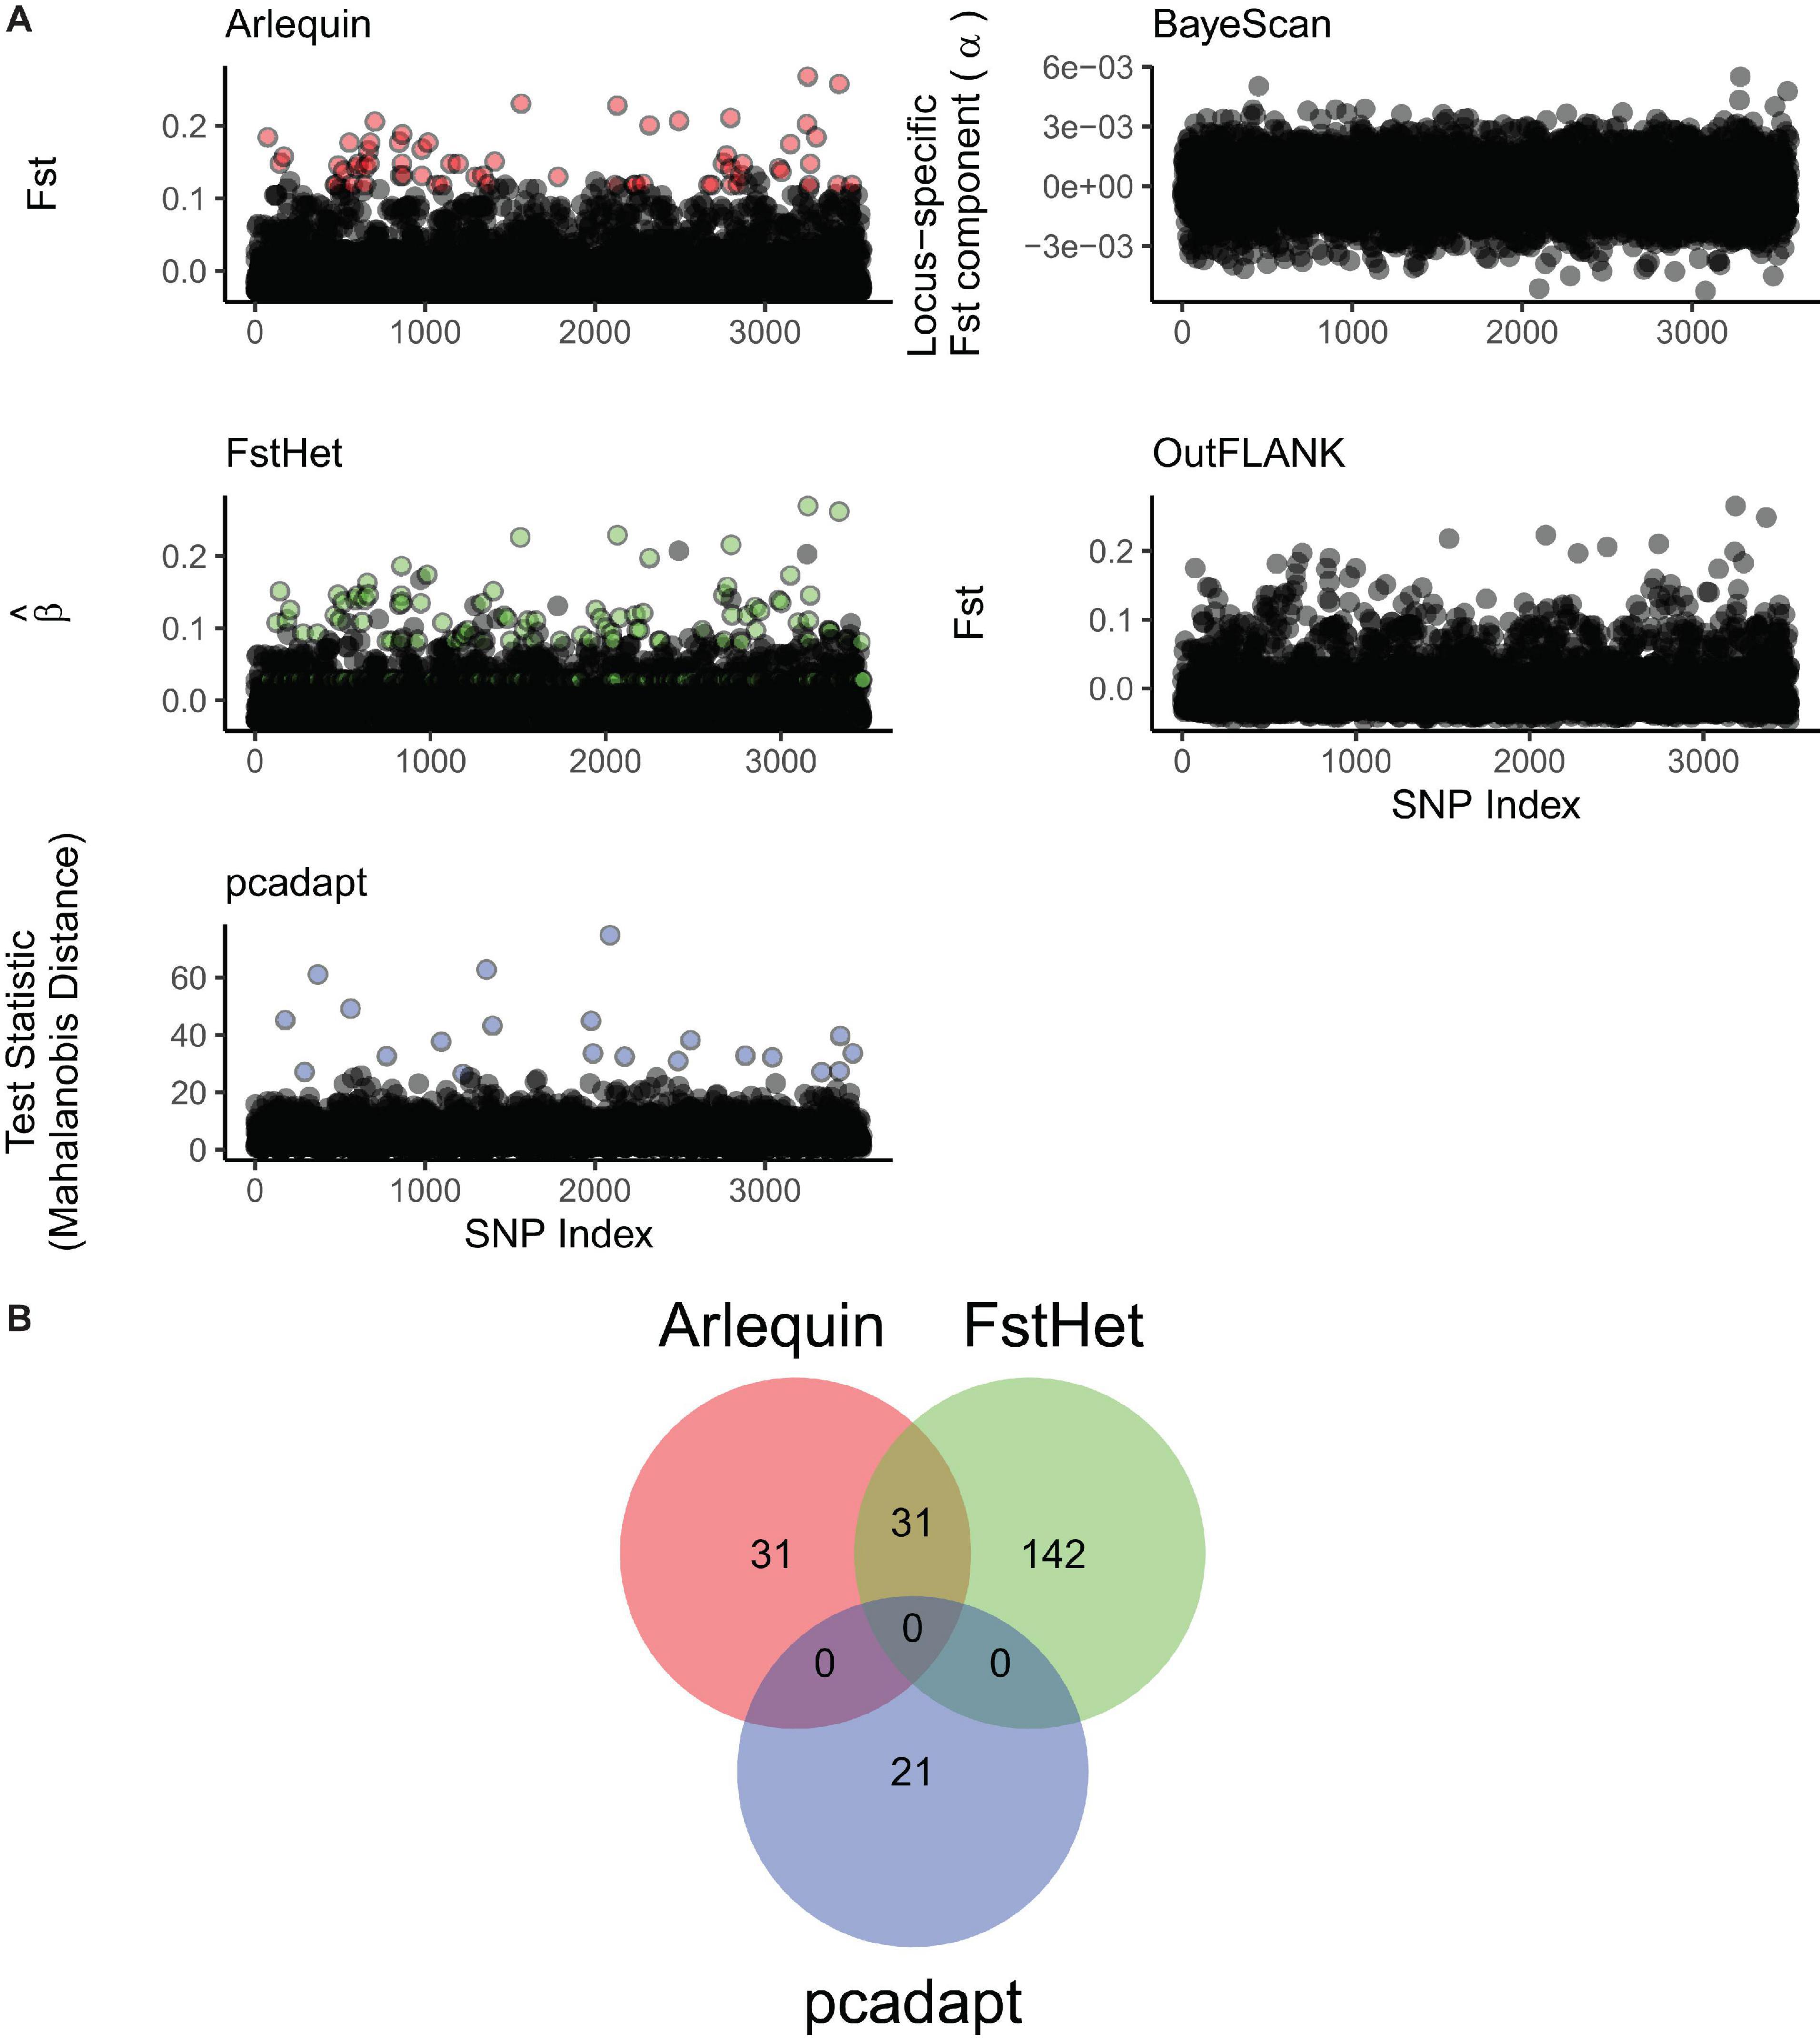
Figure 3. Screening of putatively outlier loci from the genomic dataset. (A) Manhattan plots of the different outlier detection methods used. Arlequin, fsthet, and pcadapt were able to detect outliers (colored circles), while BayeScan and OutFLANK did not. (B) Venn diagram showing the number of loci flagged as outliers by the three outlier detection methods, and those that are common between them.
Genetic Diversity and Population Genetic Structure
All SNP panels consisted of 37 samples, 19 coming from NMR and 18 from NZP, with four to seven samples per bay (Table 1). The full and neutral panels had almost similar genetic diversity indices between regions. Specifically, both regions had AO > 99%, and although heterozygosity was slightly higher in NZP (full panel: HO = 0.226 ± 0.034 SE, HE = 0.233 ± 0.031; neutral panel: HO = 0.226 ± 0.034, HE = 0.232 ± 0.031) compared to NMR (full panel: HO = 0.211 ± 0.032, HE = 0.226 ± 0.031; neutral Panel: HO = 0.216 ± 0.031, HE = 0.232 ± 0.030), such variation was not significant (t-test Bonferroni-adjusted p-values > 0.05). In contrast, the outlier panel showed disparities between the two regions. All observed alleles were represented in NMR (AO = 100%), while only 93.55% were represented in NZP. Moreover, heterozygosity was significantly higher in NZP (HO = 0.314 ± 0.042; HE = 0.328 ± 0.040) than NMR (HO = 0.219 ± 0.032; HE = 0.241 ± 0.036) (t-test Bonferroni-adjusted p-values < 0.05 for both HO and HE).
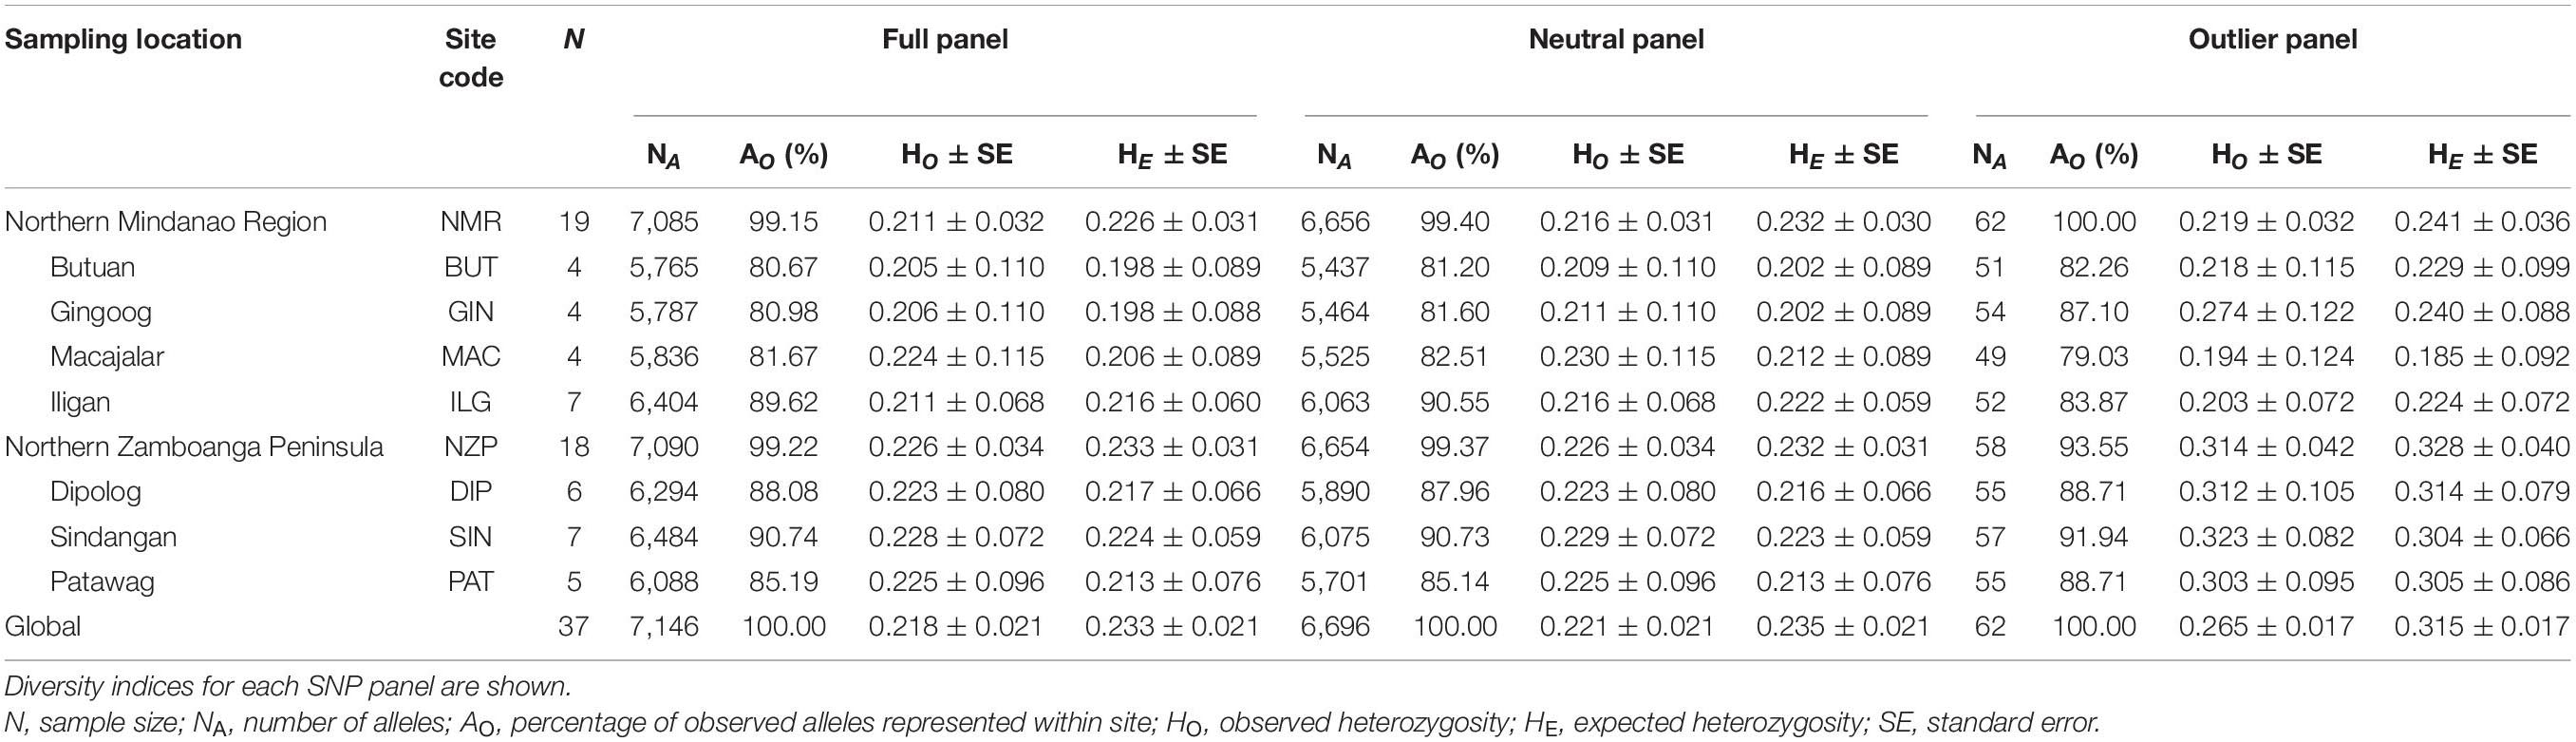
Table 1. Sampling information and genetic diversity indices of Sardinella lemuru along the northern coast of Mindanao.
Various analyses done on full and neutral SNP panels did not reveal evidence of genetic differentiation. PCA was unable to recover distinct clusters in the ordination, and K-means clustering recovered only one group for all samples (Figures 4A,B). Furthermore, genetic differentiation was negligible (global FST ∼ 0; p > 0.05 pairwise FST = −0.009 to 0.007; Figure 5). Lastly, hierarchical AMOVA did not recover significant genetic variation among samples within region (≤0.05% variance explained; FSC ∼ 0; p > 0.05) nor between regions (∼ 0.00% variance explained; FCT ∼ 0; p > 0.05; Table 2).
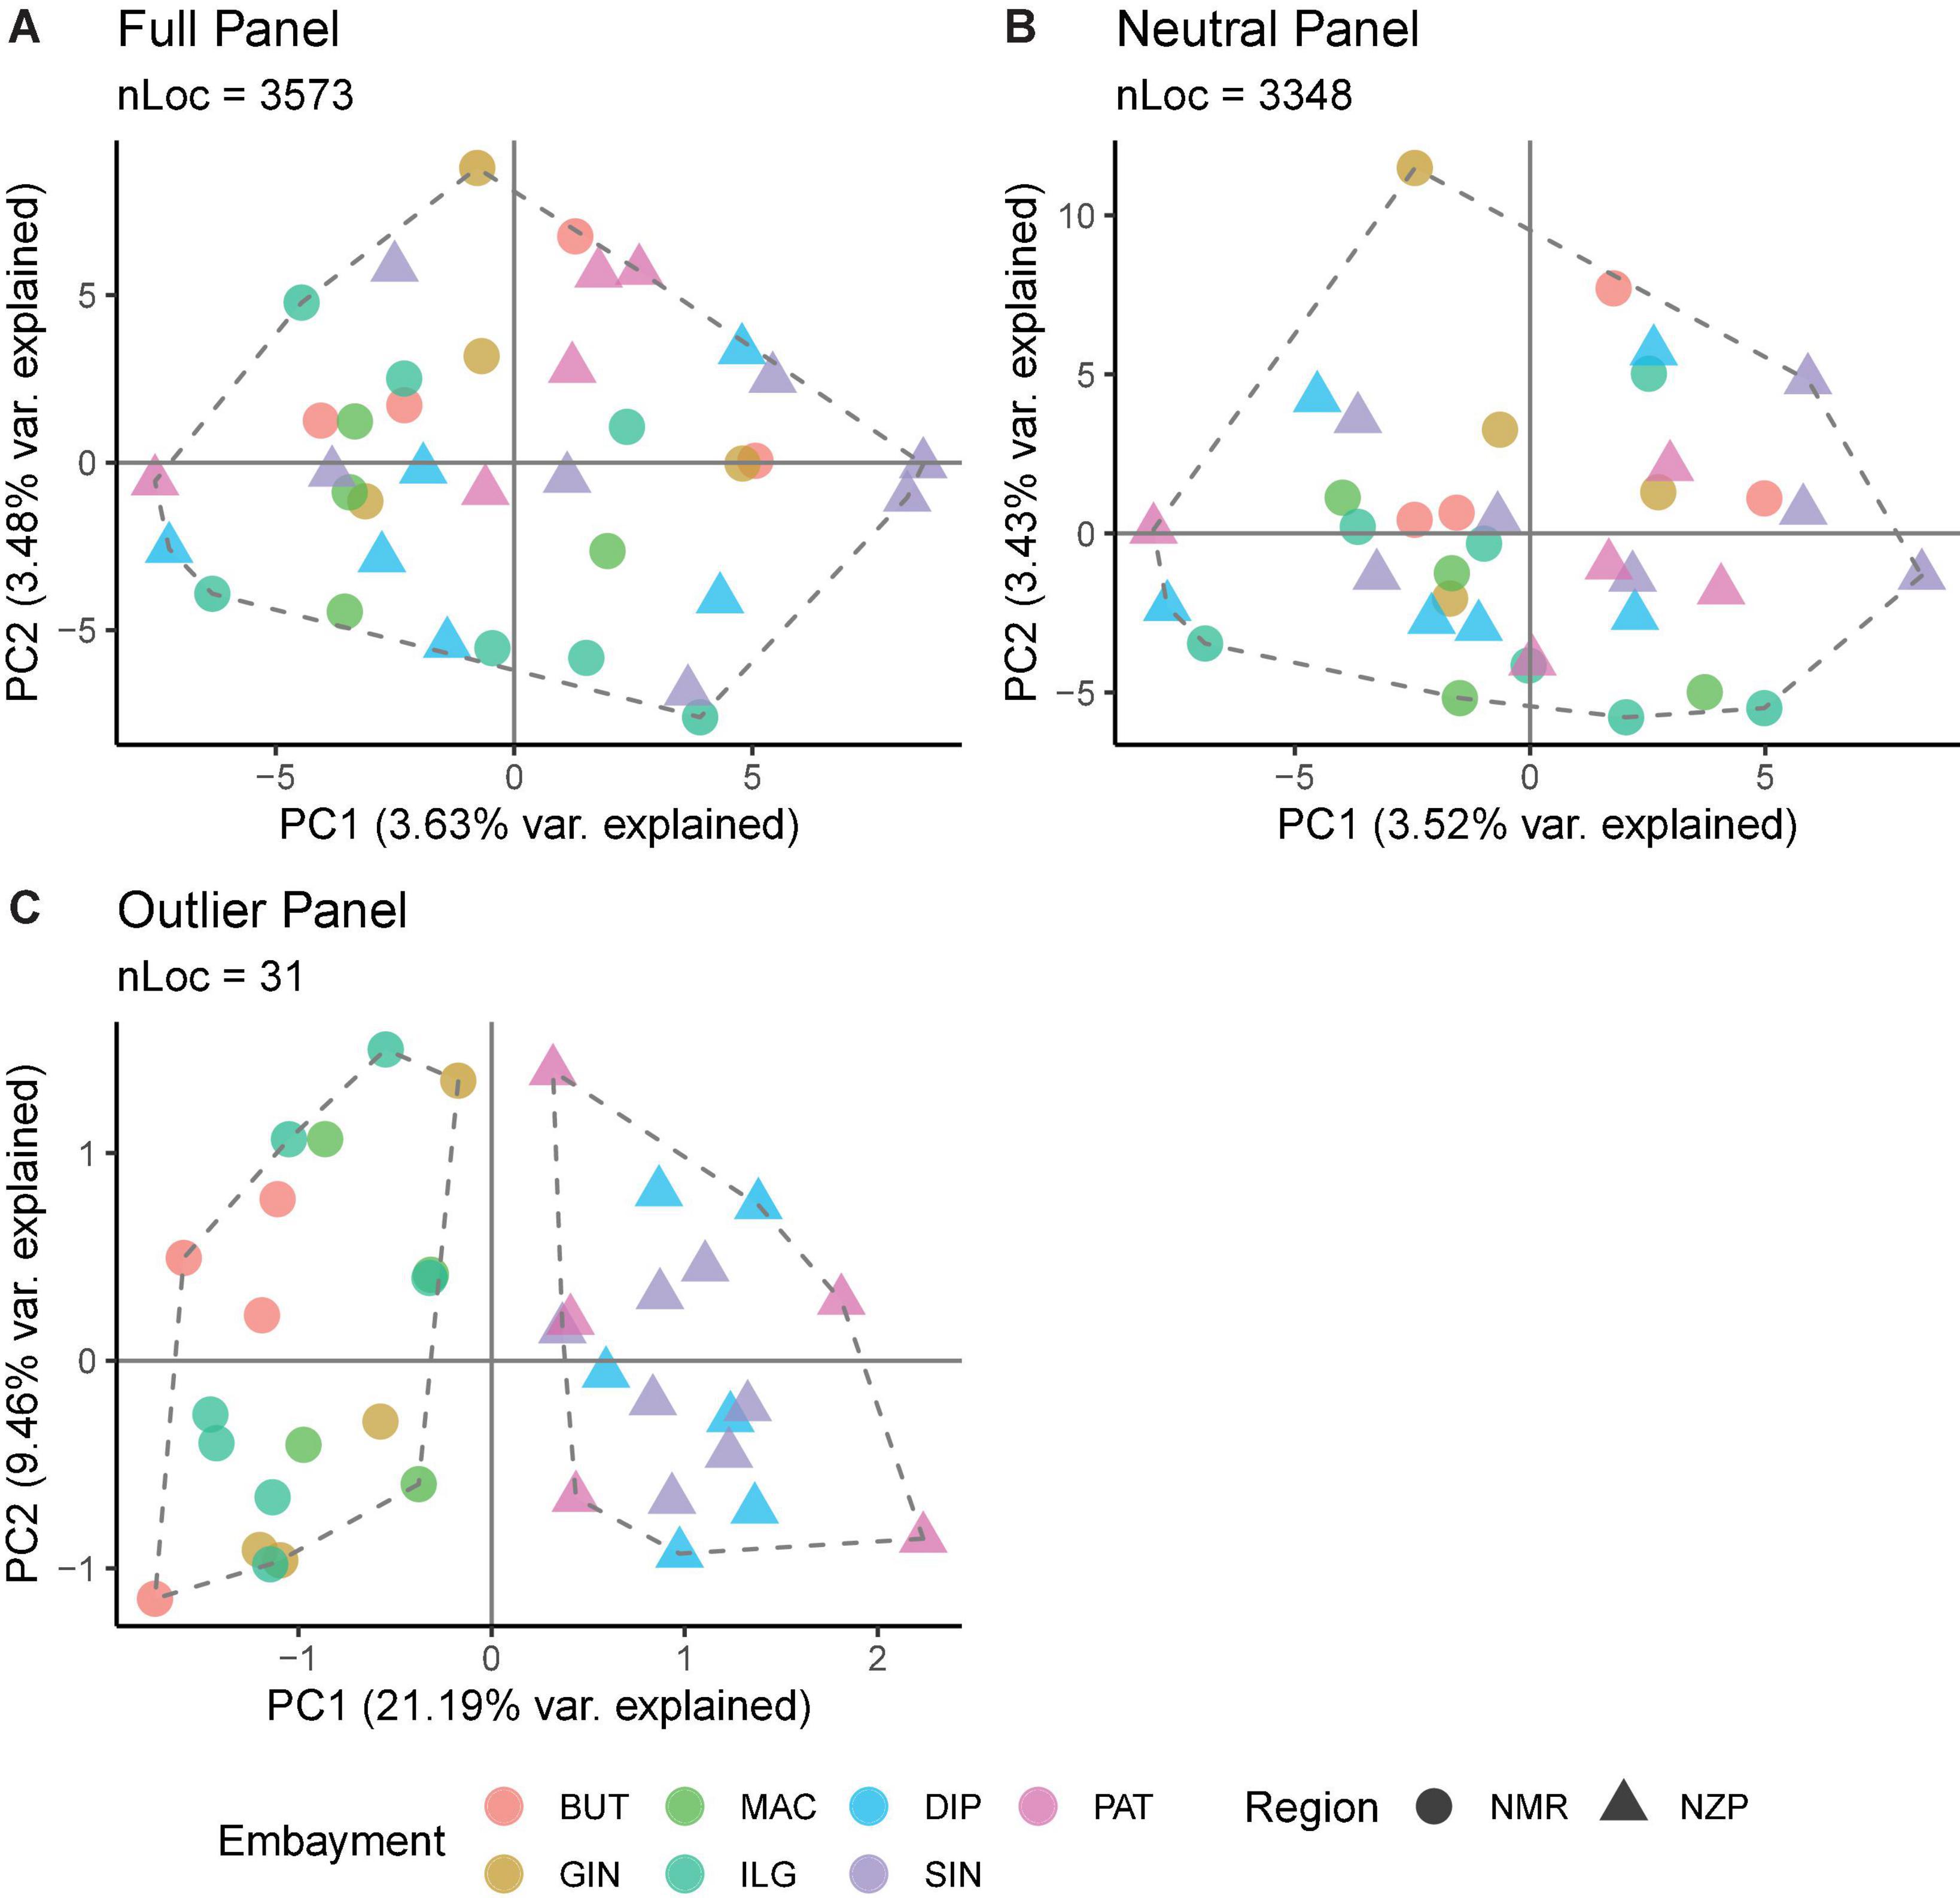
Figure 4. Summary of the ordination analyses done on the (A) full, (B) neutral, and (C) outlier SNP panels. The number of loci (nLoc) for each panel is shown. Colors indicate the bays, while shapes indicate the regions. The ordination plot was projected using PCA scores, the dashed polygons indicate the optimal number of groups inferred from K-means clustering, and the points within the polygon depict the membership of samples inferred from DAPC.
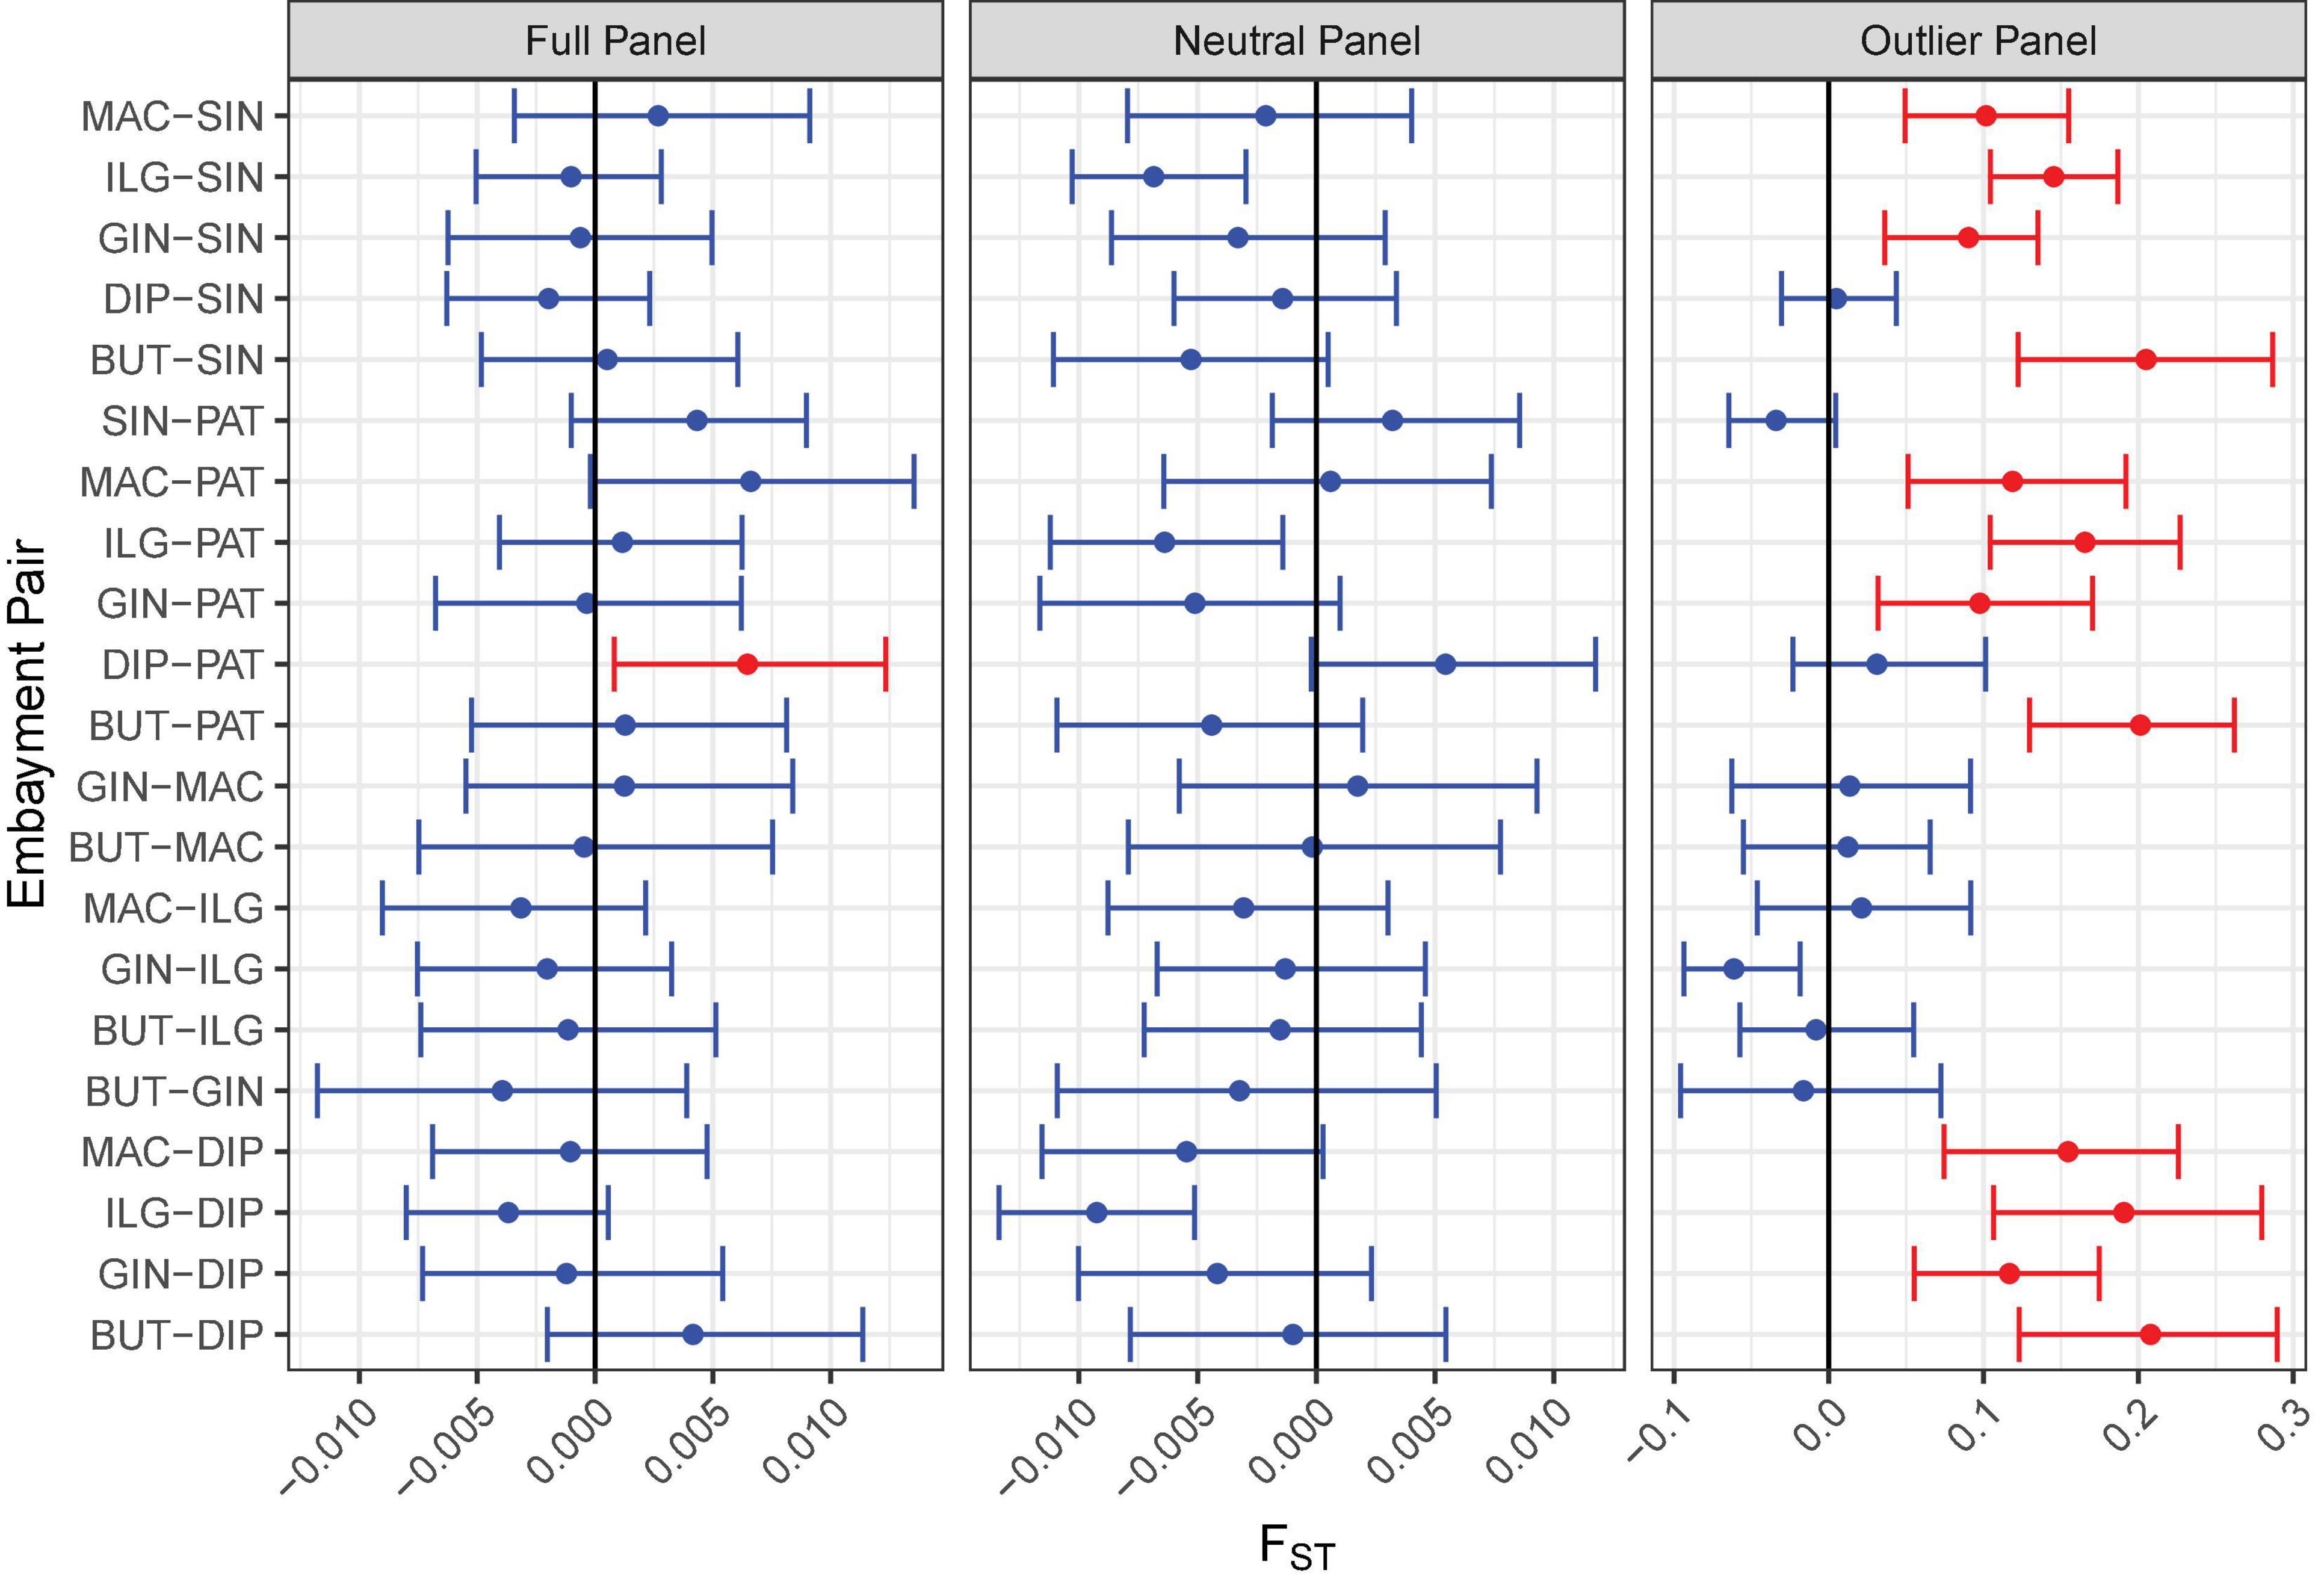
Figure 5. Pairwise FST comparison among bays for all SNP panels. The FST analog by Weir and Cockerham (1984) was used in the calculation. The error bar indicates the 95% confidence interval of the estimate based on 1,000 iterations. Significant comparisons are shown in red.
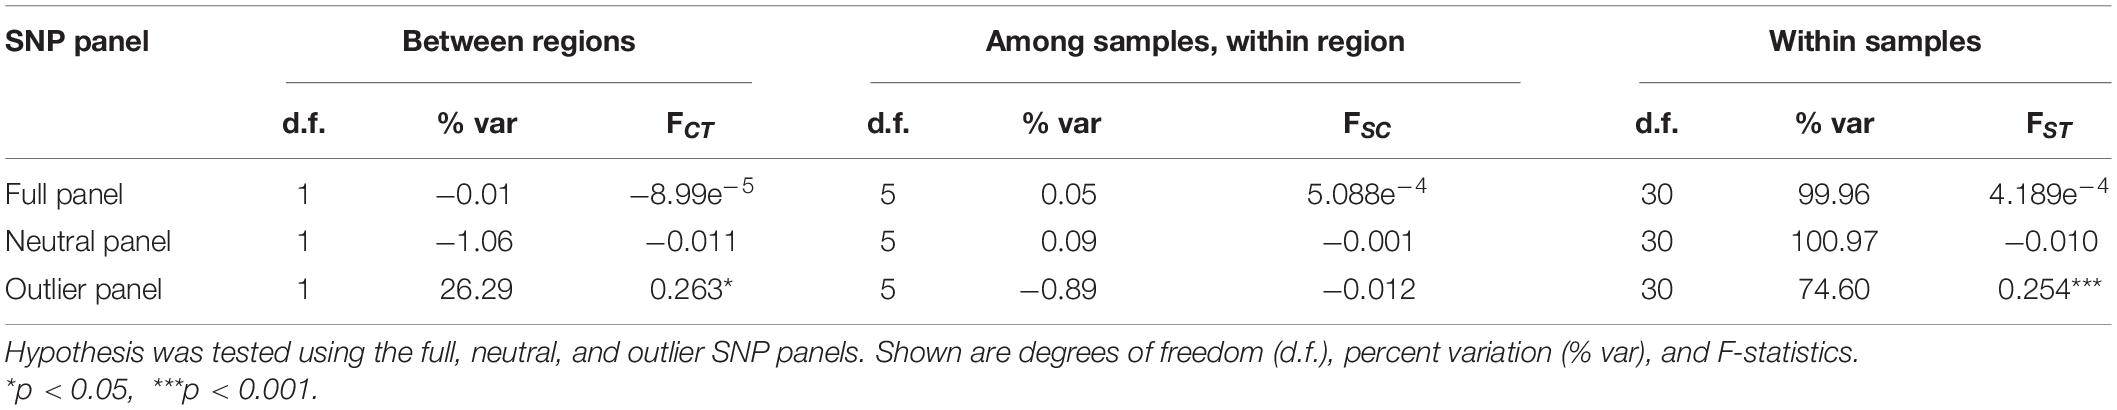
Table 2. Hierarchical analysis of molecular variance (AMOVA) testing the hypothesis of Sardinella lemuru genetic structure within and between Northern Mindanao Region (NMR) and Northern Zamboanga Peninsula (NZP).
In contrast, the outlier panel revealed regional genetic structure. PCA ordination was able to separate the different bays into their respective regions along the first axis (21.19% variance explained), while residual variance among samples within region was shown along the second axis (9.46% variance explained; Figure 4C). K-means clustering suggested K = 2 which corresponded to the two regions, and DAPC was able to assign the individuals from the different bays into their respective regions. Genetic differentiation was significant overall (global FST = 0.161, p = 0.001). Pairwise genetic differentiation was significant between regions (pairwise FST = 0.09–0.21), but not within regions (pairwise FST = −0.061 to 0.031; Figure 5). Lastly, hierarchical AMOVA recovered a significant partitioning of genetic variation between regions (26.29% variance explained, FCT = 0.263, p = 0.03) and within samples (74.60% variance explained, FST = 0.254, p < 0.001), but none among samples within region (−0.89% variance explained, FSC = −0.012, p > 0.05; Table 2).
Candidate Genes Under Selection
Out of the 31 loci putatively under selection, nine were identified using BLAST, four of which were unannotated loci belonging to assembled genomes of various species under Actinopterygii. The remaining five were annotated genes that code for various predicted proteins which largely play roles in organismal development, with percent identities ranging from 87.50 to 93.75% (Table 3). With reference to DAPC, eight loci were found to greatly drive regional differentiation based on their respective loadings; seven of these loci were unidentified, while one (SNP_8118) was identified to be a fragment of the mRNA for the diphthamide biosynthesis 2 (dph2) protein.
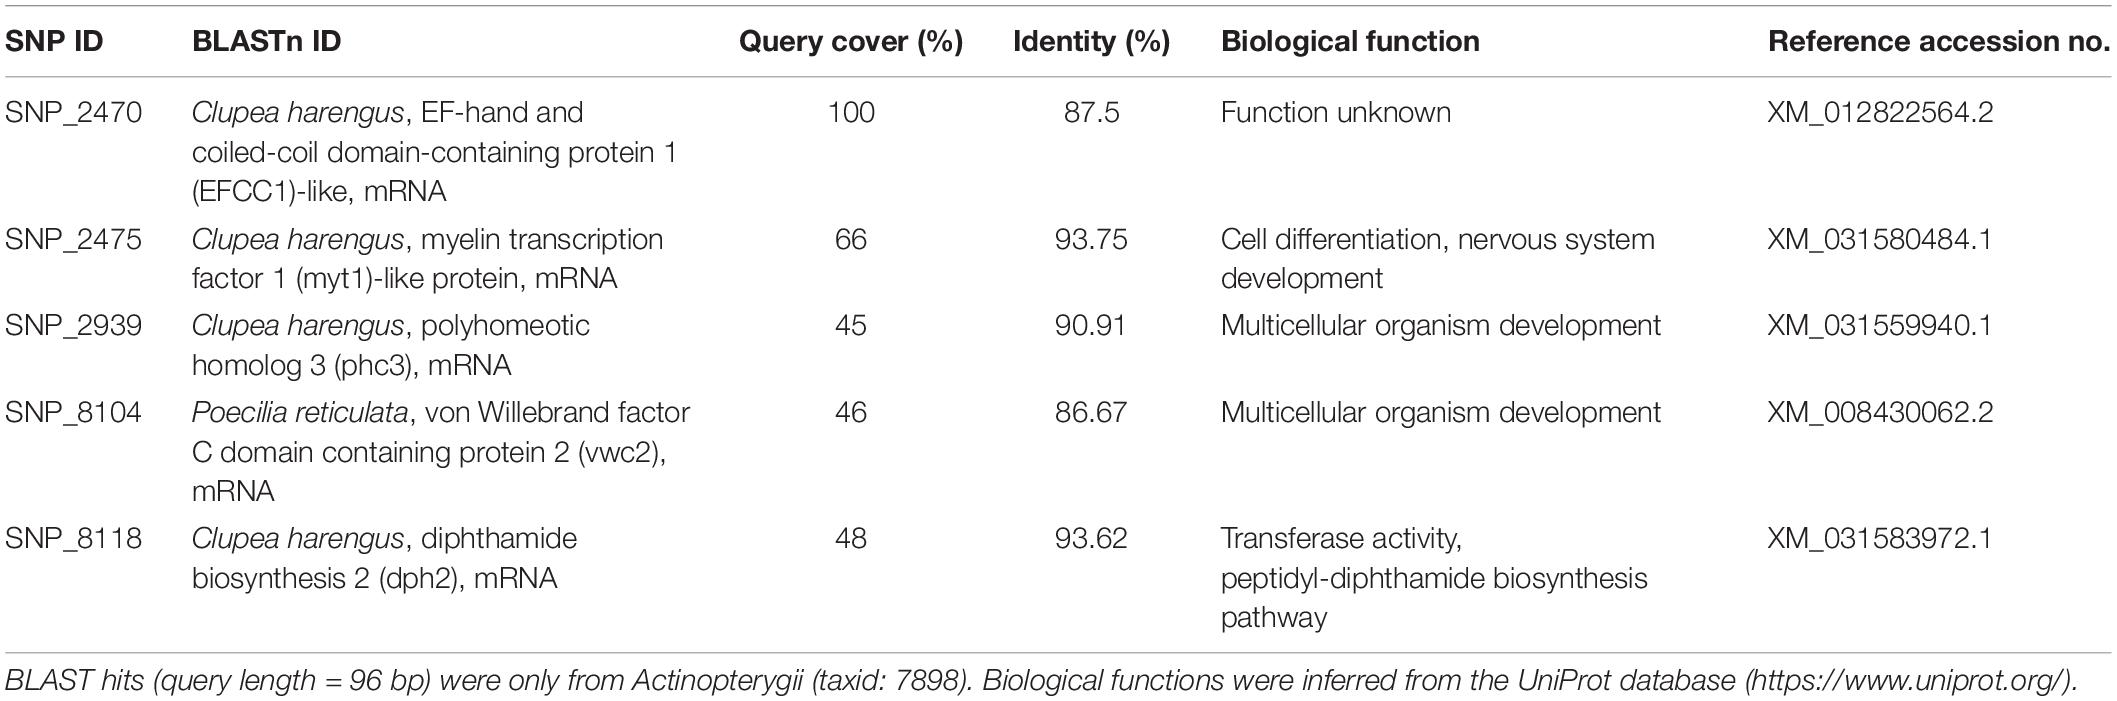
Table 3. Loci putatively under selection that had predicted protein functions.
The 36-month average of remotely sensed parameters highlighted the regional variability between NMR and NZP (Figure 6A). Bays in NZP had cooler waters compared to those in NMR, and regional variation in SST (SSTNZP = 28.72 ± 0.14°C SE; SSTNMR = 29.52 ± 0.09°C) was significant ( = 4.78, p.adj < 0.001). Furthermore, the higher concentrations of chl-a and POC in NZP (chl-a = 1.93 ± 0.31 mg m–3; POC = 228.11 ± 25.97 mg m–3) compared to NMR (chl-a = 0.64 ± 0.07 mg m–3; POC = 120.74 ± 6.52 mg m–3) were also significant ( = −2.44, p.adj < 0.05; = −2.47, p.adj < 0.05). Likewise, the mean frequencies of the focal allele of the shortlisted SNPs also varied at a regional scale (Figure 6B). Some of these SNPs had a focal allele that was absent in some bays of one region but was present in all bays of the other. Spearman correlation further showed three loci (SNP_1895, SNP_2472, and SNP_9403) that were strongly associated with SST (ρ ≥ 0.94, p.adj < 0.05; Table 4 and Supplementary Figures 1–3).
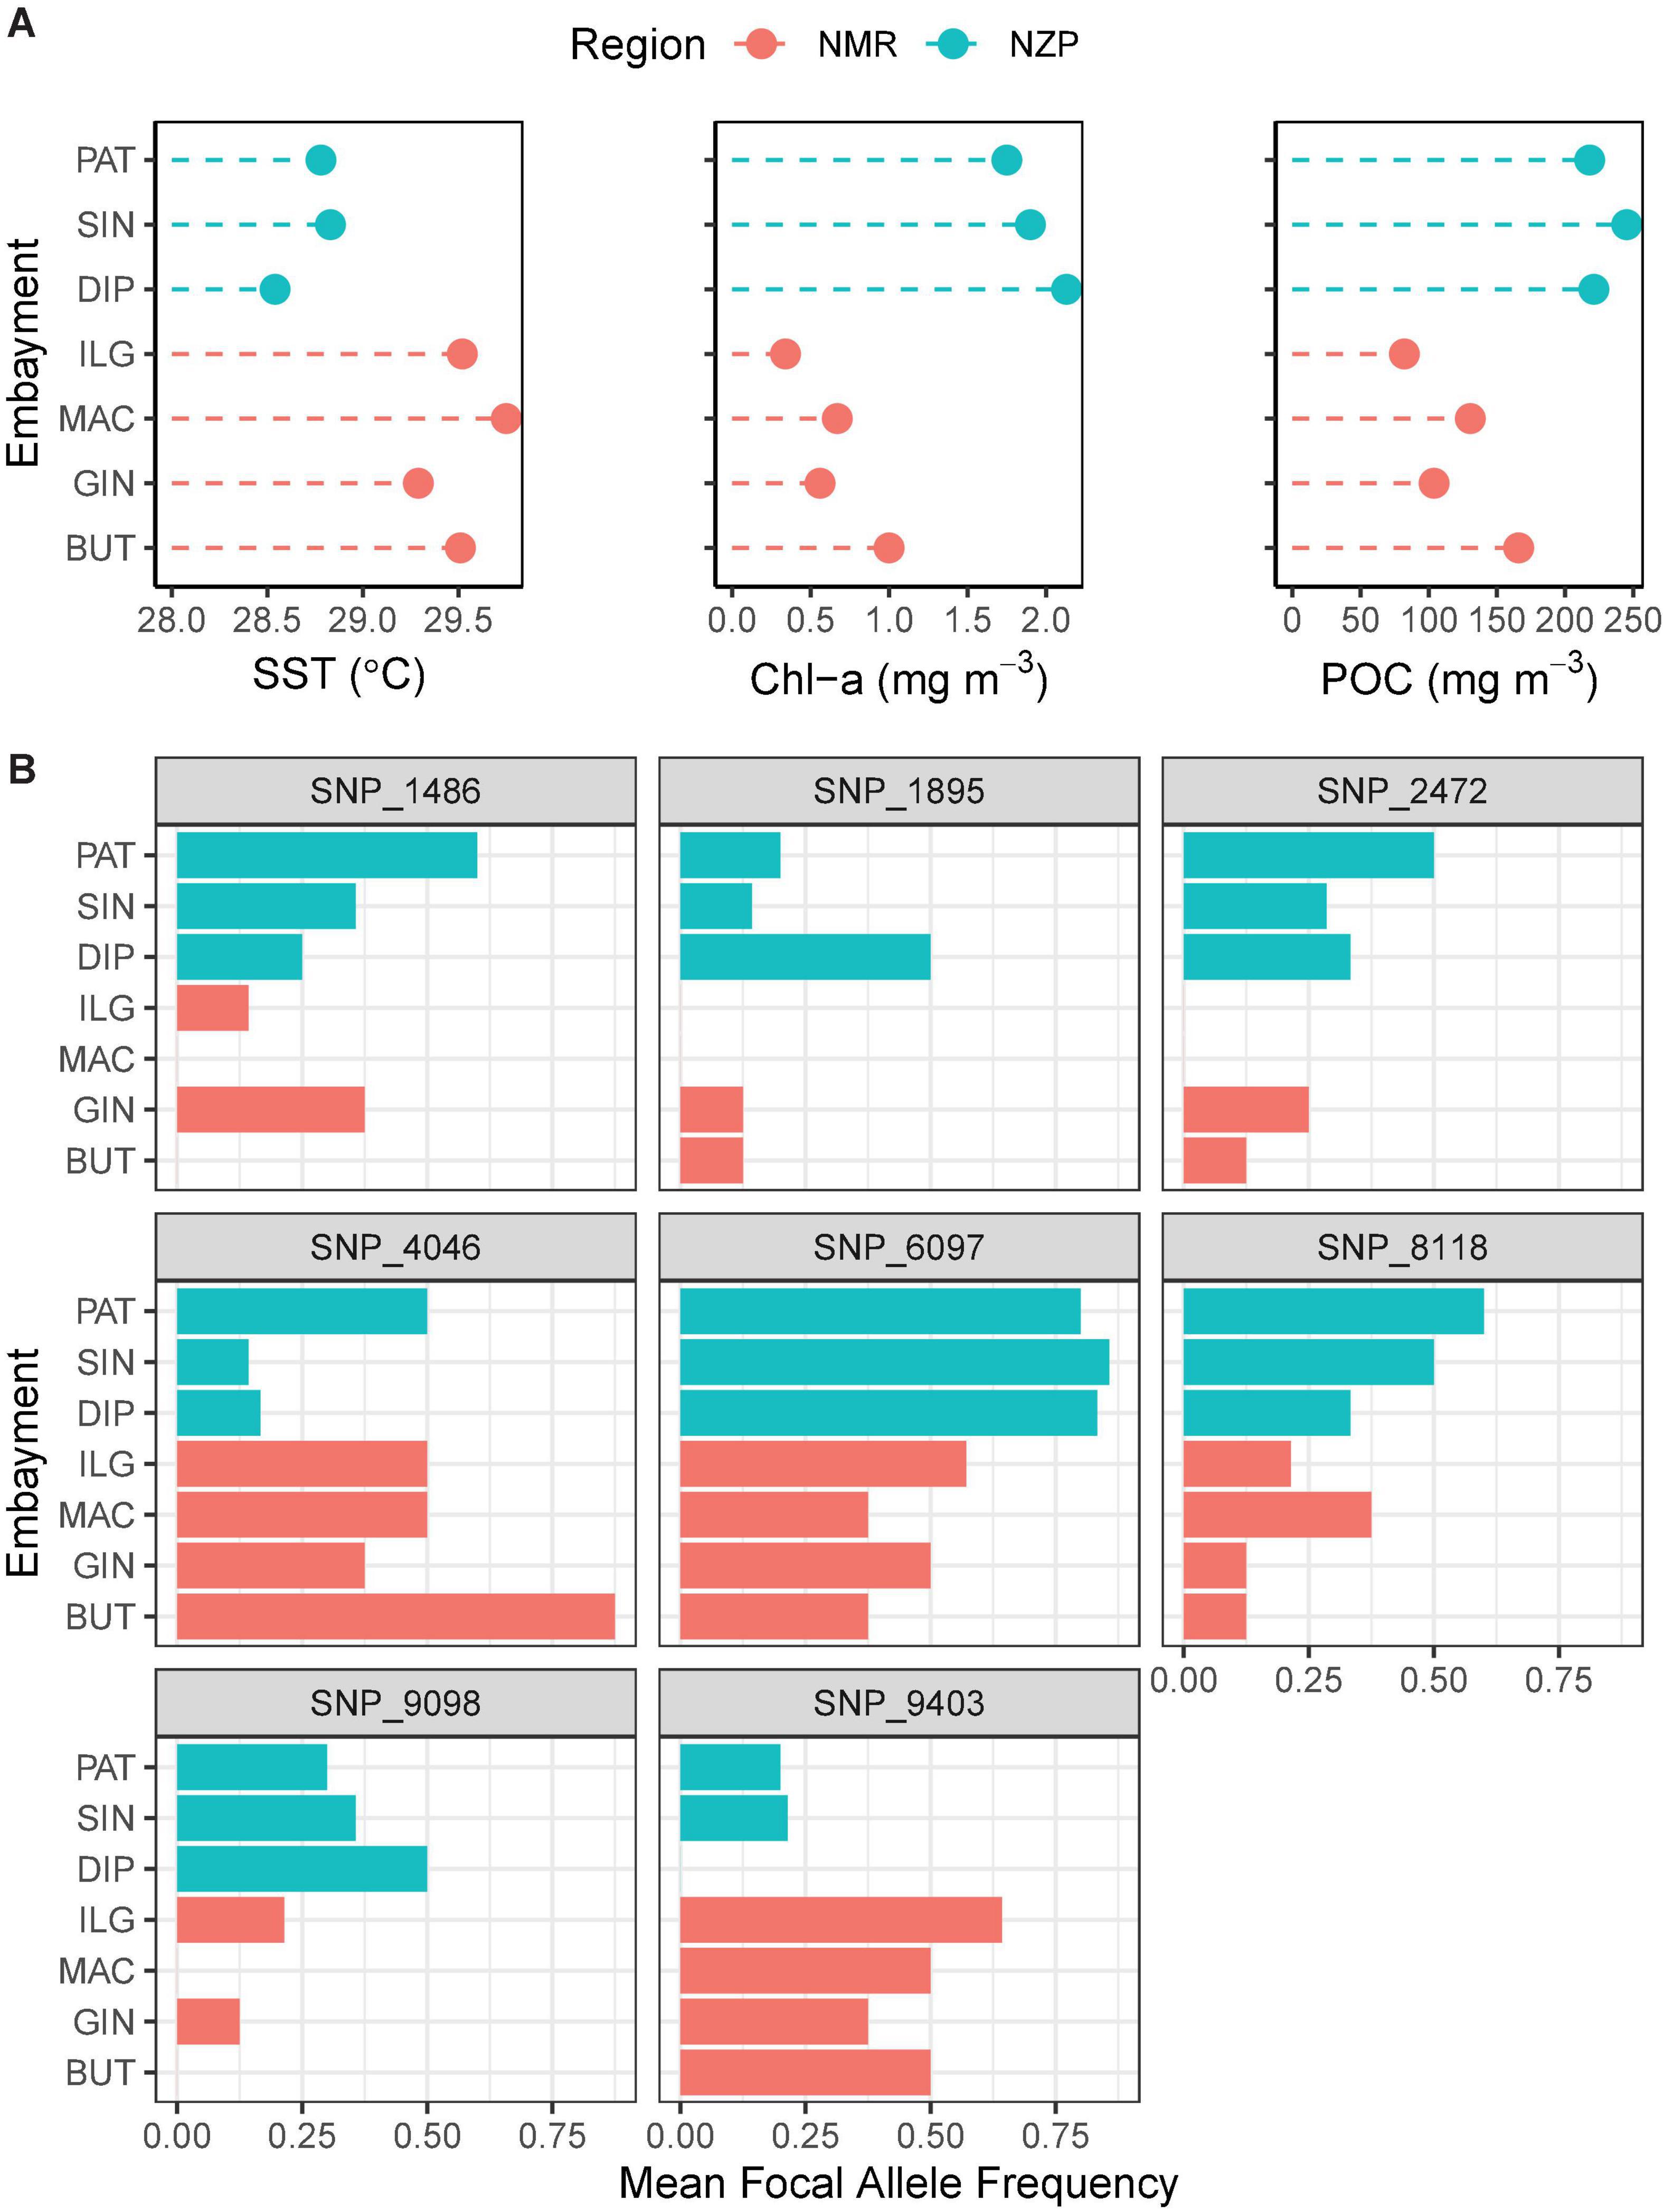
Figure 6. Association between remotely sensed (RS) oceanographic parameters and focal allele frequencies. Colors indicate region (NMR, Northern Mindanao Region; NZP, Northern Zamboanga Peninsula). (A) Oceanographic parameters (SST, sea surface temperature; chl-a, chlorophyll a; POC, particulate organic carbon) averaged across a span of 3 years (2014–2016). (B) Mean focal allele frequencies of outlier loci that contributed greatly to the regional structuring observed in the ordination analyses. The sample sizes are: BUT = 4; GIN = 4; MAC = 4; ILG = 7; DIP = 6; SIN = 7; and PAT = 5.
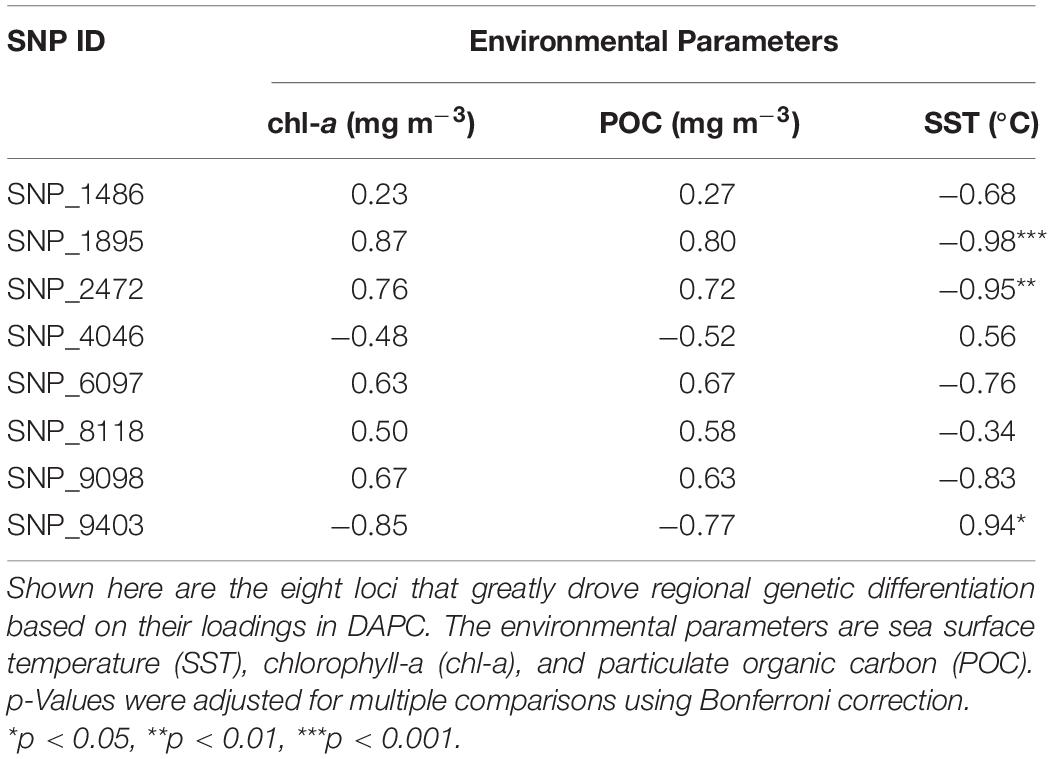
Table 4. Spearman correlation (ρ) between putatively outlier loci and remotely sensed environmental parameters.
Discussion
Sardinella lemuru Exhibits Local Adaptation Despite High Levels of Gene Flow
Contrasting inferences on genetic structure of S. lemuru along the northern coast of Mindanao were obtained from neutral and outlier loci. These reveal the potential inference of neutral and adaptive processes in shaping population structure (Kirk and Freeland, 2011; Funk et al., 2012). While neutral loci revealed genetic homogeneity suggestive of high levels of gene flow between the two regions, outlier loci revealed pronounced genetic structure and underscores how natural selection and local adaptation can shape regional genetic structure (Holderegger et al., 2006; Mariani and Bekkevold, 2014). This reflects the biological reality that local adaptation can still occur despite high levels of gene flow (Waples, 1998; Hemmer-Hansen et al., 2007b; Nielsen et al., 2009b; Corander et al., 2013; Yadav et al., 2019; Mendiola and Ravago-Gotanco, 2021).
Spatial genetic homogeneity of S. lemuru corroborates previous reports based on the mtDNA CR (Pedrosa-Gerasmio et al., 2015; Labrador et al., 2021). Most marine pelagic fishes, including this species, have large effective population sizes, are highly migratory, and have high dispersal capabilities at both larval and adult stages (Waples, 1998; Tinti et al., 2002; Lecomte et al., 2004; Ravago-Gotanco and Juinio-Meñez, 2004; Atarhouch et al., 2007; Nielsen et al., 2009b; Ruggeri et al., 2013; Pedrosa-Gerasmio et al., 2015; Sukumaran et al., 2016); all these biological properties increase the homogenizing effects of gene flow while minimizing the structuring effects of genetic drift. Moreover, agents that facilitate gene flow are not limited to biological characteristics, since oceanographic features such as the dynamic movement of water interconnecting the different geopolitical boundaries, ocean circulation shifts due to monsoon cycle, and tidal shifts are known to mediate larval dispersal and influence adult migration (Campos et al., 2015; Pedrosa-Gerasmio et al., 2015; Pata et al., 2021). Although spawning sites of S. lemuru were found to be localized in different bays within NMR and NZP (De Guzman et al., 2015; Pata et al., 2021), larvae are passively transported from one bay to another where they, along with recruits that are already present in the area, eventually make up the spawning pool (Campos et al., 2015). Dispersal models have shown how ocean currents facilitate larval transport along the northern coast of Mindanao (Pata et al., 2021). The Bohol Jet, a strong southwestward-flowing surface current from the Pacific Ocean to the Sulu Sea passing along the northern Bohol Sea (Cabrera et al., 2011), facilitates the importation of sardine larvae from the spawning grounds in NMR toward the NZP, essentially linking these regions; this was contrary to the conclusion of Luceño et al. (2014) who suggested that geographic isolation limits migration of S. lemuru between the two regions. Furthermore, there was a strong offshore transport of sardine larvae from the NZP during the northeast monsoon due to the intensified upwelling and northwestward direction of currents exiting the Dipolog Strait; this essentially facilitates the movement of sardine larvae from the northern coast of Mindanao toward other regions along the Sulu-Celebes Sea.
Meanwhile, putatively outlier SNPs revealed regional genetic differentiation, indicating that patterns of gene flow do not match patterns of adaptive divergence (Funk et al., 2012). The strong adaptive differentiation observed against a backdrop of high levels of gene flow indicates that the influence of natural selection overpowers genetic drift, a common occurrence in populations with large effective population size and inhabit heterogeneous environments (Hemmer-Hansen et al., 2007b; Funk et al., 2012; Limborg et al., 2012a,b; Moore et al., 2014; Sebastian et al., 2021). Remotely sensed parameters have shown that, at a temporal scale, the stronger signature of upwelling in NZP causes more pronounced fluctuation in SST, chl-a, and POC between monsoons, making it relatively more dynamic than NMR; meanwhile, at a spatial scale, NZP has, on average, cooler waters and higher concentrations of chl-a and POC than NMR. Even with high levels of gene flow between these two regions, larvae produced from spawning events passively drift toward areas with different environmental conditions where they are consequently subjected to the forces of selection (Nielsen et al., 2009a); this in turn heavily impacts their natural mortality and recruitment success since sardine larvae are highly vulnerable to variabilities in the environment (Pata et al., 2021). Larvae that exhibit greater fitness to prevailing environmental conditions would have a higher likelihood of survival to sexual maturity, and will eventually contribute to the gene pool, thereby resulting in a spawning population carrying specific adaptive genetic variants (Willette et al., 2014).
Signatures of genetic variation recovered using outlier loci have been reported for many fish species that exhibit high levels of gene flow, including S. longiceps (Sebastian et al., 2021), Gadus morhua (Westgaard and Fevolden, 2007; Nielsen et al., 2009b; Bradbury et al., 2010), Platichthys flesus (Hemmer-Hansen et al., 2007a,b), Caesio cuning (Ackiss et al., 2018), Clupea harengus (André et al., 2011; Lamichhaney et al., 2012; Limborg et al., 2012b; Corander et al., 2013), and Oncorhynchus nerka (Russello et al., 2012). In most cases, outlier loci identified additional genetic clusters and more complex admixture patterns compared to neutral loci, thereby increasing the overall statistical power in distinguishing the underlying genetic structure of these high gene flow species (Limborg et al., 2012b). Furthermore, several of these papers recommended that non-neutral markers could be used in differentiating stocks of high gene flow species, and that these stocks should be considered as separate MU to preserve adaptive variation.
Adaptive Divergence May Be Associated With Sea Surface Temperature
Identification of adaptively divergent fisheries populations have been conducted mostly on model organisms (e.g., Danio rerio, Gasterosteus aculeatus, and G. morhua; see Nielsen et al., 2009a). Genetic assessments were conducted using well-characterized candidate genes (HSc70, PanI, and HbI) associated with specific environmental stressors (e.g., temperature fluctuations, osmotic stress, and heavy metals; Nielsen et al., 2009a). With RADseq, we were able to perform a genome scan on a non-model organism and detected 31 loci that were putatively under selection; five of these loci were annotated to code for proteins, most of which are involved in organismal development, and three were found to be associated with the environment.
Environmental parameters linked to upwelling were previously reported to affect the population dynamics of S. lemuru. High primary productivity during upwelling, often characterized by high concentration of chl-a and relatively colder SST, correlated with higher sardine catches in Indonesia (Sartimbul et al., 2010; Sambah et al., 2012) and the Philippines (Villanoy et al., 2011). Moreover, Pata et al. (2021) posited that spawning strategies of S. lemuru in the Southern Philippines, the peak of which coincides with the upwelling event during the northeast monsoon, are adaptations to maximize sardine recruitment and lower natural mortality since the improved prey density and cooler temperatures during this time translate into more optimal growth conditions for the sardine larvae. Variability in primary productivity due to wind and ocean current was also hypothesized to influence recruitment success of S. lemuru along the coast of Western Australia (Gaughan and Mitchell, 2000). In this study, three unannotated loci that contributed greatly to the observed regional genetic differentiation correlated with SST, suggesting that this environmental parameter acts as a selective force putatively driving adaptive divergence on such genomic regions (Sebastian et al., 2021). Temperature is important for the proper functioning of proteins that affect physiological processes; it is therefore considered a primary selective agent involved in local adaptation in the marine environment, as was observed in many fishes (e.g., Hemmer-Hansen et al., 2007a; Dionne et al., 2008; Nielsen et al., 2009a,b; Limborg et al., 2012a,b; Sebastian et al., 2021). Conversely, we found no association between the candidate outlier loci and the parameters that are often used as proxies for ocean primary productivity and food availability, namely chl-a and POC. This contrasts with the findings of Sebastian et al. (2021) who reported that chl-a is among the environmental parameters that led to two adaptively divergent populations of S. longiceps in the Indian Ocean. While it is possible that chl-a and POC are not strong enough to drive adaptive divergence despite their differences between regions, it is more likely that loci associated with these parameters were neither genotyped nor screened with the outlier detection methods used.
It should be noted that inferences from this study were largely limited by the relatively few samples that were used for screening outliers. While some authors favored the use of larger sample sizes in population genetic studies (e.g., Kalinowski, 2005; Morin et al., 2009), others reported that increasing the number of markers would be more informative in estimating population genetic parameters (e.g., genetic differentiation and genetic diversity) rather than increasing the number of samples (Felsenstein, 2006; Landguth et al., 2012; Willing et al., 2012; Nazareno et al., 2017). Large number of SNPs can still provide reliable estimates even with small sample sizes (Willing et al., 2012; Nazareno et al., 2017); thus, reducing the sample size in favor of increasing the number of loci offered an alternative strategy. Furthermore, the estimator used for genetic differentiation was the FST analog by Weir and Cockerham (1984); based on simulations by Willing et al. (2012), this estimator is reliable even with small sample sizes (n = 4–6) if the number of biallelic loci is high (nloci > 1,000) and the actual measure of genetic differentiation is low (FST < 0.10). While this provides confidence in the results inferred from both the full and neutral panels, there is a risk of bias in the estimates from the outlier panel since the number of loci was low (nloci = 31) and genetic differentiation was high (FST > 0.1). Corander et al. (2013) also raised the possibility of underestimating the degree of divergence in C. harengus populations in Baltic Sea due to limited sampling. Furthermore, the outlier loci screened (0.87% of the full SNP panel) was fewer than those reported for other high gene flow species such as C. harengus (5.7%; Limborg et al., 2012b) and G. morhua (4.2%; Bradbury et al., 2010); this could be due to the small sample size of the current dataset which lacks sufficient power to detect outliers (Whitlock and Lotterhos, 2015). Ultimately, despite the valuable insights obtained from the small number of samples, further studies should either use a larger sample size per population (Corander et al., 2013) or increase the total number of sampled populations (Whitlock and Lotterhos, 2015) to get better estimates of the levels of genetic differentiation, including the number or relative proportion of putative outlier loci.
The absence of a reference genome for Sardinella also made it difficult to annotate the outlier loci. More comprehensive insights on local adaptation could have been obtained otherwise. We were unable to rule out the possibility that some loci driving regional genetic differentiation may not necessarily be adaptive genes nor are they directly associated with a phenotype, as they may be associated with coding or regulatory regions of functional genes subject to selection (Corander et al., 2013). Furthermore, with genetic hitchhiking, even neutral loci may appear to be under selection when it is linked to another gene that is influenced by selection (Gagnaire et al., 2015). It is also possible that these loci are found in genomic regions that are resistant to gene flow; these cold spots of recombination, where recombination rate is lower than average, include heterochromatic regions such as centromeres and telomeres (Tigano and Friesen, 2016). In the absence of an empirical observation regarding the link between the outlier loci and the associated phenotype with adaptive importance, our results must retain an element of speculation and must be considered as hypotheses to be tested (Nielsen et al., 2009a).
General Implications
Our results based on neutral loci suggest high levels of gene flow and likely demographic connectivity among S. lemuru populations along the northern coast of Mindanao. A null hypothesis of panmixia was not rejected, in contrast to previous reports that suggested otherwise. Following the framework by Funk et al. (2012), S. lemuru in these two regions can be considered as a single management unit. This is important to note since efforts in safeguarding the sardine fisheries, such as the implementation of a closed fishing season during peak spawning season in the northeast monsoon months (Pata et al., 2021), were more intensive in NZP compared to NMR. Improvements in the sardine fisheries in NZP (e.g., increased landed catch value and volume, increased production of bottled sardine, and increased monthly salary of fishing crew; Narvaez, 2017) would therefore be shared with NMR due to population connectivity.
However, even with high levels of gene flow, our results also provided evidence for regional genetic differentiation brought about by local adaptation. Further, results suggest that adaptive divergence could be driven by the differences in the SST between NMR and NZP as these introduce variability in the sardine’s population dynamics (e.g., recruitment success and natural mortality; Pata et al., 2021). A locally adapted subpopulation has members that are more fit in the native habitat compared to immigrants (Kawecki and Ebert, 2004); thus, even if S. lemuru has high dispersal potential, there remains a possibility that non-native individuals will have lower fitness when entering a new environment (Nielsen et al., 2009a). Larvae that enter a particular habitat are subjected to selective forces which can remove unfit individuals even before they reach sexual maturity; this results in an adult population having a higher proportion of individuals with genetic variants matching the local environment (Willette et al., 2014). Even though there is continuous larval supply from NZP to NMR and vice versa, environmental differences between the two regions would still contribute to the larval mortality which will ultimately lower the number of successful recruits, and consequently, the population size. In extreme cases when locally adapted populations decline, replenishing them would still prove challenging due to non-matching habitats (Sebastian et al., 2021). This ultimately suggests the need to not only focus on demographic parameters (e.g., stock size and catch volume increase) in management measures, but to also consider preservation of adaptive variation and evolutionary potential that are present within regions (Funk et al., 2012; Sebastian et al., 2021), as well as consider the influence of the environment especially on recruitment success (Pata et al., 2021).
Data Availability Statement
The datasets presented in this study can be found in online repositories. The names of the repository/repositories and their respective links are as follows: (1) sequence reads (NCBI, https://www.ncbi.nlm.nih.gov/bioproject/PRJNA752467) and (2) R script, SNP panels, and metadata (Dryad, https://doi.org/10.5061/dryad.4qrfj6qbx).
Ethics Statement
Ethical review and approval was not required for the animal in this study because Bali sardinella (Sardinella lemuru) is commercially available and is sold in markets all over the country.
Author Contributions
KL, RR-G, and MJP conceptualized the project. KL, JDP, and AA collected the samples, conducted the laboratory work, and performed administrative and procurement tasks. KL and AA worked to generate the sequence data, while JDP processed the remote sensing data. KL performed the formal analysis, wrote the original draft of the manuscript, and along with JDP, prepared the figures for visualization; all these were done under the supervision of RR-G and MJP. MJP secured the funding for this project. All authors commented on the manuscript and agreed to its submission.
Funding
This work was funded by the Department of Science and Technology – Philippine Council for Agriculture, Aquatic and Natural Resources Research and Development (DOST-PCAARRD) through the project entitled “Molecular Technology-Based Assessment of the Sustainability of Sardine Fisheries” under the program, “Development of Robust Tools in Support of the Sustainable Management of Sardine Fisheries in the Zamboanga Upwelling–Bohol Sea System (SarDyn).” Completion of the manuscript was made possible by the thesis writing grant awarded to KL by the University of the Philippines – Marine Science Institute (UP-MSI). Support for the publication fee was also provided by UP-MSI through the project entitled, “Upgrading Capacity, Infrastructure, and Assets for Marine Scientific Research in the Philippines.”
Conflict of Interest
The authors declare that the research was conducted in the absence of any commercial or financial relationships that could be construed as a potential conflict of interest.
Publisher’s Note
All claims expressed in this article are solely those of the authors and do not necessarily represent those of their affiliated organizations, or those of the publisher, the editors and the reviewers. Any product that may be evaluated in this article, or claim that may be made by its manufacturer, is not guaranteed or endorsed by the publisher.
Acknowledgments
We would like to acknowledge the assistance provided by Ma. Rio Naguit, Asuncion De Guzman, Jerry Garcia, Jhunrey Follante, Joshep Mercene, and John Christopher Azcarraga in sample collection and initial processing. We also acknowledge the research staff of the Marine Molecular Ecology and Evolution Laboratory (MMEEL), as well as the Marine Genomics and Molecular Genetics Laboratory (MGMGL) and its head, Arturo Lluisma, for providing valuable input in the conduct of the experiment and analysis of the data. Finally, we extend our gratitude to Demian Willette, Laura David, and Jonas Quilang for their valuable feedback on the manuscript.
Supplementary Material
The Supplementary Material for this article can be found online at: https://www.frontiersin.org/articles/10.3389/fmars.2022.766936/full#supplementary-material
Footnotes
- ^ https://blast.ncbi.nlm.nih.gov/Blast.cgi
- ^ https://www.uniprot.org/
- ^ https://oceancolor.gsfc.nasa.gov/
References
Ackiss, A. S., Bird, C. E., Akita, Y., Santos, M. D., Tachihara, K., and Carpenter, K. E. (2018). Genetic patterns in peripheral marine populations of the fusilier fish Caesio cuning within the Kuroshio current. Ecol. Evol. 8, 11875–11886. doi: 10.1002/ece3.4644
André, C., Larsson, L. C., Laikre, L., Bekkevold, D., Brigham, J., Carvalho, G. R., et al. (2011). Detecting population structure in a high gene-flow species, Atlantic herring (Clupea harengus): direct, simultaneous evaluation of neutral vs putatively selected loci. Heredity 106, 270–280. doi: 10.1038/hdy.2010.71
Andrews, K. R., Good, J. M., Miller, M. R., Luikart, G., and Hohenlohe, P. A. (2016). Harnessing the power of RADseq for ecological and evolutionary genomics. Nat. Rev. Genet. 17, 81–92. doi: 10.1038/nrg.2015.28
Andrews, S. (2010). FastQC: A Quality Control Tool for High Throughput Sequence Data. Babraham: Babraham Institute.
Atarhouch, T., Rami, M., Naciri, M., and Dakkak, A. (2007). Genetic population structure of sardine (Sardina pilchardus) off Morocco detected with intron polymorphism (EPIC-PCR). Mar. Biol. 150, 521–528. doi: 10.1007/s00227-006-0371-8
Auguie, B. (2017). gridExtra: Miscellaneous Functions for “Grid” Graphics. Available online at: https://cran.r-project.org/package=gridExtra (accessed September 9, 2017).
Bache, S. M., and Wickham, H. (2020). magrittr: A Forward-Pipe Operator for R. Available online at: https://cran.r-project.org/package=magrittr (accessed November 17, 2020).
Baird, N. A., Etter, P. D., Atwood, T. S., Currey, M. C., Shiver, A. L., Lewis, Z. A., et al. (2008). Rapid SNP discovery and genetic mapping using sequenced RAD markers. PLoS One 3:e3376. doi: 10.1371/journal.pone.0003376
Bradbury, I. R., Hubert, S., Higgins, B., Borza, T., Bowman, S., Paterson, I. G., et al. (2010). Parallel adaptive evolution of Atlantic cod on both sides of the Atlantic Ocean in response to temperature. Proc. R. Soc. B Biol. Sci. 277, 3725–3734. doi: 10.1098/rspb.2010.0985
Cabrera, O. C., Villanoy, C. L., David, L. T., and Gordon, A. L. (2011). Barrier layer control of entrainment and upwelling in the Bohol sea, Philippines. Oceanography 24, 130–141. doi: 10.5670/oceanog.2011.10
Cadrin, S. X., Kerr, L. A., and Mariani, S. (2014). Stock Identification Methods: Applications in Fishery Science, 2nd Edn, eds S. X. Cadrin, L. A. Kerr, and S. Mariani (Amsterdam: Elsevier, Inc).
Campos, W., Acabado, C., Metillo, E., Naguit, M. R., Bagarinao, A., Almaquer, C. J., et al. (2015). Estimating Early Life Stage Mortality and Sources of Recruits. Project 3 of Development of Robust Tools for Managing Sardine Fisheries in the Philippines: Zamboanga Upwelling – Bohol Sea System (SarDyn). Terminal Report. Laguna: Department of Science and Technology – Philippine Council for Agriculture, Aquatic and Natural Resources Research and Development (DOST-PCAARRD), 77.
Catchen, J. M., Amores, A., Hohenlohe, P., Cresko, W., and Postlethwait, J. H. (2011). Stacks: building and genotyping loci de novo from short-read sequences. G3 Genes Genomes Genetics 1, 171–182. doi: 10.1534/g3.111.000240
Catchen, J., Hohenlohe, P. A., Bassham, S., Amores, A., and Cresko, W. A. (2013). Stacks: an analysis tool set for population genomics. Mol. Ecol. 22, 3124–3140. doi: 10.1111/mec.12354
Conover, D. O., Clarke, L. M., Munch, S. B., and Wagner, G. N. (2006). Spatial and temporal scales of adaptive divergence in marine fishes and the implications for conservation. J. Fish. Biol. 69, 21–47. doi: 10.1111/j.1095-8649.2006.01274.x
Corander, J., Majander, K. K., Cheng, L., and Merila, J. (2013). High degree of cryptic population differentiation in the Baltic Sea herring Clupea harengus. Mol. Ecol. 22, 2931–2940. doi: 10.1111/mec.12174
Davey, J. W., and Blaxter, M. L. (2010). RADSeq: next-generation population genetics. Brief. Funct. Genomics 9, 416–423. doi: 10.1093/bfgp/elq031
De Guzman, A., Jimenez, C. R., Abrea, R. A., Garcia, J. P., Recamara, D. B., Flores, M. H., et al. (2015). Sustaining the Sardine Fisheries Industry Through Understanding Spatio-Temporal Dynamics in the Zamboanga Peninsula and Bohol Sea System. Project 2 of Development of Robust Tools for Managing Sardine Fisheries in the Philippines: Zamboanga Upwelling– Bohol Sea System (SarDyn). Terminal Report. Laguna: Department of Science and Technology – Philippine Council for Agriculture, Aquatic and Natural Resources Research and Development (DOST-PCAARRD), 63.
Dionne, M., Caron, F., Dodson, J. J., and Bernatchez, L. (2008). Landscape genetics and hierarchical genetic structure in Atlantic salmon: the interaction of gene flow and local adaptation. Mol. Ecol. 17, 2382–2396. doi: 10.1111/j.1365-294X.2008.03771.x
Dray, S., and Dufour, A. B. (2007). The ade4 package: implementing the duality diagram for ecologists. J. Stat. Softw. 22, 1–20.
Excoffier, L., and Lischer, H. E. L. (2010). Arlequin suite ver 3.5: a new series of programs to perform population genetics analyses under Linux and Windows. Mol. Ecol. Resour. 10, 564–567. doi: 10.1111/j.1755-0998.2010.02847.x
Excoffier, L., Hofer, T., and Foll, M. (2009). Detecting loci under selection in a hierarchically structured population. Heredity 103, 285–298. doi: 10.1038/hdy.2009.74
Excoffier, L., Smouse, P. E., and Quattro, J. M. (1992). Analysis of molecular variance inferred from metric distances among DNA Haplotypes: application to human mitochondrial DNA restriction data. Genetics 131, 479–491. doi: 10.1093/genetics/131.2.479
Felsenstein, J. (2006). Accuracy of coalescent likelihood estimates: do we need more sites, more sequences, or more loci? Mol. Biol. Evol. 23, 691–700. doi: 10.1093/molbev/msj079
Flanagan, S. P., and Jones, A. G. (2017). Constraints on the FST–heterozygosity outlier approach. J. Hered. 108, 561–573. doi: 10.1093/jhered/esx048
Flanagan, S. P., and Jones, A. G. (2018). fsthet: Fst-Heterozygosity Smoothed Quantiles. Available online at: https://cran.r-project.org/package=fsthet (accessed March 20, 2018).
Foll, M., and Gaggiotti, O. (2008). A genome-scan method to identify selected loci appropriate for both dominant and codominant markers: a bayesian perspective. Genetics 180, 977–993. doi: 10.1534/genetics.108.092221
Funk, W. C., McKay, J. K., Hohenlohe, P. A., and Allendorf, F. W. (2012). Harnessing genomics for delineating conservation units. Trends Ecol. Evol. 27, 489–496. doi: 10.1016/j.tree.2012.05.012
Gagnaire, P. A., Broquet, T., Aurelle, D., Viard, F., Souissi, A., Bonhomme, F., et al. (2015). Using neutral, selected, and hitchhiker loci to assess connectivity of marine populations in the genomic era. Evol. Appl. 8, 769–786. doi: 10.1111/eva.12288
Gaughan, D. J., and Mitchell, R. W. D. (2000). Final Report, FRDC Project 95/037: The Biology and Stock Assessment of the Tropical Sardine, Sardinella lemuru, off the Mid-West Coast of Western Australia. Fisheries Research Report 119. Hillarys WA: WA Marine Research Laboratories.
Goudet, J. (2005). HIERFSTAT, a package for R to compute and test hierarchical F-statistics. Mol. Ecol. Notes 5, 184–186. doi: 10.1111/j.1471-8278
Goudet, J., and Jombart, T. (2020). hierfstat: Estimation and Tests of Hierarchical F-Statistics. Available online at: https://cran.r-project.org/package=hierfstat (accessed November 17, 2021).
Gruber, B., Unmack, P. J., Berry, O. F., and Georges, A. (2018). DARTR: an R package to facilitate analysis of SNP data generated from reduced representation genome sequencing. Mol. Ecol. Resour. 18, 691–699. doi: 10.1111/1755-0998.12745
Guanco, M. R., Mesa, S. V., Belga, P. B., and Nuñal, D. R. M. (2009). Assessment of the commercial fisheries of Western and Central Visayan Sea. BFAR NFRDI Tech. Paper Ser. 12, 1–44.
Hemmer-Hansen, J., Nielsen, E. E., Frydenberg, J., and Loeschcke, V. (2007a). Adaptive divergence in a high gene flow environment: Hsc70 variation in the European flounder (Platichthys flesus L.). Heredity 99, 592–600. doi: 10.1038/sj.hdy.6801055
Hemmer-Hansen, J., Nielsen, E. E., Grønkjær, P., and Loeschcke, V. (2007b). Evolutionary mechanisms shaping the genetic population structure of marine fishes; lessons from the European flounder (Platichthys flesus L.). Mol. Ecol. 16, 3104–3118. doi: 10.1111/j.1365-294X.2007.03367.x
Henry, L., and Wickham, H. (2020). purrr: Functional Programming Tools. Available online at: https://cran.r-project.org/package=purrr (accessed April 17, 2020).
Holderegger, R., Kamm, U., and Gugerli, F. (2006). Adaptive vs. neutral genetic diversity: implications for landscape genetics. Landsc. Ecol. 21, 797–807. doi: 10.1007/s10980-005-5245-9
Izrailev, S. (2014). tictoc: Functions for Timing R Scripts, as Well as Implementations of Stack and List Structures. Available online at: https://cran.r-project.org/package=tictoc (accessed April 19, 2021).
Jaya, I. (2002). Acoustical study of the schooling behavior of Lemuru (Sardinella lemuru). Fish. Sci. 68, 1881–1884.
Jombart, T. (2008). Adegenet: a R package for the multivariate analysis of genetic markers. Bioinformatics 24, 1403–1405. doi: 10.1093/bioinformatics/btn129
Jombart, T., and Ahmed, I. (2011). adegenet 1.3-1: new tools for the analysis of genome-wide SNP data. Bioinformatics 27, 3070–3071. doi: 10.1093/bioinformatics/btr521
Jombart, T., Devillard, S., and Balloux, F. (2010). Discriminant analysis of principal components: a new method for the analysis of genetically structured populations. BMC Genet. 11:94. doi: 10.1186/1471-2156-11-94
Kalinowski, S. T. (2005). Do polymorphic loci require large sample sizes to estimate genetic distances? Heredity 94, 33–36. doi: 10.1038/sj.hdy.6800548
Kamvar, Z. N., Brooks, J. C., and Grünwald, N. J. (2015). Novel R tools for analysis of genome-wide population genetic data with emphasis on clonality. Front. Genet. 6:208. doi: 10.3389/fgene.2015.00208
Kamvar, Z. N., Tabima, J. F., and Grünwald, N. J. (2014). Poppr: an R package for genetic analysis of populations with clonal, partially clonal, and/or sexual reproduction. PeerJ 2:e281. doi: 10.7717/peerj.281
Kassambara, A. (2020). ggpubr: “ggplot2” Based Publication Ready Plots. Available online at: https://cran.r-project.org/package=ggpubr (accessed June 27, 2020).
Kassambara, A. (2021). rstatix: Pipe-Friendly Framework for Basic Statistical Tests. Available online at: https://cran.r-project.org/package=rstatix (accessed February 13, 2021).
Kassambara, A., and Mundt, F. (2020). factoextra: Extract and Visualize the Results of Multivariate Data Analyses. Available online at: https://cran.r-project.org/package=factoextra (accessed April 1, 2020).
Kawecki, T. J., and Ebert, D. (2004). Conceptual issues in local adaptation. Ecol. Lett. 7, 1225–1241. doi: 10.1111/j.1461-0248.2004.00684.x
Keenan, K., Mcginnity, P., Cross, T. F., Crozier, W. W., and Prodöhl, P. A. (2013). diveRsity: an R package for the estimation and exploration of population genetics parameters and their associated errors. Methods Ecol. Evol. 4, 782–788. doi: 10.1111/2041-210X.12067
Kirk, H., and Freeland, J. R. (2011). Applications and implications of neutral versus non-neutral markers in molecular ecology. Int. J. Mol. Sci. 12, 3966–3988. doi: 10.3390/ijms12063966
Kritzer, J. P., and Liu, O. R. (2014). “Fishery management strategies for adressing complex spatial structure in marine fish stocks,” in Stock Identification Methods: Application in Fishery Science, eds S. X. Cadrin, L. A. Kerr, and S. Mariani (Amsterdam: Elsevier, Inc), 29–53.
Labrador, K., Agmata, A., Palermo, J. D., Ravago-Gotanco, R., and Pante, M. J. (2021). Mitochondrial DNA reveals genetically structured haplogroups of Bali sardinella (Sardinella lemuru) in Philippine waters. Reg. Stud. Mar. Sci. 41:101588. doi: 10.1016/j.rsma.2020.101588
Lamichhaney, S., Barrio, A. M., Rafati, N., Sundstrom, G., Rubin, C.-J., Gilbert, E. R., et al. (2012). Population-scale sequencing reveals genetic differentiation due to local adaptation in Atlantic herring. Proc. Natl. Acad. Sci. 109, 19345–19350. doi: 10.1073/pnas.1216128109
Landguth, E. L., Fedy, B. C., Oyler-Mccance, S. J., Garey, A. L., Emel, S. L., Mumma, M., et al. (2012). Effects of sample size, number of markers, and allelic richness on the detection of spatial genetic pattern. Mol. Ecol. Resour. 12, 276–284. doi: 10.1111/j.1755-0998.2011.03077.x
Lecomte, F., Grant, W. S., Dodson, J. J., Rodríguez-Sánchez, R., and Bowen, B. W. (2004). Living with uncertainty: genetic imprints of climate shifts in East Pacific anchovy (Engraulis mordax) and sardine (Sardinops sagax). Mol. Ecol. 13, 2169–2182. doi: 10.1111/j.1365-294X.2004.02229.x
Lee, S. R., Jo, Y. S., Park, C. H., Friedman, J. M., and Olson, M. S. (2018). Population genomic analysis suggests strong influence of river network on spatial distribution of genetic variation in invasive saltcedar across the southwestern United States. Mol. Ecol. 27, 636–646. doi: 10.1111/mec.14468
Limborg, M. T., Blankenship, S. M., Young, S. F., Utter, F. M., Seeb, L. W., Hansen, M. H. H., et al. (2012a). Signatures of natural selection among lineages and habitats in Oncorhynchus mykiss. Ecol. Evol. 2, 1–18. doi: 10.1002/ece3.59
Limborg, M. T., Helyar, S. J., De Bruyn, M., Taylor, M. I., Nielsen, E. E., Ogden, R., et al. (2012b). Environmental selection on transcriptome-derived SNPs in a high gene flow marine fish, the Atlantic herring (Clupea harengus). Mol. Ecol. 21, 3686–3703. doi: 10.1111/j.1365-294X.2012.05639.x
Luceño, A. J. M., Torres, M. A. J., Tabugo, S. R. M., and Demayo, C. G. (2014). Describing the body shapes of three populations of Sardinella lemuru (Bleeker, 1853) from Mindanao Island, Philippines using relative warp analysis. Int. Res. J. Biol. Sci. 3, 6–17.
Lustrik, R., and Skrbinsek, T. (2016). zvau: Misc Functions Used by Our Ecology Lab. Available online at: https://github.com/romunov/zvau
Luu, K., Bazin, E., and Blum, M. G. B. (2017). pcadapt: an R package to perform genome scans for selection based on principal component analysis. Mol. Ecol. Resour. 17, 67–77. doi: 10.1111/1755-0998.12592
Mariani, S., and Bekkevold, D. (2014). “The nuclear genome: neutral and adaptive markers in fisheries science,” in Stock Identification Methods: Application in Fishery Science, eds S. X. Cadrin, L. A. Kerr, and S. Mariani (Amsterdam: Elsevier Inc), 298–320.
Mastretta-Yanes, A., Arrigo, N., Alvarez, N., Jorgensen, T. H., Piñero, D., and Emerson, B. C. (2014). Restriction site-associated DNA sequencing, genotyping error estimation and de novo assembly optimization for population genetic inference. Mol. Ecol. Resour. 15, 28–41. doi: 10.1111/1755-0998.12291
Mendiola, M. J. R., and Ravago-Gotanco, R. (2021). Genetic differentiation and signatures of local adaptation revealed by RADseq for a highly dispersive mud crab Scylla olivacea (Herbst, 1796) in the Sulu Sea. Ecol. Evol. 11, 7951–7969. doi: 10.1002/ece3.7625
Metillo, E. B., Campos, W. L., Villanoy, C. L., Hayashizaki, K., Tsunoda, T., and Nishida, S. (2018). Ontogenetic feeding shift and size- based zooplanktivory in Sardinella lemuru (Pisces, Clupeidae) during an upwelling in southeastern Sulu Sea, The Philippines. Fish. Manag. Ecol. 25, 441–445. doi: 10.1111/fme.12319
Metzker, M. L. (2009). Sequencing technologies - the next generation. Nat. Rev. Genet. 11, 31–46. doi: 10.1038/nrg2626
Moore, J.-S., Bourret, V., Dionne, M., Bradbury, I., O’Reilly, P., Kent, M., et al. (2014). Conservation genomics of anadromous Atlantic salmon across its North American range: outlier loci identify the same patterns of population structure as neutral loci. Mol. Ecol. 23, 5680–5697. doi: 10.1111/mec.12972
Morin, P. A., Martien, K. K., and Taylor, B. L. (2009). Assessing statistical power of SNPs for population structure and conservation studies. Mol. Ecol. Resour. 9, 66–73. doi: 10.1111/j.1755-0998.2008.02392.x
Narvaez, T. (2017). Assessment of the Industry-Level Impacts of the Closed Fishing Season Policy for Sardines in Zamboanga Peninsula, Philippines. Kawana: Food and Fertilizer Technology Center for the Asian and Pacific Region.
Nazareno, A. G., Bemmels, J. B., Dick, C. W., and Lohmann, L. G. (2017). Minimum sample sizes for population genomics: an empirical study from an Amazonian plant species. Mol. Ecol. Resour. 17, 1136–1147. doi: 10.1111/1755-0998.12654
Nielsen, E. E., Hemmer-Hansen, J., Larsen, P. F., and Bekkevold, D. (2009a). Population genomics of marine fishes: identifying adaptive variation in space and time. Mol. Ecol. 18, 3128–3150. doi: 10.1111/j.1365-294X.2009.04272.x
Nielsen, E. E., Hemmer-Hansen, J., Poulsen, N. A., Loeschcke, V., Moen, T., Johansen, T., et al. (2009b). Genomic signatures of local directional selection in a high gene flow marine organism; the Atlantic cod (Gadus morhua). BMC Evol. Biol. 9:276. doi: 10.1186/1471-2148-9-276
Olaño, V. L., Vergara, M. B., and Gonzales, F. L. (2009). Assessment of the Fisheries of Sorsogon Bay (Region 5). BFAR NFRDI Tech. Paper Ser. 12, 1–33.
Palermo, J. D. H. (2021). Trophic Ecology of Sardines: Sardinella lemuru Feeding Strategies, Vulnerability to Marine Microplastic Pollution, and Endoparasitism in Northern Mindanao. Ph.D. Dissertation. Quezon City: University of the Philippines-Diliman.
Palermo, J. D. H., Labrador, K. L., Follante, J. D., Agmata, A. B., Pante, M. J. R., Rollon, R. N., et al. (2020). Susceptibility of Sardinella lemuru to emerging marine microplastic pollution. Glob. J. Environ. Sci. Manag. 6, 373–384. doi: 10.22034/gjesm.2020.03.07
Pante, M. J. R., Palermo, J. D., Labrador, K. L., Agmata, A. A., and Follante, J. D. (2019). Molecular Technology-Based Assessment of the Sustainability of Sardine Fisheries. Project 5 of Development of Robust Tools for Managing Sardine Fisheries in the Philippines: Zamboanga Upwelling – Bohol Sea System (SarDyn). Terminal Report. Laguna: Department of Science and Technology – Philippine Council for Agriculture, Aquatic and Natural Resources Research and Development (DOST-PCAARRD), 84.
Paradis, E. (2010). Pegas: an R package for population genetics with an integrated-modular approach. Bioinformatics 26, 419–420. doi: 10.1093/bioinformatics/btp696
Paradis, E., and Schliep, K. (2019). ape 5.0: an environment for modern phylogenetics and evolutionary analyses in R. Bioinformatics 35, 526–528. doi: 10.1093/bioinformatics/bty633
Paris, J. R., Stevens, J. R., and Catchen, J. M. (2017). Lost in parameter space: a road map for stacks. Methods Ecol. Evol. 8, 1360–1373. doi: 10.1111/2041-210X.12775
Pata, P. R., and Yñiguez, A. T. (2019). Larval connectivity patterns of the North Indo-West Pacific coral reefs. PLoS One 14:e0219913. doi: 10.1371/journal.pone.0219913
Pata, P. R., Yñiguez, A. T., Deauna, J. D. L., De Guzman, A. B., Jimenez, C. R., Rosario, R. T. B., et al. (2021). Insights into the environmental conditions contributing to variability in the larval recruitment of the tropical sardine Sardinella lemuru. Ecol. Model. 451:109570. doi: 10.1016/j.ecolmodel.2021.109570
Pedrosa-Gerasmio, I. R., Agmata, A. B., and Santos, M. D. (2015). Genetic diversity, population genetic structure, and demographic history of Auxis thazard (Perciformes), Selar crumenophthalmus (Perciformes), Rastrelliger kanagurta (Perciformes) and Sardinella lemuru (Clupeiformes) in Sulu-Celebes Sea inferred by mitochondrial DNA sequences. Fish. Res. 162, 64–74. doi: 10.1016/j.fishres.2014.10.006
Peterson, R. A., and Cavanaugh, J. E. (2020). Ordered quantile normalization: a semiparametric transformation built for the cross-validation era. J. Appl. Stat. 47, 2312–2327. doi: 10.1080/02664763.2019.1630372
Plummer, M., Best, N., Cowles, K., and Vines, K. (2006). CODA: convergence diagnosis and output analysis for MCMC. R. News 6, 7–11.
R Core Team (2021). R: A Language and Environment for Statistical Computing. Vienna: R Foundation for Statistical Computing.
Ravago-Gotanco, R., and Juinio-Meñez, M. A. (2004). Population genetic structure of the milkfish, Chanos chanos, based on PCR-RFLP analysis of the mitochondrial control region. Mar. Biol. 145, 789–801. doi: 10.1007/s00227-004-1372-0
Rocha, L. A., Craig, M. T., and Bowen, B. W. (2007). Phylogeography and the conservation of coral reef fishes. Coral Reefs 26, 501–512. doi: 10.1007/s00338-007-0261-7
Rochette, N. C., and Catchen, J. M. (2017). Deriving genotypes from RAD-seq short-read data using Stacks. Nat. Protoc. 12, 2640–2659. doi: 10.1038/nprot.2017.123
Ruggeri, P., Splendiani, A., Bonanomi, S., Arneri, E., Cingolani, N., Santojanni, A., et al. (2013). Searching for a stock structure in Sardina pilchardus from the Adriatic and Ionian seas using a microsatellite DNA-based approach. Sci. Mar. 77, 565–574. doi: 10.3989/scimar.03843.26A
Russello, M. A., Kirk, S. L., Frazer, K. K., and Askey, P. J. (2012). Detection of outlier loci and their utility for fisheries management. Evol. Appl. 5, 39–52. doi: 10.1111/j.1752-4571.2011.00206.x
Sambah, A. B., Miura, F., Kadarisman, H. P., and Sartimbul, A. (2012). “Remote sensing application for Sardinella lemuru assessment: a case study of the south waters of Malang Regency, East Java, Indonesia,” in Proceedings of the SPIE, Remote Sensing of the Marine Environment II, 85250M, Vol. 8525, Kyoto. doi: 10.1117/12.976284
Sartimbul, A., Nakata, H., Rohadi, R., Yusuf, B., and Kadarisman, H. P. (2010). Variations in chlorophyll-a concentration and the impact on Sardinella lemuru catches in Bali Strait, Indonesia. Prog. Oceanogr. 87, 168–174. doi: 10.1016/j.pocean.2010.09.002
Sebastian, W., Sukumaran, S., Abdul Azeez, S., Muraleedharan, K. R., Dinesh Kumar, P. K., Zacharia, P. U., et al. (2021). Genomic investigations provide insights into the mechanisms of resilience to heterogeneous habitats of the Indian Ocean in a pelagic fish. Sci. Rep. 11:20690. doi: 10.1038/s41598-021-00129-5
Slowikowski, K. (2021). ggrepel: Automatically Position Non-Overlapping Text Labels with “ggplot2.”. Available online at: https://cran.r-project.org/package=ggrepel (accessed January 15, 2021).
Sukumaran, S., Sebastian, W., and Gopalakrishnan, A. (2016). Population genetic structure of Indian oil sardine, Sardinella longiceps along Indian coast. Gene 576, 372–378. doi: 10.1016/j.gene.2015.10.043
Tigano, A., and Friesen, V. L. (2016). Genomics of local adaptation with gene flow. Mol. Ecol. 25, 2144–2164. doi: 10.1111/mec.13606
Tinti, F., Di Nunno, C., Guarniero, I., Talenti, M., Tommasini, S., Fabbri, E., et al. (2002). Mitochondrial DNA Sequence variation suggests the lack of genetic heterogeneity in the Adriatic and Ionian Stocks of Sardina pilchardus. Mar. Biotechnol. 4, 163–172. doi: 10.1007/s10126-002-0003-3
Villanoy, C. L., Cabrera, O. C., Yniguez, A., Camoying, M., de Guzman, A., David, L. T., et al. (2011). Monsoon-driven coastal upwelling off Zamboanga Peninsula, Philippines. Oceanography 24, 156–165. doi: 10.5670/oceanog.2011.12
Villanoy, C., Yniguez, A., David, L., Deauna, J. D., Prado, J., Pata, P., et al. (2015). Capturing the Dynamic Linkages Between Small Pelagic Fisheries and Primary Production Through Satellite Images and Models for Better Resource Management in the Bohol Sea and Zamboanga Peninsula. Project 1 of Development of Robust Tools for Managing Sardine Fisheries in the Philippines: Zamboanga Upwelling – Bohol Sea System (SarDyn). Terminal Report. Laguna: Department of Science and Technology – Philippine Council for Agriculture, Aquatic and Natural Resources Research and Development (DOST-PCAARRD), 84.
Waples, R. S. (1998). Separating the wheat from the chaff: patterns of genetic differentiation in high gene flow species. J. Hered. 89, 438–450. doi: 10.1093/jhered/89.5.438
Warnes, G., Gorjanc, G., Leisch, F., and Man, M. (2021). genetics: Population Genetics. Available online at: https://cran.r-project.org/package=genetics (accessed March 1, 2021).
Weir, B. S., and Cockerham, C. C. (1984). Estimating F-statistics for the analysis of population structure. Evolution 38, 1358–1370. doi: 10.2307/2408641
Westgaard, J. I., and Fevolden, S. E. (2007). Atlantic cod (Gadus morhua L.) in inner and outer coastal zones of northern Norway display divergent genetic signature at non-neutral loci. Fish. Res. 85, 306–315. doi: 10.1016/j.fishres.2007.04.001
Whitehead, P. J. P. (1985). FAO Species Catalogue. Vol. 7. Clupeoid fishes of the world: An Annotated and Illustrated Catalogue of the Herrings, Sardines, Pilchards, Sprats, Shads, Anchovies and Wolf-Herrings. Part 1 – Chirocentridae, Clupeidae and Pristigas- teridae. FAO Fisheries Synopsis No. 125, Vol. 7. Rome: Food And Agriculture Organization Of The United Nations, 303.
Whitlock, M. C., and Lotterhos, K. E. (2015). Reliable detection of loci responsible for local adaptation: inference of a null model through trimming the distribution of FST. Am. Nat. 186, S24–S36. doi: 10.1086/682949
Wickham, H. (2016). in ggplot2: Elegant Graphics for Data Analysis, 2nd Edn, eds R. Gentleman, K. Hornik, and G. Parmigiani (Cham: Springer).
Wickham, H. (2021a). forcats: Tools for Working with Categorical Variables (Factors). Available online at: https://cran.r-project.org/package=forcats (accessed January 27, 2021).
Wickham, H. (2021b). tidyr: Tidy Messy Data. Available online at: https://cran.r-project.org/package=tidyr (accessed September 27, 2021).
Wickham, H., and Seidel, D. (2020). scales: Scale Functions for Visualization. Available online at: https://cran.r-project.org/package=scales (accessed May 11, 2020).
Wickham, H., François, R., Henry, L., and Müller, K. (2021). dplyr: A Grammar of Data Manipulation. Available online at: https://cran.r-project.org/package=dplyr (accessed June 18, 2021).
Wigginton, J. E., Cutler, D. J., and Abecasis, G. R. (2005). A note on exact tests of Hardy-Weinberg equilibrium. Am. J. Hum. Genet. 76, 887–893.
Wilke, C. O. (2020). cowplot: Streamlined Plot Theme and Plot Annotations for “ggplot2.”. Available online at: https://cran.r-project.org/package=cowplot (accessed December 30, 2020).
Willette, D. A., and Santos, M. D. (2013). Correcting widespread misidentifications of the highly abundant and commercially important sardine species Sardinella lemuru, Bleeker, 1853 in the Philippines. J. Appl. Ichthyol. 29, 881–885. doi: 10.1111/jai.12051
Willette, D. A., Bognot, E., Mutia, M., and Santos, M. (2011). Biology and ecology of sardines in the Philippine: a review. BFAR NFRDI Tech. Paper Ser. 13, 1–22.
Willette, D., Allendorf, F., Barber, P., Barshis, D., Carpenter, K., Crandall, E., et al. (2014). So, you want to use next-generation sequencing in marine systems? Insight from the Pan-Pacific advanced studies institute. Bull. Mar. Sci. 90, 79–122. doi: 10.5343/bms.2013.1008
Willing, E. M., Dreyer, C., and van Oosterhout, C. (2012). Estimates of genetic differentiation measured by fst do not necessarily require large sample sizes when using many snp markers. PLoS One 7:e42649. doi: 10.1371/journal.pone.0042649
Winter, D. J. (2012). MMOD: an R library for the calculation of population differentiation statistics. Mol. Ecol. Resour. 12, 1158–1160. doi: 10.1111/j.1755-0998.2012.03174.x
Keywords: Bali sardinella, population genomics, RADseq, sea surface temperature, SNPs, stock assessment
Citation: Labrador K, Palermo JD, Agmata A, Ravago-Gotanco R and Pante MJ (2022) Restriction Site-Associated DNA Sequencing Reveals Local Adaptation Despite High Levels of Gene Flow in Sardinella lemuru (Bleeker, 1853) Along the Northern Coast of Mindanao, Philippines. Front. Mar. Sci. 9:766936. doi: 10.3389/fmars.2022.766936
Received: 30 August 2021; Accepted: 19 January 2022;
Published: 24 February 2022.
Edited by:
Sangeet Lamichhaney, Uppsala University, SwedenReviewed by:
Hsiu-Chin Lin, National Sun Yat-sen University, TaiwanJuha Merilä, University of Helsinki, Finland
Copyright © 2022 Labrador, Palermo, Agmata, Ravago-Gotanco and Pante. This is an open-access article distributed under the terms of the Creative Commons Attribution License (CC BY). The use, distribution or reproduction in other forums is permitted, provided the original author(s) and the copyright owner(s) are credited and that the original publication in this journal is cited, in accordance with accepted academic practice. No use, distribution or reproduction is permitted which does not comply with these terms.
*Correspondence: Kevin Labrador, a2xsYWJyYWRvckB1cC5lZHUucGg=