 Ahra Mo
 Eun Jin Yang
 Sung-Ho Kang
 Dongseon Kim
 Kitack Lee
 Young Ho Ko
 Kitae Kim
 Tae-Wook Kim
- 1Division of Environmental Science and Ecological Engineering, Korea University, Seoul, South Korea
- 2Division of Ocean Science, Korea Polar Research Institute, Incheon, South Korea
- 3Marine Environmental Research Center, Korea Institute of Ocean Science and Technology, Busan, South Korea
- 4Division of Environmental Science and Ecological Engineering, Pohang University and Science and Technology, Pohang, South Korea
- 5OJEong Resilience Institute, Korea University, Seoul, South Korea
- 6Research Unit of Cryogenic Novel Materia, Korea Polar Research Institute, Incheon, South Korea
The role of sea ice melting on the air-sea CO2 flux was investigated at two ice camps in the East Siberian Sea of the Arctic Ocean. On average, sea ice samples from the two ice camps had a total alkalinity (TA) of ∼108 and ∼31 μmol kg–1 and a corresponding salinity of 1.39 and 0.36, respectively. A portion (18–23% as an average) of these sea ice TA values was estimated to exist in the sea ice with zero salinity, which indicates the excess TA was likely attributed to chemical (CaCO3 formation and dissolution) and biological processes in the sea ice. The dilution by sea ice melting could increase the oceanic CO2 uptake to 11–12 mmol m–2 d–1 over the next 21 days if the mixed layer depth and sea ice thickness were assumed to be 18.5 and 1.5 m, respectively. This role can be further enhanced by adding TA (including excess TA) from sea ice melting, but a simultaneous release of dissolved inorganic carbon (DIC) counteracts the effect of TA supply. In our study region, the additional impact of sea ice melting with close to unity TA:DIC ratio on air-sea CO2 exchange was not significant.
Introduction
The carbon dioxide concentration in the atmosphere has increased from ∼280 ppm in the preindustrial era to the current ∼410 ppm due to human activities, such as the use of fossil fuels, cement production, and land-use changes (Le Quéré et al., 2018). During this period of increasing atmospheric CO2, more than a third of anthropogenic CO2 has been absorbed by the ocean through the air-sea gas exchange (Sabine et al., 2004; Gruber et al., 2009, 2019). Specifically, it has been suggested that marginal seas bordering continents contribute disproportionately to storing anthropogenic CO2 despite their small spatial coverage (∼7%) (Cai et al., 2006; Chen and Borges, 2009; Lee et al., 2011). As of 2005, the Arctic Ocean had absorbed 2.5–3.5 Pg C of anthropogenic CO2 (Tanhua et al., 2009), which is twice the amount expected for the area it covers. The absorption of CO2 by the Arctic Ocean may be further enhanced by increasing surface area exposed to the atmosphere and reduced surface partial pressure of CO2 (pCO2) caused by mixing with ice melt waters (Bates et al., 2006; Sejr et al., 2011). However, opposing results were also reported (Cai et al., 2010; DeGrandpre et al., 2020). Oceanic CO2 uptake can be suppressed as a result of increasing temperature and decreasing nutrient availability, which reduces CO2 solubility and biological CO2 uptake, respectively (Cai et al., 2010; Land et al., 2013). According to the Intergovernmental Panel on Climate Change, sea ice coverage in September will be reduced by ∼50% in Representative Concentration Pathways (RCP) 2.6 scenario and by almost 100% in RCP8.5 scenario compared to observational sea ice extent from 1986 to 2005 (Pörtner et al., 2019). Based on the 2°C warming scenario, Niederdrenk and Notz (2018) suggested a ∼20% reduction of the sea ice extent in March and a ∼15% chance of near ice-free conditions during summer months by the end of this century. In this future scenario, contrary to the impact of the increasing ice-free surface on the air-sea CO2 flux, Arctic Ocean warming will reduce the seawater solubility of CO2 and may be capable of weakening the CO2 absorption processes involved in the annual cycle of sea ice formation and melting (Manizza et al., 2013; Ouyang et al., 2020). The latter effect explained below is the main focus of this study.
Arctic sea ice begins to form during the fall season. During sea ice formation, impurities such as salt, gasses, and particles are partly rejected to the underlying seawater and partly trapped within the sea ice structure. As sea ice cools down and brine partly freezes, the salinity of the brine remaining in the brine pocket increases, causing a buildup of dissolved inorganic carbon (DIC) and total alkalinity (TA). In addition, the contraction of the brine volume in sea ice caused by low temperatures can make sea ice effectively impermeable to brine transport (Golden et al., 2007). Along with these processes, the crystallization of calcium carbonate minerals (Ikaite: CaCO3⋅6H2O) can be facilitated in the sea ice (Papadimitriou et al., 2004; Dieckmann et al., 2008, 2010; Geilfus et al., 2013; Rysgaard et al., 2014; Obbard et al., 2016; Petrich and Eicken, 2017). As pCO2 increases in response to CaCO3 precipitation, the CO2 efflux from the sea ice to the atmosphere is enhanced during the fall season when sea ice is formed (Geilfus et al., 2013). However, brine rejection during sea ice formation causes an increase in salinity (and density) of the surrounding seawater, and thus facilitates the sinking of surface water, sequestrating CO2 at greater depths (Miller et al., 2011; König et al., 2018). During the melting season, the CO2 flux from the atmosphere to the sea ice and seawater becomes dominant. In the sea ice, pCO2 of the brine decrease due to the dissolution of CaCO3 crystals and a dilution by snow and sea ice melt water with low DIC (Geilfus et al., 2012, 2015; Lannuzel et al., 2020). Furthermore, as water from sea ice melting is released at the ocean surface, DIC and pCO2 in the seawater decrease, thereby increasing the uptake of CO2 from the atmosphere to the ocean. CaCO3 crystals are also released at the ocean surface during sea ice melting, supplying an excess TA that is not explained by a conservative linear relationship between salinity and TA (Nedashkovsky et al., 2009; Geilfus et al., 2012; Rysgaard et al., 2012; Chen et al., 2015). Geilfus et al. (2016) performed a sea ice-seawater mesocosm experiment to show the effect of CaCO3 crystal export on water column carbonate chemistry during sea ice growth and degradation. The presence of CaCO3-induced TA was reported more than 30 years ago in both Arctic and Antarctic seawaters (e.g., Jones et al., 1983; Chen, 1985). The brine rejection and CaCO3 production involved in the seasonal waning and waxing of sea ice may serve as a natural CO2 pump in polar regions (Rysgaard et al., 2007). However, the impact of these processes has not been fully explored despite increasing efforts to include inorganic carbon dynamics related to sea ice (e.g., Moreau et al., 2015, 2016; Fransson et al., 2017; DeGrandpre et al., 2019).
The East Siberian Sea (ESS) is one of the least studied subregions in the Arctic Ocean, although this region is experiencing the most rapid change in sea ice coverage, which could be partially attributed to recent Siberian heatwaves (Stroeve et al., 2012; Krumpen et al., 2019; Overland and Wang, 2020; Wang et al., 2020). In this perspective, we aim to quantify the effect of sea ice melting on the summertime CO2 absorption capacity of the ESS, dependent on the degree of freshening and TA/DIC concentration and ratio of the sea ice. Following Chen (1985) and Nomura et al. (2013a), we also evaluated excess TA of sea ice, including the possible contribution of CaCO3 using a conservative linear mixing relationship between salinity and TA, which only requires analytical systems for salinity and TA that are more easily accessible to research groups (e.g., chemical oceanographers) investigating this issue.
Materials and Methods
This study was performed in August 2017 as part of the Arctic Cruise program (ARA08B) of the Korea Polar Research Institute, using the icebreaker ARAON. Two ice camps were established for sampling sea ice cores, snow, and melt pond water. The first ice camp sampling (IC1) was conducted on 13 August and the second (IC2) on 16 August (Figure 1). IC1 and IC2 were located at 77°35.8552′N, 179°19.4508′E and 75°22.0475′N, 176°14.0973′E, respectively, and were predicted to be covered by 1st-year ice (Figure 1C, obtained from the National Snow and Ice Data Center). Four sea ice cores were obtained from IC1, and three sea ice cores and five melt pond water samples were collected from IC2. One snow sample covering the sea ice core sites was collected from both ice camps. The sea ice cores had a diameter of 9 cm and were extracted using a MARK II coring system (Kovacs Enterprises, Roseburg, OR, United States) and stored in polyethylene (PE) bags at −20°C. All sea ice samples were transported to the laboratory for analyses of TA and DIC after the cruise (October, 2017). Melt ponds were not found at IC1, however, melt pond water was sampled at IC2 using a peristaltic pump. Samples were stored in 500 mL borosilicate bottles and immediately mixed with a 200 μL saturated mercury (II) chloride (HgCl2) solution.
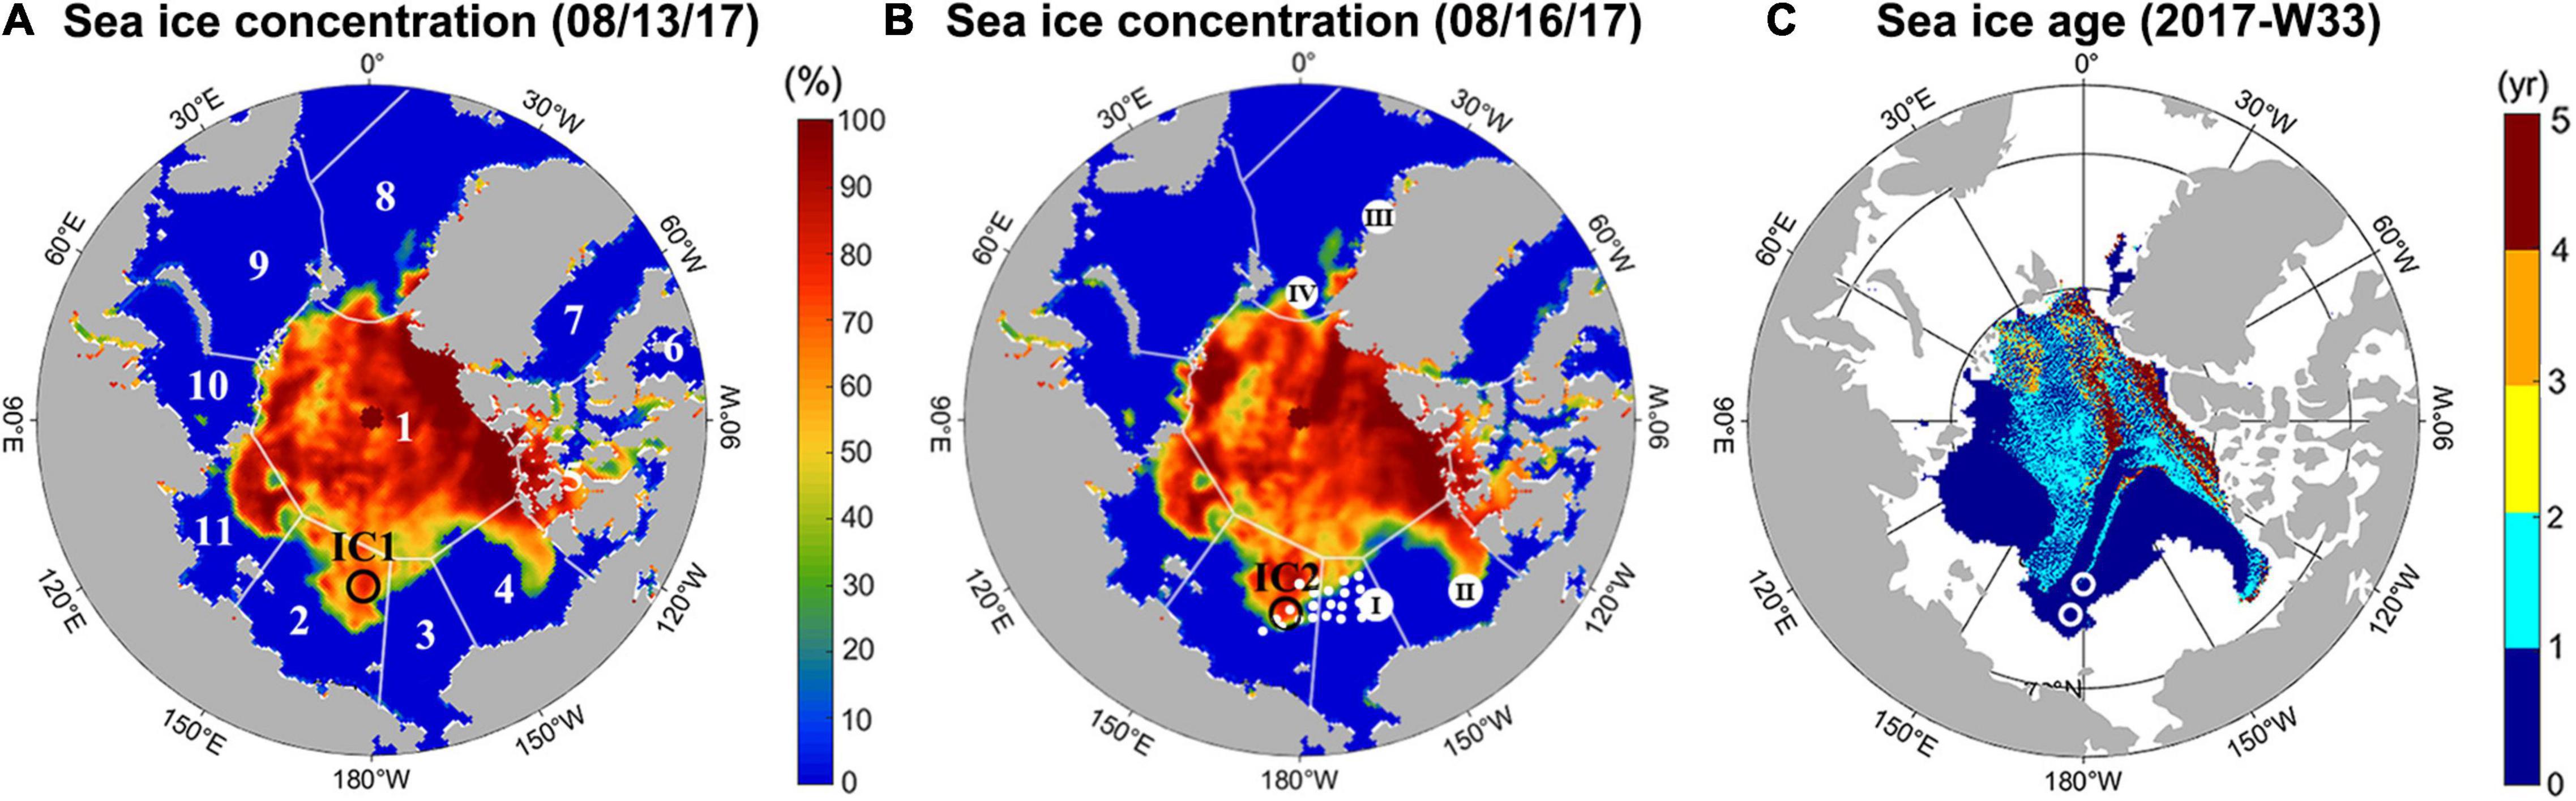
Figure 1. Sea ice concentration of the Arctic Ocean on (A) 13 August 2017, and (B) 16 August 2017. Color shading indicates the percentage of sea ice obtained from the National Snow and Ice Data Center (NSIDC; Maslanik and Stroeve, 1999). (A) Location of the first ice camp (IC1; open circle) and the Sea Ice Index regions of the Arctic Ocean (numbers), corresponding to (1) Central Arctic, (2) East Siberian Sea, (3) Chukchi Sea, (4) Beaufort Sea, (5) Canadian Archipelago, (6) Hudson, (7) Baffin, (8) Greenland Sea, (9) Barents Sea, (10) Kara Sea, and (11) Laptev Sea. Data for the Sea Ice Index regions were taken from Meier et al. (2007). (B) Location of the second ice camp (IC2; open circle) and seawater sampling stations (closed circle). Roman numerals represent the locations of previous studies investigating the impact of sea ice melting on air-sea exchange of CO2: (I) Cai et al. (2010), (II) Else et al. (2013), (III) Rysgaard et al. (2013), and (IV) Rysgaard et al. (2012). (C) Sea ice age in the 33rd week (08/14 to 08/20) of 2017, obtained from the NSIDC (Tschudi et al., 2019). The locations of the two ice camps are also shown (white circles).
In the laboratory (January, 2018), the sea ice cores were cut into 20 cm-long segments, transferred to commercially available low-density polyethylene (LDPE) bags and then mixed with the saturated HgCl2 solution in proportion to sea ice sample weight (0.04% by sample volume) to prevent biological activity. The LDPE bags were twice sealed with a vacuum sealer (FM-06, Eiffel, Seoul, South Korea) and a Nylon/polyethylene bag. The samples stored in gas-tight laminated plastic bags and the Nylon/polyethylene bag presented indistinguishable DIC concentrations (Hu et al., 2018). It was also shown that the use of the Nylon/polyethylene bags and the vacuum sealer caused no significant changes in the properties of seawater samples (Hu et al., 2018). After the sea ice and snow samples were completely melted, meltwater samples were slowly transferred to 500 mL borosilicate bottles to prevent the formation of bubbles. The DIC in the transferred samples (DICICE) was measured via coulometric titration using a Versatile Instrument for the Determination of Titration Alkalinity (VINDTA 3C, Marianda, Kiel, Germany) at room temperature.
Because of very low salinity (<3) and TA values (<220 μmol kg–1), the sea ice samples were mixed with various volumes of HgCl2-poisoned seawater collected in the East Sea (Sea of Japan) (salinity of 32 and TA of 2100 ± 2 μmol kg–1), and the TA of the mixture (TAMIX) was measured by potentiometric titration (Millero et al., 1993) using a VINDTA 3C instrument. The mixing (thus increasing salinity of samples) might reduce any potential problem caused by the difference in ionic strength in the TA samples and seawater certified reference material (CRM; prepared and distributed by Andrew Dickson, Scripps Institution of Oceanography) used to calibrate our analysis system. To validate this dilution method for TA measurement, we measured the TA value of the diluted seawater sample using CRM. In the salinity range of 15–32, measured TA values were consistent with the calculated TA values using a mixing ratio between CRM and deionized water (Supplementary Table 1). Prior to mixing, the ice meltwater sample and the seawater were, respectively filtered with syringe filter units of 0.45-μm pore size (ADVANTEC, 25HP045AN, Tokyo, Japan) and glass microfiber filters (GF/F; Whatman) at room temperature for the removal of phytoplankton and bacteria contribution on TA (Kim et al., 2006). It is noted that both ice meltwater and seawater are undersaturated with respect to ikaite at room temperature due to the high solubility of ikaite (Bischoff et al., 1993). Each empty borosilicate bottle was weighed, which was followed by weighing the bottle containing the seawater and the bottle containing the seawater and the sample. Based on weight changes, the mixing ratios of the sample and seawater were accurately determined. The salinity values of the seawater (SSW) were measured using a portable salinometer (8410A), while a portable conductivity meter (Orion Star A222) was used to determine the salinity of the sea ice meltwater (SICE), snow (SSN), and melt pond water (SMP). All salinity values were reported as practical salinity unit in this study, and thus unit was not indicated. The salinity values (SMIX) of the sample mixtures were determined based on the corresponding mixing ratios. Finally, a linear SMIX-TAMIX relationship was established for each sea ice segment sample and used to determine a TA value in the corresponding sea ice sample (i.e., TAICE) in combination with SICE. Confidence intervals at the 95% significance level for these TA measurements were determined from the uncertainties of the linear regressions.
Routine analyses using CRM ensured that the analytical precision for the DIC and TA measurements was approximately 1 and 2 μmol kg–1, respectively. The DIC and TA of snow (DICSN and TASN, respectively) and melt pond water (DICMP and TAMP, respectively) samples were determined using identical procedures as described above. Initial seawater conditions, which were required to examine the effect of sea ice melting on the air-sea CO2 flux, were ascertained from the mean DIC and TA values of surface seawater samples taken between the latitudes 75 and 77°N (collection locations shown in Figures 1A,B). The seawater DIC and TA measurements were also done using the VINDTA 3C. Seawater pH was measured by a spectrophotometric method to evaluate a possible contribution of organic alkalinity to our results (Clayton and Byrne, 1993; Ko et al., 2016). We used the CO2SYS program (CO2SYS Excel Macro version 2.3, Lewis and Wallace, 1998) to calculate pCO2 from the measured TA and DIC using measured sea surface temperature, and TA from the measured pH and DIC at the room temperature (Table 1), the carbonate dissociation constants of Mehrbach et al. (1973) (the equations refitted by Dickson and Millero, 1987) and other ancillary thermodynamic constants tabulated in Millero (1995). We also used the boron to chlorinity ratio of Lee et al. (2010). This set of thermodynamic constants yielded the agreement (comparable to analytical precision; ∼2 μmol kg–1) between measured CRM TA and calculated value from measured pH and DIC value of CRM, as previously demonstrated in a range of laboratory and field studies (McElligott et al., 1998; Lueker et al., 2000; Millero et al., 2006).
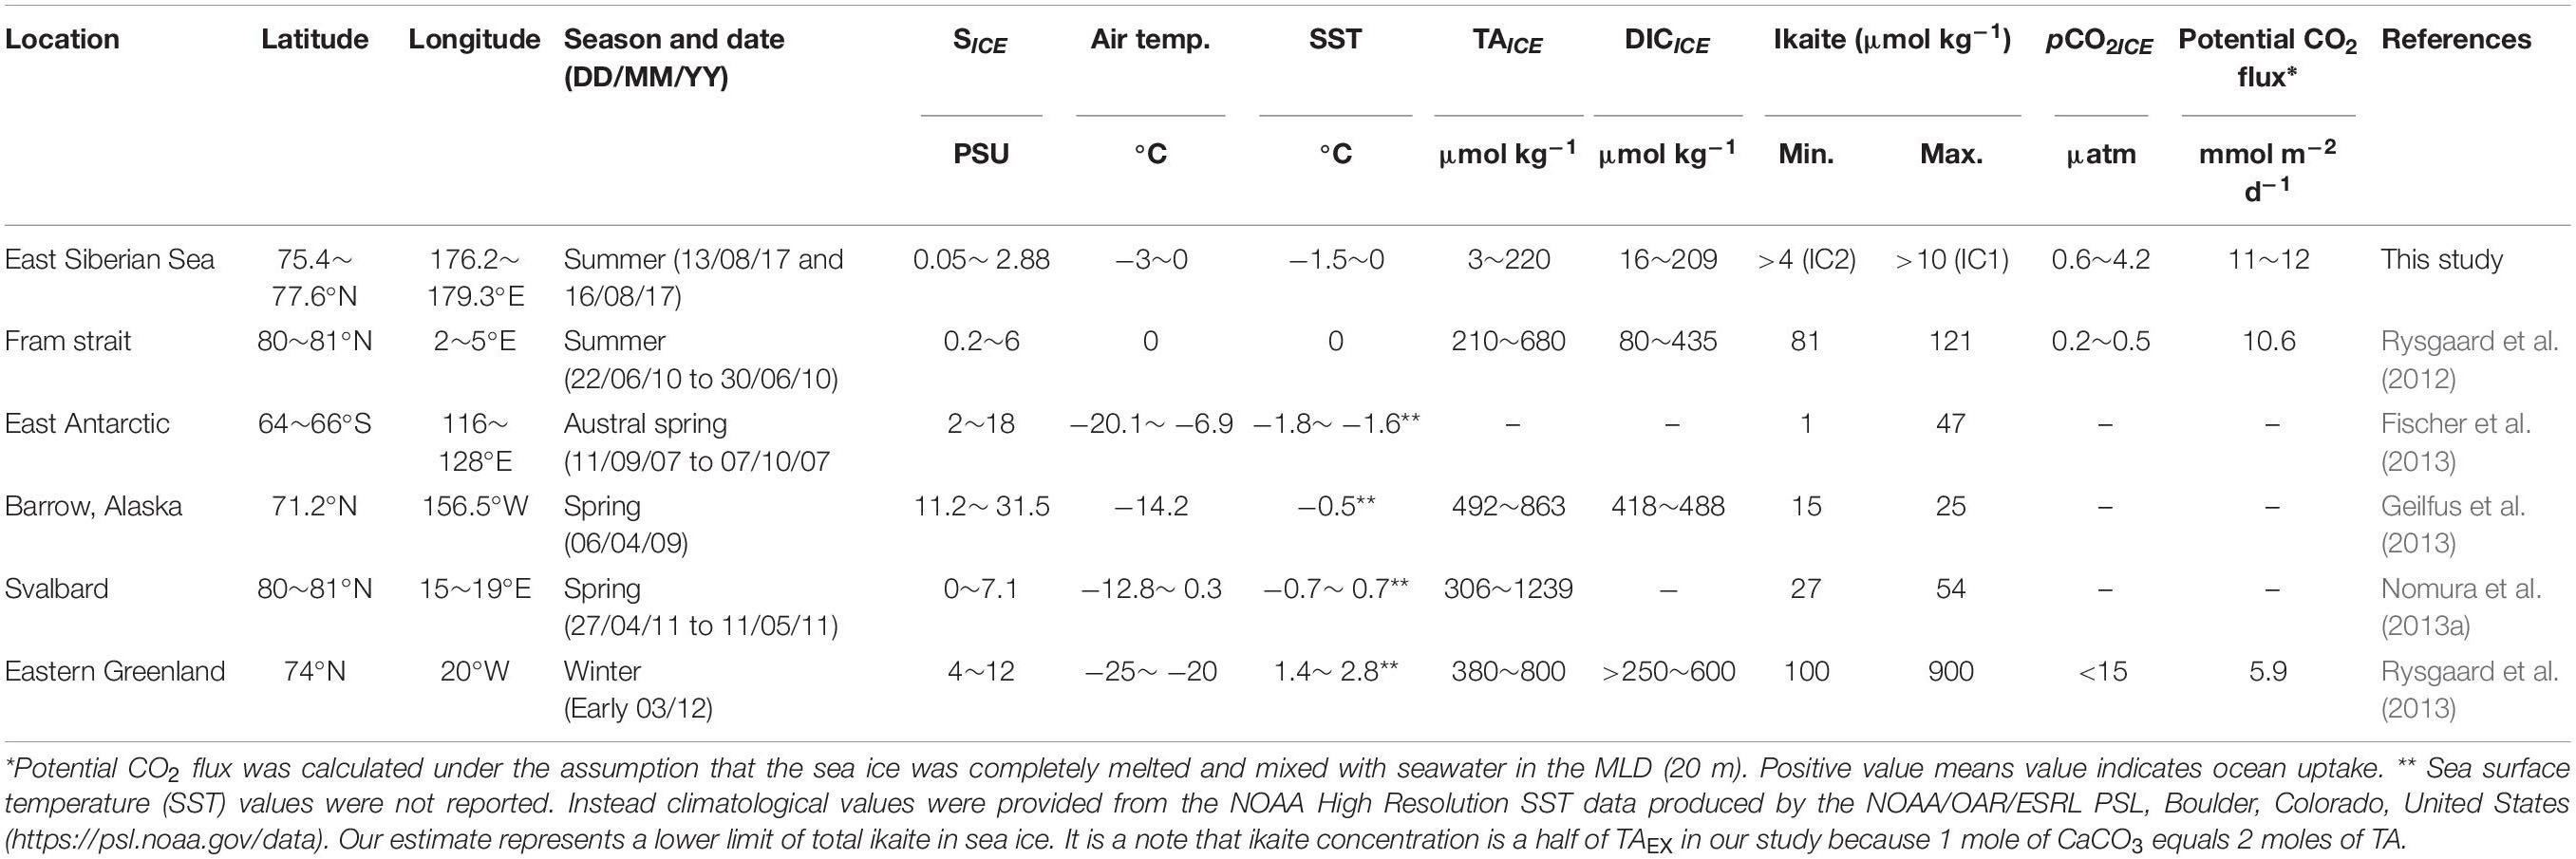
Table 1. Comparisons with the previous studies in polar regions.
Finally, air-sea CO2 flux (F) was estimated from an air-sea difference in pCO2 (ΔpCO2 = atmospheric pCO2 − seawater pCO2) and the following equation,
where, k represents the gas transfer velocity determined from Wanninkhof (2014), and K0 is the solubility coefficient in seawater for CO2 (Weiss, 1974). We used 400 μatm for the atmospheric pCO2, which was reported in Barrow, Alaska (71.3 °N, 156.6 °W) by the Scripps CO2 program.1 The mixed layer depth used in this study was provided from the Monthly Isopycnal and Mixed-layer Ocean Climatology data (Schmidtko et al., 2013).
Results and Discussion
Total Alkalinity and Dissolved Inorganic Carbon in the Ice Camp Samples and Factors Affecting Them
The average lengths (±1 standard deviation) of the sea ice cores were 110.3 (±35.9) cm at IC1, and 128.3 (±9.1) cm at IC2. At IC1, SICE ranged from 0.16 to 2.88, and TAICE and DICICE ranged from 27 to 219 μmol kg–1 and from 25 to 209 μmol kg–1, respectively (Figures 2A–D). In general, SICE, TAICE, and DICICE increased with depth at IC1. A similar profile was reported in the sea ice samples collected in the Beaufort Sea at the beginning of summer (Scharien et al., 2010). At IC2, the top (shallower than 30 cm) ice layer of two samples had higher values of SICE, TAICE and DICICE relative to the middle layer (Figures 2E,F). However, in common with IC1, the bottom (deeper than 50 cm) ice layer has the highest values of SICE, TAICE, and DICICE in all samples at IC2. In addition, the salinity profile shown in Fransson et al. (2013) was similar to our results (Figure 2F). The overall values of these components were lower in IC2, with SICE in the range 0.05–1.23 and TAICE and DICICE in the ranges of 3–87 and 16–77 μmol kg–1, respectively. As expected, the primary factor controlling TAICE and DICICE were salinity-related changes such as concentration and dilution during sea ice formation and degradation, respectively, which may be affected by weather conditions (e.g., air temperature above seas). In the snow and melt pond water, the TA and DIC distributions also increased with increasing salinity. The estimated TASN and DICSN values (± 95% confidence intervals) were −4 ± 4 and 17 ± 0 μmol kg–1 at IC1, and 0 ± 4 and 18 ± 1 μmol kg–1 at IC2, respectively. The negative TA value of the snow sample may be attributed to acid (e.g., SO4–2 and NO3–) deposition (Björkman et al., 2013; Macdonald et al., 2017).
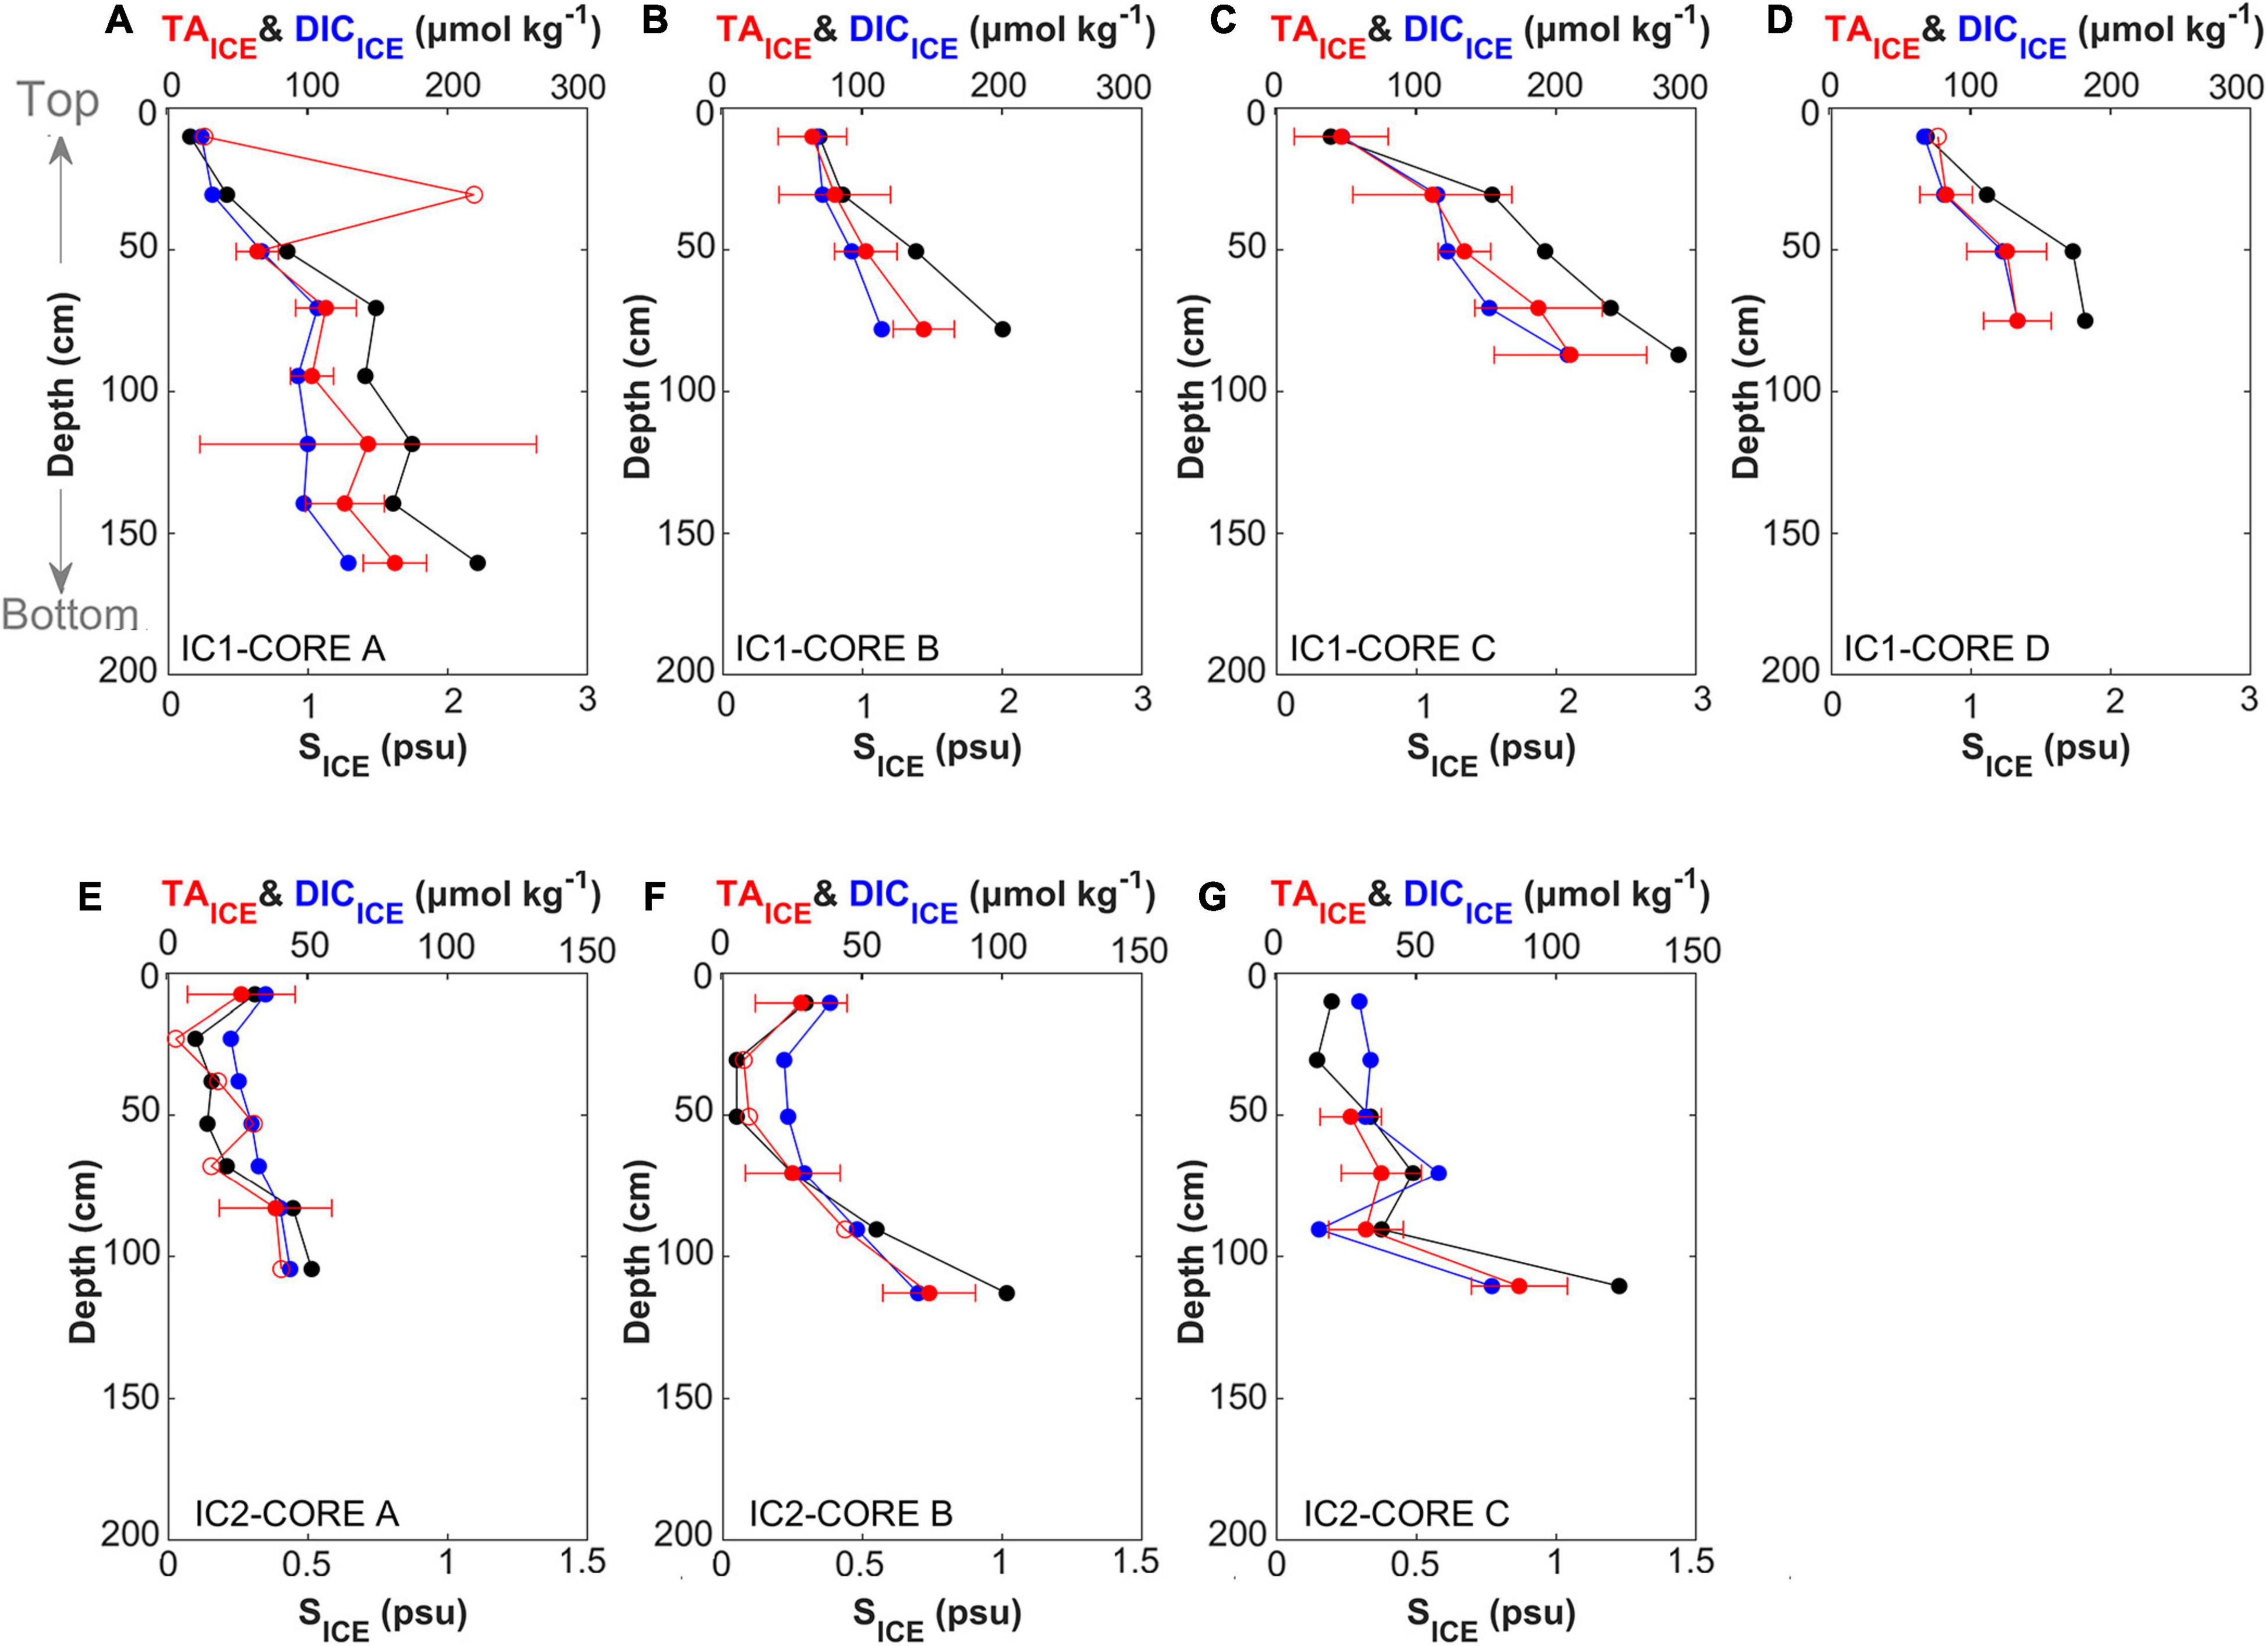
Figure 2. Vertical distributions of salinity (SICE; black, x-axis on the bottom of each panel), dissolved inorganic carbon (DICICE; blue, x-axis on the top of each panel), and total alkalinity (TAICE; red, x-axis on the top of each panel) with a 95% confidence interval. (A–D) represent results for Ice Camp 1 (IC1) and (E–G) for Ice Camp 2 (IC2). The TAICE values shown with an open circle were statistically insignificant at a 95% confidence interval.
The concentrations of SICE, TAICE, and DICICE were lower at IC2 than at IC1 (Figure 1A), indicating that the volume of sea ice melting at IC2 was comparatively greater. These observations are also consistent with the formation of melt pond only at IC2. For the melt pond water, TAMP and DICMP were in the ranges of 17–88 and 40–91 μmol kg–1, respectively. SSN (∼0.013) was found to be much lower than SMP (0.20–0.95). Thus the melt ponds appear to be significantly affected by sea ice melting. However, additional evidence such as oxygen isotope is required to confirm source waters for melt pond. The sea ice meltwater likely diluted or washed out the salts from the sea ice (Fransson et al., 2011; Geilfus et al., 2015; Kotovitch et al., 2016), and TA and DIC accumulated at the boundary regions between the ice crystals. Fresh water is released as sea ice melts, and air gaps emerge inside the sea ice, increasing permeability and the air-ice gas exchange flow (Cox and Weeks, 1983). Enhanced permeability may partially compensate for such a loss in DIC, which could explain the occurrence of some sea ice samples with DICICE:TAICE > 1 (Figures 2E–G). Previously, a laboratory sea ice chamber experiment reported an air-to-ice CO2 flux during ice melt (Kotovitch et al., 2016).
Excess Total Alkalinity in Sea Ice
The regression equations between TAICE and SICE for both IC1 and IC2 show non-zero intercepts of 19 ± 8 μmol kg–1 (R2 = 0.98, p < 0.005) and 7 ± 4 μmol kg–1 (R2 = 0.95, p < 0.005), respectively (Figures 3A,B). These excess TA values at S = 0 (TAEX) indicate that the sea ice samples were influenced by a process that shifted a conservative TA-S mixing line upward. We attribute the positive intercepts to the contribution of CaCO3 (TACC) in the sea ice (i.e., TAEX formed by TACC). However, an alternative explanation is the contribution of freshwater containing TA, as studies have reported that rivers discharging into the Arctic Ocean have an average TA of ∼1000 μmol kg–1 (Cooper et al., 2008). Pipko et al. (2011) reported lower values for the ESS (∼470 and ∼850 μmol kg–1 from the Kolyma and Lena rivers, respectively). We, therefore, tested the possibility that riverine TA produced the TAEX in our sea ice samples. We first assumed that the proportion of all chemical species rejected during the formation of sea ice was the same as that in seawater with no CaCO3 precipitation. In other words, the TA value of any sea ice should fall on a linear relationship between two points representing pure ice (i.e., SICE = 0 and TAICE = 0 μmol kg–1) and the source seawater that froze to generate the sampled sea ice (Figure 3C).
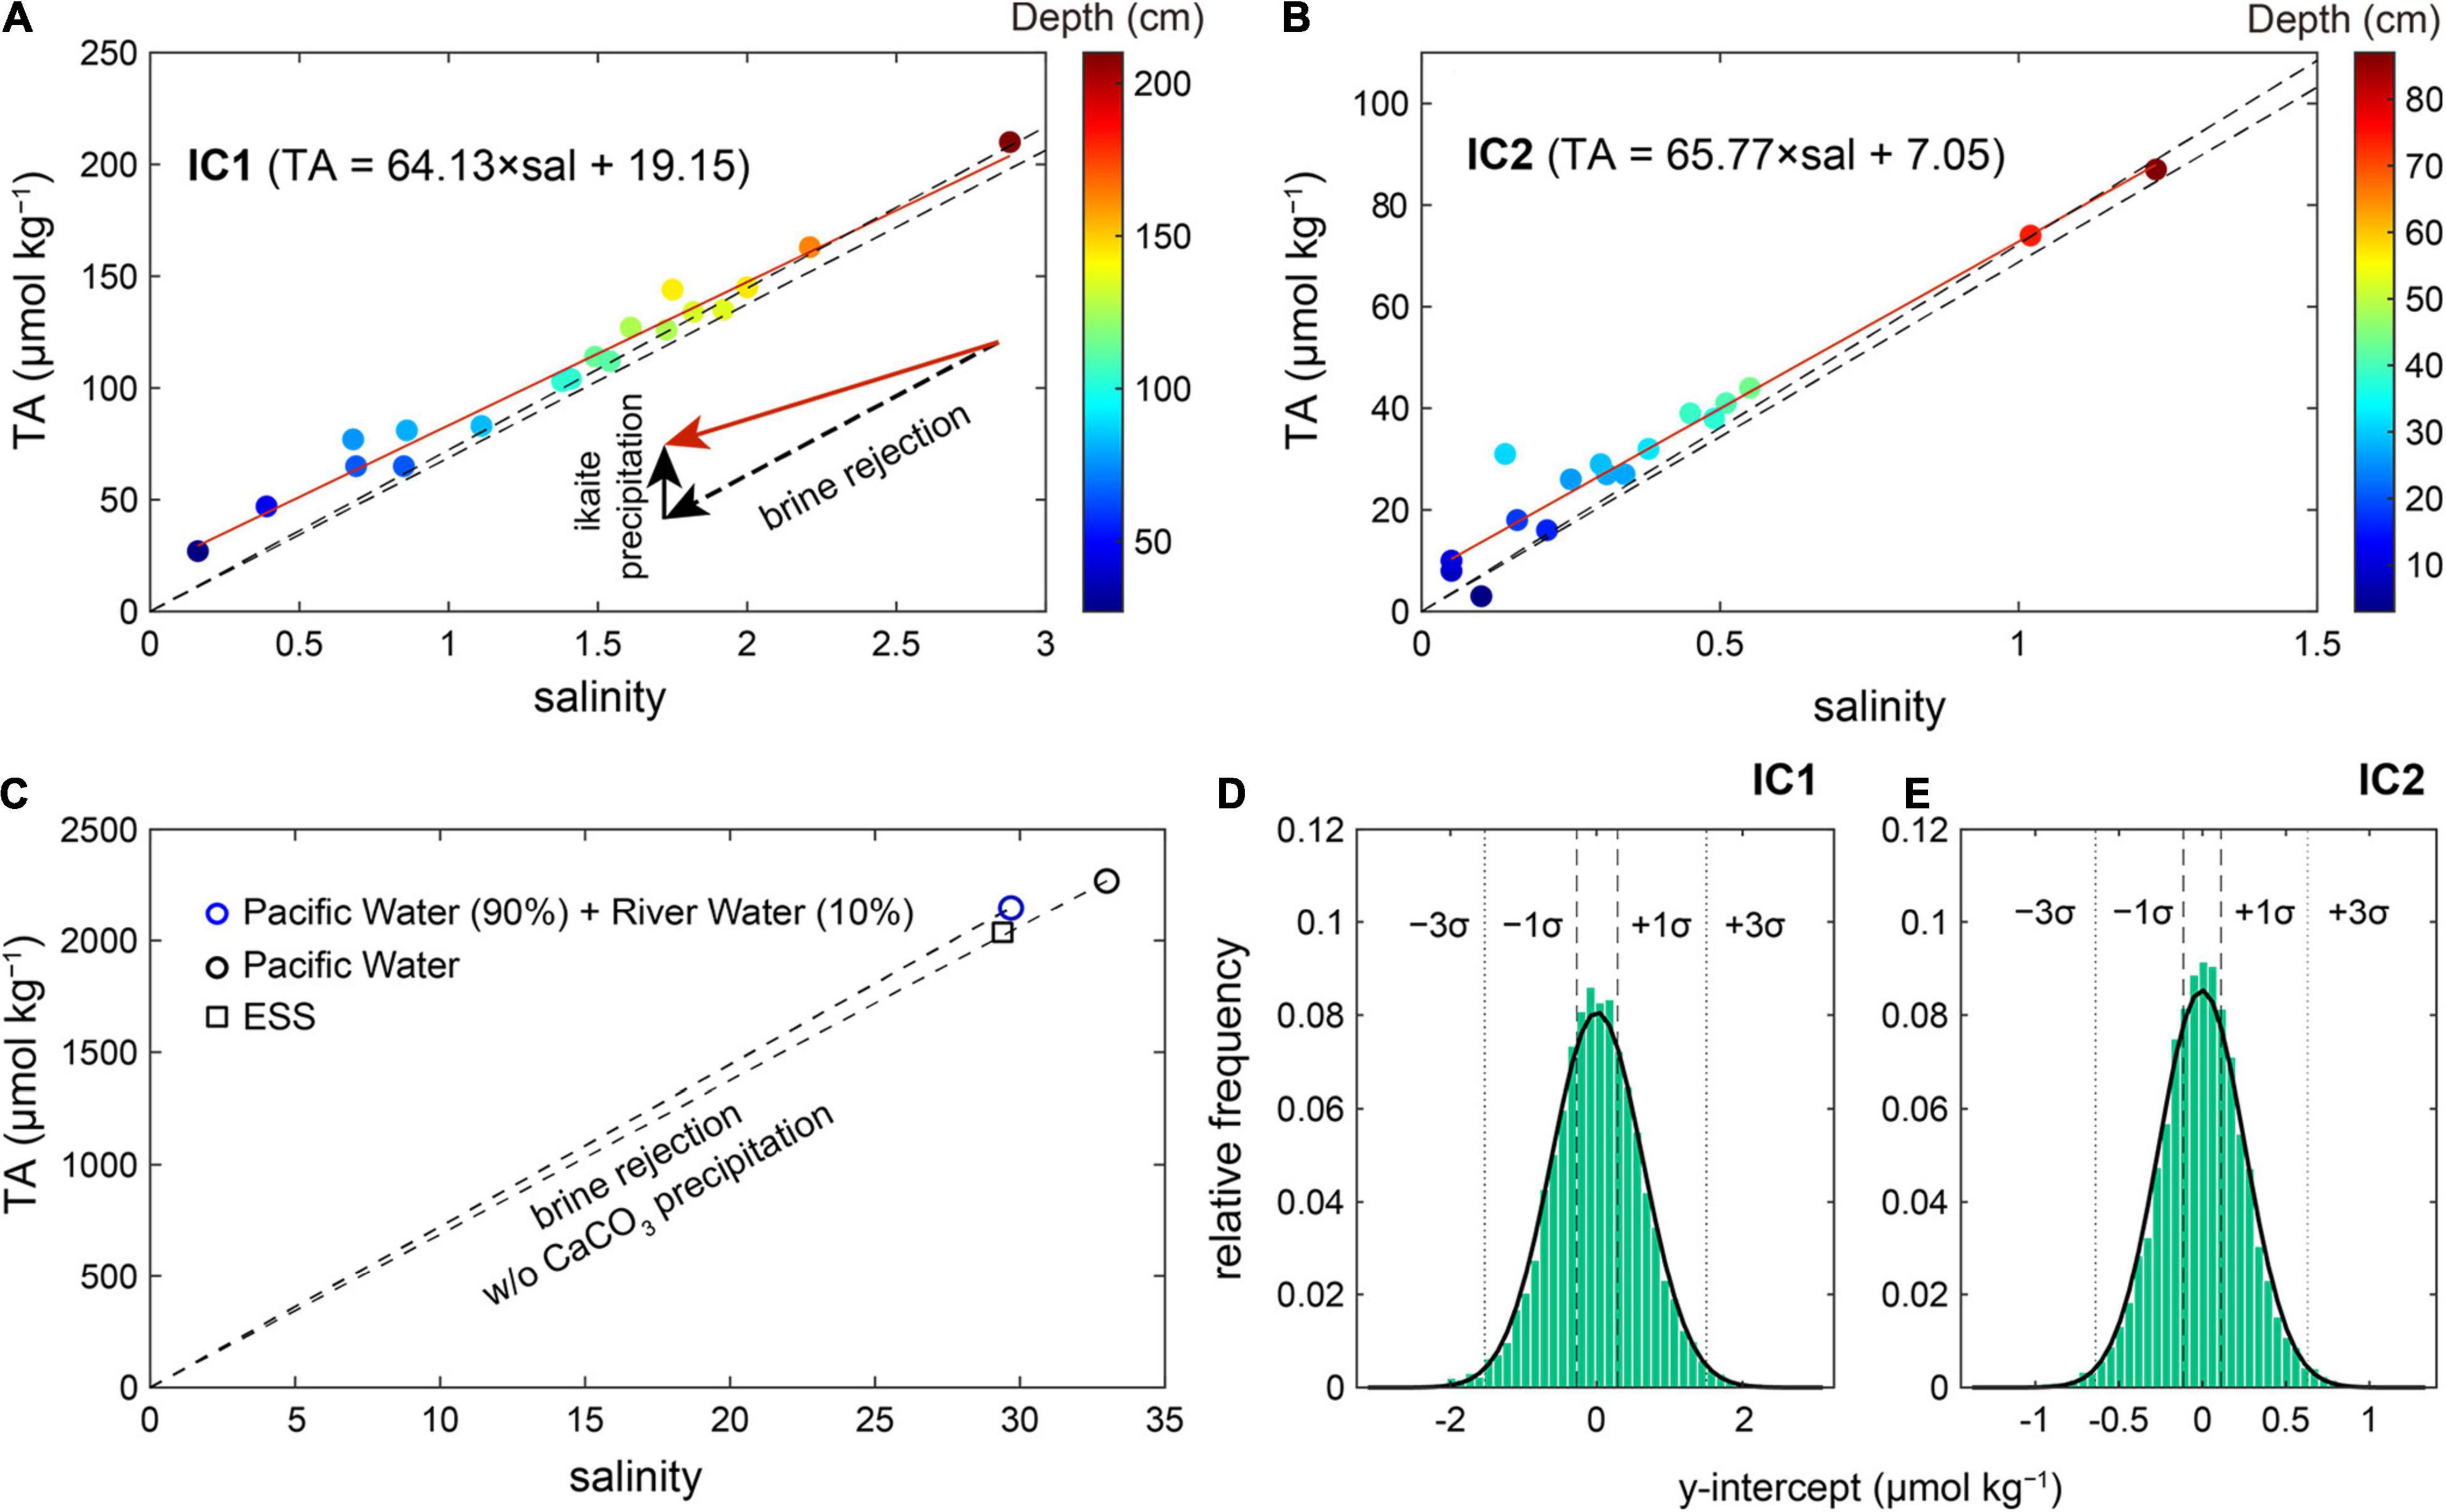
Figure 3. Relationships between TAICE and SICE at IC1 (A) and IC2 (B). Red lines indicate the linear regression lines. Positive intercepts suggest the existence of CaCO3 crystals in sea ice samples. Color shading represents the depths for the sea ice segments. (C) Linear relationships representing conservative mixing between pure sea ice water (S = 0 and TA = 0 μmol kg– 1) and two seawater endmember values (open circles), with one representing Pacific Winter Water and the other representing the same seawater but diluted by 10% with river water with TA = 1048 μmol kg– 1. These lines are also shown in (A,B). Note that SICE and TAICE in the winter season are likely to be located in the triangle (close to the bottom line) because river discharge in winter (67 km3 month– 1) is ∼25% of summer (253 km3 month– 1) in the Arctic Ocean (Holmes et al., 2012). In the winter, net community production, which can deviate the linear relationship between salinity and TA by raising TA, is limited by reduced solar radiation. The square symbol represents the mean seawater TA and S values in the East Siberian Sea (ESS). Probability distribution plots showing intercept values that could be produced from excess TA in river water with no CaCO3 precipitation at IC1 (D) and IC2 (E). An anomalously high TAICE value (=219 μmol kg– 1; Figure 2A) was excluded in this figure and calculating the linear regression. It is a note that including it increased the y-intercept (i.e., TAEX).
Two seawater endmembers were considered to investigate the effect of riverine water on our TAEX: Pacific Winter Water in the Chukchi Sea (S = 32.99 and TA = 2269 μmol kg–1; Qi et al., 2017) and the same seawater but diluted by 10% with river water (S = 0 and TA = 1048 μmol kg–1). The 10% contribution of river waters was chosen based on Jung et al. (2021) conducted in the same cruise. Three points, including zero salinity and TA values, form a triangle zone between the two lines shown in Figure 3C. In principle, any data falling above this zone (or above the upper line; Figures 3A,B) cannot be explained by riverine TA only, and must include the effect of sea ice TAEX. Thus almost all data with SICE < 1 could support the presence of TAEX (formed by ikaite) in sea ice. The higher concentration of TAEX in the upper layer is consistent with previous studies suggesting that ikaite concentration is related to the temperature of the sea ice (Fransson et al., 2013; Rysgaard et al., 2013, 2014). In contact with the cold atmosphere, the top of the sea ice is favorable (close or lower than freezing temperature) for ikaite precipitation (Bischoff et al., 1993), and a relatively large amount of ikaite can be preserved in summer (Nomura et al., 2013a). On the other hand, a lower concentration of ikaite in the middle and bottom layers suggested that ikaite was exported to underlying seawater in summer (Rysgaard et al., 2013). If no CaCO3 precipitation was assumed to occur, any sea ice affected by a riverine contribution (<10%) should fall within the triangle zone with no exception. However, the converse is not always true. In other words, all the data located within the triangle zone were not only affected by riverine TA, allowing the contributions of other TAEX sources to them. Therefore, it was required to assess the whole data together. If riverine TA was the only TAEX source, the regression of all available data should approach a zero TA with decreasing salinity, as riverine TA (accumulated in the source seawater) mixed with sea ice meltwater with no TAEX. To test this, we randomly selected the same number of data points within the same salinity ranges as IC1 and IC2, and calculated the intercept of the linear regression line. Repeated simulations (n = 50,000) showed that it was nearly impossible for the case of mixing with river water (<10%) to produce the observed TAEX of 19 and 7 μmol kg–1 in IC1 and IC2, respectively (Figures 3D,E). The riverine TA could produce a TAEX of ∼4 and ∼2 μmol kg–1 at IC1 and IC2 at best, respectively, which are values that lie within the uncertainties of our estimates.
Another factor capable of altering sea ice acid-base balance is organic acids (Yang et al., 2015; Ko et al., 2016), because high dissolved organic carbon concentrations (up to 600 μM) were reported in the Arctic sea ice (Thomas et al., 1995). However, according to the TA definition of Dickson (1981), organic acids with pKa ≥ 4.5 do not change TA because a dissociated conjugate base reacts with a proton of titrant, and thus cause no change in TA, whereas organic acids with pKa < 4.5 reduce TA (Ko et al., 2016; Hu, 2020). The former is the same as the effect of CO2 dissolution on TA. Therefore, our TAEX estimates cannot be generated by organic bases originating from dissolved organic matter production or degradation of particulate organic matter. Rather, our results would be underestimated if there was a significant production of weak organic acids with pKa < 4.5. As an exception, if the sea ice samples had precipitates consisting of metal ions and conjugate bases of organic acids with pKa ≥ 4.5, they would increase TA, whose effect is identical to that of CaCO3 crystals (Hu, 2020). To our knowledge, such a precipitate was not reported in sea ice. Finally, phytoplankton uptake of nutrient increase TA. However, ocean climatology databases (World Ocean Atlas 2018 and Global Ocean Data Analysis Project version 2) showed depletions of NO3– in the surface layer of the study area (Garcia et al., 2019; Olsen et al., 2020).
Weak organic acids can introduce an error in calculating a carbonate variable from two measured ones (e.g., pCO2 from TA and DIC), because organic acids proportionally change the contributions of other species (e.g., CO32–, B(OH)4–) to TA (Ko et al., 2016). Thus we evaluated the effect of organic acids contained in Arctic seawater on the internal consistency among seawater carbonate parameters by comparing measured TA (TAMEAS) and calculated one (TACALC) from measured pH and DIC. The difference (ΔTAM–C = TAMEAS – TACALC) can be attributed to the effect of organic alkalinity (conjugate bases of weak acids) (e.g., Yang et al., 2015; Ko et al., 2016). The estimated ΔTAM–C was ∼7 μmol kg–1 in seawaters, and thus the potential organic alkalinity contributions were estimated to be ∼0.3 and ∼0.1 μmol kg–1, at IC1 and IC2, respectively, if taking into account a linear reduction of ΔTAM–C with decreasing salinity. Thus we ignored the effect of organic alkalinity on estimating the impact of sea ice melting on air-sea exchange of CO2 in the following section.
Previous studies showed that the ikaite concentration in sea ice samples varies considerably in time and space (Rysgaard et al., 2012, 2013; Fischer et al., 2013; Geilfus et al., 2013; Nomura et al., 2013a). Our estimates are much lower than most of those observed in previous studies (Table 1). It is a note that ikaite concentration is a half of TAEX in our study because 1 mole of CaCO3 equals 2 moles of TA. Factors affecting ikaite formation and dissolution include air and ice temperatures (controlling sea ice formation), salinity (affecting ion strength, crystal nucleation, and concentrations of CO32– and Ca2+ ions), pH (affecting CO32– concentration), CO2 removal (by air-sea exchange or CO2 assimilation; affecting pH and DIC), snow (affecting ice temperature), and other ion species (Mg2+, PO43–, and SO42– as inhibitor or facilitator) (Papadimitriou et al., 2013, 2014; Rysgaard et al., 2013, 2014; Hu et al., 2014; Tollefsen et al., 2018). However, unfortunately, it was not possible to assess the effects of various ions, salts, and pH on the estimated ikaite concentrations of the previous studies (shown in Table 1), because temporal evolutions of these variables from winter to summer were not available. In general, previous estimates of higher ikaite concentration during winter than in summer indicate a seasonal reduction of ikaite concentration during the warming period (Rysgaard et al., 2013). Similarly, our summer sampling, and thus under conditions of enhanced sea ice degradation, was probably one of the factors accounting for the relatively low ikaite concentration observed in our study. In addition, ikaite could transform into calcite or vaterite when exposed to air at higher temperature (>10°C) (Sánchez-Pastor et al., 2016; Purgstaller et al., 2017). At room temperature, the transformation of ikaite in the melted sea ice sample could result in an underestimation of our calculated TAEX if particulate calcite or vaterite were preserved and filtered. However, our sea ice meltwater with low salinity was undersaturated with respect to calcite (saturation state of calcite is <0.3), suggesting that the effect of transformation of ikaite was negligible on our TAEX estimate.
Rysgaard et al. (2013) compared the TA-to-salinity (TA:S) ratios in sea ice and seawater. The TA:S ratios were greater in sea ice relative to those in the water column by ∼17 μmol kg–1 S–1 as TA (not ikaite). The same study also showed that ikaite concentrations measured by an image analysis technique fell within the same range of sea ice TA (i.e., TAICE = TACC and TAEX < TACC), implying that a TA fraction (TASAL) explained by the conservative TA-salinity relationship existed as ikaite within their sea ice samples. Based on this result, it could be inferred that our approach attributing only TAEX to ikaite could underestimate ikaite concentration in sea ice. If extrapolating the excess TA:S in sea ice of Rysgaard et al. (2013) to our study (i.e., assuming simultaneous removal of ikaite and solutes with decreasing salinity or increasing dilution by sea ice melt water), IC1 and IC2 with the mean salinity values of 1.39 and 0.36 could have the sea ice TAEX of ∼27 and ∼6 μmol kg–1, respectively, reducing the gap between Rysgaard et al. (2013) and our study. The effects of sea ice ikaite formation on air-sea exchange of CO2 need to be separated because the effects of TASAL can be evaluated from the seawater TA-S relationship without an effort to measure ikaite.
Our TAEX values are also substantially lower than estimates of 160–240 μmol kg–1 (ikaite contribution as TA) reported by Rysgaard et al. (2012), who sampled drifting ice floes in the Fram Strait during the summer of 2010. In addition, a study conducted in the Pacific sector in the Arctic Ocean suggested large enhancements in seawater TA caused by dissolution of ikaite crystal in the marginal sea ice zone during summer (Chen et al., 2015), which was quantitatively consistent with the result of Rysgaard et al. (2012). However, an assumption that Rysgaard et al. (2012) made to estimate ikaite tended to overestimate ikaite concentration. They calculated ikaite concentration from the difference between TA and DIC in sea ice, although DIC is not a conservative parameter due to gas exchange and biological processes. In fact, Moreau et al. (2015) suggested that a TA:DIC ratio of ∼2 in sea ice could be caused by outgassing. If comparing the TA:S ratio in sea ice and seawater of Rysgaard et al. (2012), their sea ice samples had the sea ice TAEX of ∼107 μmol kg–1 at salinity of 3.9, which could be further reduced to 15–55 μmol kg–1 when normalizing to our sea ice salinity values. Nomura et al. (2013a) measured TA after filtering sea ice meltwaters to remove ikaite crystal, and then estimated a loss of TA relative to salinity. Their result represents only TASAL in sea ice, thus underestimating total ikaite concentration. Overall, our TAEX could not represent the whole ikaite concentration in sea ice despite a TAEX production due to ikaite formation, but instead should be used to separate the effects of sea ice melting on seawater carbonate chemistry that is not explained by sea ice salinity. Combining our approach and that of Nomura et al. (2013a) can reveal both TAEX and TASAL in sea ice, and thus total ikaite concentration.
Impact of Sea Ice Melting on Air-Sea Exchange of CO2
Based on the characteristics of the sea ice samples, we examined the impact of sea ice melting by calculating the potential uptake of atmospheric CO2 in the MLD of the ESS (Table 2). The ESS MLD was assumed to be ∼20 m in the study area in summer (Schmidtko et al., 2013) with an average thickness of sea ice of ∼1.5 m (Global Ice-Ocean Modeling and Assimilation System; Zhang and Rothrock, 2003). Daily air-sea CO2 flux was estimated from the equation (1), and the required gas transfer velocity (k) was calculated using the mean wind speed of ∼7.0 m s–1 (measured during the survey) following the suggestion of Wanninkhof (2014). The enhancement in the total carbon content due to air-sea CO2 exchange was calculated under the assumption that the sea ice located in the marginal ice zone was completely melted and mixed with seawater in the MLD. We also assumed that the pCO2 of the seawater returned to an original condition (pCO2iSW) through the air-sea CO2 exchange without considering further degradations of sea ice and biological processes in our study region. The original condition corresponded to approximately pCO2 of 309 μatm determined based on our observations (TAiSW = 2037 μmol kg–1, DICiSW = 1932 μmol kg–1, SiSW = 29.4, and TiSW = 0°C; where iSW indicates “initial seawater condition”) conducted during our survey period. The mean TAICE values were estimated from the linear TAICE-SICE relationship (Figure 3) and the mean salinity at the two ice camps (1.39 at IC1 and 0.36 at IC2). Sea ice (1.5 m) melting at IC1 (TAICE = 108 μmol kg–1, TAEX = 19 μmol kg–1, and DICICE = 97 μmol kg–1) caused seawater (18.5 m) pCO2 value to be reduced to ∼277 μatm. If TAEX is excluded, the resulting pCO2 is ∼280 μatm. In the case of IC2 (TAICE = 31 μmol kg–1, TAEX = 7 μmol kg–1, and DICICE = 25 μmol kg–1), seawater pCO2 was reduced to ∼276 μatm after sea ice melting (∼278 μatm without considering TAEX). These estimated pCO2 drops were twice that found in the Amundsen Gulf, Arctic Ocean during the spring season (Fransson et al., 2013).
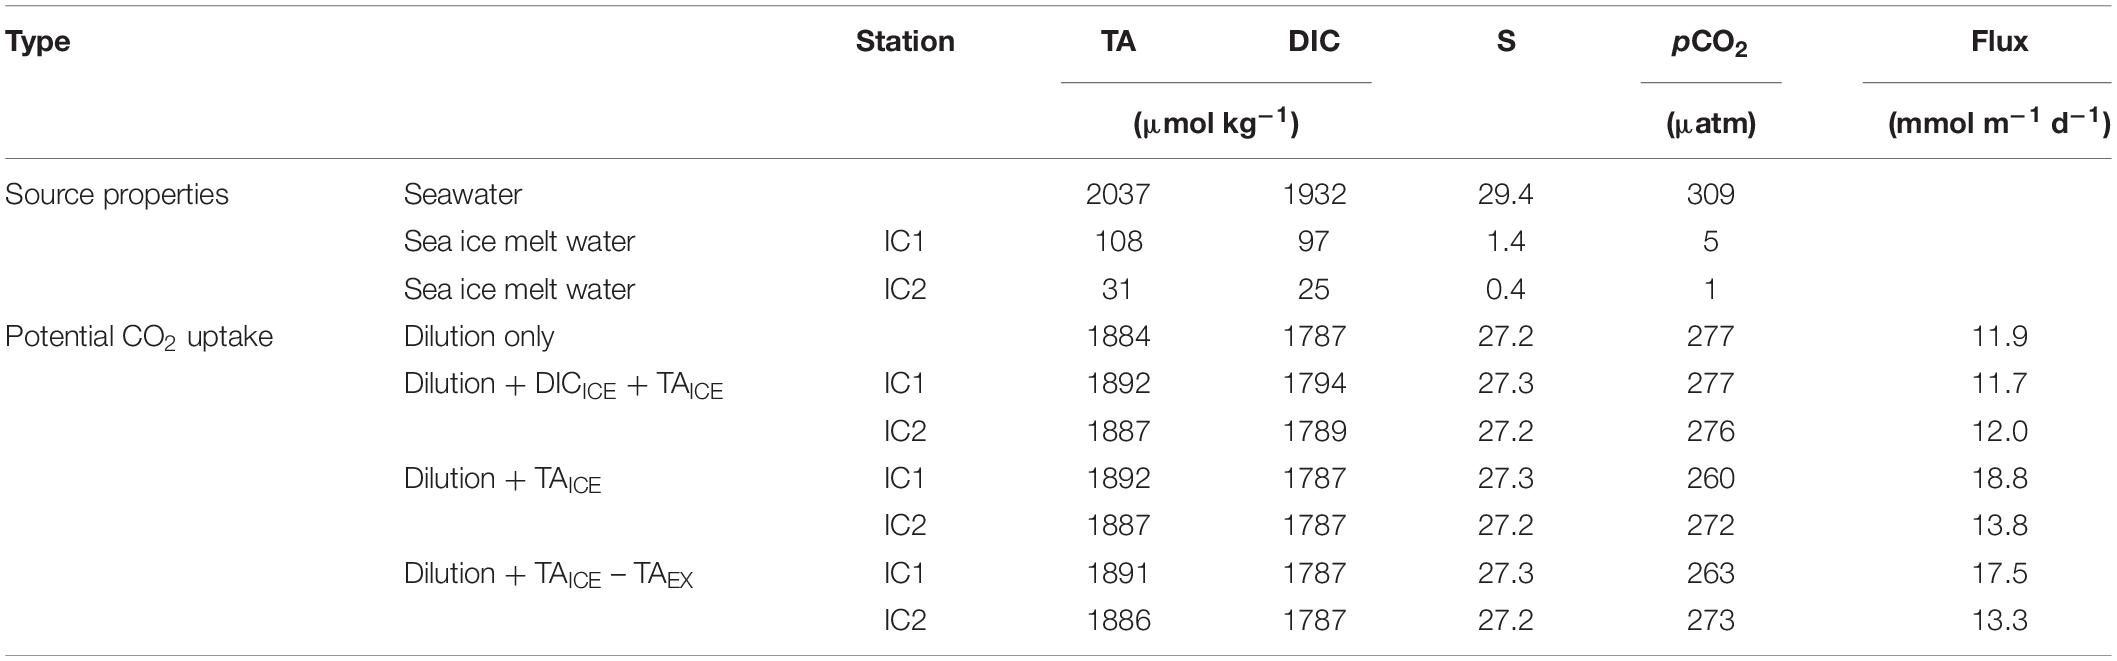
Table 2. Properties of source waters and estimated potential CO2 uptake rate in the mixed layer depth of the ESS.
In the 1st day after the complete melting and mixing in the MLD (20 m), the estimated CO2 uptake from the atmosphere was ∼13 mmol m–2 d–1, increasing pCO2 and DIC concentration in the MLD by ∼1.7 μatm and ∼0.66 μmol kg–1, respectively, at both IC1 and IC2 without a TA change. This approach was repeated every day until the pCO2iSW was recovered, which took approximately 21 days, giving the mean CO2 uptake rate of 11–12 mmol m–2 d–1. However, achieving air-sea equilibrium in this way was impossible because more than 200 days were required, during which sea conditions could significantly vary (Woosley and Millero, 2020). As a result, the total oceanic uptake of CO2 was approximately 246 and 251 mmol m–2 for 21 days in IC1 and IC2 samples, respectively. Our estimate (11–12 mmol m–2 d–1) is broadly consistent with those estimated from other field observations of TA and DIC in the ESS (−0.3 to 10.9 mmol m–2 d–1, where a positive value indicates ocean uptake) (Nitishinsky et al., 2007; Semiletov et al., 2007; Bates and Mathis, 2009), and are also similar to the effect of sea ice melting (CO2 uptake of 2.4–10.6 mmol m–2 d–1) in other areas (Chukchi Sea, Beaufort Sea, and Greenland Sea) of the Arctic Ocean (Figure 1; Cai et al., 2010; Rysgaard et al., 2012, 2013; Else et al., 2013). In the Arctic Ocean the thickness of MLD was temporarily reduced to ∼2 m due to strong stratification by ice melted water (Woosley et al., 2017). If the sea ice (IC1) meltwater is confined to the 2 m of MLD, surface pCO2 could be reduced to 56.9 μatm but equilibrated with atmospheric CO2 in 7 days. Because of rapid rise of pCO2 in the shallower MLD, oceanic CO2 uptake rate (∼4.8 mmol m–2 d–1) over 21 days was lower than our estimate for 20 m of MLD.
The impact of sea ice melting on the oceanic CO2 absorption capacity is affected by the degree of freshening and the amount of TAICE, and TAICE:DICICE ratio. In our study region, the increase in the CO2 uptake was mainly due to the dilution-induced pCO2 decrease (∼30 μatm) by sea ice melting (Table 2 and Supplementary Figure 1). The release of TAICE did not reduce seawater pCO2 due to the effect of DICICE (TAICE:DICICE = ∼1.1), which can offset the pCO2 decrease. The exclusion of TAEX also did not significantly change the mean flux rate and time required to recover the pCO2iSW. Our estimate for increased CO2 uptake rate driven by sea ice melt was not significantly different from that (∼12 mmol m–2 d–1 or 250 mmol m–2 in total) expected from a mixture with pure sea ice meltwater (zero TAICE, DICICE, and SICE). Because our sea ice samples were collected late summer, the CO2 absorption of the partially degraded sea ice may have canceled out the effect of TAEX by reducing TAICE:DICICE ratio. If TAICE and DICICE of IC1 sample are mainly controlled by CaCO3 formation and dissolution without a contribution of air-ice CO2 exchange (TAICE:DICICE = ∼2; Rysgaard et al., 2012), the CO2 uptake from the atmosphere would be ∼19 mmol m–2 d–1. In addition, if applying the summertime TAICE concentration (∼533 μmol kg–1) and TAICE:DICICE ratio (∼2) of Rysgaard et al. (2012) to our study region, the seawater pCO2 could be reduced to ∼241 μatm, thereby increasing CO2 uptake to ∼27 mmol m–2 d–1.
Finally, based on the TAMP and DICMP values determined at the sites, a pCO2 of 234 ± 146 μatm (average ± 1 standard deviation) was expected in the melt pond water with a temperature of ∼0°C. Previous studies suggested the CO2 uptake from the atmosphere to melt pond water ranged from 0.13 to 38.6 mmol m–2 d–1 from spring to summer (Nomura et al., 2010, 2013b; Geilfus et al., 2012, 2015). As the melt ponds appear to be affected by sea ice melting, the absorption of CO2 by the melt pond water should be included when assessing the role of sea ice melting on atmospheric CO2 sequestration. In fact, a study estimated 5–15% contribution of melt ponds to Arctic Ocean CO2 uptake (Geilfus et al., 2015). However, in this study, the data were insufficient to extrapolate, and we note the importance of investigating the role of melt ponds in future studies. Melt ponds in the Canada Bain and the Chuckchi Sea shelf showed the pCO2 ranges of 36–381 and 139–625 μatm, respectively (Bates et al., 2014; Geilfus et al., 2015). The broad pCO2 ranges found in three regions imply a large variation in time and space, and inconsistent sampling timing after melt water formation should be taken into account to properly assess the CO2 absorptions by melt ponds (Geilfus et al., 2015).
Conclusion
We evaluated variations in the total carbon content due to sea ice melting and estimated the corresponding enhancements of the air-to-sea CO2 flux in the East Siberian Sea. Of the two ice camps, IC2 was located at the edge of the sea ice, and thus the loss of sea ice meltwater and brine was greater than at IC1, resulting in a TAICE value four times higher at IC1 (∼108 μmol kg–1) than at IC2 (TAICE = ∼31 μmol kg–1). Moreover, the large positive intercepts in the SICE-TAICE regression could be attributed to ikaite remained in summer sea ice. The enhancements in the CO2 uptake by sea ice melting were mainly due to the dilution (release of meltwater containing a low level of DIC), and the effect of the TAICE release (reducing pCO2) was largely canceled out by DICICE. Our sea ice samples showed relatively low salinity and TAICE compared to those in other regions. The regional difference might be caused by variations in environmental factors affecting sea ice and ikaite formations to some extent. In addition, the difference in methods used to determine sea ice ikaite might prevent a direct comparison among the past studies. The potential air-sea CO2 flux determined in our study (i.e., ESS in summer) was similar to or slightly higher than those reported in other regions (Table 1).
Climate change-induced changes in environmental condition during sea ice formation and degradation may alter physical and chemical properties of sea ice including CaCO3 formation. In addition, current understanding of sea ice carbon parameters is not sufficient to fully address its effects on ocean biogeochemistry despite the previous efforts made a decade ago (Rysgaard et al., 2012; Fischer et al., 2013; Geilfus et al., 2013). Therefore, it appears that continued monitoring studies are required. Nonetheless, to our knowledge, there was no previous sea ice TA data to compare with our results in the East Siberian Sea. Given large spatiotemporal variations in the Atlantic sector of the Arctic Ocean, further studies on this issue should be followed in the Pacific sector using various complementary methods for the determination of sea ice ikaite. It might also be needed to separate the ikaite effect on seawater inorganic chemistry into TAEX and TASAL because the latter can be assessed easily by sea ice salinity. In parallel, to determine factors affecting the large variations in ikaite concentrations, laboratory experiments on ikaite formation and degradation should also be conducted in the conditions representing changing physical and biogeochemical environments in the Arctic Ocean.
Data Availability Statement
The datasets presented in this study can be found in online repositories: (https://kpdc.kopri.re.kr) Korea Polar Data Center Entry ID: KOPRI-KPDC-00001430 and https://dx.doi.org/10.22663/KOPRI-KPDC-00001430.1.
Author Contributions
AM analyzed the data and wrote the original draft. All authors discussed the results and contributed to the writing the manuscript.
Funding
This work was supported by the Polar Academic Program (PE17900) funded by the Korea Polar Research Institute, and the project titled “Korea-Arctic Ocean Warming and Response of Ecosystem (K-AWARE),” the Korea Polar Research Institute (KOPRI) 1525011760, funded by the Ministry of Oceans and Fisheries, South Korea. KL was supported by National Research Foundation of Korea (NRF-2021R1A2C3008748).
Conflict of Interest
The authors declare that the research was conducted in the absence of any commercial or financial relationships that could be construed as a potential conflict of interest.
Publisher’s Note
All claims expressed in this article are solely those of the authors and do not necessarily represent those of their affiliated organizations, or those of the publisher, the editors and the reviewers. Any product that may be evaluated in this article, or claim that may be made by its manufacturer, is not guaranteed or endorsed by the publisher.
Acknowledgments
We thank all researchers and funding agencies. Also, we would like to thank the R/V Araon crews. This work was not possible without their valuable contribution to the collection of samples.
Supplementary Material
The Supplementary Material for this article can be found online at: https://www.frontiersin.org/articles/10.3389/fmars.2022.766810/full#supplementary-material
Footnotes
References
Bates, N. R., and Mathis, J. T. (2009). The Arctic Ocean marine carbon cycle: evaluation of air-sea CO2 exchanges, ocean acidification impacts and potential feedbacks. Biogeosciences 6, 2433–2459. doi: 10.5194/bg-6-2433-2009
Bates, N. R., Garley, R., Frey, K. E., Shake, K. L., and Mathis, J. T. (2014). Sea-ice melt CO2-carbonate chemistry in the western Arctic Ocean: meltwater contributions to air-sea CO2 gas exchange, mixed-layer properties and rates of net community production under sea ice. Biogeosciences 11, 6769–6789. doi: 10.5194/bg-11-6769-2014
Bates, N. R., Moran, S. B., Hansell, D. A., and Mathis, J. T. (2006). An increasing CO2 sink in the Arctic Ocean due to sea-ice loss. Geophys. Res. Lett. 33:L23609. doi: 10.1029/2006GL027028
Bischoff, J. L., Stine, S., Rosenbauer, R. J., Fitzpatrick, J. A., and Stafford, T. W. Jr. (1993). Ikaite precipitation by mixing of shoreline springs and lake water, Mono Lake, California, USA. Geochim. Cosmochim. Acta 57, 3855–3865. doi: 10.1016/0016-7037(93)90339-X
Björkman, M., Kühnel, R., Partridge, D., Roberts, T., Aas, W., Mazzola, M., et al. (2013). Nitrate dry deposition in Svalbard. Tellus B Chem. Phys. Meteorol. 65:19071. doi: 10.3402/tellusb.v65i0.19071
Cai, W. J., Chen, L., Chen, B., Gao, Z., Lee, S. H., Chen, J., et al. (2010). Decrease in the CO2 uptake capacity in an ice-free Arctic Ocean basin. Science 329, 556–559. doi: 10.1126/science.1189338
Cai, W. J., Dai, M., and Wang, Y. (2006). Air-sea exchange of carbon dioxide in ocean margins: a province-based synthesis. Geophys. Res. Lett. 33:L12603. doi: 10.1029/2006GL026219
Chen, B., Cai, W. J., and Chen, L. (2015). The marine carbonate system of the Arctic Ocean: assessment of internal consistency and sampling considerations, summer 2010. Mar. Chem. 176, 174–188. doi: 10.1016/j.marchem.2015.09.007
Chen, C. T. A. (1985). Salinity, alkalinity and calcium of the Weddell Sea ice. Antarct. J. U.S. 17, 102–103.
Chen, C. T. A., and Borges, A. V. (2009). Reconciling opposing views on carbon cycling in the coastal ocean: continental shelves as sinks and near-shore ecosystems as sources of atmospheric CO2. Deep Sea Res. Part II Top. Stud. Oceanogr. 56, 578–590. doi: 10.1016/j.dsr2.2009.01.001
Clayton, T. D., and Byrne, R. H. (1993). Spectrophotometric seawater pH measurements: total hydrogen ion concentration scale calibration of m-cresol purple and at-sea results. Deep Sea Res. Part I Oceanogr. Res. Pap. 40, 2115–2129. doi: 10.1016/0967-0637(93)90048-8
Cooper, L. W., McClelland, J. W., Holmes, R. M., Raymond, P. A., Gibson, J. J., Guay, C. K., et al. (2008). Flow-weighted values of runoff tracers (δ18O, DOC, Ba, alkalinity) from the six largest Arctic rivers. Geophys. Res. Lett. 35:L18606. doi: 10.1029/2008GL035007
Cox, G. F., and Weeks, W. F. (1983). Equations for determining the gas and brine volumes in sea-ice samples. J. Glaciol. 29, 306–316. doi: 10.3189/S0022143000008364
DeGrandpre, M. D., Evans, W., Timmermans, M. L., Krishfield, R., Williams, B., and Steele, M. (2020). Changes in the Arctic Ocean carbon cycle with diminishing ice cover. Geophys. Res. Lett 47:e2020GL088051. doi: 10.1029/2020GL088051
DeGrandpre, M. D., Lai, C. Z., Timmermans, M. L., Krishfield, R. A., Proshutinsky, A., and Torres, D. (2019). Inorganic carbon and pCO2 variability during ice formation in the Beaufort Gyre of the Canada Basin. J. Geophys. Res. Oceans 124, 4017–4028. doi: 10.1029/2019JC015109
Dickson, A. G. (1981). An exact definition of total alkalinity and a procedure for the estimation of alkalinity and total inorganic carbon from titration data. Deep Sea Res. Part I Oceanogr. Res. Pap. 28, 609–623. doi: 10.1016/0198-0149(81)90121-7
Dickson, A. G., and Millero, F. J. (1987). A comparison of the equilibrium constants for the dissociation of carbonic acid in seawater media. Deep Sea Res. Part A Oceanogr. Res. Pap. 34, 1733–1743. doi: 10.1016/0198-0149(87)90021-5
Dieckmann, G. S., Nehrke, G., Papadimitriou, S., Göttlicher, J., Steininger, R., Kennedy, H., et al. (2008). Calcium carbonate as ikaite crystals in Antarctic sea ice. Geophys. Res. Lett. 35:L08501. doi: 10.1029/2008GL033540
Dieckmann, G. S., Nehrke, G., Uhlig, C., Göttlicher, J., Gerland, S., Granskog, M. A., et al. (2010). Ikaite (CaCO3. 6H2O) discovered in Arctic sea ice. Cryosphere 4, 227–230. doi: 10.5194/tc-4-227-2010
Else, B. G., Galley, R. J., Lansard, B., Barber, D. G., Brown, K., Miller, L. A., et al. (2013). Further observations of a decreasing atmospheric CO2 uptake capacity in the Canada Basin (Arctic Ocean) due to sea ice loss. Geophys. Res. Lett. 40, 1132–1137. doi: 10.1002/grl.50268
Fischer, M., Thomas, D. N., Krell, A., Nehrke, G., Göttlicher, J., Norman, L., et al. (2013). Quantification of ikaite in Antarctic sea ice. Antarct. Sci. 25, 421–432. doi: 10.1017/S0954102012001150
Fransson, A., Chierici, M., Miller, L. A., Carnat, G., Shadwick, E., Thomas, H., et al. (2013). Impact of sea-ice processes on the carbonate system and ocean acidification at the ice-water interface of the Amundsen Gulf. Arctic Ocean. J. Geophys. Res. Oceans 118, 7001–7023. doi: 10.1002/2013JC009164
Fransson, A., Chierici, M., Skjelvan, I., Olsen, A., Assmy, P., Peterson, A. K., et al. (2017). Effects of sea-ice and biogeochemical processes and storms on under-ice water fCO2 during the winter-spring transition in the high Arctic Ocean: implications for sea-air CO2 fluxes. J. Geophys. Res. Oceans 122, 5566–5587. doi: 10.1002/2016JC012478
Fransson, A., Chierici, M., Yager, P. L., and Smith, W. O. Jr. (2011). Antarctic sea ice carbon dioxide system and controls. J. Geophys. Res. Oceans. 116:C12. doi: 10.1029/2010JC006844
Garcia, H. E., Boyer, T. P., Baranova, O. K., Locarnini, R. A., Mishonov, A. V., Grodsky, A., et al. (2019). World Ocean Atlas 2018: Product Documentation, ed. A. Mishonov (Washington, DC: NOAA). doi: 10.13140/RG.2.2.34758.01602
Geilfus, N. X., Carnat, G., Dieckmann, G. S., Halden, N., Nehrke, G., Papakyriakou, T., et al. (2013). First estimates of the contribution of CaCO3 precipitation to the release of CO2 to the atmosphere during young sea ice growth. J. Geophys. Res. Oceans 118, 244–255. doi: 10.1029/2012JC007980
Geilfus, N. X., Carnat, G., Papakyriakou, T., Tison, J. L., Else, B., Thomas, H., et al. (2012). Dynamics of pCO2 and related air-ice CO2 fluxes in the Arctic coastal zone (Amundsen Gulf, Beaufort Sea). J. Geophys. Res. Oceans 117:C9. doi: 10.1029/2011JC007118
Geilfus, N. X., Galley, R. J., Crabeck, O., Papakyriakou, T., Landy, J., Tison, J. L., et al. (2015). Inorganic carbon dynamics of melt-pond-covered first-year sea ice in the Canadian Arctic. Biogeosciences 12, 2047–2061. doi: 10.5194/bg-12-2047-2015
Geilfus, N. X., Galley, R. J., Else, B. G., Campbell, K., Papakyriakou, T., Crabeck, O., et al. (2016). Estimates of ikaite export from sea ice to the underlying seawater in a sea ice–seawater mesocosm. Cryosphere 10, 2173–2189. doi: 10.5194/tc-10-2173-2016
Golden, K. M., Eicken, H., Heaton, A. L., Miner, J., Pringle, D. J., and Zhu, J. (2007). Thermal evolution of permeability and microstructure in sea ice. Geophys. Res. Lett. 34:L16501. doi: 10.1029/2007GL030447
Gruber, N., Clement, D., Carter, B. R., Feely, R. A., Van Heuven, S., Hoppema, M., et al. (2019). The oceanic sink for anthropogenic CO2 from 1994 to 2007. Science 363, 1193–1199. doi: 10.1126/science.aau5153
Gruber, N., Gloor, M., Mikaloff Fletcher, S. E., Doney, S. C., Dutkiewicz, S., Follows, M. J., et al. (2009). Oceanic sources, sinks, and transport of atmospheric CO2. Global Biogeochem. Cycles 23:GB1005. doi: 10.1029/2008GB003349
Holmes, R. M., McClelland, J. W., Peterson, B. J., Tank, S. E., Bulygina, E., Eglinton, T. I., et al. (2012). Seasonal and annual fluxes of nutrients and organic matter from large rivers to the Arctic Ocean and surrounding seas. Estuaries Coast 35, 369–382. doi: 10.1007/s12237-011-9386-6
Hu, X. (2020). Effect of organic alkalinity on seawater buffer capacity: a numerical exploration. Aquat. Geochem. 26, 161–178. doi: 10.1007/s10498-020-09375-x
Hu, Y. B., Wang, F., Boone, W., Barber, D., and Rysgaard, S. (2018). Assessment and improvement of the sea ice processing for dissolved inorganic carbon analysis. Limnol. Oceanogr. Methods. 16, 83–91. doi: 10.1002/lom3.10229
Hu, Y. B., Wolf-Gladrow, D. A., Dieckmann, G. S., Völker, C., and Nehrke, G. (2014). A laboratory study of ikaite (CaCO3⋅6H2O) precipitation as a function of pH, salinity, temperature and phosphate concentration. Mar. Chem. 162, 10–18. doi: 10.1016/j.marchem.2014.02.003
Jones, E. P., Coote, A. R., and Levy, E. M. (1983). Effect of sea ice meltwater on the alkalinity of seawater. J. Mar. Res. 41, 43–52. doi: 10.1357/002224083788223063
Jung, J., Son, J. E., Lee, Y. K., Cho, K. H., Lee, Y., Yang, E. J., et al. (2021). Tracing riverine dissolved organic carbon and its transport to the halocline layer in the Chukchi Sea (western Arctic Ocean) using humic-like fluorescence fingerprinting. Sci. Total Environ. 772:145542. doi: 10.1016/j.scitotenv.2021.145542
Kim, H. C., Lee, K., and Choi, W. (2006). Contribution of phytoplankton and bacterial cells to the measured alkalinity of seawater. Limnol. Oceanogr. 51, 331–338. doi: 10.4319/lo.2006.51.1.0331
Ko, Y. H., Lee, K., Eom, K. H., and Han, I. S. (2016). Organic alkalinity produced by phytoplankton and its effect on the computation of ocean carbon parameters. Limnol Oceanogr. 61, 1462–1471. doi: 10.1002/lno.10309
König, D., Miller, L. A., Simpson, K. G., and Vagle, S. (2018). Carbon dynamics during the formation of sea ice at different growth rates. Front. Earth Sci. 6:234. doi: 10.3389/feart.2018.00234
Kotovitch, M., Moreau, S., Zhou, J., Vancoppenolle, M., Dieckmann, G. S., Evers, K. U., et al. (2016). Air-ice carbon pathways inferred from a sea ice tank experiment. Element. Sci. Anth. 4:000112. doi: 10.12952/journal.elementa.000112
Krumpen, T., Belter, H. J., Boetius, A., Damm, E., Haas, C., Hendricks, S., et al. (2019). Arctic warming interrupts the Transpolar Drift and affects long-range transport of sea ice and ice-rafted matter. Sci. Rep. 9:5459. doi: 10.1038/s41598-019-41456-y
Land, P. E., Shutler, J. D., Cowling, R. D., Woolf, D. K., Walker, P., Findlay, H. S., et al. (2013). Climate change impacts on sea–air fluxes of CO2 in three Arctic seas: a sensitivity study using Earth observation. Biogeosciences 10, 8109–8128. doi: 10.5194/bg-10-8109-2013
Lannuzel, D., Tedesco, L., Van Leeuwe, M., Campbell, K., Flores, H., Delille, B., et al. (2020). The future of Arctic sea-ice biogeochemistry and ice-associated ecosystems. Nat. Clim. Chang. 10, 983–992. doi: 10.1038/s41558-020-00940-4
Le Quéré, C., Andrew, R. M., Friedlingstein, P., Sitch, S., Hauck, J., Pongratz, J., et al. (2018). Global carbon budget 2018. Earth Syst. Sci. Data. 10, 2141–2194. doi: 10.5194/essd-10-2141-2018
Lee, K., Kim, T. W., Byrne, R. H., Millero, F. J., Feely, R. A., and Liu, Y. M. (2010). The universal ratio of boron to chlorinity for the North Pacific and North Atlantic oceans. Geochim. Cosmochim. Acta 74, 1801–1811. doi: 10.1016/j.gca.2009.12.027
Lee, K., Sabine, C. L., Tanhua, T., Kim, T. W., Feely, R. A., and Kim, H. C. (2011). Roles of marginal seas in absorbing and storing fossil fuel CO2. Energy Environ. Sci. 4, 1133–1146. doi: 10.1039/C0EE00663G
Lewis, E. R., and Wallace, D. W. R. (1998). Data From: Program Developed for CO2 System Calculations (No. Cdiac: CDIAC-105). Environmental System Science Data Infrastructure for a Virtual Ecosystem. doi: 10.15485/1464255
Lueker, T. J., Dickson, A. G., and Keeling, C. D. (2000). Ocean pCO2 calculated from dissolved inorganic carbon, alkalinity, and equations for K1 and K2: validation based on laboratory measurements of CO2 in gas and seawater at equilibrium. Mar. Chem. 70, 105–119. doi: 10.1016/S0304-4203(00)00022-0
Macdonald, K. M., Sharma, S., Toom, D., Chivulescu, A., Hanna, S., Bertram, A. K., et al. (2017). Observations of atmospheric chemical deposition to high Arctic snow. Atmos. Chem. Phys. 17, 5775–5788. doi: 10.5194/acp-17-5775-2017
Manizza, M., Follows, M. J., Dutkiewicz, S., Menemenlis, D., Hill, C. N., and Key, R. M. (2013). Changes in the Arctic Ocean CO2 sink (1996–2007): a regional model analysis. Global Biogeochem. Cycles 27, 1108–1118. doi: 10.1002/2012GB004491
Maslanik, J., and Stroeve, J. (1999). Data from: Near-Real-Time DMSP SSM/I-SSMIS Daily Polar Gridded sea Ice Concentrations. doi: 10.5067/U8C09DWVX9LM
McElligott, S., Byrne, R. H., Lee, K., Wanninkhof, R., Millero, F. J., and Feely, R. A. (1998). Discrete water column measurements of CO2 fugacity and pHT in seawater: a comparison of direct measurements and thermodynamic calculations. Mar. Chem. 60, 63–73. doi: 10.1016/S0304-4203(97)00080-7
Mehrbach, C., Culberson, C. H., Hawley, J. E., and Pytkowicx, R. M. (1973). Measurement of the apparent dissociation constants of carbonic acid in seawater at atmospheric pressure 1. Limnol. Oceanogr. 18, 897–907. doi: 10.4319/lo.1973.18.6.0897
Meier, W. N., Stroeve, J., and Fetterer, F. (2007). Whither Arctic sea ice? A clear signal of decline regionally, seasonally and extending beyond the satellite record. Ann. Glaciol. 46, 428–434. doi: 10.3189/172756407782871170
Miller, L. A., Papakyriakou, T. N., Collins, R. E., Deming, J. W., Ehn, J. K., Macdonald, R. W., et al. (2011). Carbon dynamics in sea ice: a winter flux time series. J. Geophys. Res. Oceans 116:C2. doi: 10.1029/2009JC006058
Millero, F. J. (1995). Thermodynamics of the carbon dioxide system in the oceans. Geochim. Cosmochim. Acta 59, 661–677. doi: 10.1016/0016-7037(94)00354-O
Millero, F. J., Graham, T. B., Huang, F., Bustos-Serrano, H., and Pierrot, D. (2006). Dissociation constants of carbonic acid in seawater as a function of salinity and temperature. Mar. Chem. 100, 80–94. doi: 10.1016/j.marchem.2005.12.001
Millero, F. J., Zhang, J. Z., Lee, K., and Campbell, D. M. (1993). Titration alkalinity of seawater. Mar. Chem. 44, 153–165. doi: 10.1016/0304-4203(93)90200-8
Moreau, S., Vancoppenolle, M., Bopp, L., Aumont, O., Madec, G., Delille, B., et al. (2016). Assessment of the sea-ice carbon pump: insights from a three-dimensional ocean-sea-ice biogeochemical model (NEMO-LIM-PISCES) Assessment of the sea-ice carbon pump. Element. Sci. Anthrop. 4:000122. doi: 10.12952/journal.elementa.000122
Moreau, S., Vancoppenolle, M., Delille, B., Tison, J. L., Zhou, J., Kotovitch, M., et al. (2015). Drivers of inorganic carbon dynamics in first-year sea ice: a model study. J. Geophys. Res. Oceans 120, 471–495. doi: 10.1002/2014JC010388
Nedashkovsky, A. P., Khvedynich, S. V., and Petrovsky, T. V. (2009). Alkalinity of sea ice in the high-latitudinal arctic according to the surveys performed at north pole drifting station 34 and characterization of the role of the arctic ice in the CO2 exchange. Oceanology 49, 55–63. doi: 10.1134/S000143700901007X
Niederdrenk, A. L., and Notz, D. (2018). Arctic sea ice in a 1.5 °C warmer world. Geophys. Res. Lett. 45, 1963–1971. doi: 10.1002/2017GL076159
Nitishinsky, M., Anderson, L. G., and Hölemann, J. A. (2007). Inorganic carbon and nutrient fluxes on the Arctic Shelf. Cont. Shelf Res. 27, 1584–1599. doi: 10.1016/j.csr.2007.01.019
Nomura, D., Assmy, P., Nehrke, G., Granskog, M. A., Fischer, M., Dieckmann, G. S., et al. (2013a). Characterization of ikaite (CaCO3⋅6HO) crystals in first-year Arctic sea ice north of Svalbard. Ann. Glaciol. 54, 125–131. doi: 10.3189/2013AoG62A034
Nomura, D., Granskog, M. A., Assmy, P., Simizu, D., and Hashida, G. (2013b). Arctic and Antarctic sea ice acts as a sink for atmospheric CO2 during periods of snowmelt and surface flooding. J. Geophys. Res. Oceans. 118, 6511–6524. doi: 10.1002/2013JC009048
Nomura, D., Eicken, H., Gradinger, R., and Shirasawa, K. (2010). Rapid physically driven inversion of the air–sea ice CO2 flux in the seasonal landfast ice off Barrow, Alaska after onset of surface melt. Cont. Shelf Res. 30, 1998–2004.
Obbard, R. W., Lieb-Lappen, R. M., Nordick, K. V., Golden, E. J., Leonard, J. R., Lanzirotti, A., et al. (2016). Synchrotron X-ray fluorescence spectroscopy of salts in natural sea ice. Earth. Space Sci. 3, 463–479. doi: 10.1002/2016EA000172
Olsen, A., Lange, N., Key, R. M., Tanhua, T., Bittig, H. C., Kozyr, A., et al. (2020). An updated version of the global interior ocean biogeochemical data product, GLODAPv2. 2020. Earth Syst. Sci. Data 12, 3653–3678. doi: 10.5194/essd-12-3653-2020
Ouyang, Z., Qi, D., Chen, L., Takahashi, T., Zhong, W., DeGrandpre, M. D., et al. (2020). Sea-ice loss amplifies summertime decadal CO2 increase in the western Arctic Ocean. Nat. Clim. Chang. 10, 678–684. doi: 10.1038/s41558-020-0784-2
Overland, J. E., and Wang, M. (2020). The 2020 Siberian heat wave. Int. J. Climatol. 41, E2341–E2346. doi: 10.1002/joc.6850
Papadimitriou, S., Kennedy, H., Kattner, G., Dieckmann, G. S., and Thomas, D. N. (2004). Experimental evidence for carbonate precipitation and CO2 degassing during sea ice formation. Geochim. Cosmochim. Acta 68, 1749–1761. doi: 10.1016/j.gca.2003.07.004
Papadimitriou, S., Kennedy, H., Kennedy, P., and Thomas, D. N. (2013). Ikaite solubility in seawater-derived brines at 1 atm and sub-zero temperatures to 265 K. Geochim. Cosmochim. Acta 109, 241–253. doi: 10.1016/j.gca.2013.01.044
Papadimitriou, S., Kennedy, H., Kennedy, P., and Thomas, D. N. (2014). Kinetics of ikaite precipitation and dissolution in seawater-derived brines at sub-zero temperatures to 265 K. Geochim. Cosmochim. Acta 140, 199–211. doi: 10.1016/j.gca.2014.05.031
Petrich, C., and Eicken, H. (2017). “Overview of sea ice growth and properties,” in the Sea Ice, ed. D. N. Thomas (Chichester: John Wiley & Sons), 1–41.
Pipko, I. I., Semiletov, I. P., Pugach, S. P., Wåhlström, I., and Anderson, L. G. (2011). Interannual variability of air-sea CO2 fluxes and carbon system in the East Siberian Sea. Biogeosciences 8, 1987–2007. doi: 10.5194/bg-8-1987-2011
Pörtner, H. O., Roberts, D. C., Masson-Delmotte, V., Zhai, P., Poloczanska, E., Mintenbeck, K., et al. (2019). IPCC, 2019: Technical Summary. In IPCC Special Report on the Ocean and Cryosphere in a Changing Climate. Geneva: IPCC.
Purgstaller, B., Dietzel, M., Baldermann, A., and Mavromatis, V. (2017). Control of temperature and aqueous Mg2+/Ca2+ ratio on the (trans-) formation of ikaite. Geochim. Cosmochim. Acta 217, 128–143. doi: 10.1016/j.gca.2017.08.016
Qi, D., Chen, L., Chen, B., Gao, Z., Zhong, W., Feely, R. A., et al. (2017). Increase in acidifying water in the western Arctic Ocean. Nat. Clim. 7, 195–199. doi: 10.1038/nclimate3228
Rysgaard, S., Glud, R. N., Lennert, K., Cooper, M., Halden, N., Leakey, R. J. G., et al. (2012). Ikaite crystals in melting sea ice-implications for pCO2 and pH levels in Arctic surface waters. Cryosphere 6, 901–908. doi: 10.5194/tc-6-901-2012
Rysgaard, S., Glud, R. N., Sejr, M. K., Bendtsen, J., and Christensen, P. B. (2007). Inorganic carbon transport during sea ice growth and decay: a carbon pump in polar seas. J. Geophys. Res. Oceans 112:C3. doi: 10.1029/2006JC003572
Rysgaard, S., Søgaard, D. H., Cooper, M., Pućko, M., Lennert, K., Papakyriakou, T. N., et al. (2013). Ikaite crystal distribution in winter sea ice and implications for CO2 system dynamics. Cryosphere 7, 707–718. doi: 10.5194/tc-7-707-2013
Rysgaard, S., Wang, F., Galley, R. J., Grimm, R., Notz, D., Lemes, M., et al. (2014). Temporal dynamics of ikaite in experimental sea ice. Cryosphere 8, 1469–1478. doi: 10.5194/tc-8-1469-2014
Sabine, C. L., Feely, R. A., Gruber, N., Key, R. M., Lee, K., Bullister, J. L., et al. (2004). The oceanic sink for anthropogenic CO2. Science 305, 367–371. doi: 10.1126/science.1907403
Sánchez-Pastor, N., Oehlerich, M., Astilleros, J. M., Kaliwoda, M., Mayr, C. C., Fernández-Díaz, L., et al. (2016). Crystallization of ikaite and its pseudomorphic transformation into calcite: Raman spectroscopy evidence. Geochim. Cosmochim. Acta 175, 271–281. doi: 10.1016/j.gca.2015.12.006
Scharien, R. K., Geldsetzer, T., Barber, D. G., Yackel, J. J., and Langlois, A. (2010). Physical, dielectric, and C band microwave scattering properties of first-year sea ice during advanced melt. J. Geophys. Res. Oceans 115:C12026. doi: 10.1029/2010JC006257
Schmidtko, S., Johnson, G. C., and Lyman, J. M. (2013). MIMOC: a global monthly isopycnal upper-ocean climatology with mixed layers. J. Geophys. Res. Oceans 118, 1658–1672. doi: 10.1002/jgrc.20122
Sejr, M. K., Krause-Jensen, D., Rysgaard, S., Sørensen, L. L., Christensen, P. B., and Glud, R. N. (2011). Air—sea flux of CO2 in arctic coastal waters influenced by glacial melt water and sea ice. Tellus B Chem. Phys. Meteorol. 63, 815–822. doi: 10.1111/j.1600-0889.2011.00540.x
Semiletov, I. P., Pipko, I. I., Repina, I., and Shakhova, N. E. (2007). Carbonate chemistry dynamics and carbon dioxide fluxes across the atmosphere–ice–water interfaces in the Arctic Ocean: Pacific sector of the Arctic. J. Mar. Syst. 66, 204–226. doi: 10.1016/j.jmarsys.2006.05.012
Stroeve, J. C., Serreze, M. C., Holland, M. M., Kay, J. E., Malanik, J., and Barrett, A. P. (2012). The Arctic’s rapidly shrinking sea ice cover: a research synthesis. Clim. Change 110, 1005–1027. doi: 10.1007/s10584-011-0101-1
Tanhua, T., Jones, E. P., Jeansson, E., Jutterström, S., Smethie, W. M., Wallace, D. W., et al. (2009). Ventilation of the Arctic Ocean: mean ages and inventories of anthropogenic CO2 and CFC-11. J. Geophys. Res. Oceans 114:C1. doi: 10.1029/2008JC004868
Thomas, D. N., Lara, R. J., Eicken, H., Kattner, G., and Skoog, A. (1995). Dissolved organic matter in Arctic multi-year sea ice during winter: major components and relationship to ice characteristics. Polar Biol. 15, 477–483. doi: 10.1007/BF00237461
Tollefsen, E., Stockmann, G., Skelton, A., Mörth, C. M., Dupraz, C., and Sturkell, E. (2018). Chemical controls on ikaite formationel. Mineral. Mag. 82, 1119–1129. doi: 10.1180/mgm.2018.110
Tschudi, M., Meier, W. N., Stewart, J. S., Fowler, C., and Maslanik, J. (2019). Data from: EASE-Grid Sea Ice Age. doi: 10.5067/UTAV7490FEPB
Wang, Z., Li, Z., Zeng, J., Liang, S., Zhang, P., Tang, F., et al. (2020). Spatial and temporal variations of Arctic Sea ice from 2002 to 2017. Earth Space Sci. 7:e2020EA001278. doi: 10.1029/2020EA001278
Wanninkhof, R. (2014). Relationship between wind speed and gas exchange over the ocean revisited. Limnol. Oceanogr. Methods 12, 351–362. doi: 10.4319/lom.2014.12.351
Weiss, R. F. (1974). Carbon dioxide in water and seawater: the solubility of a non-ideal gas. Mar. Chem. 2, 203–215. doi: 10.1016/0304-4203(74)90015-2
Woosley, R. J., and Millero, F. J. (2020). Freshening of the western Arctic negates anthropogenic carbon uptake potential. Limnol. Oceanogr. 65, 1834–1846. doi: 10.1002/lno.11421
Woosley, R. J., Millero, F. J., and Takahashi, T. (2017). Internal consistency of the inorganic carbon system in the Arctic Ocean. Limnol. Oceanogr. Methods 15, 887–896. doi: 10.1002/lom3.10208
Yang, B., Byrne, R. H., and Lindemuth, M. (2015). Contributions of organic alkalinity to total alkalinity in coastal waters: a spectrophotometric approach. Mar. Chem. 176, 199–207. doi: 10.1016/j.marchem.2015.09.008
Keywords: Arctic Ocean, East Siberian Sea, sea ice melting, ikaite, total alkalinity
Citation: Mo A, Yang EJ, Kang S-H, Kim D, Lee K, Ko YH, Kim K and Kim T-W (2022) Impact of Sea Ice Melting on Summer Air-Sea CO2 Exchange in the East Siberian Sea. Front. Mar. Sci. 9:766810. doi: 10.3389/fmars.2022.766810
Received: 30 August 2021; Accepted: 31 January 2022;
Published: 23 February 2022.
Edited by:
Masao Ishii, Meteorological Research Institute (MRI), JapanReviewed by:
Kumiko Azetsu-Scott, Bedford Institute of Oceanography (BIO), CanadaNaohiro Kosugi, Meteorological Research Institute, Japan Meteorological Agency, Japan
Copyright © 2022 Mo, Yang, Kang, Kim, Lee, Ko, Kim and Kim. This is an open-access article distributed under the terms of the Creative Commons Attribution License (CC BY). The use, distribution or reproduction in other forums is permitted, provided the original author(s) and the copyright owner(s) are credited and that the original publication in this journal is cited, in accordance with accepted academic practice. No use, distribution or reproduction is permitted which does not comply with these terms.
*Correspondence: Tae-Wook Kim, a2ltdHdrQGtvcmVhLmFjLmty