 Mimi W. Tzeng
Introduction
Environmental distance is a measure of the similarity in environmental conditions between two geographic locations. The measure is important when considering the chances of survival for a species that has been transported from one location to the other, especially species that are not indigenous to the destination location.
For marine environments, abiotic factors such as water temperature and salinity are the dominant influences that define habitat suitability when considering a variety of different species that are not individually assessed for their biological traits or environmental requirements (Barry et al., 2008). In addition, for benthic marine species, water column depth likely affects the availability of suitable substrates and light conditions for photosynthesis. Environmental distances can be calculated using a generalized linear model from data for annual mean, minimum, and maximum temperature and salinity (Keller et al., 2011), taking into account water column depth. A low environmental distance value between two locations indicates high environmental similarity.
A common way for a marine species to travel to a new, non-adjacent geographic location is by ship, such as attached to the hull as biofouling or by being collected into and later discharged from ballast water tanks upon arrival at the destination (Molnar et al., 2008; Hewitt et al., 2009). Therefore, environmental distances are often calculated between ports, for example as a component of risk assessment for the introduction of non-indigenous marine species (e.g. Keller et al., 2011; Seebens et al., 2013; Xu et al., 2014; Wang et al., 2018; Saebi et al., 2020).
The general convention in marine ecology is to describe study area locations by latitude and longitude, and ports are single point latitude-longitude locations, which makes calculating environmental distances between them relatively straightforward. However, in some cases it may be more useful to compare environmental similarity between larger areas (Floerl et al., 2013), especially for interdisciplinary research questions where data are not necessarily recorded by port. For example, international trade databases, such as the United Nations Comtrade Database (UN Comtrade, 2021), do not identify the specific ports of a nation involved in importing or exporting trade goods, since that information is not important to international trade economists. Nations have a range of sizes and shapes and lengths of coastlines, making it difficult to measure environmental distances between them compared to single point locations.
The Marine Ecoregions Of the World (MEOW) biogeographic classification system divides the coastal, nearshore, and shelf areas of the world into a nested hierarchy of 232 ecoregions, 62 ecoprovinces, and 12 ecorealms (Spalding et al., 2007). Each ecoregion is ecologically distinct from the others, encompassing an area of a size typical to the geographic range of the life histories and ecological processes of marine species with a sedentary adult phase. Similarly, each ecoprovince is of a scale for more mobile or dispersive species. Ecorealms are large, broad areas of distinct biota at higher taxonomic classification levels. Detailed global maps of the MEOW system are available in Spalding et al. (2007).
Environmental distances were calculated between each pair of MEOW ecoregions and ecoprovinces. The primary purpose was to enable measurement of environmental distances between nations as part of a research project that uses both ecological and economic data. However, the availability of such pairwise environmental distance estimates has the potential to facilitate fundamental and applied research in many areas of marine ecology, conservation, and biosecurity, especially when combined with knowledge of the distribution and physiological requirements of potentially invasive non-indigenous marine species.
Methods
Temperature (Locarnini et al., 2019) and salinity (Zweng et al., 2019) data were obtained from World Ocean Atlas (WOA, Boyer et al., 2018) as monthly statistical means for the period 2005–2017, at quarter-degree latitude-longitude resolution and 5 to 50 m depth intervals from the surface down to 1,500 m. The MEOW polygons were obtained as a GIS shapefile from Data Basin, a science-based mapping and analysis tool developed by the Conservation Biology Institute (Corvallis, Oregon). Data were adapted from Spalding et al. (2007) by The Nature Conservancy (2016).
Temperature and salinity data from WOA were selected from within MEOW ecoregions and ecoprovinces using an overlay analysis (Intersect tool, ArcMap version 10.6) that joined the WOA data to the MEOW polygons, with MEOW identifier codes assigned to each intersecting point. The resulting post-join data are available as part of the final dataset (https://doi.org/10.17608/k6.auckland.15184092).
Within each ecoregion or ecoprovince, data were averaged at three depth intervals: surface (0-20 m), shallow (25-200 m), and deep (205-1500 m). Data were averaged for each month separately (Figure 1A). Minimum, maximum, and mean annual values were then calculated among the months for each depth interval within each ecoregion or ecoprovince (Figure 1B), resulting in nine variables each for temperature and salinity (Figure 1C). A generalized linear model was applied to calculate environmental distance between each pair of ecoregions or ecoprovinces based on the 18 variables (Figure 1D). All calculations were performed in the R statistical computing environment (R Project, 2021), and the R script is available as part of the final dataset (https://doi.org/10.17608/k6.auckland.15184107).
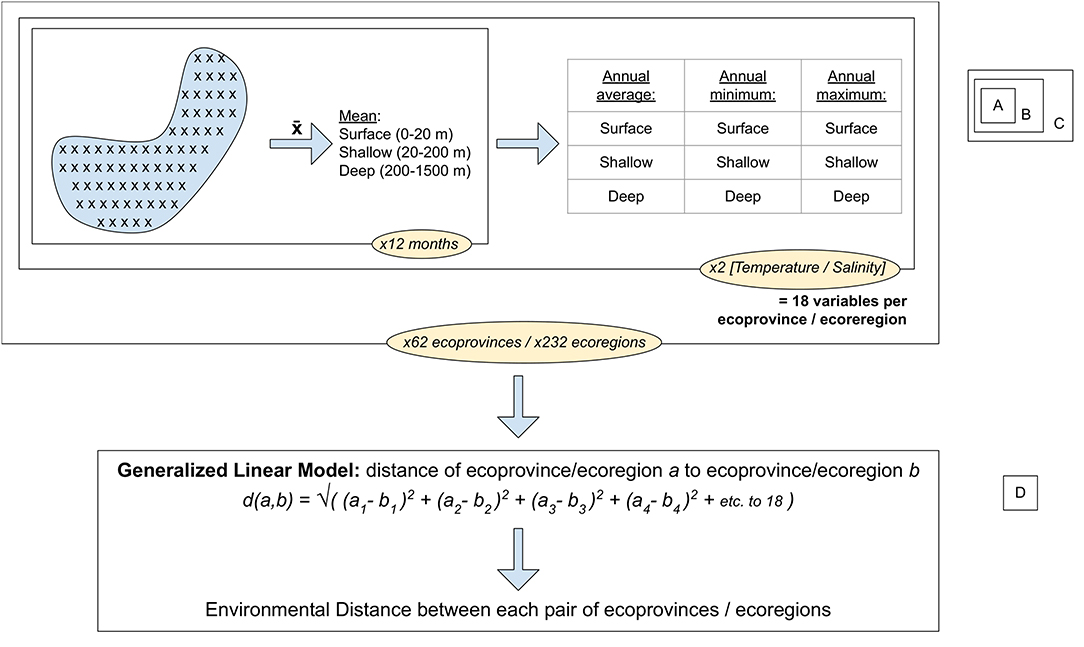
Figure 1. A diagram of the computational workflow to calculate environmental distance values between each pair of ecoregions or ecoprovinces. (A) Monthly data were selected from within each polygon and averaged for three depth intervals. (B) Minimum, maximum, and mean annual values were calculated from the monthly averaged data, resulting in nine variables each for temperature and salinity, and a total of 18 variables. (C) Calculations were carried out for each ecoregion and ecoprovince. (D) A generalized linear model was applied to calculate environmental distance between each pair of ecoregions or ecoprovinces.
The MEOW classification system mainly accounts for coastal waters up to the shelf break which is approximately 200 m in most areas of the world, and very little data for depths over 200 m have likely been included. However, any available deep data within the bounding polygons were included in an attempt to be comprehensive.
Environmental distances among ecoprovinces were showcased by creating heat maps for Ecoprovinces 1, 2, 12, and 43 (Figure 2). Data were joined to the MEOW polygons to produce the maps using QGIS 3.22.
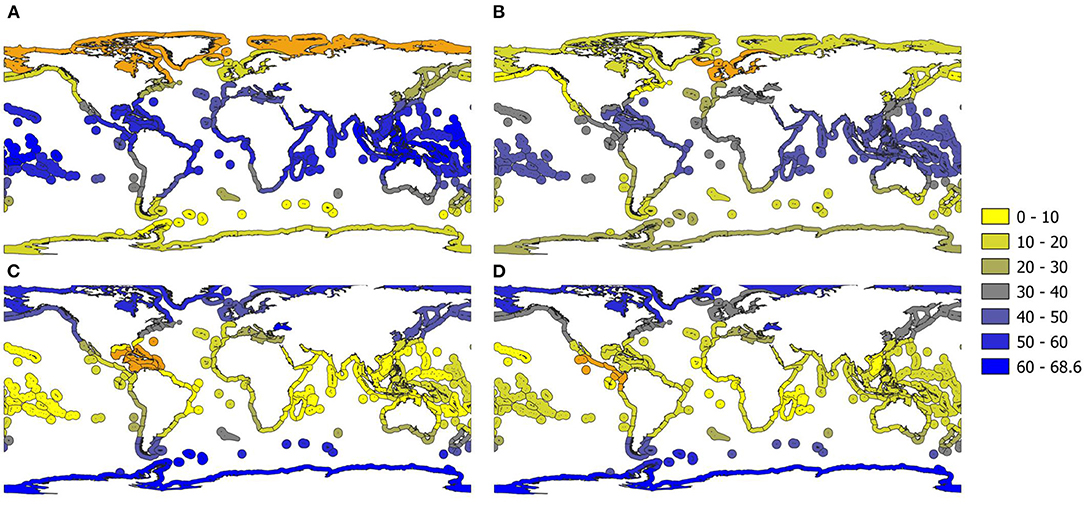
Figure 2. Heat maps showing environmental distance relative to (A) The Arctic (Ecoprovince 1), (B) The Northern European Seas (Ecoprovince 2), (C) The Caribbean (Ecoprovince 12), and (D) The Tropical East Pacific (Ecoprovince 43), ranging from yellow (low distance) to blue (high distance), with the origin ecoprovince highlighted in orange.
Dataset Characteristics
The final dataset consists of two matrices, one for 232 ecoregions and one for 62 ecoprovinces (https://doi.org/10.17608/k6.auckland.15184095). For each matrix, the ecoregions or ecoprovinces are listed in the same order in both rows and columns. Environmental distance values between each pair of ecoregions or ecoprovinces can be found at the intersection of row and column for each pairwise combination.
Environmental distance values have no intrinsic value in and of themselves, but are mainly a comparative measure to other values in the matrix. They range from 0 to 109.69 among ecoregions, and 0 to 73.02 among ecoprovinces, where 0 is the distance of an ecoregion or ecoprovince from itself. For some ecoregions, no temperature and/or salinity data were available in the World Ocean Atlas and it was not possible to generate environmental distances. Data gaps in the ecoregions matrix are indicated with NA (12% of the dataset).
As might be expected, ecoregions and ecoprovinces at similar latitudes tend to be least environmentally distant, most likely due to similarity in temperature. For example, the Arctic (Ecoprovince 1) is least environmentally distant from the Magellanic, Subantarctic Islands, Scotia Sea, and Continental High Antarctic (Ecoprovinces 48, 59, 60, 61) with values ranging from 3.38 to 10.67, and most distant from areas along the equator such as the Eastern and Western Coral Triangle and Central Polynesia (Ecoprovinces 30, 31, 39), with values ranging from 61.50 to 63.27 (Figure 2A). The Northern European Seas (Ecoprovince 2) shows a similar pattern (Figure 2B). Both are environmentally more similar to the Subantarctic Islands than to coastal Antarctica.
Along the same latitude, salinity differences may play a larger role than temperature, since geographically nearby ecoprovinces are not necessarily the most similar to each other. For example, looking at either side of Central America, the Caribbean (Ecoprovince 12) is least distant from Somali/Arabian (Ecoprovince 19) with a value of 2.56, while the Tropical East Pacific (Ecoprovince 43) is least distant from the Gulf of Guinea (Ecoprovince 17) with a value of 3.33 (Figures 2C,D). Indeed the Caribbean is more distant from the Gulf of Guinea (value of 12.75) than the Tropical East Pacific is, even though they are on opposite sides of the Atlantic, and also more distant from the Tropical East Pacific (13.77), which is geographically just on the other side of an isthmus, than it is from the Gulf of Guinea.
Data Availability Statement
The dataset is available as a University of Auckland Figshare collection (doi: 10.17608/k6.auckland.c.5564757). In addition to the final matrices (ENVDIST_final-data.zip, doi: 10.17608/k6.auckland.15184095), the collection includes the monthly temperature and salinity data files with MEOW identifier codes (ENVDIST_interim-data.zip, doi: 10.17608/k6.auckland.15184092), the R script used to calculate the environmental distances (ENVDIST_software.zip, doi: 10.17608/k6.auckland.15184107), and the files related to creating the heat maps in Figure 2 (ENVDIST_heatmaps.zip, doi: 10.17608/k6.auckland.17304008). Following best practices described by the Geoscience Papers of the Future initiative (Gil et al., 2016a), the interim, final, and heat map data are accompanied by ISO 19139 metadata (ISO, 2019), the R script is accompanied by OntoSoft metadata (Gil et al., 2016b), and the workflow is described in a ReadMe text file (ENVDIST_README, doi: 10.17608/k6.auckland.15263556).
Author Contributions
MT created the dataset, prepared the dataset for publication, created both figures, and wrote and submitted the article.
Funding
The University of Auckland and the Cawthron Institute provided general support.
Conflict of Interest
The author declares that the research was conducted in the absence of any commercial or financial relationships that could be construed as a potential conflict of interest.
Publisher's Note
All claims expressed in this article are solely those of the authors and do not necessarily represent those of their affiliated organizations, or those of the publisher, the editors and the reviewers. Any product that may be evaluated in this article, or claim that may be made by its manufacturer, is not guaranteed or endorsed by the publisher.
Acknowledgments
I thank Lisa Floerl for her work on the overlay analysis. Moritz Lehmann and Andrew Jeffs provided feedback on early versions of the manuscript. This dataset was generated at the Cawthron Institute as part of a PhD research project at the University of Auckland.
References
Barry, S. C., Hayes, K. R., Hewitt, C. L., Behrens, H. L., Dragsund, E., and Bakke, S. M. (2008). Ballast water risk assessment: principles, processes, and methods. ICES J. Marine Sci. 65, 121–131. doi: 10.1093/icesjms/fsn004
Boyer, T.P., Garcia, H.E., Locarnini, R.A., Zweng, M.M., Mishonov, A.V., Reagan, J.R., et al. (2018). Data from: World Ocean Atlas 2018. Monthly quarter-degree temperature and salinity statistical means for 2005-2017 (A5B7). NOAA National Centers for Environmental Information. Available online at: https://accession.nodc.noaa.gov/NCEI-WOA18. (accessed May 29, 2020).
Floerl, O., Rickard, G., Inglis, G., and Roulston, H. (2013). Predicted effects of climate change on potential sources of non-indigenous marine species. Diversity Distribut. 19, 257–267. doi: 10.1111/ddi.12048
Gil, Y., David, C. H., Demir, I., Essawy, B. T., Fulweiler, R. W., Goodall, J. L., et al. (2016a). Toward the geoscience paper of the future: best practices for documenting and sharing research from data to software to provenance. Earth Space Sci. 3, 388–415. doi: 10.1002/2015EA000136
Gil, Y., Garijo, D., Mishra, S., and Ratnakar, V. (2016b). OntoSoft: a distributed semantic registry for scientific software. 2016 IEEE 12th Int. Conferen. e-Sci. 16, 331–336. doi: 10.1109/eScience.2016.7870916
Hewitt, C. L., Gollasch, S., and Minchin, D. (2009). “The vessel as a vector - biofouling, ballast water and sediments,” in Vol. 204: Biological Invasions in Marine Ecosystems, eds. G. Rilov and J.A. Crooks (Berlin Heidelberg: Springer-Verlag), 117-129.
ISO (2019). ISO 19139-1:2019 Geographic information - XML schema implementation - Part 1: Encoding rules. International Organization for Standardization.
Keller, R., Drake, J., Drew, M., and Lodge, D. (2011). Linking environmental conditions and ship movements to estimate invasive species transport across the global shipping network. Diversity Distribut. 17, 93–102. doi: 10.1111/j.1472-4642.2010.00696.x
Locarnini, R. A., Mishonov, A. V., Baranova, O. K., Boyer, T. P., Zweng, M. M., Garcia, H. E., et al. (2019). World Ocean Atlas 2018 Volume 1: Temperature, ed. A. Mishonov. NOAA Atlas NESDIS 81, 52pp.
Molnar, J. L., Gamboa, R. L., Revenga, C., and Spalding, M. D. (2008). Assessing the global threat of invasive species to marine biodiversity. Front. Ecol. Environ. 6, 485–492. doi: 10.1890/070064
R Project (2021). R: A Language and Environment for Statistical Computing and Graphics. Available online at: http://www.R-project.org. (accessed June 30, 2021).
Saebi, M., Xu, J., Grey, E. K., Lodge, D. M., Corbett, J. J., and Chawla, N. (2020). Higher-order patterns of aquatic species spread through the global shipping network. PLoS ONE 15, e0220353. doi: 10.1371/journal.pone.0220353
Seebens, H., Gastner, M., and Blasius, B. (2013). The risk of marine bioinvasion caused by global shipping. Ecol. Lett. 16, 782–787. doi: 10.1111/ele.12111
Spalding, M. D., Fox, H. E., Allen, G. R., Davidson, N., Ferdaña, Z. A., Finlayson, M., et al. (2007). Marine ecoregions of the world: a bioregionalization of coast and shelf areas. BioScience 57, 573–583. doi: 10.1641/B570707
The Nature Conservancy (2016). Dataset: Marine Ecoregions of the World. Data Basin, Conservation Biology Institute. Available online at: https://databasin.org/datasets/3b6b12e7bcca419990c9081c0af254a2/.;https://databasin.org/maps/new/#datasets=3b6b12e7bcca419990c9081c0af254a2. (accessed June 29, 2021).
UN Comtrade (2021). UN Comtrade Database: a repository of official international trade statistics and relevant analytical tables. United Nations. Available online at: https://comtrade.un.org/ (accessed June23, 2021).
Wang, S., Wang, C., Wang, S., and Ma, L. (2018). Big data analysis for evaluating bioinvasion risk. BMC Bioinform. 19, 151–159. doi: 10.1186/s12859-018-2272-5
Xu, J., Wickramarathne, T. L., Chawla, N. V., Grey, E. K., Steinhaeuser, K., Keller, R. P., et al. (2014). “Improving management of aquatic invasions by integrating shipping network, ecological, and environmental data: data mining for social good,” in Proceedings of the ACM SIGKDD International Conference on Knowledge Discovery and Data Mining, pp. 1699–1708.
Keywords: environmental similarity, marine invasive species, marine non-indigenous species (NIS), marine biodiversity, geoscience papers of the future (GPF)
Citation: Tzeng MW (2022) Environmental Distances Between Marine Ecosystems of the World (MEOW) Ecoregions and Ecoprovinces. Front. Mar. Sci. 9:764771. doi: 10.3389/fmars.2022.764771
Received: 26 August 2021; Accepted: 03 February 2022;
Published: 09 March 2022.
Edited by:
Cosimo Solidoro, Istituto Nazionale di Oceanografia e di Geofisica Sperimentale, ItalyReviewed by:
José Lino Vieira De Oliveira Costa, University of Lisbon, PortugalJi-Zhong Wan, Qinghai University, China
Copyright © 2022 Tzeng. This is an open-access article distributed under the terms of the Creative Commons Attribution License (CC BY). The use, distribution or reproduction in other forums is permitted, provided the original author(s) and the copyright owner(s) are credited and that the original publication in this journal is cited, in accordance with accepted academic practice. No use, distribution or reproduction is permitted which does not comply with these terms.
*Correspondence: Mimi W. Tzeng, bXR6ZTI4NUBhdWNrbGFuZHVuaS5hYy5ueg==; orcid.org/0000-0001-9396-3217