 Laurence T. Kell
 Rishi Sharma
 Henning Winker3
- 1Centre for Environmental Policy, Imperial College London, London, United Kingdom
- 2Fisheries and Aquaculture Division, Food and Agriculture Organization of the United Nations, Rome, Italy
- 3Joint Research Centre (JRC), European Commission, Ispra, Italy
In data and capacity limited situations, catch-only models are increasingly being used to provide summaries of the state of regional and global fisheries. Due to the lack of information on stock trends, heuristics are required for initial and final depletion priors. The lack of data for calibration means that results are sensitive to the choice of heuristics. We, therefore, evaluate the value of obtaining additional information for classifying stock status. We found that heuristics alone performed nearly as well as the catch-only model. This highlights that catch-only models cannot be used as part of management control, where data updates are used to monitor the effectiveness of interventions. To implement management for data-poor stocks, additional data and knowledge are therefore required. The value of obtaining additional information for reducing risk due to loss of yield through adopting a risk equivalence approach should be evaluated. This will help identify the value-of-information and prioritise the development of scientific management frameworks that protect marine ecosystems and the well-being of people who have a stake in the resources at regional and local levels.
1 Introduction
Fisheries are important economically and socially, but are also a source of conflict since stocks can straddle Exclusive Economic Zones and be conducted in areas beyond national jurisdiction (Palacios-Abrantes et al., 2020). They may also impact endangered, threatened and protected species or vulnerable marine ecosystems (Brown and Hermes, 2019). Therefore, strategic planning and the implementation of Ecosystem-Based Fisheries Management requires assessments of fish stocks on both regional and global scales (Hilborn et al., 2020).
There is an increasing expectation for decision makers to use robust scientific advice on the status of exploited fish stocks (Smith et al., 2009). For example, the International Council for the Exploration of the Sea (ICES) classifies stocks depending on the quality and type of data, ranging from full analytical assessments to those where catch or landings only are available (see Fischer et al., 2020). Therefore, many data-limited approaches have been developed where data and resources are limited (e.g. Dowling et al., 2015b; Wetzel and Punt, 2015; Rosenberg et al., 2018).
A problem when assessing fish stocks is that they can rarely be observed directly, so estimates of status rely on models and a range of fishery-dependent and independent datasets. Many small-scale fisheries, however, lack the datasets required to conduct traditional stock assessments. These are commonly known as data-poor, or data or capacity limited fisheries (e.g. Dowling et al., 2015a). For example, although the Food and Agriculture Organization (FAO) of the United Nations’ landings database includes over 20,000 individual catch histories by FAO region, country, and taxon, the RAM Legacy Stock Assessment Database (www.ramlegacy.org), which includes most of the publicly available stock assessments contains only 1,200 assessments (Ovando et al., 2021a).
Various approaches, based on catch-only or length data, have been developed to assess stocks in such situations (e.g. Pons et al., 2018). For example, catch-only models can be used to make general statements about global and regional stock status (Worm et al., 2006), identify stocks of most concern as part of a risk assessment, or provide advice on a stock-specific basis (Bouch et al., 2020). Catch-only models reconstruct historical abundance relative to reference points by making assumptions about productivity and final biomass relative to the unfished state (e.g. Thorson et al., 2012; Froese et al., 2017; Zhou et al., 2018). Simulation has shown, however, that catch-only models are highly sensitive to the choice of priors about such known unknowns (Wetzel and Punt, 2015).
There is a need, therefore, for the validation of catch-only models, particularly as there are potentially many stakeholders with conflicting objectives and divergent views, which may mean that uncertainties are used to support polarised positions (Fromentin et al., 2014). Validation is required to ensure that a model can explain the data and that predictions made for the consequences of management actions, and should be done using observations (Kell et al., 2021). However, this is difficult for catch-only models, where the only observations are catch, and so techniques such as cross-validation cannot be used.
A key step is to identify what information, data and knowledge, are required to permit current catch-only methods to classify stock status relative to overfishing. We, therefore, evaluate the robustness of the assumptions used in catch-only models and the benefit of obtaining better priors and additional information, such as an unbiased estimate of abundance. To achieve this, we use the Bayesian biomass dynamic state-space model JABBA (Winker et al., 2018), which can be configured either as a data-poor or data-moderate assessment. This allows stock status to be estimated relative to maximum sustainable yield (MSY) reference points for catch-only models and compared to data-moderate methods that use an index of abundance. To achieve this, we used a reference set of data-rich assessments obtained from the RAM legacy database1.
2 Material and Methods
Formal model validation requires estimates to be compared to known values (i.e. observations) or well estimated historical values (Kell et al., 2021). However, the only observations used in catch-only models are the catches themselves, and if these observations are removed, then the models cannot be run. There are, therefore, two ways to validate catch-only models, either to use simulation (e.g. Rosenberg et al., 2014a), or to compare with data-rich assessments (Sharma et al., 2021). We chose the latter approach, as this also allows us to better identify the value of obtaining better information, and requires fewer assumptions to be made than in a synthetic simulation study. To accomplish this, a reference set of data-rich stocks were extracted from the RAM database. The database collates stock assessment time series from various regions, species, and fisheries. It, therefore, allows evaluation across a range of fishery types and regions of the benefits of obtaining indices of relative abundance, and improved information on initial and final relative biomass, growth rate (r), and the shape of the production function.
To estimate the skill of alternative models to classifying stock status relative to MSY reference points, we use Receiver Operating Characteristic (ROC Green et al., 1966) curves.
2.1 Material
The RAM Legacy database contains stock datasets and estimates derived from a variety of assessment models. Assessments may be based on integrated statistical models using length and age data which estimate reference points as part of the fitting process, virtual population analysis where reference points are estimated in post-processing or biomass dynamic models where assumptions related to density dependence (i.e. growth, mortality and recruitment) are modelled by a production function the maximum of which provides the MSY reference points. We selected those assessment datasets that provide estimates of biomass, spawning stock biomass (SSB) or exploitable biomass, and instantaneous fishing mortality or harvest rate relative to MSY reference points. This allowed the extraction of dimensionless trends in F/FMSY, B/BMSY, and Catch/MSY for a total of 85 stock assessments.
Stock trends, relative to MSY benchmarks, are summarised in Figure 1. Catches (Figure 1A) gradually increased, peaking around 1990 after which they showed a slight decline. Fishing mortality (Figure 1B) also increased, but the initial increase was more gradual until 1980. Fishing mortality, like catch, also peaked in 1990 and has stayed around FMSY subsequently. This behaviour is probably due to the adoption of management frameworks based on target and limit reference points by many bodies to implement a Precautionary Approach (PA, Garcia, 1996). Biomass (Figure 1C) declined from the start of the series in the 1950s until 2000, after which the stocks stabilised. A noticeable feature is that some stock shows high inter-annual variability, while others show smooth trends. Currently, catches are mostly below MSY, and yields follow the general trends in biomass and fishing mortality. Fishing mortality is the most variable of the three quantities, reflecting that management is generally based on catch and biomass is influenced by environmental variability. In summary, stocks were lightly exploited in the 1950s, exploitation then increased until the adoption of the precautionary approach, after which exploitation stopped increasing but was still highly variable, and large variations are seen by stock.
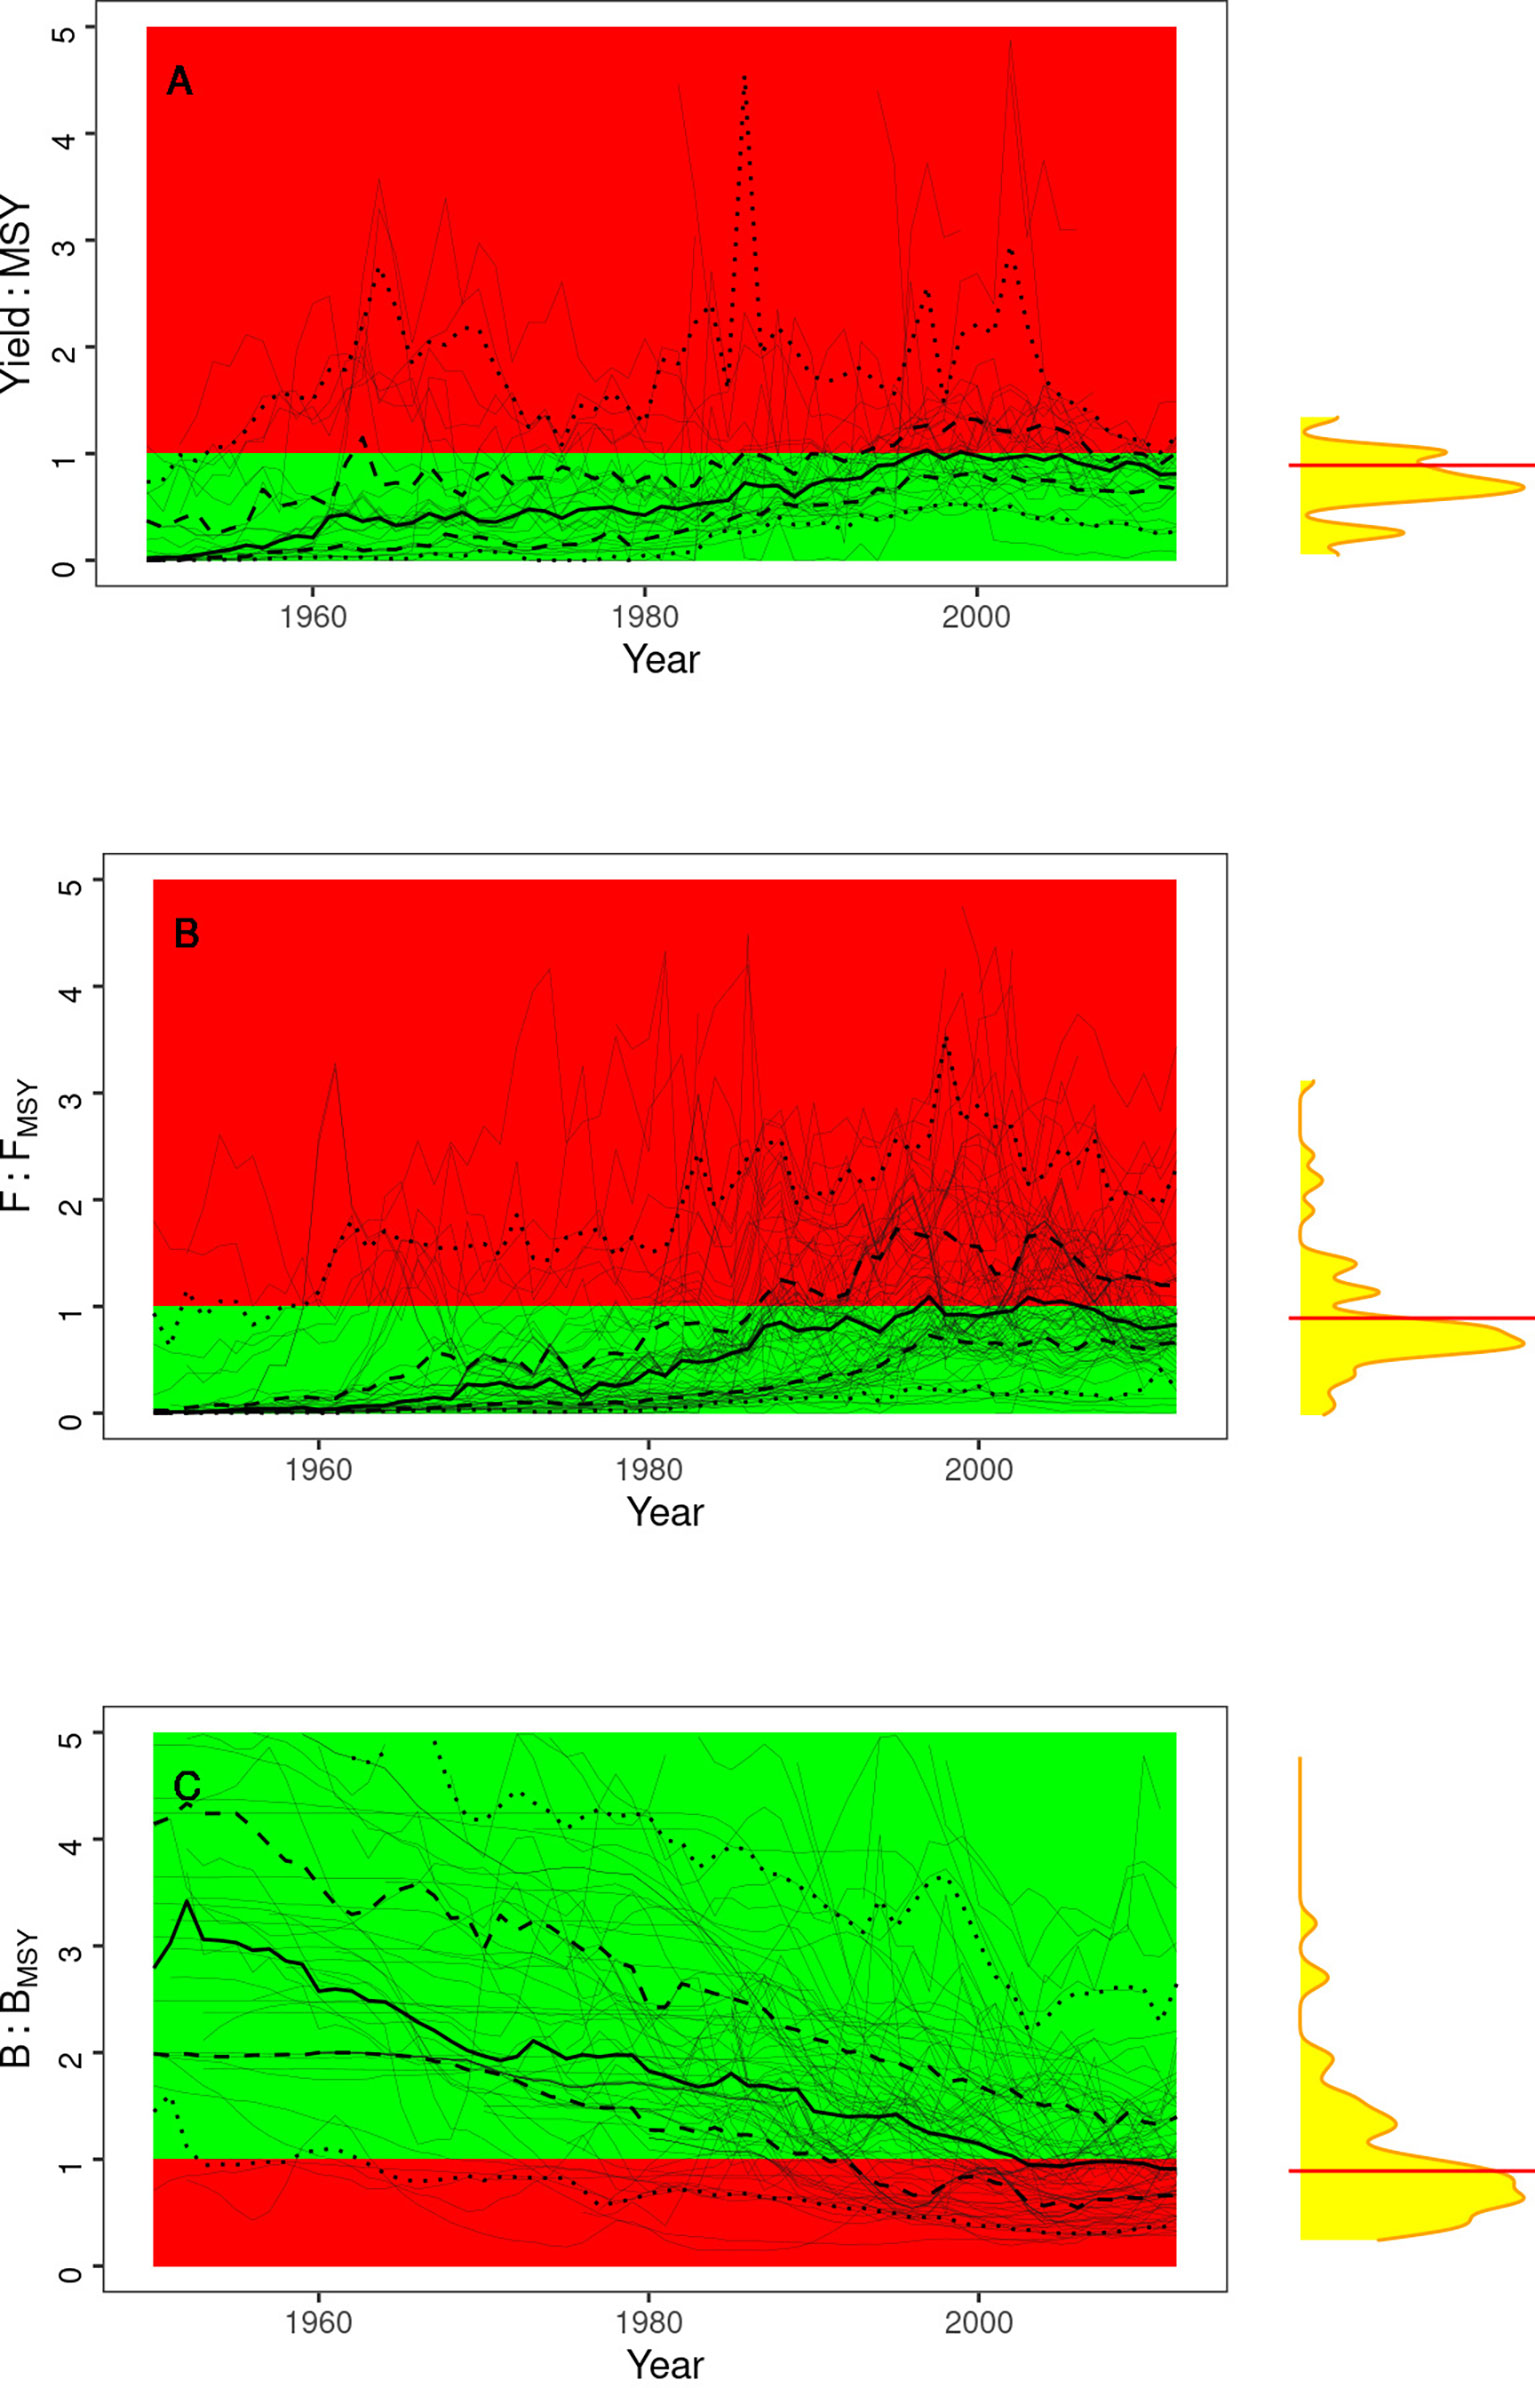
Figure 1 Time series relative to MSY benchmarks for the RAM Legacy database assessments; the faint lines represent individual stocks, the thick line the median trend, the thick dashed lines the interquartile range, and the thin dashed lines the 90 th percentiles. States relative to the MSY benchmarks in the nal year are shown as marginal densities; for (A) Yield/MSY (B) F/FMSY (C) SSB/BMSY .
2.2 Methods
2.2.1 Assessment Methods
A variety of catch-only methods have been developed to assess data-limited fisheries, these include Catch-MSY, (Martell and Froese, 2013), CMSY (Froese et al., 2017), catch-only model (Zhou et al., 2018), and stock reduction analysis (Dick and MacCall, 2011). The methods are all mainly variations on a theme, as they are based on a surpus production function, and developers have implemented heuristics to provide values for parameters for which there is insufficient information in the data to estimate. These heuristics are based on meta-analysis, and their appropriateness depend on the management frameworks used to manage the stocks. There has therefore been a growing interest in comparing performance across catch-only methods (Rosenberg et al., 2014a; Free et al., 2020). Model comparisons are typically performed using default settings and the inbuilt heuristics, e.g. to derive relative biomass priors specific to each software. However, there has been less attention paid to the value-of-information, i.e. evaluating the benefits of actually obtaining data for informing priors for productivity (r) and relative initial and terminal biomass levels.
We used the JABBA biomass dynamic model (Winker et al., 2018) as this provides a unifying, flexible framework based on a production function that can be used to estimate stock status and reference points under various prior assumptions and data scenarios. JABBA is predominantly used to conduct data-moderate stock assessment by fitting catch and one or multiple relative abundances or catch-per-unit-effort indices with priors for population growth rate (r), initial depletion (K), the shape parameter (m) of the production function and associated variance parameters for process and measurement error. At the data-poor end of the stock assessment spectrum, JABBA can be set up to approximate the behaviour of CMSY (Froese et al., 2017), sampling from prior distributions to obtain parameter values that given a catch history that does not crash the population and satisfy priors for initial and final depletion. This allows the value of improving information in the form of both data (e.g., obtaining abundance trends) and priors to be evaluated within the same, flexible framework.
A generalized production function (Pella and Tomlinson, 1969) was assumed, which allows the shape, the ratio between the biomass at MSY (BMSY) and virgin biomass (K), to be varied to represent alternative assumptions about productivity and reference points. Scenarios considered were for population growth rate (r) and the shape of the production function (m). The shape m is determined by the assumed form of density dependence. Which in aged-based assessments is mainly determined by the form of the stock recruitment relationship and steepness (h), defined as the fraction of recruitment from an unfished population obtained when the spawning stock biomass is 20% of its unfished level, and depends on the maximum per capita productivity, natural mortality and schedules of size and maturity at age (Mangel et al., 2010).
The shape of the production function was assumed to be either logistic (Schaefer, m=2) or Gompertz (Fox, m=1.001). In the latter case, production is maintained at lower stock sizes, as MSY is found at BMSY/K = 0.37 compared to at BMSY/K = 0.5 for the former.
The population growth rate at low stock size r and shape m can be derived from life-history parameters such as natural mortality (M) and the stock-recruitment relationship (Winker et al., 2020). However, these parameters are difficult to estimate (e.g. Lee et al., 2011; Jiao et al., 2012; Lee et al., 2012; Simon et al., 2012), and so in many data-rich assessments are either fixed, or uncertainty grids are used where M and h are varied independently. However, h and M are related as h describes density-dependent mortality of recruits (Simon et al., 2012). Therefore, two scenarios based on low and high M and h were employed to develop the r prior (see Supplementary Material).
The choice of the final biomass depletion prior has been shown to be particularly influential on the performance of catch-only models (Rosenberg et al., 2014b; Sharma et al., 2021). Rosenberg et al. (2014b) found that the generic heuristics for the initial, intermediate and final depletion priors as described in Froese et al. (2017) performed the best of the approaches tested. These are based on simple rules derived from patterns in the catch (Froese and Kesner-Reyes, 2002). Lacking expert priors, the catch heuristic of Froese et al. (2017) was used to assign ranges for initial and final biomass depletion.
To reduce the influence of extreme values, a 3-years simple moving average (SMA) was applied to the catch data. If the data-points are p1,p2,…,pn, then the mean over the last k data-points is calculated as:
The final year’s catch is then divided by the maximum catch Cmax and the ratio used to set the final depletion based on the following catch heuristic:
Log-normal priors were formulated based on the mean of the assigned depletion range and assuming a CV of 0.3.
Scenarios were set up to evaluate the impact of the priors and assumption on the ability to estimate depletion in the final year (Table 1). As a benchmark, against which the catch-only models can be compared, a biomass dynamic assessment was conducted with an unbiased index, based on the biomass predicted by data-rich stock assessments in the RAM legacy database for the recent half of the time series.
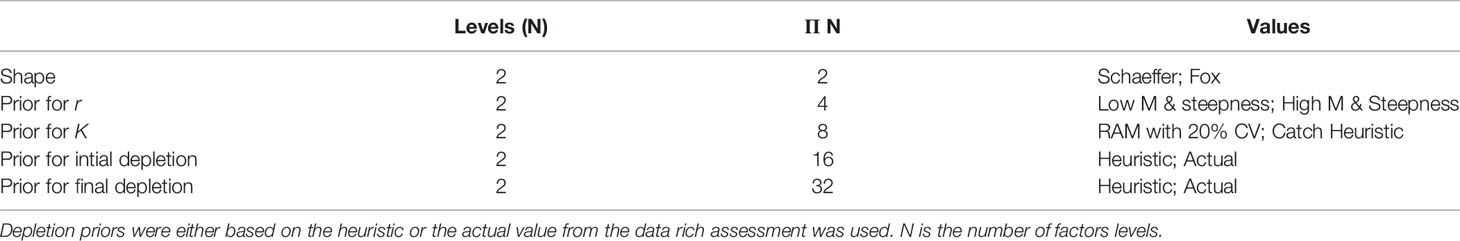
Table 1 Catch-only model settings, for shape of the production function, and the derivation of population growth rate (r) from natural mortality and the steepness of the stock recruitment relationship, see Supplementary Material for details of derivation.
All modelling was performed in R using the FLR simulation framework (Kell et al., 2007).
2.2.2 Receiver Operator Characteristics
In binary classification, e.g. identifying whether a stock above or below a reference point, where outcomes are labelled as either positive (P) or negative (N), there are four possible outcomes. If a prediction is positive (P) and the actual value is also positive then it is termed a true positive (TP); however, if the actual value is negative (N), then it is said to be a false positive (FP). A true negative (TN) occurs when the prediction and the actual value are both N, and a false negative (FN) is when although the prediction is negative, the actual value is P. To have classification skill, an indicator must have both high true positive rate [TPR=TP/(TP+FN)] and a low false positive rate [FPR=FP/(FP+TN)].
Receiver operating characteristics (ROC) graphs are useful for comparing classifiers and visualising their performance. ROC graphs are commonly used in medical decision-making, and recently have been increasingly used in machine learning and data mining research (Fawcett, 2006). ROC curves were constructed by sorting the B/BMSY and F/FMSY values from the catch-only methods by their predicted scores, with the highest scores first. Plotting TPR against FPR at the different threshold settings provides a tool to select the best candidate assessment methods. The cumulative TPR and True Negative Rate (TNR) were then calculated for the ordered observed outcomes from the data-rich assessments. The curve is then generated by plotting the area under the probability distribution (i.e. the cumulative distribution function) of the detection probability (TPR) on the y-axis versus the cumulative distribution function of the false-alarm probability (FPR) on the x-axis. Sensitivity measures the ability of a test to identify positive cases, i.e. the proportion of positives that are correctly identified, while specificity measures the proportion of negatives that are correctly identified.
The ROC curve is a probability curve, and the area under the curve (AUC) is a metric for measuring performance. A coin toss would produce a curve that fell along the y = x line and the area under the curve would be equal to 0.5. While a perfect classifier would have a value of 1. Therefore, the area under the curve measures how well an index can distinguish between states, since the closer the area under the curve is to 1, the better the model is at ranking. The best performing discrimination threshold values are those closest to the top left-hand corner (TPR=1, FPR=0), and so Receiver Operator Characteristics can be used to identify the bias in the reference point used for classification. For example, how far is the point B/BMSY = 1 on the curve from the point closest to (TPR=1, FPR=0)?
3 Results
Estimates of B/BMSY in the final year are compared to the data-rich (i.e. RAM legacy) reference set in Figure 2. The estimates from the biomass dynamic assessment calibrated with an index of abundance based on the RAM Legacy DB estimates are shown in panel A, and those from the catch-only model values in panel B. The red and blue points and smoothers correspond to the Fox and Schaefer production functions respectively, and the cross-hairs indicate B/BMSY = 1. If there were no error in the model estimates, the points would all fall along the dashed y = x line. A negative bias is evident at higher stock size, as shown by the smoother, due to the wider range of production function shapes seen in the data-rich assessments. For the catch-only models, there is no difference whether the initial depletion is known or the heuristic is used (row), this because the time series of catches were generally long, and so initial conditions had little effect on final depletion. While, if the heuristic is used for final depletion (column) all stocks are classified as overfished.
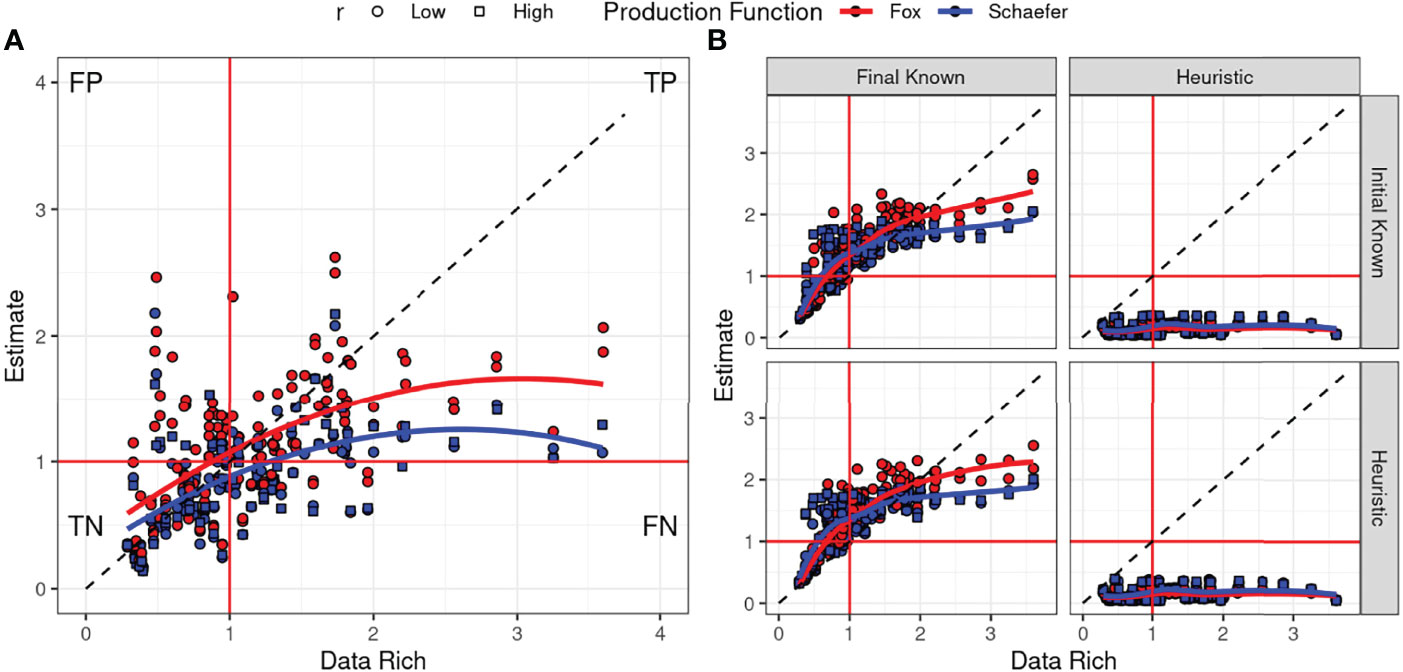
Figure 2 Comparisons of estimates of B:BMSY in the final year with the data-rich (i.e. RAM legacy DB) values. The biomass dynamic assessment model with the index of abundance estimates are shown in panel (A), and the catch-only model values in panel (B) If the biomass assessment with index was unbiased y = x. True positive (TP) is when a prediction and the actual value are both positive; false positive (FP) is when a prediction is positive the actual value is negative; true negative (TN) is when where the prediction and actual value are both negative; and false negative (FN) is when the prediction is negative and the actual value is P.
In the reference set, the positive condition (P) is defined when B≥BMSY and the negative condition (N) when B<BMSY. The number of positive cases correctly classified as true positive (TP) fall in the top right-hand quadrant. Those correctly identified as negative, i.e. true negative (TN), fall in the bottom left-hand quadrant. The false positive (FP) cases are equivalent to a false alarm or Type I error; while false negative (FN) cases are equivalent to a Type II error.
The corresponding Receiver Operator Characteristics curves are shown in Figure 3. The area under the curve is high for the model fits and varies between 0.76 and 0.8 (panel A). The points corresponding to the discriminated threshold (B/BMSY = 1) for the Fox model show that 80% of cases are correctly classified as positive and only 25% are incorrectly classified. However, in the case of the Schaefer model although nearly 100% of cases are classified as positive, 70% of cases are incorrectly classified as positive. Therefore, a model based on Schaefer could be used for ranking but not classification. The results are insensitive to the choice of r prior, since the dashed and solid lines coincide.
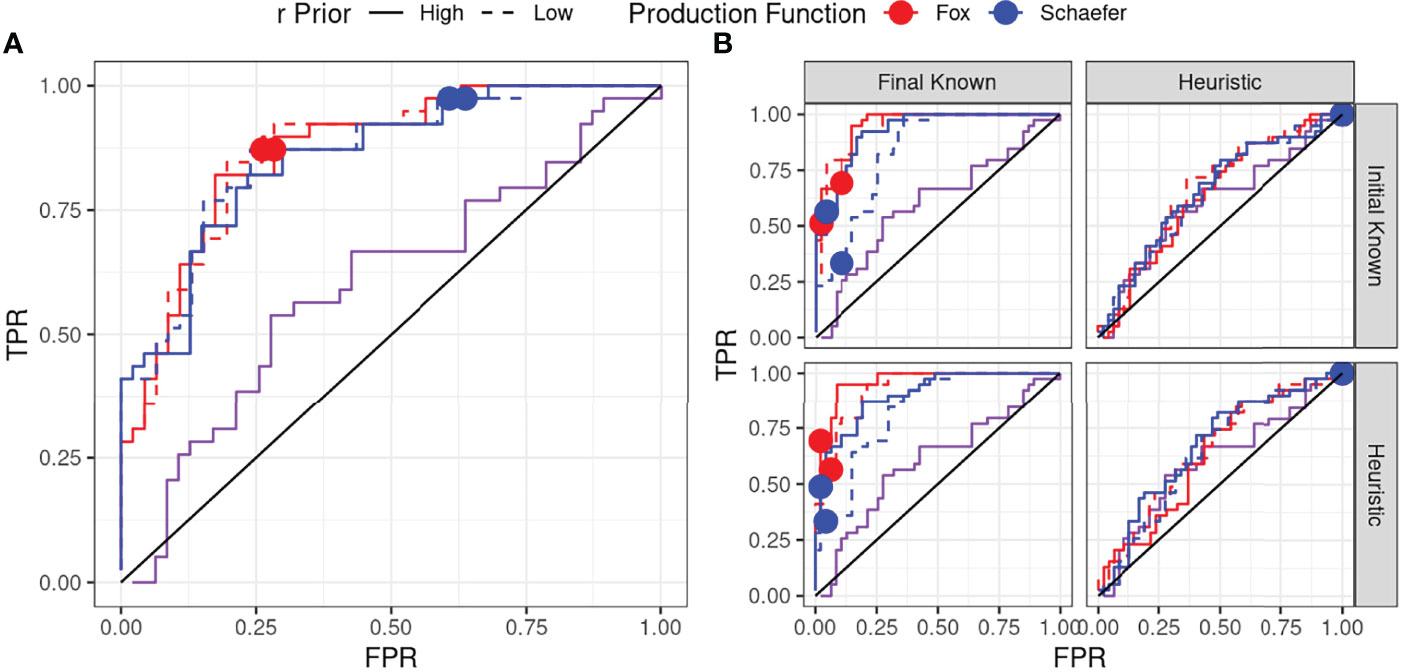
Figure 3 Receiver Operator Characteristics curves for B:BMSY, The biomass dynamic assessment model with the index of abundance estimates are shown in panel (A), and the catch-only model values in panel (B) The true positive rate (TPR) is the proportion of positive cases correctly identified and false positive rate (FPR) is the proportion of negative cases incorrectly identified as being positive. The points are for when the estimates of B:BMSY = 1. The black line (y = x) is equivalent to a coin toss, and the purple corresponds to the reference case where the heuristic for final depletion alone was used, i.e. running the catch-only model without data. The blue and red lines are the estimates for the two production functions, and the dashed/solid lines are for the choice of r prior. The dots correspond to a discrimination threshold of B/BMSY = 1, i.e. is the estimate unbiased. If the biomass assessment with index was unbiased then points will fall along y=x.
For the catch-only model (panel B), if the heuristic is used for final depletion (right column panel B) then the area under the curve is around 65% and the same as when the heuristic alone is used (purple line), and so is little better than a coin toss (y = x line). Again the Fox model out performs the Schaefer and the choice of r prior has an effect for the Schaefer model.
Classification skill for F/FMSY is summarised in Figure 4, since the heuristic alone cannot be used to estimate F/F+MSY no purple line is shown. This shows that a catch-only model cannot be used to assess exploitation level.
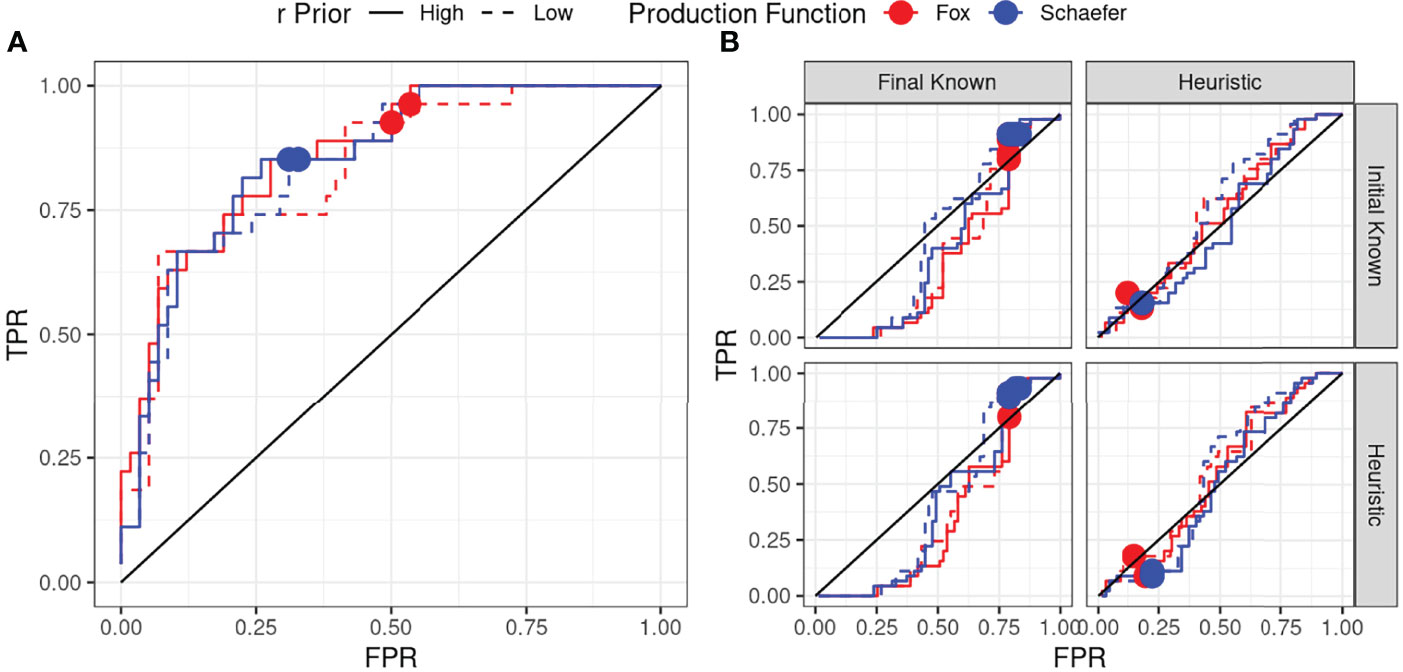
Figure 4 Receiver Operator Characteristics curves for F:FMSY, The biomass dynamic assessment model with the index of abundance estimates are shown in panel (A), and the catch-only model values in panel (B) The points are for when the estimates of F:FMSY = 1. The black line (y = x) is equivalent to a coin toss, and the purple corresponds to the reference case where the heuristic for final depletion alone was used, i.e. running the catch-only model without data. The blue and red lines are the estimatesfor the two production functions, and the dashed/solid lines are for the choice of r prior. The dots correspond to a discrimination threshold of B/BMSY = 1, i.e. is the estimate unbiased.
4 Discussion
The FAO performs a systematic assessment for 445 stocks on a biannual basis, covering approximately 70% of global landing records (Sharma et al., 2021). Catch-only models are a main tool for assessing the state of regional and global fisheries that lack the data required to run traditional assessment models. However, the limited quantity and quality of data along with methodological differences often produce counter-intuitive and conflicting results (Ovando et al., 2021b). Therefore, the debate about the status and productivity of global fisheries continues (e.g. Anderson et al., 2017; Rousseau et al., 2019; Costello et al., 2020; Palomares et al., 2020). For example, two views have been put forward about how much inference can be made based on catch data alone. The first is based on the premises that total annual catch data contains signals about stock status and as it is often the only data publicly available should be used, i.e. “While fisheries researchers continue the important debate about which fisheries are declining, why and to what degree, most fishermen worldwide are finding fewer fish in their hauls than their predecessors did. Knowing what tonnage is pulled out of the oceans each year is crucial to knowing how to reverse this trend” (Pauly, 2013). The second view expresses concern that inferring stock status from catch-only methods can be misleading and overly pessimistic, and instead encourages “… researchers to use all the available data in addition to the FAO database, and to validate their results by consulting local experts or other data sources” (Hilborn and Branch, 2013).
While (Pauly, 2013) makes a case for doing something with the available information, it is important that models should be consistent with prior knowledge and corroborated with multiple sources of information (Connell and Keane, 2006). Furthermore models should ideally be validated if they are to provide robust and credible advice (Saltelli et al., 2020). For a model to be valid it must be plausible that a system equivalent to the model generated the data (Thygesen et al., 2017). However, catch-only models cannot be validated with observations. We found that estimates were entirely driven by expert judgement codified as heuristics, as the ROC curves showed that catch-only models perform little better than a coin toss. Our results therefore support (Hilborn and Branch, 2013) call to use all the available data and to incorporate alternative data sources.
Catch-only methods are an attempt to incorporate available biological information and expert knowledge about initial and final depletion. The main catch-only models implement the same basic algorithms but vary in their default ways for setting priors, heuristics for depletion, and the assumed form of the production function (Froese et al., 2017; Zhou et al., 2018; FAO, 2019). Empirical, rule-based heuristics are only recommended for cautious use when expert information or alternative depletion estimates are lacking (Froese et al., 2017). However, the reliance on expert knowledge to formulate informative priors makes traditional simulation testing to evaluate catch-only models challenging (Cope et al., 2015; Free et al., 2020), and therefore simulation testing has been limited to specific default rules (e.g. Rosenberg et al., 2014b; Froese et al., 2017; Pons et al., 2018). Others have tested default rules for harvest control rules as part of a Management Procedure (e.g. Carruthers et al., 2014; Wetzel and Punt, 2015). In our study, we focused on heuristics and compare those to unbiased expert priors, as representative expert elicitation methods can be challenging to replicate in simulations (Chrysafi et al., 2019). We found that the heuristics rather than the data determined the estimates of current stock status, and that they performed little better than a coin toss. Therefore, if advice was to be based on such methods, there would be a high risk of both over- and under-fishing. It would also be impossible to monitor the effect of management.
There are various motivations for applying data-poor methods; as well as classifying stock status to provide synoptic views of world fisheries, these include conducting single stock assessments, and ranking stocks as part of a risk assessment. A main problem is how to validate the different implementations across stocks, species, regions, and fisheries. Particularly since diagnostics such as goodness of fit based on residuals are not applicable. Validation requires that the system be observable and measurable (Hodges et al., 1992). However, the only observations in a catch-only model are catches, and if an observation is omitted from the model the observation cannot be estimated. Therefore, we compared estimates to those from data-rich assessments based on the RAM Legacy database, as these provide a range of stock, fishery and species characteristics.
The Receiver Operator Characteristics analysis showed that correct classification of biomass relative to BMSY relies on setting final biomass depletion priors correctly. The generic heuristic alone performed poorly for ranking and classification, and including catch data made little if any improvement. Sharma et al. (2021) conducted a similar exercise comparing SRA+ and CMSY for stocks assessed by ICES, and again, poor performance was reported for inbuilt default heuristics, but as the quality of the biomass prior information increased, classification improved regarding FAO’s 3-tier classification of biomass levels relative to BMSY. In addition, we found that there was no classification skill for distinguishing between sustainable fishing (F<FMSY) and overfishing (F>FMSY) for the catch-model, irrespective of whether final biomass depletion was correctly specified. Additional data is therefore required to quantify sustainable fishing levels.
Our results showed that using catch-only methods with generic default settings to classify stock status is inappropriate in most cases, and should not be used in classification. Walters et al. (2006) and Martell and Froese (2013) showed how catch-only methods could be used to estimate MSY. However, the original intention was not classify stock status with respect to biomass and fishing mortality targets. Our study further strengthens this argument and demonstrates that using catch-only models based on heuristics provide biased and imprecise results.
The lack of classification skill may be partially attributed to the use of data-rich stocks for the analysis, whose catch dynamics are likely to systematically differ from many unregulated data-poor fisheries as a result of active catch quota management. Therefore, estimates of FMSY from catch-only model may be similarly susceptible to violations of steady-state assumption of fishing effort as per-recruit approaches (Hordyk et al., 2014; Pons et al., 2018; Haupt et al., 2020). Ovando et al. (2021a) pointed out the paradox that catch-only models possible work better for unregulated data limited fisheries, but testing of these methods relies on data rich stocks, where the relationships between catch and biomass is likely to be the weakest due to active management and strong market drivers. An alternative is to obtain alternative data sources, such as effort (Ovando et al., 2021b) and size composition (LBB, Froese et al., 2018), that can be incorporated into biomass dynamic models as information about fishing pressure or relative depletion, and then validate the model based on prediction skill (Kell et al., 2021).
Many stocks exploited by data-poor fisheries are for stocks with high r, like cephalopods, or endangered species that have low r. Also, the variability of time series and the level of process error will have an impact, particularly as catch-only methodswere shown to only be able to assess state and not exploitation level, so even if a catch-only model can assess status relative to BMSY it may not be able to explain whether it was due to the environment or fishing.
Validation is required to increase confidence in the outputs of a model, and is essential to increase trust among the public, stake and asset-holders and policymakers (Saltelli et al., 2020). Validation can also identify model limitations that should be addressed in future research. (Ovando et al., 2021b) concluded that improvements to estimates of the state of the world’s exploited fish populations depend more on efficient use of existing data and expanding the collection of new information, rather than the development of new models. Bayesian biomass dynamic models, such as JABBA, can be fitted to as little as two observations of annual abundance indices, thus enabling a continuous transition from a catch-only to a data moderate assessment. Additional data sources include length data, which can be used as a proxy for fishing mortality (e.g. Miethe et al., 2019) or relative depletion (Froese et al., 2018; LBB), and economic data as a proxy for fishing effort. Length data are potentially available for many fisheries, and even data from a single year could be used in an assessment model to provide an estimate of exploitation level. While port collection schemes could be established to monitor trend in size composition and catch-per-unit and hence exploitation and abundance indices. This way an initial catch-only model can be adapted and updated with new data as those become available and eventually be validated.
The next step after assessment is management, and if a stock is declining due to overfishing, then a reduction in catch should be implemented. Catch-only methods, however, have clear limitations in monitoring rebuilding if there are no data other than catch (Wetzel and Punt, 2015). Since monitoring a stock’s response to management requires new observations to update the assessment. However, as the data used to set catch are the same as the management regulation, it is unlikely that catch-only models can provide robust estimates and be able to update advice. Lacking observations, neither can they be validated. Therefore, rebuilding plans should be accompanied by data collection programmes designed to monitor progress and provide feedback control. Potential datasets for improving information are indices of trends e.g. in catch rate, size composition, tag recovery rate, survey estimates of abundance or species composition.
Reframing stock assessment as risk management would help in the development of scientific management frameworks. A definition of risk, is an uncertain event or set of circumstances that, should it occur, will affect the achievement of objectives (Bartlett, 2004). In fisheries management, the level of risk is a choice made by managers and stakeholders, e.g. a given probability of stock collapse or forgone yield relative to MSY. Uncertainty is generally quantified as part of the stock assessment process, when considering alternative scenarios in an ensemble of models or deriving probabilistic estimates of model outputs, or when conditioning Operating Models as part of Management Strategy Evaluation. For a given level of risk when information is low, there will be great uncertainty over stock size, and so catches should be set low, and vice versa. For a given level of risk there should therefore be a positive relationship between information and use so their is a positive value of information to and control (Cooke, 1999). In contrast, in non-precautionary management, catches are not reduced until there is sufficient information to demonstrate the necessity for limits: under such regimes, information and control has a negative value to the fishery in the short term.
A consideration of risk equivalence could assist in adapting existing practice and systematically explore management options using the available information to condition management advice to ensure objectives are still met (Roux et al., 2021). Risk equivalence is defined as the probability of a stock being depleted below a limit reference point or not being maintained at a target reference point, irrespective of the stock assessment method used to provide management advice and the amount of data available (Fulton et al., 2016). Therefore, in capacity or data limited situations, risk equivalence can help provide, robust and accountable management decision-making in the absence of perfect knowledge and provide an incentive to evaluate the value-of-information and the development of robust feedback control.
The catch-only method, in this study, was implemented in the Bayesian state-space biomass dynamic model JABBA, which has been widely applied to conduct data moderate assessments to provide advice on stock status relative to target and limit reference points, and can be validated (Kell et al., 2021). The use of JABBA will allow the evaluation of the value of different sources of information in the form of different data types, assumptions, knowledge and priors, and models to be evaluated. JABBA is also callable from FLR (Kell et al., 2007) allowing Management Strategy Evaluation to be conducted to evaluate robust control rules in data-limited situations (e.g. Fischer et al., 2020).
5 Conclusions
An artefact is “something observed in a scientific investigation or experiment that is not naturally present but occurs as a result of the preparative or investigative procedure”, while artifice is “something contrived or made up to achieve an end”. We need to protect against both artefact and artifice when developing models for advice. Therefore, the objective of this study was to evaluate the validity of catch-only methods used to classify stock status. A motivation was that Sharma et al. (2021) found that catch-only models can show notable bias when run with their inbuilt default heuristics, and that as the quality of prior information increased, classification improved. We therefore agree with Ovando et al. (2021b) that the improvement of catch-only models depends on developing robust biomass, fishing effort or mortality priors. To do this requires an objective way to evaluate classification skill. Therefore, we configured a data-moderate stock assessment method as a catch-only model to compare the value-of-information, then used Receiver Operator Characteristics to compare estimates to data-rich assessments. A main finding was that in the catch-only models the data have no effect. Although catch-only methods have been used to provide a “Snapshot”, this requires that factors that affect depletion are known, which precludes adaptive management. A major problem is that catch-only methods cannot be validated using observations nor be used in Management Strategy Evaluation as a feedback controller. The solution therefore is to collect better data and to develop robust management strategies. The value of obtaining additional information for reducing risk due to loss of yield through adopting a risk equivalence approach should also be evaluated. This will help identify the value-of-information and prioritise the development of scientific management frameworks that protect marine ecosystems and the well-being of people who have a stake in the resources at regional and local levels.
Data Availability Statement
The raw data supporting the conclusions of this article will be made available by the authors, without undue reservation.
Author Contributions
LK was the main author responsible for the hypotheses, modelling, and synthesis; RS provided the rational and overview; HW was responsible for implementing JABBA as a catch-only model. All authors contributed to the writing of the manuscript.
Funding
FAO Sofia improvement funds provided support for LK.
Conflict of Interest
The authors declare that the research was conducted without any commercial or financial relationships that could be construed as a potential conflict of interest.
Publisher’s Note
All claims expressed in this article are solely those of the authors and do not necessarily represent those of their affiliated organizations, or those of the publisher, the editors and the reviewers. Any product that may be evaluated in this article, or claim that may be made by its manufacturer, is not guaranteed or endorsed by the publisher.
Acknowledgments
This is a short text to acknowledge the contributions of specific colleagues, institutions, or agencies that aided the efforts of the authors.
Supplementary Material
The Supplementary Material for this article can be found online at: https://www.frontiersin.org/articles/10.3389/fmars.2022.762203/full#supplementary-material
Footnotes
- ^ RAM Legacy Stock Assessment Database. 2018. Version 4.44-assessment-only. Released 2018-12-22. Accessed [Date accessed 2020-10-30]. Retrieved from DOI:10.5281/zenodo.2542919
References
Anderson S. C., Cooper A. B., Jensen O. P., Minto C., Thorson J. T., Walsh J. C., et al. (2017). Improving Estimates of Population Status and Trend With Superensemble Models. Fish. Fish. 18, 732–741. doi: 10.1111/faf.12200
Bartlett J. (2004). Project Risk Analysis and Management Guide (High Wycombe, UK: APM publishing limited).
Bouch P., Minto C., Reid D. G. (2020). Comparative Performance of Data-Poor CMSY and Data-Moderate SPiCT Stock Assessment Methods When Applied to Data-Rich, Real-World Stocks. ICES J. Mar. Sci 78, 264–276. doi: 10.1093/icesjms/fsaa220
Brown D., Hermes R. (2019). The Food and Agriculture Organization of the Un and Asian Lmes: A Commentary. Deep. Sea. Res. Part II.: Top. Stud. Oceanogr. 163, 124–126. doi: 10.1016/j.dsr2.2019.03.002
Carruthers T., Punt A., Walters C., MacCall A., McAllister M., Dick E., et al. (2014). Evaluating Methods for Setting Catch Limits in Data-Limited Fisheries. Fish. Res. 153, 8–68. doi: 10.1016/j.fishres.2013.12.014
Chrysafi A., Cope J. M., Kuparinen A. (2019). Eliciting Expert Knowledge to Inform Stock Status for Data-Limited Stock Assessments. Mar. Policy 101, 167–176. doi: 10.1016/j.marpol.2017.11.012
Connell L., Keane M. T. (2006). A Model of Plausibility. Cogn. Sci. 30, 95–120. doi: 10.1207/s15516709cog0000_53
Cooke J. (1999). Improvement of Fishery-Management Advice Through Simulation Testing of Harvest Algorithms. ICES J. Mar. Sci. 56, 797. doi: 10.1006/jmsc.1999.0552
Cope J., Thorson J., Wetzel C., DeVore J. (2015). Evaluating a Prior on Relative Stock Status Using Simplified Age-Structured Models. Fish. Res. 171, 101–109. doi: 10.1016/j.fishres.2014.07.018
Costello C., Cao L., Gelcich S., Cisneros-Mata M.Á., Free C. M., Froehlich H. E., et al. (2020). Enthe Future of Food From the Sea. Nature 588 (7836), 95–100. doi: 10.1038/s41586-020-2616-y
Dick E., MacCall A. D. (2011). Depletion-Based Stock Reduction Analysis: A Catch-Based Method for Determining Sustainable Yields for Data-Poor Fish Stocks. Fish. Res. 110, 331–341. doi: 10.1016/j.fishres.2011.05.007
Dowling N., Dichmont C., Haddon M., Smith D., Smith A., Sainsbury K. (2015a). Empirical Harvest Strategies for Data-Poor Fisheries: A Review of the Literature. Fish. Res. 171, 141–153. doi: 10.1016/j.fishres.2014.11.005
Dowling N. A., Dichmont C. M., Haddon M., Smith D. C., Smith A. D. M., Sainsbury K. (2015b). Guidelines for Developing Formal Harvest Strategies for Data-Poor Species and Fisheries. Fish. Res. 171, 130–140. doi: 10.1016/j.fishres.2014.09.013
FAO (2019). EnglishReport of the Fao Expert Consultation Workshop on the “Development of Methodologies for the Global Assessment of Fish Stock Status, Rome, Italy. FAO Fish. Aquacult. Rep. 1262 2019, 4–6.
Fawcett T. (2006). An Introduction to Roc Analysis. Pattern Recognition Letters. ROC Anal. Pattern Recog. 27, 861–874. doi: 10.1016/j.patrec.2005.10.010
Fischer S. H., De Oliveira J. A., Kell L. T. (2020). Linking the Performance of a Data-Limited Empirical Catch Rule to Life-History Traits. ICES J. Mar. Sci. 77, 1914–1926. doi: 10.1093/icesjms/fsaa054
Free C. M., Jensen O. P., Anderson S. C., Gutierrez N. L., Kleisner K. M., Longo C., et al. (2020). Blood From a Stone: Performance of Catch-Only Methods in Estimating Stock Biomass Status. Fish. Res. 223, 105452. doi: 10.1016/j.fishres.2019.105452
Froese R., Demirel N., Coro G., Kleisner K. M., Winker H. (2017). Estimating Fisheries Reference Points From Catch and Resilience. Fish. Fish. 18, 506–526. doi: 10.1111/faf.12190
Froese R., Kesner-Reyes K. (2002). Impact of Fishing on the Abundance of Marine Species. ICES CM. 50, 12.
Froese R., Winker H., Coro G., Demirel N., Tsikliras A. C., Dimarchopoulou D., et al. (2018). A New Approach for Estimating Stock Status From Length Frequency Data. ICES J. Mar. Sci. 75, 2004–2015. doi: 10.1093/icesjms/fsy078
Fromentin J.-M., Bonhommeau S., Arrizabalaga H., XXXL. Kell L. (2014). The Spectre of Uncertainty in Management of Exploited Fish Stocks: The Illustrative Case of Atlantic Bluefin Tuna. Mar. Policy 47, 8–14. doi: 10.1016/j.marpol.2014.01.018
Fulton E. A., Punt A. E., Dichmont C. M., Gorton R., Sporcic M., Dowling N., et al. (2016). Developing Risk Equivalent Data-Rich and Data-Limited Harvest Strategies. Fish. Res. 183, 574–587. doi: 10.1016/j.fishres.2016.07.004
Garcia S. (1996). The Precautionary Approach to Fisheries and its Implications for Fishery Research, Technology and Management: An Updated Review. FAO Fish. Tech. Pap., 1–76.
Green D. M., Swets J. A., et al. (1966). Signal Detection Theory and Psychophysics. (Wiley New York: Wiley) Vol. 1, 1969–2012.
Haupt M., Winker H., Parker D., Kerwath S. (2020). Are South African Linefishes Recovering and What Makes Them Prone to Overexploitation? Afr. J. Mar. Sci. 42, 361–373.
Hilborn R., Amoroso R. O., Anderson C. M., Baum J. K., Branch T. A., Costello C., et al. (2020). Effective Fisheries Management Instrumental in Improving Fish Stock Status. Proc. Natl. Acad. Sci. 117, 2218–2224. doi: 10.1073/pnas.1909726116
Hilborn R., Branch T. A. (2013). Fisheries: Does Catch Reflect Abundance? Counterpoint No, it is Misleading. Nature 494, 303–306. doi: 10.1038/494303a
Hodges J. S., Dewar J. A., Center A. (1992). Is it You or Your Model Talking?: A Framework for Model Validation (Santa Monica, CA: Rand).
Hordyk A., Ono K., Valencia S., Loneragan N., Prince J. (2014). A Novel Length-Based Empirical Estimation Method of Spawning Potential Ratio (Spr), and Tests of its Performance, for Small-Scale, Data-Poor Fisheries. ICES J. Mar. Sci. 72, 217–231. doi: 10.1093/icesjms/fsu004
Jiao Y., Smith E. P., O’Reilly R., Orth D. J. (2012). Modelling non-Stationary Natural Mortality in Catch-at-Age Models. ICES J. Mar. Sci. 69, 105–118. doi: 10.1093/icesjms/fsr184
Kell L., Mosqueira I., Grosjean P., Fromentin J., Garcia D., Hillary R., et al. (2007). FLR: An Open-Source Framework for the Evaluation and Development of Management Strategies. ICES J. Mar. Sci. 64, 640. doi: 10.1093/icesjms/fsm012
Kell L. T., Sharma R., Kitakado T., Winker H., Mosqueira I., Cardinale M., et al. (2021). Validation of Stock Assessment Methods: Is it Me or My Model Talking? ICES J. Mar. Sci., Fsab104. doi: 10.1093/icesjms/fsab104
Lee H.-H., Maunder M. N., Piner K. R., Methot R. D. (2011). Estimating Natural Mortality Within a Fisheries Stock Assessment Model: An Evaluation Using Simulation Analysis Based on Twelve Stock Assessments. Fish. Res. 109, 89–94. doi: 10.1016/j.fishres.2011.01.021
Lee H.-H., Maunder M. N., Piner K. R., Methot R. D. (2012). Can Steepness of the Stock–Recruitment Relationship be Estimated in Fishery Stock Assessment Models? Fish. Res. 125, 254–261. doi: 10.1016/j.shres.2012.03.001
Mangel M., Brodziak J., DiNardo G. (2010). Reproductive Ecology and Scientific Inference of Steepness: A Fundamental Metric of Population Dynamics and Strategic Fisheries Management. Fish. Fish. 11, 89–104. doi: 10.1111/j.1467-2979.2009.00345.x
Martell S., Froese R. (2013). A Simple Method for Estimating Msy From Catch and Resilience. Fish. Fish. 14, 504–514. doi: 10.1111/j.1467-2979.2012.00485.x
Miethe T., Reecht Y., Dobby H. (2019). Reference Points for the Length-Based Indicator L_Max5 for Use in the Assessment of Data-Limited Stocks. ICES J. Mar. Sci. 76, 2125–2139. doi: 10.1093/icesjms/fsz158
Ovando D., Free C. M., Jensen O. P., Hilborn R. (2021a). A History and Evaluation of Catch-Only Stock Assessment Models. Fish. Fish. 23 (3), 616–630. doi: 10.1111/faf.12637
Ovando D., Hilborn R., Monnahan C., Rudd M., Sharma R., Thorson J. T., et al. (2021b). Improving Estimates of the State of Global Fisheries Depends on Better Data. Fish. Fish. 22, 1377–1391. doi: 10.1111/faf.12593
Palacios-Abrantes J., Reygondeau G., Wabnitz C. C., Cheung W. W. (2020). The Transboundary Nature of the World’s Exploited Marine Species. Sci. Rep. 10, 1–12. doi: 10.1038/s41598-020-74644-2
Palomares M. L. D., Froese R., Derrick B., Meeuwig J. J., Nöel S. L., Tsui G., et al. (2020). Enfishery Biomass Trends of Exploited Fish Populations in Marine Ecoregions, Climatic Zones and Ocean Basins. Estuar. Coast. Shelf. Sci., 106896. doi: 10.1016/j.ecss.2020.106896
Pauly D. (2013). Fisheries: Does Catch Reflect Abundance? Point: Yes, it is a Crucial Signal. Nature 494, 303–306. doi: 10.1038/494303a
Pella J., Tomlinson P. (1969). A Generalized Stock Production Model (San Diego, USA: Inter-American Tropical Tuna Commission).
Pons M., Cope J., Kell L. (2018). Performance of Catch-Based and Length-Based Methods in Data-Limited Fisheries. 1–17.
Rosenberg A. A., Fogarty M. J., Cooper A. B., Dickey-Collas M., Fulton E. A., Gutierrez N. L., et al. (2014a). Developing New Approaches To Global Stock Status, Vol. 1086, 01.
Rosenberg A. A., Fogarty M. J., Cooper A. B., Dickey-Collas M., Fulton E. A., Gutiérrez N. L., et al. (2014b). Developing New Approaches to Global Stock Status Assessment and Fishery Production Potential of the Seas. FAO Fish. Aquacult. Circul. 0_1.
Rosenberg A. A., Kleisner K. M., Afflerbach J., Anderson S. C., Dickey-Collas M., Cooper A. B., et al. (2018). Enapplying a New Ensemble Approach to Estimating Stock Status of Marine Fisheries Around the World. Conserv. Lett. 11, e12363. doi: 10.1111/conl.12363
Rousseau Y., Watson R., Blanchard J., Fulton E. (2019). Evolution of Global Marine Fishing Fleets and the Response of Fished Resources. Proc. Natl. Acad. Sci., 201820344. doi: 10.1073/pnas.1820344116
Roux M.-J., Duplisea D., Hunter K., Rice J. (2021). Consistent Risk Management in a Changing World: Risk Equivalence in Fisheries and Other Human Activities Affecting Marine Resources and Ecosystems. doi: 10.31219/osf.io/6d8h7
Saltelli A., Bammer G., Bruno I., Charters E., Di Fiore M., Didier E., et al. (2020). Five Ways to Ensure That Models Serve Society: A Manifesto. doi: 10.1038/d41586-020-01812-9
Sharma R., Winker H., Levontin P., Kell L., Ovando D., Palomares M. L. D., et al. (2021). Assessing the Potential of Catch-Only Models to Inform on the State of Global Fisheries and the UN’s SDGs. Sustainability 13, 6101. doi: 10.3390/su13116101
Simon M., Fromentin J.-M., Bonhommeau S., Gaertner D., Brodziak J., Etienne M.-P. (2012). Effects of Stochasticity in Early Life History on Steepness and Population Growth Rate Estimates: An Illustration on Atlantic Bluefin Tuna. PloS One 7, e48583. doi: 10.1371/journal.pone.0048583
Smith D., Punt A., Dowling N., Smith A., Tuck G., Knuckey I. (2009). Reconciling Approaches to the Assessment and Management of Data-Poor Species and Fisheries With Australia’s Harvest Strategy Policy. Manage. Mar. Coast. Fish.: Dyn. Ecosyst. Sci. 1, 244–254. doi: 10.1577/C08-041.1
Thorson J. T., Branch T. A., Jensen O. P., Quinn T. (2012). Using Model-Based Inference to Evaluate Global Fisheries Status From Landings, Location, and Life History Data. Can. J. Fish. Aquat. Sci. 69, 645–655. doi: 10.1139/f2012-016
Thygesen U. H., Albertsen C. M., Berg C. W., Kristensen K., Nielsen A. (2017). Validation of Ecological State Space Models Using the Laplace Approximation. Environ. Ecol. Stat 24, 317–339. doi: 10.1007/s10651-017-0372-4
Walters C. J., Martell S. J., Korman J. (2006). A Stochastic Approach to Stock Reduction Analysis. Can. J. Fish. Aquat. Sci. 63, 212–223. doi: 10.1139/f05-213
Wetzel C. R., Punt A. E. (2015). Evaluating the Performance of Data-Moderate and Catch-Only Assessment Methods for Us West Coast Groundfish. Fish. Res. 171, 170–187. doi: 10.1016/j.fishres.2015.06.005
Winker H., Carvalho F., Kapur M. (2018). Jabba: Just Another Bayesian Biomass Assessment. Fish. Res. 204, 275–288. doi: 10.1016/j.fishres.2018.03.010
Winker H., Carvalho F., Thorson J., Kell L., Parker D., Kapur M., et al. (2020). Jabba-Select: Incorporating Life History and Fisheries’ Selectivity Into Surplus Production Models. Fish. Res. 222, 105355. doi: 10.1016/j.fishres.2019.105355
Worm B., Barbier E. B., Beaumont N., Duffy J. E., Folke C., Halpern B. S., et al. (2006). Impacts of Biodiversity Loss on Ocean Ecosystem Services. Science 314, 787–790. doi: 10.1126/science.1132294
Keywords: biomass dynamic, data or capacity limited, evaluation, receiver operator characteristics, stock assessment, value of information
Citation: Kell LT, Sharma R and Winker H (2022) Artefact and Artifice: Evaluation of the Skill of Catch-Only Methods for Classifying Stock Status. Front. Mar. Sci. 9:762203. doi: 10.3389/fmars.2022.762203
Received: 21 August 2021; Accepted: 11 May 2022;
Published: 20 July 2022.
Edited by:
Jie Cao, North Carolina State University, United StatesReviewed by:
Kui Zhang, South China Sea Fisheries Research Institute, Chinese Academy of Fishery Sciences (CAFS), ChinaAthanassios C. Tsikliras, Aristotle University of Thessaloniki, Greece
Ruben Hernan Roa-Ureta, King Fahd University of Petroleum and Minerals, Saudi Arabia
Beyah Meissa, Institut Mauritanien de Recherches Océanographiques et des Pêches, Mauritania
Copyright © 2022 Kell, Sharma and Winker. This is an open-access article distributed under the terms of the Creative Commons Attribution License (CC BY). The use, distribution or reproduction in other forums is permitted, provided the original author(s) and the copyright owner(s) are credited and that the original publication in this journal is cited, in accordance with accepted academic practice. No use, distribution or reproduction is permitted which does not comply with these terms.
*Correspondence: Laurence T. Kell, bGF1cmllQHNlYXBsdXNwbHVzLmNvLnVr