 Zhaopeng Zhang
 Yuanchao Wang
 Shude Liu
 Cui Liang
 Weiwei Xian
- 1Key Laboratory of Marine Ecology and Environmental Sciences, Institute of Oceanology, Chinese Academy of Sciences, Qingdao, China
- 2Laboratory for Marine Ecology and Environmental Science, Qingdao National Laboratory for Marine Science and Technology, Qingdao, China
- 3University of Chinese Academy of Sciences, Beijing, China
- 4Shandong Fisheries Development and Resources Conservation Center, Yantai, China
- 5Center for Ocean Mega-Science, Chinese Academy of Sciences, Qingdao, China
- 6CAS Engineering Laboratory for Marine Ranching, Institute of Oceanology, Chinese Academy of Sciences, Qingdao, China
In recent years, the proportion and economic value of Lophius litulon (family Lophiidae) in the coastal fishery off Shandong Province, China has increased. In this study, we mapped the distribution of L. litulon abundance [catch per unit effort (CPUE)] and applied a generalized additive model (GAM) to explore the relationship between CPUE and environmental factors. Two data-limited methods (the BSM related to the CMSY method and the AMSY method) were used to evaluate the stock status and relevant fishery reference points of L. litulon. The results showed that the L. litulon stock was concentrated in the central Yellow Sea, at 34.0°–37.0° N and 121.0°–124.0° E, and the highest average CPUE of L. litulon in this area occurred in winter. The three most significant environmental factors affecting species abundance were bottom temperature, bottom salinity, and depth. L. litulon was most abundant when bottom temperature ranged from 5.8 to 10.6°C, depth was > 18 m, and bottom salinity varied from 31.0 to 33.2‰. The BSM and AMSY models indicated that the L. litulon stock was unhealthy and had been overfished in recent years, as its biomass remained below the level that can support maximum sustainable yield. The relative exploitation ratios were also high. These results provide the basic data for improving sustainability of the exploitation of L. litulon in the Yellow and Bohai Seas.
Introduction
Marine fishery resources face a variety of threats globally, which has roused international concern (Ricard et al., 2012). Multiple stresses, such as overfishing, global warming, and pollution have changed the structure of fishery resources and caused a decline in catch quantity and quality (Watson et al., 2013; Costello et al., 2016). Currently, approximately 34.2% of fish stocks are caught at unsustainable levels (FAO, 2020). China has been one of the largest national fisheries in the world since 1989 and has witnessed a decline in its coastal fishery resources (Wang et al., 2006; Zhang and Qiu, 2019).
Shandong Province, adjacent to the Yellow Sea and Bohai Sea, is one of the major fishing provinces in China. Shandong coastal waters are the most productive areas for fishing, as they are spawning and feeding grounds for a variety of commercial fish. The fishing boats in Shandong coastal waters are mainly from Shandong province, but also from Liaoning, Jiangsu, Hebei Province, and Tianjin city. According to the 2010–2020 China Fishery Statistical Yearbook, the number of domestic offshore fishing vessels in Shandong Province in 2020 decreased by 8.4% compared with 2019, and by 23.8% compared with 2010, indicating a continuous decline (Fisheries and Fisheries Administration, 2010, 2019, 2020). The marine fishery yield of Shandong Province mainly comes from the Yellow Sea and Bohai Sea, which provides more than 80% of the total catch, with the remainder mainly from the East China Sea. In the past few decades, Shandong Province has benefited substantially from marine fishery development, at the cost of resources and environmental deterioration (Chen, 1991). Pollution in coastal waters, excessive fishing intensity, and a decline in food resources have reduced catches of high value species, such as Trichiurus lepturus (Zou et al., 2019). Species with traditionally less economic value comprise as much as 60%–70% of the current catch, thus lowering the overall fishing benefit (Huang, 2012). In this context, changes in the distribution and resource status of marine organisms require urgent study to ensure current exploitation are sustainable.
Lophius litulon (family Lophiidae) is a demersal marine fish that is distributed in the northwestern Pacific constituting an important part of the catches of neighboring countries. Ji et al. (2007) showed that there was no significant difference in genetic structure between two geographical populations of L. litulon in the Yellow Sea and the Sea of Japan. Li X. et al. (2021) showed that L. litulon was the dominant species among 134 captured fish in the Shandong coastal waters. Furthermore, in waters off southwestern Korea, L. litulon was the dominant species, accounting for more than 60% of the total catch, together with Pampus echinogaster, Trichiurus lepturus, Engraulis japonicus, and Larimichthys polyactis (Kim et al., 2007). With the decline of traditional commercial fish resources, L. litulon, whose economic value has increased in recent years, has become a common species in China’s domestic fish market and one of the main fish products exported abroad in recent years. Most previous studies on L. litulon have focused on its biological characteristics (Xu et al., 2010; Zhang et al., 2011), feeding habits (Xue et al., 2007), and migratory distribution (Michiol et al., 2002). Assessments of resource status and the influence of environmental factors are scarce. Although China has adopted a series of policies to protect coastal fisheries, the L. litulon population in the Yellow Sea is thought to have a simpler age structure and smaller body size (Li et al., 2012). Sustainable exploitation of L. litulon is required.
The assessment of fishery resources can be used as a scientific basis for fishery management, but few assessments of the L. litulon stock in the Yellow Sea have been conducted due to the lack of data (Wang et al., 2020). In recent years, three computer-intensive methods, the Monte Carlo method CMSY (catch-maximum sustainable yield), the related Bayesian Schaefer model (BSM), and the abundance maximum sustainable yield (AMSY) have been proposed to evaluate stocks and related reference points of fishery resources in data-poor situations (Froese et al., 2017, 2020). In particular, CMSY uses only a time series of catches and ancillary qualitative information to quantify the stock status and related fisheries reference points. In cases where relative abundance data [i.e., catch per unit effort; CPUE] are available in addition to catch data, the BSM method can be used to combine information from both datasets. AMSY is the most recent method for assessing fish populations based on abundance (CPUE) time series (Froese et al., 2020). Froese et al. (2018) and Palomares et al. (2018) showed that the fish stock status could be defined based on the B/BMSY and F/FMSY in the final year of the time series. When B/BMSY ≥ 1 and F/FMSY ≤ 1, the assessed stock is in a healthy state; when B/BMSY < 1 and F/FMSY > 1, the stock is overfished, with higher F/FMSY and lower B/BMSY indicating more severe overfishing.
A complex functional relationship exists between CPUE and related influential factors. This relationship can be modeled using species distribution models, such as the generalized additive model (GAM) (Hastie and Tibshirani, 1990; Xiao et al., 2004). In recent years, the GAM has been widely used to study the association between the temporal and spatial distribution of fishery resources, environmental factors, and fish stocks (Li Y. et al., 2021; Ma et al., 2021). For example, Ma et al. (2021) used GAM to analyze the relationship between nominal and standardized CPUE and environmental factors for L. litulon in the Yellow Sea and Bohai Sea. Li et al. (2012) showed that the relationship between the spatial and temporal distribution of CPUE and environmental factors (such as year, position, water depth, and sea surface temperature) for L. litulon in the southern Yellow Sea was better explained by a GAM than a generalized linear model.
This study illustrated the temporal and spatial distribution of L. litulon CPUE in the Yellow Sea and Bohai Sea based on the production statistics from fishing vessels in Shandong Province from 2012 to 2019 and bottom trawl survey data in Shandong Province from 2016 to 2017. We evaluated the stock status and related fishery reference points using BSM and AMSY methods, and analyzed the relationship between CPUE and marine environmental factors such as surface temperature, salinity, and depth. The results can inform the Maritime Shandong Strategy put forward by Shandong Province and help fisheries advance into the era of farming the sea, herding, and fishing. These methods also provide theoretical baseline information for the management and development of L. litulon resources in the Yellow Sea and Bohai Sea and promote the sustainable exploitation of marine fishery resources.
Materials and Methods
Study Area
The Shandong Peninsula protrudes into the Bohai Sea and Yellow Sea, with numerous rivers flowing into both. The coastal waters of Shandong provide breeding, feeding, and nursery habitats for many fishery resources in the Yellow Sea and Bohai Sea, and support rich fishery resources for neighboring countries (Li F. et al., 2015). The distribution of fishing areas for L. litulon in this study is shown in Figure 1.
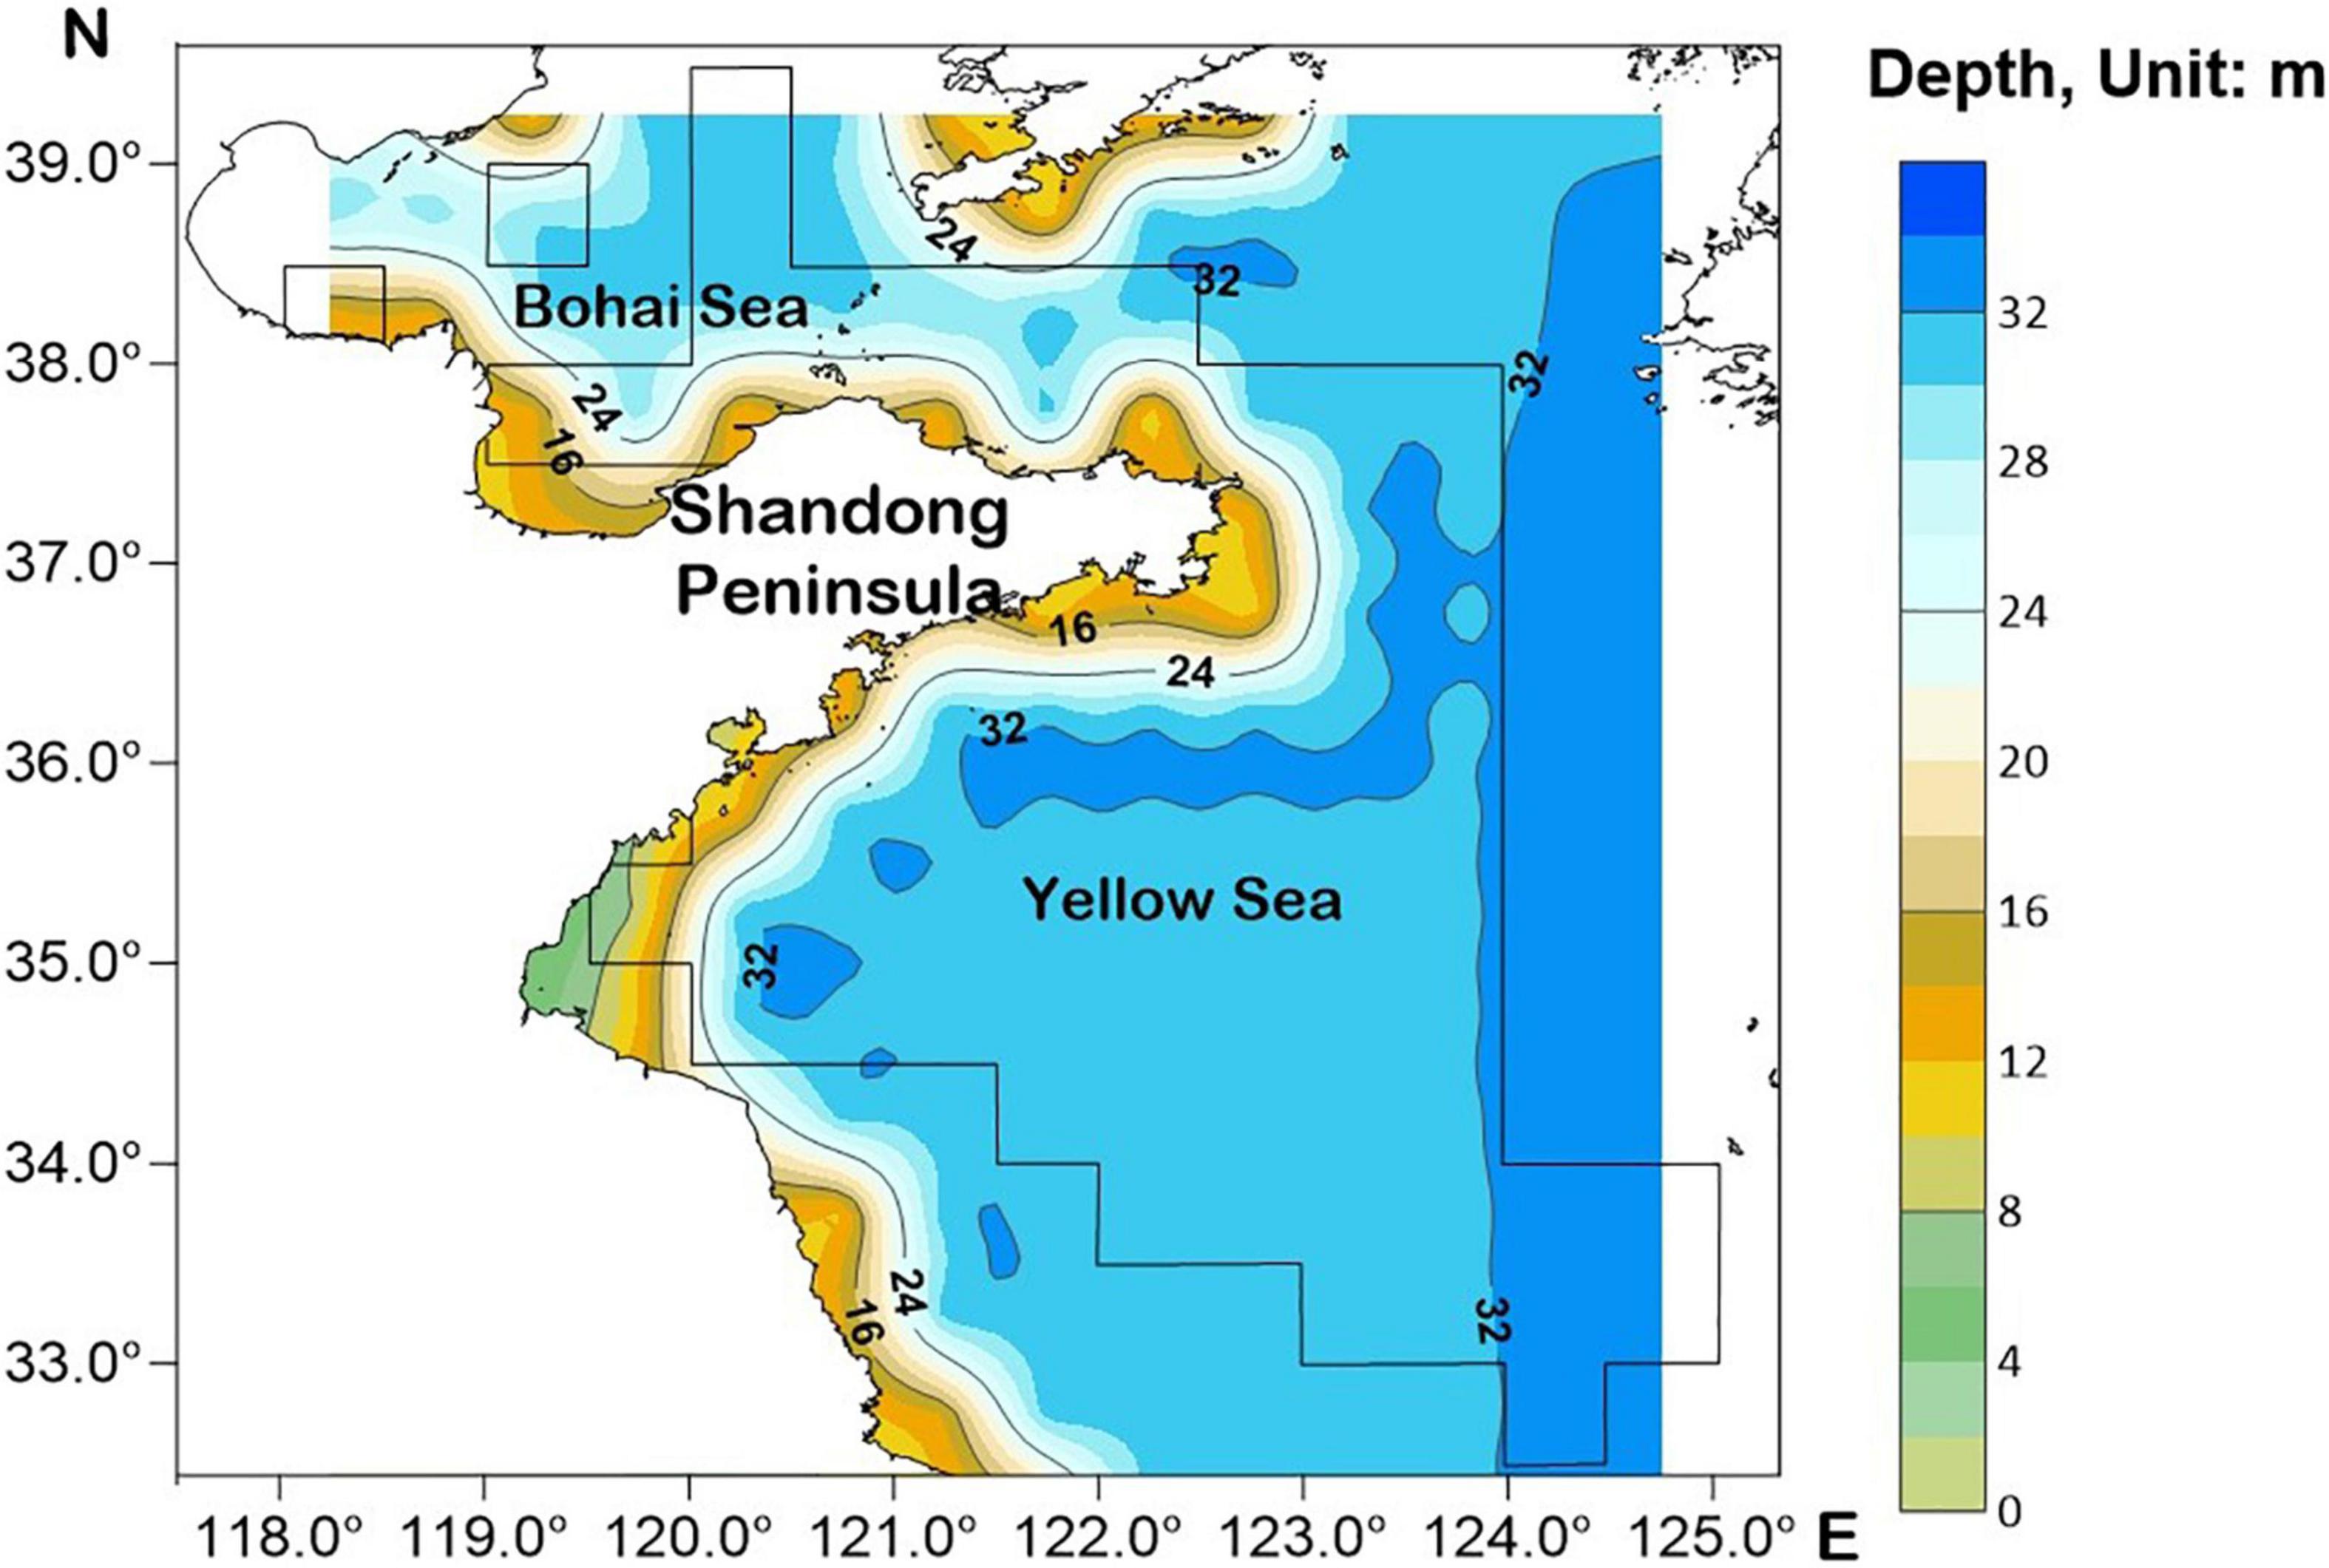
Figure 1. Scope of the Shandong coastal waters and fishing areas where Lophius litulon occur.
Datasets
The L. litulon datasets used for the BSM and AMSY models were derived from the fishing logs of offshore fishing vessels in Shandong Province from 2012 to 2019, which included fishing power, mode of operation, fishing area, operating time, catch species, and yield. However, no records of fishing areas were available in the logbooks for 2017. Therefore, after standardizing the annual mean nominal CPUE for the other years, interpolation was used to obtain the mean nominal CPUE for 2017. The spatial resolution of each fishing area was 0.5° × 0.5°, and its location was represented by the latitude and longitude of the center point.
Commercial fishery monitoring and trawl surveys were combined to obtain the catch rate of L. litulon for each fishing area (Pecquerie et al., 2004; Gonzalez et al., 2021). The datasets used to draw monthly spatial distribution maps of L. litulon CPUE and to fit the GAM were obtained from (i) fishing logs of commercial fleets from 2014 to 2016, and (ii) bottom trawl survey data for the Shandong inshore fishery resources in October 2016 and January, May, and August 2017. The fishing data of L. litulon from 2014 to 2016 were used, as they were complete and more representative. The monthly mean nominal CPUE was calculated using both sources of data. Mean values represented nine months of the year, namely January-May and September-December, as data were not available from June to August due to the closed fishing season.
Environmental data from dataset “ii” (the bottom trawl resource survey) were used to fit the relationship between L. litulon and environmental factors. Environmental factors used in this study included surface temperature (ST), bottom temperature (BT), surface salinity (SS), bottom salinity (BS), water depth (D), and surface chlorophyll a concentration (SChl_A). Missing SChl_A data were supplemented by the MODIS_Aqua model on the NASA Ocean Color website1, and the SS and ST data were supplemented by the AQUA_MODIS model on the Physical Oceanography Distributed Active Archive Center website2. The spatial resolution of the environmental data was higher than that of the fishery data, so this study used the average value of the environmental data in each fishing area to match the spatial-temporal resolution of the L. litulon fishery datasets.
Calculation of Nominal Catch Per Unit Effort
In this study, the nominal CPUE [CPUEj, kg/(kW*d)] was calculated as follows (Maunder and Langley, 2004):
where, Cij (kg) is the total monthly catch of fishing vessel i in fishing area j, Pi (kW) is the power of operating fishing vessel i, dij is the number of days of fishing vessel i operating in fishing area j in a month, and nj is the number of all fishing vessels operating in fishing area j in a month. The resulting nominal CPUE (and catch) datasets for commercial vessel logs and trawl survey are detailed in Supplementary Tables 1, 2.
Distribution Maps
Spatial distribution contour maps of L. litulon abundance were drawn by the ordinary kriging method using Surfer16 (Golden Software, Colorado). The data used to map the species distribution are presented in Supplementary Tables 2, 3, and the annual/monthly mean nominal CPUE is given in Supplementary Tables 4, 5.
Generalized Additive Model Method
A generalized additive model (GAM) was used to express the nonlinear relationship between the relative abundance of L. litulon and various environmental factors. GAM is presented as follows (Hastie and Tibshirani, 1990; R Core Team, 2018):
where, g() is the connection function, Y is the abundance of L. litulon, β is the intercept term (as the response variable), fn(xn) is the nonparametric function used to describe the relationship between g(Y) and the nth explanatory variable, which is estimated by the spline smoothing function, n is the number of selected environmental variables, and ε is the random error term (Xiao et al., 2004).
The connection function varies according to the actual distribution of response variable Y. In this study, the connection function g(Y) = log(CPUE+1) was used as the response variable, and month, ST, BT, SS, BS, D, SChl_A, Lon, and Lat were used as explanatory variables. Month was classified as a discrete variable, and all other variables were classed as continuous. The error distribution of the model was assumed to have a Gaussian distribution. Model construction was conducted using the RStudio software.
Bayesian Schaefer Model Method
In addition to the time series of catch and abundance data, BSM also requires ancillary qualitative information, that is, priors for relative biomass, intrinsic rate of population increase (r), and carrying capacity (k). According to Froese et al. (2017), the default prior for relative biomass, B/k was set to 0.2–0.6 (medium) for the start year (Bstart/k). From FishBase (Froese and Pauly, 2019), the resilience of L. litulon is “Low,” corresponding to a prior r range of 0.05–0.5 (Froese et al., 2017). The prior range for an unexploited population size or carrying capacity (k) was calculated as:
where, klow and khigh are the lower and upper boundary priors for k for low and high levels of biomass at the end of the time series, respectively, max(C) is the maximum catch value of the time series of catch data, and rlow and rhigh are the lower and upper boundary priors of the r value.
Applying the values of r and k, and the relative biomass for the first year of the time-series of catch data (Bstart), the Monte Carlo method was used to filter out suitable r–k pairs. Basic biomass dynamics are described by the following formula:
where, Bt+1 is the exploited biomass in the subsequent year t+1, Bt is the current biomass, and Ct is the catch in year t.
If is < 0.25, Eq. (3) is replaced by the following:
where, the term assumes a linear decline in recruitment below half of the biomass capable of producing MSY. More detailed equations and concepts can be found in Froese et al. (2017).
Given that the assessment was based on just 8 years of catch and effort data, sensitivity analyses were also conducted to investigate the potential effect of the relative biomass prior (Bstart/k; 0.2–0.6) on estimates of B/BMSY and F/FMSY, compared with a higher prior (0.4–0.8) and a lower prior (0.1–0.4).
The time series of catch and CPUE are displayed in Supplementary Table 4, and the R code for the BSM method, as well as Supplementary Materials describing the method in detail, can be downloaded from R Core Team (2018).
Abundance Maximum Sustainable Yield Method
The AMSY model was used to determine the maximum sustainable yield from the abundance data. The advantage of this method is that it uses only CPUE or other relative abundance time series to evaluate the exploitation pattern and stock status without catch data (Froese et al., 2020). The required input data for the AMSY method included a time-series of CPUE and prior ranges for r and relative stock size in a given year. The time-series of CPUE data are given in Supplementary Table 4, and the method of obtaining the prior range of r was the same as described above (Froese et al., 2020). Priors for together with population dynamics and the proportional factor of upper and lower limits were used to put the observed CPUE into a preliminary MSY framework, which was then refined by Monte Carlo filtering. The AMSY method estimates the relative catch based on several transformations of the Schaefer model, which requires biomass data for two consecutive years (Froese et al., 2020); hence, the relative catch (Catch/MSY), fishing pressure (F), and exploitation level (F/FMSY) were estimated up to the second-to-last year in the time series. Froese et al. (2020) provide a detailed description of the theory and equations behind AMSY. In our contribution, sensitivity analyses similar to the BSM method were also conducted for AMSY.
Results
Resource Distribution
The spatial distribution of L. litulon abundance in Shandong coastal waters from 2012 to 2019 (except for 2017) is shown in Figure 2. Lophius litulon was caught in 70 fishing areas. The distribution features of this stock in the coastal waters of Shandong in recent years were as follows: (1) the species was widely distributed in the Yellow Sea, but was less common in the Bohai Sea; (2) the resource was concentrated in the central area of the Yellow Sea (34.0°–37.0° N, 121.0°–124.0° E); (3) L. litulon appeared in most fishing areas in 2018 and showed the highest abundance; (4) although L. litulon still showed a wide distribution in 2019, the reported stock abundance was low.
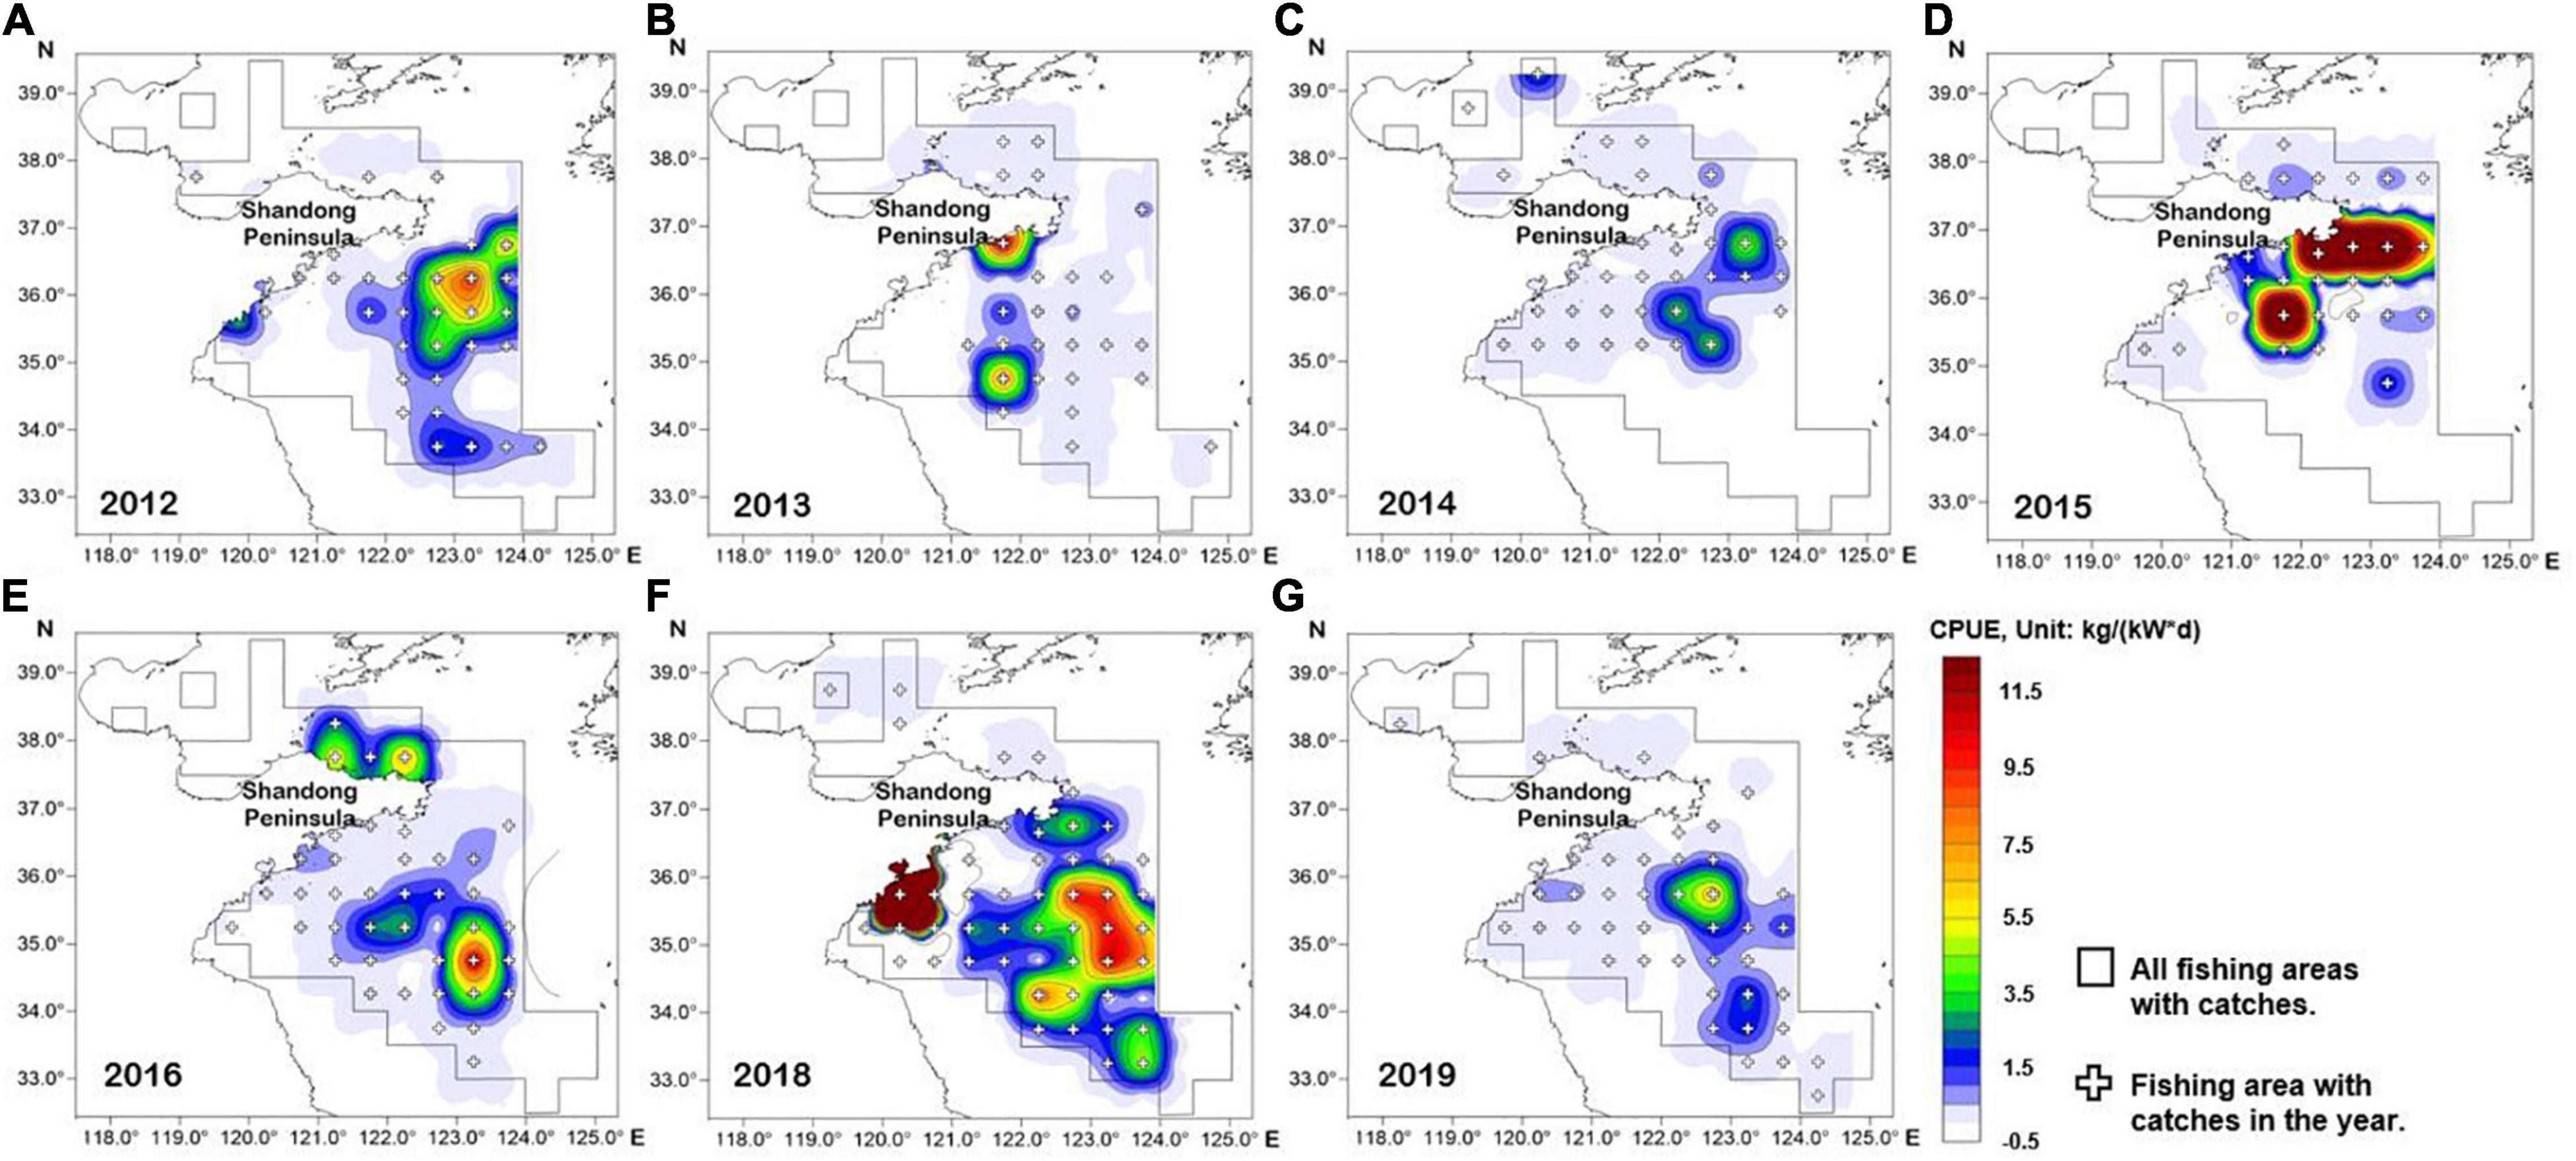
Figure 2. Spatial distribution map of Lophius litulon abundance by fishing area and year (except 2017). (A) 2012; (B) 2013; (C) 2014; (D) 2015; (E) 2016; (F) 2018; (G) 2019.
Figure 3 shows the monthly distribution of L. litulon, which was caught in 43 fishing areas. The species appeared more concentrated offshore from January to September and moved west toward the coast from October to December. The highest CPUE was usually in the central and southern coastal areas of Shandong, peaking in November and December. In January, April, May, and October, the CPUE values were low over the entire study area, with the lowest value occurring in October.
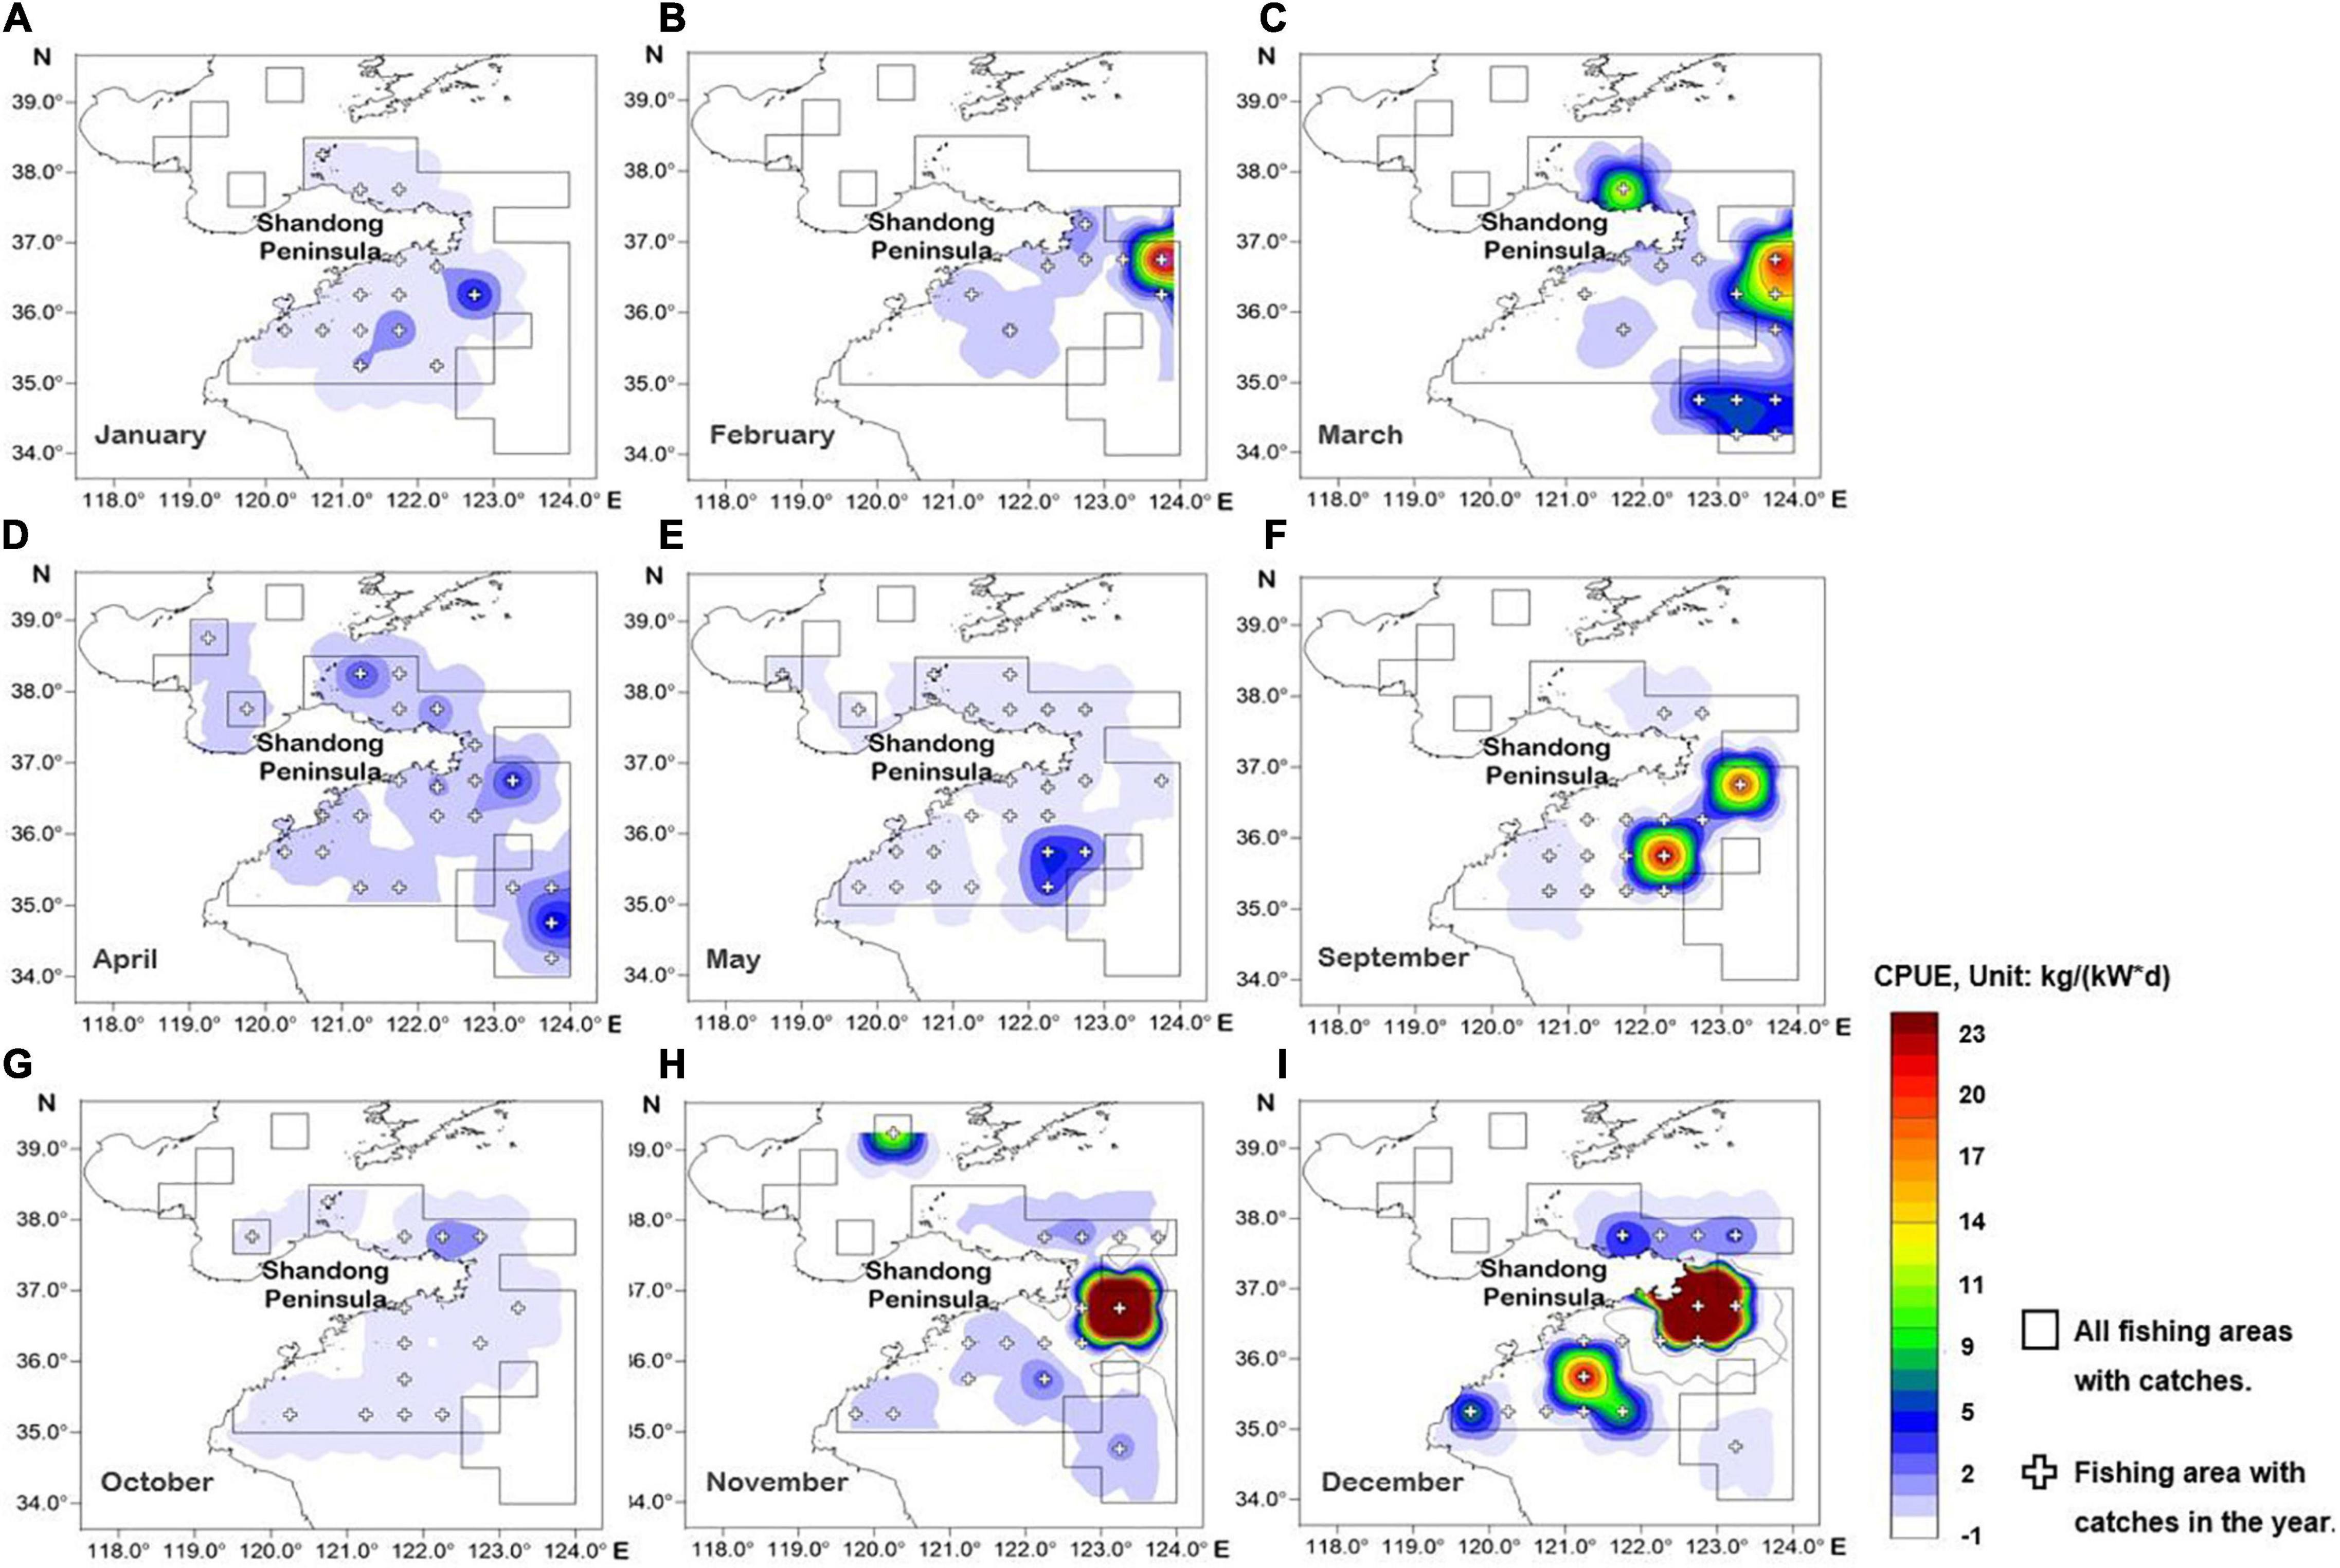
Figure 3. Spatial distribution map of Lophius litulon abundance by fishing area and month (except from June to August due to fishing closure). (A) January; (B) February; (C) March; (D) April; (E) May; (F) September; (G) October; (H) November; (I) December.
Effects of Environmental Factors
A GAM was used to fit the relationship between the relative abundance of L. litulon and environmental factors. To obtain the optimal model, impact factors were screened according to the minimum Akaike Information Criterion (AIC). The full screening process is presented in Supplementary Table 6. The final expression of the model is as follows:
Deviation analysis indicated that the cumulative deviation of the selected modeling factors was 51.70% (R = 0.446, P < 0.05). In addition to the influence of month (time factor), the F-tests showed that the environmental factor with the greatest influence was depth (D), followed by latitude (Lat), BT, BS, and longitude (Lon, Table 1). There was an extremely significant correlation between BT and the relative abundance of L. litulon (P = 0.000728).
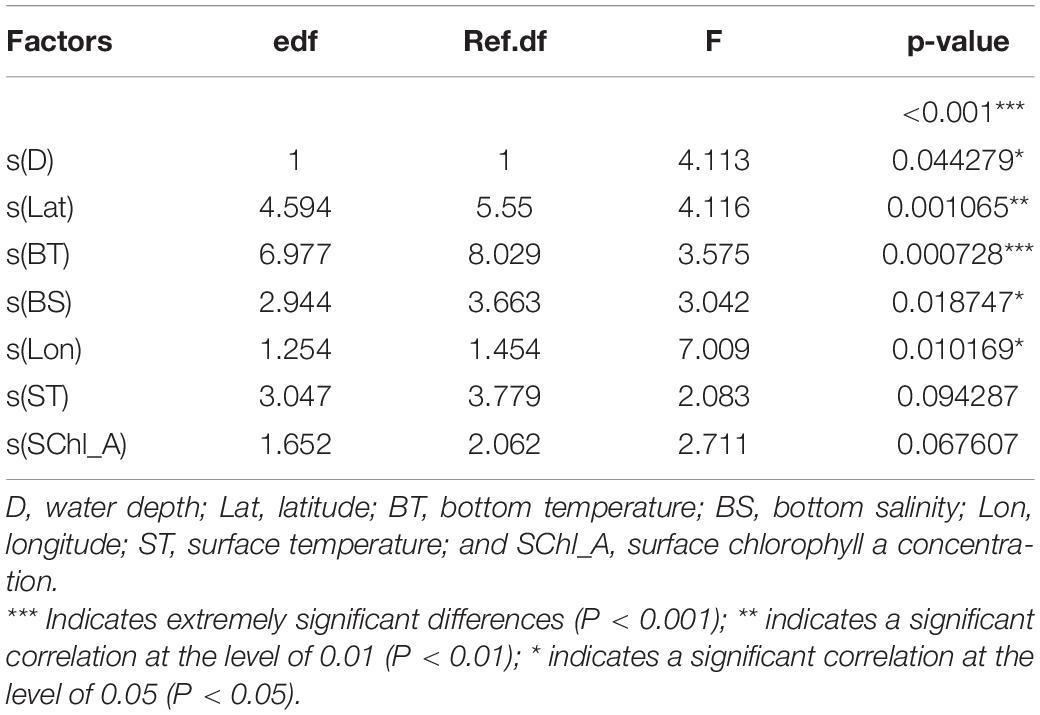
Table 1. Approximate significance of smooth terms.
Figure 4 shows the effect of environmental factors, as simulated by the GAM, on the abundance of L. litulon. Figure 4 indicates that: (1) when D was > 18 m, the abundance of L. litulon increased with D; (2) the abundance of L. litulon was higher between 35.25° and 36.00° N, and decreased north of 38.00° N; (3) L. litulon was densely distributed in the waters with BT varying between 5.8 °C and 10.6 °C; (4) as BS increased, L. litulon abundance decreased, especially in the range from 31 to 33.2‰; (5) there was a positive association between L. litulon abundance and Lon.
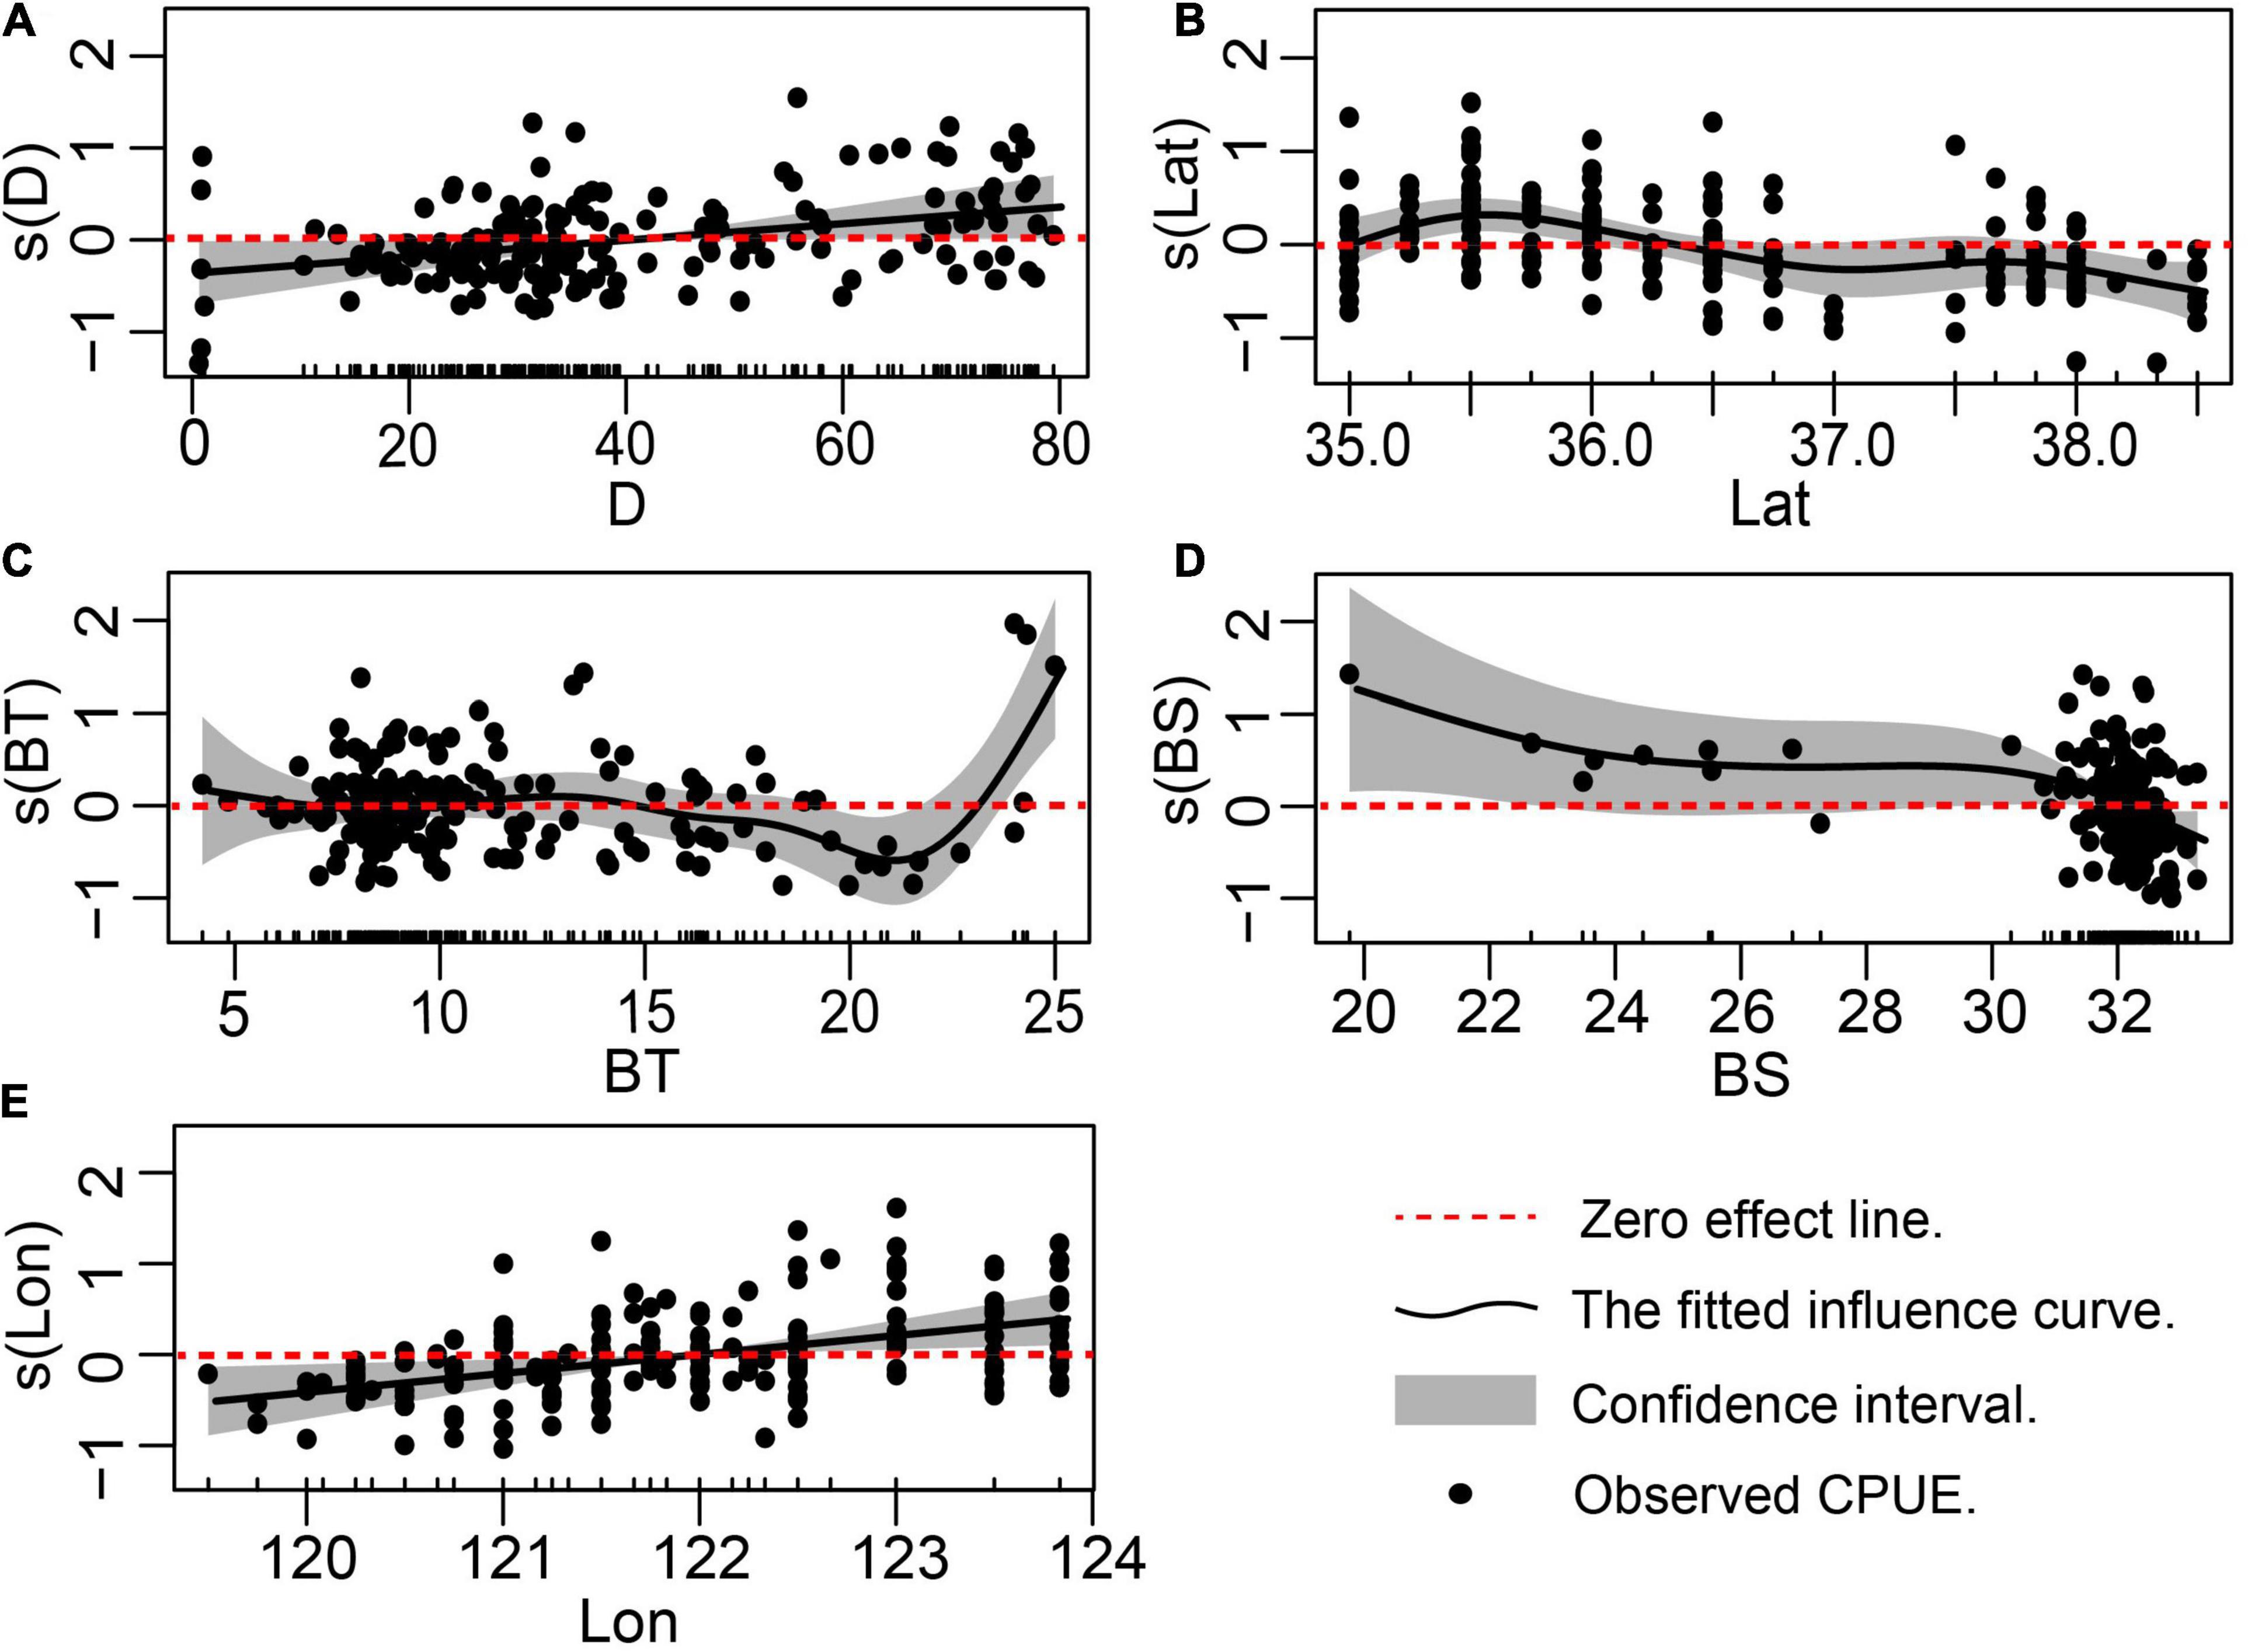
Figure 4. Effects of environmental factors on the CPUE of Lophius litulon in Shandong coastal waters. (A) Depth; (B) Latitude; (C) Bottom temperature; (D) Bottom salinity; (E) Longitude.
Resource Evaluation
The results and confidence intervals for r, k, and MSY evaluated using the BSM and AMSY methods were similar (Table 2). The exploitation rate (F/FMSY) was consistently estimated to be > 1.0, and the relative biomass (B/BMSY) in the last year was predicted to be < 1.0, which implied an unhealthy L. litulon stock status in Shandong coastal waters.
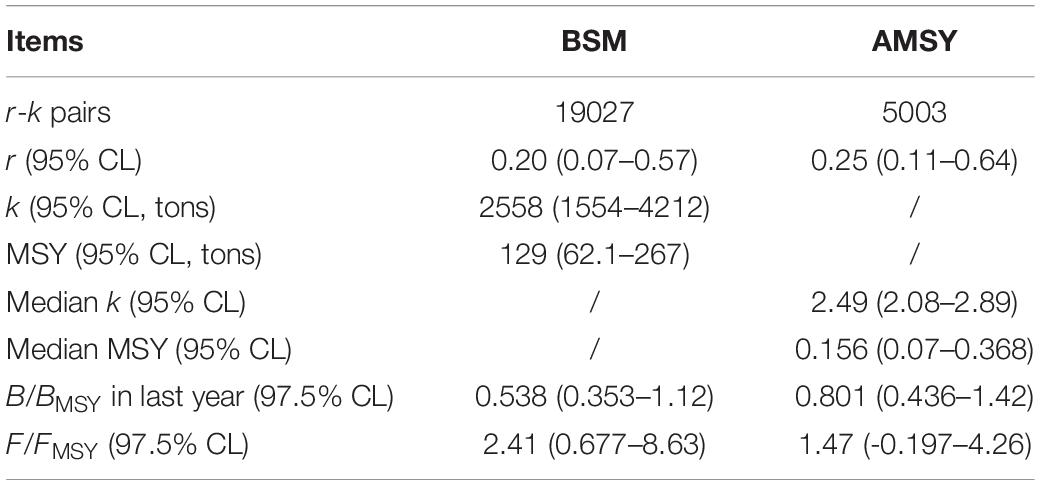
Table 2. Results of the BSM and AMSY analyses.
Figure 5A shows 19,027 feasible r-k pairs screened by BSM (black dots; gray dots for CMSY), and the darker gray cross was the best r-k pair with a 95% confidence interval (CI) (the light gray cross for CMSY). Figure 5B depicts 5003 feasible r-k pairs identified by AMSY (black dots), and the cross represents the best pair with its 95% CI. Figure 5C (estimated by the BSM method), indicates that L. litulon catches fluctuated greatly over time, with the lowest value occurring in 2013 and the highest in 2018. Figure 5D shows the time-series of CPUE data overlaid with the estimated biomass that would achieve MSY (gray line). The CPUE predicted by AMSY also exhibited significant fluctuations between 2012 and 2019, with the lowest value in 2017 and the highest in 2018.
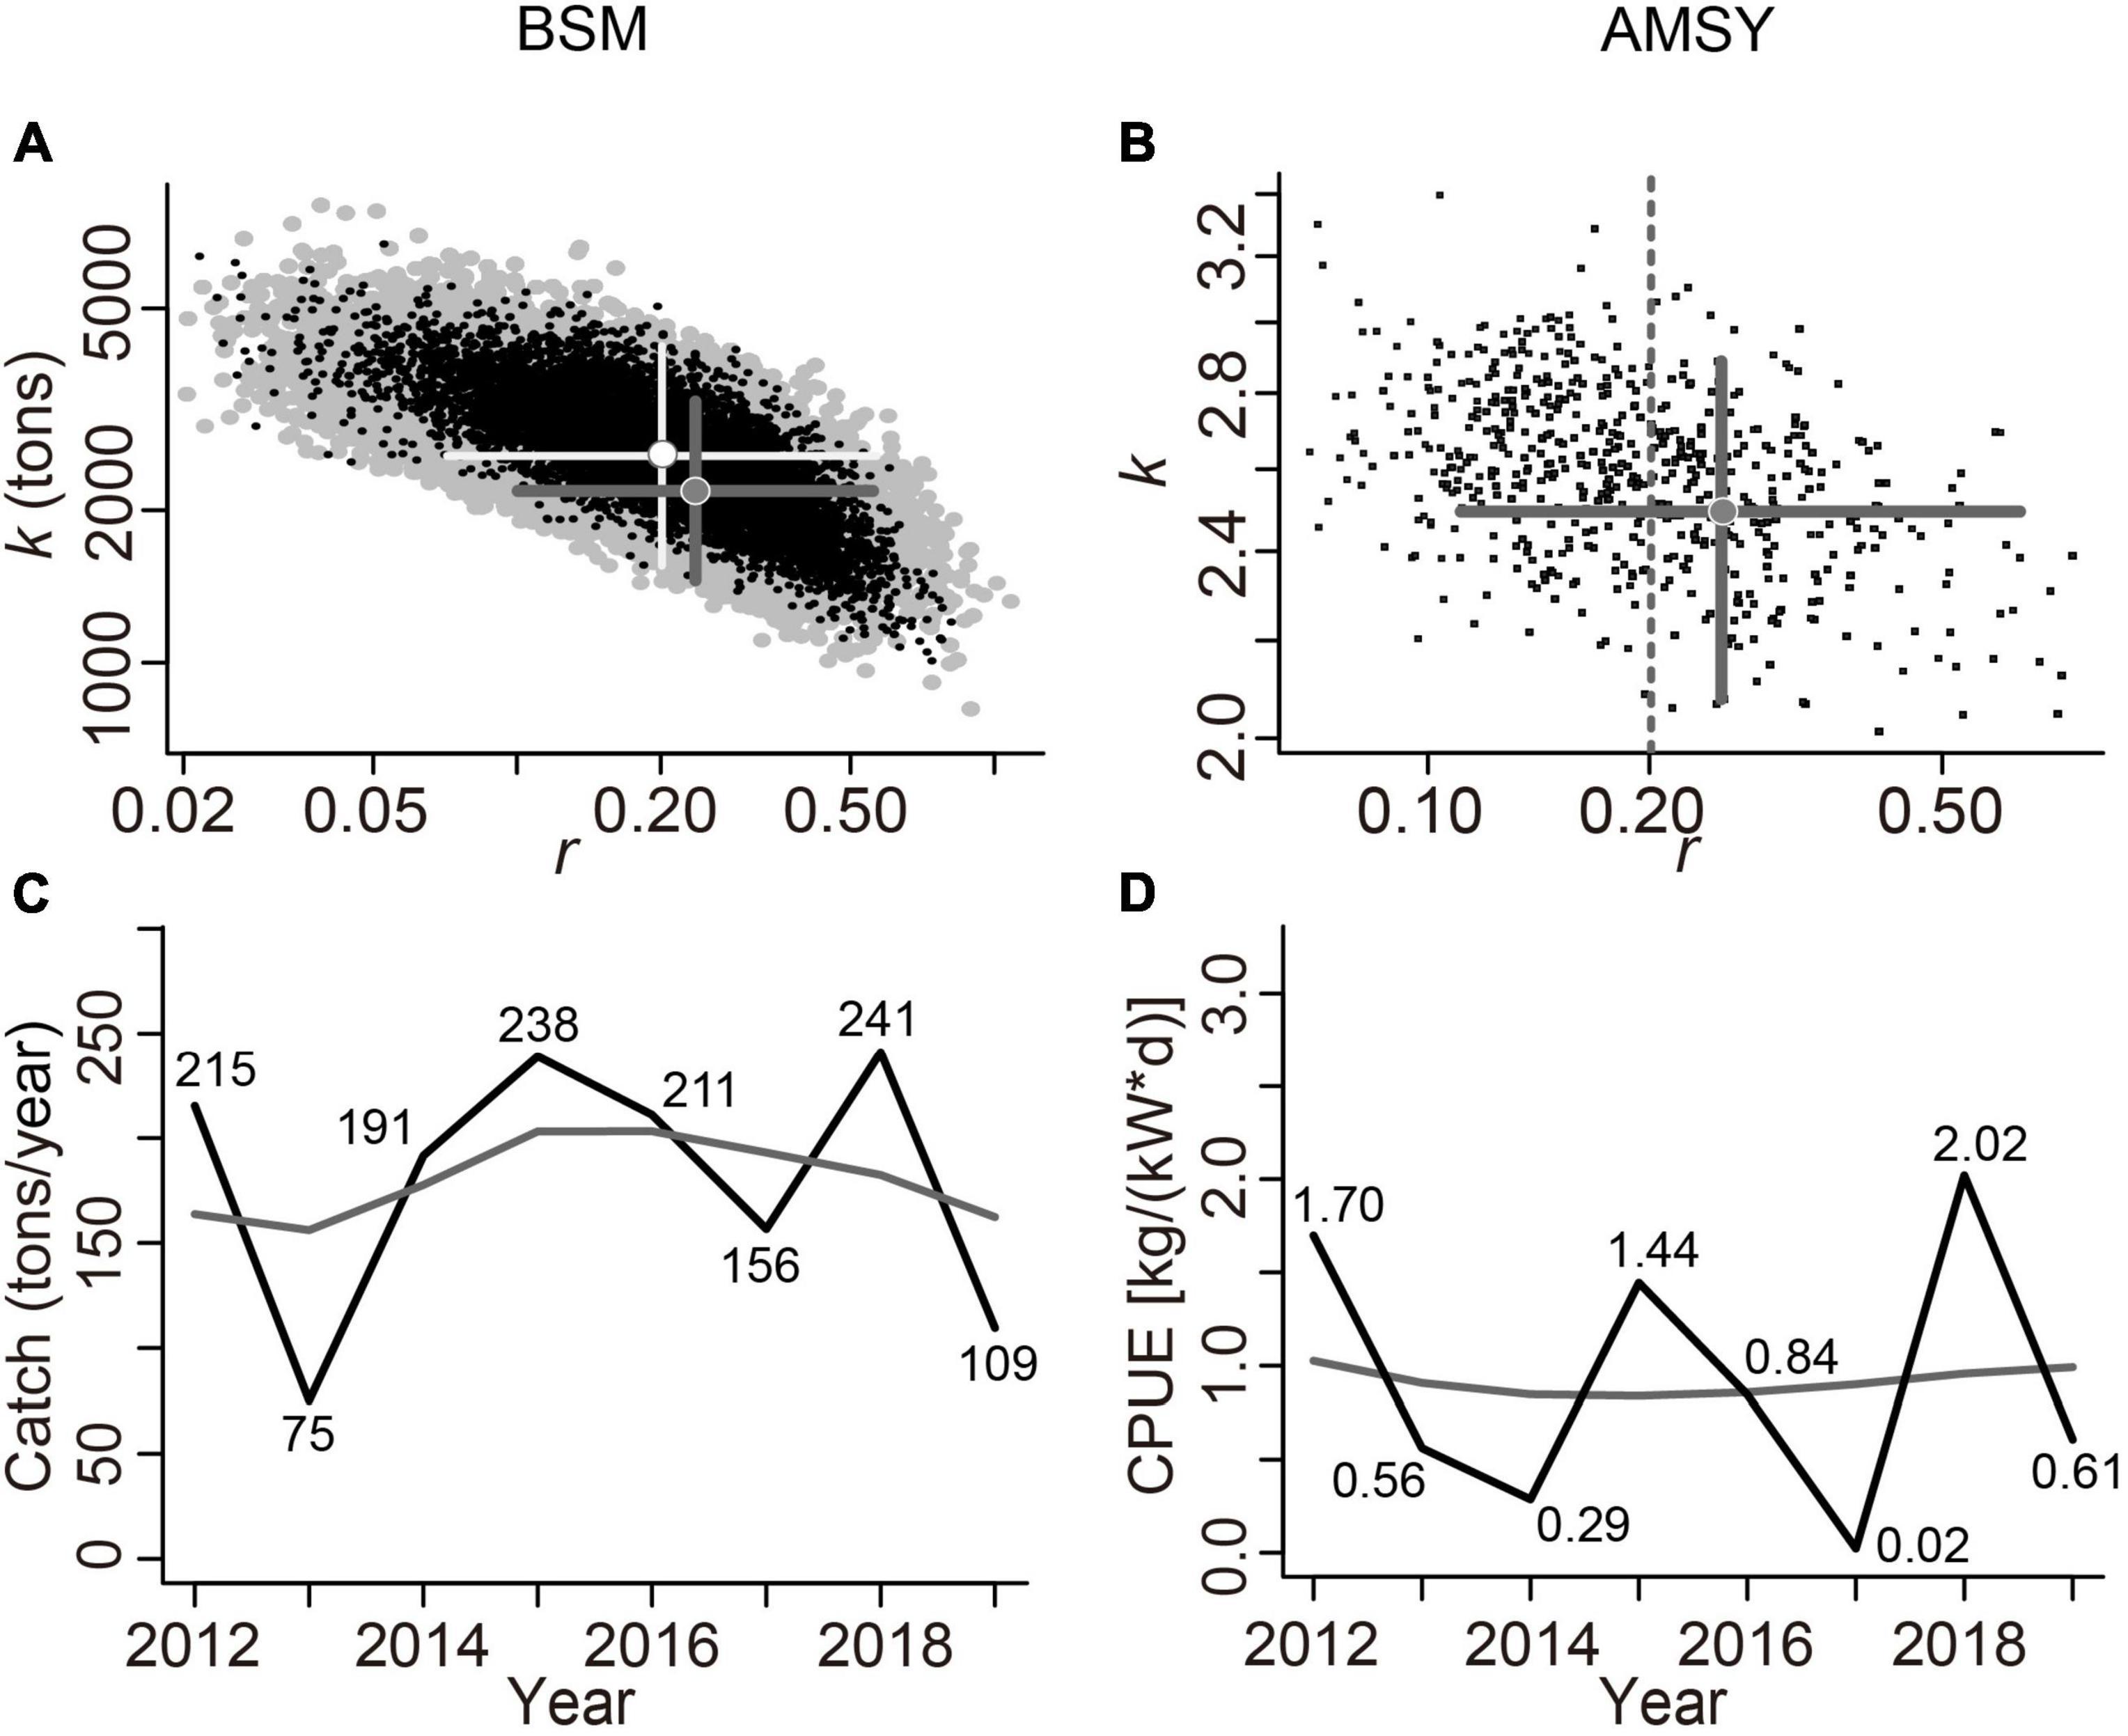
Figure 5. Analysis of viable r-k pairs and stock size (Catch for BSM related to CMSY, CPUE for AMSY) by BSM and AMSY. Notice the match between the left and right panels. (A) Feasible r-k pairs identified by BSM (in black) related to CMSY (in gray) (B) feasible r-k pairs identified by AMSY; (C) Catch (in black) relative to the MSY (in gray) estimated by BSM; (D) CPUE (in black) relative to MSY (in gray) predicted by AMSY.
The relative biomass trajectory (B/BMSY) produced by BSM is depicted in Figure 6A, and the gray area represents its 97.5% CI. B/BMSY has been declining since 2015, and the B/BMSY value in the last year of the time series was 0.538 (< 1). Figure 6B shows that the AMSY model estimated that the relative biomass trajectory (B/BMSY) decreased gradually before 2014, stabilized between 2014 and 2016, and increased gradually after 2016, but the end point of B/BMSY was 0.801 (< 1), which was closer to the level MSY. Figure 6C shows that the exploitation rate (F/FMSY) curve predicted by BSM, increased gradually after 2013, and the terminal F/FMSY value was 2.41 (> 1). Figure 6D shows that the exploitation rate estimated by AMSY gradually decreased after 2014, and the F/FMSY in the second to last year was 1.47 (> 1).
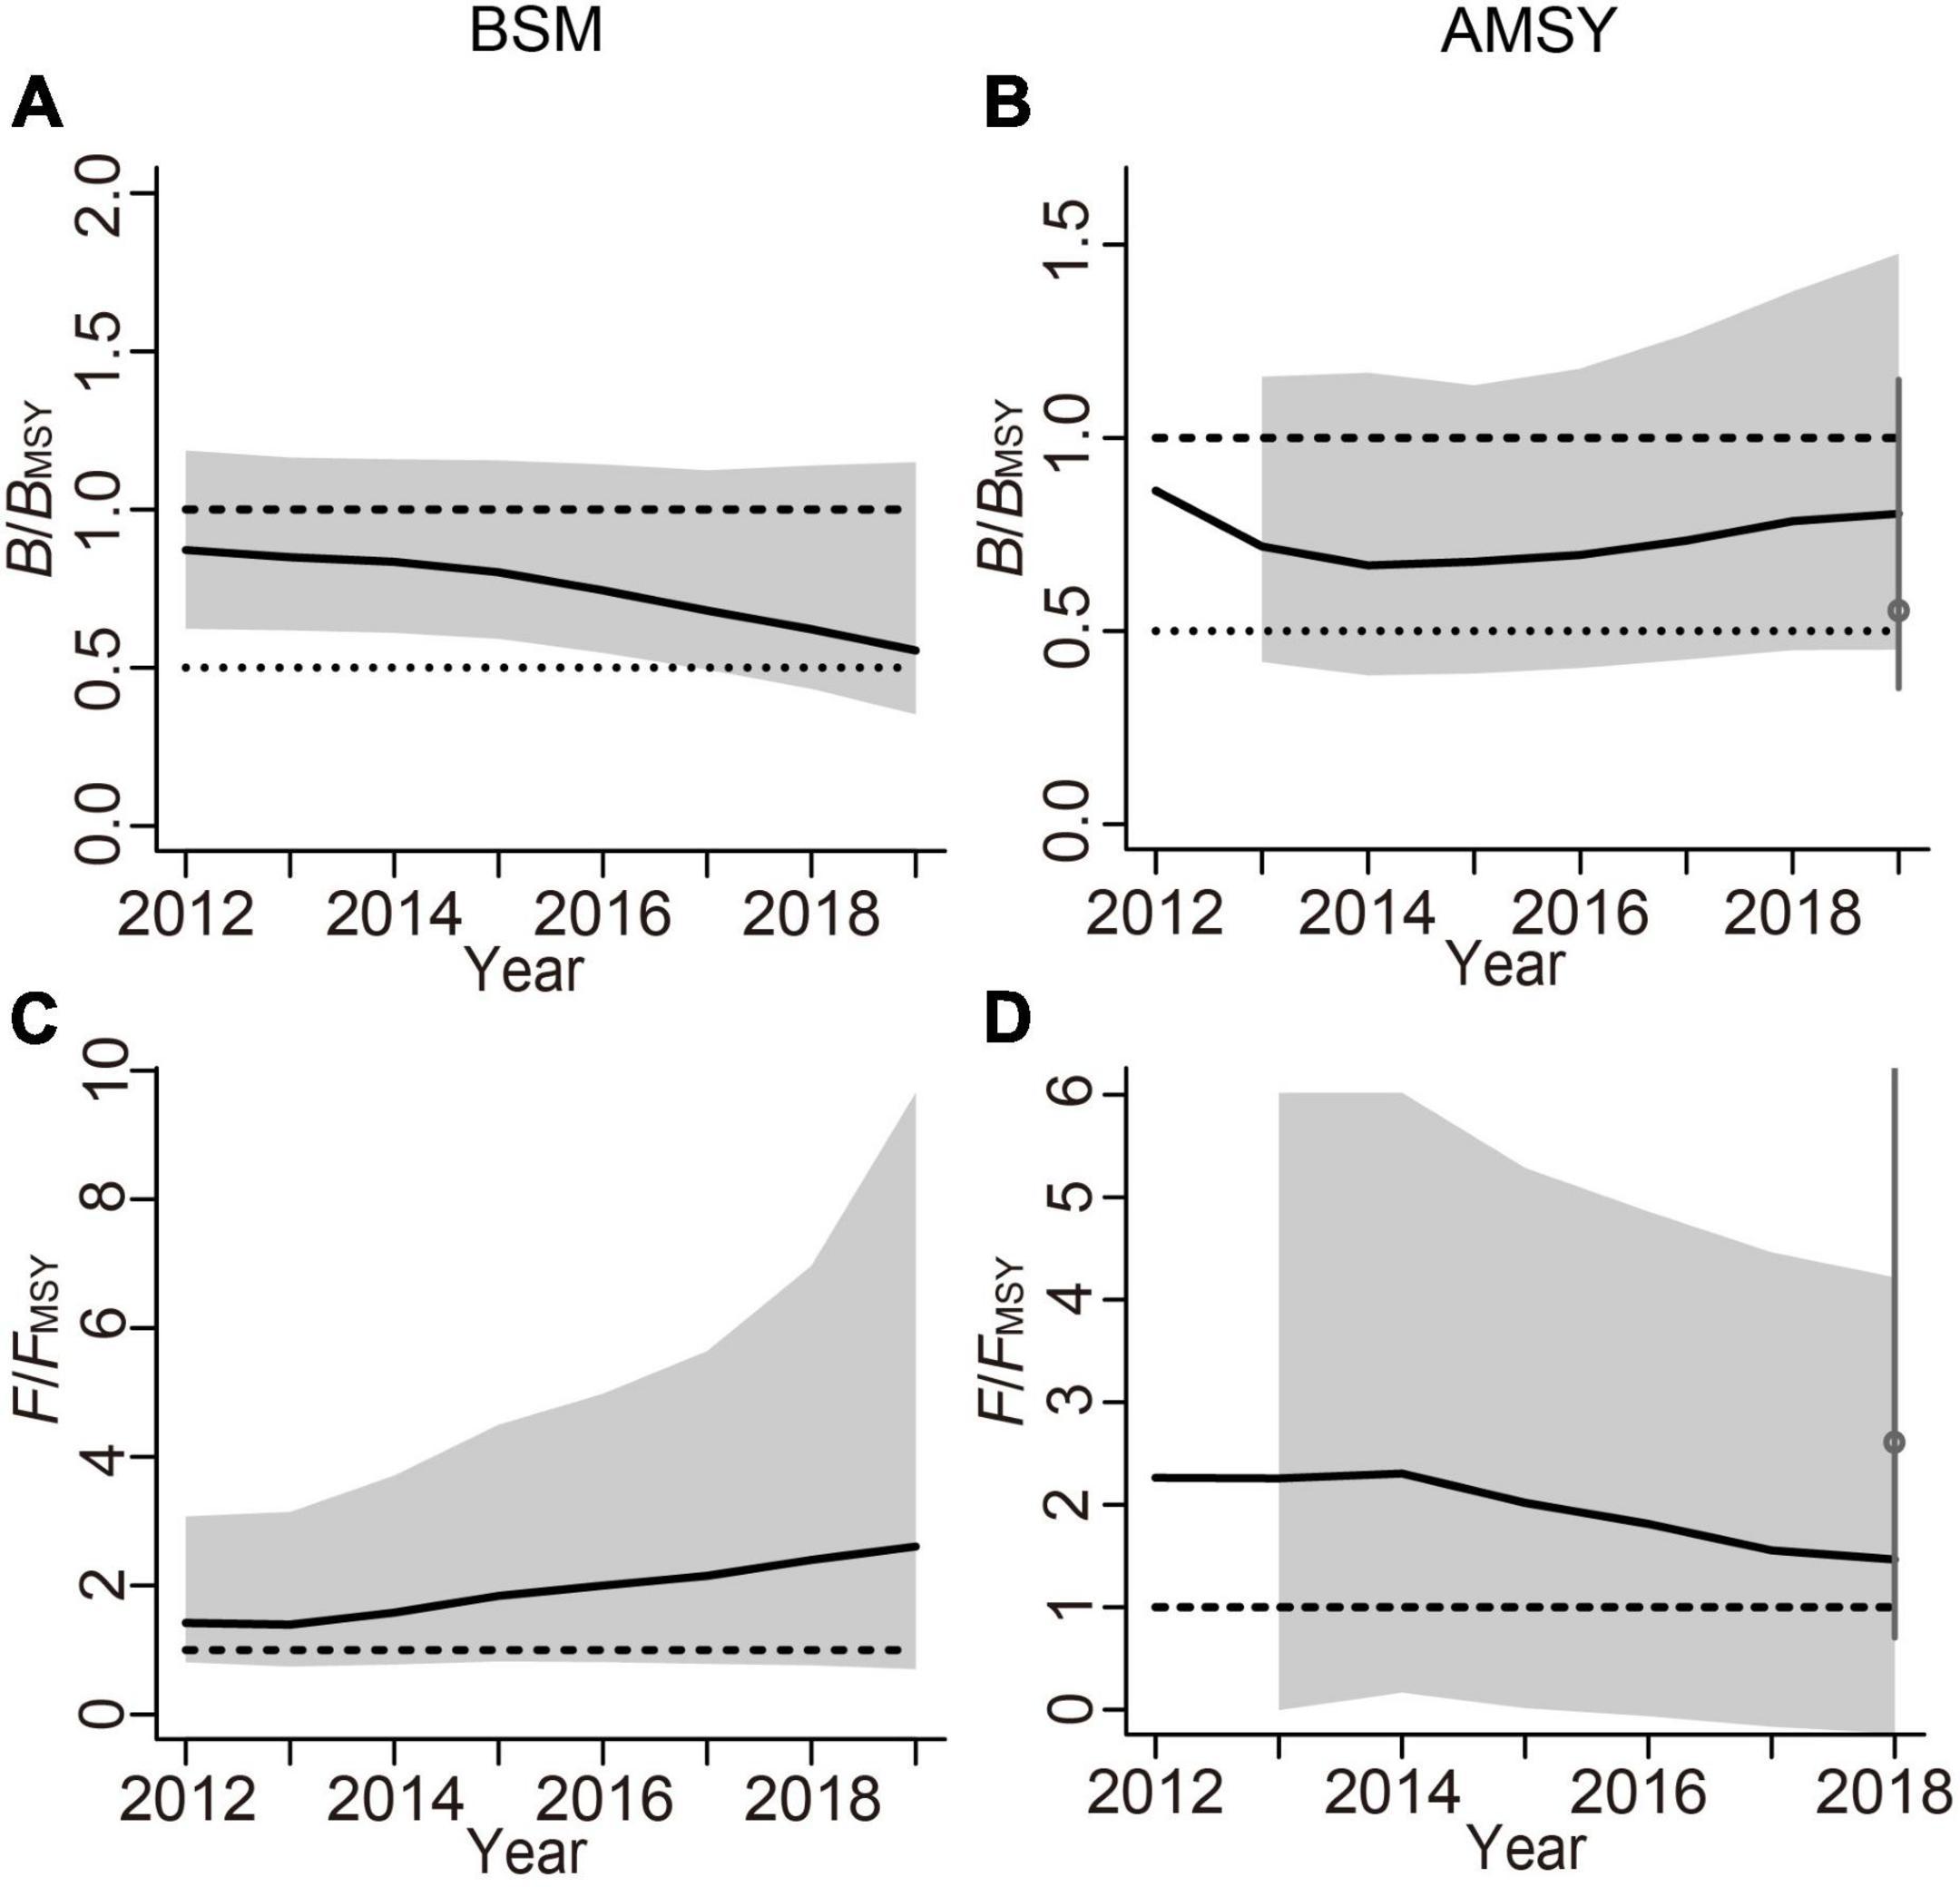
Figure 6. Comparison of relative biomass (B/BMSY) and exploitation level (F/FMSY) trajectories estimated by BSM and AMSY methods, with the gray areas representing the 97.5% CIs. (A) Relative biomass (B/BMSY) trend estimated by BSM; (B) relative biomass (B/BMSY) trend estimated by AMSY; (C) relative exploitation level (F/FMSY) trajectory predicted by BSM; (D) relative exploitation level (F/FMSY) trajectory predicted by AMSY.
The results of the sensitivity analyses are shown in Figure 7 and Supplementary Table 7, which indicate that the change in priors had a high impact on the outcome of the BSM, being very low in the AMSY model. Herein, selecting the appropriate prior values is crucial to avoid bias in the BSM estimates.
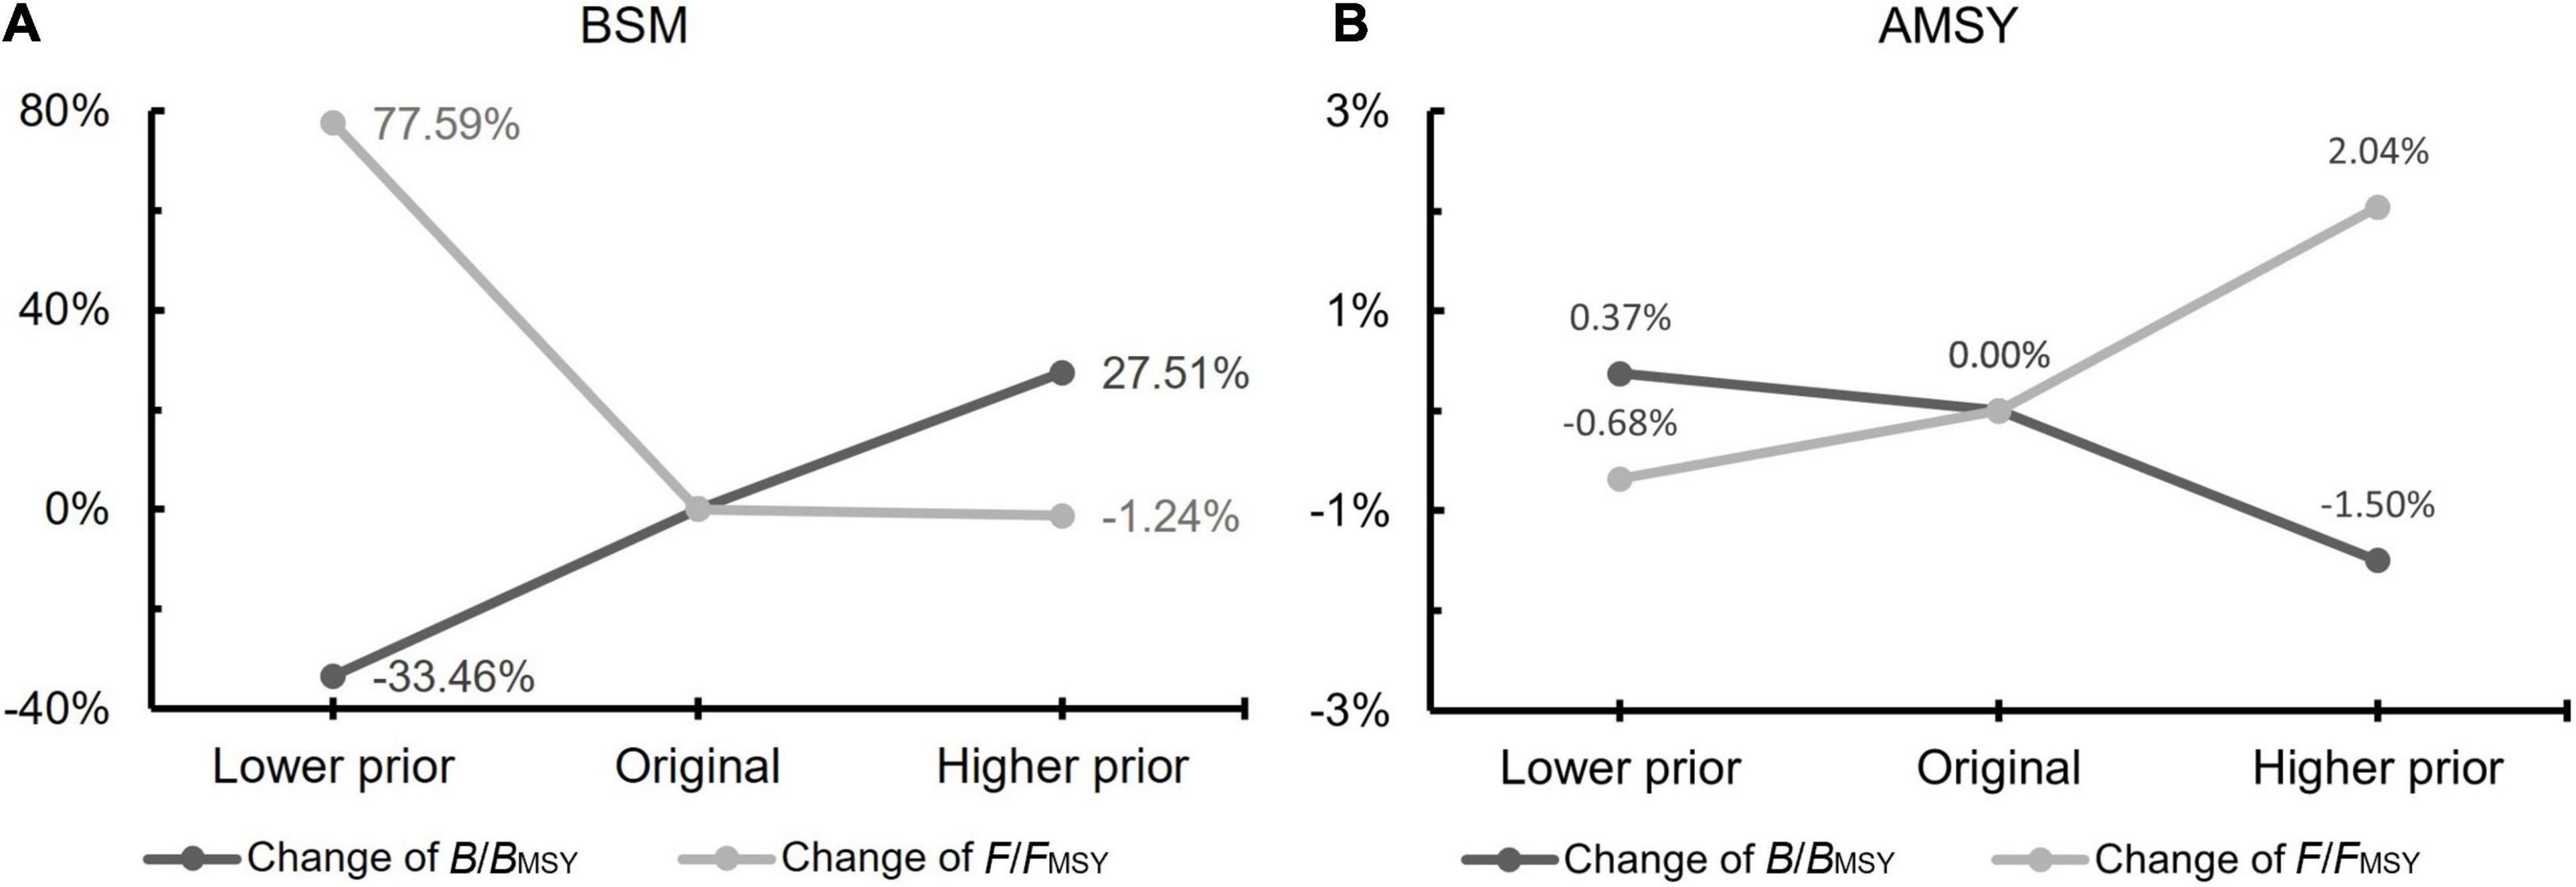
Figure 7. Sensitivity of B/BMSY and F/FMSY to changes of the priors. (A) BSM; (B) AMSY.
Discussion
Spatial-Temporal Dynamics and Environmental Influences
In this study, the marine area with the highest frequency of L. litulon occurrence from 2012 to 2019 was the central Yellow Sea (34.5°–37° N, 121°–124° E). Li Z. et al. (2015) investigated the relative resource density and distribution of L. litulon from 1985 to 2009 and found that the area with the highest density of L. litulon in the Yellow Sea was between 34°–35° N and 122°–123° E. In this study, although the mean CPUE in some years (e.g., 2014 and 2019) was lower than that in adjacent years, L. litulon was more widely distributed than in the 1985–2009 period.
During the 9 months of this study, L. litulon was widely distributed over the entire marine area from February to April, but the CPUE was low. This was possibly because spring is the spawning season for L. litulon, and either the catches comprise mostly recruits with light individual weights or the individuals are too small to be caught by nets. Conversely, the high CPUE in autumn (from September to November) might be attributed to biomass accumulated during the summer fishing moratorium.
Li et al. (2012) found that ST had a significant effect on L. litulon CPUE in the southern Yellow Sea in spring. Li Z. et al. (2015) also pointed out that the catch yield of L. litulon in the central and southern parts of the Yellow Sea was significantly correlated with the ST. This study showed that BT was the main environmental factor significantly affecting the abundance of L. litulon in the Yellow Sea. Furthermore, L. litulon was concentrated in areas of the Yellow Sea and Bohai Sea with low temperatures, high salinities, and depths >18 m. Wang et al. (2013) showed that L. litulon in Haizhou Bay and its adjacent sea areas (within the scope of this study) had a strong negative correlation with temperature, salinity, and depth in winter, but was positively related to surface pH. Herein, we suggest that further studies should consider more environmental factors to improve the accuracy of the correlation estimates. In addition, different resource-modeling approaches should be developed and adopted.
Stock Status and Suggestions for Sustainable Development
In many developing countries, including China, most of the species caught on a large scale have not yet been assessed, nor do they have an adaptive management plan to guarantee their sustainable use and protection (Costello et al., 2012). Stock assessments are generally lacking for fish that gradually become a dominant part of the catch and progressively increase their economic value, as is the case for L. litulon.
In 2002, the total annual catch of L. litulon in the East China Sea was ranked ninth of 153 species, accounting for 1.14% of the total catch, and its existing stock size was estimated to exceed 2,000 tons (Lin and Zheng, 2004). The frequency and relative resource density of L. litulon in the central and southern Yellow Sea showed an increase from 1985 to 2009 (Li Z. et al., 2015). However, owing to the strong fishing pressure in the south of the Yellow Sea, the caught individuals of L. litulon became smaller and the population structure became younger (Li Z. et al., 2015).
In this study, the results of the BSM and AMSY approaches showed that, although there were some differences in precision and biomass trajectories between different methods, the same conclusions were evident. That is, the population of L. litulon is now in an unhealthy and overfished state, and the biomass remains below the level that can produce MSY. Our results are consistent with the findings of Wang et al. (2020), indicating that the resource status of L. litulon is unacceptable in the coastal waters off Shandong.
Interestingly, the BSM showed that the status of L. litulon stock is worsening, while the AMSY model suggested it is improving. Although AMSY uses the surplus yield model of the filtered r-k pairs to predict catches that conform to the CPUE time series and the priors, its estimates of the exploitation index (F/FMSY) are normally given with wide margins of uncertainty (Froese et al., 2020). The accuracy and applicability of AMSY will be affected by how closely the stock abundance and catch follow the assumptions of the surplus yield model, so it may be less suitable than BSM for management purposes. Nevertheless, AMSY should be well suited for estimating the productivity index (r) and relative stock size (B/BMSY), so it may be useful in the management of data-poor stocks. Furthermore, sensitivity analysis demonstrated that the BSM was more sensitive to the initial relative biomass prior than AMSY. In other words, B/BMSY and F/FMSY estimates generated by the BSM model were greatly affected by the selection of priors, which might be attributed to the short time series of catch and CPUE used in this study. In such cases, reasonable prior ranges are important for obtaining reliable estimates.
Since the early 1990s, China has adopted a series of fisheries management systems to develop and protect its marine resources, including fishing moratoria, fishing permits, fishing effort controls, quota systems, and resource allocation. However, declines in marine fishery resources continue to occur. Therefore, cautious management of L. litulon resources in coastal waters of China is required.
Data Availability Statement
The original contributions presented in the study are included in the article/Supplementary Material, further inquiries can be directed to the corresponding authors.
Ethics Statement
Ethical review and approval was not required for the animal study because our data are sourced from existing fisheries data.
Author Contributions
ZZ completed the data collection and analysis and wrote the first draft. YW provided guidance on research methods and writing ideas and participated in data processing. YW, CL, and WX conceived and designed the study, and revised the first draft. SL provided the data. All authors contributed to the manuscript and approved the submitted version.
Funding
This research was funded by grants from the National Natural Science Foundation of China (31872568 and 41976094), the Natural Science Foundation of China-Shandong Joint Fund for Marine Ecology and Environmental Sciences (U1606404), and Open Fund of CAS Key Laboratory of Marine Ecology and Environmental Sciences, Institute of Oceanology, Chinese Academy of Sciences (KLMEES202004).
Conflict of Interest
The authors declare that the research was conducted in the absence of any commercial or financial relationships that could be construed as a potential conflict of interest.
Publisher’s Note
All claims expressed in this article are solely those of the authors and do not necessarily represent those of their affiliated organizations, or those of the publisher, the editors and the reviewers. Any product that may be evaluated in this article, or claim that may be made by its manufacturer, is not guaranteed or endorsed by the publisher.
Supplementary Material
The Supplementary Material for this article can be found online at: https://www.frontiersin.org/articles/10.3389/fmars.2022.759591/full#supplementary-material
Footnotes
- ^ https://oceancolor.gsfc.nasa.gov/l3
- ^ https://coastwatch.pfeg.noaa.gov/erddap/griddap/index.html?page=1&itemsPerPage=1000
References
Costello, C., Ovando, D., Clavelle, T., Strauss, C., Hilborn, R., Melnychuck, M., et al. (2016). Global fishery prospects under contrasting management regimes. Proc. Natl. Acad. Sci. U.S.A. 113, 5125–5129. doi: 10.1073/pnas.1520420113
Costello, C., Ovando, D., Hilborn, R., Gaines, S. D., Deschenes, O., and Leater, S. E. (2012). Status and solutions for the world’s unassessed fisheries. Science 338, 517–520. doi: 10.1126/science.1223389
Fisheries and Fisheries Administration (2010). China Fishery Statistical Yearbook 2010. Beijing: China Agriculture Press.
Fisheries and Fisheries Administration (2019). China Fishery Statistical Yearbook 2019. Beijing: China Agriculture Press.
Fisheries and Fisheries Administration (2020). China Fishery Statistical Yearbook 2020. Beijing: China Agriculture Press.
Froese, R., Demirel, N., Coro, G., Kleisner, K. M., and Winker, H. (2017). Estimating fisheries reference points from catch and resilience. Fish Fish. 18, 506–526. doi: 10.1111/faf.12190
Froese, R., and Pauly, D. (eds) (2019). FishBase. World Wide Web Electronic Publication. Available online at: www.fishbase.org
Froese, R., Winker, H., Coro, G., Demirel, N., Tsikliras, A. C., Dimarchopoulou, D., et al. (2018). Status and rebuilding of European fisheries. Mar. Policy 93, 159–170. doi: 10.1016/j.marpol.2018.04.018
Froese, R., Winker, H., Coro, G., Demirel, N., Tsikliras, A. C., Dimarchopoulou, D., et al. (2020). Estimating stock status from relative abundance and resilience. ICES J. Mar. Sci. 77, 527–538. doi: 10.1093/icesjms/fsz230
Gonzalez, G. M., Wiff, R., Marshall, C. T., and Cornulier, T. (2021). Estimating spatio-temporal distribution of fish and gear selectivity functions from pooled scientific survey and commercial fishing data. Fish. Res. 243:106054. doi: 10.1016/j.fishres.2021.106054
Huang, S. (2012). Analysis on the development of marine fisheries in Shandong Province. Chin. Fish. Econ. 30, 98–103.
Ji, G., Gao, T., and Takashi, Y. (2007). Morphological difference sand isozyme variations between Lophius litulon of Yellow Sea and Japan Sea. Mar. Fish. Res. 28, 73–79.
Kim, J., Choi, I., Kim, J., Choi, S., and Chun, Y. (2007). Factors affecting the wintering habitat of major fishery resources in southwestern Korean waters. Ocean Sci. J. 42, 41–48. doi: 10.1007/BF03020909
Li, F., Zhou, X., Zhang, L., Ren, Z. H., and Lü, Z. B. (2015). Taxonomic diversity of fish assemblages in coastal waters off Shandong. Acta Ecol. Sin. 35, 2322–2330. doi: 10.5846/stxb201306101579
Li, X., Wang, K., Xu, B., Xue, Y., Yiping, R., and Zhang, C. (2021). Annual variation of species composition and spatial structure of fish community in Shandong coastal waters. J. Fish. Sci. China 45, 552–562. doi: 10.11964/jfc.20200312206
Li, Y., Zhang, C., Ji, Y., Xue, Y., Xu, B., and Ren, Y. (2021). Spatio-temporal distribution of Larimichthys polyactis in southern waters off the Shandong Peninsula and its relationship with environ mental factors. J. Fish. Sci. China 28, 442–450. doi: 10.12264/JFSC2020-0288
Li, Z., Shan, X., Jin, X., Dai, F., and Lu, H. (2015). Interannual variations in the biological characteristics, distribution and stock density of anglerfish Lophius litulon in the central and southern Yellow Sea Interannual variations in the biological characteristics, distribution and stock density of anglerfish Lophius litulon in the central and southern Yellow Sea. Acta Ecol. Sin. 35, 4007–4015. doi: 10.5846/stxb201310262585
Li, Z., Ye, Z., Zhang, C., and Zhuang, L. (2012). Effects of environmental factors on catch distribution of stow net Pseudosciaena polyactis and Lophius litulon in southern Yellow Sea in spring. J. Appl. Ecol. 23, 2887–2892. doi: 10.13287/j.1001-9332.2012.0394
Lin, L. S., and Zheng, Y. J. (2004). Preliminary research on stock of Lophius litulon in the East China Sea region. Mar. Fish. 26, 176–183.
Ma, Y., Xu, B., Zhang, C., Yu, H., Xue, Y., and Ren, Y. (2021). Spatio-temporal distribution and standardization of CPUE for Scomberomorus niphonius pair trawler fishery in the Yellow and Bohai Seas. J. Fish. Sci. China 28, 493–502. doi: 10.12264/JFSC2020-0257
Maunder, M. N., and Langley, A. D. (2004). Integrating the standardization of catch-per-unit-of-effort into stock assessment models: testing a population dynamics model and using multiple data types. Fish. Res. 70, 389–395. doi: 10.1016/j.fishres.2004.08.015
Michiol, Y., Muneharu, T., Hiroshi, H., Keisuke, Y., Michiya, M., and Shuhei, M. (2002). Spawning migration of the anglerfish Lophius litulon in the East China and Yellow seas. Fish. Sci. 68, 310–313. doi: 10.2331/fishsci.68.sup1_310
Palomares, M. L., Froese, R., Derrick, B., Nöel, S., Tsui, G., Woroniak, J., et al. (2018). A Preliminary Global Assessment of the Status of Exploited Marine Fish and Invertebrate Populations. A Report Prepared by the Sea Around Us for OCEANA. Vancouver, BC: The University of British Columbia.
Pecquerie, L., Drapeau, L., Fréon, P., Coetzee, J. C., Leslie, R. W., and Griffiths, M. H. (2004). Distribution patterns of key fish species of the southern Benguela ecosystem: an approach combining fishery-dependent and fishery-independent data. Afr. J. Mar. Sci. 26, 115–139. doi: 10.2989/18142320409504053
R Core Team (2018). A Language and Environment for Statistical Computing. Vienna: R Foundation for Statistical Computing.
Ricard, D., Minto, C., Jensen, O. P., and Baum, J. K. (2012). Examining the knowledge base and status of commercially exploited marine species with the RAM legacy stock assessment database. Fish Fish. 13, 380–398. doi: 10.1111/j.1467-2979.2011.00435
Wang, S. B., Song, Y., and Li, P. (2006). Current situation of China fishery resources and countermeasures for the sustainable development. Chin. Fish. Econ. 1, 24–27.
Wang, X., Xu, B., Yupeng, J., and Ren, Y. (2013). Fish community structure and its relationships with environmental factors in Haizhou Bay and adjacent waters of East China in winter. Chin. J. Appl. Ecol. 24, 1707–1714. doi: 10.13287/j.1001-9332.2013.0350
Wang, Y., Wang, Y., Liu, S., Liang, C., Zhang, H., and Xian, W. (2020). Stock assessment using LBB method for eight fish species from the Bohai and Yellow Seas. Front. Mar. Sci. 7:164. doi: 10.3389/fmars.2020.00164
Watson, R., Cheung, W., Anticamara, J., Sumaila, U., Zeller, D., and Pauly, D. (2013). Global marine yield halved as fishing intensity redoubles. Fish Fish. 14, 493–503. doi: 10.1111/j.1467-2979.2012.00483
Xiao, Y., Punt, A. E., Millar, R. B., and Quinn, T. J. (2004). Models in fisheries research: GLMs, GAMs and GLMMs. Fish. Res. 70, 137–139. doi: 10.1016/j.fishres.2004.08.001
Xu, K., He, Z., Zhu, W., Li, P., and Zhang, S. (2010). Distribution pattern of Lophius litulon and its’ relationship with environmental factors in the south Yellow Sea and north East China Sea. Mar. Fish. 32, 59–65. doi: 10.13233/j.cnki.mar.fish.2010.01.010
Xue, Y., Jin, X., Zhao, X., Liang, Z., and Li, X. (2007). Food consumption by the fish community in the central and southern Yellow Sea in autumn. J. Ocean Univ. China 37, 75–82. doi: 10.16441/j.cnki.hdxb.2007.01.014
Zhang, X., Cheng, J., Shen, W., Liu, Z., and Yuan, X. (2011). Reproductive biology of yellow goosefish Lophius litulon. J. Fish. Sci. China 18, 290–298. doi: 10.3724/SP.J.1118.2011.00290
Zhang, Y., and Qiu, S. (2019). A preliminary study on current situation of fishery resources in Shandong offshore. Nat. Sci. Eng. Ed. 32, 61–67. doi: 10.13951/j.cnki.37-1213/n.2019.01.011
Keywords: Lophius litulon, spatial-temporal distribution, stock assessment, data-limited methods, BSM, AMSY
Citation: Zhang Z, Wang Y, Liu S, Liang C and Xian W (2022) Assessing the Distribution and Sustainable Exploitation of Lophius litulon in Marine Areas Off Shandong, China. Front. Mar. Sci. 9:759591. doi: 10.3389/fmars.2022.759591
Received: 16 August 2021; Accepted: 03 January 2022;
Published: 08 February 2022.
Edited by:
Giuseppe Scarcella, National Research Council (CNR), ItalyReviewed by:
Fabio Fiorentino, Institute for Biological Resources and Marine Biotechnology, National Research Council (CNR), ItalyBin Xia, Qingdao Agricultural University, China
Copyright © 2022 Zhang, Wang, Liu, Liang and Xian. This is an open-access article distributed under the terms of the Creative Commons Attribution License (CC BY). The use, distribution or reproduction in other forums is permitted, provided the original author(s) and the copyright owner(s) are credited and that the original publication in this journal is cited, in accordance with accepted academic practice. No use, distribution or reproduction is permitted which does not comply with these terms.
*Correspondence: Cui Liang, bGlhbmdjQHFkaW8uYWMuY24=; Weiwei Xian, d3d4aWFuQHFkaW8uYWMuY24=
†These authors have contributed equally to this work and share first authorship