 Georgina A. Gibson
 Scott Elliot2
 Jaclyn Clement Kinney
 Anastasia Piliouras
- 1International Arctic Research Center, University of Alaska, Fairbanks, AK, United States
- 2Climate Ocean Sea Ice Modeling (COSIM), Los Alamos National Laboratory, MS D-401, Los Alamos, NM, United States
- 3Department of Oceanography, Naval Postgraduate School, Monterey, CA, United States
- 4Computer, Computational, and Statistical Sciences Division, Los Alamos National Laboratory, Los Alamos, NM, United States
The Arctic coastal margin receives a disproportionately large fraction of the global river discharge. The bio-geochemistry of the river water as it empties into the marine environment reflects inputs and processes that occur as the water travels from its headwaters. Climate-induced changes to Arctic vegetation and permafrost melt may impact river chemistry. Understanding the impact of river nutrients on coastal marine production, and how this may change in the future, are important for resource managers and community members who monitor and rely on coastal food resources. Using the Energy Exascale Earth System Model we explore the impact of timing and river nutrient concentrations on primary production in each coastal Arctic region and then assess how this influences secondary production and particle fluxes supporting the benthic food web. Our results indicate that while the concentration of Arctic river nitrogen can have a significant impact on annual average nitrogen and primary production in the coastal Arctic, with production increases of up to 20% in the river influenced interior Seas, the timing of the river nutrient inputs into the marine environment appears less important. Bloom timing and partitioning between small and large phytoplankton were minimally impacted by both river nutrient concentration and timing, suggesting that in general, coastal Arctic ecosystem dynamics will continue to be primarily driven by light availability, rather than nutrients. Under a doubling river nutrient scenario, the percentage increase in the POC flux to the benthos on river influenced Arctic coastal shelves was 2-4 times the percentage increase in primary production, suggesting changes to the river nutrient concentration has the potential to modify the Arctic food web structure and dynamics. Generally, the nutrient-induced changes to primary production were smaller than changes previously simulated in response to ice reduction and temperature increase. However, in the Laptev Sea, the production increase resulting from a doubling of river nutrients exceeded the production increase simulated with an atmospheric warming scenario. Dissolved organic carbon is presently poorly represented in the model so its impact on production is hard to simulate. Applying established relationships between modeled DOC, total DOC, and light absorption we illustrate that DOC could play a very important role in modulating production. Our findings highlight the importance of developing more realistic river nutrient and discharge forcing for Earth System Models such that their impact on the critical Arctic coastal domain can be more adequately resolved.
Introduction
The Arctic Ocean only constitutes about 1% of the global ocean volume (Menard and Smith, 1966), but the entire Arctic coastal margin is about 200,000 km long and the Arctic Ocean receives a disproportionately large fraction (~10%) of the global river discharge (Aagaard and Carmack, 1989; Lammers et al., 2001). As such, the coastal Arctic will likely experience disproportionately large climate-induced changes at the land-sea interface. The nature and extent of these changes can be hard to predict due to complex physical, biological, and chemical interactions between the land, rivers, ocean, sea ice, and seafloor. Broad-scale regional changes including reduced ice cover (Arrigo et al., 2008; Pabi et al., 2008; Arrigo and Van Dijken, 2015; Frey et al., 2020; Gibson et al., 2020) and increased vertical nitrate supply (Henley et al., 2020; Randelhoff et al., 2020) have been shown to increase marine productivity in the Arctic. The impact of climate-induced variability in river inputs, including volume discharge and carbon and nutrient loadings on marine productivity is less well studied, but this relatively localized process has the potential to significantly alter marine productivity and food web dynamics, particularly in the coastal zone.
The bio-geochemistry of the riverine flow to the marine environment reflects inputs and processes that occur as the water travels from its headwaters until it empties into the ocean, a journey which could be many hundreds of miles and pass through a wide variety of terrain and geology. This is especially true for many of the larger Arctic rivers like the Lena, Ob, Yenisey, Mackenzie, and Yukon whose headwaters originate well south of the Arctic. A large portion of the freshwater input into the coastal Arctic originates as snowfall that accumulates over many months and then melts rapidly in the spring when solar radiation increases (Wrona et al., 2005). The presence of permafrost limits the ground infiltration of runoff, resulting in a condensed period, from May through July, of rapid overland flow (Dittmar and Kattner, 2003). This flow, over and within the shallow active layer of the taiga and tundra soils, brings abundant organic substances to the rivers throughout spring and summer (Khosh et al., 2017). Conversely, in winter, Arctic rivers are fed primarily by groundwater, rich in nutrients but poor in organic matter. Therefore, nitrate concentrations in Arctic rivers generally are at a minimum in summer and a maximum in winter and early spring, while dissolved organic carbon and nitrogen concentrations parallel water discharge with concentrations increasing during the spring freshet to a summer maximum (Peterson et al., 1992; Dittmar and Kattner, 2003; Stedmon et al., 2011; Townsend-Small et al., 2011; Holmes et al., 2012; Terhaar et al., 2021). Like nitrate, ammonium in Arctic rivers also negatively correlates with discharge during the spring thaw, although concentrations are less predictable (Townsend-Small et al., 2011).
Nitrogen from rivers is principally discharged into the Arctic Ocean as an organic compound and organic matter concentrations in the Arctic rivers are among the highest reported in the world’s rivers while the concentrations of inorganic nutrients are among the lowest worldwide (Dittmar and Kattner, 2003). Changes to the timing and volume of fresh water in the Arctic could impact river chemical composition and the aquatic ecosystems, as could climate-induced changes in growing season length, wildfire frequency, and permafrost thaw (McGuire et al., 2009; O’Donnell et al., 2016; Hugelius et al., 2020; Rodríguez-Cardona et al., 2020; Wang et al., 2021). As temperatures rise in response to climate change, rain and meltwater will likely become bigger sources of water to Arctic rivers (Kivinen et al., 2012). There has been a documented increase in freshwater discharge for some Arctic rivers during the last century (Peterson et al., 2002; Serreze et al., 2006) and modeling suggests that Arctic river flows may increase by 25-50% within the next 50-75 years (CliC/AMAP/IASC, 2016). Spring snowmelt floods have been occurring earlier as well, as temperatures rise and induce earlier snowmelt (Overeem and Syvitski, 2010). Long-term time-series data for Arctic river water chemistry are relatively scarce so identifying climate-induced changes in chemistry is currently challenging (Holmes et al., 2013).
Climate-induced permafrost degradation will also drive increased sediment inputs to rivers, which will affect both riverine and marine nutrient cycling and also marine productivity and food webs. Gruber et al. (2004) estimate that degradation of permafrost may release as much as 25% of the carbon stored in Arctic soils. Climate-induced changes to Arctic vegetation may also impact river chemistry, although the impact on riverine dissolved organic matter (DOM) may be minimal (Dittmar and Kattner, 2003). Inorganic nutrient export per unit of stream discharge is thought to be increasing in the Arctic (Dittmar and Kattner, 2003; Townsend-Small et al., 2011). However, Arctic rivers and watersheds are physically and chemically diverse, so, likely, the impact of climate change on river carbon and nutrient loads will be highly specific to each watershed (Wrona et al., 2005).
The specific effects of river carbon and nutrient inputs on coastal primary production are murky because of interactions, interdependencies, and the high degree of variability amongst watersheds. Likely, Arctic coastal regions will not be equally impacted by changes to river inputs. Tank et al. (2012) estimate that riverine nitrogen only supports a small portion of total Arctic Ocean photosynthesis while Terhaar et al. (2021) estimate that 28-51% of the annual Arctic Ocean net primary production is driven by carbon and nutrient inputs from land. It has been speculated that terrigenous nutrient inputs from rivers and coastal erosion might increase Arctic Ocean production (Fritz et al., 2017; Terhaar et al., 2019; Terhaar et al., 2021). However, the delivery of additional dissolved organic matter and sediments to the coastal environment would increase turbidity and reduce the light available for photosynthesis (CliC/AMAP/IASC, 2016.). The Arctic shelves that are predominantly influenced by rivers are the White Sea, Kara Sea, Laptev Sea, East Siberian Sea, and the Beaufort Sea (Carmack and Wassmann, 2006; Findlay et al., 2015). While these river-influenced interior Arctic shelves receive large volumes of river runoff, this input is considered relatively low-nutrient and highly turbid, and thus not necessarily conducive to supporting net primary production (Williams and Carmack, 2015). To date, the biological response of this region is inconclusive. For example, the Kara Sea exhibited a 22% decline in Chl-a from 1998-2018 that was attributed to the increased discharge from the Yenisey and the Ob suppressing production, yet the integrated production increased by 100% during the same period (Lewis et al., 2020). Because DOC attenuates light, its negative impact on primary production seems intuitive. However, the relationship between terrestrial DOC and marine production is likely more complicated. In some situations, terrestrial DOC may stimulate primary production by shielding phytoplankton from harmful ultraviolet radiation, increasing dissolved CO2 concentrations, and providing additional nutrient supply via nutrients that were bound in humic compounds (Seekell et al., 2015).
The marine environment provides important food resources for Arctic community members. Although Indigenous community members may travel more than 100 miles out to sea in small boats to reach traditional fishing or hunting grounds (Kapsch et al., 2010) travel out beyond the coastal zone can be dangerous and logistically challenging. Thus, stakeholders in the marine Arctic primarily interact with the Arctic coastal zone, the interface between the terrestrial and marine environments. Understanding the impact of riverine inputs on coastal marine production and how these dynamics may change in the future is important for resource managers and planners and community members who monitor and rely on coastal food resources.
Coupled ecosystem models are useful for gaining an understanding of complex ecosystem interactions and can be used to project future changes and relative importance of processes but river inputs are currently treated quite rudimentarily or ignored in most ecosystem models, and usually don’t reflect interannual variability and climate-induced changes. It is common for coupled ocean-ecosystem models to represent the physical freshwater inputs from rivers (i.e. salinity and temperature) but not the dissolved chemical constituents (i.e. DOC and DON). By explicitly including a time-varying representation of riverine DOC, a regional model for the Arctic Ocean (Manizza et al., 2009; Manizza et al., 2011) represented a significant advance in Arctic carbon cycle modeling. However, as this model did not include an explicit representation of ecosystem components, it was not an appropriate model for exploring river impact on ocean ecosystem dynamics. Under the Arctic Ocean Model Intercomparison Project, Popova et al. (2012) found that three of five coupled physical and biological ocean models had no treatment of the riverine input of nutrients while the remaining two models implemented a nitrate climatology. River nutrients continue to be poorly represented in both regional and broader scale earth system scale models of the Arctic ecosystem (i.e. Jin et al., 2018; Clement Kinney et al., 2020). Work has begun to model the organic chemistry of Arctic Rivers, at least in an idealized system (Jayasinghe et al., 2020) however this detailed river chemistry analysis has not yet been expanded to all Arctic rivers and incorporated into a coupled land-ocean modeling system.
It is increasingly common for Arctic ocean models to employ the Dai and Trenberth Global River Flow and Continental Discharge Dataset (Dai and Trenberth, 2002; Dai et al., 2009) to represent freshwater discharge to the ocean (Terhaar et al., 2019; Gibson et al., 2020). Recently, using the Nucleus for European modelling of the Ocean platform (NEMO), Terhaar et al. (2019) simulated time-varying (monthly) river nutrient discharges by scaling annual discharge predictions by the monthly river discharge data. Using this model, Terhaar et al. (2019) found that globally doubling river nutrients could increase Arctic-wide primary production by 11% and up to 35% locally. Here, using the Energy Exascale Earth System Model (E3SM), we build on this work and take a more in-depth look at the impact the timing and concentration of river nutrients have on each coastal Arctic region, and how this influences the resultant secondary production and particle fluxes supporting the benthic food web.
Materials and Method
The E3SM-HiLAT Model
The High-Latitude Application and Testing of Earth System Models (HiLAT) project, based at Los Alamos National Laboratory, developed a model for high latitudes based on version zero of E3SM. This coupled Earth system model has been described in detail in previous publications (Hecht et al., 2019; Gibson et al., 2020) so is not repeated here. As in a previous series of experiments (Gibson et al., 2020), the model was set up to use the Parallel Ocean Program (POP, version 2) and the Los Alamos Sea Ice Model (CICE v5, Hunke et al., 2015; Turner and Hunke, 2015). The model was implemented in a partially coupled ‘G-configuration’ with active prognostic ice and ocean model components coupled to version 2 of the Coordinated Ocean-ice Reference Experiments (CORE2-IAF, Griffies et al., 2009), an atmospheric data model that simulates the air temperature, air density, wind speed, and specific humidity at 10 m, as well as surface upwelling shortwave flux, surface downwelling shortwave flux, surface downwelling longwave flux, precipitation, and sea-level pressure. This global reanalysis atmospheric data set is an inter-annually varying hindcast spanning 62 years from 1948 to 2009 (Large and Yeager, 2009). The coupled ice-ocean model is run on a global grid with a Greenland pole and has a nominal 1-degree resolution.
Oceanographic initial conditions (i.e. temperature and salinity) were derived from version 2 of the Polar Science Center’s hydrographic climatology, a gridded climatology based on Steele et al. (2001)’s original version merging World Ocean Atlas data with the regional Arctic Ocean Atlas. As described in Wang et al. (2015), initial distributions of nutrients, inorganic carbon, and alkalinity in the ocean were based on the World Ocean Atlas and Global Data Analysis Project databases. The model was initialized with no ice or ice-associated variables—rather these were allowed to spin up during run time. The baseline HiLAT model was run for two full cycles of the sixty-two-year CORE2 forcing dataset to ensure adequate model spin-up. To avoid the unphysical jump in the response to forcing as the model returns to 1948 after the end of each 62-year cycle (Griffies et al., 2012) we started each of our experiments on January 1, 1960 (model year 137), twelve years into the third cycle, and ran for twenty-one years (1960-1980).
The ocean biogeochemistry is simulated with the Biogeochemical Elemental Cycling (BEC) model (Moore et al., 2002; Moore et al., 2004; Wang et al., 2015; Gibson et al., 2020) fully coupled with the physical ocean model. The BEC model includes four key phytoplankton functional groups (diatoms, diazotrophs, phaeocystis, and small phytoplankton), a single zooplankton group, and two detrital pools. The non-sinking detrital pool largely represents DOM. The large particulate detrital pool represents sinking particulate organic matter. Nutrient variables include carbon, nitrogen, phosphorous, iron, and silica. The single zooplankton compartment ‘grazes’ on each of the phytoplankton groups, as well as the large particulate detritus, and has been parameterized to encompass the actions of both the microzooplankton and larger zooplankton. The sea ice biogeochemistry model is based on the 2D PhEcoM model (Jin et al., 2006; Deal et al., 2011; Jeffery et al., 2020) and includes ice algae, nitrate, ammonium, silicate, dissolved iron, and DOM.
River Runoff and Nutrients
River runoff was implemented by way of the Dai and Trenberth Global River Flow and Continental Discharge Dataset (Dai and Trenberth, 2002; Dai et al., 2009), which has a monthly mean resolution from 1948 through 2007, and climatology for subsequent years. To maintain stability, rather than inputting all the river runoff (kg s-1 m2) into the grid point closest to the river mouths, the HiLAT model spreads out this input over several surface grid cells using a Gaussian nearest neighbor smoothing function with a constant exponential decay scale of 1000 km over a horizontal radius of 300 km near the river mouths. River nutrient inputs in the model include dissolved organic and inorganic nitrogen, phosphorus, and carbon, dissolved iron, and silicate. These inputs were developed using output from the Global Nutrient Export from WaterSheds model (GNEWS), a spatially explicit, global-scale model (Mayorga et al., 2010; Seitzinger et al., 2010) that calculates the total annual nutrient flux at river mouths for the year 2000 (Mayorga et al., 2010). As GNEWS does not currently provide estimates of dissolved iron runoff, here we assume that all river water has a dissolved iron concentration of 0.01 mmol m-3. For use in the HiLAT model, GNEWS annual river nutrient inputs were partitioned into twelve monthly forcing values. The nearest ocean grid point to each of the GNEWS river mouth locations was identified and then, as with the runoff, the nutrient inputs for each river basin were spatially mapped to surface ocean model grid cells, which are 10 meters thick, such that the spatial pattern of river nutrient dispersion follows river water inputs to the oceans.
River Nutrients Experiments
Freshwater river discharge and river nutrient inputs to the ocean are currently treated separately and independently within E3SM. Here, our efforts have focused on modifying the river nutrient concentrations while leaving discharge volumes for each river at the baseline values. To explore the likely impact of climate-induced changes in river nutrients on marine biogeochemistry in the coastal Arctic we performed a set of model experiments systematically modifying the concentration and timing of dissolved organic and inorganic nitrogen (DON and DIN). River DIN is added to the nitrate pool while the river DON is added to the semi-labile DON pool before being remineralized to ammonium. The model’s phosphorus, iron, and silicate were left unmodified. The standard river nutrient concentration forcing (i.e. Figure 1A) used in E3SM to date does not have seasonality, rather 12 constant monthly (m) values for each grid cell distributed the annual nutrient input evenly throughout a year. To develop a climatology of river nitrogen inputs for Arctic rivers and reflect the potential coupling that we would see between discharge and river nutrient concentrations, a scaled climatology (Sm) of monthly river volume flux for the Arctic (>66.5°N) was first computed from the 62 years of baseline forcing (Figure 1B). The scaled climatology for the Arctic had a mean discharge peak in June (29%) which fell off sharply in July (~15%). Approximately 10% of the discharge occurred in both May and August and only ~3% of the total annual river discharge occurred in each month from November-April. As a first approximation of river nutrient input, this scaled river discharge climatology was used to scale the constant monthly river nitrogen inputs (NBASE) at each grid point (i,j) north of 66.5° so that DON and DIN input directly correlated with river volume discharge, while maintaining the total annual nitrogen input (NCLIM). This seasonal climatology, with peak nutrient inputs in June, reflects findings (Le Fouest et al., 2013, cf. Figure 4) that Arctic river nitrogen fluxes peak in the summer, with some of the larger fluxes occurring in June. To reflect potential impacts of thawing permafrost on Arctic river nutrient loading, in a third scenario the scaled nutrient concentrations at each grid cell and monthly time step were shifted earlier by two months so that the peak nitrogen discharge occurred in April (NCLIMS2). In a fourth scenario, the river nitrogen inputs were doubled and shifted earlier by one month (NCLIMX2S1). Finally, a model scenario was also conducted using a time constant but doubled river nitrogen inputs (NX2). Each of the five river nutrient experiments is illustrated in Figure 1C.
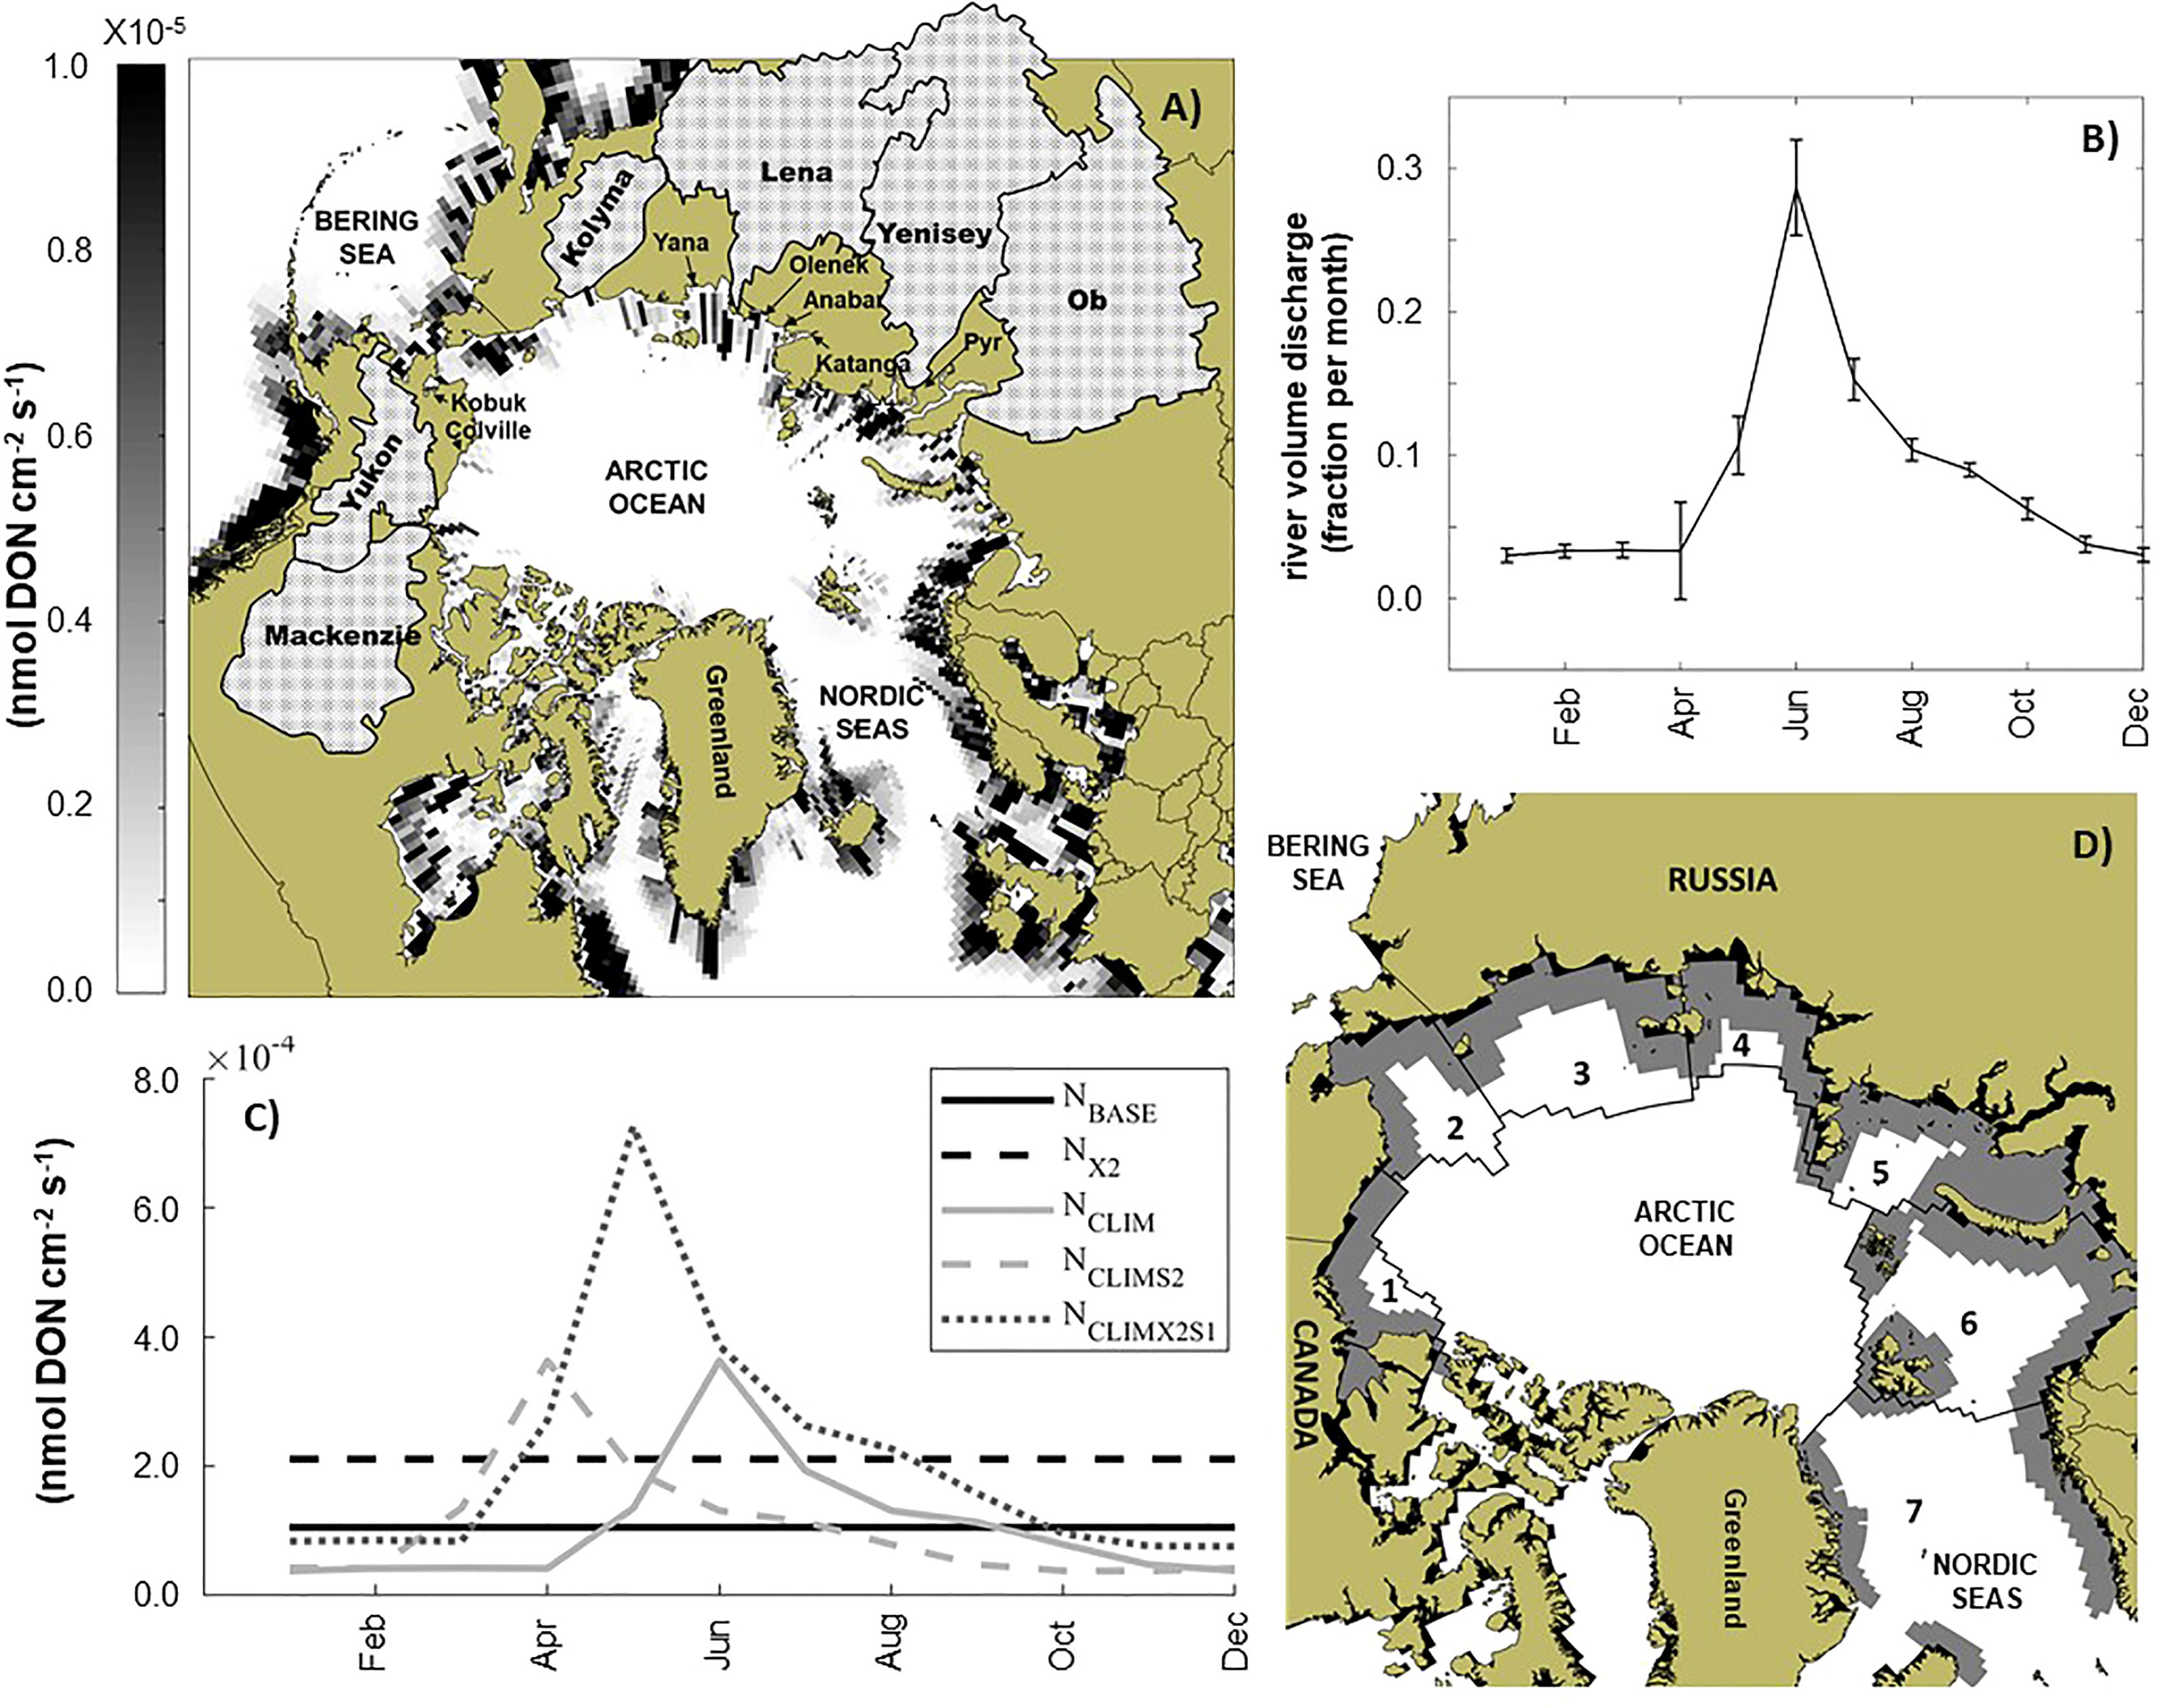
Figure 1 Study area, example river inputs, and analysis regions. (A) Spatially varying river input from dissolved organic nitrogen (nmol cm-2 s-1) for September 1948. To help orientate the reader, the approximate location of major rivers around the Arctic Ocean, along with the watersheds of the six largest rivers (hatched area), the Bering Sea, Kara Sea, and Nordic Seas are indicated. (B) Scaled monthly average volume discharge (Sm) for all rivers north of 66.5°N). (C) Example time series of baseline constant river nutrient input (NBASE), doubled constant river nutrient input (NX2), monthly climatology of river nutrient inputs (NCLIM) derived by scalling NBASE by Sm, climatology of river nutrient inputs shifted by two months (NCLIMS2), and climatology of river nutrients doubled and shifted by one month (NCLIMX2S1): These examples of annual river nutrient inputs are for location 74.2°N,77.1°E in the Kara Sea, indicated by the white star symbol in (A). (D) Map of study area showing the location of the seven regions considered in our analysis. Beaufort Sea (R1), Chukchi Sea (R2), East Siberian Sea (R3), Laptev Sea (R4), Kara Sea (R5), Barents Sea (R6), and the Nordic Seas (R7). The grey shaded region indicates the marine coastal zone within each region, which was assumed to be three ocean grid cells from land.
Analysis
A set of coastal analysis regions were created by first identifying ocean grid cells within the 8-connected neighborhood of any land-masked cell, and then expanding the connected neighbor analysis to give a domain that included oceanic cells within three grid cells from a land boundary. This coastal region was then further divided to define each Arctic Sea (Figure 1D). The median distance from a coastal ocean grid cell to a neighboring cell was 34 km, thus our coastal analysis region extended approximately 112 km from the coast. For each coastal region, output variables were averaged over all associated grid points to produce regional time series of seasonal, monthly, or daily averages. For this analysis, ‘Spring’ was considered to be March, April, and May; ‘Summer’ was June, July, and August; and the ‘growing season’ was March through September. The mixed layer depth was computed internally using vertical density gradient and varied temporally and spatially but was generally ~10-20 m in the coastal Arctic during the growing season.
The environmental output variables considered included spring, summer, and growing season mixed layer nitrate (NO3) and ammonium (NH4) and annual average and summer average vertical integrated (upper 100 m) zooplankton biomass (Z) and flux of Particulate Organic Carbon (POC) to the benthos, all of which were computed from monthly averages. Annual average phytoplankton production (Prodo) was computed by first summing daily average, depth-integrated productivity for each calendar year period. When comparing seasonal averages for each model scenario, means were computed from the last ten years of each model run (years 148-157, i.e. Figure 2), and the change in the regionally averaged environmental variables between the baseline model run and each river nutrient scenario was determined. This analysis period was chosen as a balance between allowing time (over a decade) for the model to adjust to the perturbations in forcing while providing a decade of output to explore interannual variability. By comparing the annual maximum in regionally averaged mixed layer nitrate concentrations in the baseline run and in each model experiment i.e. diffNO3=max(NO3)EXP – max(NO3)BASE, we determined acceptable model adjustment had occurred within the first eleven years, and that additional drift was minimal. The increase in this difference (diffNO3), over the final 10 years analyzed, ranged from 0.001 to 0.005 mmol NO3 m-3 y-1. Correlations between the final 10-year monthly mixed layer NO3 time series for the baseline run and each experiment exceeded 0.99 in all regions.
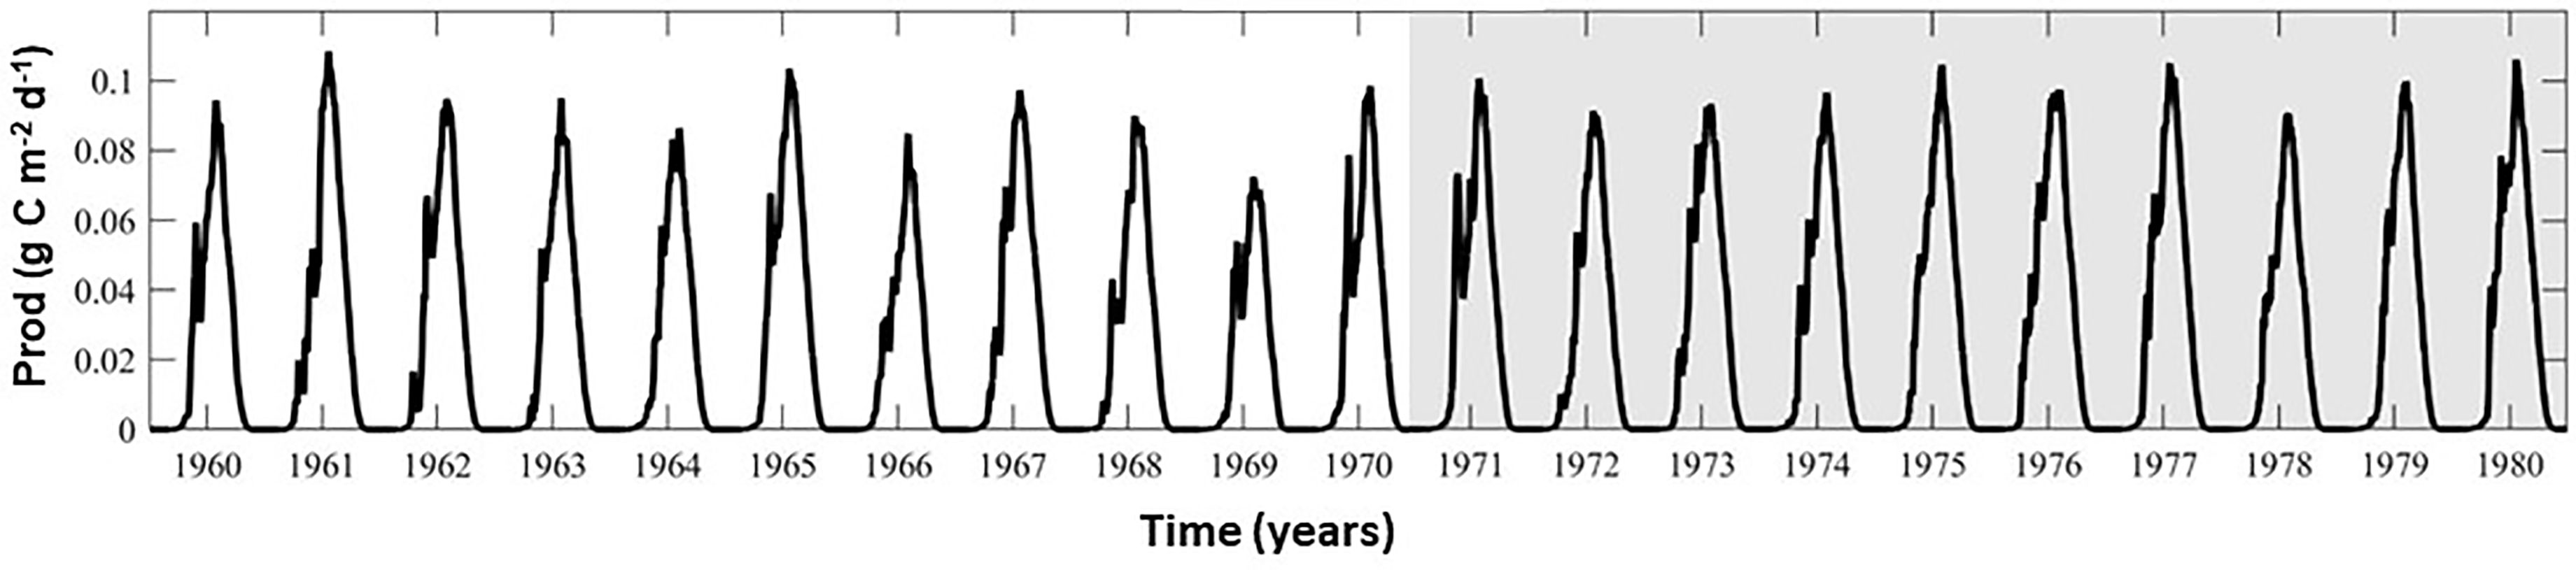
Figure 2 Regionally averaged seasonal cycle of total primary production (diatoms and small phytoplankton) for the Kara Sea coastal region. The shaded region indicates the last ten years that were used in model analysis and comparison.
Following previous approaches to quantify impacts of environmental change (Goosse et al., 2018; Gibson et al., 2020) the relative impact of each perturbation in river nutrients on the marine ecosystem was quantified as:
For the same ten-year period, the proportion of daily phytoplankton productivity and annual primary production contributed by each phytoplankton group, the day of peak phytoplankton biomass, and the bloom start date (BSD) were also computed. BSD was assumed to be the day at which regionally averaged cumulative phytoplankton biomass exceeded 15% of the total annual biomass (Gibson et al., 2020).
River DOC Experiment
The model simulates dissolved organic carbon (DOC) concentration and distribution, as well as its remineralization to dissolved inorganic carbon (DIC), although presently their treatment in the model is quite rudimentary and neither DOC nor DIC are limiting to primary production. While DIC is not thought to have a limiting mechanism to production, DOC, in reality, contains colored dissolved organic matter (CDOM) and thus does have the potential to impact primary production via light attenuation. It is important to understand the magnitude of the impact that DOC could have on primary production in the Arctic Ocean to determine the urgency and effort level that should be placed on improving DOC representation in models. Without the ability to directly simulate the production response to DOC we use a two-pronged approach to bound the likely response, such that we can compare it to the impact of other environmental factors. First, we extrapolate from the empirical relationship derived from Arctic lakes (Seekell et al., 2015) to determine the relationship between the DOC and the primary production and use this to estimate the annual primary production for each experiment. Then, we use established relationships for DOC in the marine environment to provide additional insights into the impact of DOC on production.
Extrapolating a DOC-Production Relationship From Freshwater Data
We doubled the constant monthly Arctic river DOC concentrations, assessed how this impacted coastal DOC, and then projected implications for production.
Seekell et al. (2015) evaluated how light availability and total-nitrogen concentration interacted to shape observed patterns in primary production across gradients in DOC. They identified 4.8 mg C l-1 to be a threshold [DOC]. Below this threshold, they found a positive linear relationship between [DOC] and primary production while at [DOC] above this threshold they found a negative linear relationship between [DOC] and production. As the [DOC] simulated and observed in the Arctic Ocean fall far below the 4.8 mg C l-1 threshold, here we assume the positive relationship as a first approximation of DOC impact on production in the Arctic marine environment. Fitting a line to the data points presented in Seekell et al. (2015, cf. Figure 3.) we approximate the relationship between primary production and DOC to be represented by Prod=0.011*DOC + 0.081. Our estimates for DOC influence on production thus assume that the slope of the line (m=0.011) gives the additional production seen if the DOC impact was explicitly simulated. Assuming a growing season of 180 days we derive annual production potential changes to (Table 4).
Extrapolating a DOC-Production Relationship From Literature
While the current representation of DOC in the HiLAT model is simplistic and lacks any chromatic feedback to production via light attenuation, we can use established relationships for DOC in the marine environment to provide additional insights into the impact of DOC on production. We use published relationships and equations to make a more realistic estimate of the total Arctic Ocean DOC concentrations, including semi-labile and humic components. Using published equations, we then provide an estimate for the attenuation of light in the Arctic Ocean by DOC.
Results
Mixed Layer Nitrogen
The annual cycles of nitrate and ammonium concentrations in the coastal mixed layer were only minimally impacted by the timing and concentrations of river nutrients (Figure 3). With the baseline river nutrient forcing, coastal nitrate peaked in April and then decreased rapidly between May and June. For reference, an example of the Arctic-wide spatial distribution of mixed layer nitrate concentration is presented in (Gibson et al. 2020, cf. Figure S3). Throughout the coastal Arctic, regionally averaged nitrate remained low from June through September before beginning to increase again. Coastal mixed layer ammonium concentration was relatively low at the beginning of the year but began to increase in March and peaked in May before rapidly decreasing. Ammonium concentrations remained low from July to September and then increased to a second peak in October with concentrations similar to the spring peak. Although the monthly resolution model outputs exhibited no notable difference in the timing of each region’s nutrient minimums and maximums (Figure 3), the magnitude of the nutrient peaks in each model scenario did vary slightly, in particular in the NX2 and the NclmX2S1 scenarios in which the nutrient concentration in the rivers was doubled. A more detailed comparison of the changes seen in nutrient concentrations in the different seasons and regions is provided below.
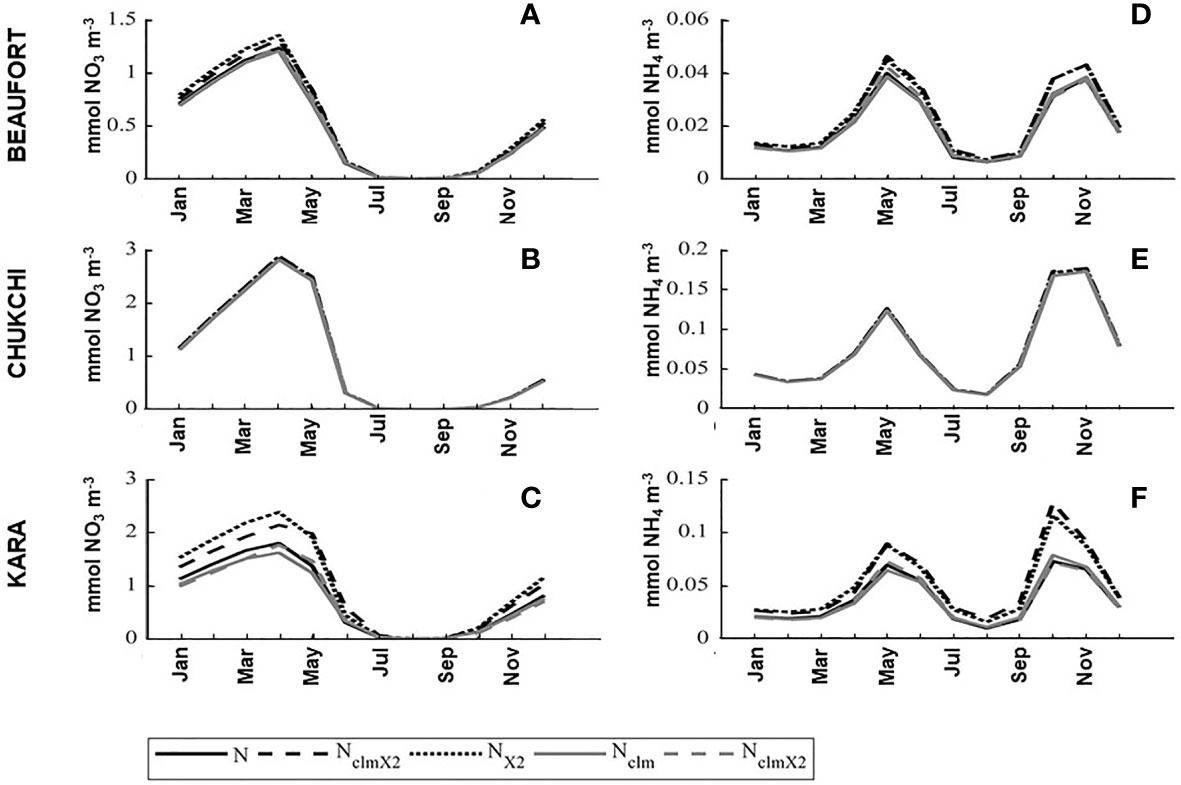
Figure 3 Mixed layer nitrate and ammonium concentrations (mmol m-3) in the baseline run and in each of the river nutrient experiments in the Beaufort Sea (A, D), Chukchi Sea (B, E), and the Kara Sea (C, F) coastal regions. Each monthly climatology is a ten-year average. See Figure 1D for each region boundary.
Arctic coastal spring mixed layer nitrate concentration in the baseline model ranged from 0.18 mmol m-3 in the East Siberian Sea (ESS) to 5.33 mmol m-3 in the Nordic Seas (Table 1). Summer mixed layer nitrate concentrations throughout the coastal Arctic were low, and at least an order of magnitude less than their spring counterparts (0.01-0.2 mmol m-3) with the lowest values again being in the ESS coastal region, and the highest being for the Barents Sea coastal region. Mixed layer ammonium concentration was low (≤0.15 mmol m-3) in all coastal regions in both the spring and summer. In most regions, the summer ammonium concentration was approximately half the spring concentration.
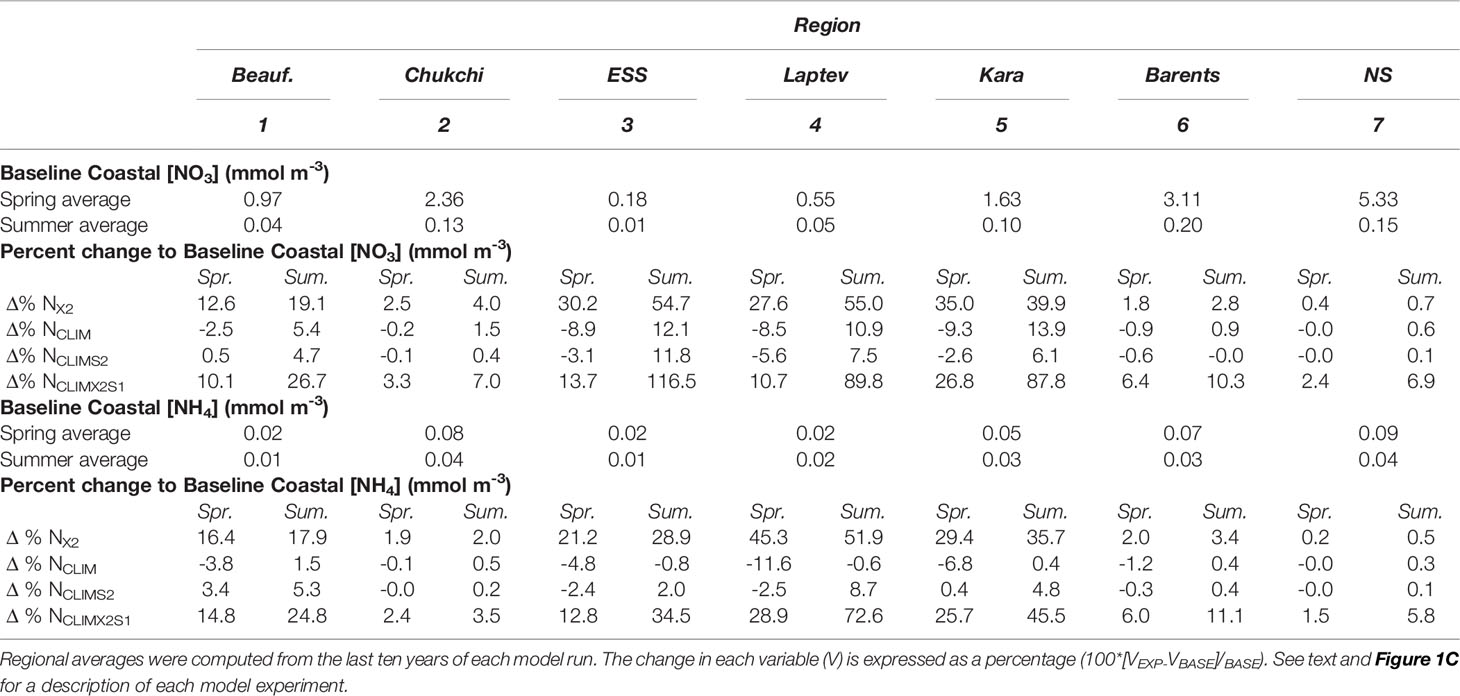
Table 1 Summary of mixed layer nitrate and ammonium concentration in the baseline model (BASE) and the change seen in the four river nutrient model scenarios (EXP) during Spring (March-May) and Summer (June-August).
A simple doubling of the river nitrogen (nitrate and ammonium) input (i.e. model scenario NX2) had a minimal impact (0.4-4% increase) on spring or summer mixed layer nitrate and ammonium concentration on the Chukchi, Barents, and Nordic Seas coastal regions (Table 1, Figures 4A, B, and 5A). Conversely, the more interior coastal regions i.e. the ESS, Laptev, Kara, and Beaufort Seas, saw a more notable impact resulting from the river nutrient doubling with a 13-45% increase in nitrate and ammonium concentrations in Spring and a 19-55% increase in summer.
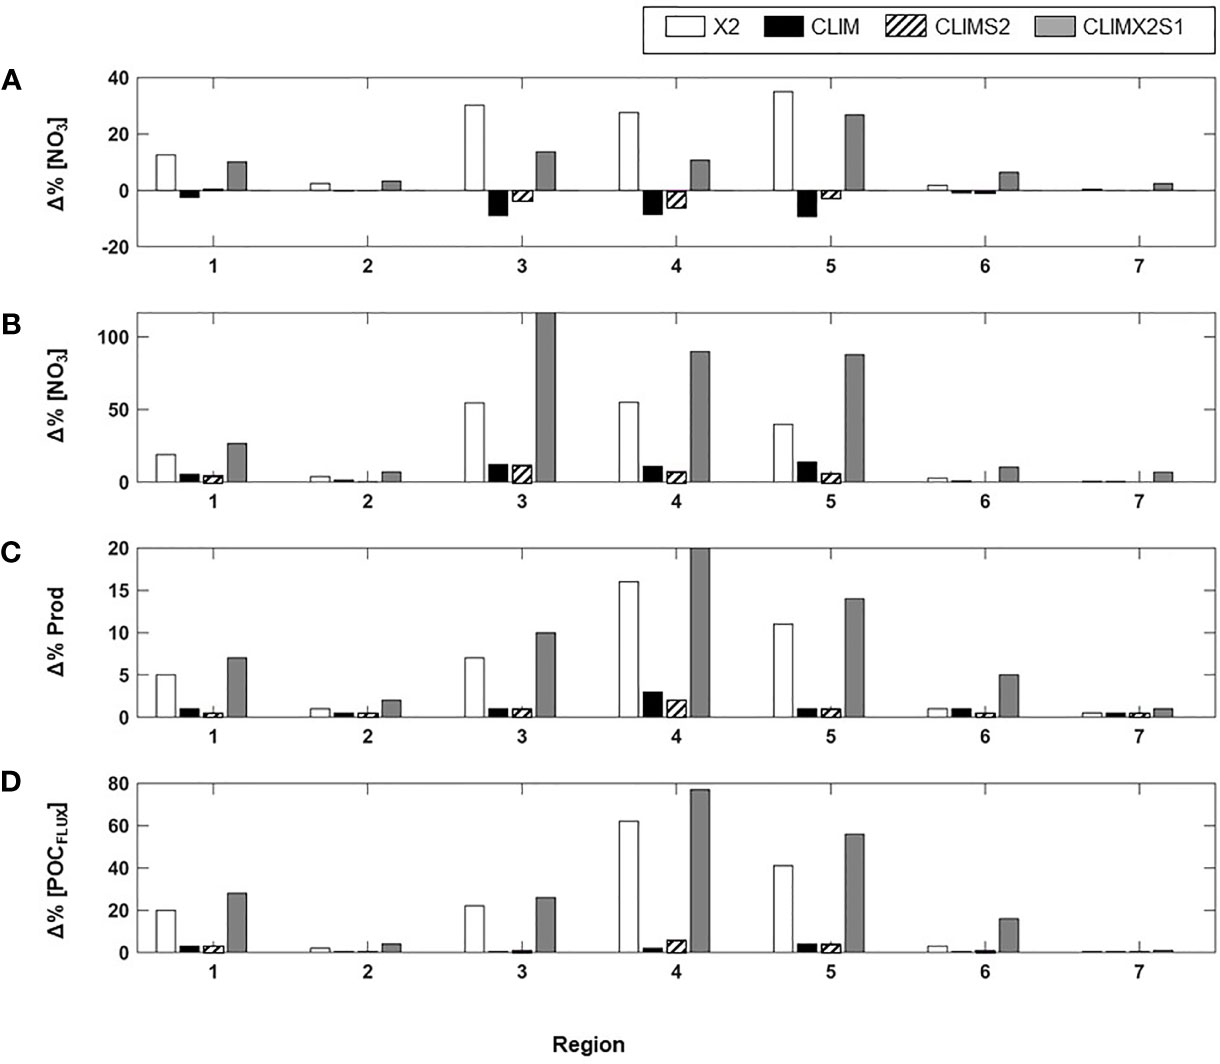
Figure 4 Percentage change to (A) spring mixed layer nitrate, (B) spring mixed layer nitrate, (C) vertically integrated annual primary production, and (D) Annual flux of POC to the sediment arising from each of the reiver nutrient experiments. Percent changes are shown for each of the seven coastal regions (see Figure 1D for location).
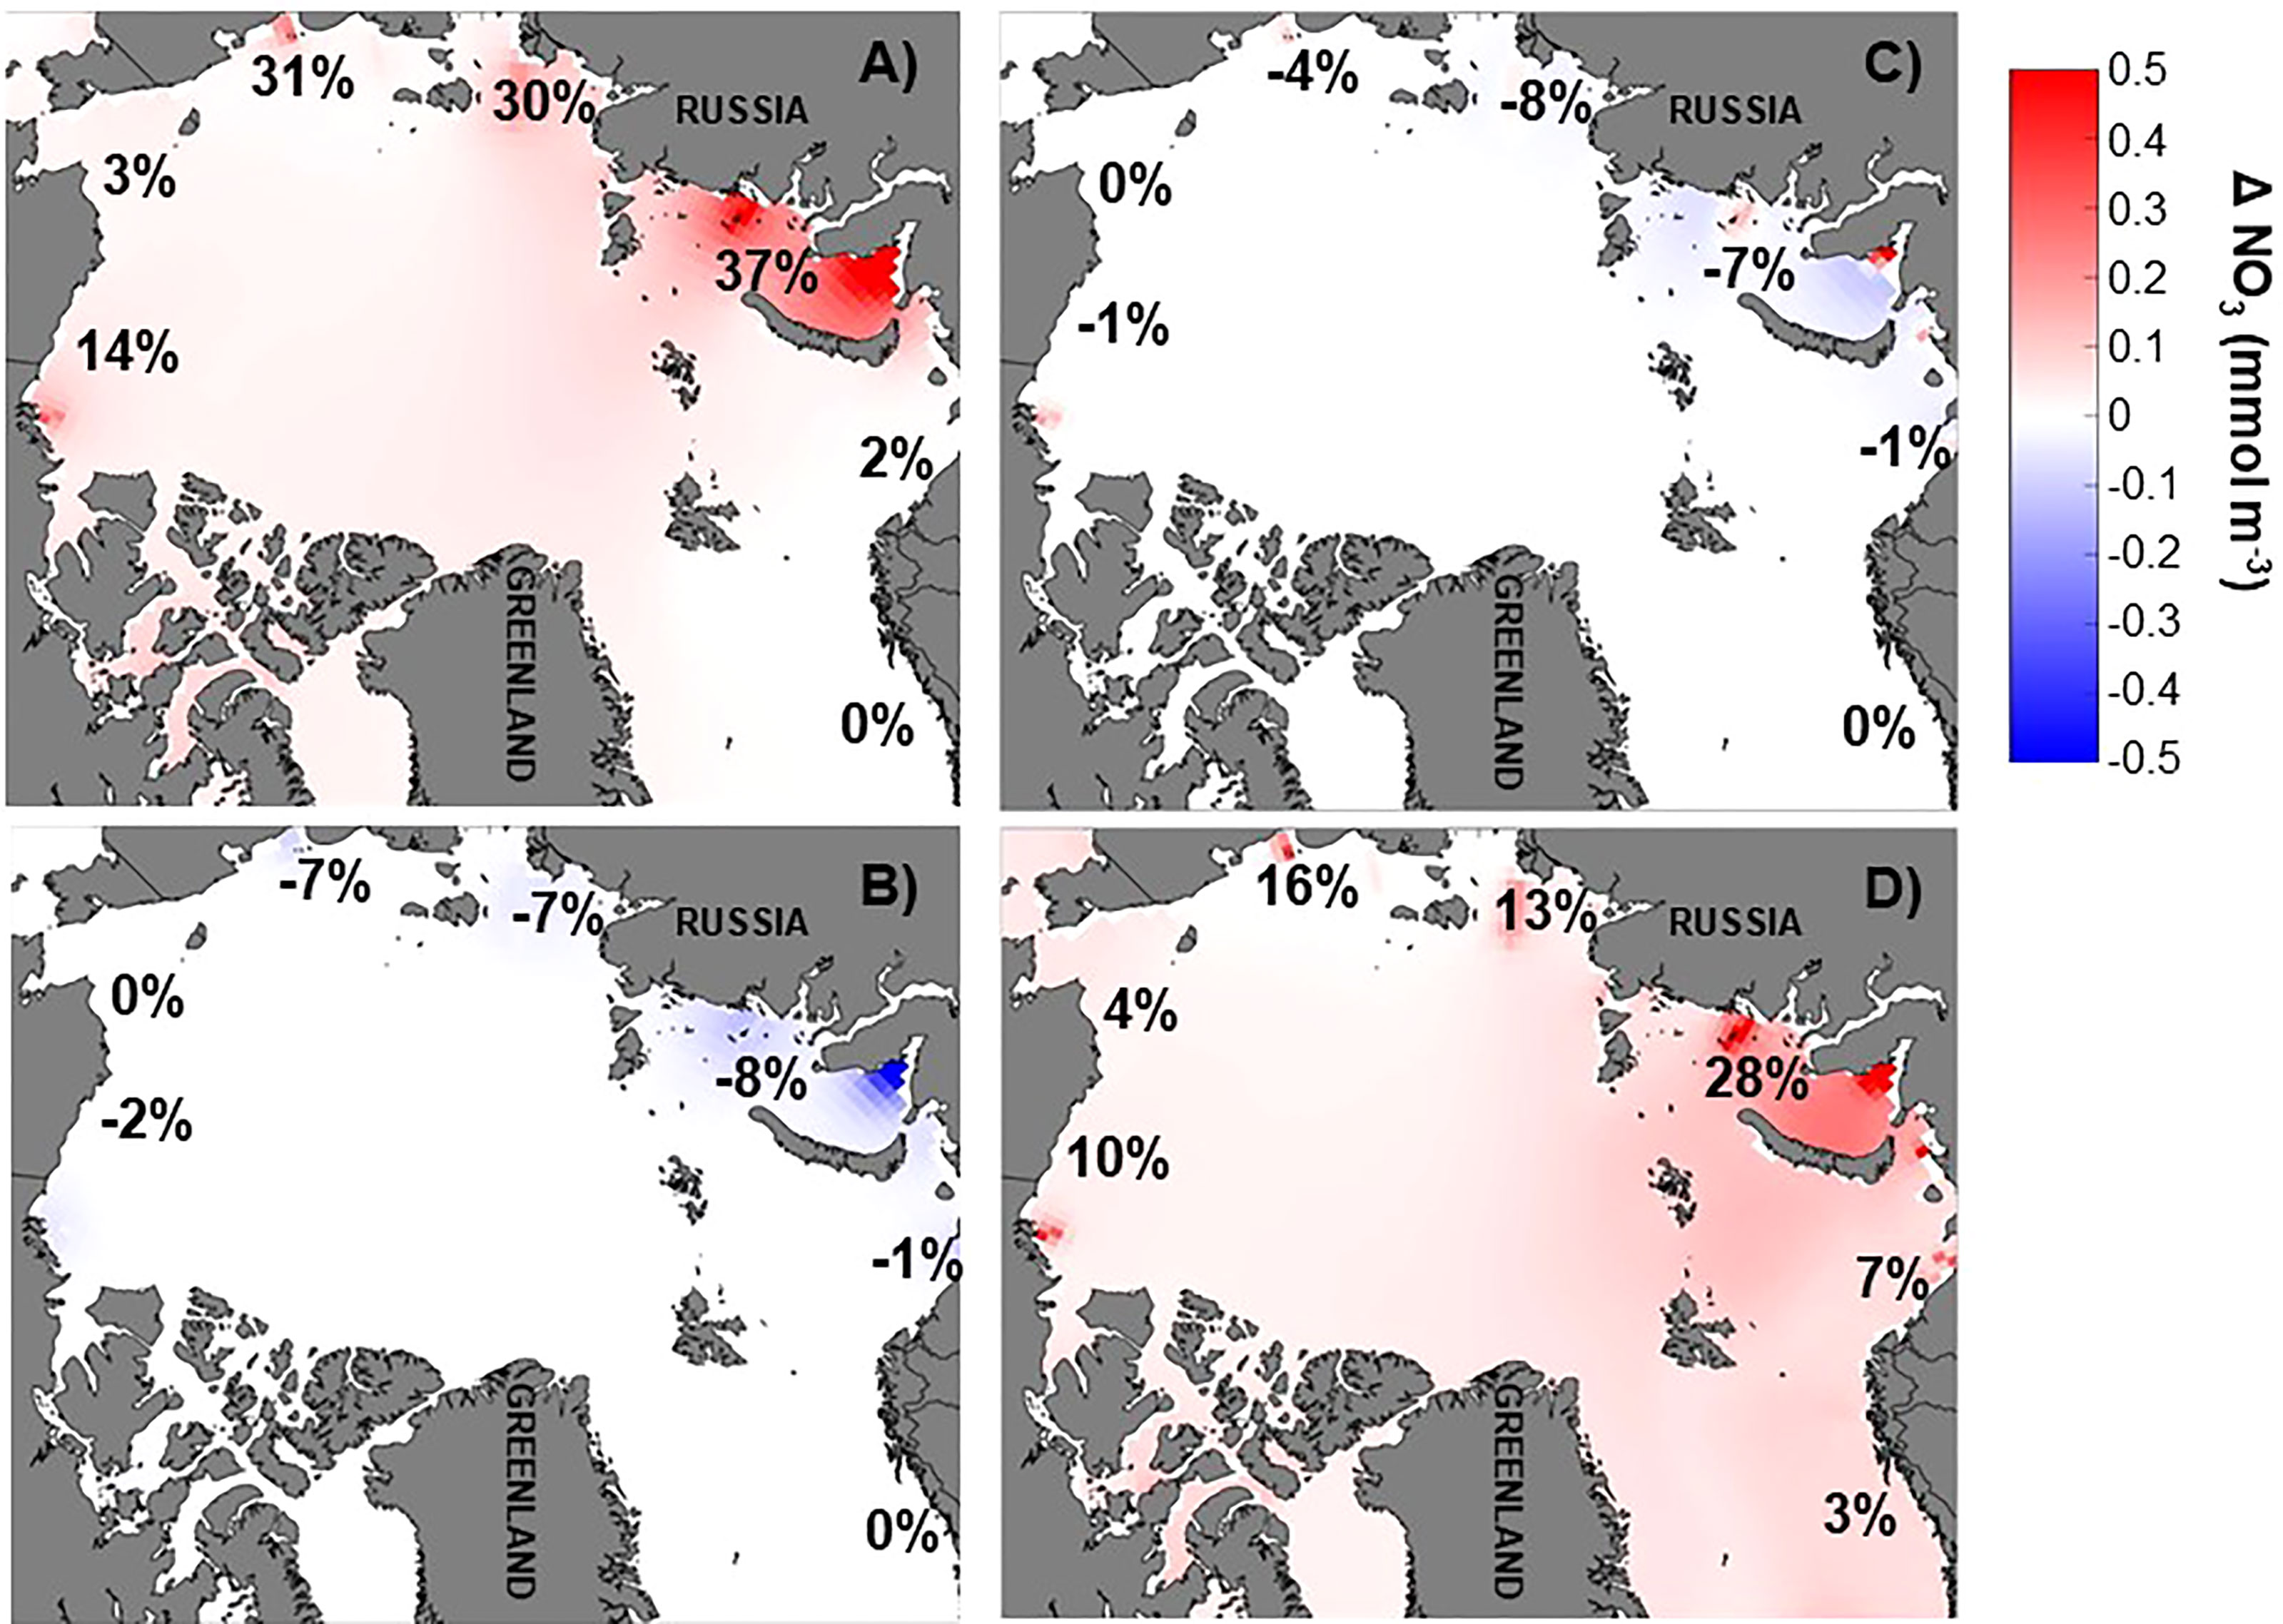
Figure 5 Annual average nitrate anomaly (mmol m-3) in the upper mixed layer relative to the baseline run [(NO3)EXP –(NO3)BASE] for (A) doubling of river nitrate (NX2), (B) annual river nitrate climatology (NCLIM), (C) river nitrate climatology shifted earlier by two months (NCLIMS2), and (D) river nitrate climatology doubled and shifted earlier by one month (NCLIMX2S1). Red colors indicate increased nitrate over the baseline run while blue colors indicate lower nitrate concentrations than the baseline run. Percentage change by coastal region is also indicated. All model results presented are ten years averages.
Distributing the river nutrient input over the year as a monthly climatology tied to river volume discharge, which has a peak in June (NCLIM), generally resulted in a decrease in both mixed layer nitrate and ammonium concentration in the spring and an increase in the summer (Table 1 and Figure 4). The spring nitrate decrease was small to negligible (<-0.01to -3%) in the Beaufort, Chukchi, Barents, and Nordic Seas but around -9% in the ESS, Laptev, and Kara. Similarly, the summer increase was lowest (1-5%) in the more marginal Arctic Seas and highest (11-13%) in the interior Seas. These changes resulted in an overall decrease over the growing season (May-Sept, Figure 5B). Changes to the mixed layer ammonium concentration in spring followed a spatial pattern similar to the nitrate, with the largest changes (-11.6%) in the Laptev. Unlike the other regions, the Laptev Sea and ESS Sea coastal regions exhibited a small decrease in ammonium in the summer as well as the spring with the monthly climatology river nutrient scenario (Table 1). Shifting the river nitrate climatology earlier by two months (NCLIMS2), so that the nutrient peak was in April rather than June, has a similar impact on mixed layer nitrate in terms of magnitude and direction of change in most regions (Figures 4A, B, 5C and Table 1), although the extent of the change relative to the baseline with shifted climatology was generally smaller than with the initial climatology. The largest decrease in spring nitrate (-6%) was in the Laptev Sea and the largest summer increase (12%) was in the ESS. Rather than the small decrease in ammonium seen with the original climatology, the shifted climatology resulted in an increase in summer ammonium in the interior seas. The shift had the largest impact on ammonium in the Laptev Sea where the spring decrease was reduced to -2.5 and the summer concentrations increased by 9% above the baseline.
In the ESS, Beaufort, Laptev, and Kara Seas, the spring increase in nitrate concentration in the coastal mixed layer with a doubling and shifting the river nutrient climatology (NCLIMX2S1) was less than seen in the simple doubling scenario (NX2). The largest spring nitrate increase (26.8%) was in the Kara Sea. Changes to the summer mixed layer nitrate under this river nutrient scenario were generally relatively large, with the marginal seas exhibiting increases of 7-27% and the interior seas exhibiting an 88-117% increase relative to the baseline model. With a 2.4-14.8% increase in ammonium contractions relative to the baseline in the Beaufort, Chukchi, and the Barents Sea, the percentage increase in spring ammonium with NCLIMX2S1 was a little more than that seen with a simple doubling while in the other regions the spring increase was a little less. The increase in summer ammonium concentration with NCLIMX2S1 in all regions (3.5-72.6%) was greater than seen with the simple doubling. The annual average change in mixed layer nitrate concentration in the Arctic coastal regions generally fell between the percentage changes seen for spring and summer but were closer to the spring value (Figure 5D and Table 1). The scenario in which the annual river nutrient climatology was shifted earlier by two months resulted in reductions to the annual average nitrogen concentration that were greater than those seen in the spring.
Primary Production
In the baseline model run, depth-integrated annual primary production varied significantly by region from the more productive Nordic Seas region (98 g C m-2) to the less productive interior ESS and Laptev Sea (18 g C m-2). Except for the coastal Nordic Seas, which had an average annual production of 87土3 g C m-2, production in coastal regions was not significantly different from production averaged over the broader regional seas (Table 2). Coastal regions comprise a large fraction of the total sea area (79-95%) in the Beaufort, Laptev, and the Kara Sea and, at 10, 6, and 20 Tg C respectively, contributed >75% of the total annual carbon production in each of these regions. In the Chukchi, ESS, and Barents Sea the coastal region comprises roughly 50% of the total area and contributed 47-60% of the total annual carbon production. The Nordic Seas, the largest of the regions examined although only 26% is considered coastal, had a total annual regional production of 219 Tg C with 23% (or 49 Tg C) coming from the coastal region.
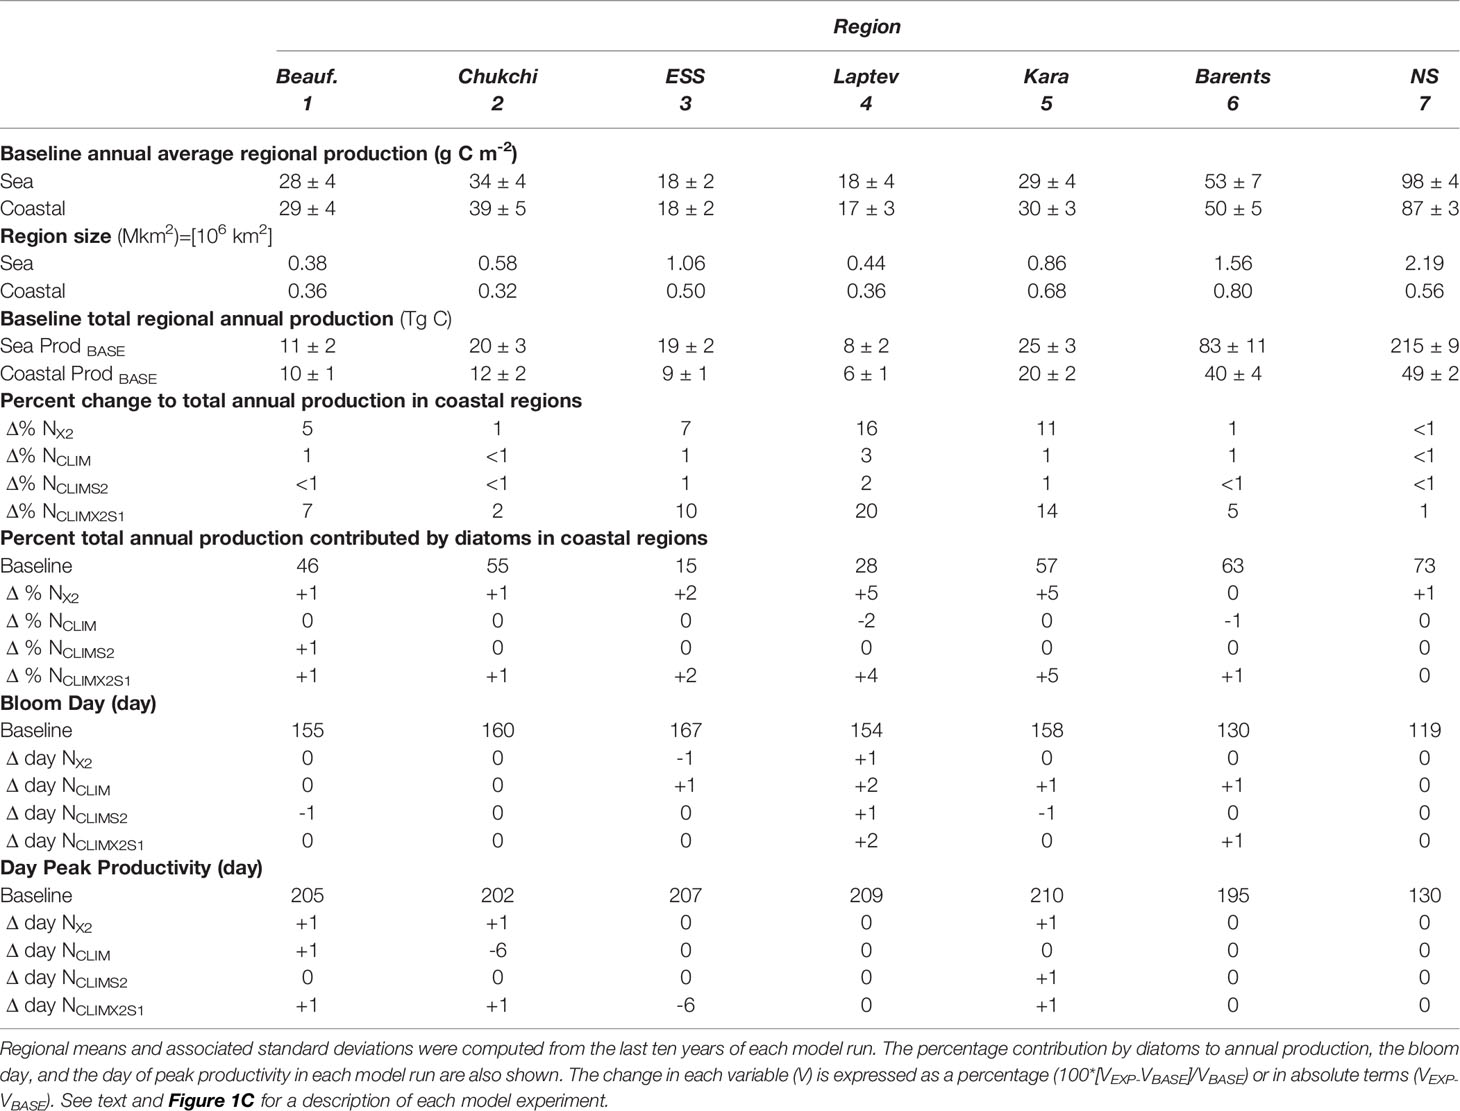
Table 2 Summary of annual primary production (Prod) in the baseline model (BASE) and the change seen in the four river nutrient model scenarios (EXP).
In response to the modified river nutrient inputs, the largest changes to regionally averaged vertically integrated primary production in the coastal zones occurred when the river nutrients were doubled (Nx2, NCLIMx2, Figures 4C, 6). In both of these scenarios, the most notable changes were in the interior seas coastal regions with a 5-20% increase from the baseline annual production. The other river nutrient input scenarios, which input the river nutrients as annual climatologies but did not modify the total annual nutrient input (NCLIM, NCLIMS2) had at most a 3% increase (Laptev Sea) while the other regions saw an increase of 1% or less.
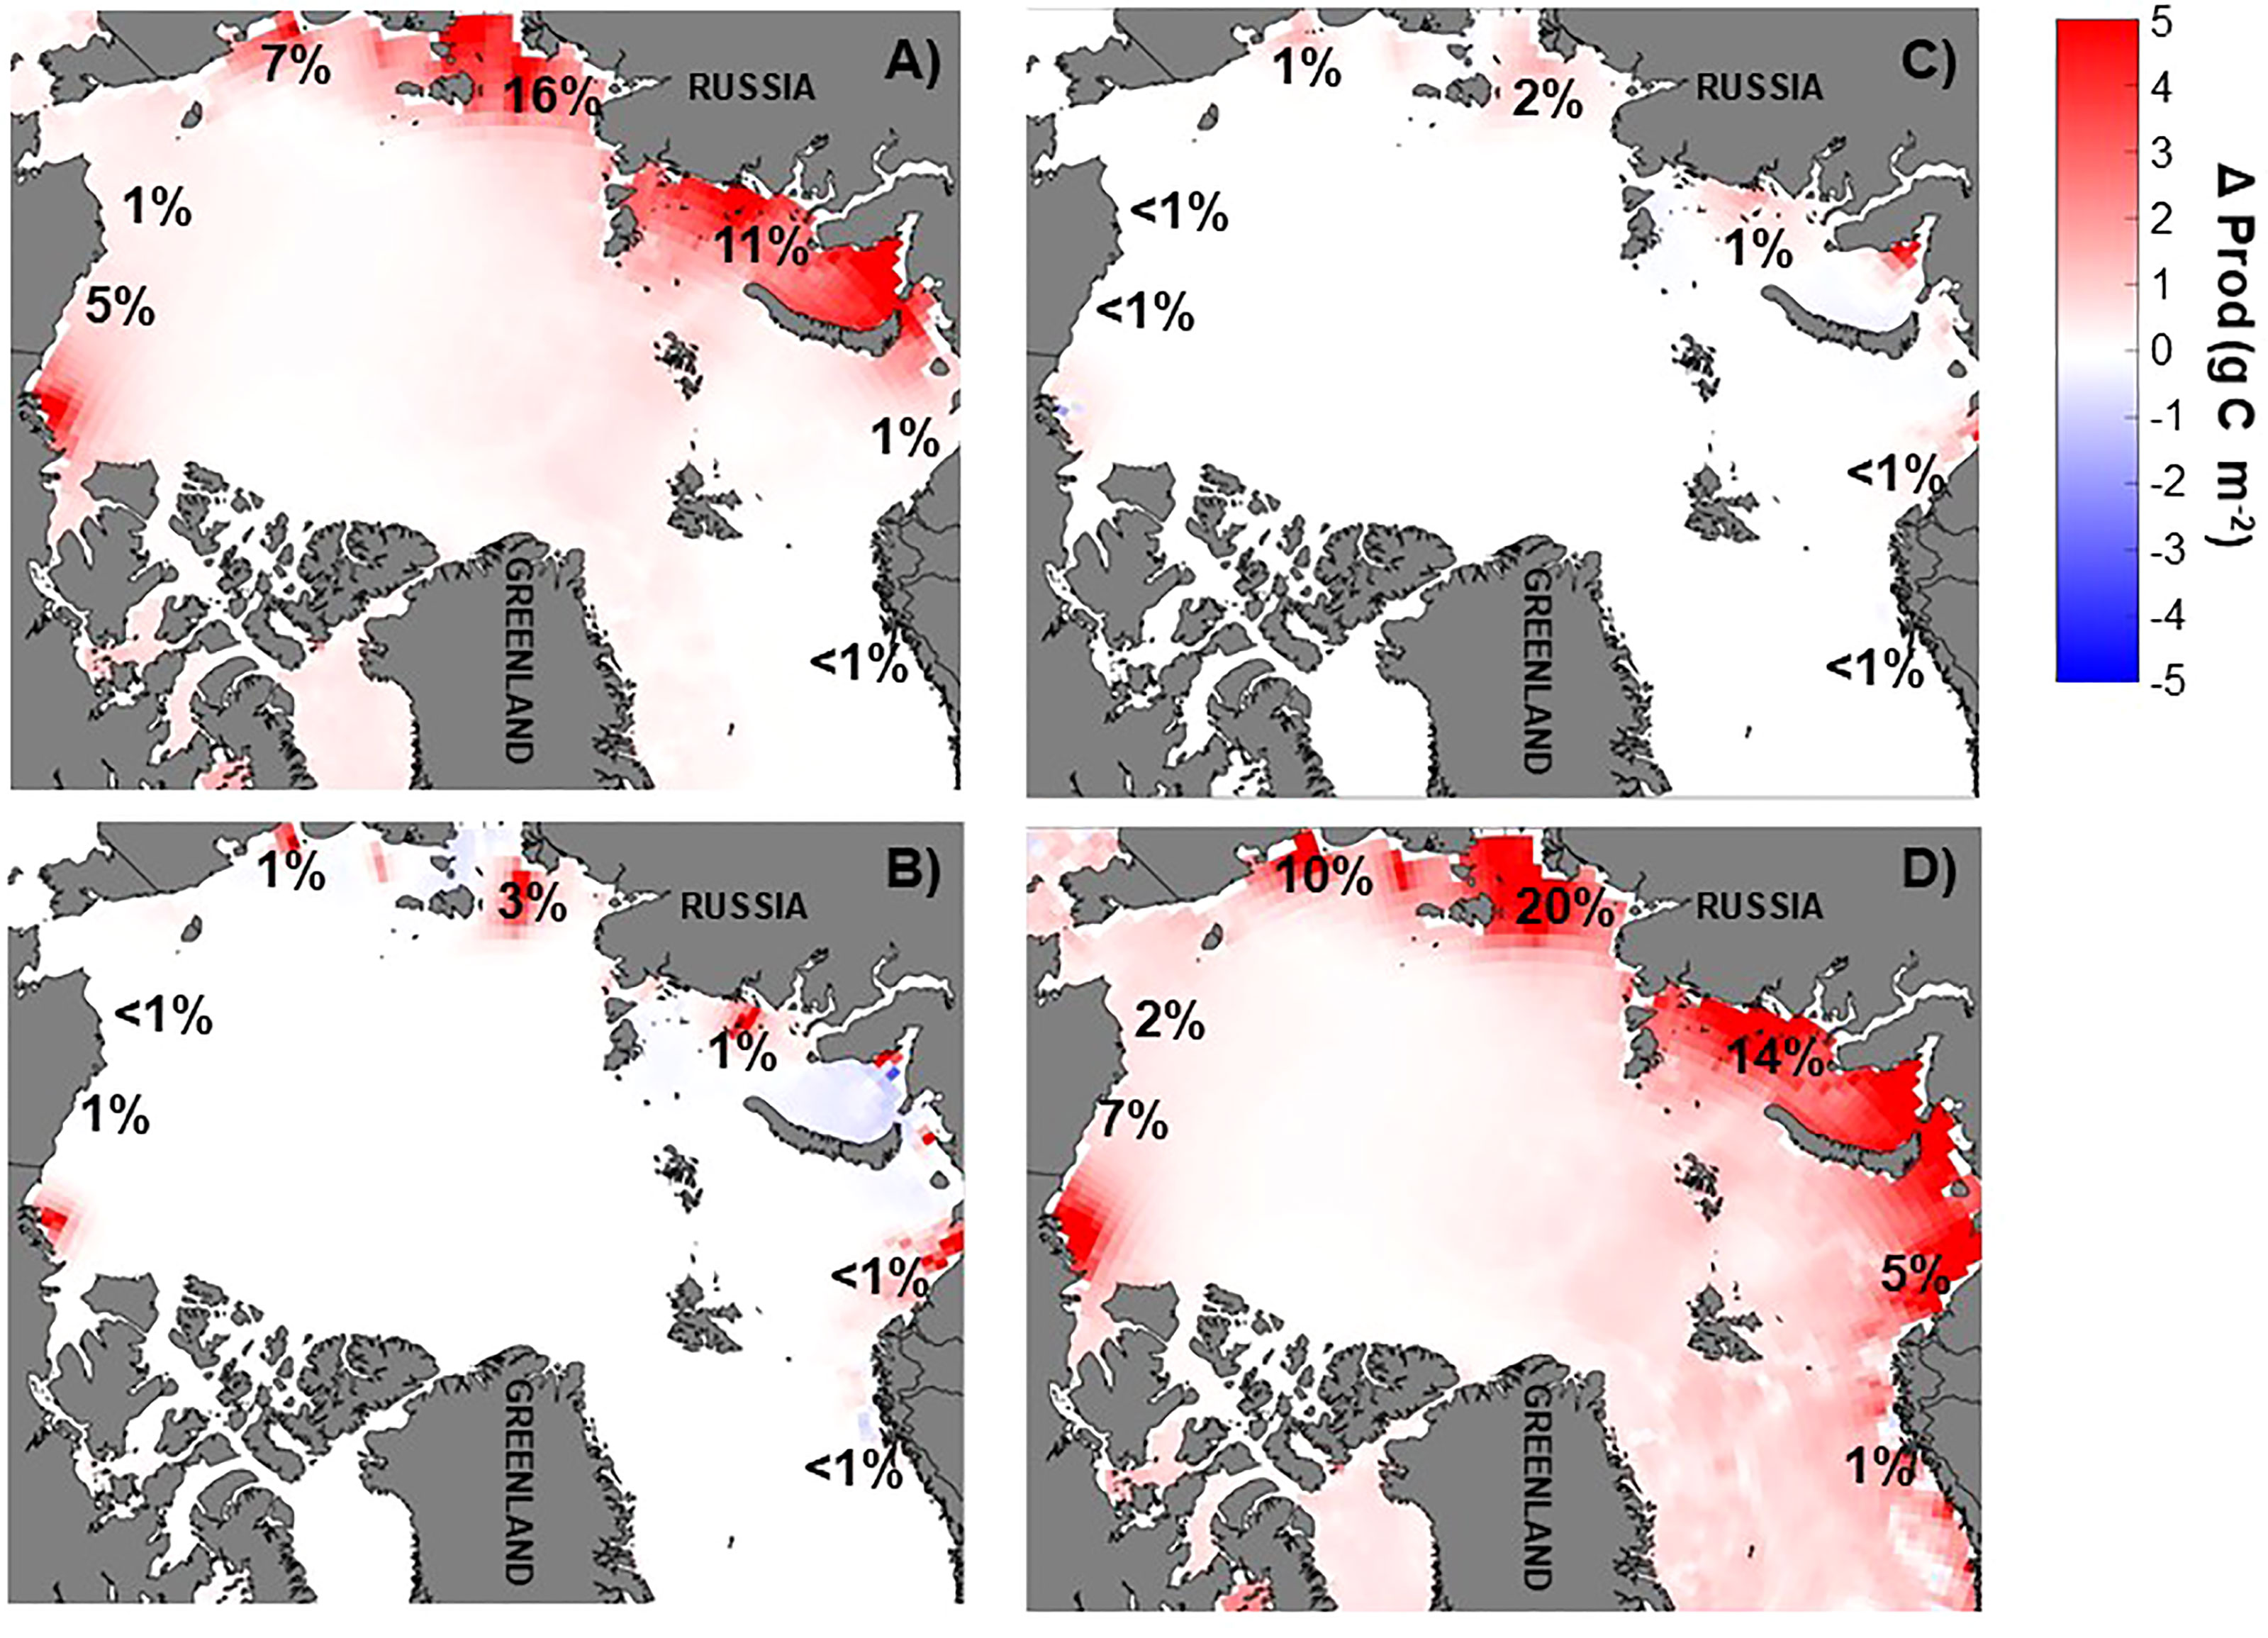
Figure 6 Annual average primary production anomaly (g C m-2) relative to the baseline run [(NO3]EXP –(NO3)BASE] for (A) doubling of river nitrate (NX2), (B) annual river nitrate climatology (NCLIM), (C) river nitrate climatology shifted earlier by two months (NCLIMS2), and (D) river nitrate climatology doubled and shifted earlier by one month (NCLIMX2S1). Red colors indicate increased production over the baseline run while blue colors indicate lower production than the baseline run. Percentage change by coastal region is also indicated. All model results presented are ten years averages. Production was integrated over the upper 100 m in the upper mixed layer.
The relative contribution of diatoms and small phytoplankton to total primary production in each region varied throughout the year (Figure 7). In the Kara, Barents, Chukchi and Nordic Seas diatoms dominated regional coastal productivity early in the growing season. The productivity of small phytoplankton increased throughout spring and summer and by early August (~year day 220) it exceeded that of the diatoms. In the Beaufort Sea, diatom and small phytoplankton productivity were relatively similar for much of the year although peak productivity of small phytoplankton lagged that of the diatoms by approximately 20 days. In the ESS and the Laptev Sea, small phytoplankton productivity exceeded that of the diatoms throughout the year. With baseline river nutrient forcing, diatoms contributed the majority of the annual primary production (Table 2) in the Barents Sea (63%) and the Laptev Sea (73%). In the Beaufort, Chukchi, and Kara Seas the contribution of the two phytoplankton groups was more even, with diatoms contributing 46-57% of annual production. In the ESS and Laptev Seas, annual production was dominated by small phytoplankton with diatoms only contributing 15% and 28% in these regions respectively. Modifying the river nutrient concentrations and/or the timing of the river nutrient input had only a small impact on the relative contribution of the two phytoplankton groups to annual production. The largest shift in contribution was a 5% increase from diatoms in the interior seas when the river nitrate was doubled (NX2, NCLIMX2S1). Modifying the river nutrient inputs to a climatology but not increasing the overall annual nutrient input from the rivers (NCLIM, NCLIMS2) resulted in zero change to the distribution of the annual primary production between the two phytoplankton groups.
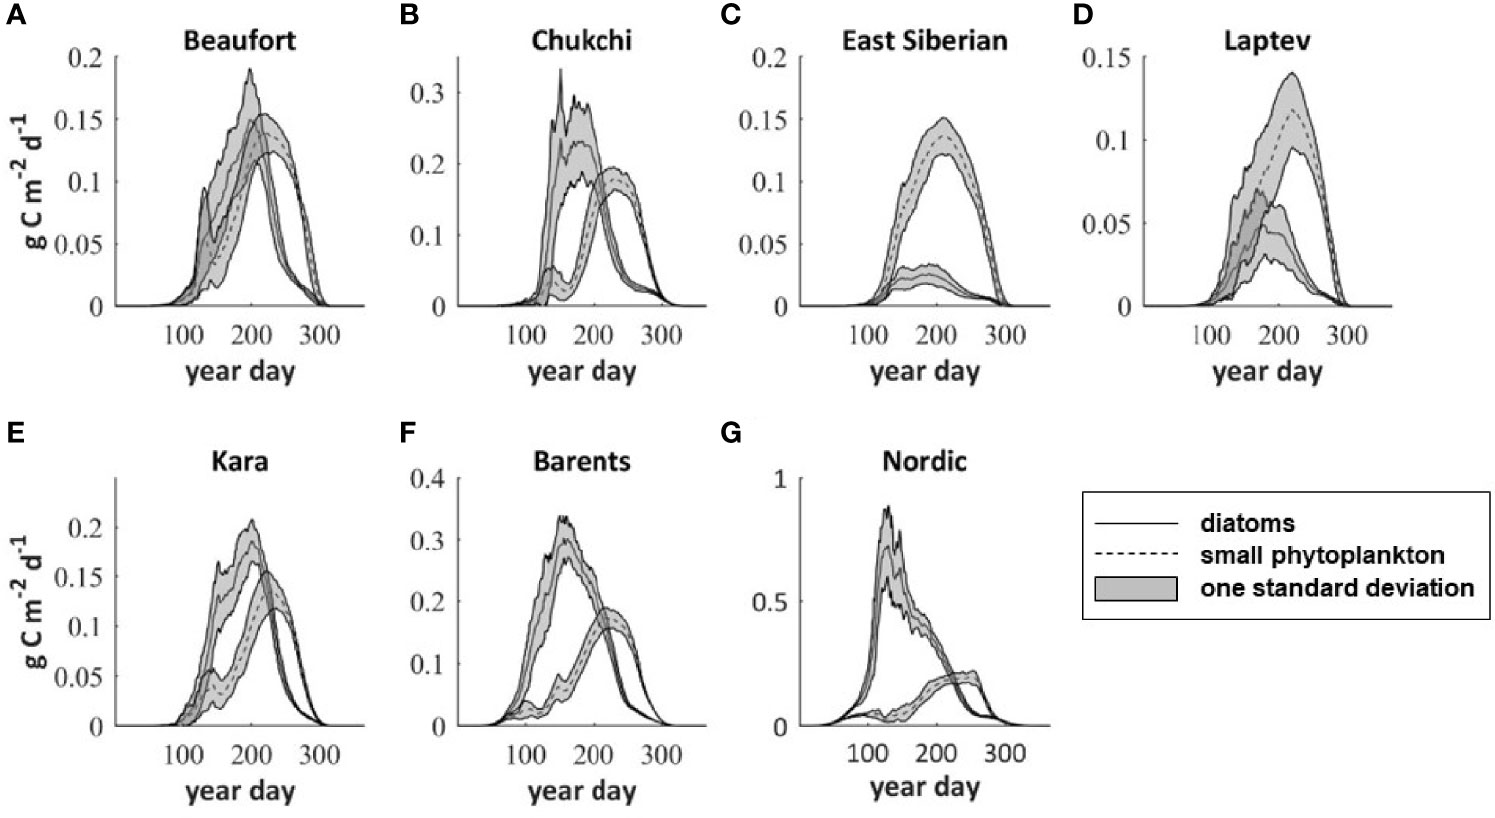
Figure 7 Regionally averaged seasonal cycle of primary production by group (diatoms and small phytoplankton) in the baseline model run for (A) Beaufort Sea (R1), (B) Chukchi Sea (R2), (C) East Siberian Sea (R3), (D) Laptev Sea (R4) (E) Kara Sea (R5), (F) Barents Sea (R6) and (G) Nordic Seas (R7). The grey shading indicates ± one standard deviation.
In the baseline model, the average bloom day (Table 2) in the Arctic coastal regions occurred in early to mid-June (year day 154-167). The Barents Sea, where it occurred in early May (year day 130), and the Nordic Seas where it occurred at the end of April (year day 119) were exceptions. Similarly, the peak in primary productivity was early May (year day 130) in the Nordic Seas coastal region and mid-July (year day 195) in the Barents Sea, but not until the end of August (year day 202-210) in the other Arctic coastal regions. Both the bloom day and the day of peak production in each coastal region were only minimally impacted, if at all, by the modification to river nutrients in each of our scenarios. The largest impact to the bloom timing was a 2-day delay in the Laptev Sea when river nutrients were input as a climatology (NCLIM) and concentrations were shifted and doubled (NCLIMX2S1). The largest impact to the productivity peak was also seen under these two river nutrient scenarios, with a shift to six days earlier in the Chukchi Sea when a climatology was imposed (NCLIM) and an analogous six-day shift in the timing of the peak in the ESS when the climatology was shifted and doubled (NCLIMX2S1).
The Fate of Primary Production
The annual average flux of POC to the sediment ranged from 0.53 g C m-2 in the Beaufort and ESS to 6.13 g C m-2 in the Chukchi Sea (Table 3). Thus, the spatial pattern of POC flux did not directly mimic the coastal Arctic primary production patterns (Table 2) which were largest in the Nordic and Barents Seas. The POC flux represented 1.8% - 15.8% of the annual primary production with the largest percentage being in the Chukchi Sea. The next largest percentages were seen in the Kara (6.4%) and Barents Sea (5.1%). The change in the flux of POC to the seafloor sediments under the different river nutrient scenarios (Figure 4D; Table 3) showed a response pattern similar to that of primary production (Figure 4C; Table 2). As was the case with the primary production response, Arctic-wide the largest changes resulted from doubling the river nutrient concentration (NX2, NclmX2S1), and regionally the biggest responses were in the Laptev (62, 77%) and Kara Seas (41, 56%). Under both of the nutrient doubling scenarios, the increase in POC flux in the Barents Sea (20, 28%) and ESS (22, 26%) coastal regions were also notable. The river nutrient scenarios which did not modify the overall annual nutrient input (NCLIM, NCLIMX2S1) only resulted in a <1-6% increase in regional POC flux. The percentage change to the annual POC flux in each coastal region relative to the baseline was ~2-4 times higher than the percentage change to the annual primary production.
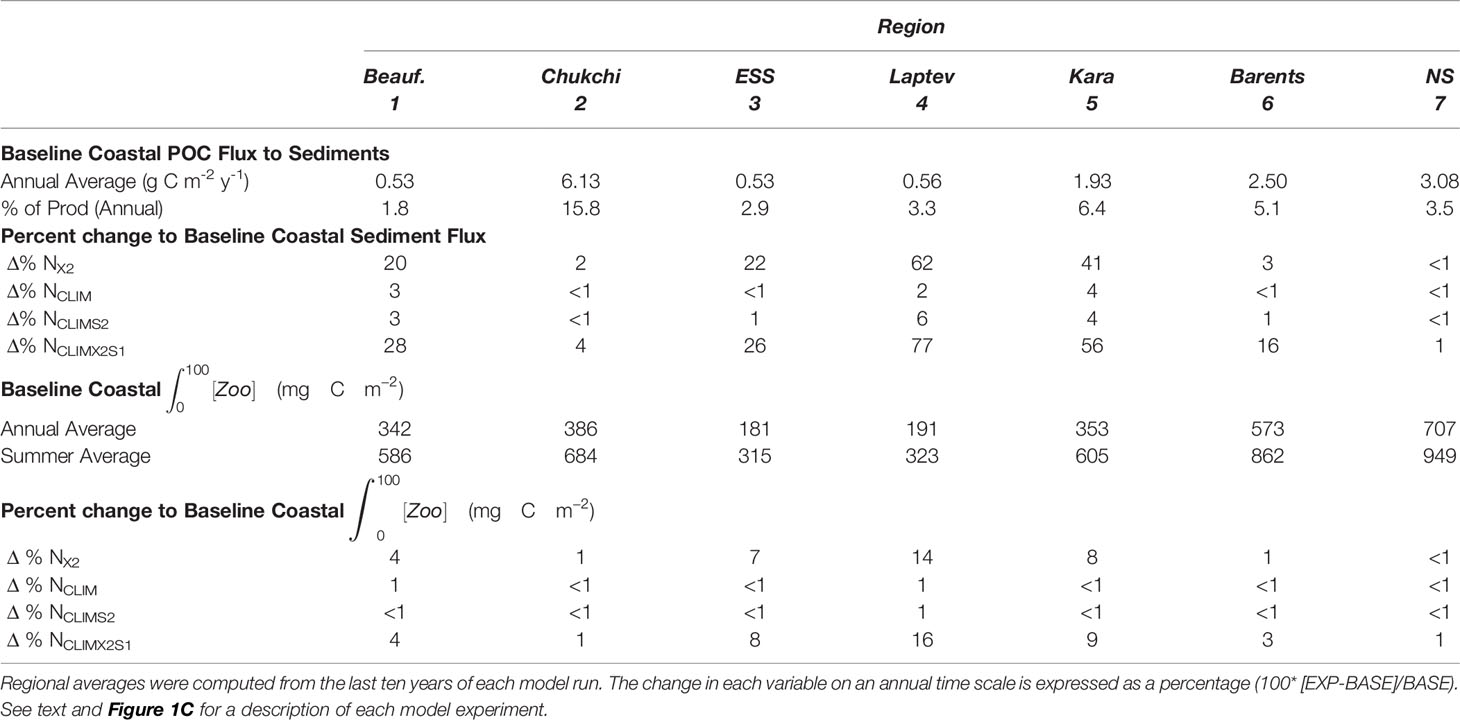
Table 3 Summary of sediment flux and zooplankton biomass in the baseline model (BASE) and the change seen in the four river nutrient model scenarios (EXP) during the summer season (June-August) and on an annual basis.
Unlike the annual average POC flux to the sediments, the spatial pattern of annual average zooplankton biomass in the coastal Arctic closely mimicked primary production (Table 3). At 707 and 573 g C m-2 respectively, the highest zooplankton biomass was in the Nordic and the Barents Seas. The annual average in the Beaufort, Chukchi, and Kara Seas was very similar (342-386 g C m-2), and the biomass was lowest in the ESS (181 g C m-2) and Laptev Sea (191 g C m-2). The summer biomass in the more interior seas was almost double the annual average. The response of zooplankton biomass to the river nutrients was very similar to the primary production response. The scenarios which input the baseline nutrients as an annual climatology but did not modify the overall annual input (NCLIM, NCLIMS2) resulted in very little (generally < 1%) change to the zooplankton biomass. Conversely, the two scenarios that doubled the nutrient concentration (NX2, NCLIMX2S1) had a similar impact on the biomass in each region, with the largest increases (7-16%) in the Laptev, Kara, and ESS and only minimal impacts (1-4%) in the more marginal seas.
Dissolved Organic Carbon
Regionally averaged baseline coastal DOC concentrations are highest in the Chukchi Sea (~20 mmol C m-3) and Kara Sea (~18 mmol C m-3) and lowest in the central Arctic Basins (Table 4). In addition to a DOC supply through the Bering Strait to the Chukchi Sea, the distribution pattern of DOC in the upper mixed layer reflects the very localized DOC input from rivers, with high concentrations close to river mouth decreasing rapidly moving offshore (Figure 8A). In each of the Arctic coastal regions, the regional average mixed layer DOC remained relatively steady from January through April but then increased to a summer peak (i.e. Figure 8B). As with river nitrogen, doubling riverine DOC concentration (DOCX2) increased the DOC concentration in the upper mixed layer of the coastal Arctic by varying degrees depending on location (Table 4 and Figure 8C). The more marginal Arctic coastal regions (i.e. Chukchi and Barents) only saw a very small (~3%) increase in DOC whereas the interior seas (i.e. Kara and Laptev) saw more than a 40% increase in the DOC concentration.
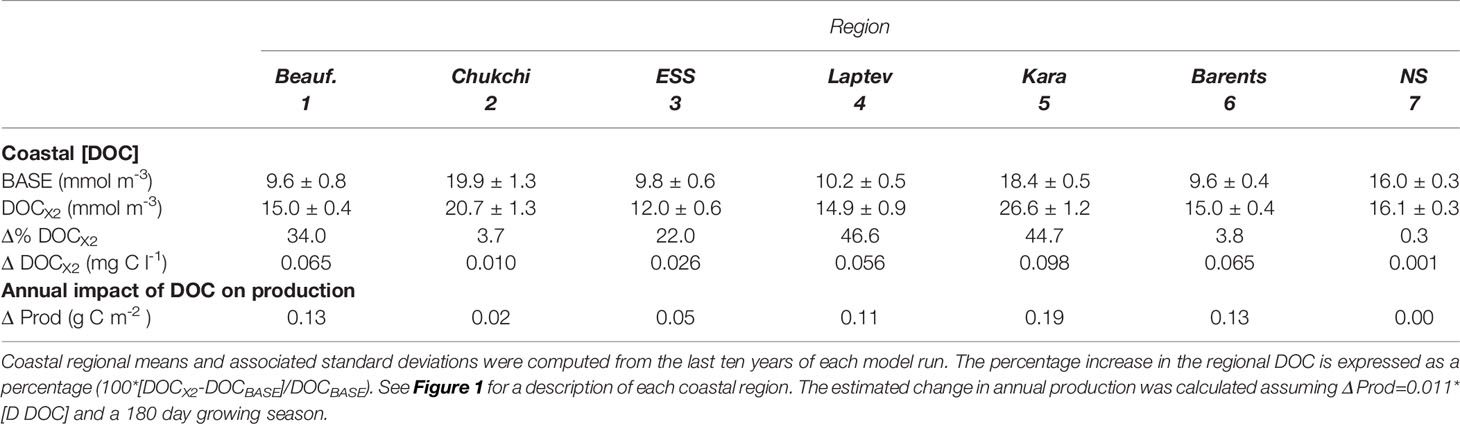
Table 4 Summary of summer (June-August) average regional DOC concentration in the baseline model (BASE) and a scenario in which river [DOC] was doubled.
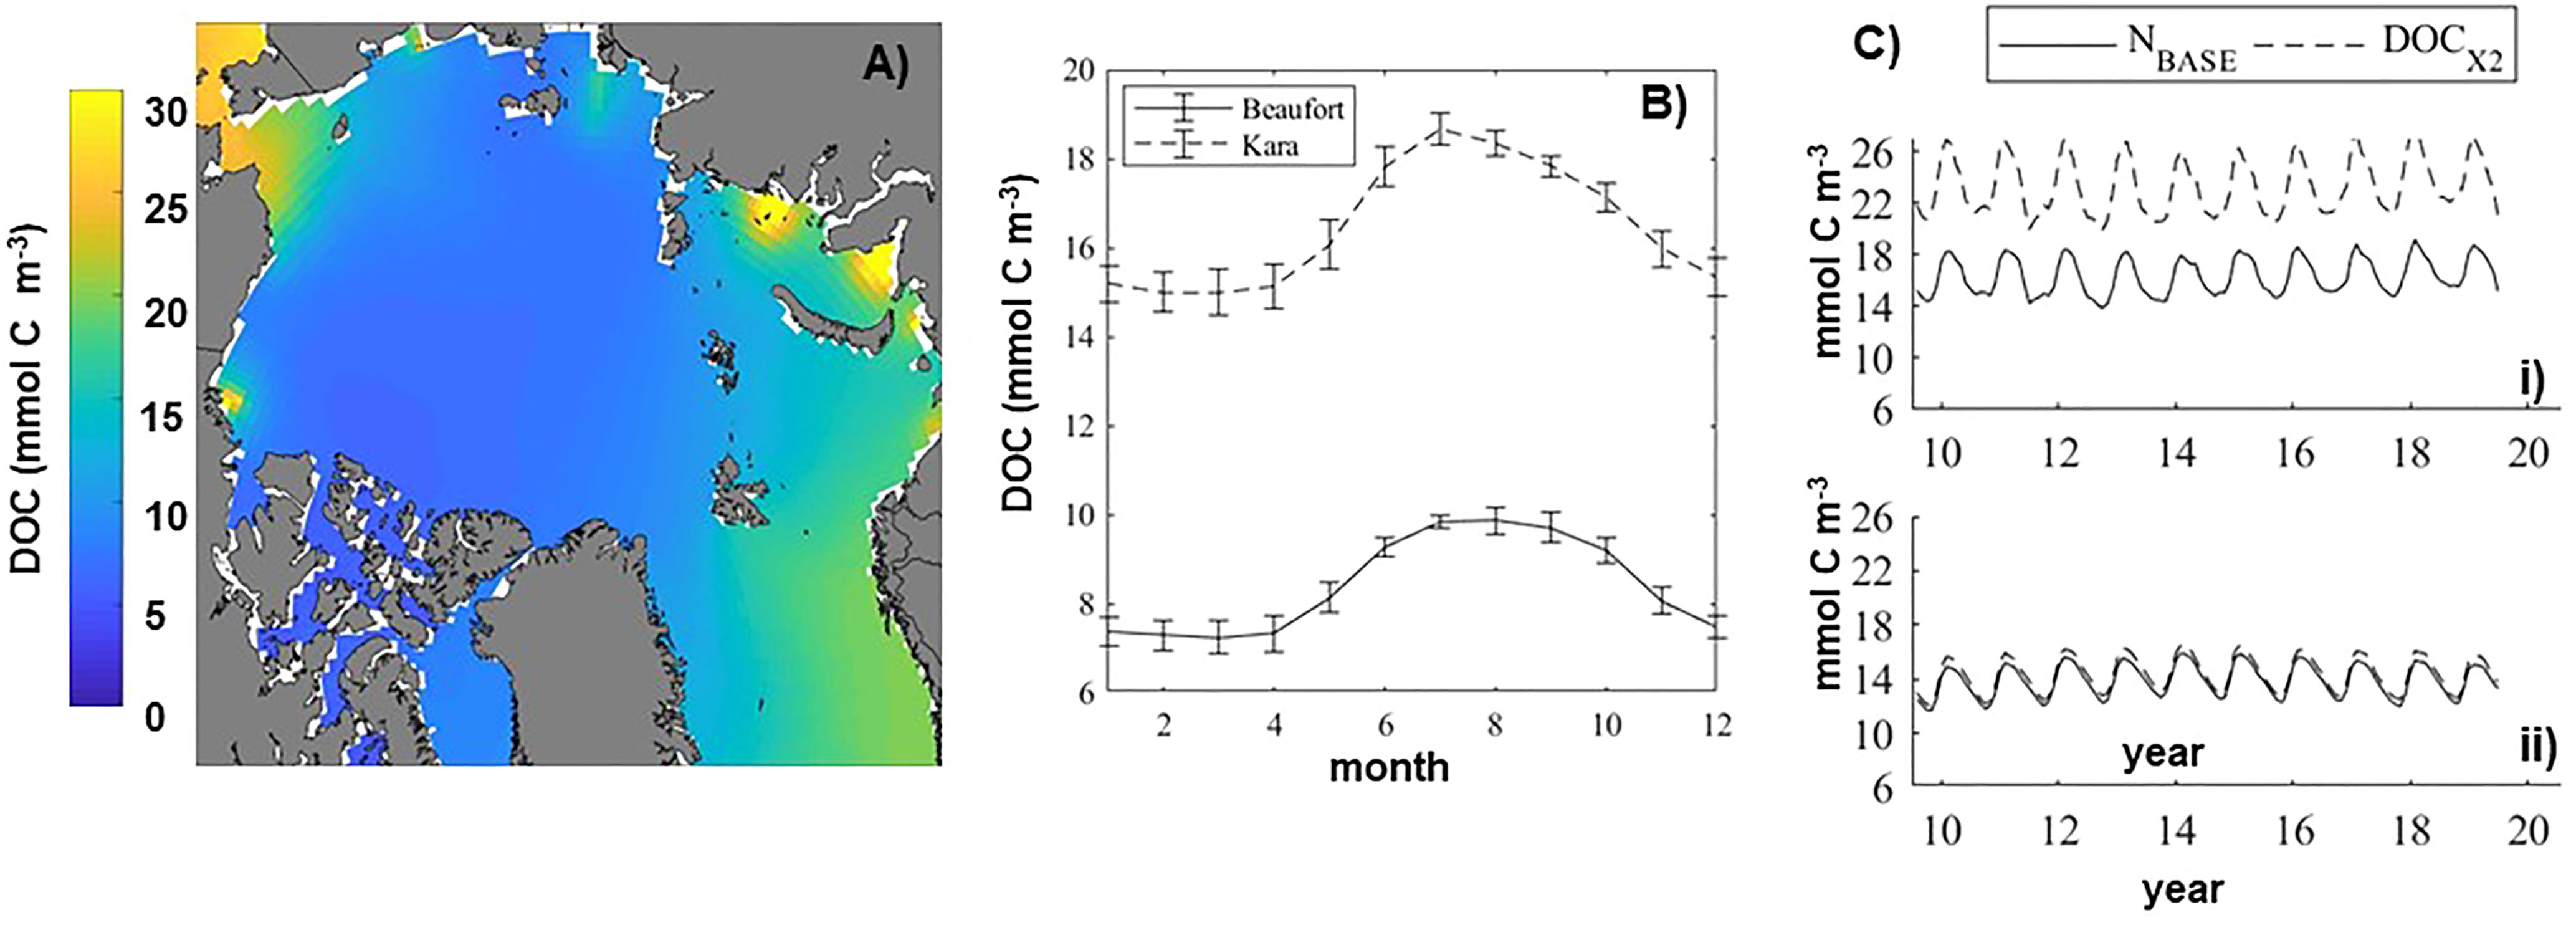
Figure 8 (A) Summer dissolved organic carbon (DOC) concentration (mmol C m-2) in the Arctic Ocean mixed layer. The average was computed over June-August for the last ten years of the baseline model simulation. (B) The baseline average seasonal climatology for the Kara and Beaufort Seas. (C) Time series of regionally averaged DOC in the coastal mixed layer regions in the baseline model and with a doubling of river DOC (DOCX2) for the Kara Sea (i) and the Beaufort Sea (ii).
The HiLAT model does not presently explicitly simulate the impact of DOC on primary production, thus baseline production estimates were not impacted by the increased levels of DOC. Using the relationship between primary production and DOC concentrations found in Arctic lakes Seekell et al. (2015) the projected change in DOC in the coastal regions due to a doubling of river concentrations will likely have only minimal impact on coastal Arctic production. Even the simulated maximal (~40 mmol C m-3 ≈ 0.48 mg l-1) DOC concentrations close to river mouths are relatively low and thus would only impact simulated baseline production by ~1g C m-2 annually. Arctic DOC may be as high as 120 µM or 1.44 mg l-1 (Gonçalves-Araujo et al., 2020) which, following the Seekell et al. (2015) relationship for Arctic lakes, would still also result in a relatively small increase of 2.9 g C m-2 annually. However, following our empirical based approach, outlined below, we show that the impact of DOC on production could be much more significant.
In the HiLAT model, the river DOC flux, as well as products from autotroph and zooplankton mortality, are added to the semi-labile DOC pool, while other components of DOC are not currently represented. If we assume that this semi-labile organic carbon (DOCSL) represents the fresh biomacromolecules that are added yearly, we need to also consider an estimate of the humic acid component.
Where DOCmodeled = average [DOC] for June over the last 10 years of the model run. To account for the riverine humics, we apply the linear DOC-Salinity relationship determined by Hansell et al. (2004, cf. Figure 4A), assuming that ninety percent of the DOC will be humics i.e.
Thus, a better estimate for total DOC in the Arctic can be considered the sum of semi-labile and riverine humics (Figure 9A), which has a maximum concentration of 293 mmol C m-3 in the coastal Kara Sea, and a value of ~70 mmol C m-3 in the central Arctic, which agrees well with past observations (Benner, 2002; Hansell et al., 2004).
From this DOC starting point, we can approximate the impact of DOC on light absorption by determining the coefficient at 375 nm (a375) in the Arctic Ocean. First, using the average a375 and DOC values determined by Stedmon et al. (2011, cf. Table 1) for each Arctic river we develop a linear relationship between a375 and DOC, forcing it through the origin since the physicochemistry of UV absorption dictates that this must be true (Figure 9B).
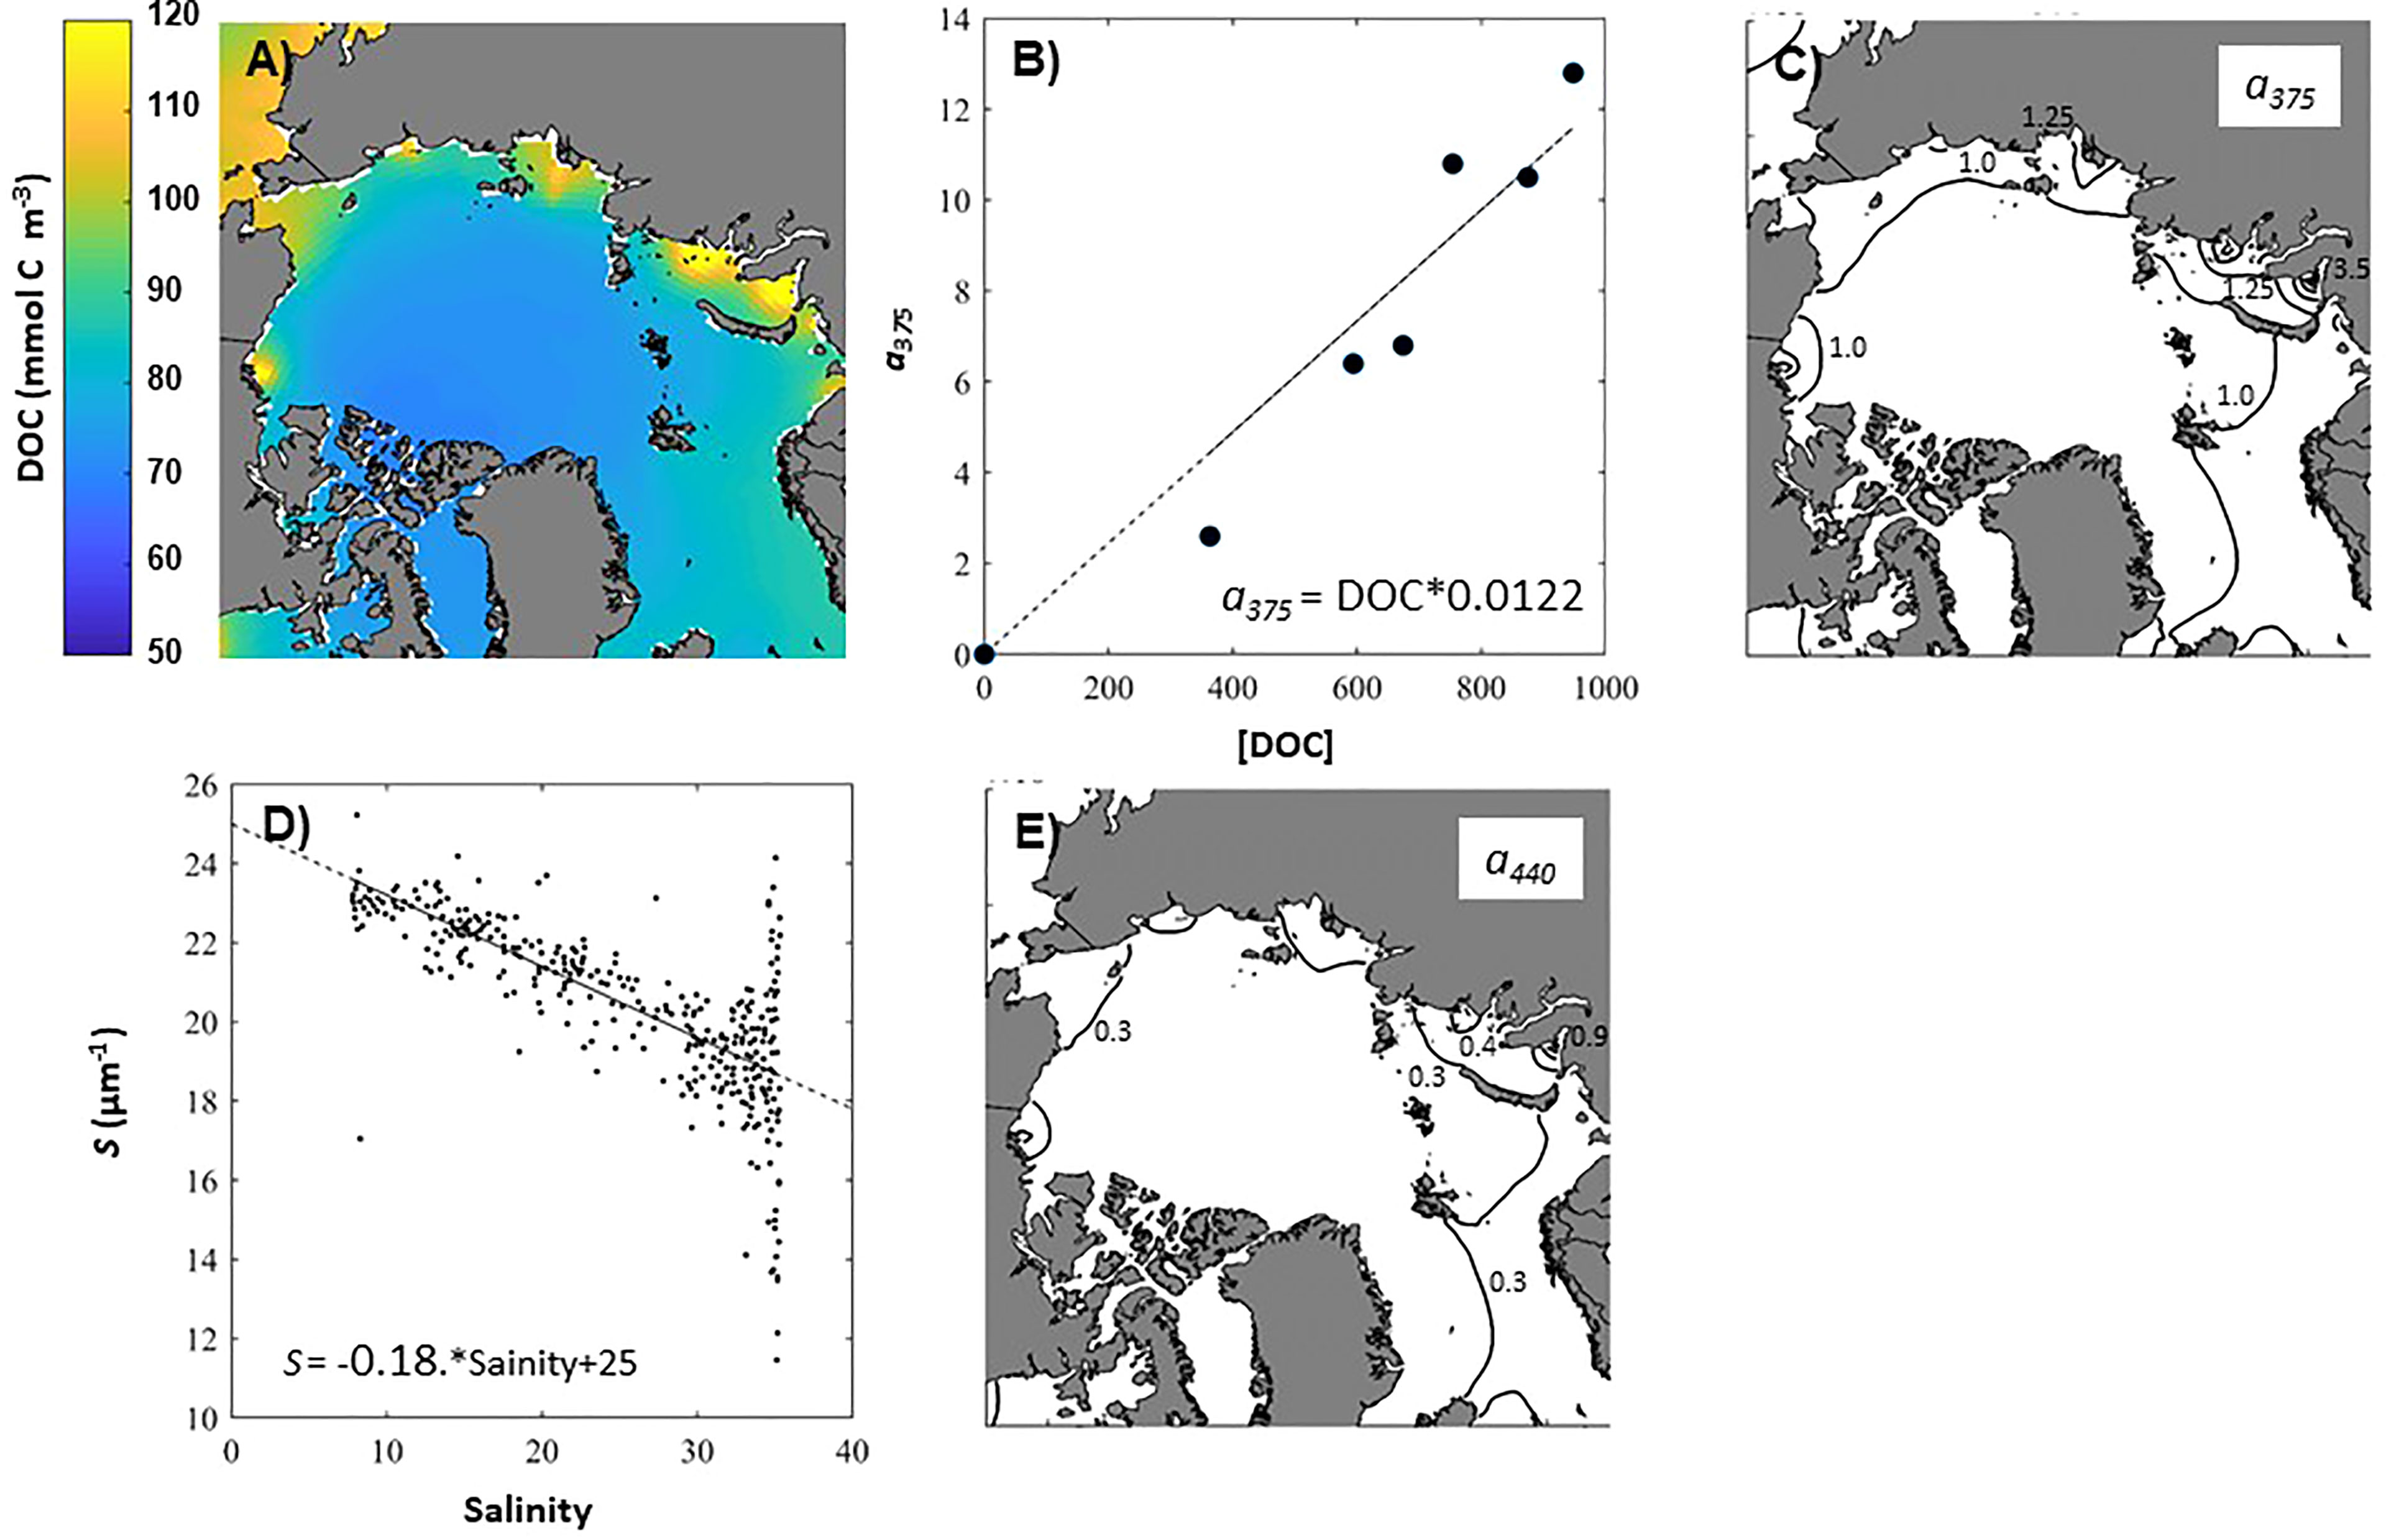
Figure 9 Estimating the impact of DOC on the attenuation of light in the Arctic. Estimated June DOC concentration including labile and humics (A), linear relationship between DOC and a375 (B), Estimation of a375 (C), linear relationship between spectral slope (S) and salinity (D), and estimation of a440 (E).
Using this relationship, we estimate a375 from the DOCTOTAL to range from ~1.0-2.5 m-1 across the Arctic, with the highest values in the Kara Sea (Figure 9C).
Finally, we convert a375 to a440, as it is the 440 nm wavelength that corresponds to the maximal absorption by algal pigments (Bricaud et al., 1981) by applying the classic absorption equation.
Where S is the spectral slope. We estimate the salinity-dependent spectral slope for open water (Figure 9D) from Stedmon et al. (2000, cf. Figure 3).
With the above assumptions, a440 across the Arctic varies from ~0.3-0.9 m-1, with the highest values again close to the river mouth in the Kara Sea (Figure 9E).
Summary and Discussion
There are multiple factors including changes in growing season length, wildfire frequency, and permafrost thaw (McGuire et al., 2009; O’Donnell et al., 2016; Hugelius et al., 2020; Rodríguez-Cardona et al., 2020) that could impact both the timing and concentration of nutrients in Arctic rivers flowing into the ocean. Capturing both the present and future variability in Arctic river inputs will be challenging, especially as different river basins will likely respond differently. Our results indicate that while the concentration of Arctic river nitrogen (DIN and DON) can have a significant impact on annual average nitrogen and primary production in the coastal Arctic, the timing of the river nutrient input into the marine environment is less important. We modify DON and DIN in the same way in each experiment so are currently unable to distinguish the relative importance of changes in either. However, in West Siberia, projected warming has been linked to a probable increase of riverine DON and total dissolved nitrogen by very similar amounts (32–53% and 30–50% respectively, Frey et al., 2007) so this assumption may be reasonable.
Impact of River Nitrogen on Marine Production
Varying the timing of the peak nutrient input in rivers throughout the year impacted the phytoplankton ‘bloom day’ and the day of peak productivity by usually only a day or two at most. The largest shift observed was a six-day earlier production peak in the ESS following a two-month shift in nutrient input. Shifting the nutrient input earlier by a month did not have any notable impact on regionally averaged production (<1-2%), and shifting the input by two months while doubling the concentrations only resulted in a ≤5% relative increase in regional production. Furthermore, we also did not see a large shift in phytoplankton community composition, from diatoms to small phytoplankton. Contribution of riverine nitrate to new primary production increases from the bloom (<1%) to July–October (5.5%, Le Fouest et al., 2013) indicating that we may have seen more of an impact on production if our experiments had shifted the river nutrient peak later, although we do not currently have reason to think this would be an observed change. Our findings suggest that despite the changing timing of nutrient inputs to the Arctic associated with changing permafrost hydrology, marine production and biophysical dynamics will continue to be primarily driven by light availability rather than nutrients.
Previously, Terhaar et al. (2021) suggested that doubling river nutrients resulted in a relative increase in annual primary production by 11% on average across the Arctic, and up to 34-35% in the Laptev and the Beaufort Sea, with the largest total regional changes being in the Barents (+4.8Tg, 6%) and the Kara (+4.4Tg, 20%). We also found the largest regional increases in production in the interior seas, which have relatively low connectivity to the Atlantic or Pacific, but at a maximum of 20% in the Laptev Sea and 14% in the Kara Sea, the changes were lower in magnitude than previously reported. In addition to using a different bio-physical model, Terhaar et al. (2019) increased river nutrients by 1%/year to achieve the concentration doubling after 70 years. The general agreement of results from the two different model constructs provides confidence in the robustness of the projected increase in production in response to river nutrient increases. In contrast to Terhaar et al. (2021), we only found a 1% increase in production in the Barents Sea with a simple doubling of nutrients. Here we doubled river nutrients only in Arctic rivers (north of 66.5°) whilst the previous investigation modified river inputs globally. The likely explanation for why the previous estimates for production increases in these regions are higher is that they are driven by additional nutrients being transported into the Arctic through the Fram Strait from rivers that discharged further south. Both total discharge and change in baseflow in Arctic rivers increase with permafrost coverage but show a weak connection to annual changes in precipitation (Song et al., 2020). While rivers outside the Arctic may see some change in nutrient concentrations, they are unlikely to see such a drastic climate-driven change to river chemistry because of the reduced amplitude of climate change and the absence of melting permafrost. Therefore, we believe that the present study provides a more realistic projection of future conditions.
Impact of River Nitrogen on Arctic Food Web Structure
Our simulations indicate that an increase in river nutrient concentration could have a relatively large impact on the POC flux to the benthos, and thus has the potential to modify Arctic food web structure and dynamics. When doubling river nutrients, the percentage increase in the POC flux on the river-influenced Arctic coastal shelves was 2-4 times the percentage increase in primary production. Sea ice extent, hydrographic forcing, and export production have been previously identified as important factors in controlling the benthic biological system (Grebmeier, 2012), and the relative timing of primary and zooplankton production in the Arctic is important in determining whether phytoplankton carbon primarily flows into the pelagic or benthic food web (Kędra et al., 2015). Climate-induced reductions in sea ice have been identified as supporting an ecosystem reorganization towards more pelagic processes (Grebmeier et al., 2006; Kędra et al., 2015) but our results suggest that an increase in river nutrients could counteract such a re-organization in coastal regions by supporting a shift towards more benthic processes. The HiLAT model currently treats secondary producers rather simplistically, with only a single zooplankton component. Additionally, microbial communities are not explicitly represented in the model, although the degradation and remineralization of riverine DOM by microbes in the Arctic Ocean could constitute a significant portion of production (Sipler et al., 2017) and thus have the potential to impact the length of the food web close to river outflows. To better understand the potential impact of changing river nutrients on the Arctic coastal food web would require more fully resolving secondary producers.
Uncertainty in River Inputs
Our experiments did not reflect all of the potential compounding factors that determine river nutrient inputs to the Arctic Ocean. However, they did allow us to explore the impact of timing and increased nutrients that may be brought about by the input of additional nutrient-rich groundwater or organic-rich overland flow. Because of the potential impact increasing river nutrients can have on coastal production (i.e. up to 20% increase in annual primary production resulting from a doubling in some regions) it is important to understand the current bounds of river nutrient concentrations throughout the Arctic, as well as how we can expect concentrations to change under likely future climate scenarios. In addition to climate-induced processes that impact river nutrients, some Arctic rivers will likely also see increases in volume discharge. Such a dilution factor makes the river nutrient changes even more challenging to predict. As a preliminary gauge of river nutrient impacts on Arctic production the experiments presented here modified all river nutrients homogeneously (i.e. doubled all Arctic river nutrient concentrations) but in reality, the Arctic is quite heterogeneous, and river nutrient concentrations will likely respond differently to climate change, in both magnitude and timing, throughout the region. Flow in interior Alaskan rivers during late fall/winter and during the snowmelt (late April/mid-May) has increased 50% over the last several decades, while post-snowmelt flow in late May and into the summer has decreased. Annually, this has resulted in a decline in annual maximum streamflow but a general increase in minimum flow (Bennett et al., 2015). Similarly, streamflow in the Ob, Yenisei, and Lena has increased over the past several decades by ∼7 - 22.0% (Wang et al., 2021). Déry et al. (2016) could detect no significant trends for rivers in Northern Canada but did see strong regional variations in seasonal trends of river discharge, with overall winter (summer) flows increasing (decreasing), except for the most recent decade. Some of these trends were partly attributed to flow regulation and storage but Holmes et al. (2019) found the long-term increase in the Eurasian Arctic discharge to be coincident increases in precipitation. In addition to diluting or concentrating river nutrients, changes to the river volume discharge will also have the potential to impact the water column stability of the coastal zone, which in turn could impact light and the vertical mixing of nutrients.
Terhaar et al. (2021) suggest that terrigenous nutrients account for 36% of the Arctic ocean NPP and sustain 59% of the production in the Kara Sea, 80% in the Laptev Sea, and 57% in the ESS. Although previously, Tremblay et al. (2015) have suggested that while nutrient supply by rivers is locally important, it does not appear to sustain a major portion of overall pan-Arctic NPP. Examining historical data, Le Fouest et al. (2013) found large differences in the contribution of rivers to new primary production across the Arctic shelf seas, but also noted that these contributions were small relative to the influence of the Bering Strait inflow. Gibson et al. (2020) have previously shown the HiLAT model to underestimate the flow of nitrate through the Bering Strait so it may be difficult to fully pin down the impact of the rivers on production unless this is rectified.
The coastal Arctic ecosystem is complex and, in addition to changes in river inputs explored here, it is experiencing changes in atmospheric temperature and sea ice cover that will also impact production (Table 5). Previously, Gibson et al. (2020) found that sea ice cover had a larger impact on Arctic production than the temperature in the Laptev, Kara, and East Siberian Seas. For example, they found a 36-47% increase in production when sea ice was artificially reduced but only a 14-20% increase in production under an atmospheric warming scenario. In the Nordic, Barents, Chukchi, and Beaufort Seas the temperature increase and sea ice reductions had a similar impact on production (~+10-20% increase depending on region). Here we have shown that the impact of doubling river nutrients was relatively small (<5% increase in annual production) in the Beaufort, Chukchi, Barents, and Nordic Seas. However, in the Laptev, Kara, and East Siberian Sea the river nutrient increase was more noticeable. In the Laptev Sea, the production increase caused by doubling river nutrients exceeded the production increase simulated with an atmospheric warming scenario (16% vs. 14%). This finding highlights the importance of factoring in river impacts into future Arctic ecosystem projections. Developing more realistic river nutrient and discharge forcing for earth system models appears key to improving both now-cast and future estimates of Arctic coastal production.
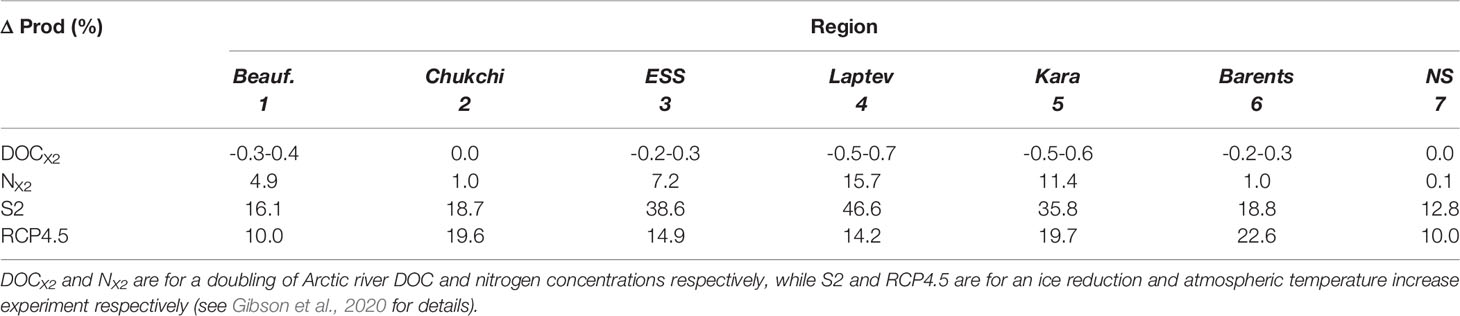
Table 5 Estimated impact of environmental variables on annual primary production in the Arctic regional seas.
There is inherent uncertainty in our estimations of the nutrients impact on marine production due to the model’s inability to resolve fine-scale coastal dynamics that may be important. Model resolution is known to impact both physical and biological simulations of the marine environment, i.e. due to better representation of the mixed layer depth and mixed layer nitrate concentration (Jin et al., 2018). At ~1-degree horizontal resolution the E3SM-HILAT model is relatively coarse and does not capture sub-mesoscale processes. Having a finer resolution model could be particularly impactful in understanding river impacts on coastal dynamics. We speculate that a finer scale model would allow the river nutrients to be distributed and mixed in the ocean model in a more heterogeneous and realistic manner; this may result in increased impacts on production closer to the coast, but reduced impacts on a broader regional scale.
River DOC and Production
The HiLAT model does not presently represent CDOM, the major light-absorbing constituent in natural waters (Stedmon et al., 2000), but we would intuitively expect light attenuation by CDOM to be sufficiently high in the near coastal region that it would, at least at certain times in the year, have a negative impact on primary production. Seekell et al. (2015) have found that in lakes there is a threshold concentration (4.8 mg C l-1) above which the relationship to primary production is negative due to light extinction inhibiting primary production and below which the relationship between DOC and production is positive, due to the associated nutrient availability. In our river DOC doubling experiment, annual DOC in the interior Arctic seas increased by as much as 46% but was still at concentrations below the threshold, suggesting the increases would not negatively impact the production assuming the relationship found by Seekell et al. (2015) for Arctic lakes holds for the Arctic Ocean. There are numerous factors, i.e. the pH and salinity, that could impact the relationship between DOC and primary production in the Arctic marine environment that should be explored further. As benthic primary production contributed to the observed whole lake primary production water depth could also impact this relationship. The depth of even the shallow coastal zones are likely deeper than the Arctic lakes examined (max mean depth of 7.6 m). However, a similar positive relationship between [DOC] and phytoplankton density and phytoplankton growth rate has also been observed in microcosm experiments of Arctic lake water (Kissman et al., 2013) indicating this relationship is probably not dependent on the benthic contribution. Our projected impact of DOC doubling on production was an order of magnitude less than seen when doubling river nitrogen, atmospheric temperature, or sea ice cover (Table 5).
However, simulated Arctic marine DOC may be underestimated and the DOC-production relationship may not apply to the saline marine environment with potentially very different nutrient limitations. DOC in the ocean comprises organic matter from soils and terrestrial plants (allochthonous) as well as from marine algae (autochthonous). DOC includes both ‘structural’ components of cells, i.e. cellulose and lignin, as well as more ‘operational’ components i.e. polysaccharides, proteins, and lipids. Lignin and cellulose are insoluble and are converted to humic acid, which is highly aromatic and long-lived, surviving around ten years in the open sea. The majority of fluvial DOC is humic and its concentrations approximately correlate to salinity in the Arctic Ocean (Hansell et al., 2004). Conversely, the polysaccharides, proteins, and lipid portion of DOC are fresher biomacromolecules that are labile with high turnover rates in the Arctic Ocean. Through a series of calculations, we have demonstrated that DOC absorption in the Arctic Ocean could be ~0.3-0.9 m-1. Light absorption by phytoplankton in the HiLAT model is dependent on Chl-a concentration but could be ~0.55 m-1 (Morel and Maritorena, 2001) at λ 440 and [Chl-a]=10 mg m-3. Thus, DOC has the potential to impact the attenuation of light at least as much as Chl-a, so could play an important role in controlling primary production across the Arctic. The DOC flux in the Mackenzie River, which provides substantial inputs of freshwater and biogeochemical constituents to the Arctic Ocean, has increased 39% since the early1970s (Tank et al., 2016). Given the unresolved potential impact of DOC on light attenuation, and the historic increase in Arctic river DOC inputs, it is important to resolve the discrepancy between these estimates of DOC impacts and those determined by applying the Seekell et al. (2015) relationship. This highlights the need to better represent DOC and its influence on light attenuation and production within the model.
Concluding Remarks
Annual primary production in the Arctic ocean may only be minimally impacted by future variability in the timing of river nutrient inputs. This suggests that Arctic production will continue to be primarily controlled by ice cover and temperature. However, in the Laptev Sea, a doubling of river nutrients increased production by the same amount as a projected temperature increase. River DOC increases result in a substantial increase in coastal marine DOC. The actual impact of the DOC on the production is currently an un-answered question, although we have illustrated that, via light attenuation, it could be of a similar magnitude as the attenuation by Chl-a. Increased river concentrations may result in a shift towards a more benthic food web.
Data Availability Statement
The E3SMv0-HiLAT source code is publicly available at http://github.com/lanl/E3SMv0-HiLAT. The supporting processed model output for this manuscript is available at 10.5281/zenodo.5062110.
Author Contributions
GG: Funding acquisition, Conceptualization, Methodology, Investigation, Formal analysis, Visualization, Writing- Original draft preparation. SE: Methodology, Writing- Original draft preparation. AP: Writing- Original draft preparation. JK: Writing - Original draft preparation. NJ: Model development Writing - Original draft preparation. All authors have read and agreed to the published version of the manuscript.
Funding
This work was supported by the Regional and Global Model Analysis (RGMA) program of the US Department of Energy’s Office of Science as a contribution to the HiLAT-RASM project. Additional support for this project was provided by the National Science Foundation, under award #173886 and by the Energy Exascale Earth System Model (E3SM) Project, funded by the US Department of Energy, Office of Science, Office of Biological and Environmental Research.
Conflict of Interest
The authors declare that the research was conducted in the absence of any commercial or financial relationships that could be construed as a potential conflict of interest.
Publisher’s Note
All claims expressed in this article are solely those of the authors and do not necessarily represent those of their affiliated organizations, or those of the publisher, the editors and the reviewers. Any product that may be evaluated in this article, or claim that may be made by its manufacturer, is not guaranteed or endorsed by the publisher.
Acknowledgments
This research used resources provided by the Los Alamos National Laboratory Institutional Computing Program. Los Alamos National Laboratory is operated by Triad National Security, LLC, for the National Nuclear Security Administration of U.S. Department of Energy (Contract No. 89233218CNA000001).
References
Aagaard K., Carmack E. C. (1989). The Role of Sea Ice and Other Fresh Water in the Arctic Circulation. J. Geophys. Res. Oceans 94 (C10), 14485–14498. doi: 10.1029/JC094iC10p14485
Arrigo K. R., Van Dijken G. L. (2015). Continued Increases in Arctic Ocean Primary Production. Prog. Oceanogr. 136, 60–70. doi: 10.1016/j.pocean.2015.05.002
Arrigo K. R., van Dijken G., Pabi S. (2008). Impact of a Shrinking Arctic Ice Cover on Marine Primary Production. Geophys. Res. Lett. 35 (19), 1–6. doi: 10.1029/2008GL035028
Benner R. (2002). “Chapter 3 - Chemical Composition and Reactivity,” in Biogeochemistry of Marine Dissolved Organic Matter. Eds. Hansell D. A., Carlson C. A. (San Diego or London: Academic Press), 59–90. doi: 10.1016/B978-012323841-2/50005-1
Bennett K. E., Cannon A. J., Hinzman L. (2015). Historical Trends and Extremes in Boreal Alaska River Basins. J Hydrol. 527, 590–607. doi: 10.1016/j.jhydrol.2015.04.065
Bricaud A., Morel A., Prieur L.. (1981). Absorption By Dissolved Organic Matter Of The Sea (Yellow Substance) In The Uv And Visible Domains, Limnol. Oceanogr. 26, 43–53.
Carmack E., Wassmann P. (2006). Food Webs and Physical–Biological Coupling on Pan-Arctic Shelves: Unifying Concepts and Comprehensive Perspectives. Prog. Oceanogr. 71 (2–4), 446–477. doi: 10.1016/j.pocean.2006.10.004
Clement Kinney J., Maslowski W., Osinski R., Jin M., Frants M., Jeffery N., et al. (2020). Hidden Production: On the Importance of Pelagic Phytoplankton Blooms Beneath Arctic Sea Ice. J. Geophys. Res. Oceans 125 (9), e2020JC016211. doi: 10.1029/2020JC016211
CliC/AMAP/IASC. (2016). The Arctic Freshwater System in a Changing Climate WCRP Climate and Cryosphere (CliC) Project, Arctic Monitoring and Assessment Programme (AMAP), International Arctic Science Committee (IASC) Narayana Press, Gylling DK-8300 Odder, DenmarkISBN – 978-82-7971-097-4. Available at: http://hdl.handle.net/11374/1854.
Dai A., Qiam T., Trenberth K. E. (2009). Changes in Continental Freshwater Discharge From 1948 to 2004. J. Clim. 22, 2773–2792. doi: 10.1175/2008JCLI2592.1
Dai A., Trenberth K. E. (2002). Estimates of Freshwater Discharge From Continents: Latitudinal and Seasonal Variations. J. Hydrometeorol. 3, 660–687. doi: 10.1175/1525-7541(2002)003<0660:EOFDFC>2.0.CO;2
Deal C., Jin M., Elliott S., Hunke E., Maltrud M., Jeffery N. (2011). Large-Scale Modeling of Primary Production and Ice Algal Biomass Within Arctic Sea Ice in 1992. J. Geophysical Research: Oceans 116 (7), 1–14. doi: 10.1029/2010JC006409
Déry S. J., Stadnyk T. A., MacDonald M. K., Gauli-Sharma B. (2016). Recent Trends and Variability in River Discharge Across Northern Canada. Hydrology Earth System Sci. 20, 4801– 4818. doi: 10.5194/hess-20-4801-2016
Dittmar T., Kattner G. (2003). The Biogeochemistry of the River and Shelf Ecosystem of the Arctic Ocean: A Review. Mar. Chem. 83 (3–4), 103–120. doi: 10.1016/S0304-4203(03)00105-1
Findlay H. S., Gibson G., Kędra M., Morata N., Orchowska M., Pavlov A. K., et al. (2015). Responses in Arctic Marine Carbon Cycle Processes: Conceptual Scenarios and Implications for Ecosystem Function. Polar Res. 34, 24252. doi: 10.3402/polar.v34.24252
Frey K. E., Comiso J. C., Cooper L. W., Grebmeier J. M., Stock L. V. (2020). “Arctic Ocean Primary Productivity: The Response of Marine Algae to Climate Warming and Sea Ice Decline,” in Arctic Report Card 2019. Eds. Richter-Menge J., Druckenmiller M. L., Jeffries M.. doi: 10.25923/vtdn-2198
Frey K. E., McClelland J. W., Holmes R. M., Smith L. C. (2007). Impacts of Climate Warming and Permafrost Thaw on the Riverine Transport of Nitrogen and Phosphorus to the Kara Sea. J. Biogeosciences 112 (G4), G04S58. doi: 10.1029/2006JG000369
Fritz M., Vonk J., Lantuit H. (2017). Collapsing Arctic Coastlines. Nat. Clim. Change 7, 6–7. doi: 10.1038/nclimate3188
Gibson G. A., Weijer W., Jeffery N., Wang S. (2020). Relative Impact of Sea Ice and Temperature Changes on Arctic Marine Production. J. Biogeosciences 125 (7), e2019JG005343. doi: 10.1029/2019JG005343
Gonçalves-Araujo R., Stedmon C. A., de Steur L., Osburn C. L., Granskog M. A. (2020). A Decade of Annual Arctic DOC Export With Polar Surface Water in the East Greenland Current. Geophys. Res. Lett. 47, e2020GL089686. doi: 10.1029/2020GL089686
Goosse H., Kay J. E., Armour K. C., Bodas-Salcedo A., Chepfer H., Docquier D., et al. (2018). Quantifying Climate Feedbacks in Polar Regions. Nat. Commun. 9, 1919. doi: 10.1038/s41467-018-04173-0
Grebmeier J. M. (2012). Shifting Patterns of Life in the Pacific Arctic and Sub-Arctic Seas. Ann. Rev. Mar. Sci. 4, 63–78. doi: 10.1146/annurev-marine-120710-100926
Grebmeier J. M., Cooper L. W., Feder H. M., Sirenko B. I. (2006). Ecosystem Dynamics of the Pacific-Influenced Northern Bering and Chukchi Seas in the Amerasian Arctic. Prog. Oceanography 71 (2–4), 331–361. doi: 10.1016/j.pocean.2006.10.001
Griffies S. M., Biastoch A., Böning C., Bryan F., Danabasoglu G., Chassignet E. P., et al. (2009). Coordinated Ocean-Ice Reference Experiments (COREs). Ocean Model. 26 (1–2), 1–46. doi: 10.1016/j.ocemod.2008.08.007
Griffies S. M., Winton M., Samuels B., Danabasoglu G., Yeager S., Marsland S., et al. (2012) Datasets and Protocol for the CLIVAR WGOMD Coordinated Ocean-Sea Ice Reference Experiments (COREs). Available at: https://data1.gfdl.noaa.gov/~nnz/mom4/COREv2/doc/CORE_notes.23oct2012.pdf.
Gruber S., Hoelzle M., Haeberl W. (2004). Permafrost Thaw and Destabilization of Alpine Rock Walls in the Hot Summer of 2003. Geophys. Res. Lett. 31, L1350. doi: 10.1029/2004GL020051
Hansell D. A., Kadko D., Bates N. R. (2004). Degradation of Terrigenous Dissolved Organic Carbon in the Western Arctic Ocean. Science 304 (5672), 858–861. doi: 10.1126/science.1096175
Hecht M., Veneziani M., Weijer W., Kravitz B., Burrows S., Comeau D., et al. (2019). E3SMv0-HiLAT: A Modified Climate System Model Targeted for the Study of High-Latitude Processes. J. Adv. Model. Earth Syst. 11 (8), 2814–2843. doi: 10.1029/2018MS001524
Henley S. F., Porter M., Hobbs L., Braun J., Guillaume-Castel R., Venables E. J., et al. (2020). Nitrate Supply and Uptake in the Atlantic Arctic Sea Ice Zone: Seasonal Cycle, Mechanisms and Drivers. Phil. Trans. R. Soc A. 378, 20190361. doi: 10.1098/rsta.2019.0361
Holmes R. M., Coe M. T., Fiske G. J., Gurtovaya T., McClelland J. W., Shiklomanov A. I., et al. (2012). “Climate Change Impacts on the Hydrology and Biogeochemistry of Arctic Rivers,” in Climatic Change and Global Warming of Inland Waters: Impacts and Mitigation for Ecosystems and Societies. Eds. Goldman C. R., Kumagai M., Robarts R. D., Chapter 1. 1–26. doi: 10.1002/9781118470596.ch1
Holmes R. M., Coe M. T., Fiske G. J., Gurtovaya T., McClelland J. W., Shiklomanov A. I., et al. (2013). “Climate Change Impacts on the Hydrology and Biogeochemistry of Arctic Rivers,” in Climatic Change and Global Warming of Inland Waters: Impacts and Mitigation for Ecosystems and Societies. Eds. Goldman C. R., Kumagai M., Robarts R. D. (John Wiley and Sons, Ltd), 1–26. doi: 10.1002/9781118470596.ch1
Holmes R. M., Shiklomanov A. I., Suslova A., Tretiakov M., McClelland J. W., Spencer R. G. M., et al. (2019). River Discharge [in “State of the Climate in 2018”]. Bull. Amer. Meteor. Soc 100 (9), 161–163. doi: 10.1175/2019BAMSStateoftheClimate.1
Hugelius G., Loisel J., Chadburn S., Jackson R. B., Jones M., MacDonald G., et al. (2020). Large Stocks of Peatland Carbon and Nitrogen are Vulnerable to Permafrost Thaw. Proc. Natl. Acad. Sci. 117 (34), 20438–20446. doi: 10.1073/pnas.1916387117
Hunke E., Lipscomb W., Turner A., Jeffery N., Elliot S. (2015). CICE: The Los Alamos Sea Ice Model. Documentation and Software User’s Manual Version 5.1 (Tech. Rep. No. LA-CC-06-012) (Los Alamos, NM: Los Alamos National Laboratory). Available at: http://www.ccpo.odu.edu/~klinck/Reprints/PDF/cicedoc2015.pdf.
Jayasinghe A., Elliot S., Piliouras A., Clement Kinney J., Gibson G. A., Jeffery N., et al. (2020). Modeling Functional Organic Chemistry in Arctic Rivers: An Idealized Siberian System. Atmosphere 11, 1090. doi: 10.3390/atmos11101090
Jeffery N., Maltrud M. E., Hunke E. C., Wang S., Wolfe J., Turner A. K., et al. (2020). Investigating Controls on Sea Ice Algal Production Using E3SMv1.1-BGC. Ann. Glaciol. 61 (82), 51–72. doi: 10.1017/aog.2020.7
Jin M., Deal C., Maslowski W., Matrai P., Roberts A., Osinski R., et al. (2018). Effects of Model Resolution and Ocean Mixing on Forced Ice-Ocean Physical and Biogeochemical Simulations Using Global and Regional System Models. J. Geophys. Res. Oceans 123, 358–377. doi: 10.1002/2017JC013365
Jin M., Deal C. J., Wang J., Shin K. H., Tanaka N., Whitledge T. E., et al. (2006). Controls of the Landfast Ice-Ocean Ecosystem Offshore Barrow, Alaska. Ann. Glaciology 44, 63–72. doi: 10.3189/172756406781811709
Kędra M., Moritz C., Choy E. S., David C., Degen R., Duerksen S., et al. (2015). Status and Trends in the Structure of Arctic Benthic Food Webs. Polar Res. 34 (1). doi: 10.3402/polar.v34.23775
Kapsch M. L., Eicken H., Robards M. (2010). “Sea Ice Distribution and Ice Use by Indigenous Walrus Hunters on St. Lawrence Island, Alaska,” in SIKU: Knowing Our Ice (Dordrecht: Springer), (pp. 115–144).
Khosh M. S., McClelland J. W., Jacobson A. D., Douglas T. A., Barker A. J., Lehn G. O. (2017). Seasonality of Dissolved Nitrogen From Spring Melt to Fall Freezeup in Alaskan Arctic Tundra and Mountain Streams. J. Geophys. Res. Biogeosciences 122, 1718–1737. doi: 10.1002/2016JG003377
Kissman C. E. H., Williamson C. E., Rose K. C., Saros J. E. (2013). Response of Phytoplankton in an Alpine Lake to Inputs of Dissolved Organic Matter Through Nutrient Enrichment and Trophic Forcing. Limnol. Oceanogr. 58, 867–880. doi: 10.4319/lo.2013.58.3.0867
Kivinen S., Kaarlejärvi E., Jylhä K., Räisänen J. (2012). Spatiotemporal Distribution of Threatened High-Latitude Snowbed and Snow Patch Habitats in Warming Climate. Environ. Res. Lett. 7, 34024. doi: 10.1088/1748-9326/7/3/034024
Lammers R. B., Shiklomanov A. I., Vörösmarty C. J., Fekete B. M., Peterson B. J. (2001). Assessment of Contemporary Arctic River Runoff Based on Observational Discharge Records. J. Geophys. Res. Atmospheres 106 (D4), 3321–3334. doi: 10.1029/2000JD900444
Large W. G., Yeager S. G. (2009). The Global Climatology of an Interannually Varying Air - Sea Flux Data Set. Clim. Dyn. 33 (2–3), 341–364. doi: 10.1007/s00382-008-0441-3
Le Fouest V., Babin M., Tremblay J.-É. (2013). The Fate of Riverine Nutrients on Arctic Shelves. Biogeosciences 10, 3661–3677. doi: 10.5194/bg-10-3661-2013
Lewis K. M., van Dijken G. L., Arrigo K. R. (2020). Changes in Phytoplankton Concentration Now Drive Increased Arctic Ocean Primary Production. Science 369 (6500), 198–202. doi: 10.1126/science.aay8380
Manizza M., Follows M. J., Dutkiewicz S., McClelland J. W., Menemenlis D., Hill C. N., et al. (2009). Modeling Transport and Fate of Riverine Dissolved Organic Carbon in the Arctic Ocean. Glob. Biogeochem. Cycles 23, GB4006. doi: 10.1029/2008GB003396
Manizza M., Follows M. J., Dutkiewicz S., Menemenlis D., McClelland J. W., Hill C. N., et al. (2011). A Model of the Arctic Ocean Carbon Cycle. J. Geophys. Res. Oceans 116, C12020. doi: 10.1029/ 2011JC006998
Mayorga E., Seitzinger S. P., Harrison J. A., Dumont E., Beusen A. H. W., Bouwman A. F., et al. (2010). Global Nutrient Export From WaterSheds 2 (NEWS 2): Model Development and Implementation. Environ. Model. Software 25 (7), 837–853. doi: 10.1016/j.envsoft.2010.01.007
McGuire D. A., Anderson L. G., Christensen T. R., Dallimore S., Guo L., Hayes D. J., et al. (2009). Sensitivity of the Carbon Cycle in the Arctic to Climate Change. Ecolo. Monogr. 79, 523–555. doi: 10.1890/08-2025.1
Menard H. W., Smith S. M. (1966). Hypsometry of Ocean Basin Provinces. J. Geophys. Res. 71 4305–,4325.
Moore K. J., Doney S. C., Kleypas J. A., Glover D. M., Fung I. Y. (2002). An Intermediate Complexity Marine Ecosystem Model for the Global Domain. Deep-Sea Res. II: Top. Stud. Oceanogr. 49 403–462. doi: 10.1016/S0967-0645(01)00108-4
Moore J. K., Doney S. C., Lindsay K. (2004). Upper Ocean Ecosystem Dynamics and Iron Cycling in a Global Three-Dimensional Model. Glob. Biogeochem. Cycles 18 (4) GB4028. doi: 10.1029/2004GB002220
Morel A., Maritorena S. (2001). Bio-Optical Properties of Oceanic Waters: A Reappraisal. J. Geophys. Res. Oceans 106 (C4), 7163–7180. doi: 10.1029/2000JC000319
OˈDonnell J. A., Aiken G. R., Swanson D. K., Panda S., Butler K. D., Baltensperger A. P. (2016). Dissolved Organic Matter Composition of Arctic Rivers: Linking Permafrost and Parent Material to Riverine Carbon. Glob. Biogeochem. Cycles 30, 1811–1826. doi: 10.1002/2016GB005482
Overeem I., Syvitski J. P. M. (2010). Shifting Discharge Peaks in Arctic Rivers 1977–2007. Geogr. Ann. A: Phys. Geogr. 92:2, 285–296. doi: 10.1111/j.1468-0459.2010.00395.x
Pabi S., van Dijken G. L., Arrigo K. R. (2008). Primary Production in the Arctic Ocean 1998-2006. J. Geophys. Res. Oceans 113 (8), C08005. doi: 10.1029/2007JC004578
Peterson B. J., Corliss T., Kriet K., Hobbie J. E. (1992). Nitrogen and Phosphorus Concentrations and Export for the Upper Kuparuk River on the North Slope of Alaska in 1980. Hydrobiol. 240, 61–69. doi: 10.1007/BF00013452
Peterson B. J., Holmes R. M., McClelland J. W., Vörösmarty C. J., Lammers R. B., Shiklomanov A. I., et al. (2002). Increasing River Discharge to the Arctic Ocean. Science 298 (5601), 2171–2173. doi: 10.1126/science.1077445
Popova E. E., Yool A., Coward A. C., Dupont F., Deal C., Elliott S., et al. (2012). What Controls Primary Production in the Arctic Ocean? Results From an Intercomparison of Five General Circulation Models With Biogeochemistry. J. Geophys. Res. Atmospheres 117, C00D12. doi: 10.1029/2011JC007112
Randelhoff A., Holding J., Janout M., Sejr M. K., Babin M., Tremblay J.-E., et al. (2020). Pan-Arctic Ocean Primary Production Constrained by Turbulent Nitrate Fluxes. Front. Mar. Sci. 7 (150). doi: 10.3389/fmars.2020.00150
Rodríguez-Cardona B. M., Coble A. A., Wymore A. S., Kolosov R., Podgorski D. C., Zito P., et al. (2020). Wildfires Lead to Decreased Carbon and Increased Nitrogen Concentrations in Upland Arctic Streams. Sci. Rep. 10, 8722. doi: 10.1038/s41598-020-65520-0
Seekell D. A., Lapierre J.-F., Ask J., Bergström A.-K., Deininger A., Rodríguez P., et al. (2015). The Influence of Dissolved Organic Carbon on Primary Production in Northern Lakes. Limnol. Oceanogr. 60, 1276–1285. doi: 10.1002/lno.10096
Seitzinger S. P., Mayorga E., Bouwman A. F., Kroeze C., Beusen A. H. W., Billen G., et al. (2010). Global River Nutrient Export: A Scenario Analysis of Past and Future Trends. Glob. Biogeochem. Cycles 24 (4), GB0A08. doi: 10.1029/2009GB003587
Serreze M. C., Barrett A. P., Slater A. G., Woodgate R. A., Aagaard K., Lammers R. B., et al. (2006). The Large-Scale Freshwater Cycle of the Arctic. J. Geophys. Res. 111 (C11010). doi: 10.1029/2005JC003424
Sipler R. E., Kellogg C. T. E., Connelly T. L., Roberts Q. N., Yager P. L., Bronk D. A. (2017). Microbial Community Response to Terrestrially Derived Dissolved Organic Matter in the Coastal Arctic. Front. Microbiol. 8. doi: 10.3389/fmicb.2017.01018
Song C., Wang G., Mao T., Dai J., Yang D. (2020). Linkage Between Permafrost Distribution and River Runoff Changes Across the Arctic and the Tibetan Plateau. Sci. China Earth Sci. 63, 292–302. doi: 10.1007/s11430-018-9383-6
Stedmon C. A., Amon R. M. W., Rinehart A. J., Walker S. A. (2011). The Supply and Characteristics of Colored Dissolved Organic Matter (CDOM) in the Arctic Ocean: Pan Arctic Trends and Differences. Mar. Chem. 124 (1–4), 108–118. doi: 10.1016/j.marchem.2010.12.007
Stedmon C. A., Markager S., Kaas H. (2000). Optical Properties and Signatures of Chromophoric Dissolved Organic Matter (CDOM) in Danish Coastal Waters. Estuar. Coast. Shelf Sci. 51 (2), 267–278. doi: 10.1006/ecss.2000.0645
Steele M., Morley R., Ermold W. (2001). PHC: A Global Ocean Hydrography With a High Quality Arctic Ocean. J. Clim. 14, 2079–2087. doi: 10.1175/1520-0442(2001)014<2079:PAGOHW>2.0.CO;2
Tank S. E., Manizza M., Holmes R. M., McClelland J. W., Peterson B. J. (2012). The Processing and Impact of Dissolved Riverine Nitrogen in the Arctic Ocean. Estuaries Coast 35, 401–415. doi: 10.1007/s12237-011-9417-3
Tank S. E., Striegl R. G., McClelland J. W., Kokelj S. V. (2016). Multi-Decadal Increases in Dissolved Organic Carbon and Alkalinity Flux From the Mackenzie Drainage Basin to the Arctic Ocean. Environ. Res. Lett. 11 (5), 54015. doi: 10.1088/1748-9326/11/5/054015
Terhaar J., Lauerwald R., Regnier P., Gruber N., Bopp L. (2021). Around One Third of Current Arctic Ocean Primary Production Sustained by Rivers and Coastal Erosion. Nat. Commun. 12, 169. doi: 10.1038/s41467-020-20470-z
Terhaar J., Orr J. C., Ethé C., Regnier P., Bopp L. (2019). Simulated Arctic Ocean Response to Doubling of Riverine Carbon and Nutrient Delivery. Glob. Biogeochem. Cycles 33, 1048–1070. doi: 10.1029/2019GB006200
Townsend-Small A., McClelland J. W., Holmes R. M., Peterson B. J. (2011). Seasonal and Hydrologic Drivers of Dissolved Organic Matter and Nutrients in the Upper Kuparuk River, Alaskan Arctic. Biogeochemistry 103, 109–124. doi: 10.1007/s10533-010-9451-4
Tremblay J., Anderson L. G., Matrai P., Coupel P., Bélanger S., Michel C., et al. (2015). Global and Regional Drivers of Nutrient Supply, Primary Production and CO2 Drawdown in the Changing Arctic Ocean. Prog. Oceanogr. 139, 171–196. doi: 10.1016/j.pocean.2015.08.009
Turner A. K., Hunke E. C. (2015). Impacts of a Mushy-Layer Thermodynamic Approach in Global Sea-Ice Simulations Using the CICE Sea-Ice Model. J. Geophys. Res. Oceans 120, 1253–1275. doi: 10.1002/2014JC010358
Wang S., Elliott S., Maltrud M., Cameron-Smith P. (2015). Influence of Explicit Phaeocystis Parameterizations on the Global Distribution of Marine Dimethyl Sulfide. J. Geophys. Res. Biogeosci. 120, 2158–2177. doi: 10.1002/2015JG003017
Wang K., Zhang T., Yang D. (2021). Permafrost Dynamics and Their Hydrologic Impacts Over the Russian Arctic Drainage Basin. Adv. Clim. Change Res. 12 (4), 482–498. doi: 10.1016/j.accre.2021.03.014
Williams W. J., Carmack E. C. (2015). The ‘Interior’ Shelves of the Arctic Ocean: Physical Oceanographic Setting, Climatology and Effects of Sea-Ice Retreat on Cross-Shelf Exchange. Prog. Oceanogr. 139, 24–41. doi: 0.1016/j.pocean.2015.07.008
Keywords: production, earth system model (ESM), marine ecosystem, coastal, river nutrients, Arctic Ocean
Citation: Gibson GA, Elliot S, Clement Kinney J, Piliouras A and Jeffery N (2022) Assessing the Potential Impact of River Chemistry on Arctic Coastal Production. Front. Mar. Sci. 9:738363. doi: 10.3389/fmars.2022.738363
Received: 08 July 2021; Accepted: 11 April 2022;
Published: 18 May 2022.
Edited by:
Anas Ghadouani, University of Western Australia, AustraliaReviewed by:
Sophia Barinova, University of Haifa, IsraelAmber Holdsworth, Department of Fisheries and Oceans, Canada
Copyright © 2022 Gibson, Elliot, Clement Kinney, Piliouras and Jeffery. This is an open-access article distributed under the terms of the Creative Commons Attribution License (CC BY). The use, distribution or reproduction in other forums is permitted, provided the original author(s) and the copyright owner(s) are credited and that the original publication in this journal is cited, in accordance with accepted academic practice. No use, distribution or reproduction is permitted which does not comply with these terms.
*Correspondence: Georgina A. Gibson, Z2FnaWJzb25AYWxhc2thLmVkdQ==