 Feng Mei1,2†Chaoshuo Zhang2,3†Bin Luo2,4Dongxu Zhang2,3Shaoqiu Hu2,5Jianghui Bao2Yuxi Lian6Daxian Zhao1,7*
 Ming Duan2*
- 1School of Life Sciences, Nanchang University, Nanchang, China
- 2State Key Laboratory of Freshwater Ecology and Biotechnology, Institute of Hydrobiology, Chinese Academy of Sciences, Wuhan, China
- 3College of Advanced Agricultural Sciences, University of Chinese Academy of Sciences, Beijing, China
- 4College of Animal Science, Guizhou University, Guiyang, China
- 5College of Fisheries, Huazhong Agricultural University, Wuhan, China
- 6College of Life Science, Anqing Normal University, Anqing, China
- 7Fisheries Laboratory, Chongqing Research Institute of Nanchang University, Chongqing, China
Hydroacoustics is a non-invasive fish stock assessment sampling technique that plays an important role in fishery science and management. However, non-standard hydroacoustic surveys could lead to biased results, and the factor of the sampling period (e.g., season and diel cycle) is extremely critical as it can greatly affect hydroacoustic results. Efforts to improve the accuracy and credibility of the hydroacoustic survey results are getting more and more attention. Thus, we conducted two diel hydroacoustic surveys in situ in summer and winter to detect whether there were diel and seasonal differences in density, Target Strength (TS) and vertical distribution of fish. The results indicated that nighttime had significantly higher fish mean density than daytime in summer and winter. No significant difference between summer and winter daytime, however, significant difference between summer and winter nighttime, but this bias could be accepted from the fisheries management perspective; The mean TS of the summer daytime was significantly higher than that of summer nighttime, winter daytime and winter nighttime, but there were no significant differences among summer nighttime, winter daytime, and winter nighttime, mainly due to mean TS may be overestimated from fish schooling behavior during summer daytime; The fish vertical distribution had significant seasonal correlations and was more dispersed in different water layers during the nighttime, proving that the assessment was better at nighttime than during the daytime. Consequently, the hydroacoustic surveys in Yudong Reservoir and other similar plateau deep water reservoirs should be performed at nighttime, which will yield relatively accurate density and TS, and dispersed vertical distribution of fish.
1 Introduction
The hydroacoustic technique has been developed for decades and is now considered a robust and reliable method (MacLennan and Simmonds, 2013). It has been widely used in assessing the density, biomass, body size, or spatial and temporal distribution of freshwater fish with the advantages of being efficient, rapid and not damaging biological resources compared to other fish stock assessment methods (e.g., gillnet and trawl) (Koslow, 2009). Therefore, hydroacoustics has become an excellent tool for research in the management of fish resources in reservoirs, the conservation of fish resources in rivers and lakes, and the monitoring of fish in dams and locks (Tan et al., 2011; Godlewska et al., 2016).
Like other sampling methods, hydroacoustics also has biases and limitations caused by fish species discrimination, acoustic dead zone (near the surface or bottom of reservoirs), and schooling due to fish rhythms Girard et al., (2020). It must be considered when choosing the suitable survey period, as species-specific behavior and spatial distribution add uncertainty to fish stock assessment (Ye et al., 2013; Lian et al., 2017). Therefore, selecting the sampling period (e.g., season and diel cycle) is essential for hydroacoustic surveys. Previous studies have demonstrated that the survey results of lakes and rivers in different periods were distinct. For example, Loures and Pompeu (2015) found that fish densities detected by hydroacoustics were significantly higher in the wet season than dry season in the Sao Francisco River. Lyons (1998) found that fish densities were 2.4-11.0 times higher during the nighttime than daytime in the River Trent; Girard et al., (2020) discussed that the hydroacoustic detection of fish density and biomass was higher during the nighttime than daytime in temperate lakes; Říha et al., (2015) concluded that hydroacoustic surveys of fish in Central European reservoirs should be performed at nighttime.
Reservoirs are artificially dammed bodies of water between lakes and rivers and are found worldwide, especially with scarce water resources (Straškraba et al., 1993). They have become the primary way to relieve water supply pressure and play an essential role in human development (Zhou et al., 2016). Certainly, they also have other important functions, such as power generation, flood control, agricultural irrigation and aquaculture (Fernando and Holčík, 1991). However, the operation of the reservoir has a significant impact on the waterbody. On the one hand, it changes the original runoff characteristics of the water and reduces the ability of the water to degrade pollutants. On the other hand, the nutrient level of the water will rise sharply due to the accumulation of nutrients in and around the inundated area, which will quickly cause the outbreak of harmful algal blooms and the deterioration of the water environment and threaten the safety of drinking water. Reducing the nutrient level of water can be achieved by controlling the number of algae in the water by releasing filter-feeding fish (Chen et al., 1991; Mei et al., 2016; Zhang et al., 2016). To achieve a scientific and reasonable fish release, the fish density of existing and the community structure in the reservoir needs to be clarified first.
Yudong Reservoir is located in the middle of the Yunnan-Kweichow Plateau. Like other plateau reservoirs, it is an artificial lake formed by building dams at the narrow mouth of the mountain. Influenced by anthropogenic activities, harmful algal bloom events often occur in Yudong Reservoir in recent years. The reasonable density of silver carp (Hypophthalmichthys molitrix) and bighead carp (Hypophthalmichthys nobilis) can control the harmful algae and purify the water. Thus, we need to assess accurately silver carp and bighead carp density and biomass to provide scientific recommendations for the reservoir management department. However, hydroacoustic surveys of plateau deep water reservoirs may differ from lakes, rivers and other types of reservoirs due to differences in fish behavior caused by environmental conditions and species-specific (Girard et al., 2020). The optimal period for hydroacoustic detection in plateau deep water reservoirs such as Yudong Reservoir has yet to be studied or reported. In this study, we chose three important indicators of the density, TS and vertical distribution of fish to indicate the effect of survey periods on survey results to identify the appropriate sampling period.
2 Materials and methods
2.1 Study area
Yudong Reservoir (27.359°N∼ 27.479°N, 103.475°E∼ 103.551°E) is located in Zhaotong City, Yunnan Province, China. Figure 1 illustrates the geographical location of Yudong Reservoir, whose mean elevation is 1985 m. The watershed area of Yudong Reservoir is approximately 709 km2, and the water-spread area is approximately 16.3 km2. In summer, Yudong Reservoir releases water for power generation and flood control, while it stores water for sufficient water supply in winter. The deepest point of Yudong Reservoir is 46.7 m, mean depth is approximately 22.0 m in summer. The deepest point is 57.4 m, and the mean depth is approximately 30.3 m in winter. It is the main water supply source for nearly three hundred thousand people in Zhaoyang District and Ludian County. In the present study, we divided Yudong Reservoir into nine areas based on mean depth (summer and winter) and distance: Dam (32.3 m), Huangnibao (44.6 m), Yanjiashan (16.1 m), Qimihei (15.1 m), Zhaojiayuan (27.8 m), Zujiaying (22.1 m), Yuba (16.3 m), Lan river (9.4 m) and Guazhai (14.2 m).
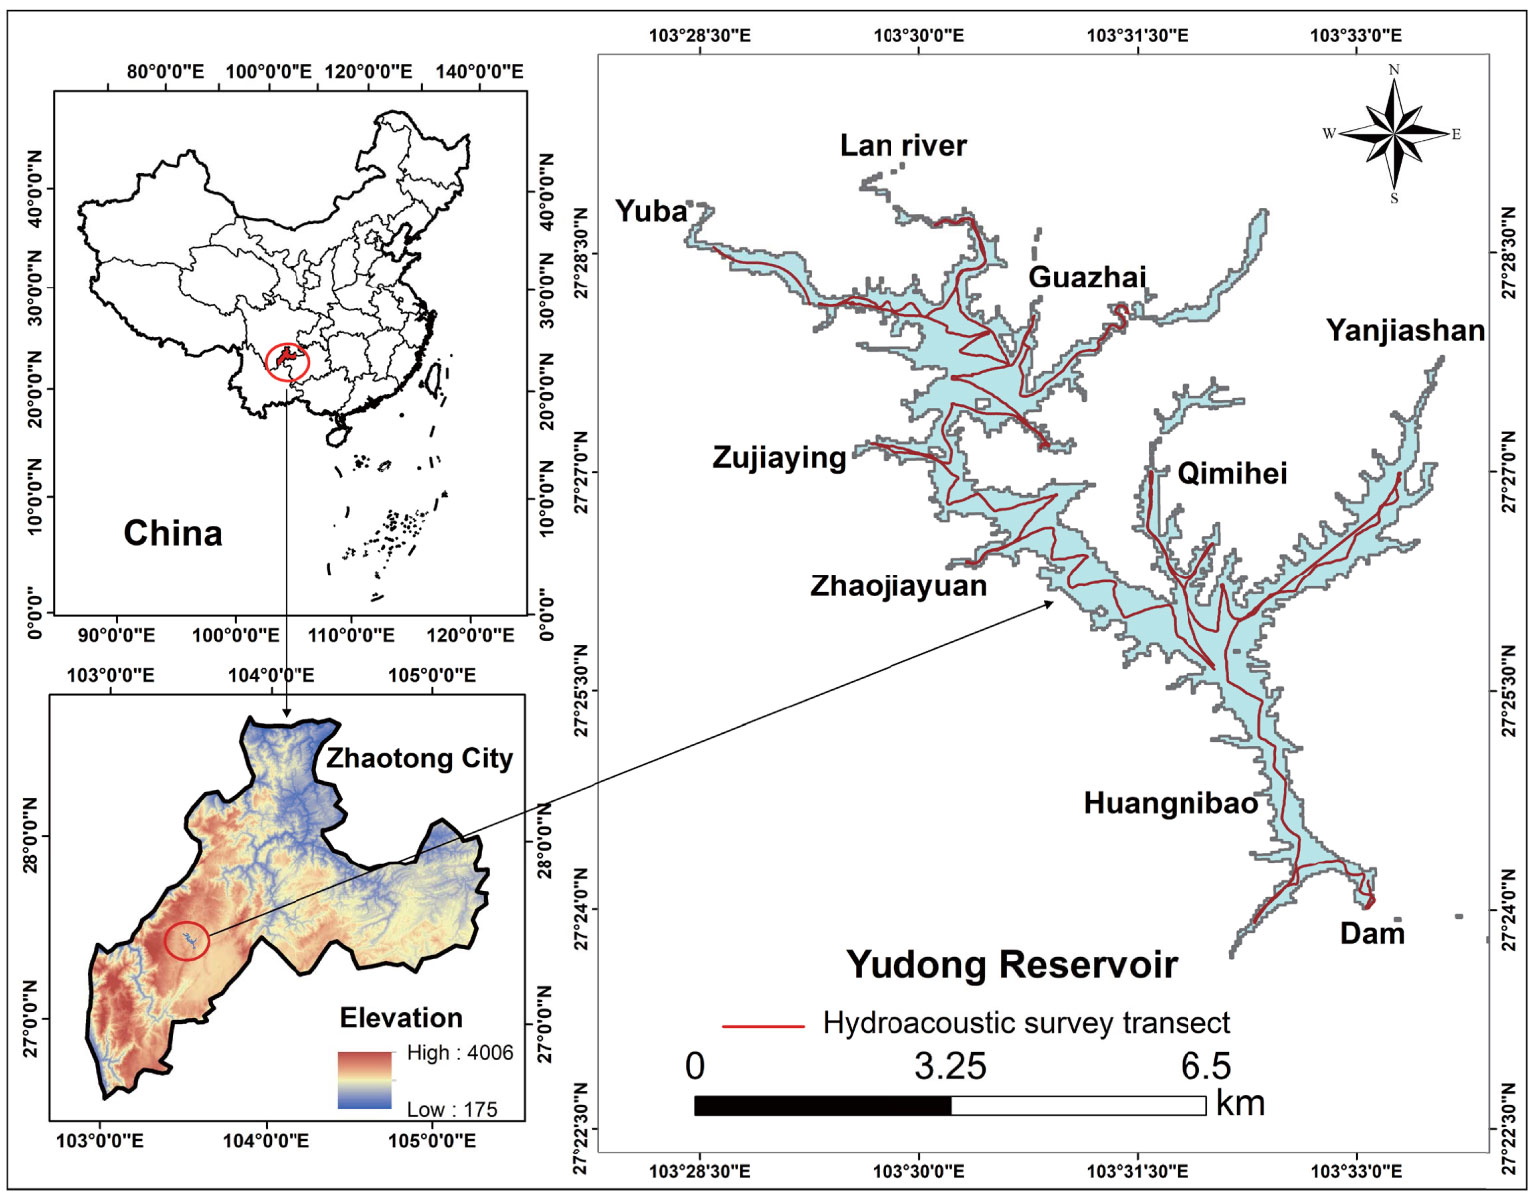
Figure 1 Map of the Yudong Reservoir showing its geographical location and hydroacoustic survey transect.
2.2 Hydroacoustic surveys
Two diel hydroacoustic surveys of fish resources were conducted in Yudong Reservoir in summer (August 10th - 11st, 2021) and winter (January 5th - 6th, 2022). Daytime surveys were conducted 1 hour after sunrise, and nighttime surveys were conducted 1 hour after sunset (Axenrot et al., 2016). The hydroacoustic survey equipment was BioSonics DT-X split-beam echo detector (BioSonics, Seattle, Washington, USA) (operating frequency 199 kHz, beam angle 6.8°×6.8°), latitude and longitude data were recorded and stored in real-time by Garmin GPS 17 X HVS (Garmin, Olathe, Kansas, USA), Acquisition 6.0 software (BioSonics, Seattle, Washington, USA) was used to collect hydroacoustic data, and calibrating the transducer by referring to the steps in the manual before detection. The transducer was fixed to the bow of speedboat using a homemade iron frame with a draft of 0.5 m, and the beam was emitted vertically downward. The speedboat was driven forward at 10km/h on a “Z” course at a constant speed (Figure 1), While recording the transect and elevation with a handheld GPS (Magellan, San Dimas, California, USA). The four hydroacoustic survey transects were shown in Figure 1. The credibility of the hydroacoustic survey was judged by calculating the coverage ratio, which was defined as the ratio between the square root of the transect mileage (km) and the water-spread area of the reservoir (km2) (Aglen, 1983). It was generally recommended that the coverage ratio was at least 3.0 and preferably higher than 6.0 (Emmrich et al., 2012), and all coverage ratios in our study were more significant than 8.0.
2.3 Hydroacoustic data analysis
The hydroacoustic data was analyzed by Visual Analyzer 4.3 software (BioSonics, Seattle, Washington, USA). The single echo detection method was used to analyze the target signals of fish in the water column, with the specific parameters shown in Table 1. To exclude external interference such as vessel engine noise and air bubbles, the hydroacoustic data were selected from 1 m below the transducer to 0.3 m above the reservoir bottom, and the aquatic plants, secondary bottom echoes, and non-fish echoes were manually removed. Finally, parameters such as real-time water depth, Fish Per Unit Area (FPUA, ind./m2), Fish Per Cubic Meter (FPCM, ind./m3), and TS were obtained. The real-time coordinates and density information (FPUA) returned from Visual Analyzer 4.3 (BioSonics, Seattle, Washington, USA) were imported into ArcGIS 10.7 software (ESRI, Redlands, California, USA), and the fish density distribution was mapped by Kriging spatial interpolation.

Table 1 Setting parameters for individual target analysis.
2.4 Relationship between TS and total length and biomass of fish
Target Strength in hydroacoustics is a physical quantity that responds to the size of fish. We use the term TS to refer to Target Strength throughout the paper, the unit is dB, and TS is proportional to the total length, the more significant the TS, the greater the total length of fish.
The equation (1) proposed by Foote (1987) for fish that have swim bladders was used to estimate the total length (TL in cm) of fish:
The equation (2) for the conversion between the TL and weight W (g) of bighead carp was proposed by Wanner and Klumb (2009).
The mean biomass B (g/m) was calculated as the multiplication of fish mean density ρ (ind./m2 ) estimated by hydroacoustics and the weight corresponding to mean TS , and equation (3) shows how it is calculated:
2.5 Statistical analysis
We analyzed differences between density, TS, and vertical distribution of fish of each transect during the diel cycle in summer and winter. Hydroacoustic data used Student’s t-test and nonparametric Wilcoxon test, when data homogeneity or normality was not achieved, a nonparametric test was used, otherwise, a Student’s t-test was used. In addition, the standardized main axis (SMA) was performed (Warton et al., 2006). This test was previously used to compare hydroacoustic data from different scenarios (Mouget et al., 2019), and our study was mainly applied to the distribution of the density and TS of fish in nine areas. The method was suitable for extended and completed linear regression when the measurement error was unknown. The SMA evaluation compared whether the major-axis results followed the 1:1 line for different periods. All analyses were carried out using software R (version 4.1.2) (Team, 2013), and the Smatr package (version 3.4-8) for the SMA test (Warton et al., 2012).
3 Results
3.1 Seasonal and diel difference in fish density
The fish mean density was highest during the nighttime in winter (2.1 ind./m2), followed by summer nighttime (1.7 ind./m2), then summer daytime (0.9 ind./m2), and finally winter daytime (0.7 ind./m2) (Figure 2). Figure 3 shows the fish density distribution from four hydroacoustic surveys in Yudong Reservoir.
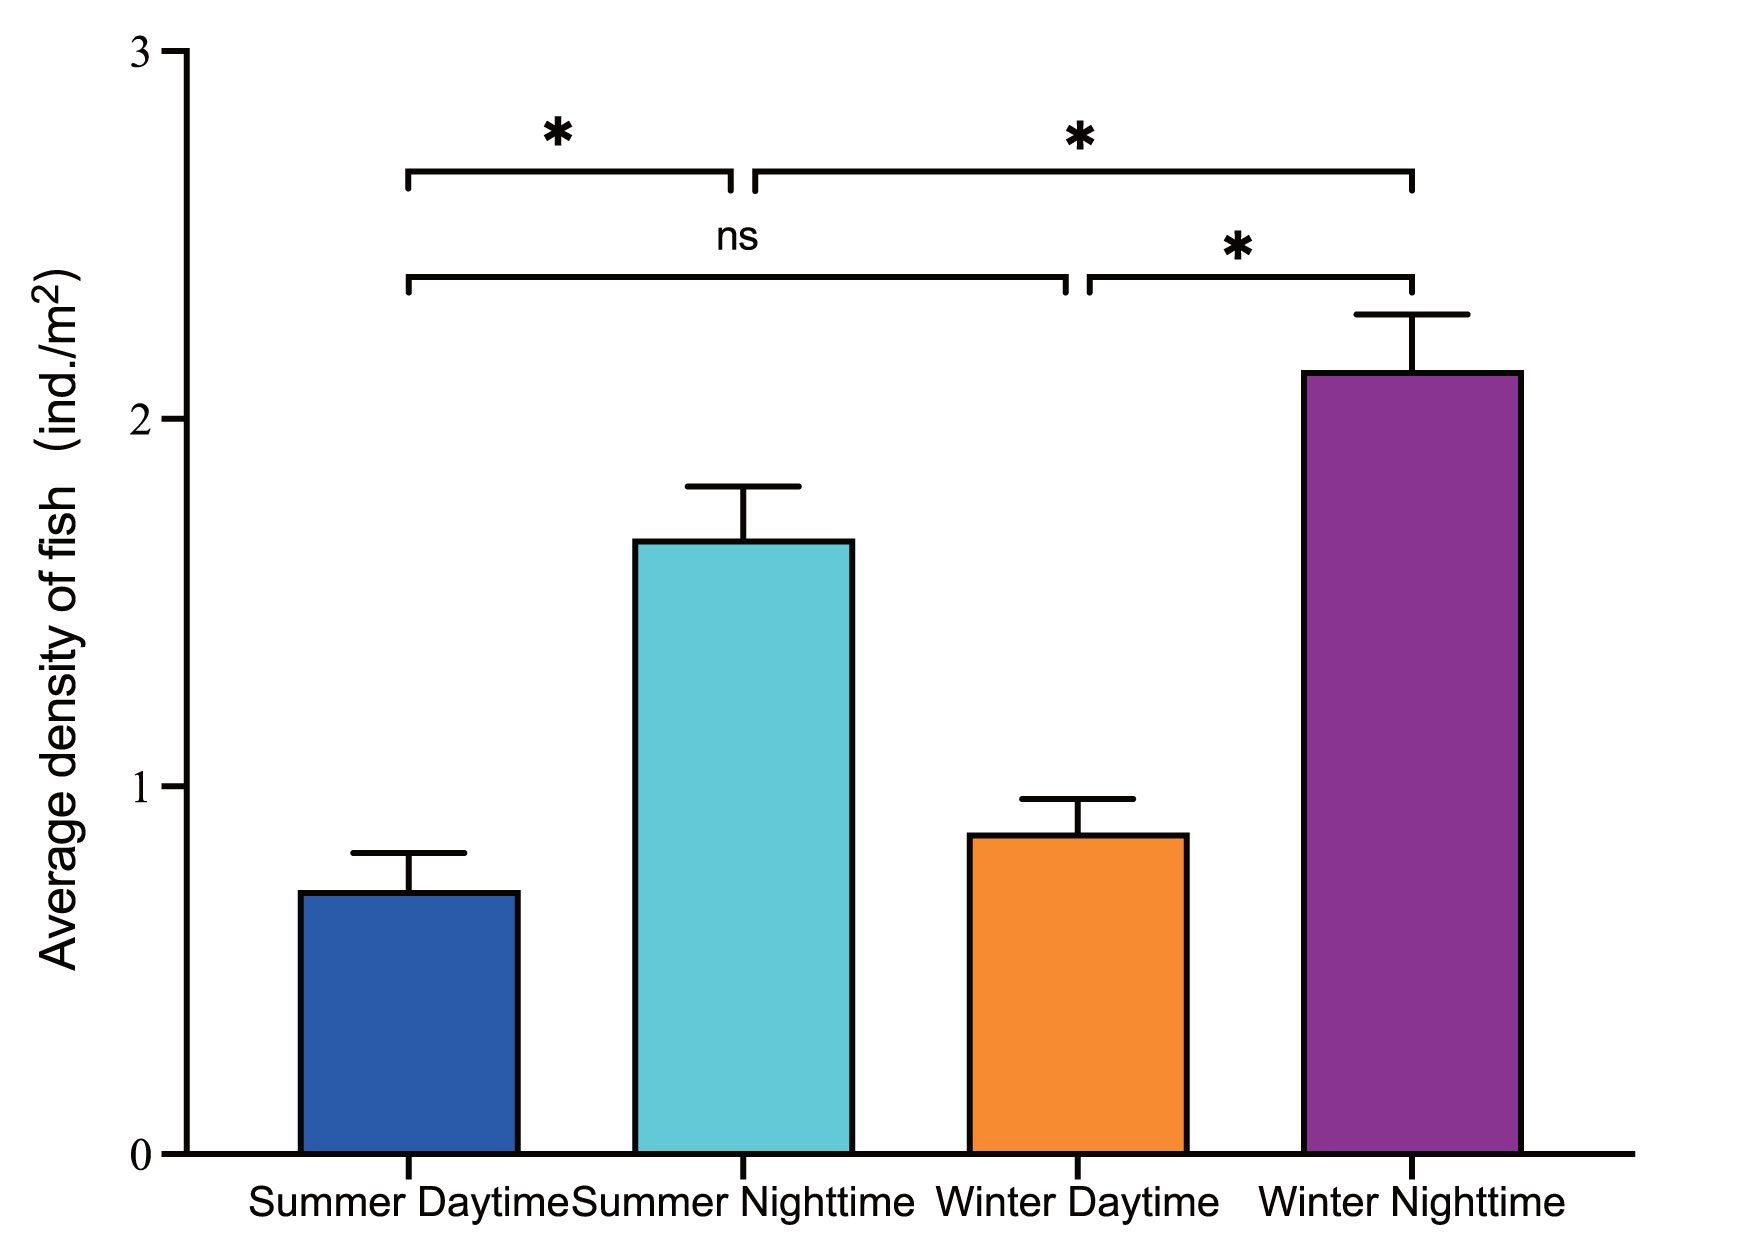
Figure 2 Mean density of four hydroacoustic surveys during different periods in Yudong Reservoir. Asterisks indicate significant correlations (p < 0.05), ns indicates no significant correlations (p > 0.05).
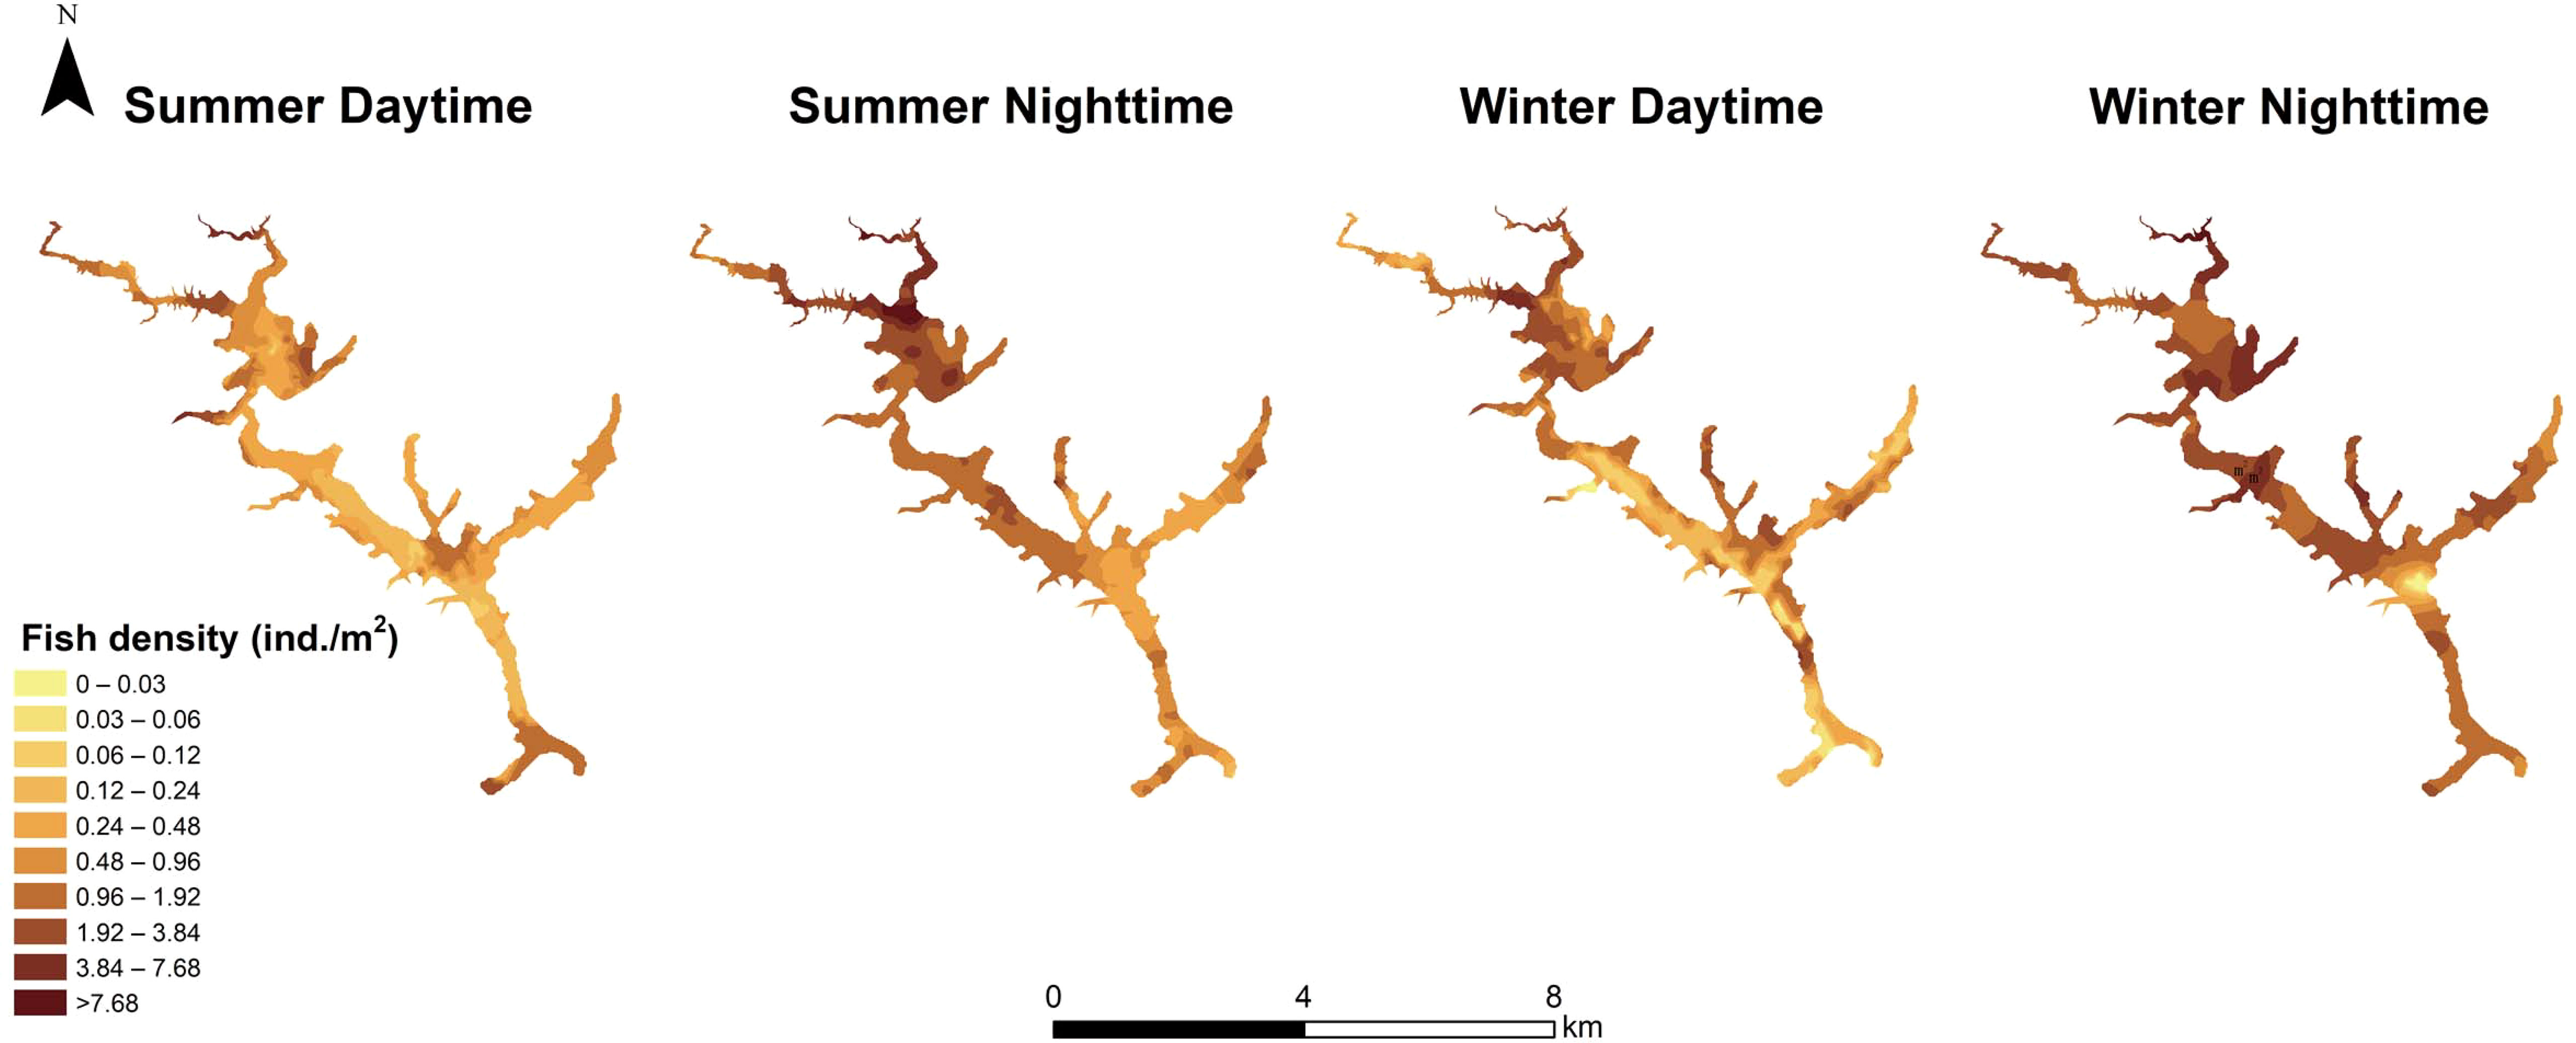
Figure 3 Fish density distribution from four hydroacoustic surveys in Yudong Reservoir.
For diel differences, the mean density was significantly higher during the nighttime than daytime in summer (Wilcoxon test, p < 0.05) (Figure 2). The slope of the linear relationship was not significantly different from 1 (SMA r = 0.2576, p > 0.05) and the intercept was not significantly different from 0 (SMA t = -0.8299, p > 0.05) (Figure 4). Like summer, the mean density during the nighttime was significantly higher than daytime in winter (Wilcoxon test, p < 0.05). The intercept was not significantly different from 0 (SMA t = -1.758, p > 0.05), but the slope of the linear relationship was significantly different from 1 (SMA r = 0.8174, p< 0.05) (Figure 4).
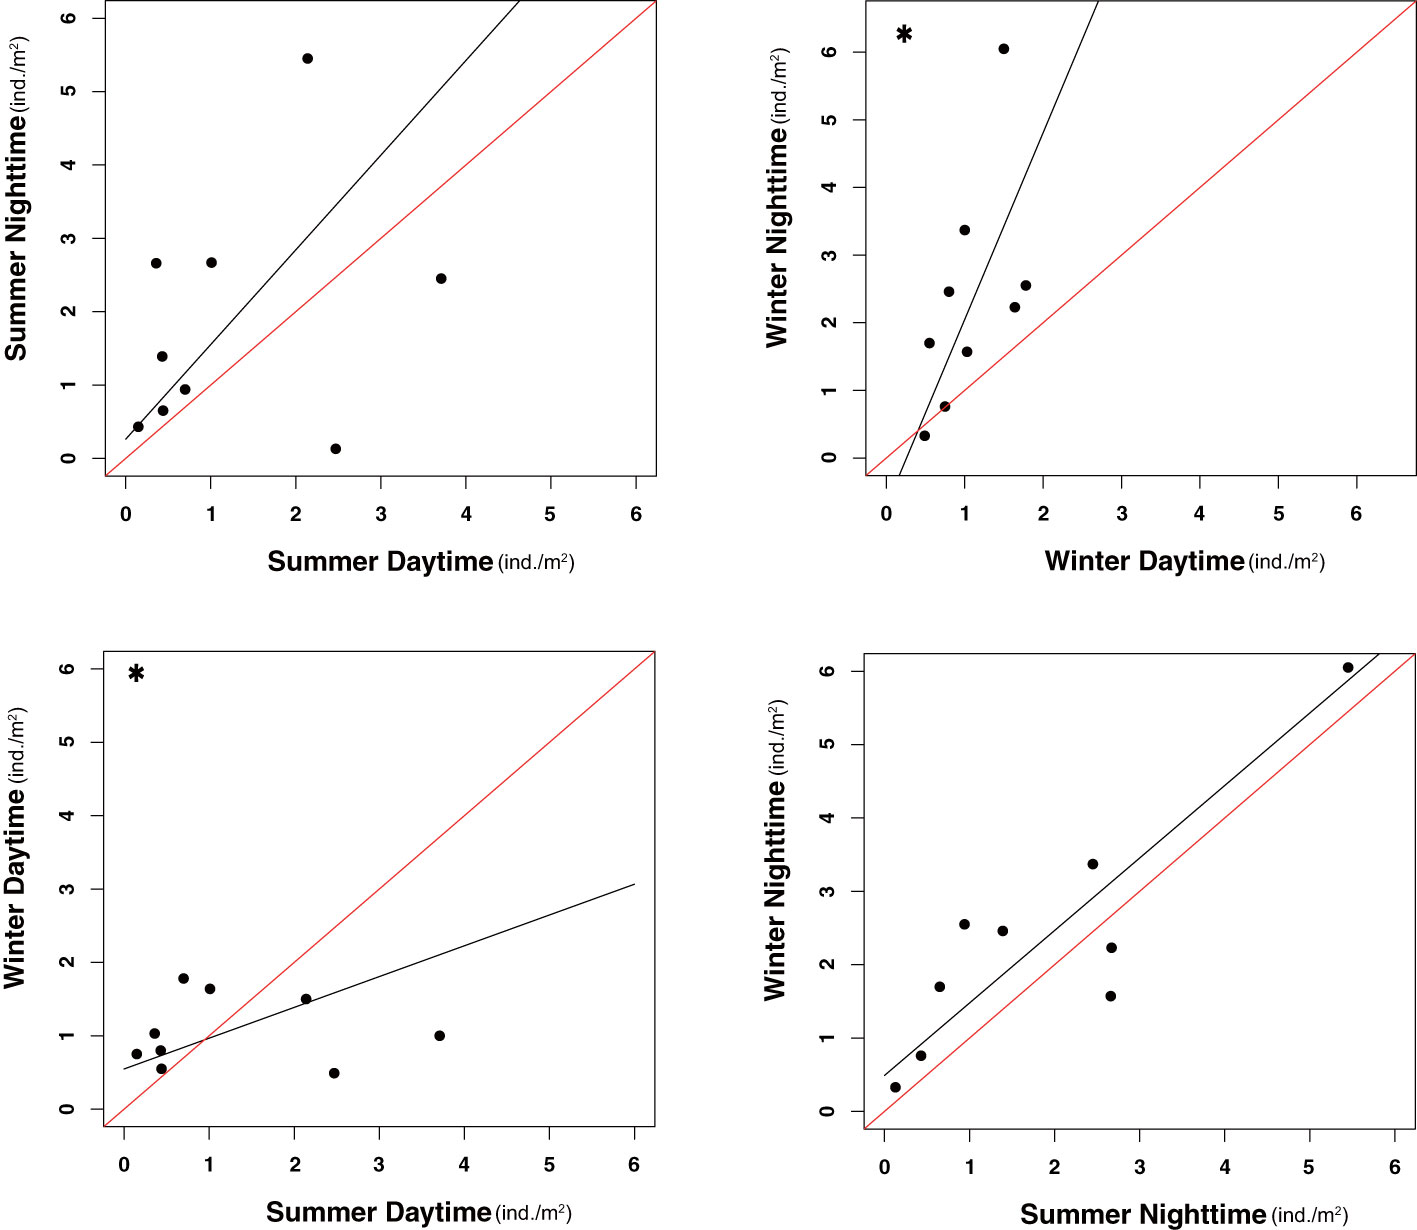
Figure 4 Linear relationship between seasonal and diel results for mean density in nine areas. Asterisks in the upper left corner indicates significant correlations (p < 0.05). The red line represents the 1:1 line, and the black line the relationship estimated by the SMA (N = 9).
For seasonal differences, the difference during the daytime was not significant (Wilcoxon test, p > 0.05) (Figure 2), and the linear relationship between slope and 1 was significant (SMA r = -0.7004, p < 0.05), but the intercept was not significantly different from 0 (SMA t = -1.471, p > 0.05) (Figure 4). The mean density of winter nighttime was slightly higher than summer nighttime and was significantly different (Wilcoxon test, p < 0.05) (Figure 2), the slope and intercept were not significantly different from the expected value (SMA r = -0.01925, p > 0.05; SMA t = -0.9981, p > 0.05) (Figure 4).
3.2 Seasonal and diel difference in fish TS
The mean TS in summer daytime, summer nighttime, winter daytime, and winter nighttime were (-49.1 ± 3.7) dB, (-55.1 ± 4.3) dB, (-55.2 ± 4.4) dB, and (-55.7 ± 3.1) dB, respectively, and their corresponding total lengths of fish were 13.8 cm, 6.9 cm, 6.8 cm, and 6.5 cm according to equation (1). Their peaks were all focused around -58 dB. Figure 5 shows the TS distribution of fish from the four hydroacoustic surveys.
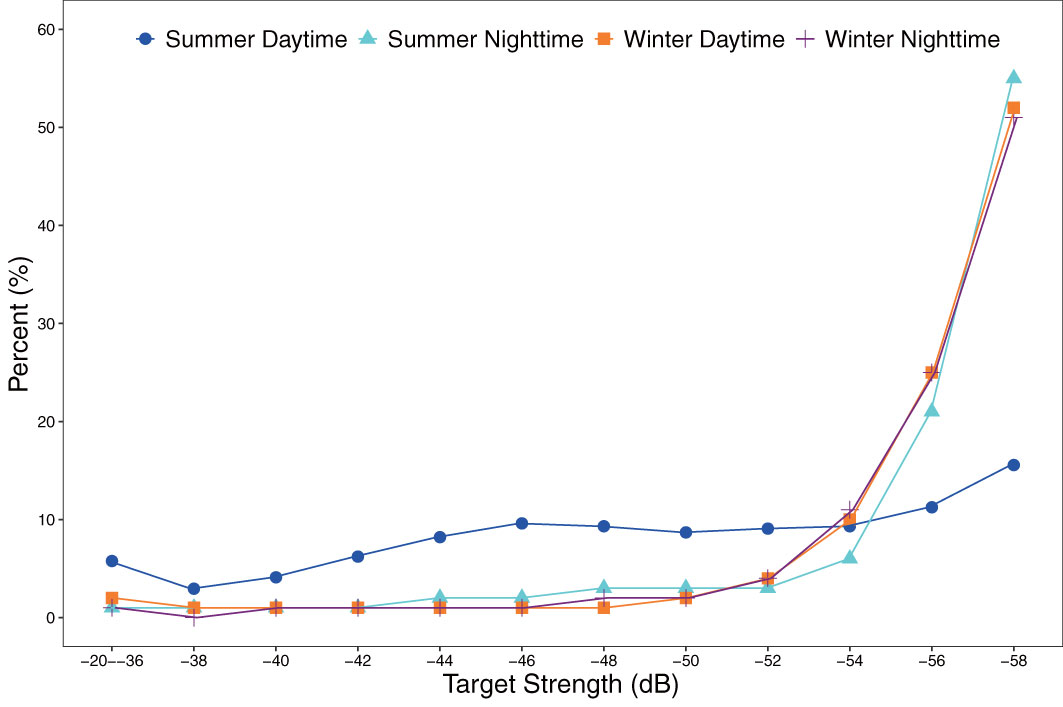
Figure 5 Fish TS distribution from four hydroacoustic surveys in Yudong Reservoir.
For diel differences, the mean was significantly higher during the daytime than nighttime in summer (Wilcoxon test, p < 0.05), but the slope and intercept of SMA were not significantly different from the expected value (SMA r = 0.2432, p > 0.05; SMA t = 0.3098, p > 0.05). However, there was no significant correlation in the mean TS between daytime and nighttime in winter, but both the slope and intercept were significantly different from the expected values (SMA r = -0.6308, p < 0.05; SMA t = -3.147, p < 0.05) (Figure 6).
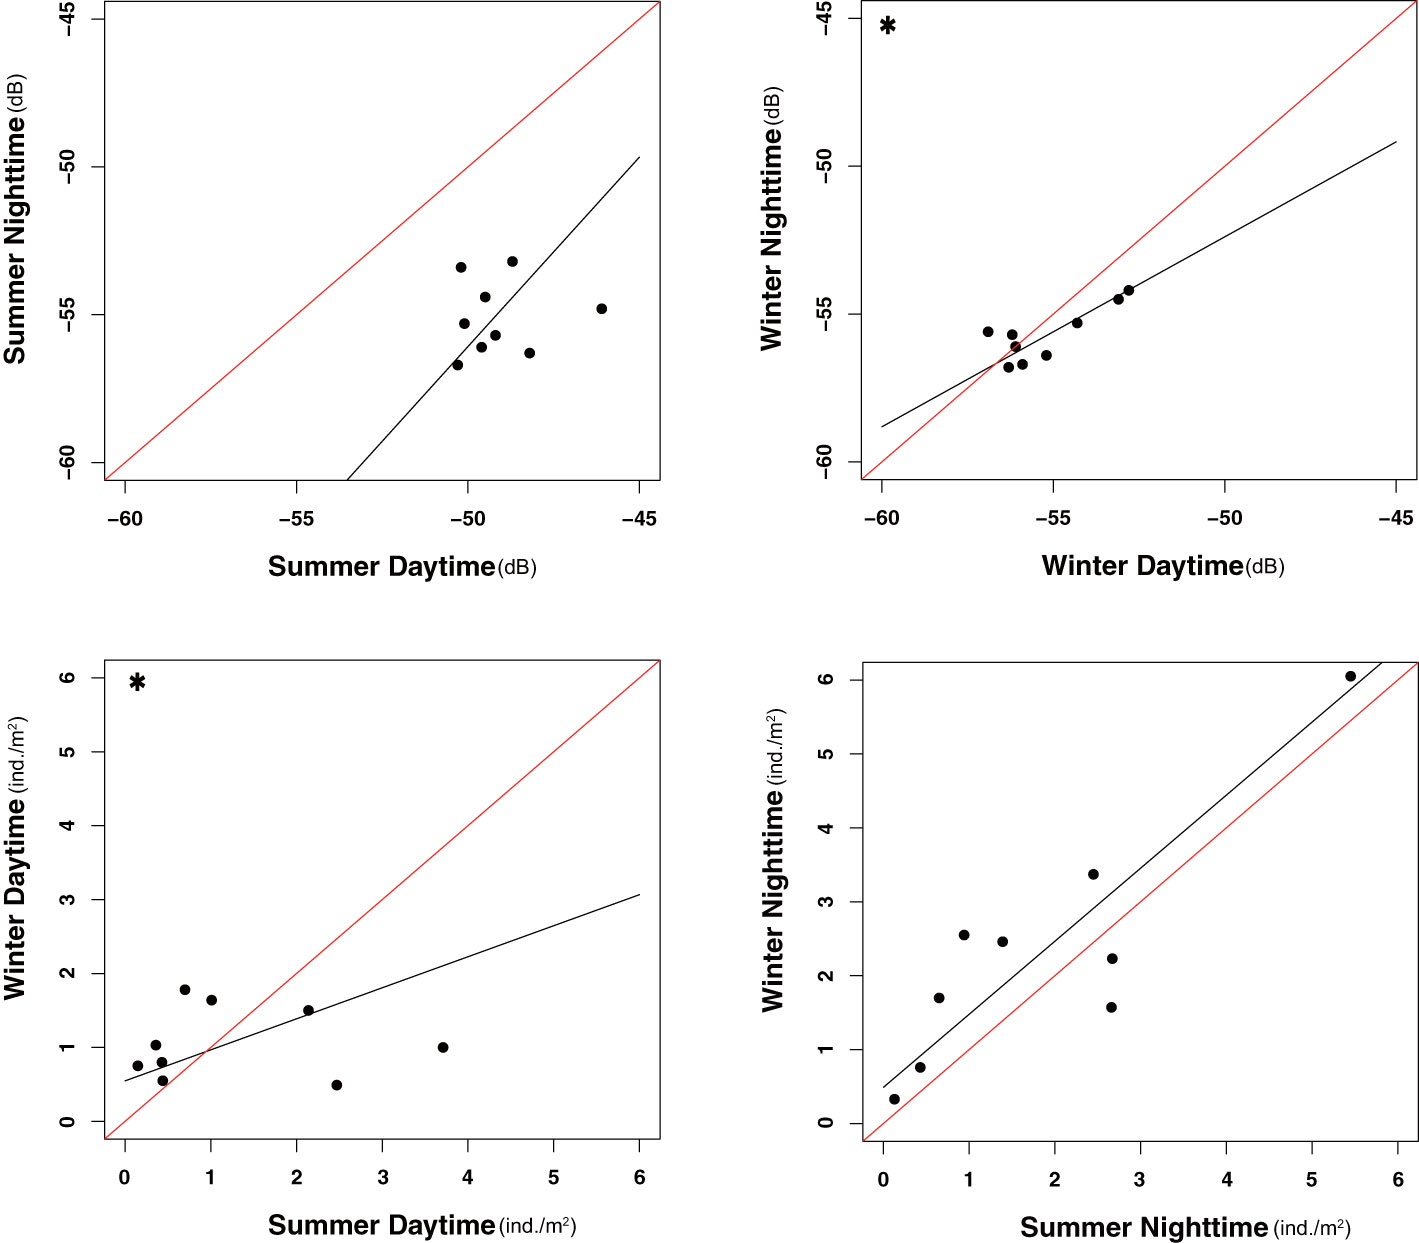
Figure 6 Linear relationship between diel and seasonal results for mean TS in nine areas. Asterisks in the upper left corner indicate significant correlations (p < 0.05). The red line represents the 1:1 line, and the black line the relationship estimated by the SMA (N = 9).
For seasonal differences, the daytime mean TS was significantly different (Wilcoxon test, p < 0.05), but the slope and intercept were not significantly different from the expected value (SMA t = 0.2663, p > 0.05; SMA r = 0.2856, p > 0.05). However, the nighttime mean TS was not significantly different (Wilcoxon test, p > 0.05), nor was the slope or intercept significantly different from the expected value (SMA t = -1.379, p > 0.05; SMA r = -0.3304, p> 0.05) (Figure 6).
3.3 Seasonal and diel difference in fish vertical distribution
According to the water depth of the Yudong Reservoir and the vertical distribution of fish in each water layer, the whole water column was divided into seven water layers, 0-5 m, 5-10 m, 10-15 m, 15-20 m, 20-25 m, 25-30 m and 30-60 m, and the percentage of fish density in each water layer in summer and winter seasons was calculated respectively (Figure 7).
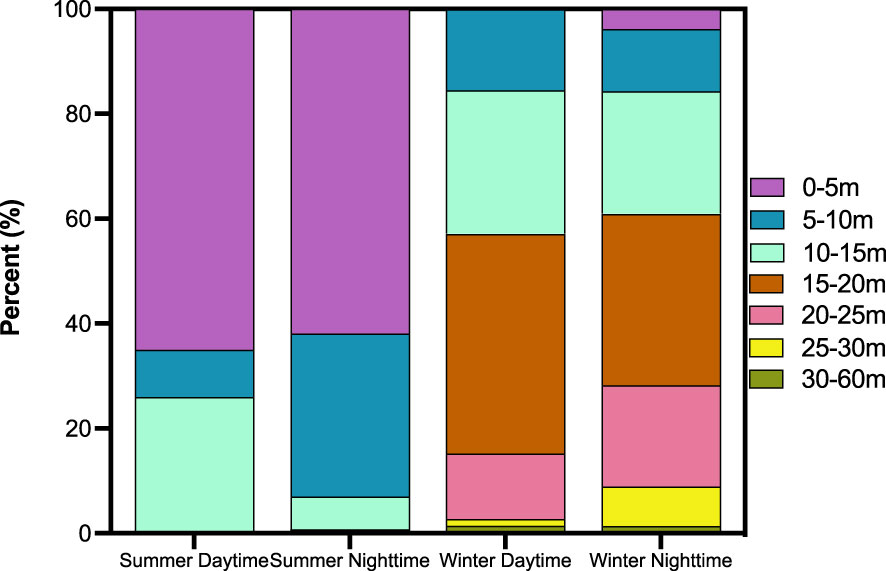
Figure 7 Fish density ratio of each water layer from four hydroacoustic surveys in Yudong Reservoir.
For diel differences, there was significant difference in the vertical distribution in summer (Wilcoxon test, p < 0.05), but there was no significant difference in winter (Student’s test, p > 0.05) (Figure 7).
For seasonal differences, there was significant difference in the vertical distribution during daytime and nighttime (Wilcoxon test, p < 0.05).
Summer and winter values showed different vertical distribution patterns. There were more than 90% of fish distributed in the water layer above 15m during both daytime and nighttime in summer, especially in the 0-5m water layer, which accounted about for 60%, but the number of fish active in the 5-10m water layer accounted for a higher percentage during the nighttime than daytime in the nighttime than at daytime, while the number of fish distributed in the 10-15m water layer during the daytime was higher than nighttime. Unlike summer, fish were mainly distributed between 5-30m water layer during the daytime and nighttime in winter. These results suggest that fish could migrate to the surface during the nighttime in summer but not in winter.
4 Discussion
4.1 Factors influencing changes in fish density
Regarding the density difference in diel cycle. (Figures 3, 4). The mean density detected during the nighttime was approximately twice as high as during the daytime in both winter and summer. Many studies also supported this result (Lyons, 1998; Ye et al., 2013; Lian et al., 2017). Potential reasons may include the following, (i) Related to the diel rhythm of fish, the aggregation behavior of fish is more evident during the daytime than at nighttime (Appenzeller and Leggett, 1992). Hence, the beam from the hydroacoustic detector radiates on the acoustic scattering cross section of the upper fish, and it immediately reflects on the detector’s receiving, resulting in the beam not penetrating the upper fish and detecting the lower fish (Orduna et al., 2021). (ii) Related to the anti-predatory behavior of fish, the light intensity during the daytime is favorable to the predatory activities of predators, and many fish migrate to shallow waters or hide under some shelters such as aquatic plants and rocks to avoid predators (Říha et al., 2015; Christensen and Persson, 1993; Wolter and Bischoff, 2001; Prchalová et al., 2008; Mehner, 2012), hydroacoustic surveys usually actively avoid these areas considering safety, but they return to deeper water during the nighttime, resulting in the detection of fish during the daytime density being higher than at nighttime. (iii) Fish are more active during the daytime than at nighttime and have a more extraordinary ability to avoid vessels and hydroacoustic detectors (DuFour et al., 2018).
Regarding the density difference in seasons, the mean density was significantly different during the nighttime but not daytime. This follows the result that the lower temperature, the higher density of fish detected during the nighttime (Winfield et al., 2007; Loures and Pompeu, 2015), however, this difference is acceptable from the fisheries management perspective. The SMA was significantly different during the daytime, which can only indicate greater seasonal variation in nine areas with more significant density (Figure 7), regardless of the overall density.
4.2 Factors influencing changes in fish TS
The SMA results showed that mean TS distribution has significant correlations in nine areas between daytime and nighttime in winter, indicating significant differences in the total length of fish detected in different areas. However, the mean TS during summer daytime was much higher than in the other three hydroacoustic surveys, and a similar result was also found by Girard et al., (2020). Some possible explanations for this might be that fish have an assertive aggregation behavior in late summer and early autumn, resulting in TS error assessment due to the thermal stratification effect of the waterbody. Secondly, there are high densities of juvenile fish in reservoirs, often in groups, migrating to shallower waters or under some shelter during the daytime to avoid predators and returning to deeper waters to feed during the nighttime (Appenzeller and Leggett, 1992; Wolter and Bischoff, 2001; Prchalová et al., 2008; Probst et al., 2009), resulting in a low density of fish detected during summer daytime. In addition, low water temperature affects the activity of fish digestive enzymes in winter (Russell et al., 1996; Person-Le Ruyet et al., 2004; Zhang et al., 2017), reducing the predation pressure on juvenile fish and increasing the probability of detection. Hence, the mean TS of fish detected in winter daytime and nighttime was smaller than that in summer daytime.
4.3 Factors influencing changes in fish vertical distribution
The vertical distribution of fish had significant seasonal characteristics. The fish were mainly distributed in the water layer above 15 m, and almost no fish activity in the water layer below 15 m in summer. The vertical distribution of fish showed diel differences in summer, indicating the existence of diel vertical migration of fish, which may be related to the vertical migration of plankton, which is influenced by light, nutrient salts and water disturbance (Ringelberg, 1995), etc., and will migrate down to the water surface in the dawn and up to the water surface in the evening (Han and Straskraba, 1998), and forced by feeding pressure, most fish will also migrate with the migration of plankton (Mehner, 2012). Secondly, it may be related to the dissolved oxygen content of the water column, the dissolution of oxygen in the air, and the photosynthesis of phytoplankton during the daytime, making the whole water column with sufficient dissolved oxygen. During the nighttime, photosynthesis is weakened, the respiration of organisms consumes a large amount of dissolved oxygen in the water column, and the lower water column is not replenished with oxygen (Bezerra-Neto and Pinto-Coelho, 2007; Du et al., 2019), forcing the middle and lower fish to move up to breathe oxygen, so the fish have a significant difference in summer diel cycle. In winter, plankton and dissolved oxygen are distributed in each water layer. They are less affected by diel and seasonal plankton (Magnesen, 1989; Zhang et al., 2022), so fish do not need to migrate vertically for oxygen and food. Therefore, there was no significant difference between daytime and nighttime in the vertical direction in winter.
5 Conclusions
The SMA test and vertical distribution of fish results indicate horizontal and vertical migratory behaviors of fish influenced by diel and seasonal rhythms, which could affect the hydroacoustic assessment of fish resources. The mean density was less influenced by season and more by diel cycle, and the nighttime estimates being less influential than daytime. Nevertheless, there were no significant differences between mean TS, except for summer daytime, and this bias may be influenced by fish behavior. The density and TS are vital indicators for biomass, after calculation, the mean biomass in summer nighttime and winter nighttime were 6.63 (g/m) and 6.93 (g/m), and we believe this is well within experimental error, and thus such a difference is perfectly acceptable. Given the above considerations, hydroacoustic surveys could be conducted during the nighttime in Yudong Reservoir and other similar plateau deep water reservoirs. In addition, regardless of time and cost, hydroacoustic surveys during winter nighttime are recommended for more accurate assessments of fish populations density and biomass.
Data availability statement
The raw data supporting the conclusions of this article will be made available by the authors, without undue reservation.
Ethics statement
Ethical review and approval was not required for the animal study because the hydroacoustic experiment did not cause any harm to or involve direct intervention with the animals.
Author contributions
FM (co-first author): conceptualization, methodology, formal analysis, investigation, data curation, validation, writing–original draft. CZ (co-first author): conceptualization, methodology, investigation, data curation, validation, writing-review and editing. BL: investigation, data curation, writing-review and editing. DoZ: investigation, data curation, writing-review and editing. SH: investigation, data curation. JB: data curation, writing-review and editing. YL: writing-review and editing. DaZ (co-corresponding author): conceptualization, funding acquisition, writing-review and editing. MD (co-corresponding author): conceptualization, funding acquisition, writing-review and editing. All authors contributed to the article and approved the submitted version.
Funding
This work was financially supported by the Science and Technology Poverty Alleviation Program of the Chinese Academy of Sciences (KFJ-FP-201905), the National Natural Science Foundation of China (No. 32172955; No. 32202914), the National Key R and D Program of China (No. 2022YFB 3206903), the Scientific Instrument Developing Project of the Chinese Academy of Sciences (No. YJKYYQ 20190055), the Special Program for the Institute of National Parks of the Chinese Academy Sciences (No. KFJ-STS-ZDTP-2021-003), and Chongqing Scientific Research Institutions Performance Incentive R&D Investment Guidance Project (Tongnan District, tkx-2022-01).
Acknowledgments
We sincerely thank the staff of Yudong Reservoir for their help.
Conflict of interest
The authors declare that the research was conducted in the absence of any commercial or financial relationships that could be construed as a potential conflict of interest.
Publisher’s note
All claims expressed in this article are solely those of the authors and do not necessarily represent those of their affiliated organizations, or those of the publisher, the editors and the reviewers. Any product that may be evaluated in this article, or claim that may be made by its manufacturer, is not guaranteed or endorsed by the publisher.
References
Aglen A. (1983). Random errors of acoustic fish abundance estimates in relation to the survey grid density applied. FAO Fish. Rep. 300, 293–298.
Appenzeller A., Leggett W. (1992). Bias in hydroacoustic estimates of fish abundance due to acoustic shadowing: evidence from day–night surveys of vertically migrating fish. Can. J. Fisheries Aquat. Sci. 49, 2179–2189. doi: 10.1139/f92-240
Axenrot T., Guillard J., Riha M., Tuser M. (2016). Applying the european hydroacoustic standard on fish abundance estimation (EN 15910).
Bezerra-Neto J. F., Pinto-Coelho R. M. (2007). Diel vertical migration of the copepod thermocyclops inversus (kiefer 1936) in a tropical reservoir: The role of oxygen and the spatial overlap with chaoborus. Aquat. Ecol. 41, 535–545. doi: 10.1007/s10452-007-9119-x
Chen S., Liu X., Hua L. (1991). The role of silver carp and bighead in the cycling of nitrogen and phosphorus in the east lake ecosystem. Acta Hydrobiol. Sin. 15, 8–26.
Christensen B., Persson L. (1993). Species-specific antipredatory behaviours: effects on prey choice in different habitats. Behav. Ecol. Sociobiol. 32, 1–9. doi: 10.1007/BF00172217
DuFour M. R., Mayer C. M., Qian S. S., Vandergoot C. S., Kraus R. T., Kocovsky P. M., et al. (2018). Inferred fish behavior its implications for hydroacoustic surveys in nearshore habitats. Fisheries Res. 199, 63–75. doi: 10.1016/j.fishres.2017.11.018
Du Y., Peng W., Liu C. (2019). A review of dissolved oxygen variation and distribution in the stratified lakes or reservoirs. J. Hydraulic Eng. 50, 990–998. doi: 10.13243/j.cnki.slxb.20190147
Emmrich M., Winfield I. J., Guillard J., Rustadbakken A., Verges C., Volta P., et al. (2012). Strong correspondence between gillnet catch per unit effort and hydroacoustically derived fish biomass in stratified lakes. Freshw. Biol. 57, 2436–2448. doi: 10.1111/fwb.12022
Fernando C., Holčík J. (1991). Fish in reservoirs. International Review of Hydrobiology 76, 149–167. doi: 10.1002/iroh.19910760202
Foote K. G. (1987). Fish target strengths for use in echo integrator surveys. J. Acoustical Soc. Am. 82, 981–987. doi: 10.1121/1.395298
Girard M., Goulon C., Tessier A., Vonlanthen P., Guillard J. (2020). Comparisons of day-time and night-time hydroacoustic surveys in temperate lakes. Aquat. Living Resour. 33, 9. doi: 10.1051/alr/2020011
Godlewska M., Izydorczyk K., Kaczkowski Z., Jóźwik A., Długoszewski B., Ye S., et al. (2016). Do fish and blue-green algae blooms coexist in space and time? Fisheries Res. 173, 93–100. doi: 10.1002/iroh.19910760202
Han B.-P., Straškraba M. (1998). Modeling patterns of zooplankton diel vertical migration. J. Plankton Res. 20, 1463–1487. doi: 10.1093/plankt/20.8.1463
Koslow J. A. (2009). The role of acoustics in ecosystem-based fishery management. ICES J. Mar. Sci. 66, 966–973. doi: 10.1093/icesjms/fsp082
Lian Y., Ye S., Godlewska M., Huang G., Wang J., Chen S., et al. (2017). Diurnal, seasonal and inter-annual variability of fish density and distribution in the three gorges reservoir (china) assessed with hydroacoustics. Limnologica 63, 97–106. doi: 10.1016/j.limno.2017.01.008
Loures R. C., Pompeu P. (2015). Seasonal and diel changes in fish distribution in a tropical hydropower plant tailrace: evidence from hydroacoustic and gillnet sampling. Fisheries Manage. Ecol. 22, 185–196. doi: 10.1111/fme.12116
Lyons J. (1998). A hydroacoustic assessment of fish stocks in the river trent, england. Fisheries Res. 35, 83–90. doi: 10.1016/S0165-7836(98)00062-9
MacLennan D. N., Simmonds E. J. (2013). Fisheries acoustics Vol. 5 (Springer Science & Business Media).
Magnesen T. (1989). Vertical distribution of size-fractions in the zooplankton community in lindåspollene, western norway. l. seasonal variations. Sarsia 74, 59–68. doi: 10.1080/00364827.1989.10413422
Mehner T. (2012). Diel vertical migration of freshwater fishes–proximate triggers, ultimate causes and research perspectives. Freshw. Biol. 57, 1342–1359. doi: 10.1111/j.1365-2427.2012.02811.x
Mei Y., Chang C.-C., Dong Z., Wei L. (2016). Stream, lake, and reservoir management. Water Environ. Res. 88, 1533–1563. doi: 10.2175/106143016X14696400495370
Mouget A., Goulon C., Axenrot T., Balk H., Lebourges-Dhaussy A., Godlewska M., et al. (2019). Including 38 khz in the standardization protocol for hydroacoustic fish surveys in temperate lakes. Remote Sens. Ecol. Conserv. 5, 332–345. doi: 10.1002/rse2.112
Orduna C., Encina L., Rodriguez-Ruiz A., Rodriguez-Sanchez V. (2021). Testing of new sampling methods and estimation of size structure of sea bass (dicentrarchus labrax) in aquaculture farms using horizontal hydroacoustics. Aquaculture 545, 737242. doi: 10.1016/j.aquaculture.2021.737242
Person-Le Ruyet J., Mahe K., Le Bayon N., Le Delliou H. (2004). Effects of temperature on growth and metabolism in a mediterranean population of european sea bass, dicentrarchus labrax. Aquaculture 237, 269–280. doi: 10.1016/j.aquaculture.2004.04.021
Prchalová M., Kubečka J., Vašek M., Peterka J., Hohausová E. (2008). Patterns of fish distribution in a canyon-shaped reservoir. J. Fish Biol. 73, 54–78. doi: 10.1111/j.1095-8649.2008.01906.x
Probst W. N., Thomas G., Eckmann R. (2009). Hydroacoustic observations of surface shoaling behaviour of young-of-the-year perch perca fluviatilis (linnaeus 1758) with a towed upward-facing transducer. Fisheries Res. 96, 133–138. doi: 10.1016/j.fishres.2008.10.009
Říha M., Ricard D., Vaek M., Prchalová M., Mrkvika T., Jza T., et al. (2015). Patterns in diel habitat use of fish covering the littoral and pelagic zones in a reservoir. Hydrobiologia 747, 111–113. doi: 10.1007/s10750-014-2124-x.
Ringelberg J. (1995). Changes in light intensity and diel vertical migration: a comparison of marine and freshwater environments. J. Mar. Biol. Assoc. U. K. 75, 15. doi: 10.1017/S0025315400015162
Russell N., Fish J., Wootton R. (1996). Feeding and growth of juvenile sea bass: The effect of ration and temperature on growth rate and efficiency. J. Fish Biol. 49, 206–220. doi: 10.1111/j.1095-8649.1996.tb00017.x
Straškraba M., Tundisi J., Duncan A. (1993). “State-of-the-art of reservoir limnology and water quality management,” in Comparative reservoir limnology and water quality management (Springer), 213–288.
Tan X., Kang M., Tao J., Li X., Huang D. (2011). Hydroacoustic survey of fish density, spatial distribution, and behavior upstream and downstream of the changzhou dam on the pearl river, China. Fisheries Sci. 77, 891–901. doi: 10.1007/s12562-011-0400-5
Team R. C. (2013). R: A language and environment for statistical computing (vienna, austria: R. Foundation for statistical computing [Computer program]).
Wanner G. A., Klumb R. A. (2009). Length-weight relationships for three asian carp species in the missouri river. J. Freshw. Ecol. 24, 489–495. doi: 10.1080/02705060.2009.9664322
Warton D. I., Duursma R. A., Falster D. S., Taskinen S. (2012). smatr 3 -an r package for estimation and inference about allometric lines. Methods Ecol Evol. 3, 257–259. doi: 10.1111/j.2041-210X.2011.00153.x
Warton D. I., Wright I. J., Falster D. S., Westoby M. (2006). Bivariate line-fitting methods for allometry. Biol. Rev. 81, 259–291. doi: 10.1017/S1464793106007007
Winfield I., Fletcher J., James J. (2007). Seasonal variability in the abundance of arctic charr (salvelinus alpinus (l.)) recorded using hydroacoustics in windermere, uk and its implications for survey design. Ecol. Freshw. Fish 16, 64–69. doi: 10.1111/j.1600-0633.2006.00170.x
Wolter C., Bischoff A. (2001). Seasonal changes of fish diversity in the main channel of the large lowland river oder. Regulated Rivers: Res. Manage. 17, 595–608. doi: 10.1002/rrr.645
Ye S., Lian Y., Godlewska M., Liu J., Li Z. (2013). Day-night differences in hydroacoustic estimates of fish abundance and distribution in lake laojianghe, china. J. Appl. Ichthyology 29, 1423–1429. doi: 10.1111/jai.12367
Zhang L., Zhao Z., Fan Q., Zhang L., Zhao Z., Fan Q., et al (2017). Effects of water temperatureand initial weight on growth, digestion and energy budget of yellow catfish pelteobagrus fulvidraco (richardson, 1846). J Appl Ichthyol. 33, 6. doi: 10.1111/jai.13465
Zhang W., Dunne J. P., Wu H., Zhou F., Huang D. (2022). Using timescales of deficit and residence to evaluate near-bottom dissolved oxygen variation in coastal seas. J. Geophysical Research: Biogeosciences 127, e2021JG006408. doi: 10.1029/2021JG006408
Zhang X., Liu Z., Jeppesen E., Taylor W. D., Rudstam L. G. (2016). Effects of benthic-feeding common carp and filter-feeding silver carp on benthic-pelagic coupling: Implications for shallow lake management. Ecol. Eng. 88, 256–264. doi: 10.1016/j.ecoleng.2015.12.039
Keywords: hydroacoustic, diel, seasonal, mean density, mean TS, vertical distribution
Citation: Mei F, Zhang C, Luo B, Zhang D, Hu S, Bao J, Lian Y, Zhao D and Duan M (2023) Effects of season and diel cycle on hydroacoustic estimates of density, Target Strength, and vertical distribution of fish in Yudong Reservoir, a plateau deep water reservoir in southwest China in a plateau deep. Front. Mar. Sci. 9:1119410. doi: 10.3389/fmars.2022.1119410
Received: 08 December 2022; Accepted: 28 December 2022;
Published: 26 January 2023.
Edited by:
Ce Shi, Ningbo University, ChinaCopyright © 2023 Mei, Zhang, Luo, Zhang, Hu, Bao, Lian, Zhao and Duan. This is an open-access article distributed under the terms of the Creative Commons Attribution License (CC BY). The use, distribution or reproduction in other forums is permitted, provided the original author(s) and the copyright owner(s) are credited and that the original publication in this journal is cited, in accordance with accepted academic practice. No use, distribution or reproduction is permitted which does not comply with these terms.
*Correspondence: Ming Duan, ZHVhbm1pbmdAaWhiLmFjLmNu; Daxian Zhao, emhhb2RheGlhbkBuY3UuZWR1LmNu
†These authors share first authorship