 Tongfei Qu1Chengzong Hou1
 Chen Guan1Xinyu Zhao2Jun Chen1Yi Zhong1Jinhui Xu1Zhihao Lin1Yu Xu1Xuexi Tang1,2*
 Ying Wang1,2*
- 1College of Marine Life Sciences, Ocean University of China, Qingdao, China
- 2Laboratory for Marine Ecology and Environmental Science, Qingdao National Laboratory for Marine Science and Technology, Qingdao, China
Based on the diversity and importance of phycospheric microorganisms as well as their complex interaction with algae, their ecological correlation with algal bloom events has become a research topic of great interest that remains unclear in the natural dynamic process of harmful macroalgal blooms (HMBs). The world’s largest green tides caused by macroalgae Ulva prolifera have occurred in the Yellow Sea for 16 consecutive years, and seriously affected the coastal ecosystem. Here, we monitored the spatiotemporal dynamics of the phycospheric bacterial community during the U. prolifera green tide bloom. The 73-day continuous field survey covered the whole process of initial invasion until the extinction of the green tide. The phycospheric bacterial community has a higher richness than the control seawater bacteria; in addition, it has more enriched taxa with organic nutrition preference and environmental pressure adaption, such as Bacteroidetes, Firmicutes, and Desulfobacterota. The same differences in populations and functional profiles were observed among the epiphytic bacterial and phycospheric seawater bacterial communities, which may be driven by the spatial heterogeneity of biogenic elements (e.g., organic nutrients and oxygen) among the habitats. Significant succession occurred in both the epiphytic bacterial and phycospheric seawater bacterial communities; their diversity and richness exhibited significant heterogeneity variation patterns, and their community structure became more similar in late phases. Our study revealed that macroalgal phycospheric microbial communities have a highly complex and dynamic composition and variable ecological functions, which indicate that phycospheric microorganisms are closely related to the fate of HMBs and may have the profound effect coastal biogeochemical cycles.
Introduction
Algae and microorganisms are important regulators of the structure and function of marine ecosystems, and intricate interactions between algae and microorganisms govern marine productivity and biogeochemical cycling, representing a fundamental ecological relationship (Moran, 2015; Seymour et al., 2017). Marine bacteria are extremely diverse and multifunctional, and they often differ greatly in their biodegradability, organic nutrient preferences and life strategies (Azam and Malfatti, 2007; Moran, 2015). Indeed, many taxa have always been identified in algae-associated bacterial communities albeit mostly at the phylum level, such as Proteobacteria, Bacteroidota, and Cyanobacteria (Singh and Reddy, 2014; Paix et al., 2021). Interestingly, some specific taxa live on one type of algae, and none (or only very small numbers are found) on others (Burke et al., 2011; Egan et al., 2013). The distribution of such common and specific taxa is determined by the algal type (i.e., red, green, and brown algae), life cycle (i.e., health and aging), and habitats (endophytic, epiphytic, and free-living) (Egan et al., 2013; Seymour et al., 2017). In turn, the succession of these taxa reflects changes in the physiological and habitat characteristics of their algal host, and acts as the indicators of environmental change (Abdel-Gawad et al., 2014; Seymour et al., 2017). Studies on algal–microbial interactions have typically been conducted on large spatiotemporal scales (Azam and Malfatti, 2007; Moran, 2015). Emerging evidence indicates that the algae–bacteria relationship is often governed by microscale interactions played out within the region immediately surrounding algal cells, which is known as the phycosphere (Kim et al., 2022; Raina et al., 2022).
The phycosphere is the key ecological interface for algae–microorganism interactions (Seymour et al., 2017), and can be considered as marketplace where cross-kingdom communications are mediated by the release and uptake of organic compounds and gradients within this sphere guide chemoattraction of bacteria in microscale interactions (Ashraf et al., 2022). Thus, the size of the phycosphere is variable (several hundreds of micrometers to a few millimeters), depending largely on the size of algal cells and surrounding microbes, and can be changed by algal growth, exudation rate, concentration, and diffusivity of exuded compounds (Smriga et al., 2016; Seymour et al., 2017; Ashraf et al., 2022). Phycospheric microbial communities have highly complex and dynamic compositions, and variable ecological functions (Seymour et al., 2017). Phycospheric microorganisms exist in various forms; microorganisms in a free and particulate form are suspended in phycospheric seawater, while those in a flocculated form can build a zoogloea consortium to surround phytoplankton cells or build biofilms to attach to the macroalgal surface (Flemming et al., 2016). Recent research has revealed that the phycosphere contains many new and undiscovered microbial lineages and genetic resources (Zhang et al., 2019a; Ashraf et al., 2022). The formation of phycosphere microbial communities are closely related to algal bloom events and phycospheric microorganisms can influence the fate and development of algal bloom cooperatively or competitively, providing a new theory to analyze the mechanism of algal bloom occurrence (Zhou et al., 2018; Flemming and Wuertz, 2019; Liu et al., 2019).
The worldwide macroalgae Ulva spp. initially settled as major producers in intertidal to coastal waters, and the expansion of their free-floating taxa biomass increased their distribution (Smetacek and Zingone, 2013). The occurrence of Ulva spp. macroalgae blooms has become a worldwide marine ecological problem, spreading to many coastal countries in Europe, North America, and the Asia-Pacific region (Zhang et al., 2019b). Since 2007, green tides caused by macroalgae Ulva prolifera have been occurring periodically in the Yellow Sea of China, and have been recognized as the world’s largest green tide in terms of its distribution, coverage, and biomass of floating algae (Wang et al., 2015). The U. prolifera green tide is a typical trans-regional ecological disaster and usually originates in the coastal areas of the southern China Yellow Sea (33°N) from mid-April to early May (Wang et al., 2015). After a long northward migration driven by ocean currents and the southeast monsoon, floating U. prolifera grows to a huge size, and usually begins to invade the coast of the Shandong Peninsula (36°N) in mid-June (Zhou et al., 2015). Massive macroalgae form dense algal mats (more than 50 cm thick) that cover the coastal water and seriously upset the balance of the coastal ecosystems (Zhao et al., 2016). For example they hinder air–sea exchanges and cause organic nutrient overload. The decomposition of the massively accumulated algae can degrade seawater quality, cause seawater hypoxia, acidification, eutrophication, and even lead to the death of cultured organisms (Hou et al., 2022). In addition, the massive macroalgal bloom can have a long-term impact on marine biogeochemical cycles (Chen et al., 2020). Researchers have begun to focus on the potential interactions between U. prolifera and microbial communities, and hope to reveal the potential causes and ecological effects of U. prolifera green tides from the perspective of interspecific relationships. Studies of U. prolifera-associated microorganisms are usually conducted in laboratory simulation systems (Chen et al., 2020; Liang et al., 2021), and most field surveys focus on changes in environmental microbial communities (i.e., surface seawater and sediment) (Qu et al., 2020; Zhao et al., 2022). There are few field surveys on phycospheric microbial diversity in the natural dynamic process of the U. prolifera green tide.
Our recent research has revealed the complex dynamics of the structure and function of the phycospheric microbial community during the long-distance migration process of the U. prolifera green tide (Qu et al., 2021). However, there is currently a lack of systematic research on the structure and function succession of the phycospheric microbial community during the outbreak and extinction process of the green tide. In this research, a 73-day long field survey covered the entire process of U. prolifera green tide from the initial invasion to the final extinction. The process was divided into four phases based on the variations in population size and physiological activity of floating algae, and phycospheric bacteria, including epiphytic bacteria and phycospheric seawater bacteria were collected in each phase. High-throughput sequencing of the 16S rRNA gene was employed to characterize the community structure and function succession of U. prolifera phycospheric bacteria. Our study generated information on the interaction and synergistic evolution between marine organisms and the environment, providing new ideas to increase our understanding of the diversity and variation pattern of macroalgal phycospheric microbial communities, as well as the formation mechanisms and ecological effects of green tides.
Methods
Sampling procedures
This study was conducted in the coastal area of Tuandao Bay, Qingdao, China (36°056′N; 120°303′E) (Figure 1), which is most severely affected by U. prolifera green tide bloom every year. The coast of Tuandao Bay is a typical artificial shoreline without large seaweed beds, and there are no large rivers or outfalls into the sea. A 73-days (June 10 to August 22, 2021) continuous field survey covering the whole process of initial invasion until the extinction of the green tide was conducted. The population size of the floating algae was evaluated using the coverage and distribution area of the green tide in the north sea area of N 35°, and the algal physiological activities were evaluated using the PSII maximum quantum yield (Fv/Fm) of floating algae. Combining the population size and the algal physiological activities, the green tide bloom was divided into four phases, namely the development phase (P1), maintenance phase (P2), decline phase (P3), and extinction phase (P4) (Figure 2). Further phycospheric and control seawater sample collection was carried out in the four phases. There was no rainfall on the sampling day and the day before.
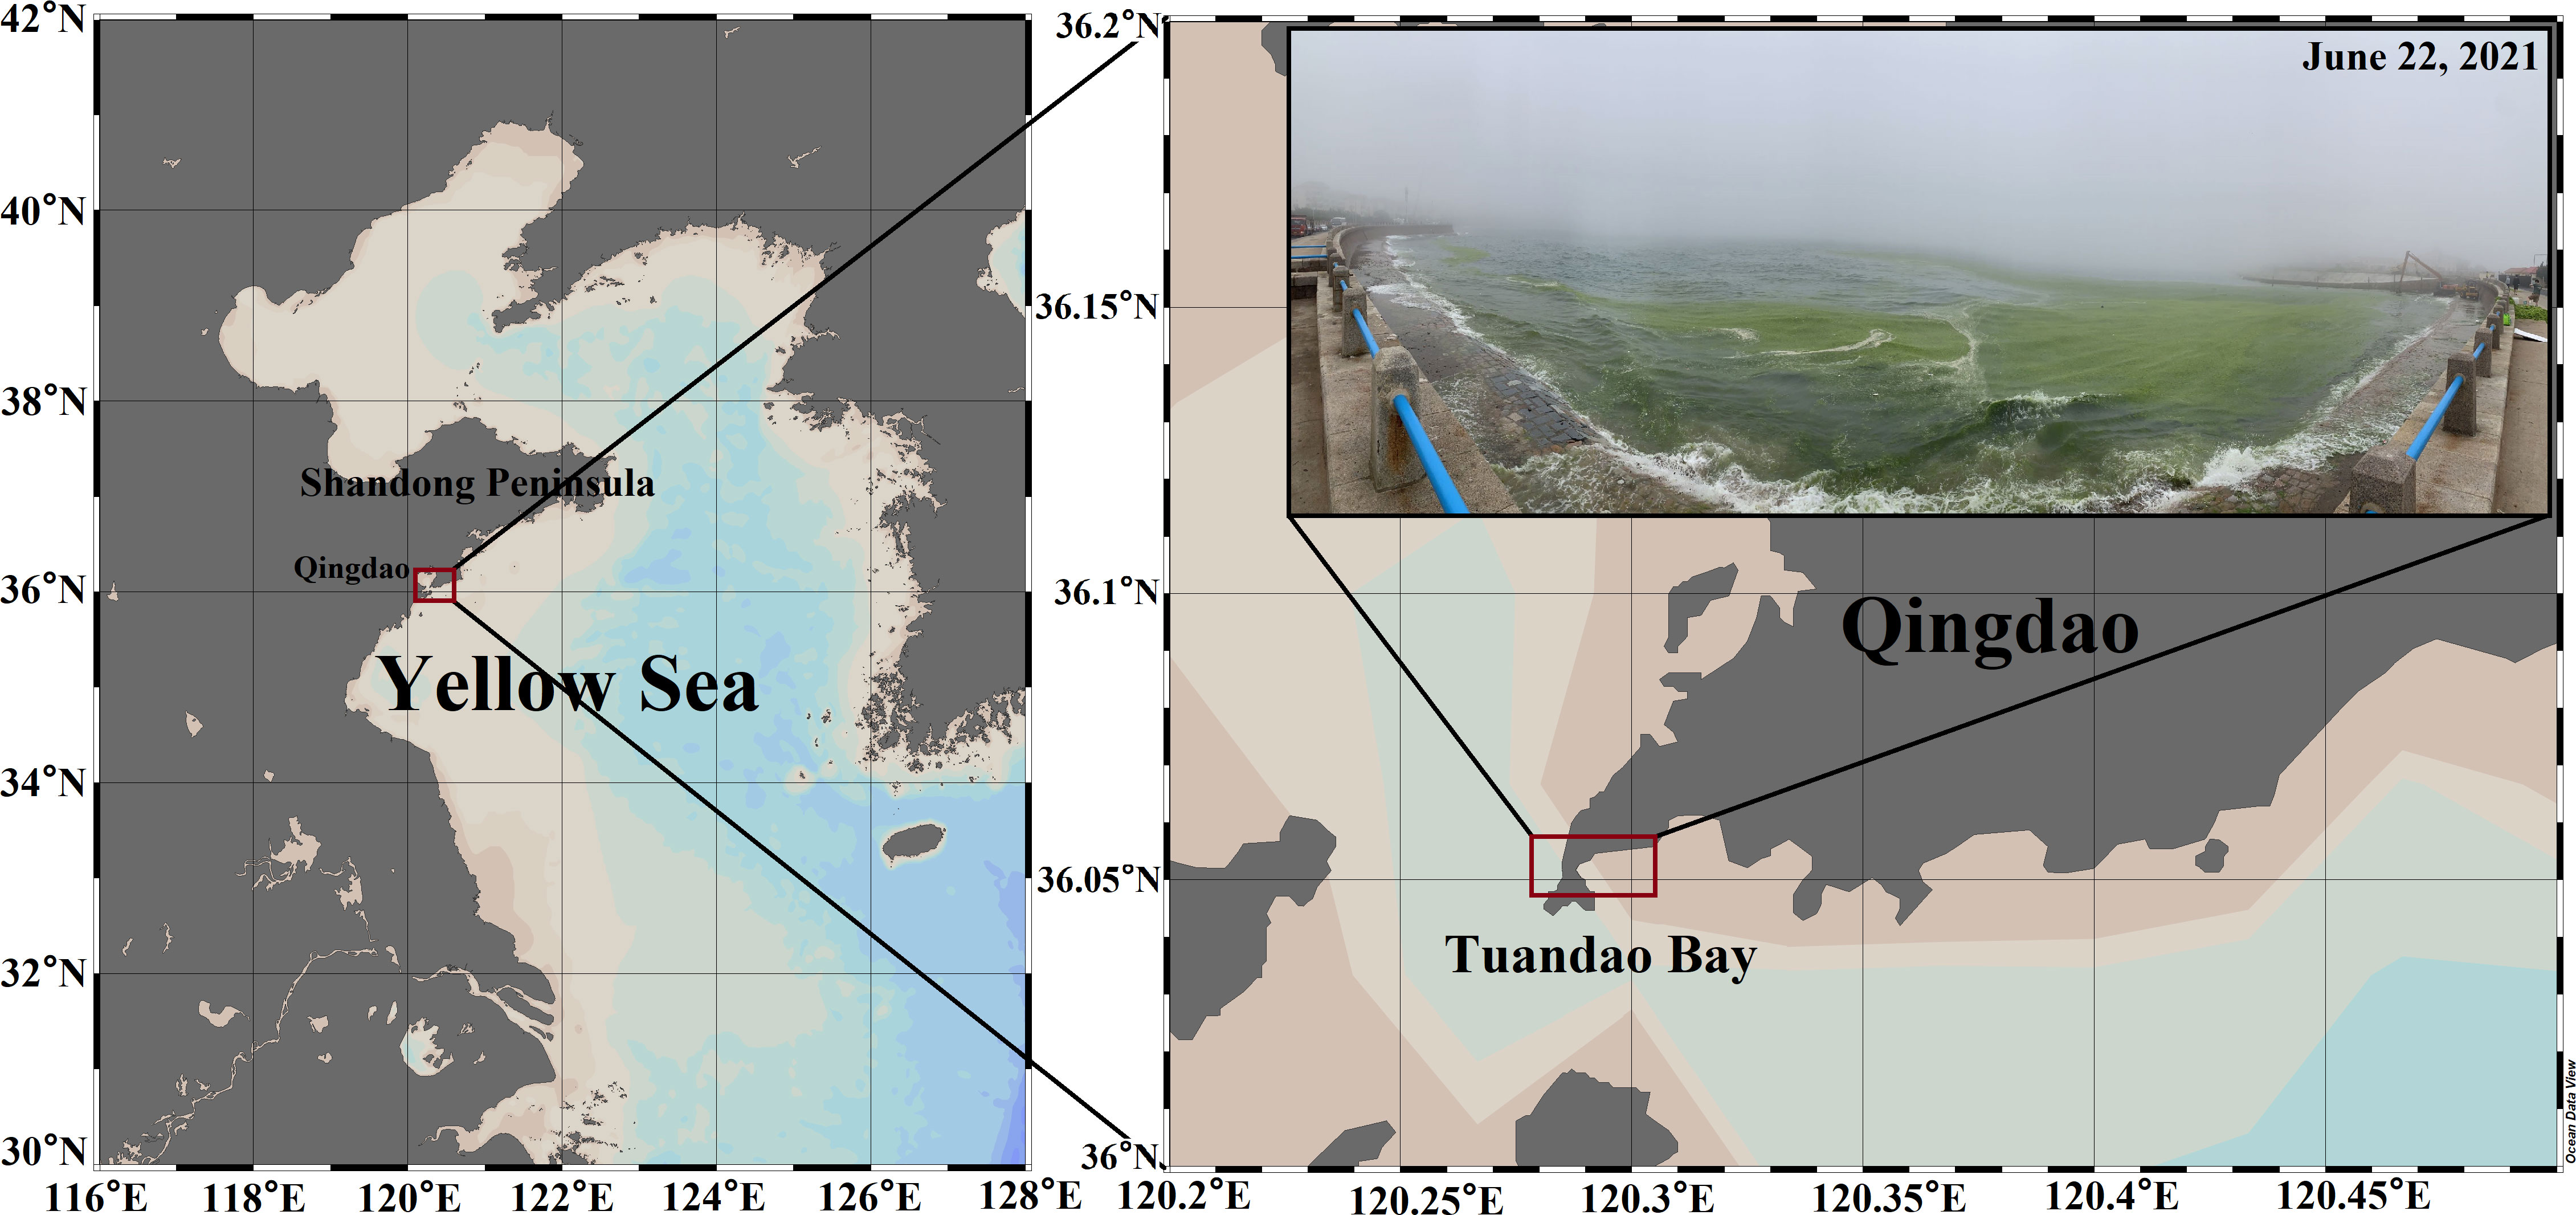
Figure 1 Locations of the investigation area in Tuandao Bay, Qingdao, China.
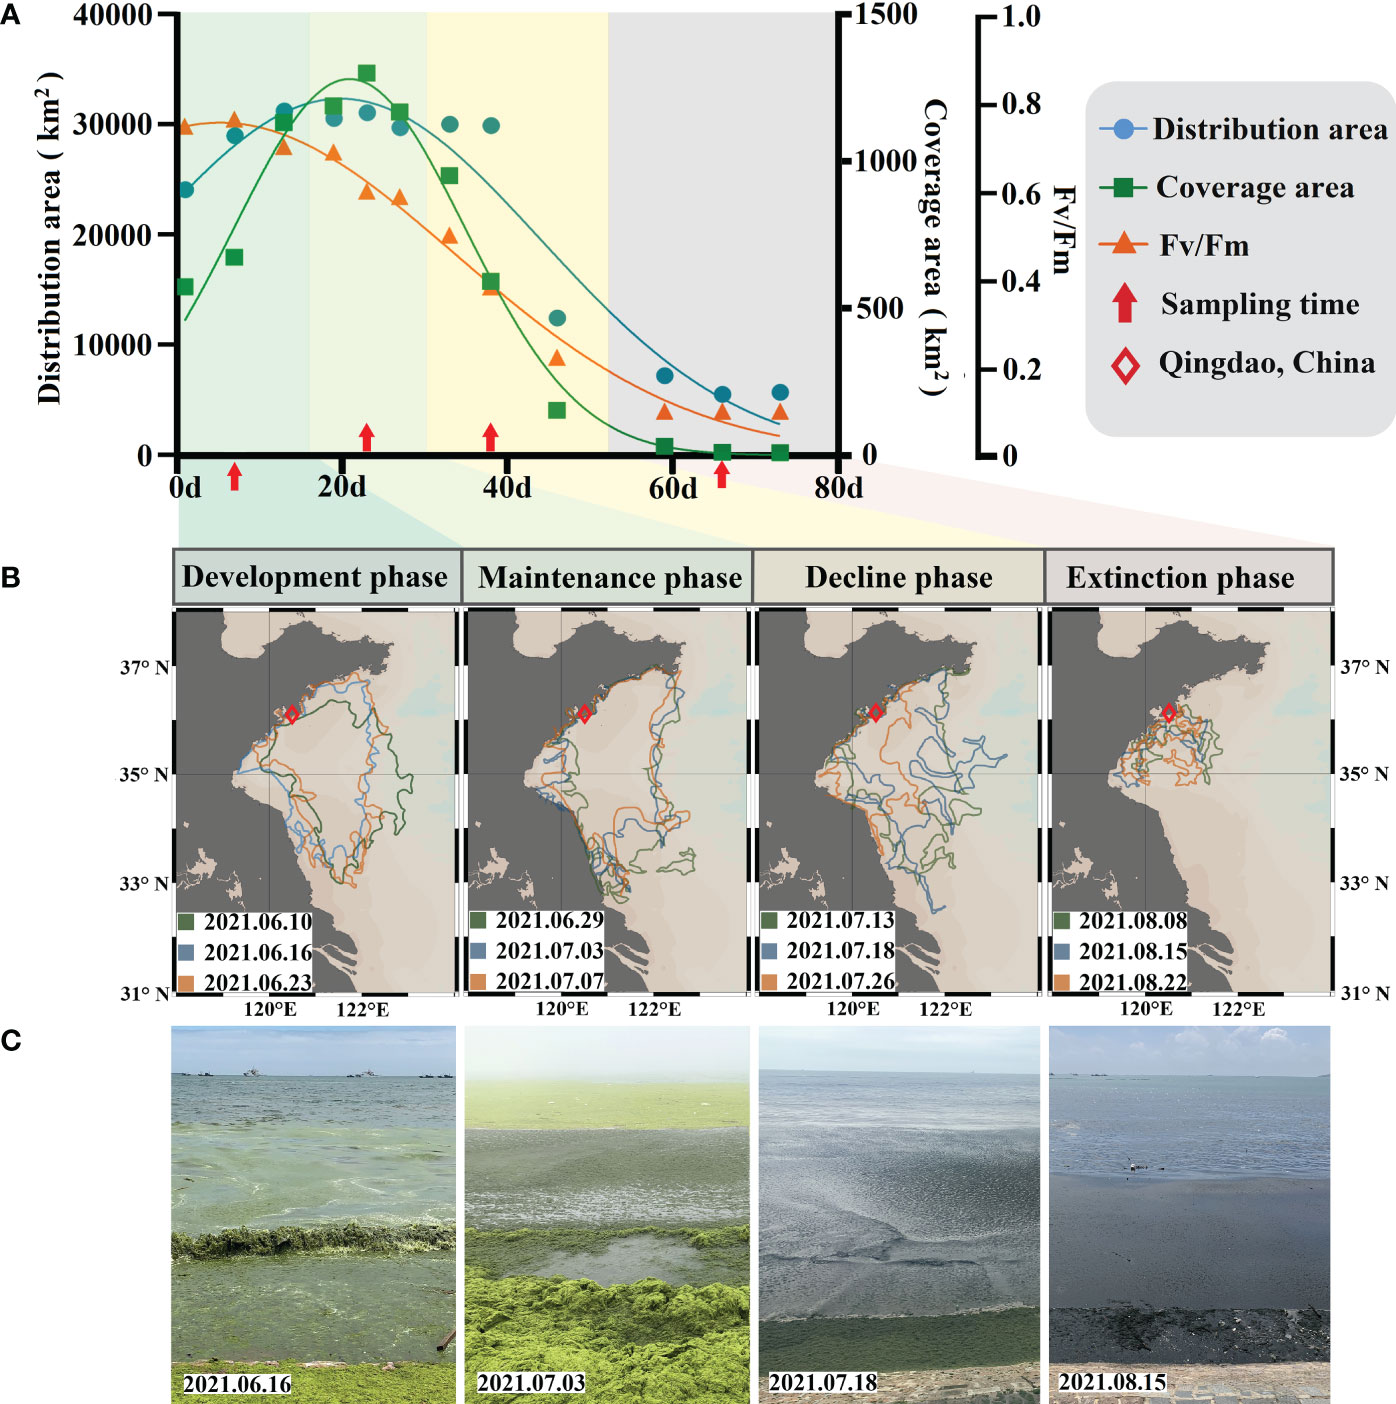
Figure 2 Information on the process of the U. prolifera green tide bloom and the phases. (A) Variations in the distribution area, coverage area, and algal physiological activity. (B) Phases of the green tide bloom. (C) Field conditions of the investigation during the different phases of the green tide bloom.
The phycospheric samples, comprising the floating algae and phycospheric seawater, were collected from 0–20 cm depth in the center of the algal mats (Figure S1A, B). The floating algae in this location were dense and could be representative of the growth state of the entire floating population (Zhao et al., 2016). The floating algae and interstitial seawater (average distance from the thalli is less than 5 mm) were collected simultaneously using the sterilized samplers, and then separated using sterile screens with 2 mm pores. The interstitial seawater was considered the phycospheric seawater (Figure S1C). The control seawater samples were collected from 0–20 cm depth in the seawater without floating algal cover during the green tide bloom. The algal samples were used for the measurement of algal physiological characteristics and the collection of epiphytic bacteria. The phycospheric seawater and control seawater samples were used for the collection of phycospheric seawater bacteria and control seawater bacteria (Figure S1D).
Measurement of algal physiological state
The thalli were cleaned gently with sterile seawater and brushes. Then, the algal thalli were checked for small grazers and epiphytes, which, if present, were carefully removed with a sterile scraper. To ensure that we were working with U. prolifera, we identified the floating algal samples by morphological identification based on the color of the algae, the condition of the base (holdfasts, etc.), and the outline of the algae (main axis and branching characteristics). The parameter Fv/Fm (PSII maximum quantum yield) was measured to characterize the algal photosynthetic activity. A Dual-PAM-100 fluorometer (Walz, Berlin, Germany) was used to measure the chlorophyll fluorescence. Before the experiments, the thalli were placed in the dark for 15 min. The settings of the Dual-PAM-100 fluorometer were as described by Zhao et al. (2016). The automated induction, recovery curve routine, and repetitive application of saturation pulses were used to obtain the results of chlorophyll fluorescence. After the saturation pulse, F0 and Fm were determined. F0 is the minimal fluorescence after dark acclimation and Fm is the maximal fluorescence after saturation flashes in the dark-acclimatized sample. The parameter Fv/Fm was calculated using the equation: Fv/Fm = (Fm − F0)/Fm, which represents the PSII maximum quantum yield in the thalli and can be used to evaluate the photosynthetic activity in U. prolifera.
Microbial sample collection and pretreatment
For each phycospheric seawater bacterial sample, 3 L of phycospheric seawater was prefiltered through a polycarbonate filter with 3-µm pore sizes, and then the phycospheric seawater bacteria were collected using a polycarbonate filter with 0.22-μm pore sizes (filtration pressure < 0.04 MPa). The control seawater bacterial samples were treated in the same way as the phycospheric seawater bacterial samples. Epiphytic bacteria were obtained by co-vortexing algae with silica sands, and this method can almost completely collect epiphytic bacteria (Liu et al., 2022). For each epiphytic bacterial sample, the thallus with 50 g fresh weight was rinsed three times in autoclaved artificial seawater and then co-vortexed with sterilized silica sand for three rounds at 150 rpm. The vortex suspension was composed of 50g U. prolifera, silica sand with grain sizes ranging from 125–250 µm, and 300 mL sterilized seawater. After each round of vortexing for 15 min, the suspension was entirely renewed for the next round. All vortex suspensions produced over the three rounds were combined and pre-filtrated using mixed cellulose ester filter membranes with 3-μm pore sizes to remove the silica sand and other contamination. The epiphytic bacteria were then collected from the filtering liquid using a polycarbonate filter with 0.22-μm pore sizes (filtration pressure < 0.04 MPa). All the filters were stored at –80°C until DNA extraction.
DNA extraction, 16S rRNA gene amplification, and high throughput sequencing
Microbial DNA was extracted from all the samples using the MoBio PowerSoil DNA kit (Qiagen, CA, USA) according to the manufacturer’s protocols. The final DNA concentration and purity were determined using a Qubit 2.0 Fluorometer (Thermo Scientific, MA, USA). DNA quality was assessed using 1% agarose gel electrophoresis. The V3–V4 hypervariable regions of the 16S rRNA gene were PCR-amplified with primers 338F-806R (Sangon, Shanghai, China) (Chen et al., 2022) using a GeneAmp 9700 thermocycler system (ABI, CA, USA). All PCRs were performed in 15 μL reaction volumes containing 7.5 μL of Phusion High-Fidelity PCR Master Mix (New England Biolabs, MA, USA), 1 μL of forward and reverse primers (10 μM), 1 μL of dNTPs (2.5 mM), and 1 μL template DNA. Thermal cycling consisted of initial denaturation at 95°C for 2 min followed by 25 cycles of denaturation at 94°C for 5 s, annealing at 55°C for 30 s, and elongation at 72°C for 30 s. The PCR products from each sample were detected using electrophoresis on 1.5% agarose gel. The PCR products obtained were purified, quantified, and mixed in equal amounts to construct the sequencing libraries. The library quality was evaluated using an Agilent Bioanalyzer 2100 system and a Qubit @2.0 Fluorometer (Thermo Scientific, MA, USA). Purified amplicons were pooled in equimolar amounts and paired-end sequenced (2 × 300) on an Illumina Novaseq 6000 platform (Illumina, CA, USA).
Sequencing process and statistical analysis
The raw data were primarily filtered using Trimmomatic (version 0.33). The identification and removal of primer sequences were performed using Cutadapt (version 1.9.1). The paired-end reads obtained from the previous steps were assembled using USEARCH (version 10.0) followed by chimera removal using UCHIME (version 8.1). The high-quality clean reads generated from the above steps were used for amplicon sequence variant (ASV) Clustering. The sequencing depth was characterized using Good’s coverage index, rarefaction curve, and Shannon index curve. DADA2 (version 1.2) was applied to cluster sequences with a similarity of 100%. The representative sequence of each ASV was chosen using the default method and assigned a bacterial taxon based on the SILVA ribosomal RNA database (SILVA 138). A bacterial ASV abundance table was constructed, and data normalization was based on the smallest number of effective sequences (clean reads) in all the samples.
The mean values and standard deviation were calculated according to the different replicates of each treatment. The one-way ANOVA, Student’s t test, and Pearson correlation analysis were performed using SPSS 22.0 statistical software (SPSS Inc., USA). Column diagrams were generated by OriginPro 2019 (OriginLab, USA). Alpha diversity indexes, including Chao1, Shannon, and Simpson indexes, were calculated using QIIME 2 (Quantitative Insights into Microbial Ecology) to analyze the richness, diversity, and evenness of the bacterial community. Beta diversity was calculated using Bray-Curtis distances based on relative abundance matrices of ASVs. Nonmetric multidimensional scaling (NMDS) was employed to reveal the changes in the bacterial community structure. The unweighted pair-group method with arithmetic mean (UPGMA) analysis based on the Bray–Curtis distances was used to determine the community structural similarities between samples. The permutation multivariate analysis of variance (PERMANOVA) was applied to test the significance of differences in bacterial community structure. Unique and common ASVs are shown by the Venn diagram. The non-strict version of Linear discriminant analysis effect size (LEfSe) was used to identify which taxa among all those detected as statistically and biologically differentially abundant, could explain the greatest differences across the different groups (the taxa observed in less than 60% of the samples were filtered out). Functional Annotation of Prokaryotic Taxa (FAPROTAX) was applied to predict the functional potential of the bacterial community by 16S rRNA gene sequencing profiles following the developer’s instructions, and the taxonomic microbial community profiles were extrapolated into putative functional profiles based on a database of cultured microorganisms (Louca et al., 2016).
Results
The characteristics and phases of the green tide bloom
The main body of the green tide began to invade the survey area on a large scale on June 12, 2021, and the population size of the floating algae expanded dramatically, as shown by the continuous increase in the distribution area and coverage area of the green tide in the area of north N35° (Figure 2A). The green tide distribution data were obtained from the North China Sea Marine Forecasting Center of State Oceanic Administration (http://www.nmfc.org.cn). The distribution area and coverage area reached the peak on July 3, with 31,143 km2 and 1302 km2, respectively. After that, the scale of the green tide was maintained at a large scale until July 13, when the coverage area of the floating algae was significantly reduced. The impact of U. prolifera green tide on the offshore continued until late August. The distribution area and the coverage area showed extremely strong covariation characteristics (Pearson, R = 0.94, P < 0.001). The floating algae collected initially had a healthy growth state manifested by a high physiological activity (Fv/Fmmax = 0.764). Throughout the investigation, the floating algal photosynthetic activity showed a decreasing trend and eventually dropped below the detection limit of 0.1 (Figure 2A). Algal physiological activity was significantly and positively correlated with the distribution and coverage area of the green tide (Pearson, R > 0.86, P < 0.001). In addition, the weakening of the floating algal population size showed a relative lag compared to that of the algal physiological activity (approximately 2 weeks).
Combined with the population size of the U. prolifera and the variation in algal activity, the process of the U. prolifera green tide could be divided into four phases (Figures 2B, C). Development phase (P1): the distribution area (24158 km2 to 31306 km2) and coverage area (574 km2 to 1134 km2) of the floating algae increased rapidly. The floating algae have high physiological activity (Fv/Fm > 0.7). Maintenance phase (P2): the distribution area (>30,000 km2) and the coverage area (>1000 km2) of the floating algae reached the peak and maintained a high level. The floating algae were in a semi-healthy physiological state (Fv/Fm: 0.5–0.7). Decline phase (P3): the distribution area (30,100 km2 to 12550 km2) and the coverage area (952 km2 to 153 km2) of the floating algae decreased significantly. The algae were in a senescent physiological state (Fv/Fm: 0.2–0.5). Extinction phase (P4): the distribution area (< 7000 km2) and the coverage area (< 30 km2) of the floating algae decreased significantly. The algae almost completely lost physiological activity (Fv/Fm < 0.1). P1 and P2 were defined as the early phases of the green tide bloom, and P3 and P4 were defined as the late phases of the green tide bloom.
Sequencing quality
Using the Illumina Novaseq 6000 platform, 4,308,375 filtered 16S rRNA gene sequences were obtained from 54 samples, with each sample producing 79,785 sequences on average (range: 79,292–80,332, SD = 227). Based on the 100% similarity threshold, they were classified into 15,448 ASVs, 286 per sample (range: 173–378, SD = 49). Statistical analysis indicates that the average number of clean reads and ASVs were 79,670 and 305, respectively, for each epiphytic bacterial sample; 79,985 and 292, respectively, for each phycospheric seawater bacterial sample, while 79,440 and 183, respectively, for each control seawater bacterial sample. The average number of clean reads and ASVs of the phycospheric samples, comprising the epiphytic bacterial samples an and the phycospheric seawater bacterial samples were significantly higher (Student’s t test, P < 0.05) than those of the control seawater bacterial samples, suggesting that the bacterial richness in the phycosphere was higher than that in the control seawater. More detailed 16S rRNA sequencing results are shown in Table S1.
The sequencing depth was evaluated using the rarefaction curve and Shannon index curve to determine whether it met the requirements of subsequent bioinformatics analysis. Both the rarefaction curve and the Shannon index curve tended to be flattened with the increase in sequencing depth (Figure S2). The Shannon index curve reached saturation before the rarefaction reach the plateau. These reflect that the vast majority of bacterial diversity was captured. The Goods coverage index showed that the species coverage of the bacterial samples ranged from 0.999–1.000 (Table S1); therefore, our sequencing results reflect the real situation of the bacterial community.
Fluctuations and diversity patterns of phycospheric bacterial communities
Alpha indexes were calculated to investigate changes in the biodiversity of the bacterial communities (Table S1). The richness (Chao1 index) of the phycospheric bacterial community comprising the epiphytic bacteria and the phycospheric seawater bacteria was significantly higher than that of the control seawater bacteria (one-way ANOVA, P < 0.05) (Figure 3A). The Shannon and Simpson indexes of the phycospheric seawater bacteria were significantly lower than those of the epiphytic and control seawater bacteria in the early phases (P1 and P2) (one-way ANOVA, P < 0.05), whereas in the later phases (P3 and P4), the Shannon and Simpson indexes of the phycospheric seawater bacteria were significantly higher than those of the control seawater bacteria and were not significantly different from that of the epiphytic bacteria. The highest Chao1, Shannon, and Simpson indexes of the epiphytic and phycospheric seawater bacterial community occurred in the maintenance (P2) and extinction phases (P4), respectively.
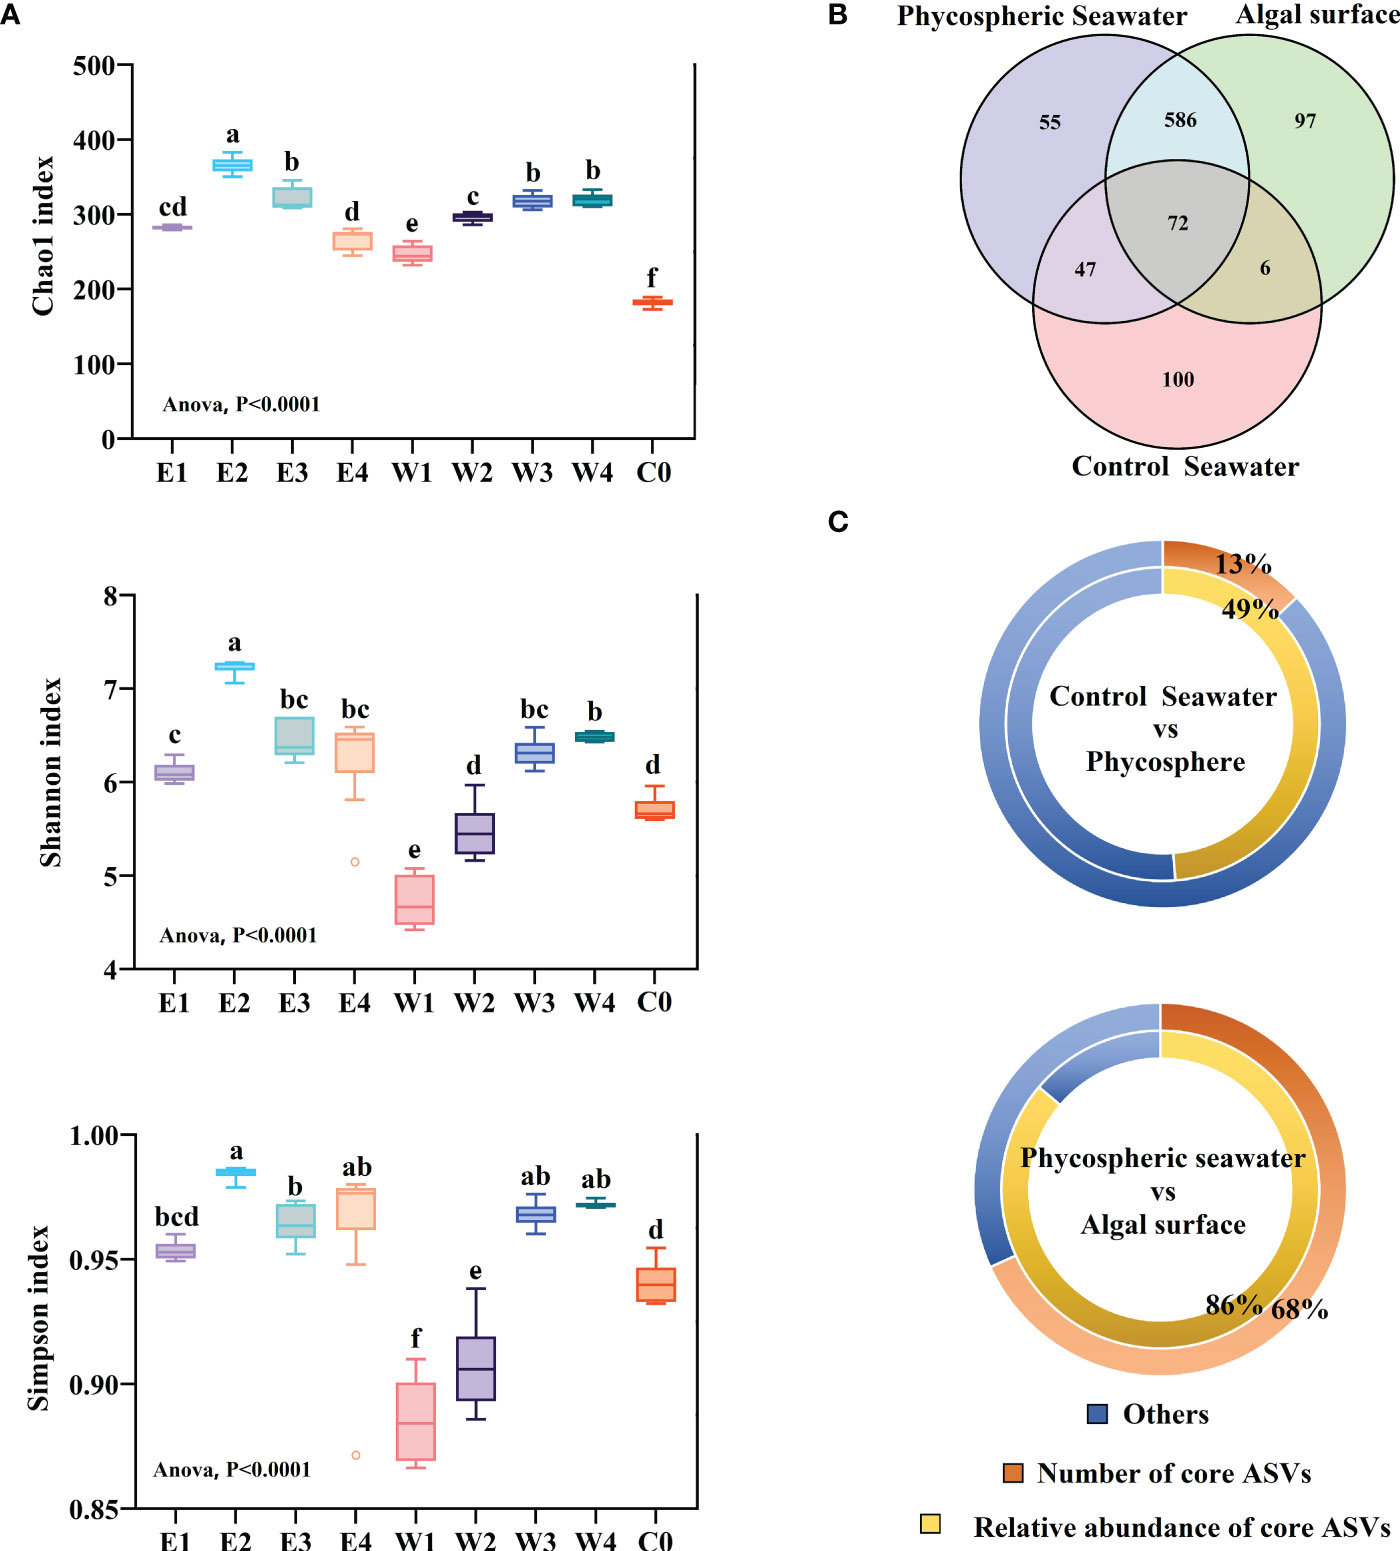
Figure 3 Alpha diversity and taxonomic features of the phycospheric bacterial community. E and W refer to the epiphytic and phycospheric seawater bacterial sample groups, respectively. The numbers 1 to 4 refer to the P1 to P4 phases, respectively. C0 refers to the control seawater bacterial sample groups. (A) Alpha diversity indexes of the sample groups. The Chao1, Shannon, and Simpson indexes were calculated to indicate the richness, diversity, and evenness of the bacterial community, respectively. The error bars represent standard deviations (n = 6). Different letters above the bars indicate significantly different values (one-way ANOVA, P < 0.05). (B) Venn diagram analyse shows the common and unique ASVs. The circle in the figure represents sample groups, and the number of overlaps represents the number of ASVs shared between the samples. The numbers without overlap represent the number of unique ASVs in the sample. (C) Percentage and relative abundance of the core ASVs in all samples.
The variations in the Chao 1 and Shannon indexes revealed heterogeneous succession patterns in the richness and diversity of the epiphytic bacterial and phycospheric seawater bacterial community. Specifically, the epiphytic bacteria and phycospheric seawater bacteria both showed a significant increasing trend in richness and diversity during the early phases (P1 and P2) (one-way ANOVA, P < 0.05), and the richness and diversity of the epiphytic bacterial community were significantly higher than those of the phycospheric seawater bacterial community (one-way ANOVA, P < 0.05). During the late phases (P3 and P4), the richness and diversity showed decreased and increased trends in the epiphytic bacterial and phycospheric seawater bacterial communities, respectively. The heterogeneous succession patterns caused the richness and diversity of the phycospheric seawater bacterial community to catch up with or even exceed that of the epiphytic bacterial community in the late phases.
Variation in taxonomic features and composition of the phycospheric bacterial community
A total of 963 different ASVs were identified during the investigation. Only 13% ASVs (125) were distributed both in phycosphere and control seawater (Figure 3B), but the sequences of these ASVs occupied an average of 49% of the total 16S rDNA sequences (Figure 3C). There was still a considerable number of ASVs (738) only distributed in the phycosphere. Among these ASVs, 658 ASVs (68% of the total ASVs) were distributed both in the phycospheric seawater and on the algal surface (Figure 3B), and their sequences occupied an average of 86% of the total 16S rDNA sequences (Figure 3C). The number of common ASVs shared by the epiphytic and phycospheric seawater bacteria was higher in the P3 (353) and P4 (323) phases than in the P1 (288) and P2 (310) phases (Figure S3). The above results indicate that the bacterial composition in the phycosphere is vastly different from that in the control seawater, and the composition of the epiphytic bacterial and phycospheric seawater bacterial communities became similar with the green tide development.
The composition of the phycospheric bacterial community exhibited significant variation with the green tide development. The dominant bacterial phyla, families, genera, and ASVs with relative abundance above 1.00% were calculated (Figure 4, S4). The dominant bacterial phyla included Proteobacteria, Bacteroidetes, Firmicutes, Campylobacterota, Desulfobacterota, Patescibacteria, Spirochaetota, and Cyanobacteria (Figure 4A). Proteobacteria (7–78%) was the dominant bacterial phyla both in the phycosphere and control seawater, and Bacteroidetes (9–49%), Firmicutes (8–22%), Campylobacterota (1–29%), Desulfobacterota (2–11%), and Spirochaetota (1–7%) were significantly enriched in the phycosphere compared to the control seawater (Student’s t test, P < 0.05). Among these phyla, Desulfobacterota and Spirochaetota were more enriched in the epiphytic bacterial communities. Campylobacterota (19–29%) was more enriched in the phycospheric seawater bacterial communities, especially during the early phases.
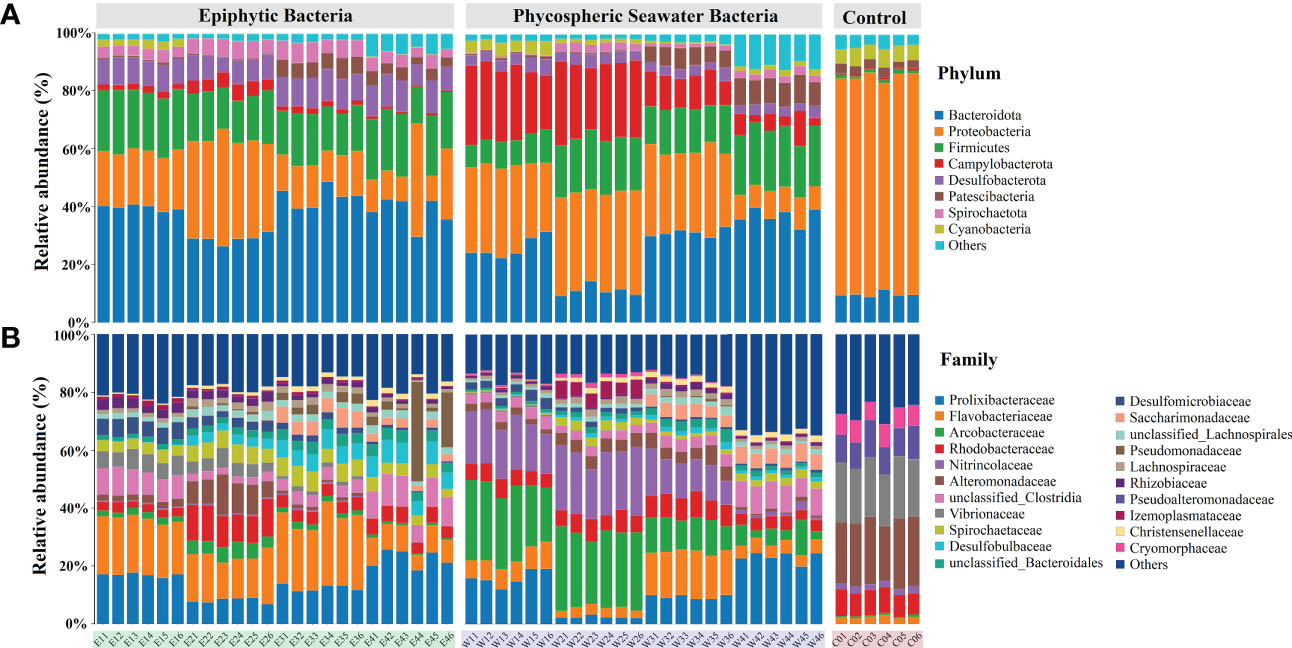
Figure 4 Taxonomic composition of bacterial communities. The histograms show the phyla (A) and families (B) with relative abundance above 1.00%. E and W refer to the epiphytic and phycospheric seawater bacterial sample groups, respectively. The numbers 1 to 4 refer to the P1 to P4 phases, respectively. C0 refers to the control seawater bacterial sample groups. Others: sum of taxa with a relative abundance below 1%.
The dominant bacterial families mainly included Prolixibacteraceae, Flavobacteriaceae, Arcobacteraceae, Rhodobacteraceae, Nitrincolaceae, and Alteromonadaceae (Figure 4B). Rhodobacteraceae (2–13%) and Alteromonadaceae (1–24%) were the dominant bacterial families both in phycosphere and control seawater. Prolixibacteraceae, Flavobacteriaceae, Arcobacteraceae, Nitrincolaceae, unclassified Clostridia, Spirochaetaceae, Desulfobulbaceae, and Desulfomicrobiaceae were more enriched in the phycosphere. The dominate bacterial families were varied among the epiphytic and phycospheric seawater bacterial communities. In the epiphytic bacterial communities, Flavobacteriaceae (5–29%) and Vibrionaceae (1–7%) were abundant and their abundance decreased with the green tide development, while Desulfobulbaceae (1–8%) was more abundant during the late phases. In the phycospheric seawater bacterial communities, Arcobacteraceae (3–29%) and Nitrincolaceae (1–24%) were more enriched and their abundance decreased with the green tide development, while Prolixibacteraceae (2–25%) and unclassified Clostridia (2–9%) were more abundant during the late phases.
Phycospheric bacterial community structural dynamics
The structural differences between each sample group were visualized using NMDS analysis based on Bray–Curtis distance (Figure 5A) and samples with similar community structure are closer in the NMDS plot. The significance of the differences was tested using PERMANOVA analysis. The results show that all the sample groups were separated (PERMANOVA, R2 = 0.965, P < 0.001), indicating that their bacterial community structures were different. The phycospheric samples comprising the epiphytic bacterial samples and phycospheric bacterial samples were separated from the control seawater bacterial samples (PERMANOVA, R2 = 0.261, P < 0.001) (Figure 5A). The phycospheric seawater bacterial samples could be separated from the epiphytic bacterial samples on the horizontal axis (PERMANOVA, R2 = 0.201, P < 0.001). Moreover, the phycospheric samples derived from the different phases could be differentiated on the vertical axis (PERMANOVA, R2 = 0.633, P < 0.001). The epiphytic bacterial and phycospheric seawater bacterial samples were closer in the late phases, indicating that their bacterial communities were more similar. The UPGMA analysis based on the Bray–Curtis distances clustered the samples to determine the community structural similarities between the samples. The closer the sample groups the shorter branch lengths, indicating that the community structure of the two sample groups is more similar. UPGMA analysis revealed that most of the samples were clustered by phases rather than sample types (Figure 5B). It indicates that phase was the largest source of variation in the phycospheric bacterial community structure rather than sample types, which is the same as the results of PERMANOVA (Figure 5A; Table S2).
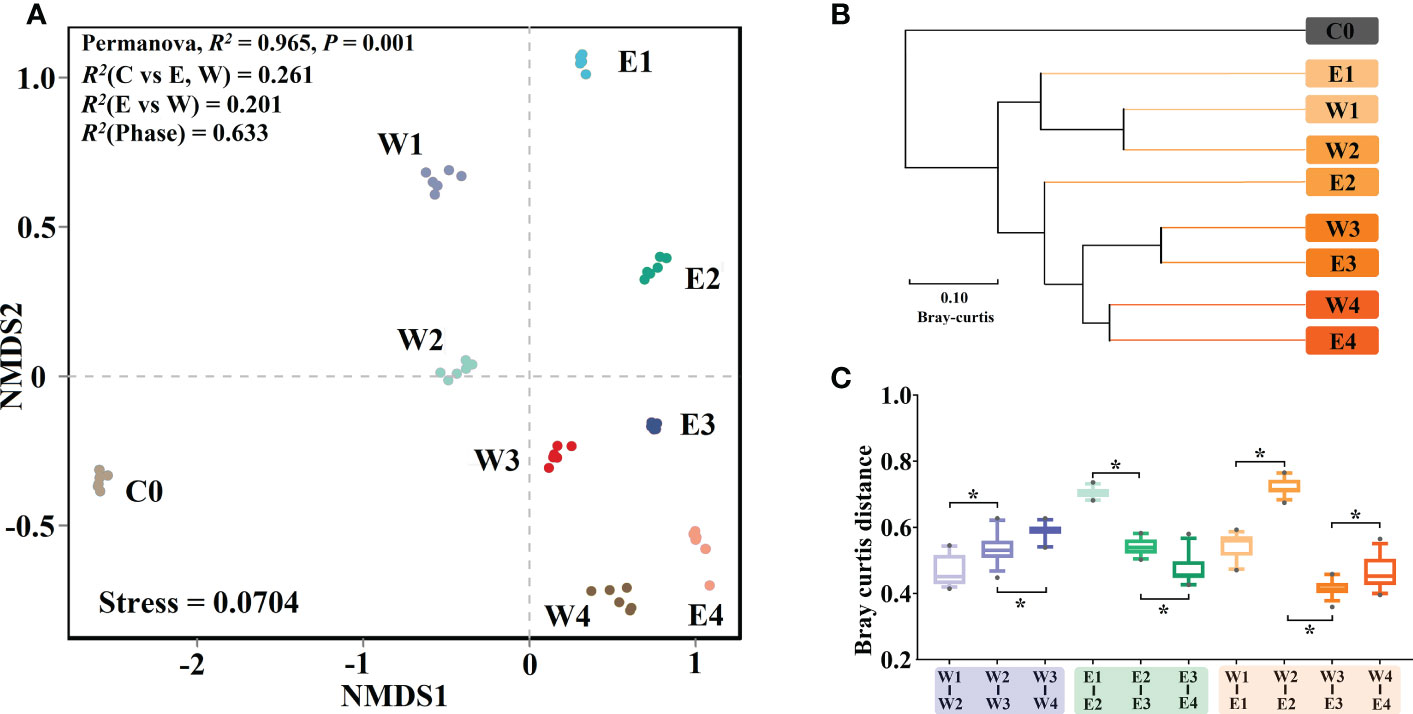
Figure 5 Variation in bacterial community structure. (A) The NMDS analysis. (B) The UPGMA analysis. (C) Bray–Curtis distances of pairwise bacterial communities. E and W refer to epiphytic and phycospheric seawater bacterial sample groups, respectively. The numbers 1 to 4 refer to P1 to P4 phases, respectively. C0 refers to the control seawater bacterial sample groups. The asterisks indicate statistical significance (Student t text, P < 0.05). The error bars represent the standard deviations.
The Bray–Curtis distances between the sample groups are showed in Figure 5C. Larger Bray–Curtis distances mean larger variations in the community structure between the two sample groups. The Bray–Curtis distances between the samples of the different phases revealed that with the green tide development, the degree of bacterial community structural variation significantly increased in the phycospheric seawater bacteria and significantly decreased in the epiphytic bacteria (Student’s t test, P < 0.001). The Bray-Curtis distances between the epiphytic and phycospheric seawater bacterial samples in same phase showed that the structural difference between these two bacterial communities increased in the early phases, and the biggest difference occurred in the maintenance phase. During the late phases, the structural difference between the epiphytic bacterial and phycospheric seawater bacterial communities became significantly smaller (Student’s t test, P < 0.001).
Identified significant bacterial biomarkers
The linear discriminant analysis effect size (LEfSe) algorithm was used to search for bacterial biomarkers that could explain the greatest differences across the different groups. LEfSe scores could be interpreted as the degree of consistent difference in relative abundance of the analyzed bacteria communities across all sample groups. The histogram thus identifies which taxa among all those detected as statistically and biologically differentially abundant could explain the greatest differences across the nine groups. After pooling respective biomarkers from the nine sample groups, 33 biomarkers at the family level were identified, mainly including Desulfomicrobiaceae, Rhodobacteraceae, Flavobacteriaceae, Pseudomonadaceae, Arcobacteraceae, Nitrincolaceae, Prolixibacteraceae, Bacteroidaceae, Alteromonadaceae, and Vibrionaceae (LDA score > 4, P < 0.05; Figure 6, S5). We identified 40 genera as biomarkers of phycospheric bacteria, which were more abundant in the phycosphere and could differentiate phycospheric bacterial samples from the control seawater bacterial samples (LDA score > 3, P < 0.05; Figure S6A). Among them, 33 biomarker genera were more abundant on the algal surface and could also be used to differentiate epiphytic bacterial samples from phycospheric seawater bacterial samples, mainly including Lutibacter, Maribacter, Desulfobulbus, Spirochaeta, Desulfomicrobium, Pseudomonas, and Alteromonas. The other seven biomarker genera were more abundant in the phycospheric seawater, mainly including Marinobacterium, TM7a, Izimaplasma, and Bacteroides (Figure S6A).
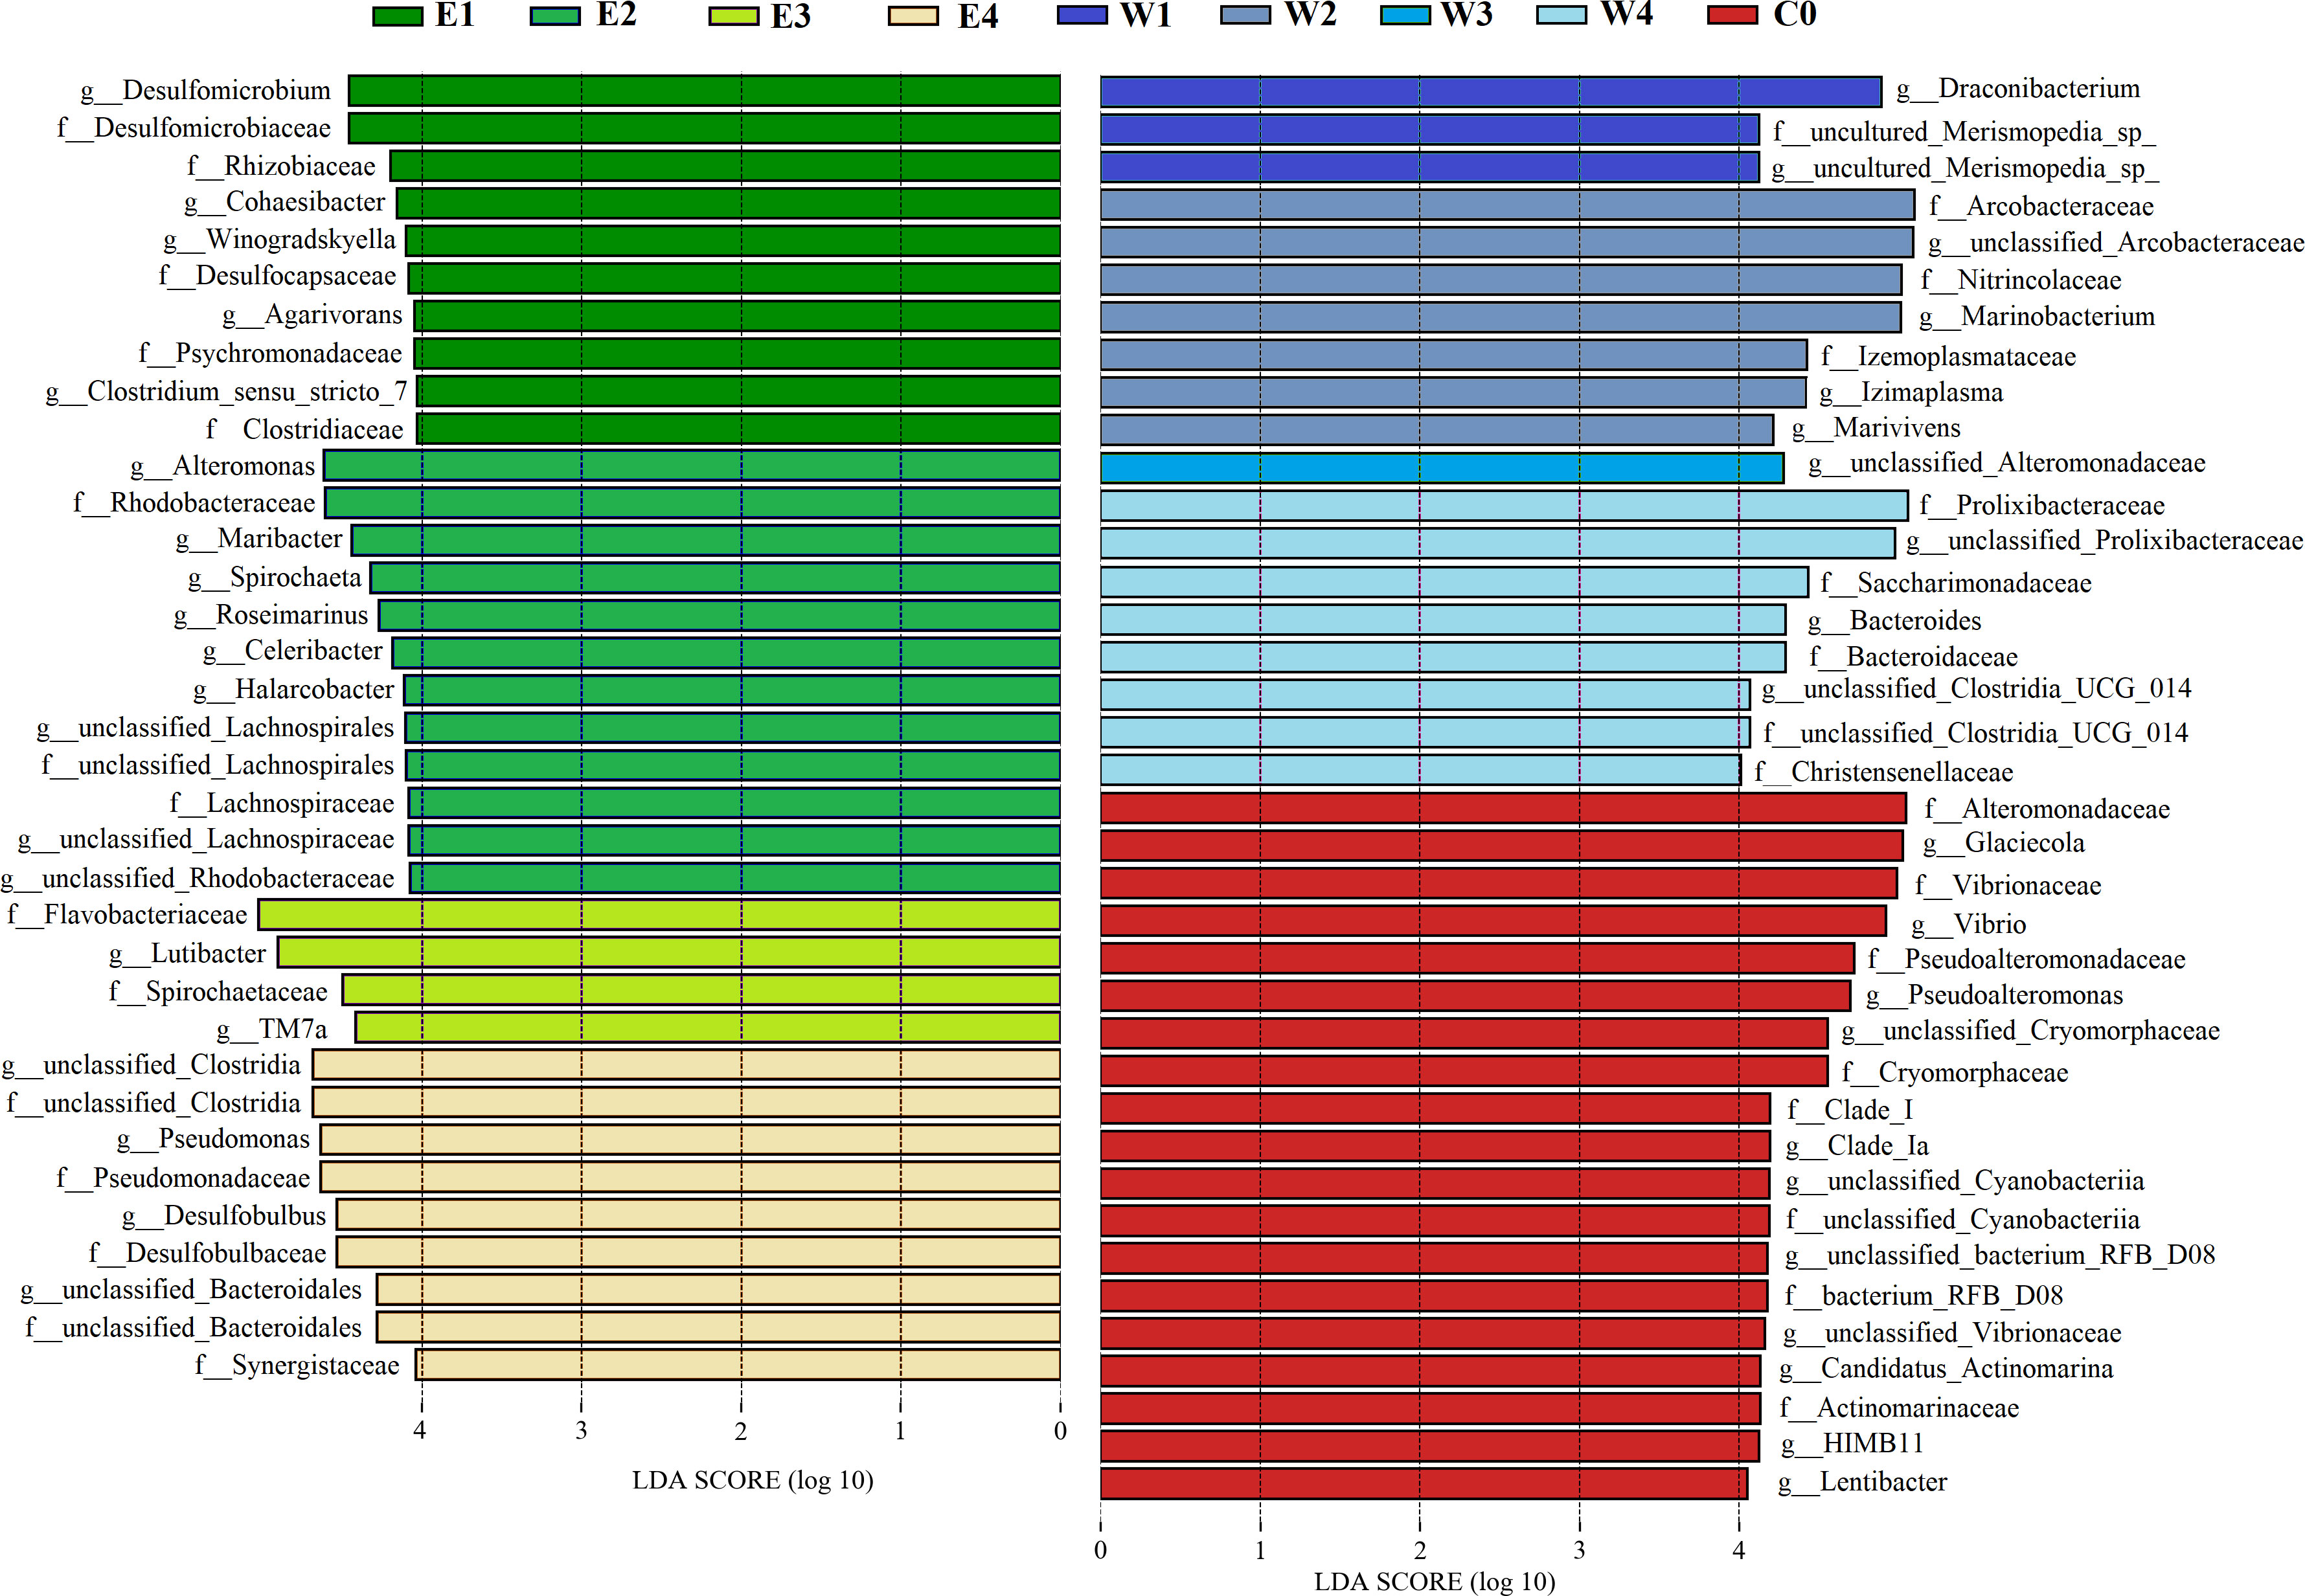
Figure 6 Histogram of the LDA scores computed for differentially abundant taxa on family and genus levels across all sample groups. E and W refer to the epiphytic and phycospheric seawater bacterial sample groups, respectively. The numbers 1 to 4 refer to the P1 to P4 phases, respectively. C0 refers to the control seawater bacterial sample groups.
We further identified the bacterial biomarkers to differentiate phycospheric bacterial samples from different phases. For the epiphytic bacterial samples, 28 biomarker genera were more abundant in the early phases and could differentiate the epiphytic bacterial samples in the early phases from those in the late phases, mainly including Vibrio, Alteromonas, and Desulfomicrobium (LDA score > 3, P < 0.05; Figure S6B). The 13 biomarker genera were more abundant in the epiphytic bacterial samples during the late phases, mainly including Pseudomonas, Desulfobulbus, TM7a, Flavobacterium, and Desulfovibrio (LDA score > 3, P < 0.05; Figure S6B). For the phycospheric seawater bacterial samples, 14 biomarker genera were more abundant in the early phases and could differentiate the phycospheric seawater bacterial samples in the early phases from those in the late phases, mainly including Marinobacterium, Glaciecola, Marivivens, and Desulfomicrobium (LDA score > 3, P < 0.05; Figure S6C). The 17 biomarker genera were more abundant in the phycospheric seawater bacterial samples during the late phases, mainly including TM7a, Maribacter, Bacteroides, Halarcobacter, and Desulfobulbus (LDA score > 3, P < 0.05; Figure S6C).
Prediction of phycospheric bacterial functional potential
To better understand the role of the bacterial taxa present in the phycosphere, FAPROTAX was employed to reveal the variation in the abundance of taxa with functional potentials, and a total of 45 functional taxa were identified. The major functional taxa (with relative abundance above 1.00%) accounted for more than 95% of the total abundance, including taxa with functional potential of sulfate respiration, sulfite respiration, sulfur compounds respiration, fermentation, aerobic chemoheterotrophy, nitrate reduction, cyanobacteria, oxygenic photoautotrophy, photoautotrophy, phototrophy, and chemoheterotrophy (Figure 7A). The taxa with functional potentials of chemoheterotrophy and aerobic chemoheterotrophy had the highest abundance both in the phycosphere and the control seawater.
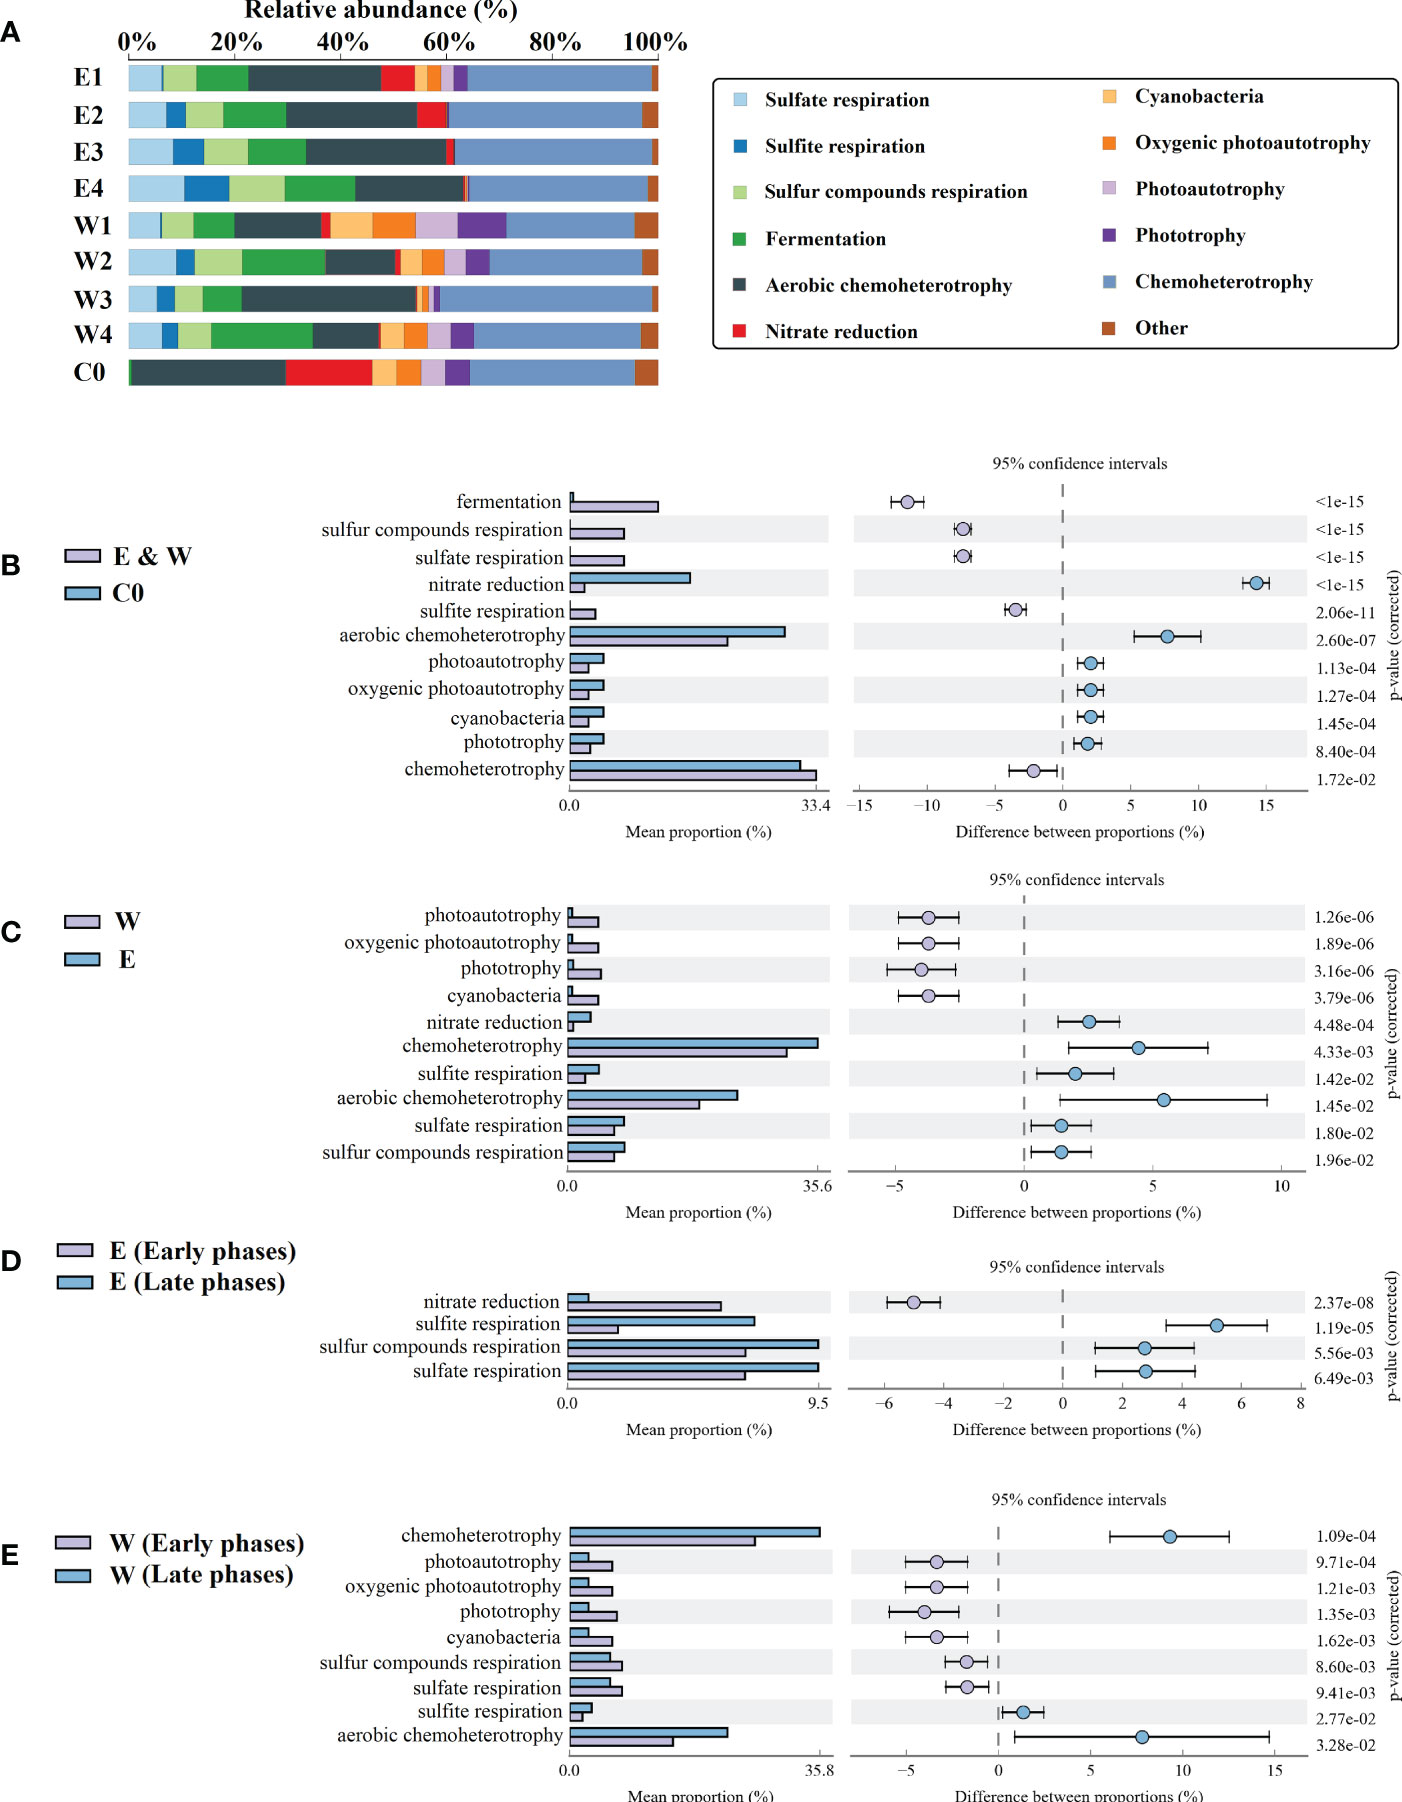
Figure 7 The potential functional taxa in sample groups. (A) The potential functional taxa with relative abundance above 1.00%. (B–E) The potential functional taxa with significant differences in abundance between different sample groups. E and W refer to the epiphytic and phycospheric seawater bacterial sample groups, respectively. The numbers 1 to 4 refer to the P1 to P4 phases, respectively. C0 refers to the control seawater bacterial sample groups. Others: sum of functional taxa with a relative abundance below 1%.
Compared with the control seawater, the abundance of taxa with functional potentials including fermentation and sulfur metabolism (respiration of sulfate, sulfite, and sulfur compounds) was significantly higher in the phycosphere (Student’s t test, P < 0.05) (Figure 7B). By contrast, the abundance of taxa with functional potentials of nitrate reduction and photoautotrophy were significantly higher in the control seawater (Student’s t test, P < 0.05) (Figure 7B). In the phycosphere, the taxa with functional potentials, including chemoheterotrophy, sulfur metabolism, and nitrate reduction were more abundant in epiphytic bacterial samples, and taxa with the potential function of photoautotrophy were more abundant in the phycospheric seawater bacterial samples (Student’s t test, P < 0.05) (Figure 7C).
In the epiphytic bacterial community, the potential nitrate reduction taxa were significantly enriched in the early phases, and sulfur metabolism associated taxa were significantly enriched in the late phases (Student’s t test, P < 0.05) (Figure 7D). In the phycospheric seawater bacterial community, the taxa with functional potentials including photoautotrophic and sulfate and sulfur compounds respiration were more abundant in the early phases, and taxa with functional potentials including chemoheterotrophic and sulfite respiration were more abundant in the late stage (Student’s t test, P < 0.05) (Figure 7E).
Discussion
Previous studies have suggested that the phycosphere has rich microbial communities, diverse material compositions, and variable ecological functions (Seymour et al., 2017). Phycospheric microbial communities are closely related to phytoplankton bloom and have the potential to influence biogeochemical cycles (Zhou et al., 2018; Cirri and Pohnert, 2019; Han et al., 2021). However, much less is known about the structural and functional succession patterns of phycospheric microbial communities during the natural dynamic process of macroalgal bloom. In this study, we investigated the phycospheric bacterial community during the world’s largest green tide bloom in the coastal water of Tuandao Bay, Qingdao, China. Numerous floating U. prolifera accumulate and decay naturally every summer in this area (Qu et al., 2020). Our analyses focused on documenting the evolution of the composition, structure and function of phycospheric microbial communities comprising epiphytic bacteria and phycospheric seawater bacteria during the green tide bloom to provide insights into the mechanisms underlying macroalgal phycospheric microbial dynamics.
Organic nutrition preference and environmental pressure adaption drove differentiation among phycospheric and control seawater bacterial communities
Algae fundamentally change the chemical environment of the phycosphere (e.g., the level of oxygen and the pH, in their vicinity) (Cirri and Pohnert, 2019). They also release large amounts of organic compounds, some of which can be detected and metabolized by bacteria (Ashraf et al., 2022; Raina et al., 2022). Bacteria exhibit chemotaxis to a range of algal exudates, which may likewise enable them to colonize the phycosphere (Smriga et al., 2016; Raina et al., 2022). In this study, we revealed that the composition, structure, and function of bacterial communities in the U. prolifera phycosphere were significantly different compared to that in control seawater.
There were a few common taxa existed both in the phycosphere of the U. prolifera and the control seawater (Figures 3B, C), mostly at the phylum level, including Proteobacteria and Bacteroidota (Figure 4A). The families Rhodobacteraceae and Alteromonadaceae within Proteobacteria dominate in microorganisms that are commonly found in studies on the marine ecosystem, and reveal that members of this bacterial phyla have a wide physiological and functional diversity as well as ecological adaptations (Moran, 2015). The families Prolixibacteraceae and Flavobacteriaceae within Bacteroidota were more abundant in the phycosphere rather than in the control seawater (Figure 4B). Due to the strong nutrient demand for organic matter, the significant convergence to nutrient hot spots, and the ability to efficiently degrade complex organic matter, Bacteroidota are commonly enriched in habitats with high organic nutrients (Wu et al., 2019; Qu et al., 2020; Chen et al., 2020). The growth and death processes of U. prolifera release a large amount of algal-derived organic matter, and a large amount of algal detritus over a short time is also an important source of dissolved organic matter (DOM) in coastal areas (Zhang and Wang, 2017; Zhang et al., 2019b). The release of DOM from U. prolifera provides not only major sources of organic C and N, but also important food sources to microbial communities in coastal waters (Zhang and Wang, 2017; Liang et al., 2021) which may lead to the higher richness and diversity of the bacterial community in phycosphere compared to control seawater (Chen et al., 2020; Hou et al., 2022) (Figure 3A). The results of functional prediction confirmed that the abundance of taxa with the functional potential of fermentation and chemoheterotrophy was significantly higher in the phycosphere than in the control seawater (Figure 7B). The major biomarker genera to differentiate bacteria in the phycosphere from those in control seawater including the organic matter decomposers that specialize in degrading complex biological macromolecules and algal debris such as Lutibacter, Maribacter, Spirochaeta, Glaciecola, and TM7a (Califano et al., 2020; Qu et al., 2021; Kublik et al., 2022) (Figure S6A). The results above suggest that biodegradability and organic nutrition preference may be the main reasons for the enrichment of related taxa in the phycosphere.
In addition to organic overload, green tide bloom will also lead to changes in light conditions, pH value, and dissolved oxygen in the affected sea areas (Zhao et al., 2016; Hou et al., 2022). The shading of light by a large number of floating macroalgae will affect the growth of photoautotrophs, including the phytoplankton and photoautotrophic bacterial communities (Zhao et al., 2018). The results of functional prediction confirmed that the abundance of taxa with functional potential of oxygenic photoautotrophy, photoautotrophy, and phototrophy in the phycosphere was significantly lower than that in control seawater (Figure 7B). Our previous situ studies revealed that floating U. prolifera mat metabolism led to more changes in diel pH and CO2 in affected seawaters covered by algal mat than that in unaffected areas (Hou et al., 2022). The decomposition of massive U. prolifera fronds consumes a large amount of oxygen, resulting in low oxygen or even hypoxic conditions in the coastal waters (Zhang et al., 2019b). Firmicutes (most are Clostridia) were enriched in the phycosphere during all bloom phases and abundance of Firmicutes was significantly higher than that in the control seawater (Figure 4). Studies on of Firmicutes have suggested that except for organic nutrition preference, these taxa are exceptionally well equipped to resist the effects of multiple stress parameters (i.e., drought and anoxia), and may possess high-efficiency energy-generation systems (Seong et al., 2018; Wu et al., 2019). Moreover, the biomarkers of phycospheric bacteria such as Desulfobulbus and Desulfomicrobium are all strict anaerobic sulfate-reducing bacteria (SRB) (Tian et al., 2017) and enriched in the phycosphere (Figures S4A, S6A). Thus, except for the organic nutrition preference, adaptation to environmental stress may contribute to the competitive advantage gained by associated taxa in the phycospheric bacterial community.
Organic substrate gradients and biofilm formation properties further drove differentiation among epiphytic and phycospheric seawater bacterial communities
Few studies have investigated differences in microbial diversity and composition between epiphytic bacteria and planktonic bacteria in the macroalgal phycosphere. The size of the phycosphere is usually defined in terms of the range of gradients of the algal-derived organic substrate surrounding the algal cell and strongly determined by the size, number, and metabolic activity of the algal cell, as well as organic substrate characteristics (Smriga et al., 2016; Seymour et al., 2017). High organic substrate produced by the algae is key to attracting bacteria to migrate rapidly and enter the phycosphere (Raina et al., 2022), and the concentration gradient from high (on algal surface) to low (in phycospheric seawater) of organic substrate may lead to a different spatial distribution of related functional taxa within the phycosphere (Kim et al., 2022). In this study, significant differentiation in composition and function among epiphytic and phycospheric seawater bacterial communities were found. The results reveal that taxa with organic nutrition preference, such as members of the families Flavobacteriaceae, Spirochaetaceae, and Desulfobulbaceae (Figure 4B) as well as the taxa with the functional potentials of sulfur metabolism, chemoheterotrophy, and nitrate reduction were more enriched on the algal surface than in the phycospheric seawater (Figure 7C). Approximately 83% (33/44) biomarker genera used to differentiate the phycosphere from the control seawater could also be used to differentiate the epiphytic bacteria from the phycospheric seawater bacteria, most of them exhibit organic nutritional preferences and are more enriched on the algal surface (Figure S4A). This suggests that the algal surface provided more nutrient resources for the epiphytic bacteria compared to planktonic bacteria living in the phycospheric seawater.
That surface-attached bacteria represent a distinct form of life compared with planktonic bacteria (Egan et al., 2013). Epiphytic bacteria usually adhere to the surface of algae in the form of biofilm to enable both resistance to environmental stress and promote complex organic substrate metabolism (Lee et al., 2014). In this study, Alteromonas, Pseudomonas, and Vibrio were observed to be more abundant on the surface of U. prolifera rather than in the phycospheric seawater (Figure S4A), and also served as biomarkers to differentiate between epiphytic and phycospheric seawater bacteria (Figure S6A). Because of the biofilm-forming properties of these taxa, they can easily colonize algal surfaces and provide a sticky substrate for colonization by other bacteria (Holmström and Kjelleberg, 1999; Zhou et al., 2018; Liang et al., 2021). Moreover, Alteromonas–Pseudomonas–Vibrio group (APV group) is frequently characterized as r-strategists, colonizing quickly and promoting the growth of more specialized taxa, which could help them gain an early advantage in seizing the limited ecological niches on the surface of the algae (Weinbauer et al., 2006; Han et al., 2021). The APV group are commonly found on the surface of phytoplankton and macroalgae and was closely associated with algal bloom events (Egan et al., 2013; Zhou et al., 2018; Mei et al., 2019; Qu et al., 2021). Thus, the advantage of opportunistic selection is the key for these taxa to rapidly reach the algal surface along the organic substrate gradients, and the biofilm-forming properties determine whether they can colonize on algal surface.
Changes in the composition and concentration of organic matter drove the structural and functional succession of phycospheric bacterial communities
Community succession of algal-associated and environmental bacteria with the development of algal blooms is frequently reported, and it has been suggested that each phase of the algal bloom events has different ecological effects, depending on the physiological state and population size of the algae (Smetacek and Zingone, 2013; Zhang et al., 2020). The results indicate that the phase was the largest source of variation in the phycospheric bacterial community structure (Figure 5A) and significant successions in community diversity, structure, and function occurred in both epiphytic and phycospheric seawater bacteria with the green tide bloom (Figures 5C, 7). The increased bacterial community richness and diversity on both algal surface and phycospheric seawater during early phases (Figure 3A) could be related to the continuous and stable organic nutrients provided by the healthy U. prolifera (Zhang and Wang, 2017; Liang et al., 2021). With the decaying of U. prolifera and decomposition by microorganisms, the rapid decrease in population size of the floating algae during the late phases (Figure 2A). The decline of habitat could weaken the nutritional support for the growth of epiphytic bacteria population, leading to a consequent decrease in the richness and diversity of the epiphytic bacterial community (Figure 3A). By contrast, more algal detritus (nutrient hotspots) may enter the phycospheric seawater, ensuring the nutrient supply of phycospheric seawater bacteria and contributing to the increase in its diversity and promoting community structural variation (Figures 3A, 5C). The results of bacterial community structure analysis revealed a more similar structure of epiphytic and phycospheric seawater bacterial communities at the late phases (Figures 5A, C) which implies an increased homogenization between the two microhabitats.
The organic matter released by algae is strongly favored by bacteria, and its characteristics are influenced by the algal growth state (Moran, 2015; Raina et al., 2022). Studies have revealed that the organic matter secreted by U. prolifera at different growth stages is significantly different (Azam and Malfatti, 2007; Amin et al., 2012). The labile and low molecular weight organic matter including small peptides, oligopeptides, oligosaccharides, oligonucleotides, and vitamins are leached by healthy U. prolifera (Aguilera-Morales et al., 2005; Buchan et al., 2014), while refractory and large molecular weight organic matters such as polysaccharides, humic substances, peptides, and proteins are more leached by decaying U. prolifera (Buchan et al., 2014; Zhong et al., 2020). The simulation experiment proved that the consumption of labile dissolved organic carbon (DOC) released by U. prolifera by bacteria was rapid and could be completed within one month, while the degradation of semi labile or semi-refractory DOC occurred within half a year or more (Chen et al., 2020). In our study, the opportunistic populations, such as members of APV groups were more abundant in the phycosphere during the early phases (Figure S6B, C), which may be due to the higher bioavailability of algal-derived metabolites released by healthy algae. Members of the TM7 cluster and CFB group (Cytophaga-Flavobacter-Bacteroides) with ability to efficiently degrade complex carbon sources (Qu et al., 2020; Kublik et al., 2022) were significantly highly abundant in the phycosphere during the late phases (Figures S6B, C), which may be related to the increase in the release of macromolecular algal-derived metabolites (i.e., polysaccharides and proteins) due to the aging and cell lysis of U. prolifera.
Throughout the investigation, potential sulfate, sulfite, and sulfur compound respiration taxa were the most dominant functional populations in the phycosphere (Figure 7A). Studies have indicated that U. prolifera contains a large number of sulfated polysaccharides and it is the responsible alga for releasing dimethylsulfide, which plays an important role in biogenic sulfur transfer, sulfate absorption, and sulfur cycles in seawater (Steinke and Kirst, 1996; Zhong et al., 2020; Li et al., 2022). The large amount of biogenic sulfur released by U. prolifera through its metabolism and decomposition could provide an abundant substrate for taxa associated with sulfur cycles such as SRB. Previous study found that sedimentation and decomposition of U. prolifera resulted in a significant increase in SRB abundance in the surface sediments (Qu et al., 2020). Driven by the sulfur metabolic taxa, U. prolifera-derived biogenic sulfur could be mineralized as sulfate and further reduced by SRB under anoxic conditions to produce toxic H2S, which could cause serious harm to other aquatic organisms as well as the environment (Tian et al., 2017; Raven et al., 2021). Taxa with functional potential of nitrate respiration were more abundant on algal surface during early phases (Figure 7D), which may compete with U. prolifera for nitrate and produce gaseous N2O and N2, resulting in a loss of nitrogen (Kuypers et al., 2018). In summary, the variable functional taxa enriched in the phycosphere may have profound effects on the biogeochemical cycling of carbon, sulfur, and nitrogen in the coastal ecosystem.
Conclusion
This study revealed the diverse composition and variable ecological functions of the macroalgal phycospheric bacterial community during the natural dynamic process of the world’s largest green tide bloom. We demonstrated that phycospheric bacteria exhibited complex dynamics, which comprised the succession of distinct populations exhibiting distinct functional profiles with the green tide development. Furthermore, we hypothesize that the differences in populations and functional profiles may be driven by the spatiotemporal heterogeneity in the distribution of biogenic elements (i.e., U. prolifera-derived organic matter and oxygen) among the different habitats and phases, and the variability in phycospheric functional taxa and its intricate interactions with U. prolifera may have profound effects on biogeochemical cycling in the coastal ecosystem. Future research using integrated approaches, such as in situ isolation experiments, metabolomics, and metagenomics, will continue to improve our understanding of the interactions between the phycospheric microorganisms and macroalgae during macroalgal bloom events.
Data availability statement
The datasets presented in this study can be found in online repositories. The names of the repository/repositories and accession number(s) can be found below: BioProject, PRJNA900698.
Author contributions
YW, XT, and TQ conceived and designed the study. TQ, CH, CG, YZ, ZL, JX, and YX carried out the sample collection and experiments. TQ, XZ, and JC performed the data analysis and figure drawing. TQ, CH, and CG provided critical biological interpretations of the data. TQ wrote the manuscript. XT and YW supervised this work and edited on the manuscript. All authors contributed to the article and approved the submitted version.
Funding
This study was financially supported by the National Natural Science Foundation of China (No. 42176204; 42106201; 42176154; 42206117); the NSFC-Shandong Joint Fund (No. U1806213), and the China Postdoctoral Science Foundation (No. 2021M693019).
Acknowledgments
We would like to thank members of the Marine ecology laboratory groups for assistance in data contributions, insights, and logistical support.
Conflict of interest
The authors declare that the research was conducted in the absence of any commercial or financial relationships that could be construed as a potential conflict of interest.
Publisher’s note
All claims expressed in this article are solely those of the authors and do not necessarily represent those of their affiliated organizations, or those of the publisher, the editors and the reviewers. Any product that may be evaluated in this article, or claim that may be made by its manufacturer, is not guaranteed or endorsed by the publisher.
Supplementary material
The Supplementary Material for this article can be found online at: https://www.frontiersin.org/articles/10.3389/fmars.2022.1101378/full#supplementary-material
Supplementary Figure 1 | Schematic diagram of sampling design. (A) The floating algae in the center of the algal mats are dense and the thickness of the floating algal mats’ center can be up to 50 cm. (B) Phycospheric samples including floating algae and phycospheric seawater were collected from 0–20 cm depth in the center of the algal mats, the control seawater samples were collected in the seawater without the floating algae cover. (C) The floating algae and interstitial seawater (average distance from the thalli less than 5 mm) were collected simultaneously, and the interstitial seawater was considered the phycospheric seawater. (D) Algal samples were used for the measurement of algal physiological characteristics and the collection of epiphytic bacteria. Phycospheric seawater and control seawater samples were used for the collection of phycospheric seawater bacteria and control seawater bacteria, respectively.
Supplementary Figure 2 | Rarefaction curves and Shannon curves. The curve tends to be flat indicated that the sequencing data is large enough and the species variety does not increase with the amount of sequencing. E, W, and C refer to the epiphytic bacterial, phycospheric seawater bacterial, and control seawater bacterial sample groups, respectively. The numbers 1 to 4 refer to the P1 to P4 phases, respectively. C0 refers to the control seawater bacterial sample groups.
Supplementary Figure 3 | Venn analyses shows the number of common and unique ASVs among sample groups during the development phase (A), maintenance phase (B), decline phase (C), and extinction phase (D). Circles in the figure represents sample groups, and the number of overlaps represents the number of ASVs shared between the samples. The numbers without overlap represent the number of unique ASVs in the sample. E and W refer to the epiphytic and phycospheric seawater bacterial sample groups, respectively. The numbers 1 to 4 refer to the P1 to P4 phases, respectively. C0 refers to the control seawater bacterial sample groups.
Supplementary Figure 4 | Taxonomic composition of bacterial communities. The histograms show the genera (A) and ASVs (B) with relative abundance above 1.00%. E and W refer to the epiphytic and phycospheric seawater bacterial sample groups, respectively. The numbers 1 to 4 refer to the P1 to P4 phases, respectively. C0 refers to the control seawater bacterial sample groups. Others: sum of taxa with a relative abundance below 1%.
Supplementary Figure 5 | Identification of phycospheric bacterial biomarkers by Linear discriminant analysis effect size (LEfSe) algorithm. The bacteria (highlighted by small circles and by shading) showing different abundance values among nine sample groups. There are six layers from the inside of this plot to the outside, corresponding to six levels of taxonomy (kingdom, phylum, class, order, family, and genus). Each node (small circle) represents a taxon; color nodes represent the bacterial biomarkers of each sample groups with the highest abundance compared with that in the other groups, while yellow nodes indicate the bacteria that are not statistically and biologically differentially abundant among the nine sample groups. The diameter of each circle is proportional to the taxon’ s abundance. This representation, employing the Silva taxonomy, simultaneously highlights high-level trends and specific genera; for example, multiple differentially abundant sibling taxa are consistent with the variation of the parent clade. E and W refer to the epiphytic and phycospheric seawater bacterial sample groups, respectively. The numbers 1 to 4 refer to the P1 to P4 phases, respectively. C0 refers to the control seawater bacterial sample groups.
Supplementary Figure 6 | Identification of phycospheric bacterial biomarkers by Linear discriminant analysis effect size (LEfSe) algorithm. LEfSe scores could be interpreted as the degree of consistent difference in relative abundance of the analyzed bacteria communities across all sample groups. The histogram thus identifies which clades among all those detected as statistically and biologically differentially abundant and could explain the greatest differences across different groups. (A) Biomarkers that could explain the greatest differences across the phycospheric seawater bacteria, epiphytic bacteria, and control seawater bacteria samples. (B) Biomarkers that could explain the greatest differences across the early phases and late phases of the epiphytic bacteria samples. (C) Biomarkers that could explain the greatest differences across the early phases and late phases of the phycospheric seawater bacteria samples.
References
Abdel-Gawad K. M., Hifney A. F., Issa A. A., Gomaa M. (2014). Spatio-temporal, environmental factors, and host identity shape culturable-epibiotic fungi of seaweeds in the red Sea, Egypt. Hydrobiologia 740, 37–49. doi: 10.1007/s10750-014-1935-0
Aguilera-Morales M., Casas-Valdez M., Carrillo-Domínguez S., González-Acosta B., Pérez-Gil F. (2005). Chemical composition and microbiological assays of marine algae enteromorpha spp. as a potential food source. J. Food Compos. Anal. 18, 79–88. doi: 10.1016/j.jfca.2003.12.012
Amin S. A., Parker M. S., Armbrust E. V. (2012). Interactions between diatoms and bacteria. Microbiol. Mol. Biol. Rev. 76, 667–684. doi: 10.1128/MMBR.00007-12
Ashraf N., Ahmad F., Lu Y. (2022). Synergy between microalgae and microbiome in polluted waters. Trends Microbiol., S0966842X22001603. doi: 10.1016/j.tim.2022.06.004
Azam F., Malfatti F. (2007). Microbial structuring of marine ecosystems. Nat. Rev. Microbiol. 5, 782–791. doi: 10.1038/nrmicro1747
Buchan A., LeCleir G. R., Gulvik C. A., González J. M. (2014). Master recyclers: features and functions of bacteria associated with phytoplankton blooms. Nat. Rev. Microbiol. 12, 686–698. doi: 10.1038/nrmicro3326
Burke C., Thomas T., Lewis M., Steinberg P., Kjelleberg S. (2011). Composition, uniqueness and variability of the epiphytic bacterial community of the green alga ulva australis. ISME J. 5, 590–600. doi: 10.1038/ismej.2010.164
Califano G., Kwantes M., Abreu M. H., Costa R., Wichard T. (2020). Cultivating the macroalgal holobiont: Effects of integrated multi-trophic aquaculture on the microbiome of ulva rigida (Chlorophyta). Front. Mar. Sci. 7. doi: 10.3389/fmars.2020.00052
Chen J., Li H., Zhang Z., He C., Shi Q., Jiao N., et al. (2020). DOC dynamics and bacterial community succession during long-term degradation of ulva prolifera and their implications for the legacy effect of green tides on refractory DOC pool in seawater. Water Res. 185, 116268. doi: 10.1016/j.watres.2020.116268
Chen J., Zang Y., Yang Z., Qu T., Sun T., Liang S., et al. (2022). Composition and functional diversity of epiphytic bacterial and fungal communities on marine macrophytes in an intertidal zone. Front. Microbiol. 13. doi: 10.3389/fmicb.2022.839465
Cirri E., Pohnert G. (2019). Algae–bacteria interactions that balance the planktonic microbiome. New Phytol. 223, 100–106. doi: 10.1111/nph.15765
Egan S., Harder T., Burke C., Steinberg P., Kjelleberg S., Thomas T. (2013). The seaweed holobiont: understanding seaweed–bacteria interactions. FEMS Microbiol. Rev. 37, 462–476. doi: 10.1111/1574-6976.12011
Flemming H.-C., Wingender J., Szewzyk U., Steinberg P., Rice S. A., Kjelleberg S. (2016). Biofilms: an emergent form of bacterial life. Nat. Rev. Microbiol. 14, 563–575. doi: 10.1038/nrmicro.2016.94
Flemming H.-C., Wuertz S. (2019). Bacteria and archaea on earth and their abundance in biofilms. Nat. Rev. Microbiol. 17, 247–260. doi: 10.1038/s41579-019-0158-9
Han Y., Jiao N., Zhang Y., Zhang F., He C., Liang X., et al. (2021). Opportunistic bacteria with reduced genomes are effective competitors for organic nitrogen compounds in coastal dinoflagellate blooms. Microbiome 9, 71. doi: 10.1186/s40168-021-01022-z
Holmström C., Kjelleberg S. (1999). Marine pseudoalteromonas species are associated with higher organisms and produce biologically active extracellular agents. FEMS Microbiol. Ecol. 30, 285–293. doi: 10.1016/S0168-6496(99)00063-X
Hou C., Qu T., Zhao X., Xu J., Zhong Y., Guan C., et al. (2022). Diel metabolism of yellow Sea green tide algae alters bacterial community composition under in situ seawater acidification of coastal areas. Sci. Total Environ. 807, 150759. doi: 10.1016/j.scitotenv.2021.150759
Kim H., Kimbrel J. A., Vaiana C. A., Wollard J. R., Mayali X., Buie C. R. (2022). Bacterial response to spatial gradients of algal-derived nutrients in a porous microplate. ISME J. 16, 1036–1045. doi: 10.1038/s41396-021-01147-x
Kublik S., Gschwendtner S., Magritsch T., Radl V., Rillig M. C., Schloter M. (2022). Microplastics in soil induce a new microbial habitat, with consequences for bulk soil microbiomes. Front. Environ. Sci. 10. doi: 10.3389/fenvs.2022.989267
Kuypers M. M. M., Marchant H. K., Kartal B. (2018). The microbial nitrogen-cycling network. Nat. Rev. Microbiol. 16, 263–276. doi: 10.1038/nrmicro.2018.9
Lee K. W. K., Periasamy S., Mukherjee M., Xie C., Kjelleberg S., Rice S. A. (2014). Biofilm development and enhanced stress resistance of a model, mixed-species community biofilm. ISME J. 8, 894–907. doi: 10.1038/ismej.2013.194
Liang J., Liu J., Zhan Y., Zhou S., Xue C.-X., Sun C., et al. (2021). Succession of marine bacteria in response to ulva prolifera-derived dissolved organic matter. Environ. Int. 155, 106687. doi: 10.1016/j.envint.2021.106687
Li J., He Z., Liang Y., Peng T., Hu Z. (2022). Insights into algal polysaccharides: A review of their structure, depolymerases, and metabolic pathways. J. Agric. Food Chem. 70, 1749–1765. doi: 10.1021/acs.jafc.1c05365
Liu W., Jacquiod S., Brejnrod A., Russel J., Burmølle M., Sørensen S. J. (2019). Deciphering links between bacterial interactions and spatial organization in multispecies biofilms. ISME J. 13, 3054–3066. doi: 10.1038/s41396-019-0494-9
Liu X., Zhao J., Jiang P. (2022). Easy removal of epiphytic bacteria on ulva (Ulvophyceae, chlorophyta) by vortex with silica sands. Microorganisms 10, 476. doi: 10.3390/microorganisms10020476
Louca S., Parfrey L. W., Doebeli M. (2016). Decoupling function and taxonomy in the global ocean microbiome. Science 353, 1272–1277. doi: 10.1126/science.aaf4507
Mei X., Wu C., Zhao J., Yan T., Jiang P. (2019). Community structure of bacteria associated with drifting sargassum horneri, the causative species of golden tide in the yellow Sea. Front. Microbiol. 10. doi: 10.3389/fmicb.2019.01192
Moran M. A. (2015). The global ocean microbiome. Science 350, aac8455–aac8455. doi: 10.1126/science.aac8455
Paix B., Layglon N., Le Poupon C., D’Onofrio S., Misson B., Garnier C., et al. (2021). Integration of spatio-temporal variations of surface metabolomes and epibacterial communities highlights the importance of copper stress as a major factor shaping host-microbiota interactions within a Mediterranean seaweed holobiont. Microbiome 9, 201. doi: 10.1186/s40168-021-01124-8
Qu T., Hou C., Zhao X., Zhong Y., Guan C., Lin Z., et al. (2021). Bacteria associated with ulva prolifera: A vital role in green tide formation and migration. Harmful Algae 108, 102104. doi: 10.1016/j.hal.2021.102104
Qu T., Zhao X., Hao Y., Zhong Y., Guan C., Hou C., et al. (2020). Ecological effects of ulva prolifera green tide on bacterial community structure in qingdao offshore environment. Chemosphere 244, 125477. doi: 10.1016/j.chemosphere.2019.125477
Raina J.-B., Lambert B. S., Parks D. H., Rinke C., Siboni N., Bramucci A., et al. (2022). Chemotaxis shapes the microscale organization of the ocean’s microbiome. Nature 605, 132–138. doi: 10.1038/s41586-022-04614-3
Raven M. R., Keil R. G., Webb S. M. (2021). Microbial sulfate reduction and organic sulfur formation in sinking marine particles. Science 371, 178–181. doi: 10.1126/science.abc6035
Seong C. N., Kang J. W., Lee J. H., Seo S. Y., Woo J. J., Park C., et al. (2018). Taxonomic hierarchy of the phylum firmicutes and novel firmicutes species originated from various environments in Korea. J. Microbiol. 56, 1–10. doi: 10.1007/s12275-018-7318-x
Seymour J. R., Amin S. A., Raina J.-B., Stocker R. (2017). Zooming in on the phycosphere: the ecological interface for phytoplankton–bacteria relationships. Nat. Microbiol. 2, 17065. doi: 10.1038/nmicrobiol.2017.65
Singh R. P., Reddy C. R. K. (2014). Seaweed-microbial interactions: key functions of seaweed-associated bacteria. FEMS Microbiol. Ecol. 88, 213–230. doi: 10.1111/1574-6941.12297
Smetacek V., Zingone A. (2013). Green and golden seaweed tides on the rise. Nature 504, 84–88. doi: 10.1038/nature12860
Smriga S., Fernandez V. I., Mitchell J. G., Stocker R. (2016). Chemotaxis toward phytoplankton drives organic matter partitioning among marine bacteria. Proc. Natl. Acad. Sci. 113, 1576–1581. doi: 10.1073/pnas.1512307113
Steinke M., Kirst G. O. (1996). Enzymatic cleavage of dimethylsulfoniopropionate (DMSP) in cell-free extracts of the marine macroalga enteromorpha clathrata (Roth) grev. (Ulvales, chlorophyta). J. Exp. Mar. Biol. Ecol. 201, 73–85. doi: 10.1016/0022-0981(95)00207-3
Tian H., Gao P., Chen Z., Yanshu Li, Yan Li, Wang Y., et al. (2017). Compositions and abundances of sulfate-reducing and sulfur-oxidizing microorganisms in water-flooded petroleum reservoirs with different temperatures in China. Front. Microbiol. 08. doi: 10.3389/fmicb.2017.00143
Wang Z., Xiao J., Fan S., Li Y., Liu X., Liu D. (2015). Who made the world’s largest green tide in china?-an integrated study on the initiation and early development of the green tide in yellow Sea: Green tide in yellow Sea of China. Limnol. Oceanogr. 60, 1105–1117. doi: 10.1002/lno.10083
Weinbauer M. G., Christen R., Höfle M. G. (2006). The response of vibrio- and rhodobacter-related populations of the NW Mediterranean Sea to additions of dissolved organic matter, phages, or dilution. Microb. Ecol. 51, 336–344. doi: 10.1007/s00248-006-9028-x
Wu L., Ning D., Zhang B., Li Y., Zhang P., Shan X., et al. (2019). Global diversity and biogeography of bacterial communities in wastewater treatment plants. Nat. Microbiol. 4, 1183–1195. doi: 10.1038/s41564-019-0426-5
Zhang W., Ding W., Li Y.-X., Tam C., Bougouffa S., Wang R., et al. (2019a). Marine biofilms constitute a bank of hidden microbial diversity and functional potential. Nat. Commun. 10, 517. doi: 10.1038/s41467-019-08463-z
Zhang Y., He P., Li H., Li G., Liu J., Jiao F., et al. (2019b). Ulva prolifera green-tide outbreaks and their environmental impact in the yellow Sea, China. Natl. Sci. Rev. 6, 825–838. doi: 10.1093/nsr/nwz026
Zhang T., Wang X. (2017). Release and microbial degradation of dissolved organic matter (DOM) from the macroalgae ulva prolifera. Mar. pollut. Bull. 125, 192–198. doi: 10.1016/j.marpolbul.2017.08.029
Zhang H., Wang G., Zhang C., Su R., Shi X., Wang X. (2020). Characterization of the development stages and roles of nutrients and other environmental factors in green tides in the southern yellow Sea, China. Harmful Algae 98, 101893. doi: 10.1016/j.hal.2020.101893
Zhao G., He H., Wang H., Liang Y., Guo C., Shao H., et al. (2022). Variations in marine bacterial and archaeal communities during an ulva prolifera green tide in coastal qingdao areas. Microorganisms 10, 1204. doi: 10.3390/microorganisms10061204
Zhao J., Jiang P., Qiu R., Ma Y., Wu C., Fu H., et al. (2018). The yellow Sea green tide: A risk of macroalgae invasion. Harmful Algae 77, 11–17. doi: 10.1016/j.hal.2018.05.007
Zhao X., Tang X., Zhang H., Qu T., Wang Y. (2016). Photosynthetic adaptation strategy of ulva prolifera floating on the sea surface to environmental changes. Plant Physiol. Biochem. 107, 116–125. doi: 10.1016/j.plaphy.2016.05.036
Zhong R., Wan X., Wang D., Zhao C., Liu D., Gao L., et al. (2020). Polysaccharides from marine enteromorpha: Structure and function. Trends Food Sci. Technol. 99, 11–20. doi: 10.1016/j.tifs.2020.02.030
Zhou M.-J., Liu D.-Y., Anderson D. M., Valiela I. (2015). Introduction to the special issue on green tides in the yellow Sea. Estuar. Coast. Shelf Sci. 163, 3–8. doi: 10.1016/j.ecss.2015.06.023
Keywords: green tide, phycosphere, Ulva prolifera, bacterial community, harmful macroalgal bloom
Citation: Qu T, Hou C, Guan C, Zhao X, Chen J, Zhong Y, Xu J, Lin Z, Xu Y, Tang X and Wang Y (2022) Phycospheric bacterial community structure and function succession during the typical harmful macroalgal blooms. Front. Mar. Sci. 9:1101378. doi: 10.3389/fmars.2022.1101378
Received: 17 November 2022; Accepted: 05 December 2022;
Published: 15 December 2022.
Edited by:
Lisheng He, Institute of Deep-Sea Science and Engineering (CAS), ChinaReviewed by:
Zengling Ma, Wenzhou University, ChinaSun Cuici, South China Sea Institute of Oceanology (CAS), China
Copyright © 2022 Qu, Hou, Guan, Zhao, Chen, Zhong, Xu, Lin, Xu, Tang and Wang. This is an open-access article distributed under the terms of the Creative Commons Attribution License (CC BY). The use, distribution or reproduction in other forums is permitted, provided the original author(s) and the copyright owner(s) are credited and that the original publication in this journal is cited, in accordance with accepted academic practice. No use, distribution or reproduction is permitted which does not comply with these terms.
*Correspondence: Ying Wang, eXdhbmdAb3VjLmVkdS5jbg==; Xuexi Tang, dGFuZ3h4QG91Yy5lZHUuY24=