- 1College of Marine Ecology and Environment, Shanghai Ocean University, Shanghai, China
- 2The Key Laboratory of marine ecological monitoring and restoration technology of the Ministry of natural resources, Shanghai, China
- 3East China Sea Environmental Monitoring Center, State Oceanic Administration, Shanghai, China
- 4School of Oceanography, Shanghai Jiao Tong University, Shanghai, China
Estuarine and coastal area is dynamic zone for both marine carbon and oxygen cycles. There is limited evaluation of the labile and refractory fraction of sedimentary organic carbon and further a lack of attention to the corresponding potential in dissolved oxygen utilization. In this study, we collected sediment samples from the Changjiang estuary and adjacent coastal areas in the East China Sea in June 2019 to reveal the distribution, main controlling factor, and implications of four operational fractions of sediment organic carbon that range from labile to refraction. In the laboratory, we processed and defined the four operational fractions of sedimentary organic carbon, includes 1) pure water extractable carbon (WEC), 2) salt (K2SO4 solution) extractable carbon (SEC), 3) Microbial biomass carbon (MBC; chloroform extractable carbon), and 4) refractory organic carbon (ROC; the acid-processed fraction). We revealed that off the Changjiang Estuary, the bulk sedimentary organic carbon (SOC), WEC, SEC, MBC, and ROC were 9.43 ± 3.07 g/kg, 0.12 ± 0.10 g/kg, 0.16 ± 0.07 g/kg, 1.58 ± 0.45 g/kg, and 4.38 ± 1.95 g/kg, respectively. Sediment grain size played a vital role in constraining the LOC fractions, and samples from aquaculture areas showed extra-higher levels of LOC when compared to samples from the non-aquaculture area. The LOC and MBC fraction showed clear negative relation with dissolved oxygen (DO) in the near bottom waters under high DO background (DO > 5.5 mg/L), whereas in a low DO background (DO < 3-4 mg/L) no clear relation can be found. Based on our observed LOC content and DO concentration in the near bottom waters, the depth of hypoxia in the near bottom waters, which would be caused by a total decomposition of 4 mm of LOC in the top sediment, ranged between 0.3 m to 4.7 m with an average depth of 2 m. This value (2 m) means that sedimentary oxygen consumption would contribute 10% in the occurrence of hypoxia, with the rest contributing from water column respiration. Overall, we used the LOC fraction of sedimentary organic carbon to address the dissolved oxygen consumption in the near bottom waters and further study is needed to evaluate this approach.
1. Introduction
As the ultimate destination of sinking carbon, the form and burial of organic carbon in sediments is an important topic of marine carbon cycle study (Syvitski et al., 2005; Burdige, 2007; Zhao et al., 2018). Further, the labile fraction of sedimentary carbon exerts an impact on near-bottom waters via sediment-water exchange. So sedimentary carbon also plays an important role in marine hypoxia (Boynton et al., 2018). In shallow marine systems like river-effected estuaries and coasts, sedimentary carbon in these sites is particularly important because high terrestrial output enhances its significant role in carbon budget and storage (Ouyang and Lee, 2020; Wang et al., 2021a), and increasing occurrence of estuarine-coastal hypoxia makes it essential to make clear the role of sedimentary oxygen consumption, most of which is attributed by decomposition of the labile carbon fraction in the sediment.
As a labile-refractory continuum, carbon presented in sediment can be divided into several fractions. Such fractions can be quantified via various pretreatment before high-temperature combustion method determination. Carbon form determined by various pretreatment methods is primarily used in soil studies (Dodla et al., 2012; Cao et al., 2016; Wang et al., 2021b) and such an approach has been applied in marine sediment carbon studies in recent years (Liu et al., 2016; Lian et al., 2018). The water extractable carbon (WEC) and salt extractable carbon (SEC), constitute the labile pool of sedimentary carbon and is regarded as labile organic carbon (LOC). The third fraction Microbial biomass C (MBC) is usually represented by chloroform extractable C (Yang et al., 2013). WEC consists mainly of the hydrophilic fraction of carbon, including fulvic and humic acids, which affect the water solubility of sediment organic matter and act as direct reservoirs for microbial metabolism (Sun, 2009; Dodla et al., 2012; Yang et al., 2013). And SEC represents non-structural carbohydrates that are easily degraded by microorganisms and low molecular weight organic acids, which is a direct supply of carbon that sedimentary microorganisms can break down and utilize (Sun, 2009; Dodla et al., 2012). There are differences in WEC and SEC extraction in the soil environment (McGILL et al., 1986; Rochette and Gregorich, 1998). And marine sediments have different habitats and compound properties from the soil. Therefore, there are differences in WEC and SEC extracted from sediments compared to soils. This needs to be studied in more depth. Despite making only a small portion of the total SOC pool, LOC and MBC are the most active component, has a high turnover rate, and are sensitive to environmental changes (Kirwan and Megonigal, 2013; Wang et al., 2021b), and is essential for controlling the number of nutrients that are available to plants and microbes (Dodla et al., 2012; Xiao et al., 2015). Due to its water extractable feature, oxidation of LOC of the sedimentary diffusion boundary layer is expected to play an essential role in dissolved oxygen consumption for the near bottom waters in the marine environment. The fourth fraction, namely carbon that is resistant to acid hydrolysis, is the stablest part (Paul Eldor et al., 2006; Silveira et al., 2008). Despite studies of these four fractions in terrestrial soil habitats (Dodla et al., 2012; Cao et al., 2016; Wang et al., 2021b), the application of such an approach to marine sediments is very rare (Liu et al., 2016; Lian et al., 2018).
Among the biggest rivers, the Changjiang exports a great amount of terrestrial carbon to the ocean, most of which is buried in regions of its river mouth (Wang et al., 2008; Zhu et al., 2011a; Chen et al., 2021). Also, abundant riverine nutrients promote vivid phytoplankton growth in offshore waters, which generates notable marine source carbon in the estuarine and coastal areas (Gong et al., 2011). Bulk SOC measurement and incubations suggest that about one-third of settled particulate organic carbon is finally buried in the sediment (Zhao et al., 2018). The SOC was adsorbed by fine-grained particles and selectively transported southward along the coast, the fresh SOM in the sandy area, as indicated by amino acids, 13C and C/N, was mainly from in situ production (Chen et al., 2021), and the bioavailability of SOC decreased from nearshore to offshore as quantified by amino sugars (Ren et al., 2019).
Also, hypoxia off the Changjiang Estuary in the East China Sea is one of the largest coastal hypoxic zones in the world (Li et al., 2002). Sedimentary oxygen consumption is expected to play a role in the occurrence of hypoxia, as quantified by both 224Ra/228Th disequilibrium method approach (Cai et al., 2014) and sediment-water incubations (Song et al., 2016). More recently, the dynamic shift of sedimentary dissolved oxygen (DO) consumption and water column respiration is revealed via the DO-δ18O approach. In hypoxic conditions, sedimentary oxygen consumption only accounted for 20% of total apparent oxygen utilization (AOU) of the near bottom waters, and in normoxia conditions (DO> 2mg/L), sedimentary oxygen consumption contribution to total AOU of the near bottom waters increased from < 20% to over 80% (Zhou et al., 2021).
Despite the previous investigations for SOC and oxygen budget off the Changjiang Estuary, the labile-refractory fraction of SOC remains unclear in this region. More importantly, the oxygen isotope approach in the hypoxia mechanism study lacks evidence of carbon cycling. Under this background, the scientific question to be addressed in this work is 1) what is the spatial pattern of labile to refractory SOC distribution off the Changjiang Estuary and its primary controlling factors, and 2) how much oxygen would the LOC consume and its implication to oxygen budget in the near-bottom waters. A cruise in June 2019, was conducted to collect the surface sediments off the Changjiang Estuary. We analyzed the four components of SOC and the basic supporting parameters in the laboratory and discussed the potential influences and significance of these four components. At last, the sedimentary oxygen demand, as estimated from the total decomposition of LOC fraction, and its impact on the oxygen budget of the near-bottom waters was addressed.
2. Materials and methods
2.1. Field sampling
In June 2019, surface sediments in the Changjiang Estuary and its adjacent waters were collected via a box corer on the R/V “Su Ru Fishery Raising No. 08327” (Figure 1). The DO of the seawater sample was measured via a CTD profiler (SBE 19plus; Seabird, USA) with a DO meter, which was calibrated before the cruise. All the islands in the sampling area south of 30°57’ is regarded as the Zhoushan archipelago. Several stations (S22-S26) are located in a mussels aquaculture zone (Figure 1). The sampling points in the non-archipelago area are marked as triangular, including S1-7, S10-11, S15-16, and S20-21. The rest sampling sites (solid dots) are grouped within the Zhoushan archipelago area. On board, the surface 0-5cm sediment was collected via grab corer and sediment was immediately kept under -20°C in a freezer till analysis in the lab.
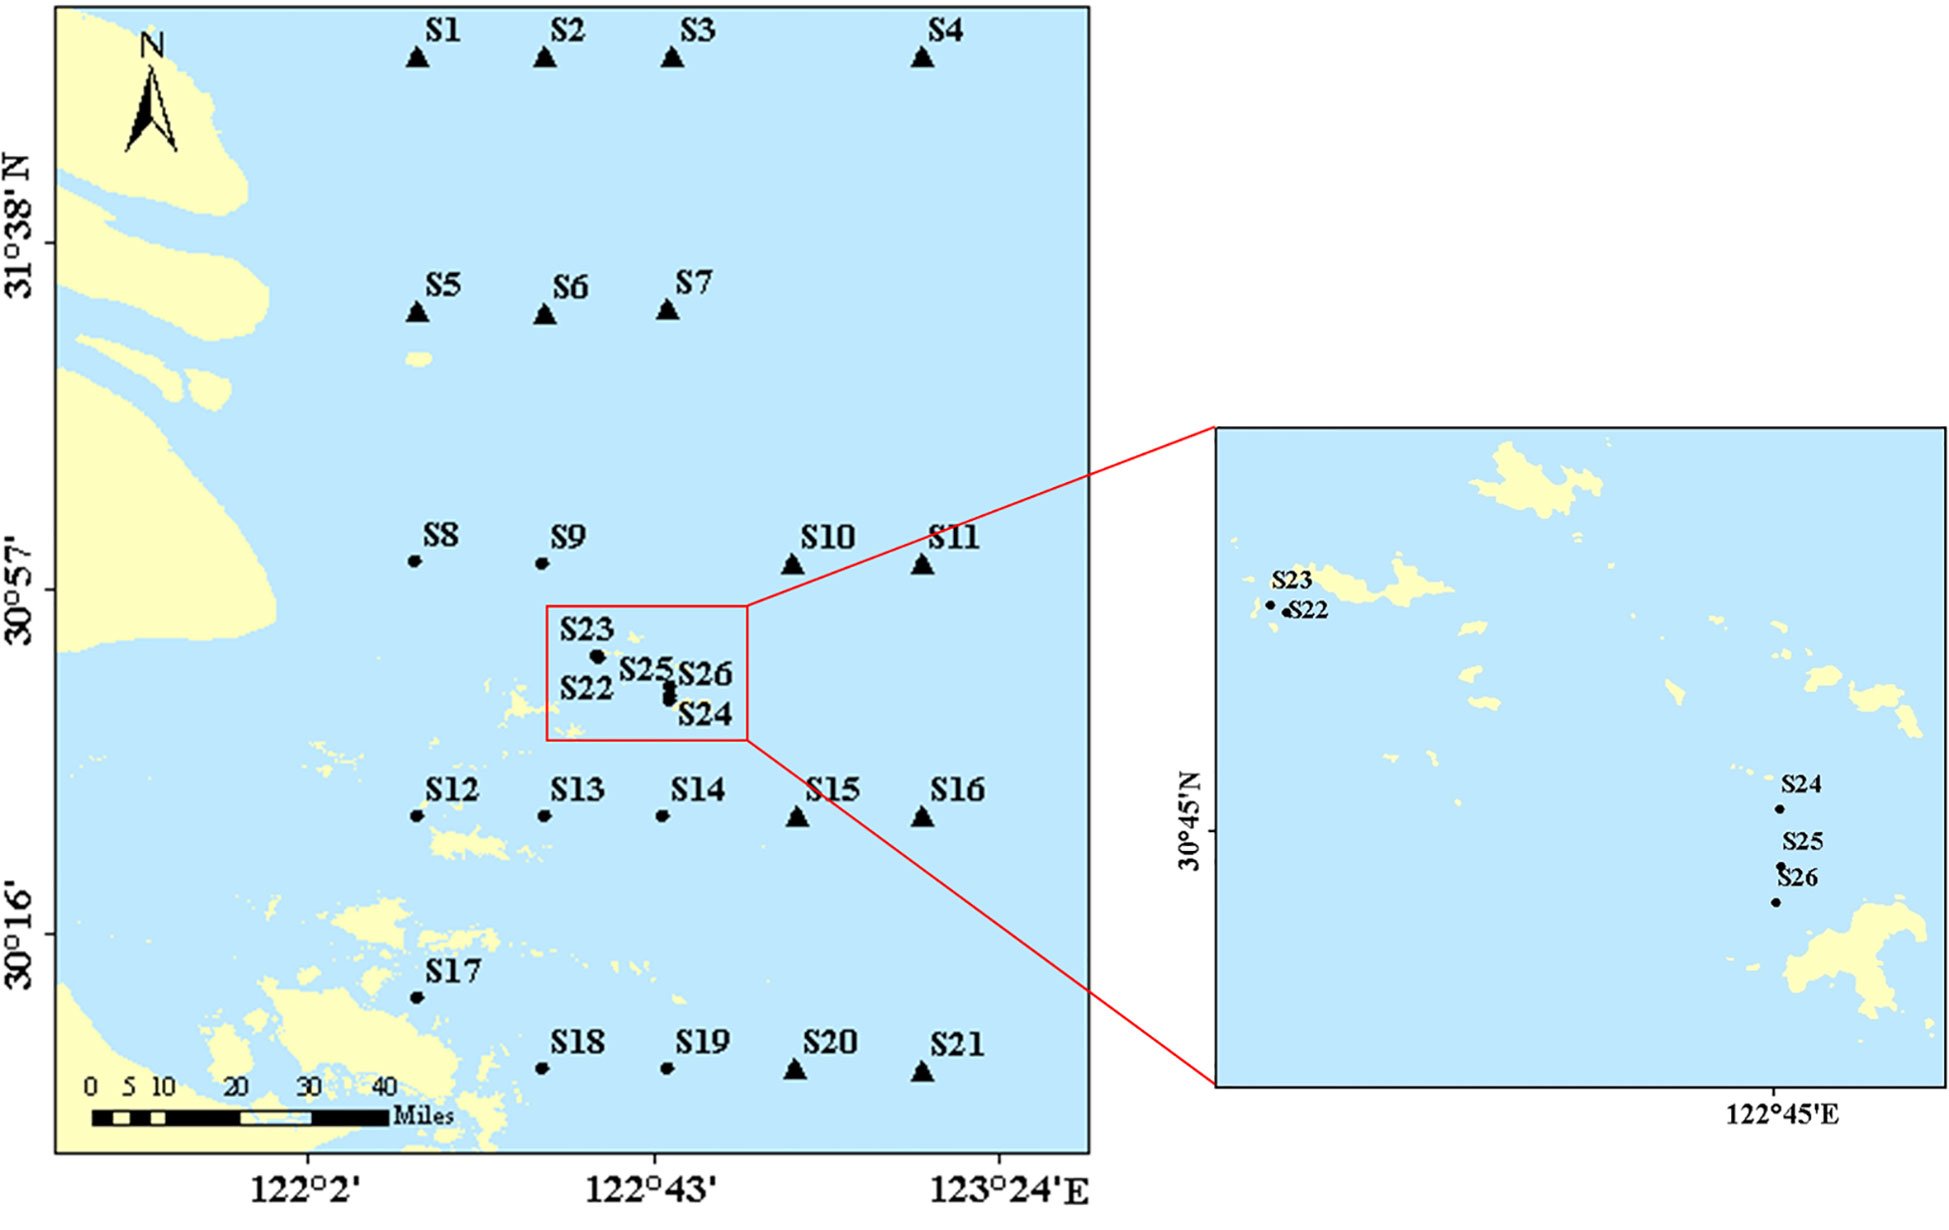
Figure 1 Sampling stations in this work. The small plot on the right indicates the sites with aquaculture impact (mussel aquaculture area).
2.2. Laboratory analyses
Samples were analyzed for the total sediment organic carbon (SOC), four carbon fractions, grain size, and bulk density (BD). SOC was measured using ferrous ammonium sulfate and dichromate oxidation (Kalembasa and Jenkinson, 1973). Frozen sediment samples were used to analyze SOC. The samples were freeze-dried and ground to 0.175 mm (80 mesh). The samples were placed in a glass test tube with a small amount of solid Ag2SO4 and 10.00 mL K2Cr2O7-H2SO4 standard solution, a batch of tubes was placed in a wire cage (with a blank sample in it), and then placed at 185-190°C. The solution and residue were put in the test tube in a 250 mL conical flask, added 2 to 3 drops of o-phenanthroline indicator, and titrated with FeSO4 standard solution until the solution changes from light green to bright green and then to brick red as the endpoint.
As for the four carbon fractions in the SOC, they are LOC (i.e., WEC and SEC), MBC, and ROC in operation. Both WEC and SEC were extracted from a 10 g moist sediment sample and added with 30 mL of deionized water (Singh et al., 1988) and 30 mL of 0.5 M K2SO4 (Coxall et al., 2005; Lian et al., 2018), respectively. WEC and SEC are processed separately with individual subsamples. The mixture was shaken for 30 min and then extracted with deionized water or 0.5 M K2SO4, respectively. The mixture was centrifuged for 10 min and then filtered through a GF/F filter (450°C, 3 h) into pre-combusted at 450°C glass vials for TOC analysis. MBC was determined by the chloroform extraction method (Chen et al., 2006; Yang et al., 2020; Yu et al., 2020). The method involves the addition of chloroform to the untreated moist sediment and mixing in an oscillator. The mixture was left in the dark for 24 h. After chloroform fumigation, the sample was processed in the SEC way (extracted with K2SO4). And the glass bottle containing the fumigation extract was placed in a 100°C water bath, after cooling in the water bath, the organic carbon content in the extract was determined by an analyzer. Non-fumigation controls were extracted directly with 0.5 M K2SO4 solution. MBC was calculated following the formula, MBC = Ec/0.45, where Ec is the OC content difference between the fumigation-treated sediments and untreated ones (Chen et al., 2006). OC of all filtrates was analyzed using a Shimadzu TOC analyzer (TOC-LCPN). ROC was determined following acid hydrolysis (Cheng et al., 2007; Dodla et al., 2012; Lian et al., 2018). Specifically, sediment samples were mixed with 6 mol/L HCl in a 1:10 ratio of precipitate to the solution followed by refluxing for 16 hours. After cooling to room temperature, the samples from each tube were separated by filtering using a glass fiber membrane (GF/F; 450°C, 3h). The residual was then washed with deionized water and oven dried at 80°C. After drying, residual samples were weighed and analyzed for OC by a Vario EL CUBE analyzer.
For grain size measurements, the method described by Liu et al. (2019b) was adopted. Briefly, organic matter and carbonates were first removed by adding 10 mL of H2O2 (10%) and 10 mL of HCl (10%) to the dried sediment (0.2 g). After 2 h the sample was filled with Milli-Q water and soaked overnight. The supernatant was then carefully removed and two drops of 5% sodium hexametaphosphate solution were added under ultrasonication for 10 min. Finally, the well-dispersed samples were measured using a laser particle size analyzer (LS13 320, Beckman Coulter, USA). Three categories are defined as clay (< 4 μm), silt (4–63 μm), and sand (> 63 μm). The BD was calculated as the ratio of the dry weight of the sediment core and the internal volume of the metallic core (Wang et al., 2021b).
2.3. Data analysis
Figures 2–5 was prepared by the Inverse Distance Weight method in interpolation analysis of ArcMap7.0 software. For Figure 6, a linear fit was performed using OriginPro 2021 for data with DO > 5.5 mg/l. Spearman’s correlation analyses were performed to determine the relationships between the measured parameters. All data analyses were performed with IBM SPSS Statistics 25 software.
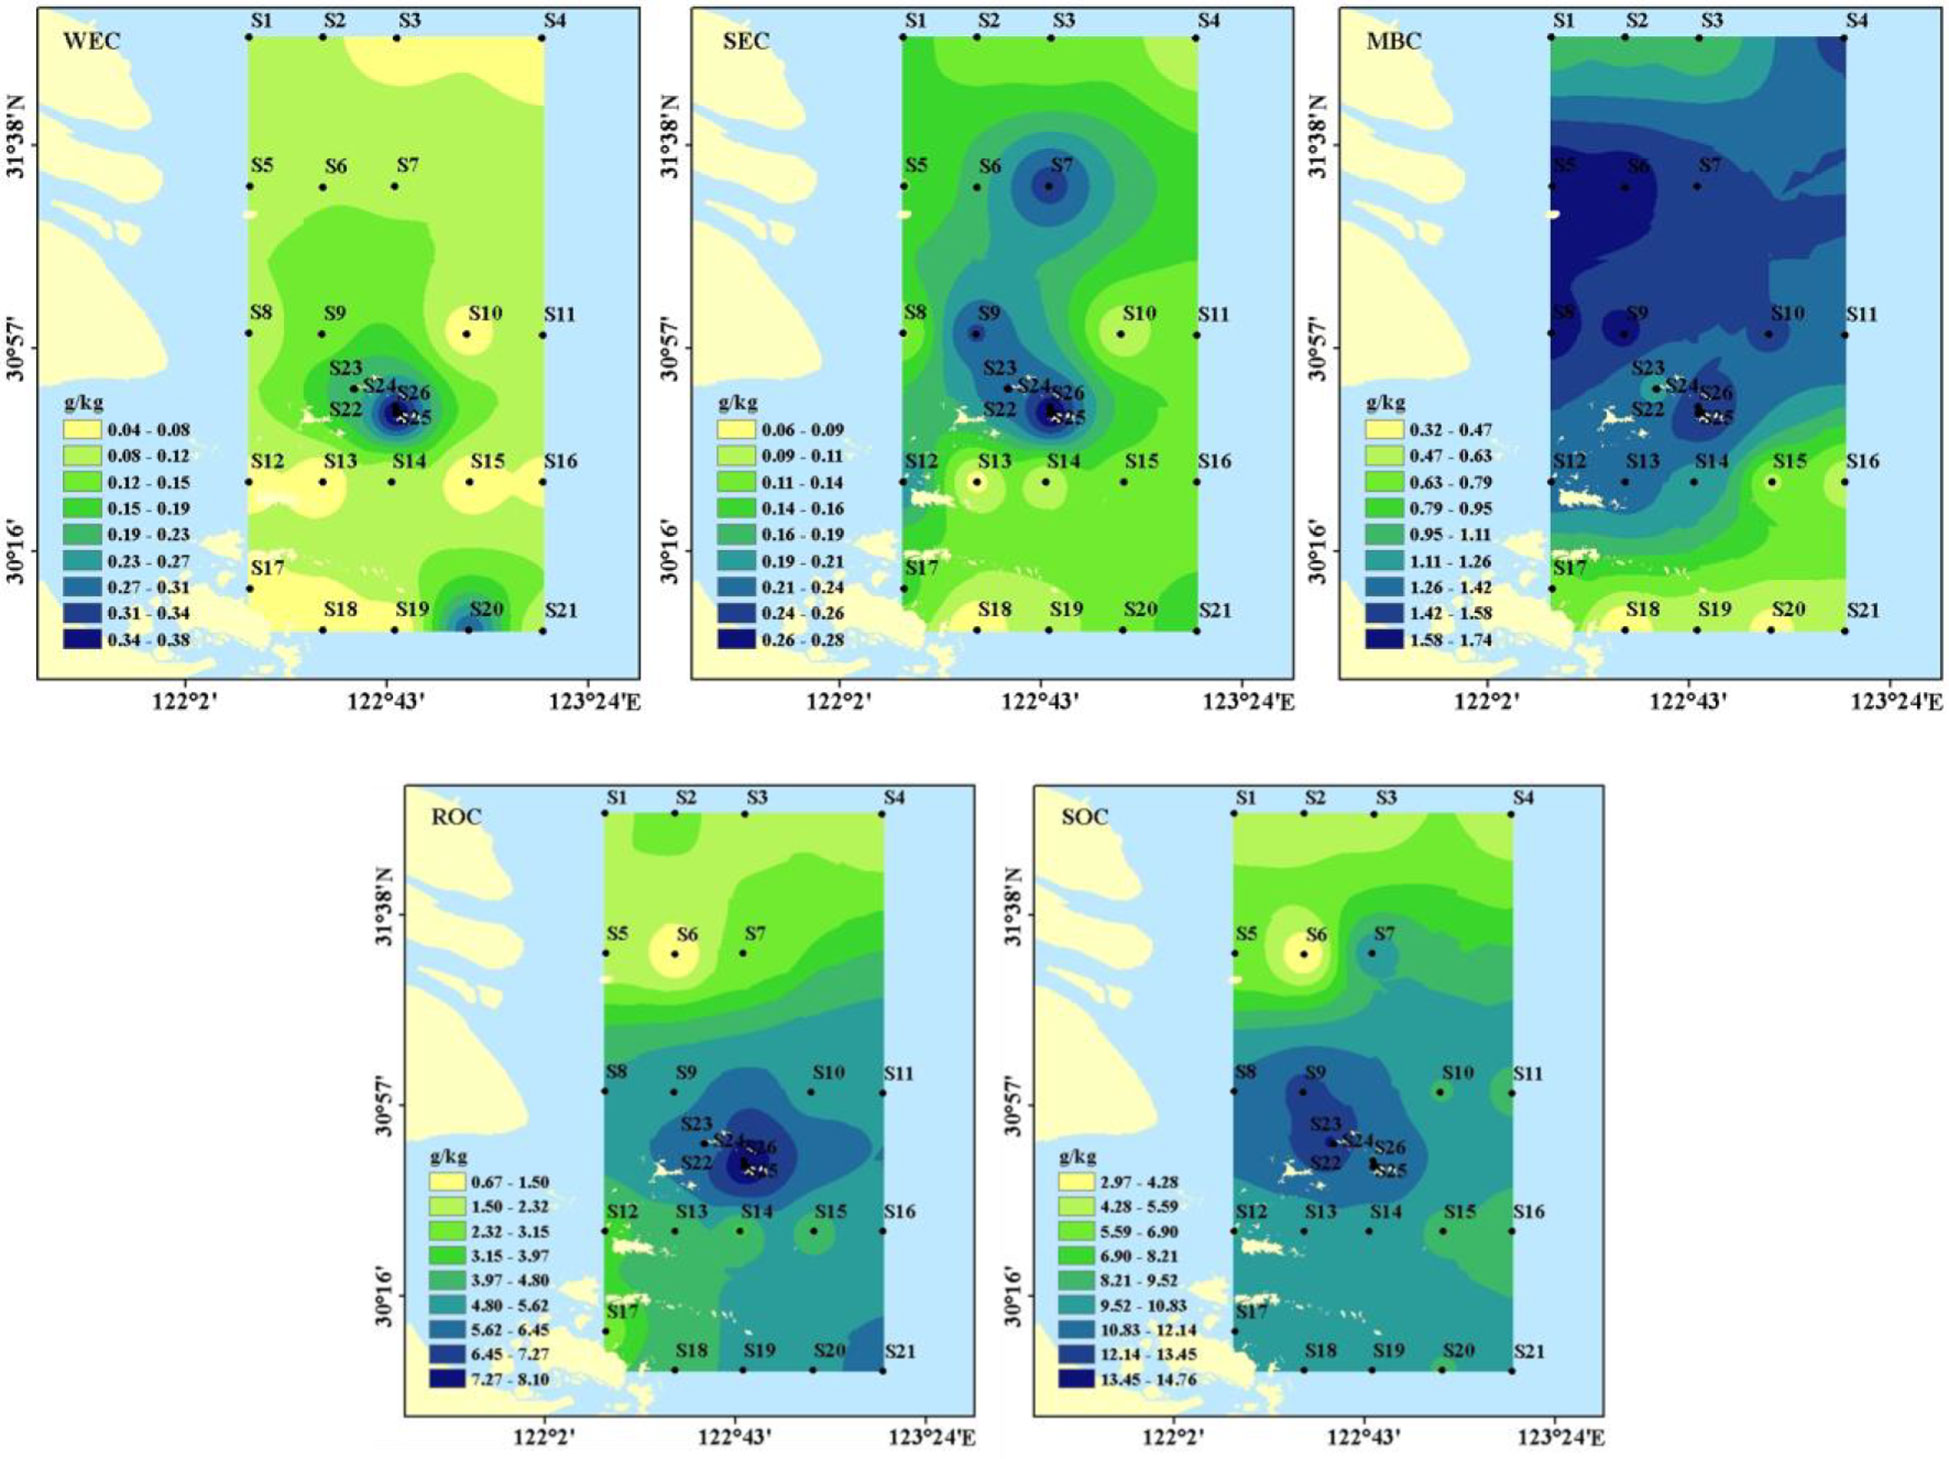
Figure 4 The four operational fractions and SOC in the surface sediments off the Changjiang Estuary and adjacent sea.
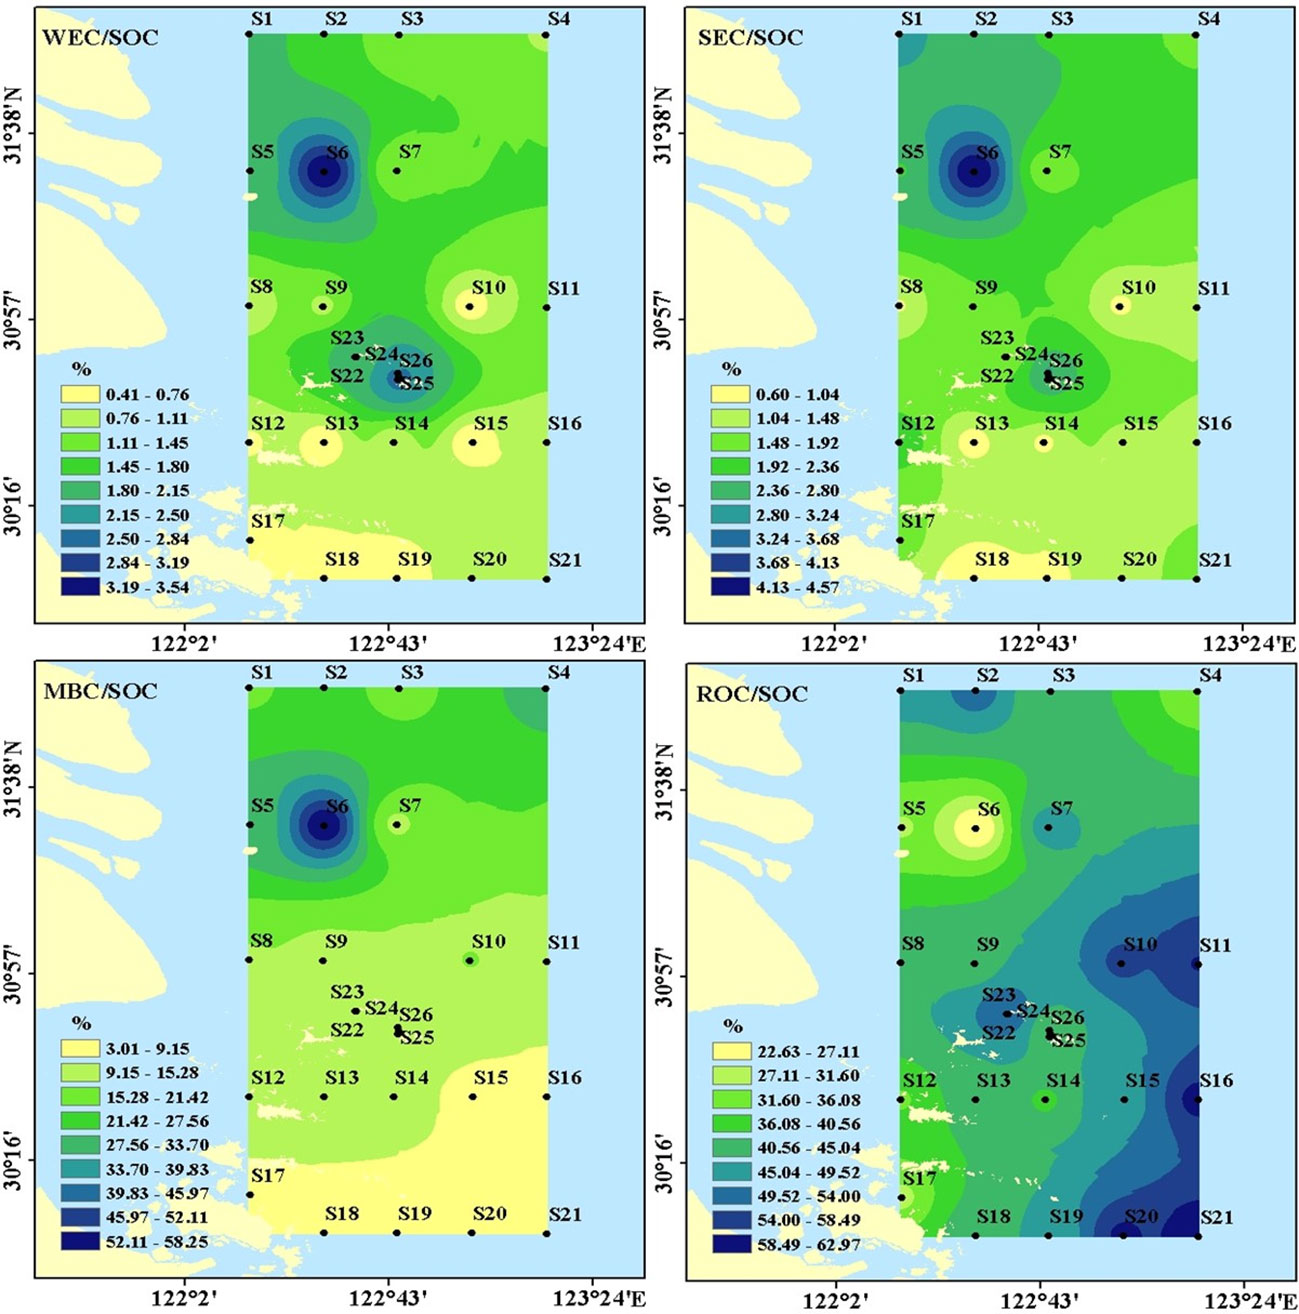
Figure 5 Distribution of WSOC/SOC, SEC/SOC, MBC/SOC, ROC/SOC in the surface sediments off the Changjiang Estuary and adjacent sea.
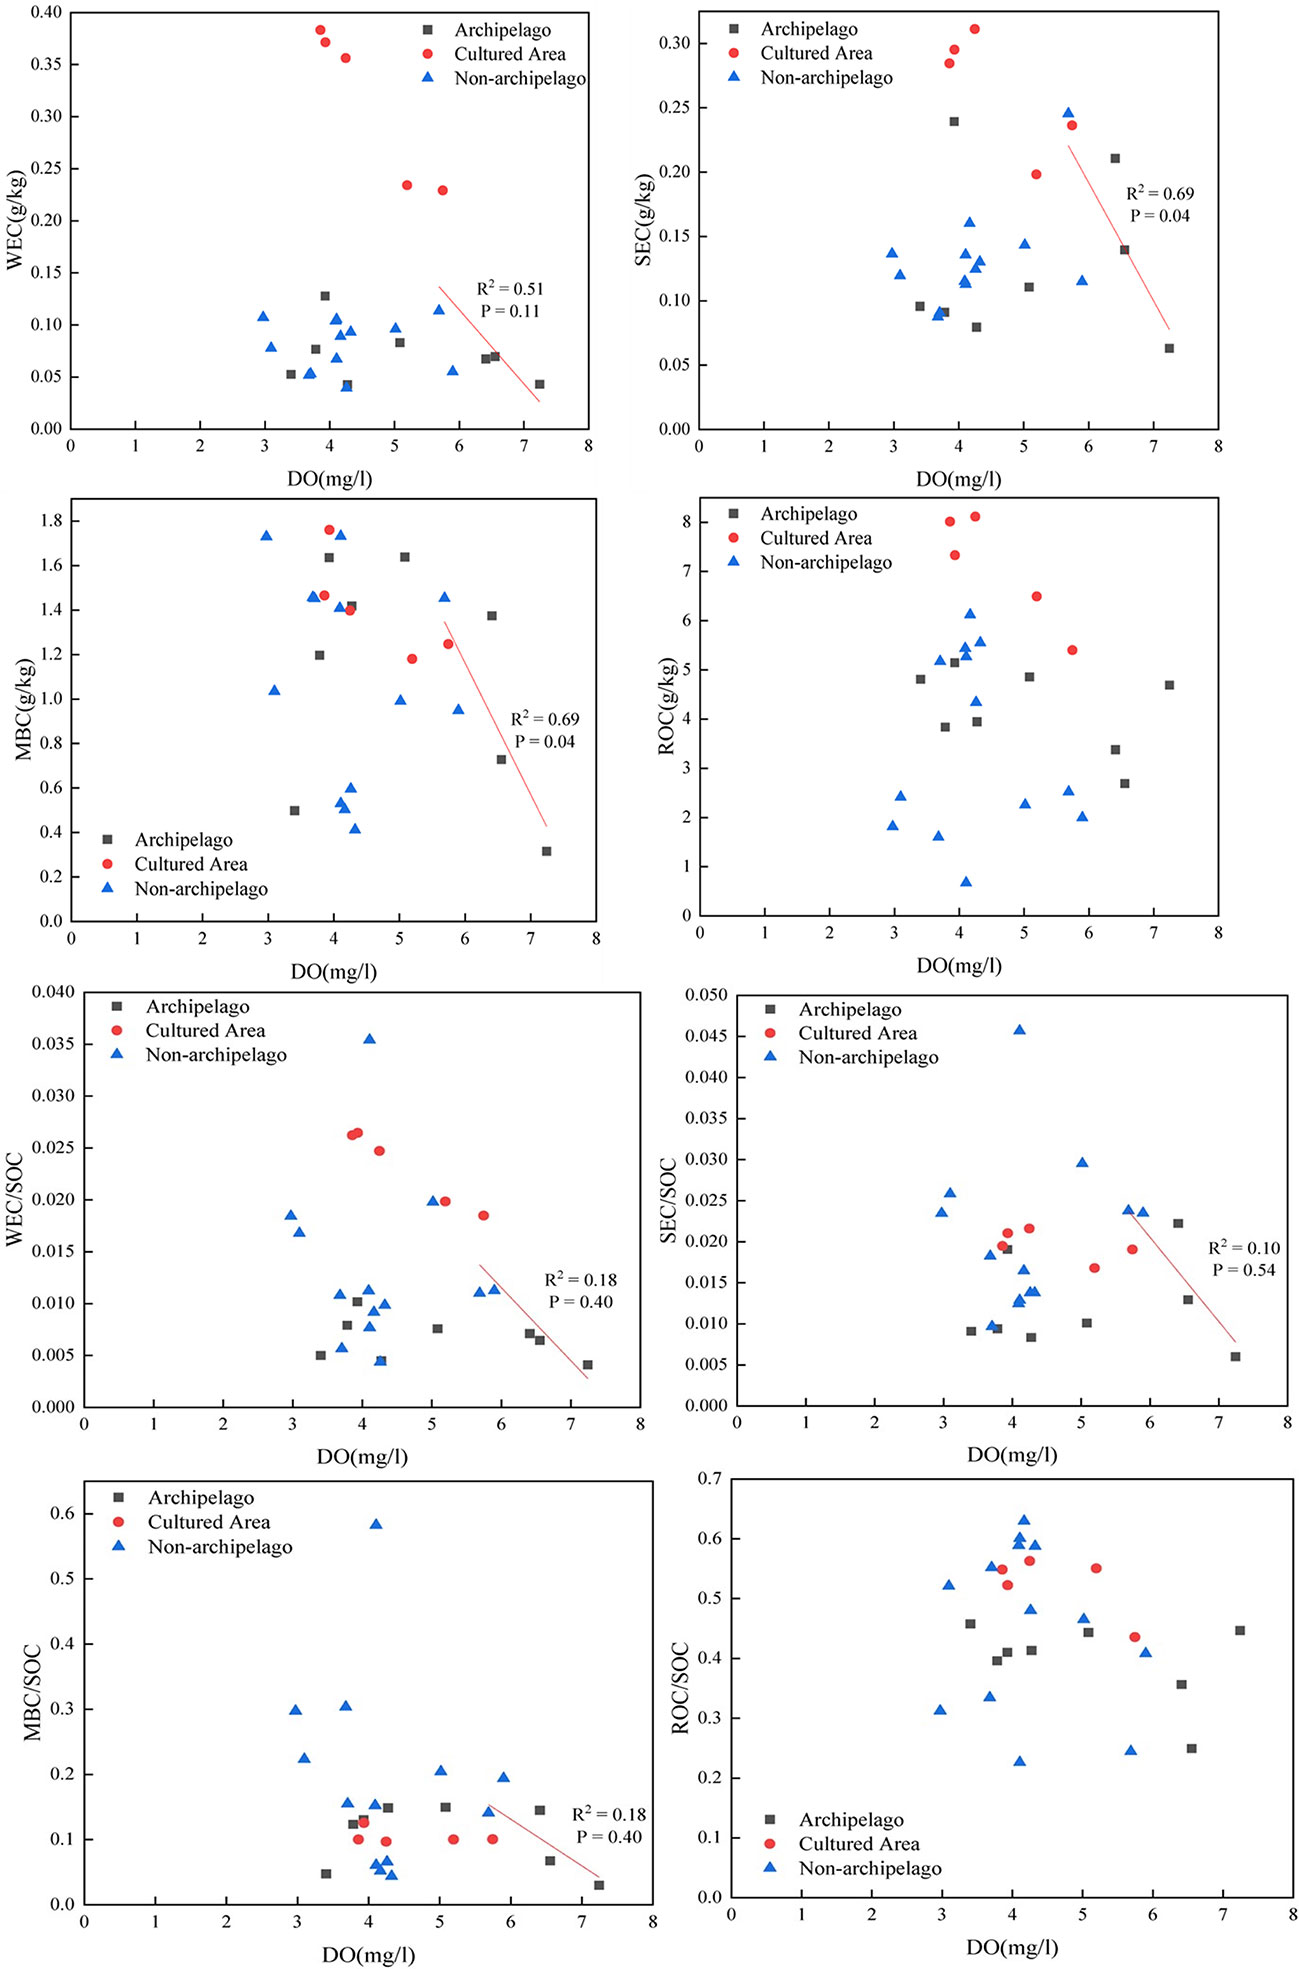
Figure 6 Relationship between various carbon fractions in the surface sediments and dissolved oxygen in the near-bottom waters. Gray and dashed arrows indicate the negative relation under high DO background (DO over 5.5 mg/L).
3. Results
3.1. Grain size, bulk density (BD) and DO
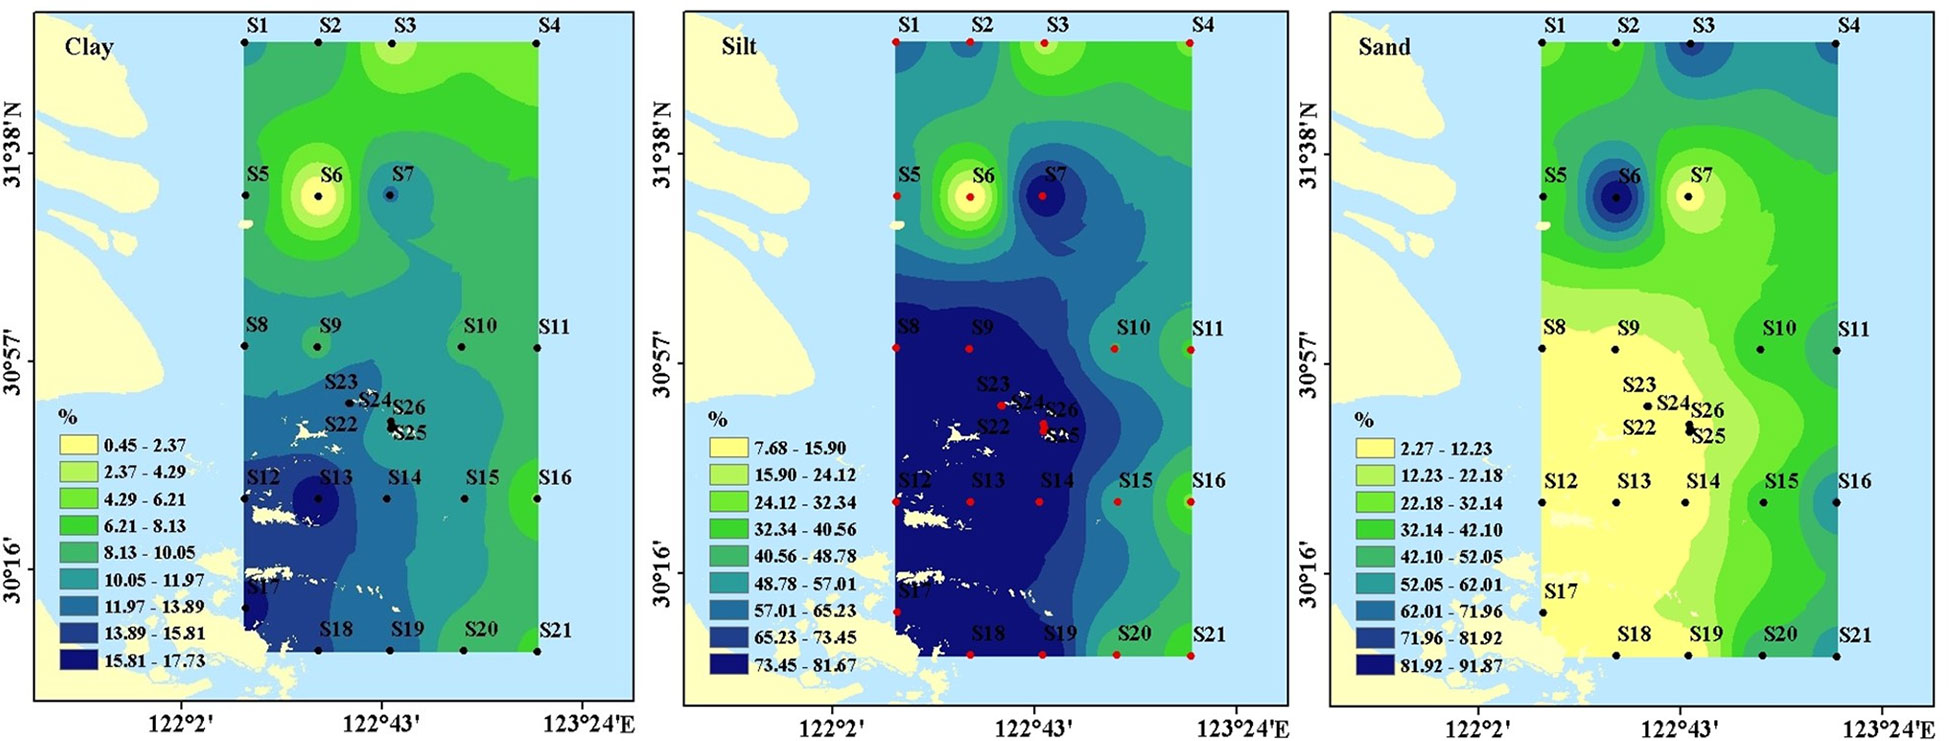
The surface sediments in the study area were dominated by silt, with an average of 61.5%. However, the sediment at S6 was dominated by sand particles (> 63 μm) accounting for 91.89%. The estuary and the short, mobile mud belt that ran parallel to the coast and continued southward were the main locations for fine-grained sediments. It was noteworthy that outside of the Changjiang Estuary and in the outer shelf region, coarser sandier materials predominated (Figure 2). For instance, more than 60% of the sediments at stations S3, S4, and S16 contained sand.
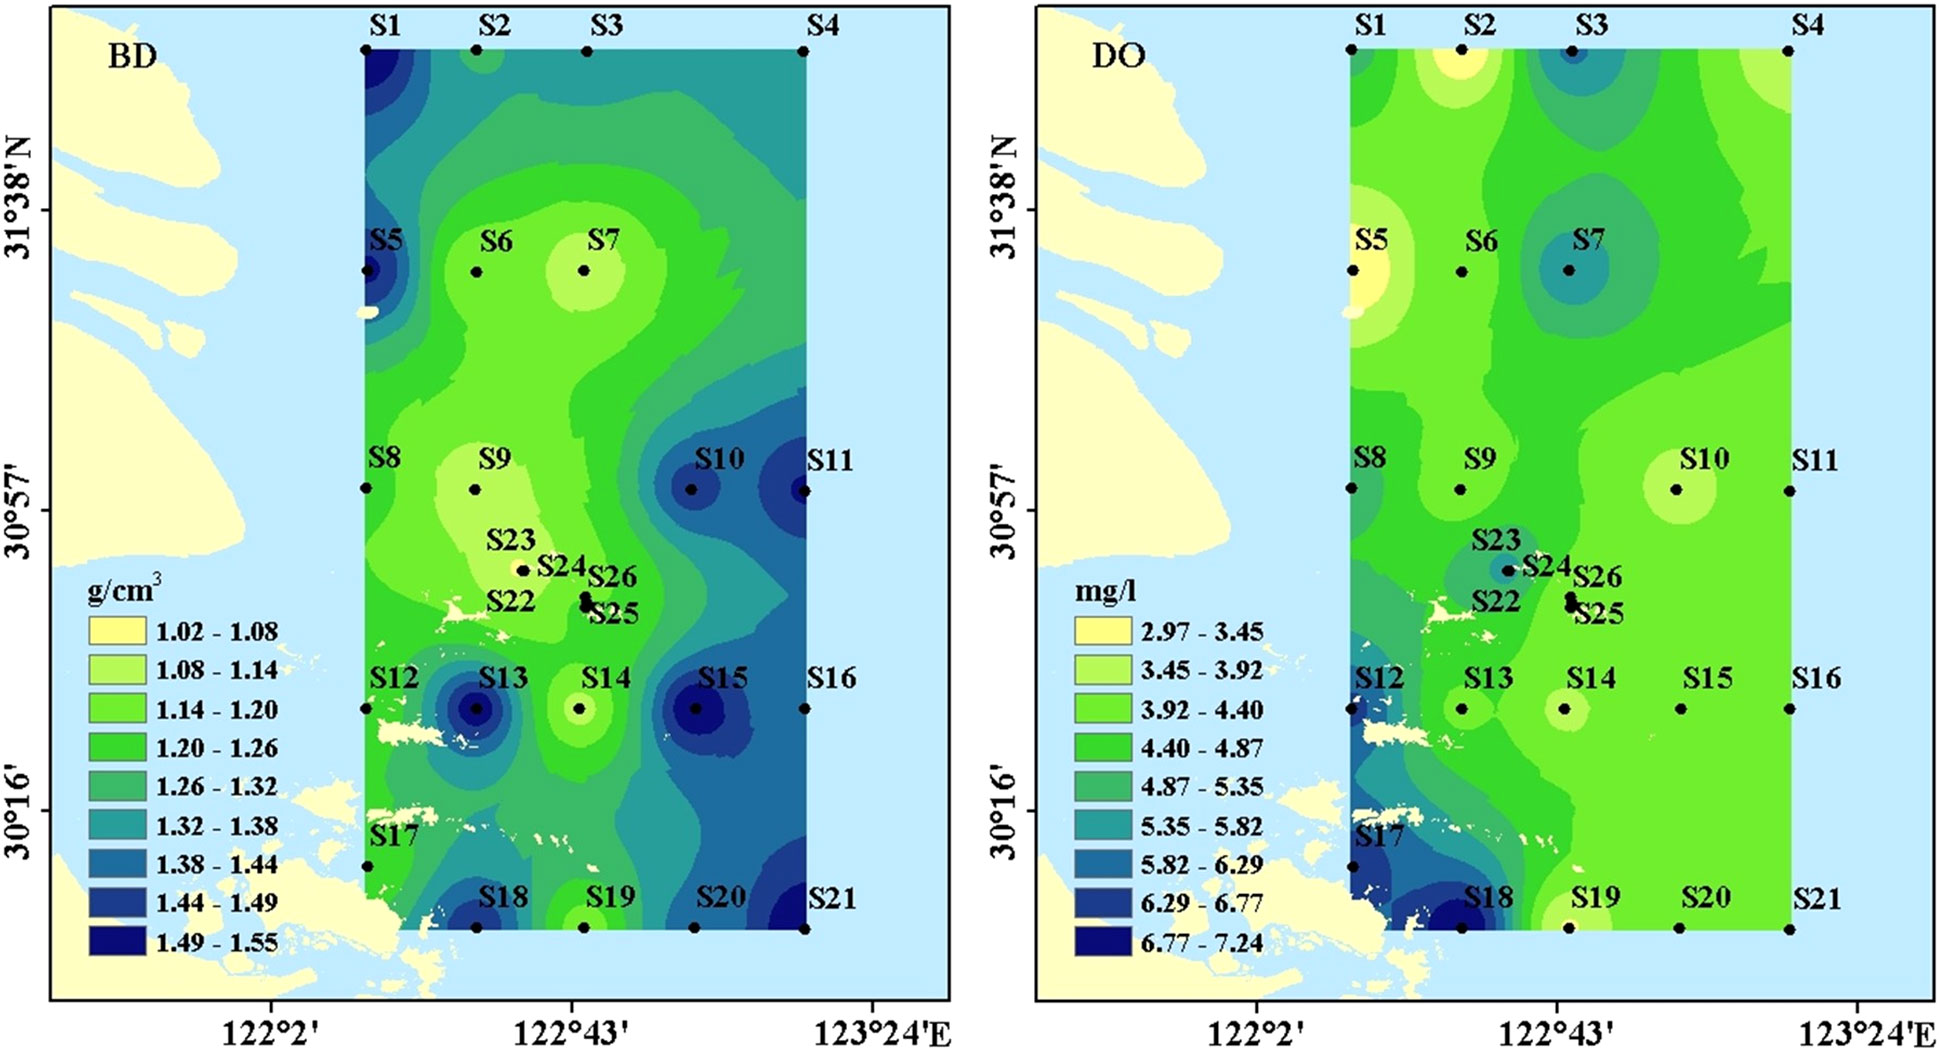
The BD in the surface sediments ranged from 1.01 g/cm3 to 1.55g/cm3, with averages of 1.31 ± 0.17 g/cm3 (Figure 3). BD was higher in non-archipelagic areas and lower near the Zhoushan Archipelago. The DO concentrations in near-bottom water ranged from 2.97 mg/l to 7.24 mg/l, with averages of 4.57 ± 1.08 mg/l (Figure 3). DO concentrations were higher near the Zhoushan Archipelago and decreased along the direction away from the Zhoushan Archipelago, similar to the distribution of fine-grained sediments (Figure 2).
3.2. Sedimentary organic carbon (SOC)
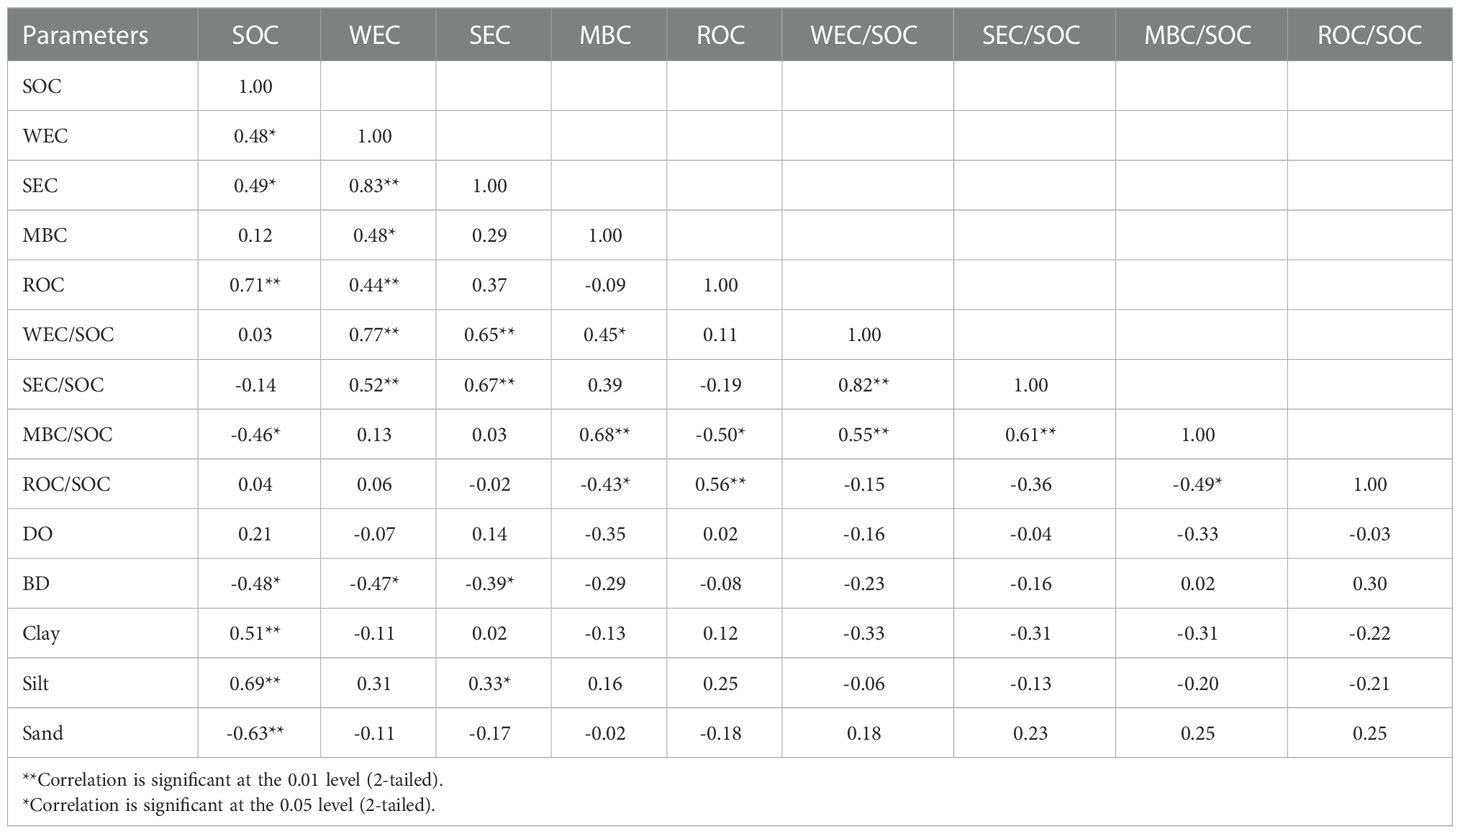
The organic carbon content was higher near the islands than in the non-Zhoushan Archipelago, which was also similar to the distribution of dissolved oxygen. The content of SOC increased southward, in line with the trend of fine particle composition, and was significantly negatively linked with the sand (Table 1). High values of SOC were found in the muddy areas close to the estuary, where silt and clay contents were high (Figure 2).
3.3. The four carbon fractions
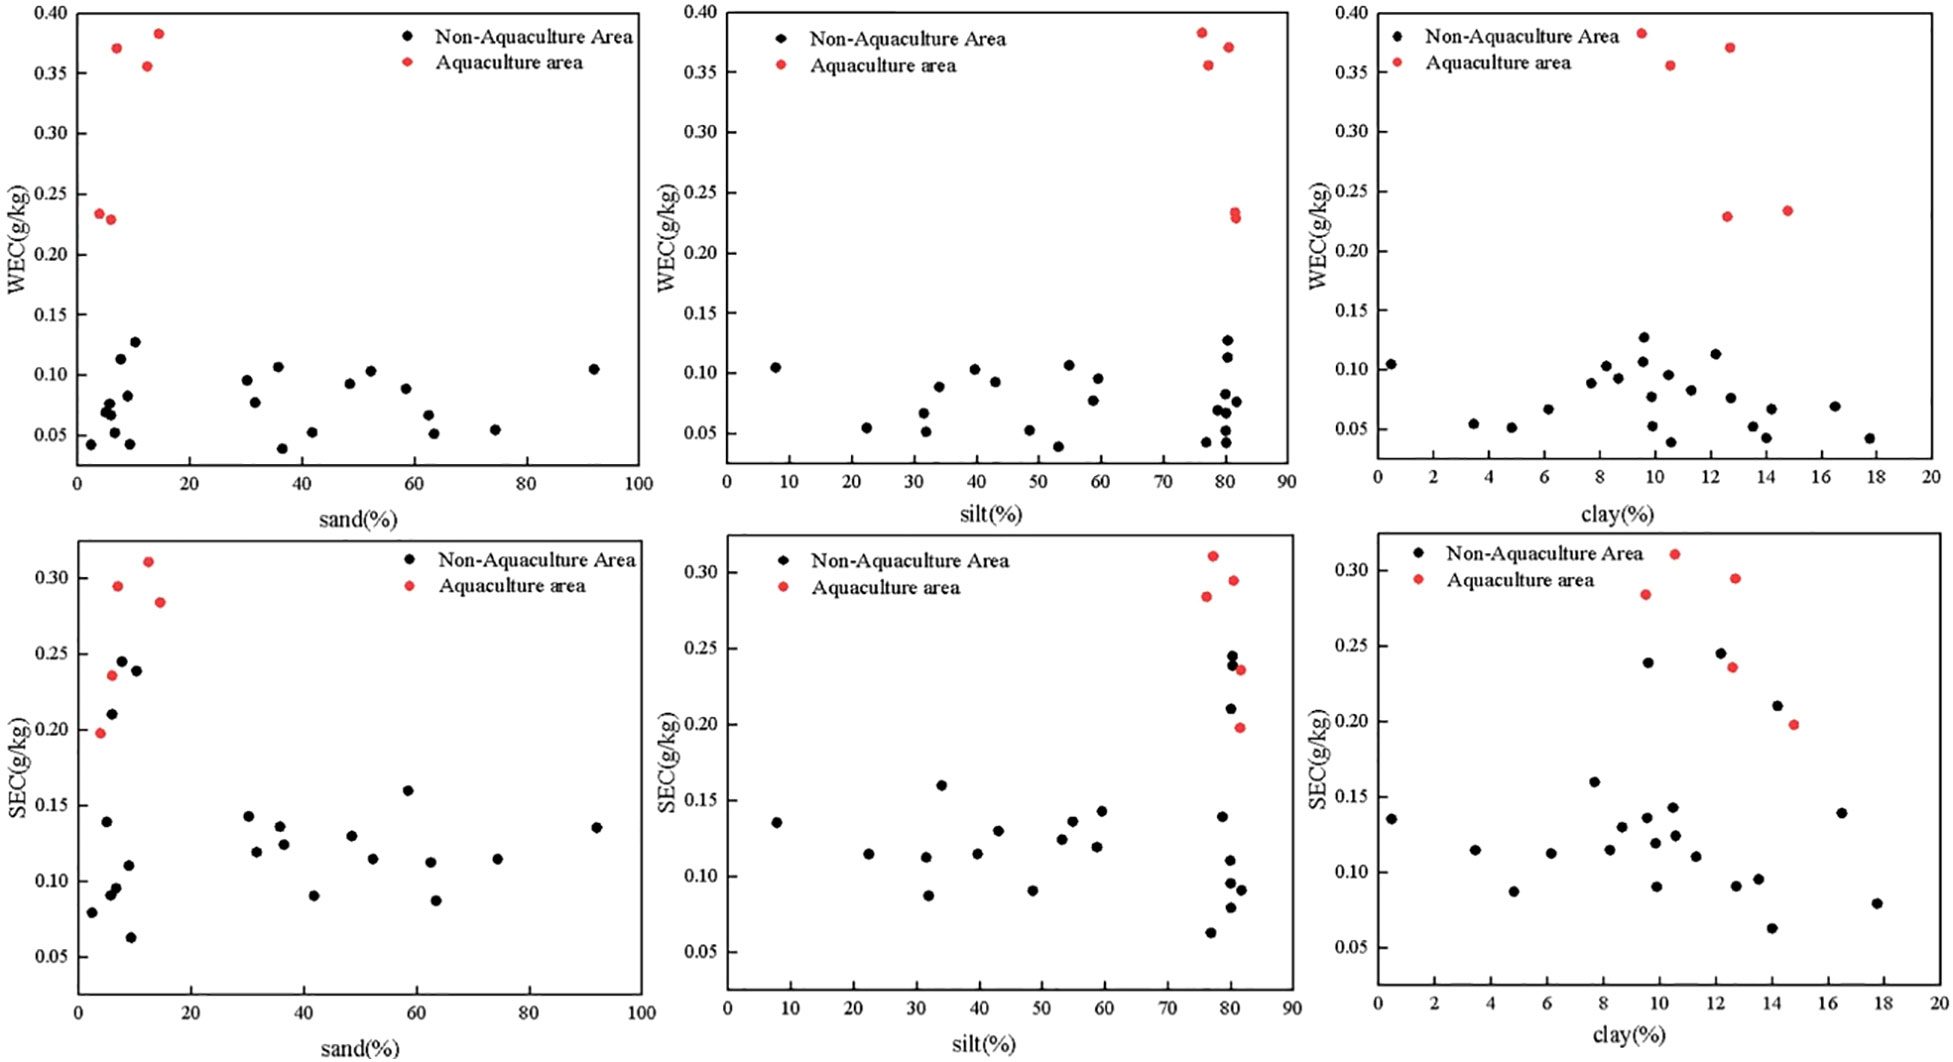
The distribution of SOC and its fractions was shown in Figure 4. SOC, WEC, SEC, MBC, and ROC contents ranged from 2.97 to 14.61 g/kg, 0.04 to 0.38 g/kg, 0.06 to 0.31 g/kg, 0.32 to 1.76 g/kg and 0.67 to 8.11 g/kg, respectively which the corresponding mean values were 9.43 ± 3.07 g/kg, 0.12 ± 0.10 g/kg, 0.16 ± 0.07 g/kg, 1.16 ± 0.45 g/kg and 4.38s ±1.95 g/kg, respectively. The distribution of SOC in the study area indicated an upward trend from north to south, with the highest value in the aquaculture area. The WEC and SEC in the aquaculture area and the non-aquaculture area were 0.23 to 0.38 g/kg and 0.20 to 0.31 g/kg and 0.04 to 0.13 g/kg and 0.06 to 0.25 g/kg, respectively. The aquaculture area was higher than the non-aquaculture area.
WEC/SOC, SEC/SOC, MBC/SOC, and ROC/SOC ranged from 0.41% to 3.54%, 0.60% to 4.57%, 2.38% to 58.26%, and 22.63 to 62.97%, respectively. The mean percentage of WEC, SEC, MBC, and ROC to SOC was 1.31% ± 0.81%, 1.79% ± 0.82%, 14.19% ± 11.55%, and 45.16% ± 11.25%, respectively (Figure 5), indicating that the majority of SOC in the study area was relatively recalcitrant. Higher WEC/SOC, SEC/SOC, and MBC/SOC were observed at S6 compared to the other stations, while lower ROC/SOC was observed at S6.
3.4. Relationship between organic carbon fraction and physical properties
Relations between parameters are shown in Table 1. The SOC was significantly and positively correlated to WEC, SEC, and ROC while the opposite was found between SOC and SEC/SOC and MBC/SOC. The SEC, WEC, and MBC were correlated with each other (Table 1). WEC/SOC and SEC/SOC had a significant positive correlation, and the correlation between ROC and SOC was more significant. The relationship between carbon fraction and particle size was not significant. There were also negative correlations between BD and WEC, SEC, MBC, and ROC, among which WEC and SEC were significantly correlated (Table 1).
4. Discussion
4.1. Controls and implication of stationary fraction ROC
Sediment grain size composition plays an essential role in sediment organic matter (Zhu et al., 2011a). The SOC in the study area was significantly correlated with clay and silt, corresponding to the concentration of fine-grained components near the Zhoushan Archipelago (Figure 2). There is also a significant negative correlation between SOC and sand, indicating the potential influence of hydrodynamics on the accumulation of organic matter and sediment sorting in estuaries and coastal areas. Fine-grained sediments (< 63 μm) usually had a more ancient organic carbon signature than coarse-grained sediments, indicating that fine-grained sediments contained more highly degraded OM (Bao et al., 2016). The sand substrate of S6 may be the main reason for the low SOC content. Furthermore, the greater oxygen permeability in sandy sediments compared to fine-grained and muddy sediments may also account for the lower SOC content (Macreadie et al., 2011; Xiao et al., 2015).
The strong acid processing in the treatment of the samples means the measured organic carbon is resistant to strong acid, or more likely, it is in a very solid and/or recalcitrant matrix in the sediment, for example, within the mineral crystal lattice. As a result, the ROC content tended to be more stable in the whole sediment than in the rest carbon pool (Silveira et al., 2008). Among the four fractions, ROC showed the highest fraction (Table 2) and strongest relation (0.71) with SOC relative to WEC, SEC, and MBC (Table 1). Hence it is ROC that determined the overall sedimentary OM nature. Previously, it is reported that sediments of lower density have a higher fraction of SOC (Anh et al., 2014), whereas more compact soils may inhibit the mineralization of organic carbon (Wang et al., 2021b). Indeed, we observed consistent relation between grain size and sedimentary OM fractions (Table 1), and sediments with higher SOC and lower density showed a greater LOC component (Figures 3, 4).
Given the resistant nature (likely fixed in the mineral lattice), the ROC should be related to both the aging process and/or the source feature (composition). As revealed by 14C, the OM age of the surface sediments off the Changjiang Estuary showed an age of 5500 years in the river mouth, and gradually increase east of the Zhoushan Archipelago to over 7500 years (Wu et al., 2013). A more detailed 14C age of surface sediments is later provided by Bao et al. (2016). A quantitative comparison between the reported 14C age (Bao et al., 2016) and our ROC data gives no clear relation (figure not shown), and this irregularity may either be due to the sediment heterogenous feature (the compared data were not from identical samples) or due to the complex ROC composition and formation mechanism.
4.2. Controlling factors for LOC and MBC
4.2.1. LOC
Significant positive relations between WEC-SOC, and SEC-SOC, indicate that labile fractions in the sediments increased as the bulk of SOC increased (Table 1). A similar relation was also observed in the coastal wetland soils (Xiao et al., 2015), the Mississippi Coastal Wetland (Dodla et al., 2012), and Pearl River Estuary sediments (Lian et al., 2018).
Although LOC showed no significant pattern along with grain size, samples from the aquaculture areas showed significantly higher LOC values at different grain sizes (Figure 7). WEC in aquaculture areas had a more pronounced trend compared to SEC. The high SEC/SOC ratio in the aquaculture area indicated the strong microbial activity in the sediments. In addition to high primary production in the water column, aquaculture activities further enhance the generation of organic matter via feces or pseudofeces. Both natural process (primary production) and anthropogenic activities (aquaculture) enhanced sinking OM, and consequently, the decomposition of extra OM in the near bottom waters would potentially increase the observed labile OM fraction (Figure 7). A similar aquaculture impact on sedimentary labile OM fraction was also reported in shellfish and seaweed aquaculture area (Zhang et al., 2017; Liu et al., 2019a).
4.2.2. MBC
As for MBC, which is usually related to microbial biomass indicators in soil studies (Shao et al., 2015; Liu et al., 2017), is usually also regarded as belonging to labile fractions (Liu et al., 2017). In this study, MBC was significantly related to WEC (Table 1). This indicated that the input of unstable carbon increased the MBC concentration and significantly stimulates the metabolism of microorganisms (Yang et al., 2013; Liu et al., 2016). However, MBC was not related to SEC, ROC, and SOC (Table 1), in contrast with WEC. Different from soil studies on land, sediments in the marine environment are different habitats from lands. Compared to terrestrial OM, marine OM was more labile and easy to decompose (Lamb et al., 2006) and hence was more likely to be utilized by bacteria in marine sediments. On the other hand, sediment off estuaries is under strong terrestrial OM input. Lignin, one of the terrestrial biomarkers, in surface sediments showed a high concentration in the river mouth (S5, S8; Figure 1) and gradually decreased in seawards in both east and south direction (Wu et al., 2013). The distribution pattern was very similar to that of MBC off the Changjiang Estuary (Figure 4). Though lacking direct evidence, we believe that compounds with similar polarity to chloroform are preferentially extracted from the samples. The poor polarity of some terrestrial biomarkers like lignin or high-carbon normal alkane (Xing et al., 1994; Lu et al., 2016), may be partially extracted and measured as MBC. The implication of MBC in estuarine sediments and its intersection with terrestrial biomarkers requiress further study.
4.2.3. Comparison with other sites
We notice that the SOC determination method in current work is not popular when compared to many other marine science studies. As is the case of dichromate, not all organic compounds are completely oxidized. Theoretically, some other soil constituents (e.g., Fe2+) may also be oxidized, and this in turn leads to overestimates of SOC. But overall, the not-oxidized organic fractions and a reductive inorganic fraction (e.g., Fe2+) are much less in amount when compared to the bulk SOC content, so much interference usually can be ignored (Bisutti et al., 2004; Nayak et al., 2019). SOC in our work ranged between 0.30% to 1.46% (Table 2) and SOC from (Yao et al., 2014), ranged from 0.12% to 0.68%, and SOC from (Bao et al., 2016), ranged from <0.01% to 2.14%. More literature is also checked, like (Chen et al., 2021)(0.13%-0.93%), (Limin Hu et al., 2012)(0.17%-0.70%) and (Zhu et al., 2011a)(0.1%-1.3%). In numbers, the dichromate-oxidation-method result seems to be consistent with previous work (usually high-temperature combustion method via elemental analyzer).
In the Changjiang estuary and adjacent areas, the estimated average SOC inventory in the top 10 cm of sediment was 12.1 Mg C ha−1. As a comparison, the Pearl River estuary sediments SOC inventory (top 0.75 m) is 34 Mg C ha-1 (Lian et al., 2018), and the top sediments in Australian estuarine mangrove range from 8.65 ± 0.89 to 32.98 ± 1.36 Mg/ha (Ouyang and Lee, 2020).
A comparison with a previous study indicates that sedimentary organic carbon off the Changjiang Estuary showed a comparative content with other sites (Table 2). But overall the active fraction, LOC, was 0.11 to 0.67 g/kg and this is lower when compared to that in the Pearl River Estuary (Table 2) (Figure 8).
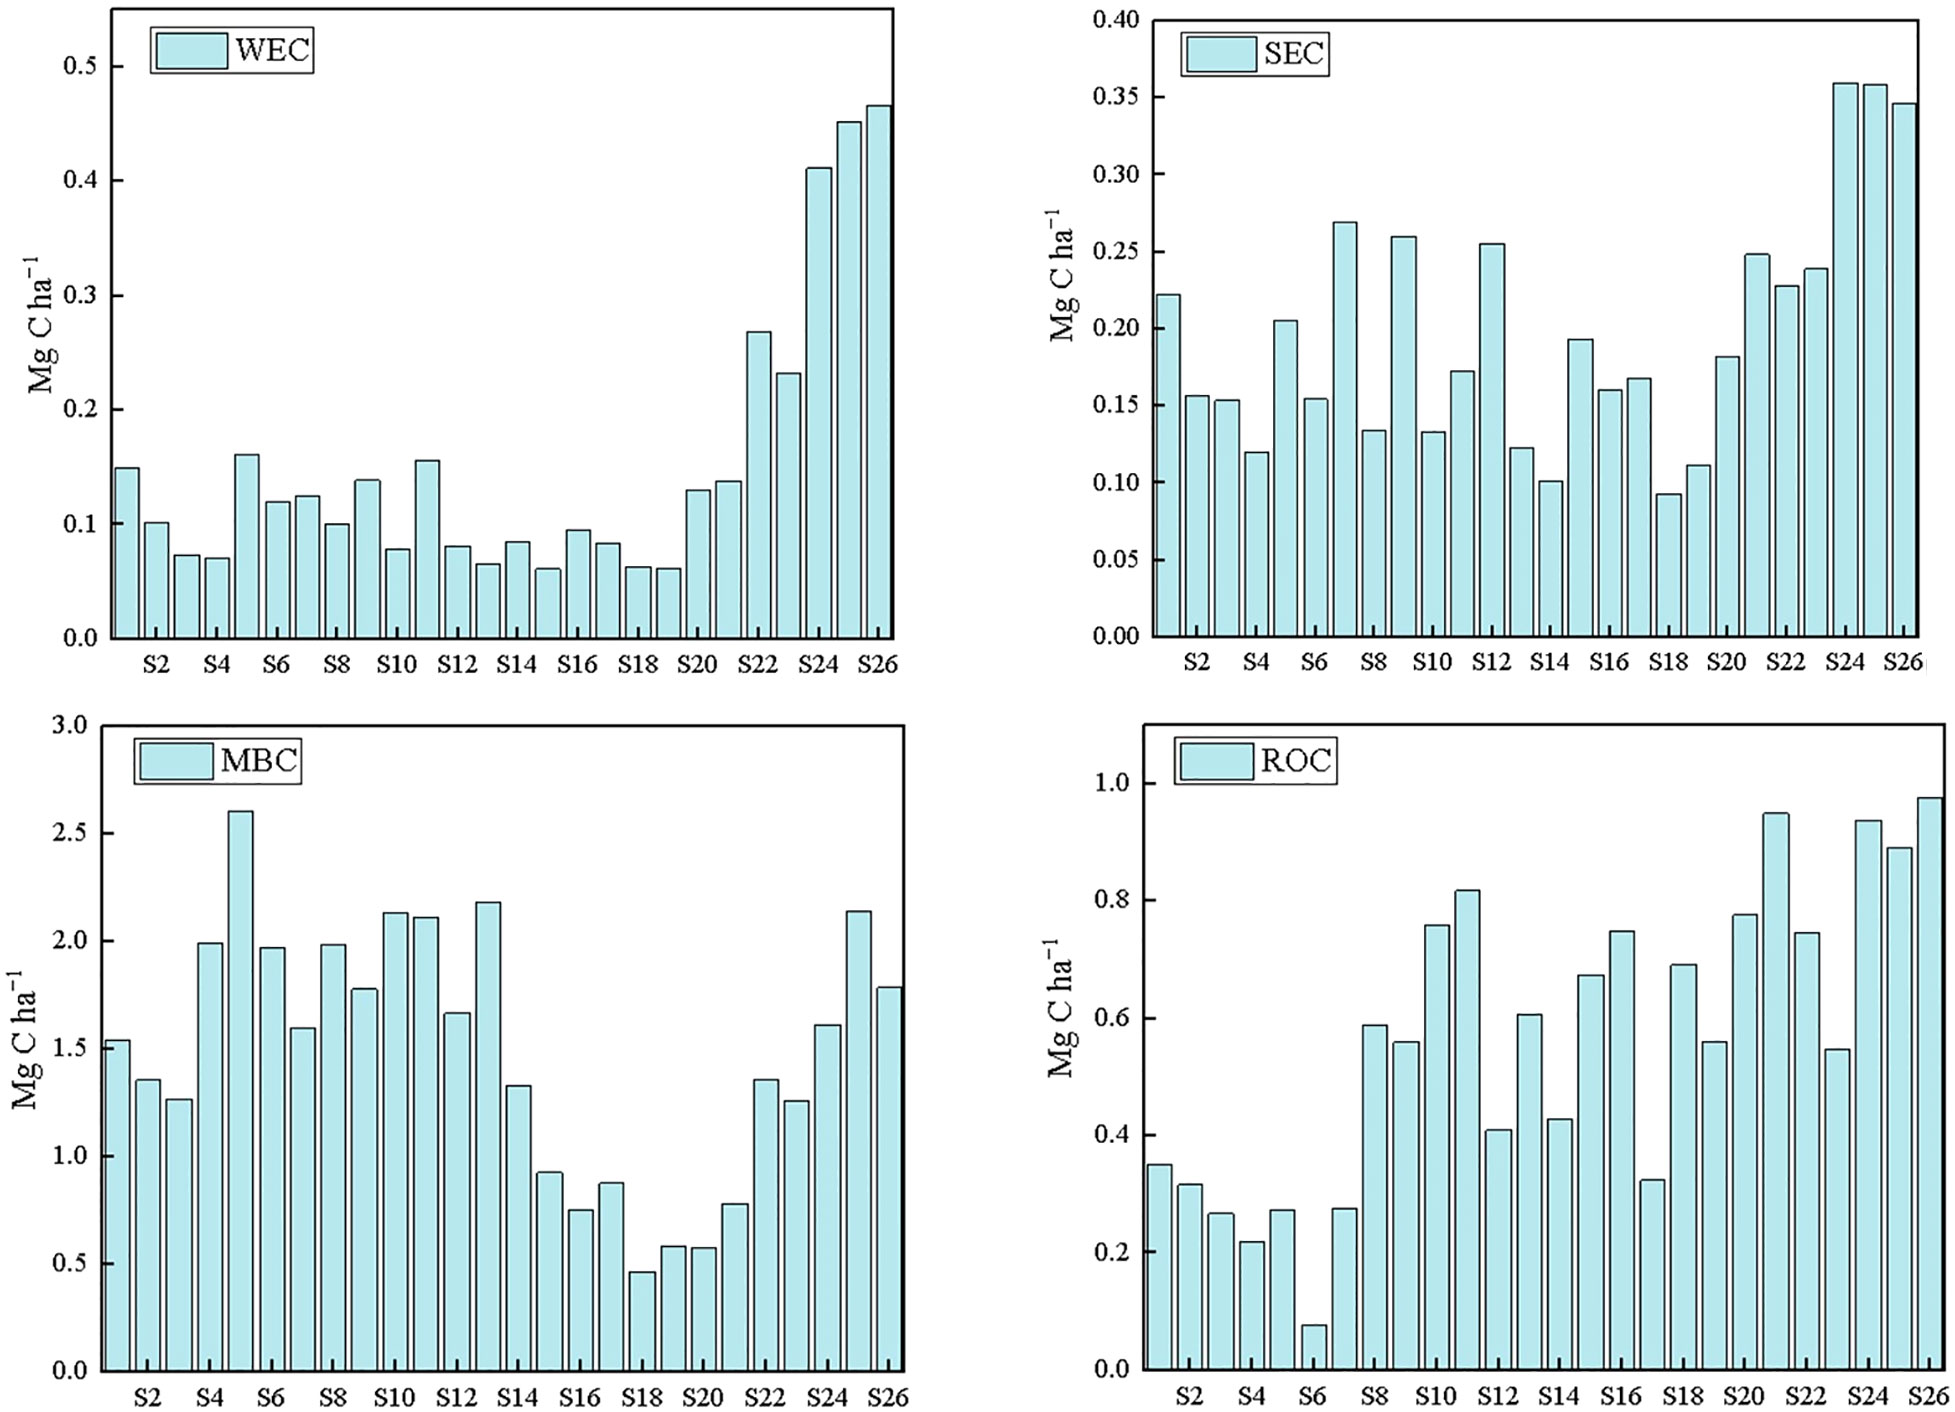
Figure 8 The stock of WEC, SEC, MBC and ROC of the surface sediment in this work (note: even-numbered sites are displayed).
4.3. Implication of hypoxia in the near bottom waters
Sedimentary oxygen demand and water column respiration are the two DO sinks in the water column and there is a shift of key oxygen sink from sedimentary oxygen demand to water column respiration with changes in DO (Zhou et al., 2021). That is when DO in the bottom water is towards hypoxic (e.g., < 3-4 mg/L), water column respiration is the key DO sink, but when DO is towards no depletion (e.g., > 5.5 mg/L), the sedimentary oxygen demand dominates the oxygen sink (Zhou et al., 2021). Therefore, when DO was < 3-4 mg/L, a weak relation between labile sedimentary carbon and DO in the near bottom is expected because a weak coupling between DO and degradation of sedimentary organic carbon is expected under very low DO conditions (< 3-4 mg/L). But, when DO is high (e.g., 5-7 mg/L), the sedimentary labile carbon content is expected to be low, because under the high DO conditions, a strong coupling between DO and degradation of sedimentary organic carbon is expected (Figure 6).
In detail, there is no clear relation between DO and sedimentary carbon when DO < 4 mg/L, but when the DO was > 5.5 mg/L, a clear decreasing pattern can be observed between DO and LOC (or MBC) (Figure 6). The data with DO > 5.5 mg/L was correlated and analyzed for r and p values (Spearman). Though not very significant (p = 0.11), the relation between DO and WEC is still strong (r = -0.71). The insignificance relation between DO and WEC (p = 0.11 > 0.05) needs further study, but a possible explanation includes the freshwater extraction doesn’t ideally reflect the real extraction process in the marine environment, in which the sedimentary OC is immersed in salty water. Further, the WEC fraction usually consists mainly of the hydrophilic fraction of organic carbon, which affects the water solubility of sedimentary organic matter (Sun, 2009; Dodla et al., 2012), whereas the SEC fraction composed of non-structural carbohydrates (like sucrose, mannose, xylose et al) and low molecular weight organic acids that are susceptible to microbial degradation (Liu et al., 2016; Liu et al., 2017). From the chemical composition, it is expected that SEC fraction, rather than WEC, is more closely related to sedimentary organic matter decomposition and corresponding oxygen consumption. This also partially explains the poor significance between DO and WEC. ROC is the exception: when DO was high (over 5.5 mg/L), ROC showed no decreasing pattern at all (Figure 6). This is because ROC is not expected to efficiently interact with DO due to its refractory nature.
Though both LOC and MBC showed decreasing pattern against DO under a high DO scenario (DO over 5.5 mg/L; Figure 6), LOC (WEC + SEC) clearly differs from MBC: because LOC fraction is the fraction extracted by chemicals of strong polarity (water), whereas MBC is the fraction extracted by chemicals of very poor polarity (chloroform). In the marine environment, the contrasting extractability between LOC and MBC means the former has much higher mobility and potential in releasing into the water column whereas the latter tend to stay in the sediment. This mobility and release potential difference means the LOC fractions have better potential in affecting near-bottom waters, including causing dissolved oxygen depletion in the near-bottom waters, relative to MBC and let alone ROC.
Off the Changjiang Estuary, the oxygen penetrates only a few mm into the sediment, typically 4 mm (Song et al., 2020). If we consider the top 4 mm as the active layer that can directly impact the near bottom water DO, then a quantitative estimate can be made assuming the vertical distribution of LOC in the top sediment is homogenous. That is, the stock of WEC and SEC within the top 4 mm of the sediment is assumed as the values we sampled, then 1.46 g/m2 can be calculated based on the observed WEC% (SEC%) and sediment weight (density plus volume). Assuming this labile OM amount will be totally decomposed and further assuming a C:O ratio of 1:1.2 (Jahnke and Jahnke, 2000), that would mean a DO requirement of 0.15 mol/m2. In the top 4 mm where DO can penetrate into the sediment and O2 is the most preferred electron acceptor, this amount of DO requirement (0.15 mol/m2) is to be fulfilled by DO from the near bottom waters and this hence cause a drop of DO in the near bottom waters. In other words, the 4 mm LOC decomposition represents the maximum sedimentary oxygen demand. Given the observed DO in the near bottom waters (Figure 3), the maximum hypoxic water depth caused by the sedimentary oxygen demand (decomposition of 4 mm LOC) ranged 0.3 m to 4.7 m (Figure 9), with a mean depth of 2 m. Note that the above estimate assumes the total decomposition of the LOC and that the 4 mm sediment is consistent with the LOC content contained in the 0-5 cm sediment. Therefore, it should be viewed as an upper limit, which is partially compensated by the ignorance of oxygen consumption via oxidation of sedimentary reductive inorganic elements.
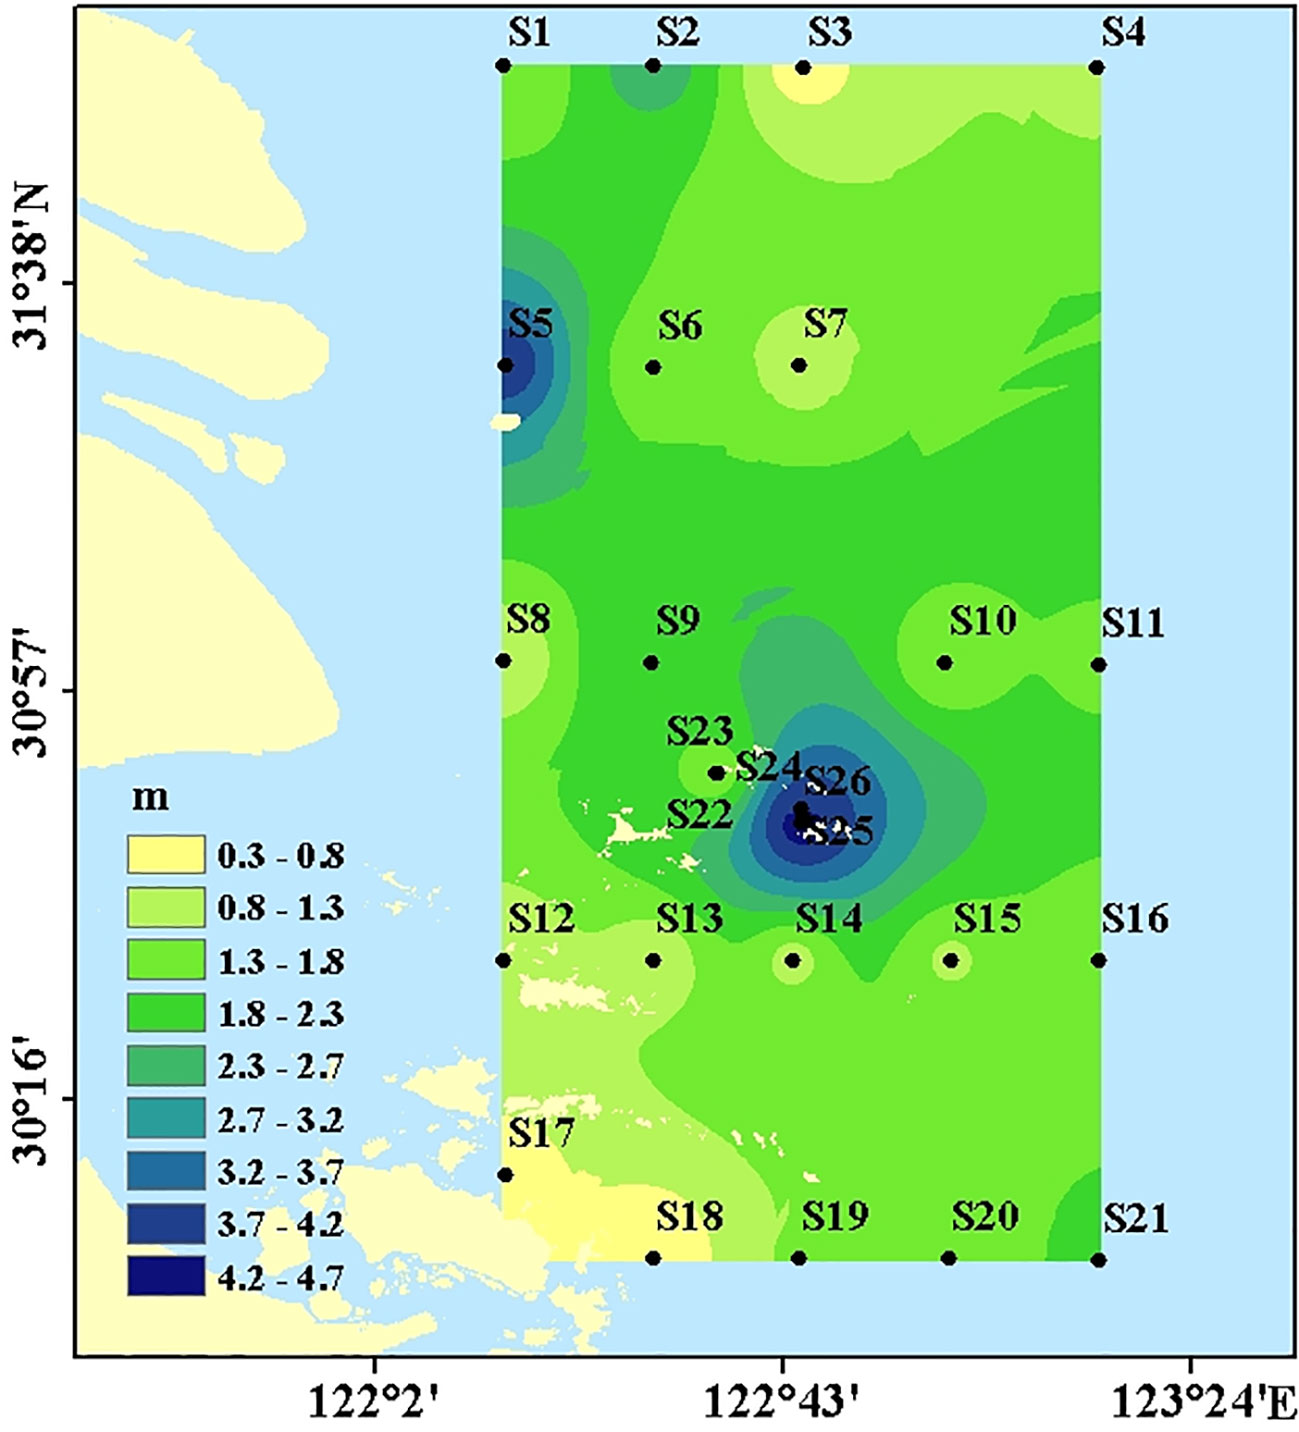
Figure 9 The estimated maximum hypoxic water depth caused by the decomposition of LOC in the top 4 mm sediment.
Hypoxia off the Changjiang Estuary has a mean depth of 20 m in the near bottom waters (Zhu et al., 2011b). The mean hypoxic water depth of 2 m caused by sedimentary oxygen demand suggests that the sedimentary oxygen consumption contributed 10% (2/20) of the AOU in the occurrence of hypoxia, with the rest 90% then caused by water column respiration. This estimate (10% vs. 90%) well agreed with the previous judgment addressed by the dissolved oxygen δ18O approach (Zhou et al., 2021). In other words, hypoxia off the Changjiang Estuary is mainly caused by water column respiration (Figure 9) and sedimentary oxygen consumption played a minor role (up to 10%).
5. Summary and conclusion
Our result shows the four fractions of SOC in the sediments of the Changjiang Estuary. The LOC fraction, namely the WEC and SEC ranged between 0.04 to 0.38 g/kg and 0.06 to 0.31 g/kg, respectively. MBC content was higher, ranging between 0.32 to 1.76 g/kg. ROC is the main component of SOC, accounting for 45.16% of SOC. For spatial distribution, the fine-grained sediments contained more degradable organic matter and lighter sediment contained more LOC. The LOC increased with increasing SOC. Aquaculture activities further increase the LOC content in the sediment. Preservation of LOC was found under lower DO conditions.
As the decomposition of sedimentary carbon is the major part of sedimentary oxygen demand for the diffusion boundary layer, the LOC-based oxygen demand is a reasonable approach for sedimentary oxygen consumption in the hypoxia study. Our estimate suggests that the decomposition of a labile fraction of carbon in the top a few mm of sediments would cause a few meters of near-bottom waters to become hypoxic. Quantitatively, 4 mm of top sediment LOC would potentially cause 2 m of near-bottom waters to become hypoxic. Compared with the 10 to over 40 m of water column depth, sedimentary impact on the water column oxygen budget is very limited, and our findings of sedimentary oxygen consumption contribution to hypoxia (10%) are consistent with the previous DO-δ18O approach. This implies that our estimate for the sedimentary oxygen consumption via the top of a few mm LOC is reasonable. Given the heterogeneity of LOC in the sediment layer, and dynamic DO in the near bottom waters, based on the LOC approach estimating the role of sedimentary oxygen consumption in hypoxia needs further study.
Data availability statement
The original contributions presented in the study are included in the article/supplementary material. Further inquiries can be directed to the corresponding authors.
Author contributions
YC: Investigation, Analyzing the data, Original Draft writing, HH: Supervision, Methodology, Writing-Review & Editing, XZ: Investigation, Analyzing the data, JLi: Investigation, TW: Investigation, JLin: Investigation, Z-YZ: Composing the primary idea and revising. All authors contributed to the article and approved the submitted version.
Acknowledgments
We are grateful to the captain and crew of the R/V “Su Ru Fishery Raising No. 08327” for their help on board. We thank the two reviewers, as well as the editor, for their suggestions and comments, which improved the original manuscript. This work was funded by the Key Laboratory of Marine Ecological Monitoring and Restoration Technologies (No. MEMRT2022-3), the Ministry of Science and Technology of China (2020YFA0608301), the National Natural Science Foundation of China (41976042), and the Oceanic Interdisciplinary Program of Shanghai Jiao Tong University (project number SL2021MS020) and the Funding of the National Key R&D Program of China (No.2018YFD0900704 and 2019YFD0901302).
Conflict of interest
The authors declare that the research was conducted in the absence of any commercial or financial relationships that could be construed as a potential conflict of interest.
Publisher’s note
All claims expressed in this article are solely those of the authors and do not necessarily represent those of their affiliated organizations, or those of the publisher, the editors and the reviewers. Any product that may be evaluated in this article, or claim that may be made by its manufacturer, is not guaranteed or endorsed by the publisher.
References
Anh P. T. Q., Gomi T., MacDonald L. H., Mizugaki S., Van K. P., Furuichi T. (2014). Linkages among land use, macronutrient levels, and soil erosion in northern Vietnam: A plot-scale study. Geoderma 232-234, 352–362. doi: 10.1016/j.geoderma.2014.05.011
Bao R., McIntyre C., Zhao M., Zhu C., Kao S.-J., Eglinton T. I. (2016). Widespread dispersal and aging of organic carbon in shallow marginal seas. Geology 44 (10), 791–794. doi: 10.1130/g37948.1
Bisutti I., Hilke I., Raessler M. (2004). Determination of total organic carbon – an overview of current methods. TrAC Trends Analytical Chem. 23 (10-11), 716–726. doi: 10.1016/j.trac.2004.09.003
Boynton W. R., Ceballos M. A. C., Bailey E. M., Hodgkins C. L. S., Humphrey J. L., Testa J. M. (2018). Oxygen and nutrient exchanges at the sediment-water interface: a global synthesis and critique of estuarine and coastal data. Estuaries Coasts 41 (2), 301–333. doi: 10.1007/s12237-017-0275-5
Burdige D. J. (2007). Preservation of organic matter in marine sediments: controls, mechanisms, and an imbalance in sediment organic carbon budgets? Chem. Rev. 107 (2), 467–485. doi: 10.1021/cr050347q
Cai P. H., Shi X. M., Moore W. S., Peng S. Y., Wang G. Z., Dai M. H. (2014). 224Ra:228Th disequilibrium in coastal sediments: Implications for solute transfer across the sediment–water interface. Geochim. Cosmochim. Acta 125, 68–84. doi: 10.1016/j.gca.2013.09.029
Cao L., Song J., Wang Q., Li X., Yuan H., Li N., et al. (2016). Characterization of labile organic carbon in different coastal wetland soils of laizhou bay, bohai Sea. Wetlands 37 (1), 163–175. doi: 10.1007/s13157-016-0858-0
Cheng L., Leavitt S. W., Kimball B. A., Pinter P. J., Ottman M. J., Matthias A., et al. (2007). Dynamics of labile and recalcitrant soil carbon pools in a sorghum free-air CO2 enrichment (FACE) agroecosystem. Soil Biol. Biochem. 39 (9), 2250–2263. doi: 10.1016/j.soilbio.2007.03.031
Chen Y., Hu C., Yang G. P., Gao X. C., Zhou L. M. (2021). Variation and reactivity of organic matter in the surface sediments of the changjiang estuary and its adjacent East China Sea. J. Geophys. Res.: Biogeosci. 126 (1). doi: 10.1029/2020jg005765
Chen G., Liu Y., Yao H., Huang C. (2006). A method for measuring microbial biomass c in waterlogged soil : chloroform fumigation extraction–water bath method. Acta pedol. Sin. 43, 981–988. doi: 10.11766/trxb200603150615
Coxall H. K., Wilson P. A., Palike H., Lear C. H., Backman J. (2005). Rapid stepwise onset of Antarctic glaciation and deeper calcite compensation in the pacific ocean. Nature 433(7021), 53–57. doi: 10.1038/nature03135
Dodla S. K., Wang J. J., Delaune R. D. (2012). Characterization of labile organic carbon in coastal wetland soils of the Mississippi river deltaic plain: relationships to carbon functionalities. Sci. Total Environ. 435-436, 151–158. doi: 10.1016/j.scitotenv.2012.06.090
Gong G.-C., Liu K.-K., Chiang K.-P., Hsiung T.-M., Chang J., Chen C.-C., et al. (2011). Yangtze River floods enhance coastal ocean phytoplankton biomass and potential fish production. Geophys. Res. Lett. 38 (13). doi: 10.1029/2011gl047519
Jahnke R. A., Jahnke D. (2000). Rates of c, n, p and Si recycling and denitrification at the US mid-Atlantic continental slope depocenter. Deep-Sea Res. Part I-Oceanogr. Res. Pap. 47 (8), 1405–1428. doi: 10.1016/s0967-0637(99)00118-1
Kalembasa S. J., Jenkinson D. S. (1973). A comparative study of titrimetric and gravimetric methods for the determination of organic carbon in soil. J. Sci. Food Agric. 24 (9), 41–47. doi: 10.1002/jsfa.2740240910
Kirwan M. L., Megonigal J. P. (2013). Tidal wetland stability in the face of human impacts and sea-level rise. Nature 504(7478), 53–60. doi: 10.1038/nature12856
Lamb A. L., Wilson G. P., Leng M. J. (2006). A review of coastal palaeoclimate and relative sea-level reconstructions using δ13C and C/N ratios in organic material. Earth-Sci. Rev. 75 (1-4), 29–57. doi: 10.1016/j.earscirev.2005.10.003
Lian Z., Jiang Z., Huang X., Liu S., Zhang J., Wu Y. (2018). Labile and recalcitrant sediment organic carbon pools in the pearl river estuary, southern China. Sci. Total Environ. 640-641, 1302–1311. doi: 10.1016/j.scitotenv.2018.05.389
Lian Z.-L., Jiang Z.-J., Huang X.-P., Zhang L., Wu Y.-C., Liu S.-L. (2019). Distribution of labile organic carbon using different extract method in the surface sediments of pearl river estuary. Mar. Environ. Sci. 38 (03), 391–398. doi: 10.13634/j.cnki.mes.2019.03.011
Limin Hu X. S., Yu Z., Yang Z., Guo Z., Ma D., Wang H., et al. (2012). Distribution of sedimentary organic matter in estuarine–inner shelf regions of the East China Sea: Implications for hydrodynamic forces and anthropogenic impact. Mar. Chem. 142-144, 29–40. doi: 10.1016/j.marchem.2012.08.004
Liu Y., Deng B., Du J., Zhang G., Hou L. (2019b). Nutrient burial and environmental changes in the Yangtze delta in response to recent river basin human activities. Environ. pollut. 249, 225–235. doi: 10.1016/j.envpol.2019.03.030
Liu S., Jiang Z., Deng Y., Wu Y., Zhao C., Zhang J., et al. (2017). Effects of seagrass leaf litter decomposition on sediment organic carbon composition and the key transformation processes. Sci. China Earth Sci. 60 (12), 2108–2117. doi: 10.1007/s11430-017-9147-4
Liu S., Jiang Z., Wu Y., Deng Y., Chen Q., Zhao C., et al. (2019a). Macroalgae bloom decay decreases the sediment organic carbon sequestration potential in tropical seagrass meadows of the south China Sea. Mar. pollut. Bull. 138, 598–603. doi: 10.1016/j.marpolbul.2018.12.009
Liu S., Jiang Z., Zhang J., Wu Y., Lian Z., Huang X. (2016). Effect of nutrient enrichment on the source and composition of sediment organic carbon in tropical seagrass beds in the south China Sea. Mar. pollut. Bull. 110 (1), 274–280. doi: 10.1016/j.marpolbul.2016.06.054
Li D. J., Zhang J., Huang D. J., Wu Y., Liang J. (2002). Oxygen depletion off the changjiang (Yangtze river) estuary. Sci. China Ser. D—Earth Sci. 45 (12), 1137–1146. doi: 10.1360/02yd9110
Lu L., Shi R., Liu L., Yan J., Lu F., Lei A. (2016). Oxidative Alkane C-H Alkoxycarbonylation. Oxid. Alkane C-H Alkoxycarbonylation Chem. 22 (41), 14484–14488. doi: 10.1002/chem.201602791
Macreadie P. I., Allen K., Kelaher B. P., Ralph P. J., Skilbeck C. G. (2011). Paleoreconstruction of estuarine sediments reveal human-induced weakening of coastal carbon sinks. Global Change Biol. 18 (3), 891–901. doi: 10.1111/j.1365-2486.2011.02582.x
McGILL W. B., Cannon K. R., Robertson J. A., Cook F. D. (1986). Dynamics of soil microbial biomass and water-soluble organic c in breton l after 50 years of cropping to two rotations. Can. J. Soil Sci. 66 (1), 1–19. doi: 10.4141/cjss86-001
Nayak A. K., Rahman M. M., Naidu R., Dhal B., Swain C. K., Nayak A. D., et al. (2019). Current and emerging methodologies for estimating carbon sequestration in agricultural soils: A review. Sci. Total Environ. 665, 890–912. doi: 10.1016/j.scitotenv.2019.02.125
Ouyang X., Lee S. Y. (2020). Improved estimates on global carbon stock and carbon pools in tidal wetlands. Nat. Commun. 11 (1), 317. doi: 10.1038/s41467-019-14120-2
Ouyang X., Lee S. Y., Connolly R. M. (2017). Structural equation modelling reveals factors regulating surface sediment organic carbon content and CO(2) efflux in a subtropical mangrove. Sci. Total Environ. 578, 513–522. doi: 10.1016/j.scitotenv.2016.10.218
Paul Eldor A., Morris S. J., Conant R. T., Plante A. F. (2006). Does the acid hydrolysis–incubation method measure meaningful soil organic carbon pools? Soil Sci. Soc. America J. 70 (3), 1023–1035. doi: 10.2136/sssaj2005.0103
Ren C., Yuan H., Song J., Duan L., Li X., Li N., et al. (2019). Amino sugars as indicator of organic matters source and diagenesis in the surface sediments of the East China Sea. Ecol. Indic. 97, 111–119. doi: 10.1016/j.ecolind.2018.10.011
Rochette P., Gregorich E. G. (1998). Dynamics of soil microbial biomass c, soluble organic c and CO2 evolution after three years of manure application. Can. J. Soil Sci. 78 (2), 283–290. doi: 10.4141/s97-066
Shao X., Yang W., Wu M. (2015). Seasonal dynamics of soil labile organic carbon and enzyme activities in relation to vegetation types in hangzhou bay tidal flat wetland. PloS One 10 (11), e0142677. doi: 10.1371/journal.pone.0142677
Silveira M. L., Comerford N. B., Reddy K. R., Cooper W. T., El-Rifai H. (2008). Characterization of soil organic carbon pools by acid hydrolysis. Geoderma 144 (1-2), 405–414. doi: 10.1016/j.geoderma.2008.01.002
Singh B., Ryden J. C., Whitchead D. C. (1988). Some relationships between denitrification potential and fractions of organic carbon in air-dried and field-moist soils Soil Biology & Biochemistry 20 (5), 737–741. doi: 10.1016/0038-0717(88)90160-5
Song G.-D., Liu S.-M., Zhang J., Zhu Z.-Y., Zhang G.-L., Marchant H. K., et al. (2020). Response of benthic nitrogen cycling to estuarine hypoxia. Limnol. Oceanogr. 9999, 1–15. doi: 10.1002/lno.11630
Song G.-D., Liu S.-M., Zhu Z.-Y., Zhai W.-D., Zhu C.-J., Zhang J. (2016). Sediment oxygen consumption and benthic organic carbon mineralization on the continental shelves of the East China Sea and the yellow Sea. Deep Sea Res. Part II: Topical Stud. Oceanogr. 124 (Supplement C), 53–63. doi: 10.1016/j.dsr2.2015.04.012
Sun L. (2009). Partitioning of water soluble organic carbon in three sediment size fractions: Effect of the humic substances. J. Environ. Sci. 21 (1), 113–119. doi: 10.1016/S1001-0742(09)60020-6
Syvitski J. P. M., Vörösmarty C. J., Kettner A. J., Green P. (2005). Impact of humans on the flux of terrestrial sediment to the global. Coast. Ocean 308(5720), 376–380. doi: 10.1126/science.1109454
Wang F., Tang J., Ye S., Liu J. (2021a). Blue carbon sink function of Chinese coastal wetlands and carbon neutrality strategy. Bull. Chin. Acad. Sci. 36 (3), 241–251. doi: 10.16418/j.issn.1000-3045.20210215101
Wang M., Wang S., Cao Y., Jiang M., Wang G., Dong Y. (2021b). The effects of hummock-hollow microtopography on soil organic carbon stocks and soil labile organic carbon fractions in a sedge peatland in changbai mountain, China. Catena 201. doi: 10.1016/j.catena.2021.105204
Wang H., Yang Z., Wang Y., Saito Y., Liu J. P. (2008). Reconstruction of sediment flux from the changjiang (Yangtze river) to the sea since the 1860s. J. Hydrol 349 (3-4), 318–332. doi: 10.1016/j.jhydrol.2007.11.005
Wu Y., Eglinton T., Yang L., Deng B., Montluçon D., Zhang J. (2013). Spatial variability in the abundance, composition, and age of organic matter in surficial sediments of the East China Sea. J. Geophys. Res.: Biogeosci. 118 (4), 1495–1507. doi: 10.1002/2013jg002286
Xiao Y., Huang Z., Lu X. (2015). Changes of soil labile organic carbon fractions and their relation to soil microbial characteristics in four typical wetlands of sanjiang plain, northeast China. Ecol. Eng. 82, 381–389. doi: 10.1016/j.ecoleng.2015.05.015
Xing B., McGill W. B., Dudas M. J., Maham Y., Hepler L. (1994). Sorption of phenol by selected biopolymers: isotherms, energetics, and polarity. Environ. Sci. Technol. 28 (3). doi: 10.1021/es00052a019
Yang J., Yang W., Wang F., Zhang L., Zhou B., Sarfraz R., et al. (2020). Driving factors of soluble organic nitrogen dynamics in paddy soils: Structure equation modeling analysis. Pedosphere 30 (6), 801–809. doi: 10.1016/s1002-0160(18)60032-3
Yang W., Zhao H., Chen X., Yin S., Cheng X., An S. (2013). Consequences of short-term C4 plant spartina alterniflora invasions for soil organic carbon dynamics in a coastal wetland of Eastern China. Ecol. Eng. 61, 50–57. doi: 10.1016/j.ecoleng.2013.09.056
Yao P., Zhao B., Bianchi T. S., Guo Z., Zhao M., Li D., et al. (2014). Remineralization of sedimentary organic carbon in mud deposits of the changjiang estuary and adjacent shelf: Implications for carbon preservation and authigenic mineral formation. Continental Shelf Res. 91, 1–11. doi: 10.1016/j.csr.2014.08.010
Yu X., Zhang P., Zhang J., Chen F., Yang Y. (2020). Characteristics of distribution patterns of microbial biomass and community structures in the sediments from urban river. Acta Scientiae Circumstantiae 40 (2), 585–596. doi: 10.13671/j.hjkxxb.2019.0378
Zhang Y., Zhang J., Liang Y., Li H., Li G., Chen X., et al. (2017). Carbon sequestration processes and mechanisms in coastal mariculture environments in China. Sci. China Earth Sci. 60 (12), 2097–2107. doi: 10.1007/s11430-017-9148-7
Zhao B., Yao P., Bianchi T. S., Arellano A. R., Wang X., Yang J., et al. (2018). The remineralization of sedimentary organic carbon in different sedimentary regimes of the yellow and East China seas. Chem. Geol. 495, 104–117. doi: 10.1016/j.chemgeo.2018.08.012
Zhou J., Zhu Z.-Y., Hu H.-T., Zhang G.-L., Wang Q.-Q. (2021). Clarifying water column respiration and sedimentary oxygen respiration under oxygen depletion off the changjiang estuary and adjacent East China Sea. Front. Mar. Sci. 7 (1229). doi: 10.3389/fmars.2020.623581
Zhu C., Wang Z.-H., Xue B., Yu P.-S., Pan J.-M., Wagner T., et al. (2011a). Characterizing the depositional settings for sedimentary organic matter distributions in the lower Yangtze river-East China Sea shelf system. Estuarine Coast. Shelf Sci. 93 (3), 182–191. doi: 10.1016/j.ecss.2010.08.001
Keywords: sedimentary oxygen consumption, Changjiang Estuary, refractory carbon, labile carbon, organic carbon
Citation: Cao Y, Huang H, Zhao X, Li J, Wang T, Lin J and Zhu Z-Y (2023) Labile and refractory fractions of sedimentary organic carbon off the Changjiang Estuary and its implications for sedimentary oxygen consumption. Front. Mar. Sci. 9:1096108. doi: 10.3389/fmars.2022.1096108
Received: 11 November 2022; Accepted: 22 December 2022;
Published: 12 January 2023.
Edited by:
Siyuan Ye, Qingdao Institute of Marine Geology (QIMG), ChinaReviewed by:
Xiaoguang Ouyang, Southern Marine Science and Engineering Guangdong Laboratory (Guangzhou), ChinaBin Zhao, Ocean University of China, China
Copyright © 2023 Cao, Huang, Zhao, Li, Wang, Lin and Zhu. This is an open-access article distributed under the terms of the Creative Commons Attribution License (CC BY). The use, distribution or reproduction in other forums is permitted, provided the original author(s) and the copyright owner(s) are credited and that the original publication in this journal is cited, in accordance with accepted academic practice. No use, distribution or reproduction is permitted which does not comply with these terms.
*Correspondence: Hong Huang, aGh1YW5nQHNob3UuZWR1LmNu; Zhuo-Yi Zhu, emh1LnpodW95aUBzanR1LmVkdS5jbg==
 Yu Cao1
 Hong Huang
 Xu Zhao