 Chao Li
 Jian-ling Huo
 Yu-ze Song1,2,3
- 1Offshore Observation Department, National Ocean Technology Center, Tianjin, China
- 2Key Laboratory of Marine Ecological Monitoring and Restoration Technologies, Ministry of Natural Resources, Shanghai, China
- 3Key Laboratory of Ocean Observation Technology, Ministry of Natural Resources, Tianjin, China
Nowadays, nuclear power plays an important role in the energy structure of many countries. However, A bloom of a disaster-causing organism (DCO) in the cold-water intake area of a coastal nuclear power plant can block the water cooling system and seriously affect the operational safety of the nuclear power unit. Currently, the traditional method of protection is to estimate the DCO abundance by regular manual investigation and sampling, but that method cannot give continuous real-time data. Instead, proposed and implemented here is a seafloor in situ integrated monitoring system for DCOs (known as IMSDCO), which is equipped with an optical microscopic imager (OMI) and hydrometric sensors to monitor automatically the DCO abundance and hydrology. All the data are transmitted to a terminal in the shore station through a photoelectric composite cable for real-time display. When the DCO abundance reaches a preset threshold, software automatically raises an alarm. Since placing IMSDCO at the cold-water intake of the Changjiang nuclear power plant, a six-month field trial has been completed, during which large amounts of hydrology data and DCO images were obtained. IMSDCO successfully identified and estimated the abundances of various DCOs (e.g., Phaeocystis globosa, Acetes chinensis, and small fish) and predicted their movements based on hydrology data. Based on the analysis of the experimental data, we discussed the reasons for the error in the abundance estimation of DCO and the methods to reduce the error. The experimental results show that the OMI-based IMSDCO can monitor and give early warning of DCOs in the water intake areas of costal nuclear power plants and is worthy of long-term deployment.
1 Introduction
As a high-efficiency, energy-saving, and eco-friendly energy source, nuclear power plays an important role in reducing carbon dioxide emissions, controlling the greenhouse effect, and promoting carbon neutrality (Deng, 2021). To date, more than 30 countries have built nuclear power plants, and nuclear power accounts for an important proportion of the domestic energy structure of the United States, Britain, Russia, and especially France, where it accounts for more than 70% (Chen and Xia, 2017; Xu, 2020; MOC, 2021). By the end of 2020, there were 48 nuclear power units in operation and 17 nuclear power units under construction in mainland China, with nuclear power accounting for ca. 5% of the national cumulative power generation and growing annually (Zhang, 2021; CNEA, 2021).
Most nuclear power plants are built in coastal areas, where the excess heat from the power generation process is taken away by the cyclic seawater to ensure stable operation of the nuclear power units. Therefore, the water quality of its cold-water intake directly affects the operational safety of a nuclear power plant. However, with the over-exploitation of marine resources by humans, the marine ecological environment is deteriorating day by day, and the resulting frequent blooms of algae, jellyfish, fish, shrimp, snails, and other marine organisms can block the intercept net at the water intake of a nuclear power plant, thereby seriously threatening its operational safety (Purcell et al., 2007; Azila and Chong, 2010; Ruan, 2015; Zhang et al., 2019). Since 2000, there have been more than 200 unit outages due to cooling-water blockages in many countries with nuclear power plants, causing major safety hazards and huge economic losses (Han et al., 2018; MEE, 2020), and such incidents are occurring more and more year by year throughout the world.
How to improve the safety of the cold sources of nuclear power plants is now a major common concern of the international nuclear-power community. The United States, France, Japan, South Korea, and other countries have all researched countermeasures for cold-source protection, including strengthening water-quality monitoring, setting up intercept nets, and enhancing the backwashing capacity of drum nets (Meng et al., 2019), which have alleviated the occurrence of such disasters to a certain extent. However, those measures are all based on passive defense and cannot give early warning of an outbreak of a marine disaster-causing organism (DCO). In recent years, some nuclear power plants in China have used sonar detection technology to monitor DCOs at their water intakes, such as the Daya Bay and Hongyanhe nuclear power plants, which have monitored Creseis acicula and Aurelia aurita (Wang and Fu, 2021; Zeng et al., 2021). However, because sonar echo is particularly vulnerable to near-shore terrain and environment, it is difficult to identify targets, especially tiny plankton.
With the development of optical imaging technology, underwater optical microscopic imagers (OMIs) have been applied to marine-organism monitoring (Jaffe, 2015; Lombard et al., 2019; Liu et al., 2021; Merz et al., 2021). OMIs based on bright-field imaging technology support higher sampling rates, and some research teams in countries other than China have installed them on survey ships and gliders to conduct fish and plankton surveys to obtain images and understand their underwater distribution (Cowen and Guigand, 2008; Picheral et al., 2010; Ohman et al., 2019). However, the disadvantages of a bright-field imager are that its image resolution is poor and its images are easily affected by particles when used in coastal waters (Greer et al., 2016). By contrast, a dark-field imager usually has better resolution but lower sampling rate, making it more suitable for long-term in situ observation at fixed points near the shore (Grossmann et al., 2014). Nowadays, benefitting from the rapid development of image processing technology based on machine learning algorithms, OMIs for underwater in situ online monitoring can automatically and quickly identify the species, size, and abundance of aquatic organisms (Yang et al., 2022), thereby expanding greatly the application field of OMIs. In China, Bi et al. (Bi et al., 2022) used PlanktonScope to monitor plankton such as copepods, jellyfish, chaetognaths, appendicularians, and meroplanktonic larvae in coastal estuaries, and they researched the primary productivity of estuaries. Also, Li et al. (Li et al., 2022) installed an OMI on a buoy and carried out plankton and water quality monitoring in Dapeng Cove. However, to the best of our knowledge, there have been no reports to date of an OMI being installed on a bottom platform to monitor DCOs at the water intake of a nuclear power plant.
The integrated monitoring system for DCOs (known as IMSDCO) that is reported herein is equipped with an OMI, which can quickly identify marine organisms with sizes of between 500 µm and 20 mm via its auto-zoom capability and then generate high-resolution two-dimensional images. Also, IMSDCO is equipped with multiple hydrological and water quality sensors, including an acoustic Doppler current profiler (ADCP), a conductivity–temperature–depth (CTD) sensor, a tidal meter, and two multi-parameter water-quality detectors (pH, dissolved oxygen, temperature, and conductivity).It can monitor DCO quantity, current, temperature, salinity, depth, and water-quality parameters in real time, estimate the abundances of DCOs, and predict their migration tracks algorithmically. The system was placed at the cold-water intake of the Changjiang nuclear power plant in Hainan Province in China, and the monitoring results were displayed in real time via PC software to achieve long-term DCO monitoring and quantitative evaluation. The cooling water of Changjiang nuclear power plant is surface water intake from open channel. Three intercept nets are set around the water intake, and IMSDCO is placed on the seabed 800m away from the third net, which is about 1500m away from the water intake. This distance can ensure that the nuclear power plant has enough time to take countermeasures after discovering the outbreak of the DCOs.
2 Materials and methods
2.1 Design of IMSDCO
IMSDCO comprises a shore station, a photoelectric composite cable, an underwater node, and scientific sensors, as shown in Figure 1. Equivalent to the brain of IMSDCO, the shore station is responsible for power supply, communication, data collection and storage, and human–computer interaction functions to ensure the safe and stable operation of the system. Also, the communication system in the shore station is connected to the public Internet so that authorized users can access IMSDCO from anywhere. The photoelectric composite cable connects the shore station and the seabed monitoring system and is the channel for power supply and communication between them. The underwater node is a platform equipped with scientific sensors, and the electronic cabin thereon provides appropriate power supply and communication interfaces for the sensors. Also, the mooring structure is designed to monitor the sea water profile.
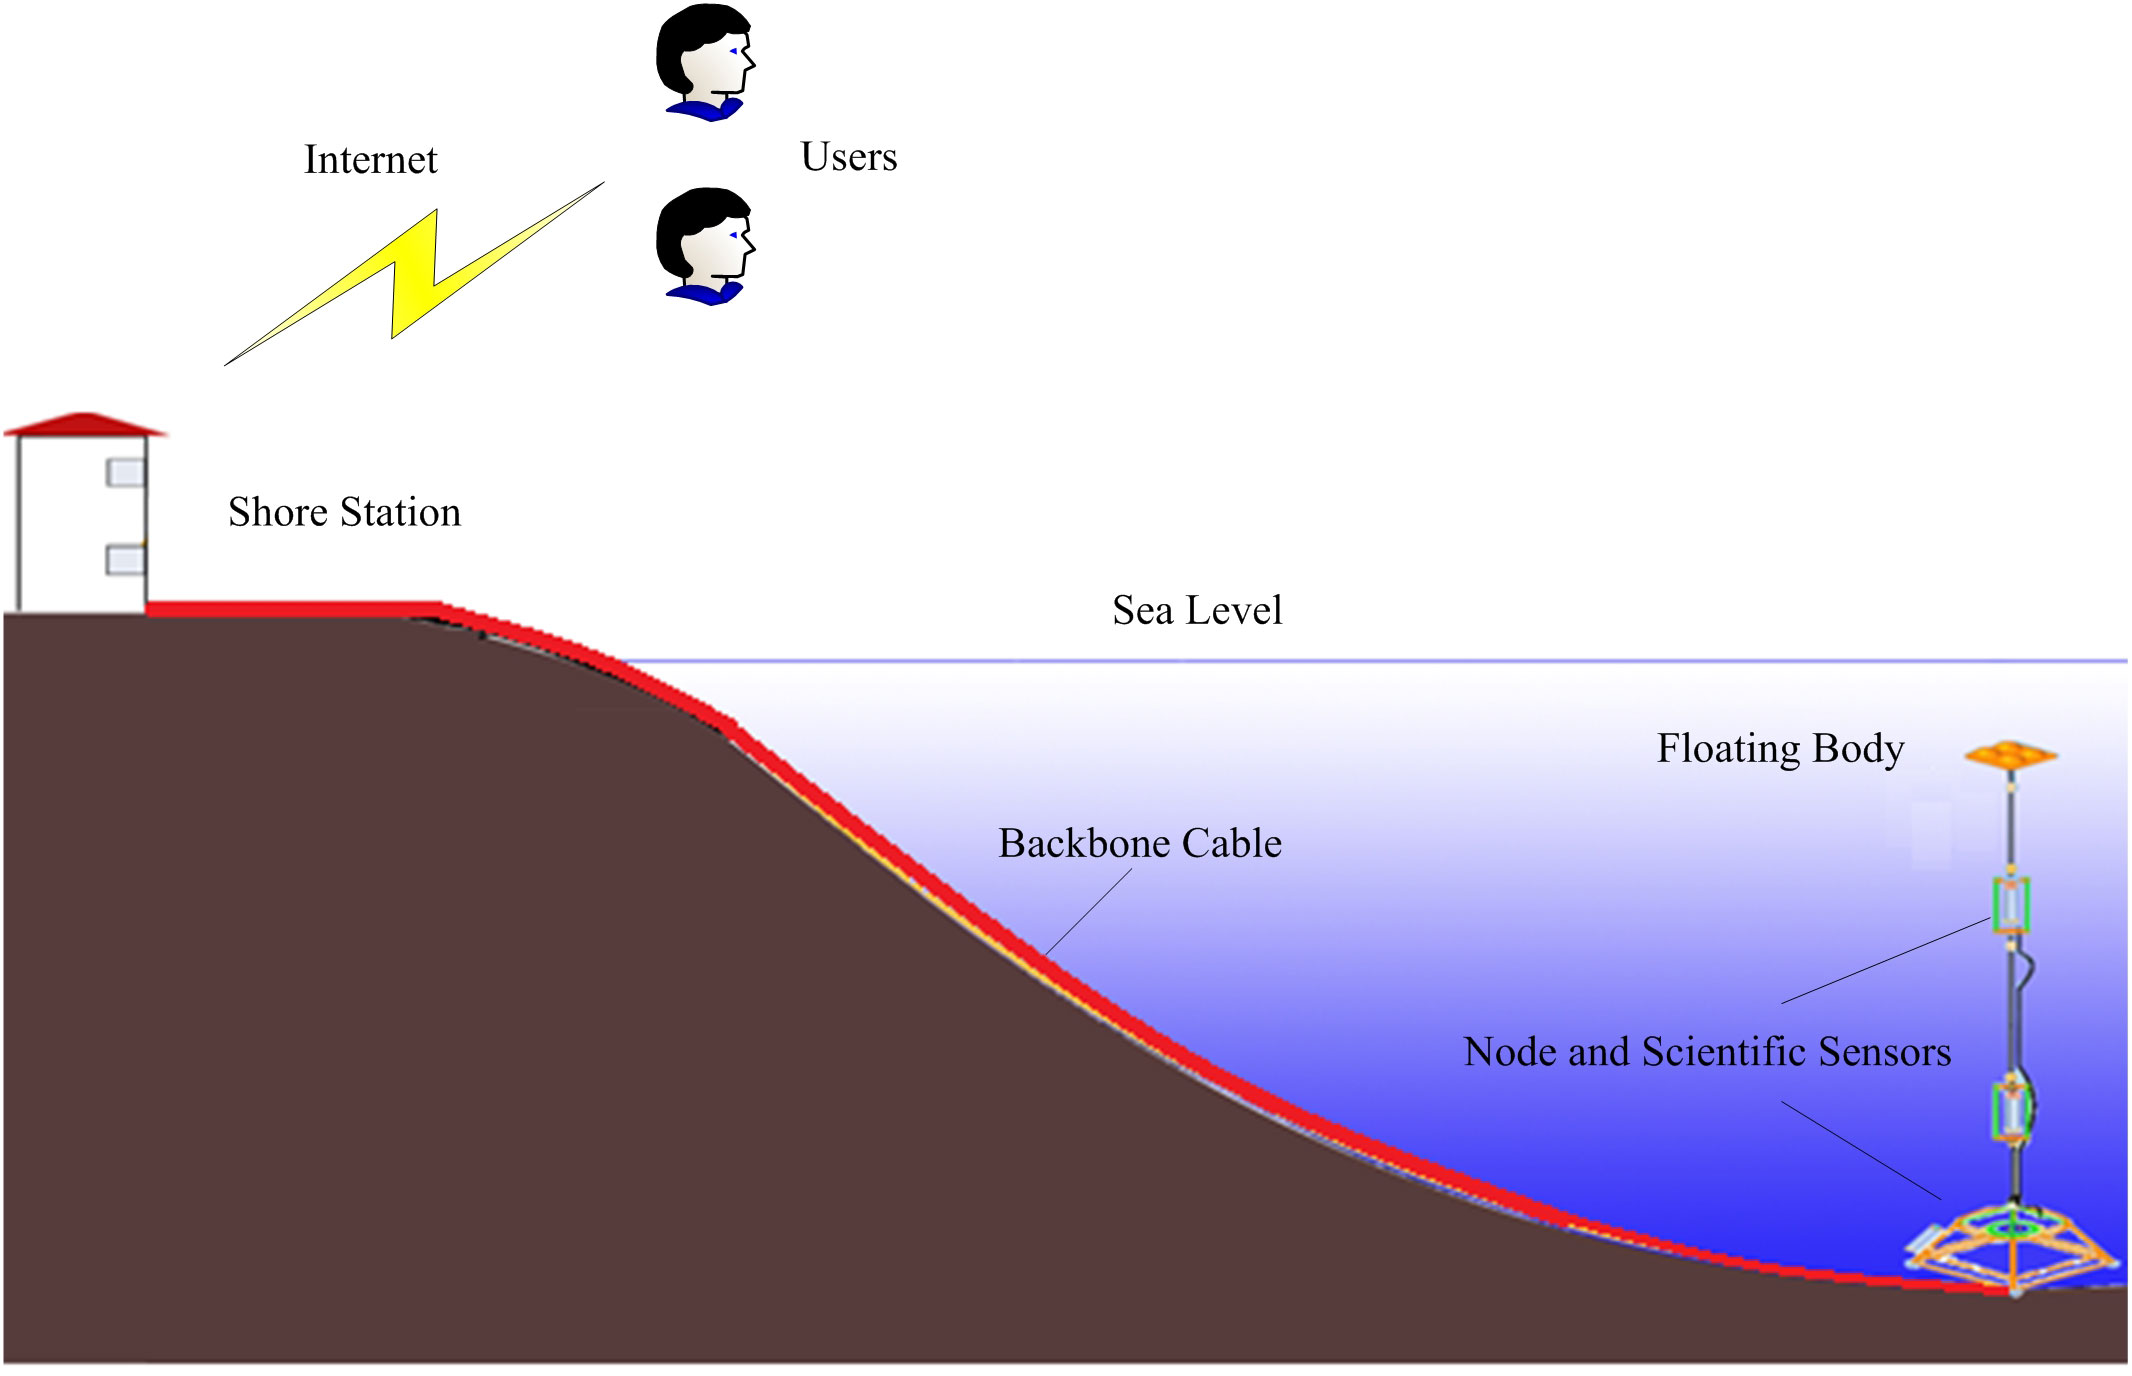
Figure 1 Overview of integrated monitoring system for DCOs (IMSDCO).
2.2 Power supply system
The submarine environment is complex and changeable, and a reliable power supply for IMSDCO is very important. Alternating current (AC) transmission requires highly insulated cables that form a large equivalent capacitance with seawater and earth, thereby increasing the reactive power loss; therefore, the power loss of long-distance AC transmission is serious without inductance compensation. Compared with AC transmission, although direct current (DC) transmission also has capacitance to ground, its ripple voltage is small, the voltage is stable in the steady state, and the reactive power loss is small; therefore, DC transmission is more economical and stable (Howe et al., 2002; Yu et al., 2013).
The DC power supply of the shore station converts 220-V AC into 375-V DC and then transmits it to the electronic cabin of the underwater node through the photoelectric composite cable. The electronic cabin has one input port and six output ports: the input port can adapt to the voltage range of 275–425 V, while the output ports comprise two 24-V ports and four 12-V ports, each of which is connected to a different scientific sensor. The logic diagram of the power supply system is shown in Figure 2. After the 375-V DC enters the electronic cabin through the input port, it first passes through a surge-protection device to suppress any surge current on the line that would otherwise damage the circuit components. A DC/DC converter converts 375-V DC into 24-V and 12-V DC and supplies power to the communication system, the external scientific sensors, and the internal sensors (temperature, humidity, and water leakage) through the state monitoring and control system.

Figure 2 Diagram of power supply system of electronic cabin.
The surge-protection device is very important for the stable operation of the power supply system. Under the influence of the equivalent capacitance in the circuit, the instantaneous current is very large at the moment of power on; this exposes the circuit components to great potential safety hazards and so must be limited (Du et al., 2018). The principle of the surge-protection device is shown in Figure 3. Resistor R1 with an appropriate resistance is connected in series in the circuit, and relay KT1 is connected in parallel with R1. After power on, R1 limits the surge current in the circuit within a reasonable range, thereby suppressing it. After a delay of few seconds, a control signal from the state monitoring and control system closes KT1 to short R1, thereby reducing the power loss thereon. The filter and capacitor C1 are used to smooth the peak voltage so that the components can avoid the impact of surge voltage. Also, the monitor behind the surge-protection device monitors the voltage and current in real time and inputs the monitoring data to the state monitoring and control system, which are finally displayed by the PC software in the shore station.
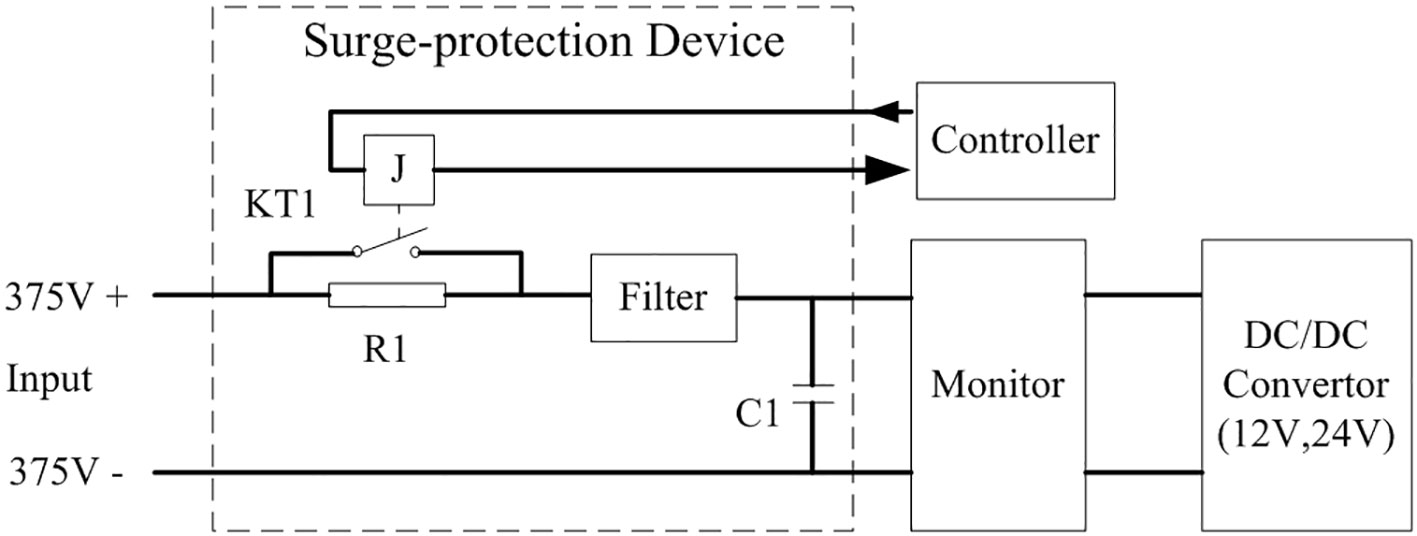
Figure 3 Schematic of surge-protection device.
The DC/DC converter has eight outputs that are isolated from each other: two for internal loads and six for the loads of the external scientific sensors. Based on the voltages required by the loads, the output voltages are 12-V and 24-V: the 12-V module (model V375C12T75BL; VICOR Company) has a power of 75-W, and the 24-V module (model V375C24T150BL; VICOR Company) has a power of 150-W. The two power modules are small in size, high in power density, and stable in performance, making them very suitable for use in the narrow confined spaces of underwater monitoring systems. When operating, the power modules generate a lot of heat that must be conducted into the seawater by radiators to ensure stable operation for a long time (Li et al., 2016). The radiators are made of aluminum, which has a high thermal conductivity. As shown in Figure 4, the inner surface of a radiator is planar for fixing power modules, and the outer surface is curved with the same radius as that of the inner wall of the cylindrical pressure vessel. Four symmetrically distributed radiators are connected into a cylindrical shape by a mechanical structure, and a threaded support element is installed in the middle of the cylinder; after the radiators are installed in the pressure vessel, the rotatable part of the threaded support is rotated clockwise manually, and the support element presses two of the symmetrical radiators tightly against the inner wall of the pressure vessel for rapid heat transfer to the seawater. The other two symmetrical radiators are held in place in the same way. For more-effective heat conduction, silicone grease is applied on the outer arc surfaces of the radiators to make them fit more closely.
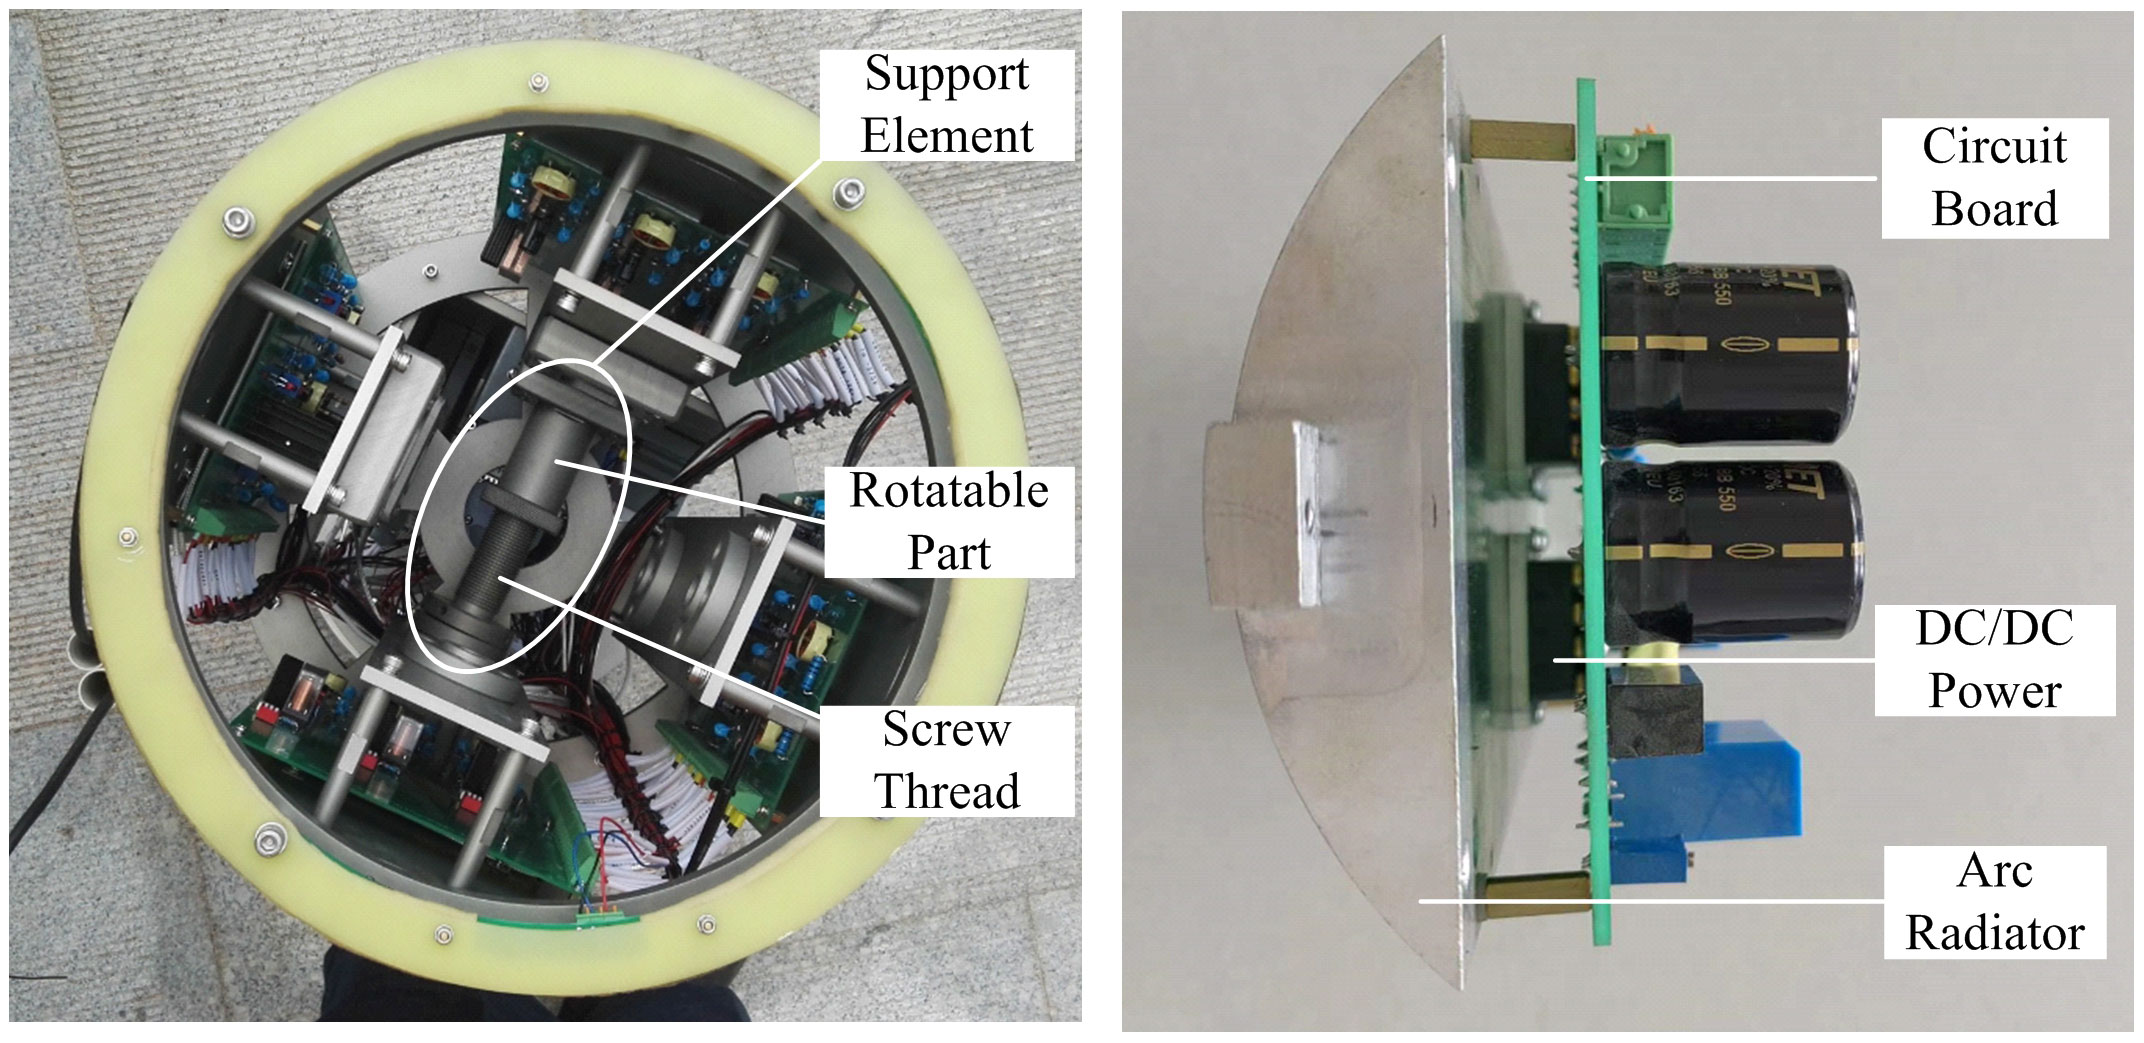
Figure 4 Mounting structure for radiator.
2.3 State monitoring and control system
The state monitoring and control system has two main functions: (i) monitor the data from the internal sensors and the voltage and current of each output port in real time; (ii) control the power outputs of the output ports via the PC software, which can automatically isolate local faults in an emergency (e.g., short circuits and reduced insulation performance of an port). The core unit of the state monitoring and control system is a micro-controller chip (MSP430F149; Texas Instruments) with the characteristics of low operating voltage, ultra-low power consumption, flexible expansion, and high reliability (Song et al., 2012). As shown in Figure 5, the MSP430F149 has two RS-232 serial communication ports: one connected to the communication system, the other connected to the load monitoring module. The MSP430F149 has 48 input/output ports in total, but we use only nine of them, with the others being spare. Of the nine used ports, six are connected to the control circuit on the load monitoring module to control the power supply of the external scientific sensors, and the other three are connected to the temperature and humidity sensor, the water-leakage monitoring sensor, and the surge-protection device.
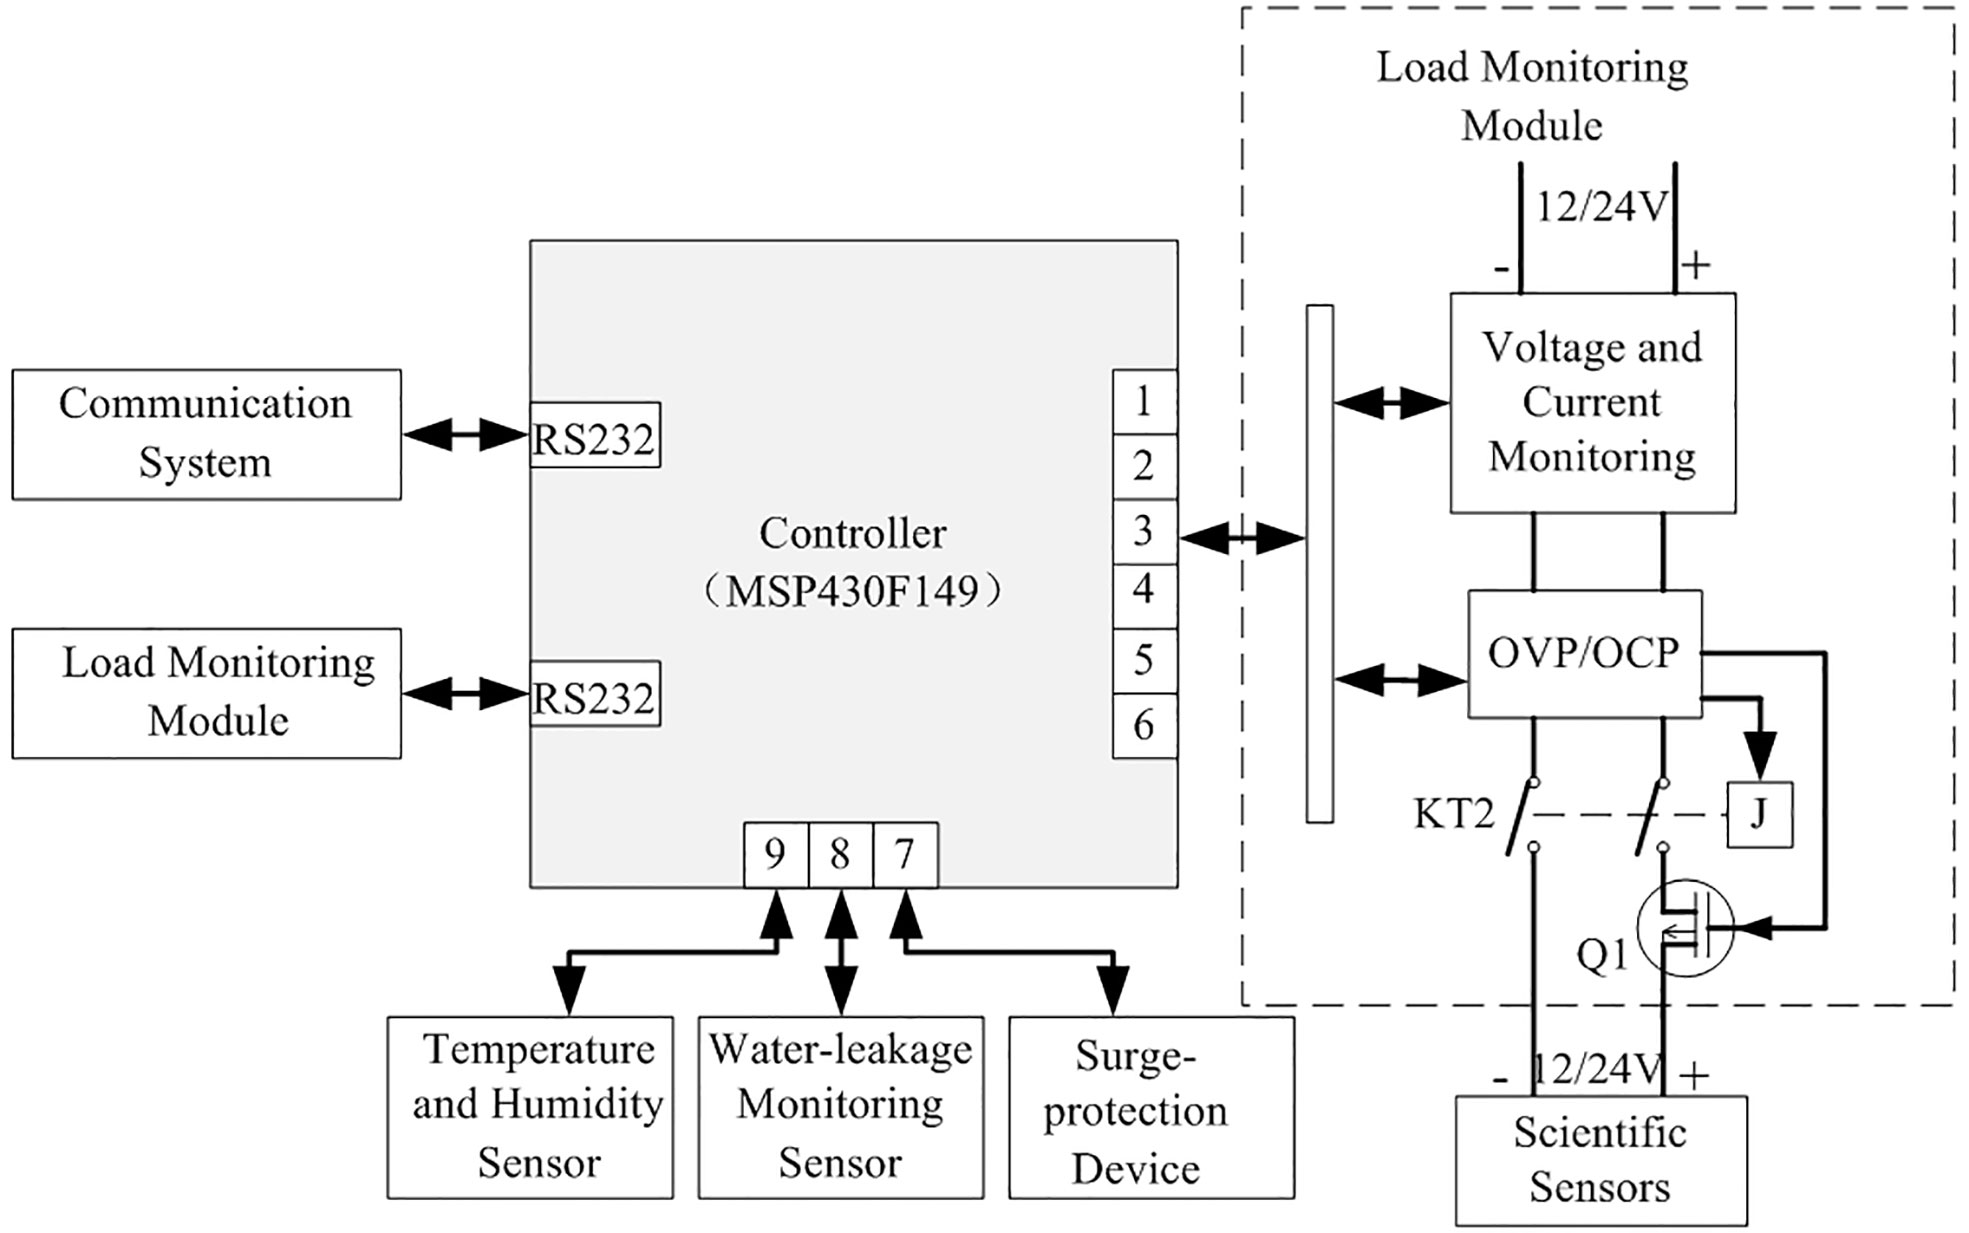
Figure 5 Block diagram of state monitoring and control system.
To ensure stable operation of the scientific sensors, the load monitoring module must keep the supply voltage and current within safe and reliable ranges. As shown in Figure 5, the six circuits are isolated from each other, and each circuit is equipped with voltage and current monitoring and over-voltage protection (OVP) and over-current protection (OCP) functions. The voltage and current monitoring monitors the instantaneous voltage and current on the circuit and triggers OVP and OCP if they exceed their preset values; the controller then immediately disconnects the scientific sensor from the power supply through the control actuator, which comprises MOSFET (metal–oxide–semiconductor field-effect transistor) Q1 and electromagnetic relay KT2 in series. The MOSFET has the characteristic of fast switching and can be used as a power switch to control the load circuit, but it cannot achieve absolute electrical isolation. Although the electromagnetic relay can achieve electrical isolation, the contact is prone to arc discharge when it acts with load; in particular, there is a possibility of action failure in the case of high voltage and current (Lin et al., 2011). Therefore, the MOSFET and electromagnetic relay are connected in series to realize their complementary performance and improve the reliability of the actuator. Their working logic is as follows: under normal conditions, when supplying power to the scientific sensors, KT2 is first connected, then the conduction of Q1 is controlled after a delay of several milliseconds; by contrast, in the case of OVP or OCP, Q1 is stopped, then KT2 is disconnected after a delay of several milliseconds.
2.4 Communication system
The communication system of IMSDCO is via optical-fiber Ethernet communication based on TCP/IP (Transmission Control Protocol/Internet Protocol). The communication system architecture is shown in Figure 6. The shore-station communication system comprises a switch and a server running the communication system software. The switch is a network managed industrial optical Ethernet switch (EDS-G509-T; MOXA Company), which supports web management and SNMP (Simple Network Management Protocol) to achieve optimal network settings, and the IP addresses of the ports are set through the configuration software. The communication system in the underwater node comprises a switch and a serial-port server; it realizes communication between the shore station and the controller in the node and serves as a transit station for communication between the shore station and the scientific sensors. The uplink of the switch (EDS-480A-T; MOXA Company) is connected to the shore station through optical fiber, and the downlink is connected to the OMI and the serial-port server based on TCP/IP through twisted-pair cable. The serial-port server (NPort 5650I-8-DT; MOXA Company) connects the scientific sensors based on the RS-232 serial-port communication protocol, which converts the serial-port communication protocol into TCP/IP to achieve bidirectional transparent transmission of data. Also, the serial-port server supports remote configuration, and each of its ports can be set as an independent virtual IP address via software, so that each scientific sensor can be accessed remotely at the shore station. Based on the communication system with this architecture, authorized users can access the node and the scientific sensors from anywhere through the Internet.
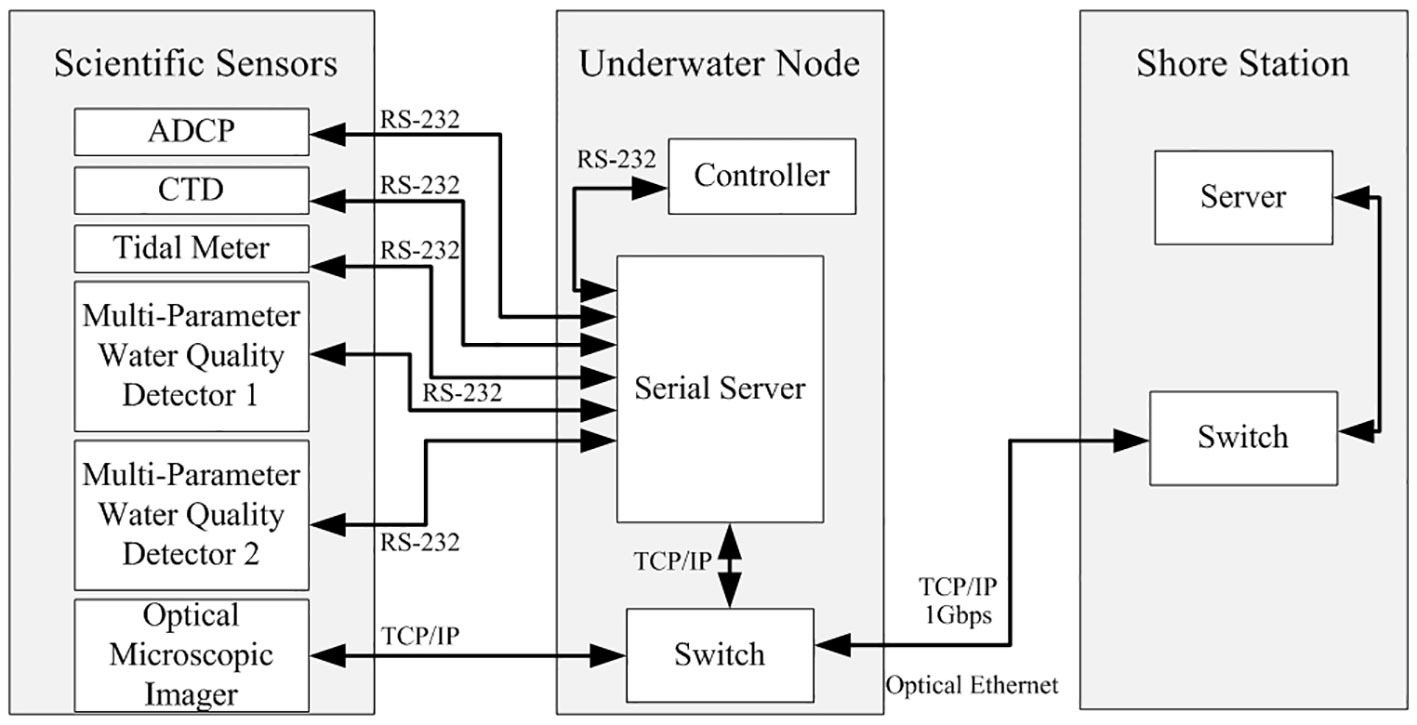
Figure 6 Block diagram of communication system.
2.5 Data acquisition and management system
Six scientific sensors are connected to the underwater node: five of them (ADCP, CTD, tidal meter, multi-parameter water-quality detector 1, and OMI) are installed on the bottom platform; the other (multi-parameter water-quality detector 2) is installed on the mooring structure. The specifications of the scientific sensors are given in Table 1.
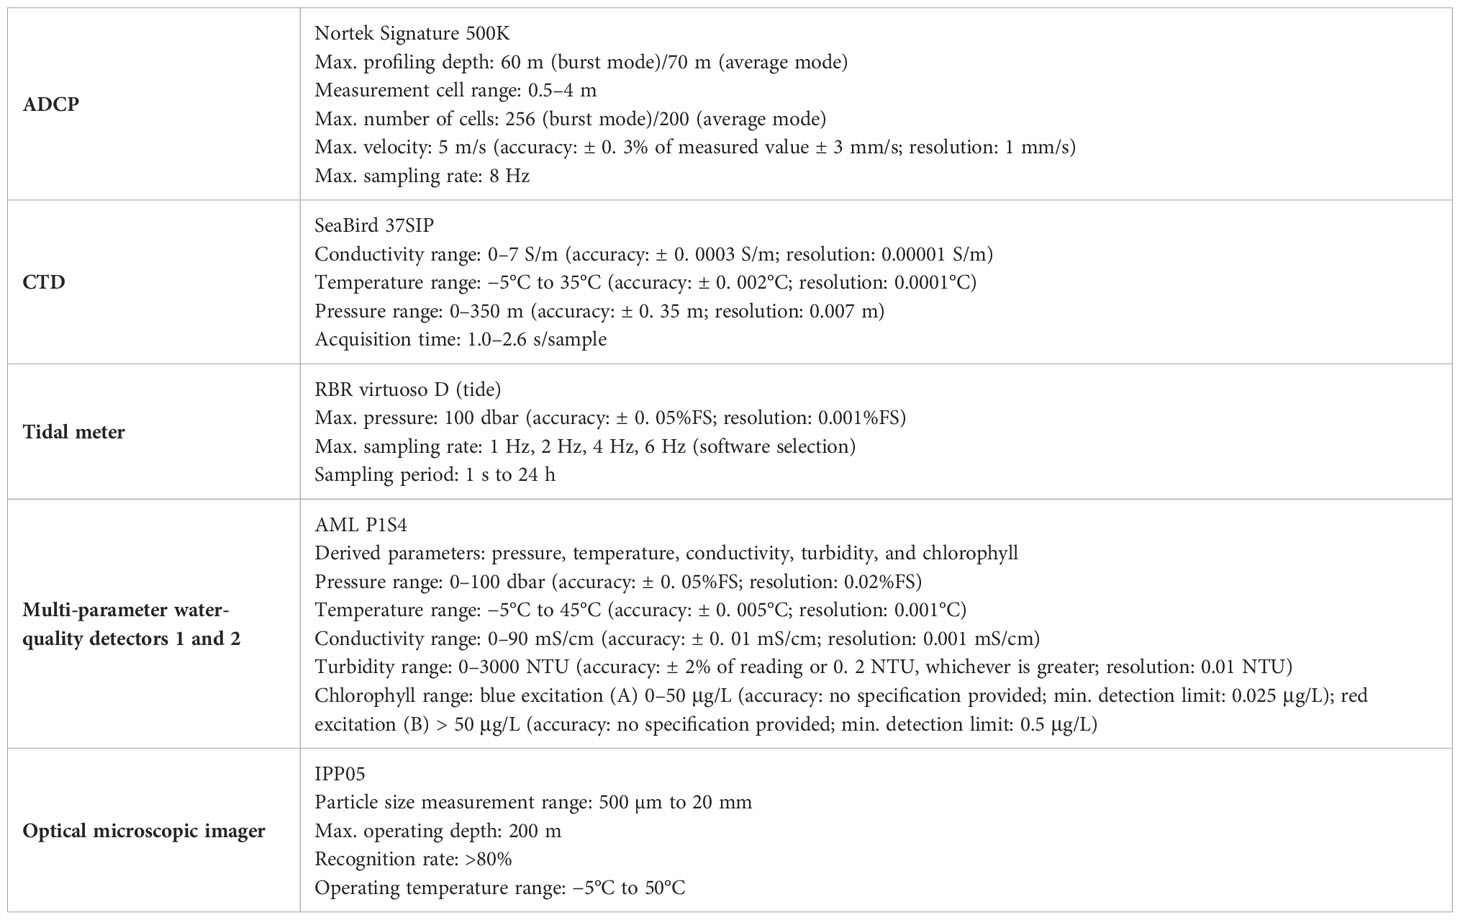
Table 1 Specifications of scientific sensors installed on node.
The hypogynous machine of the data acquisition and management system packages the collected underwater-node operation-status data and scientific-sensor monitoring data and sends them to the PC software in the shore station via the communication system. The function of the PC software is to complete data reception, analysis, storage, and visualization. As shown in Figure 7, the PC software is divided into six core service modules: (i) sensor-driven service, (ii) data collection and distribution service, (iii) quality-control service, (iv) time service, (v) data archiving service, and (vi) data application service. The six modules exchange scientific-sensor data, control instructions, and node operation-status data through message-oriented middleware, and they cooperate to complete the data collection, archiving, distribution, and application. The data acquisition and management system can easily realize various functions, such as user management, permission setting, data query, historical data curve browsing, and instrument maintenance record query, among others.
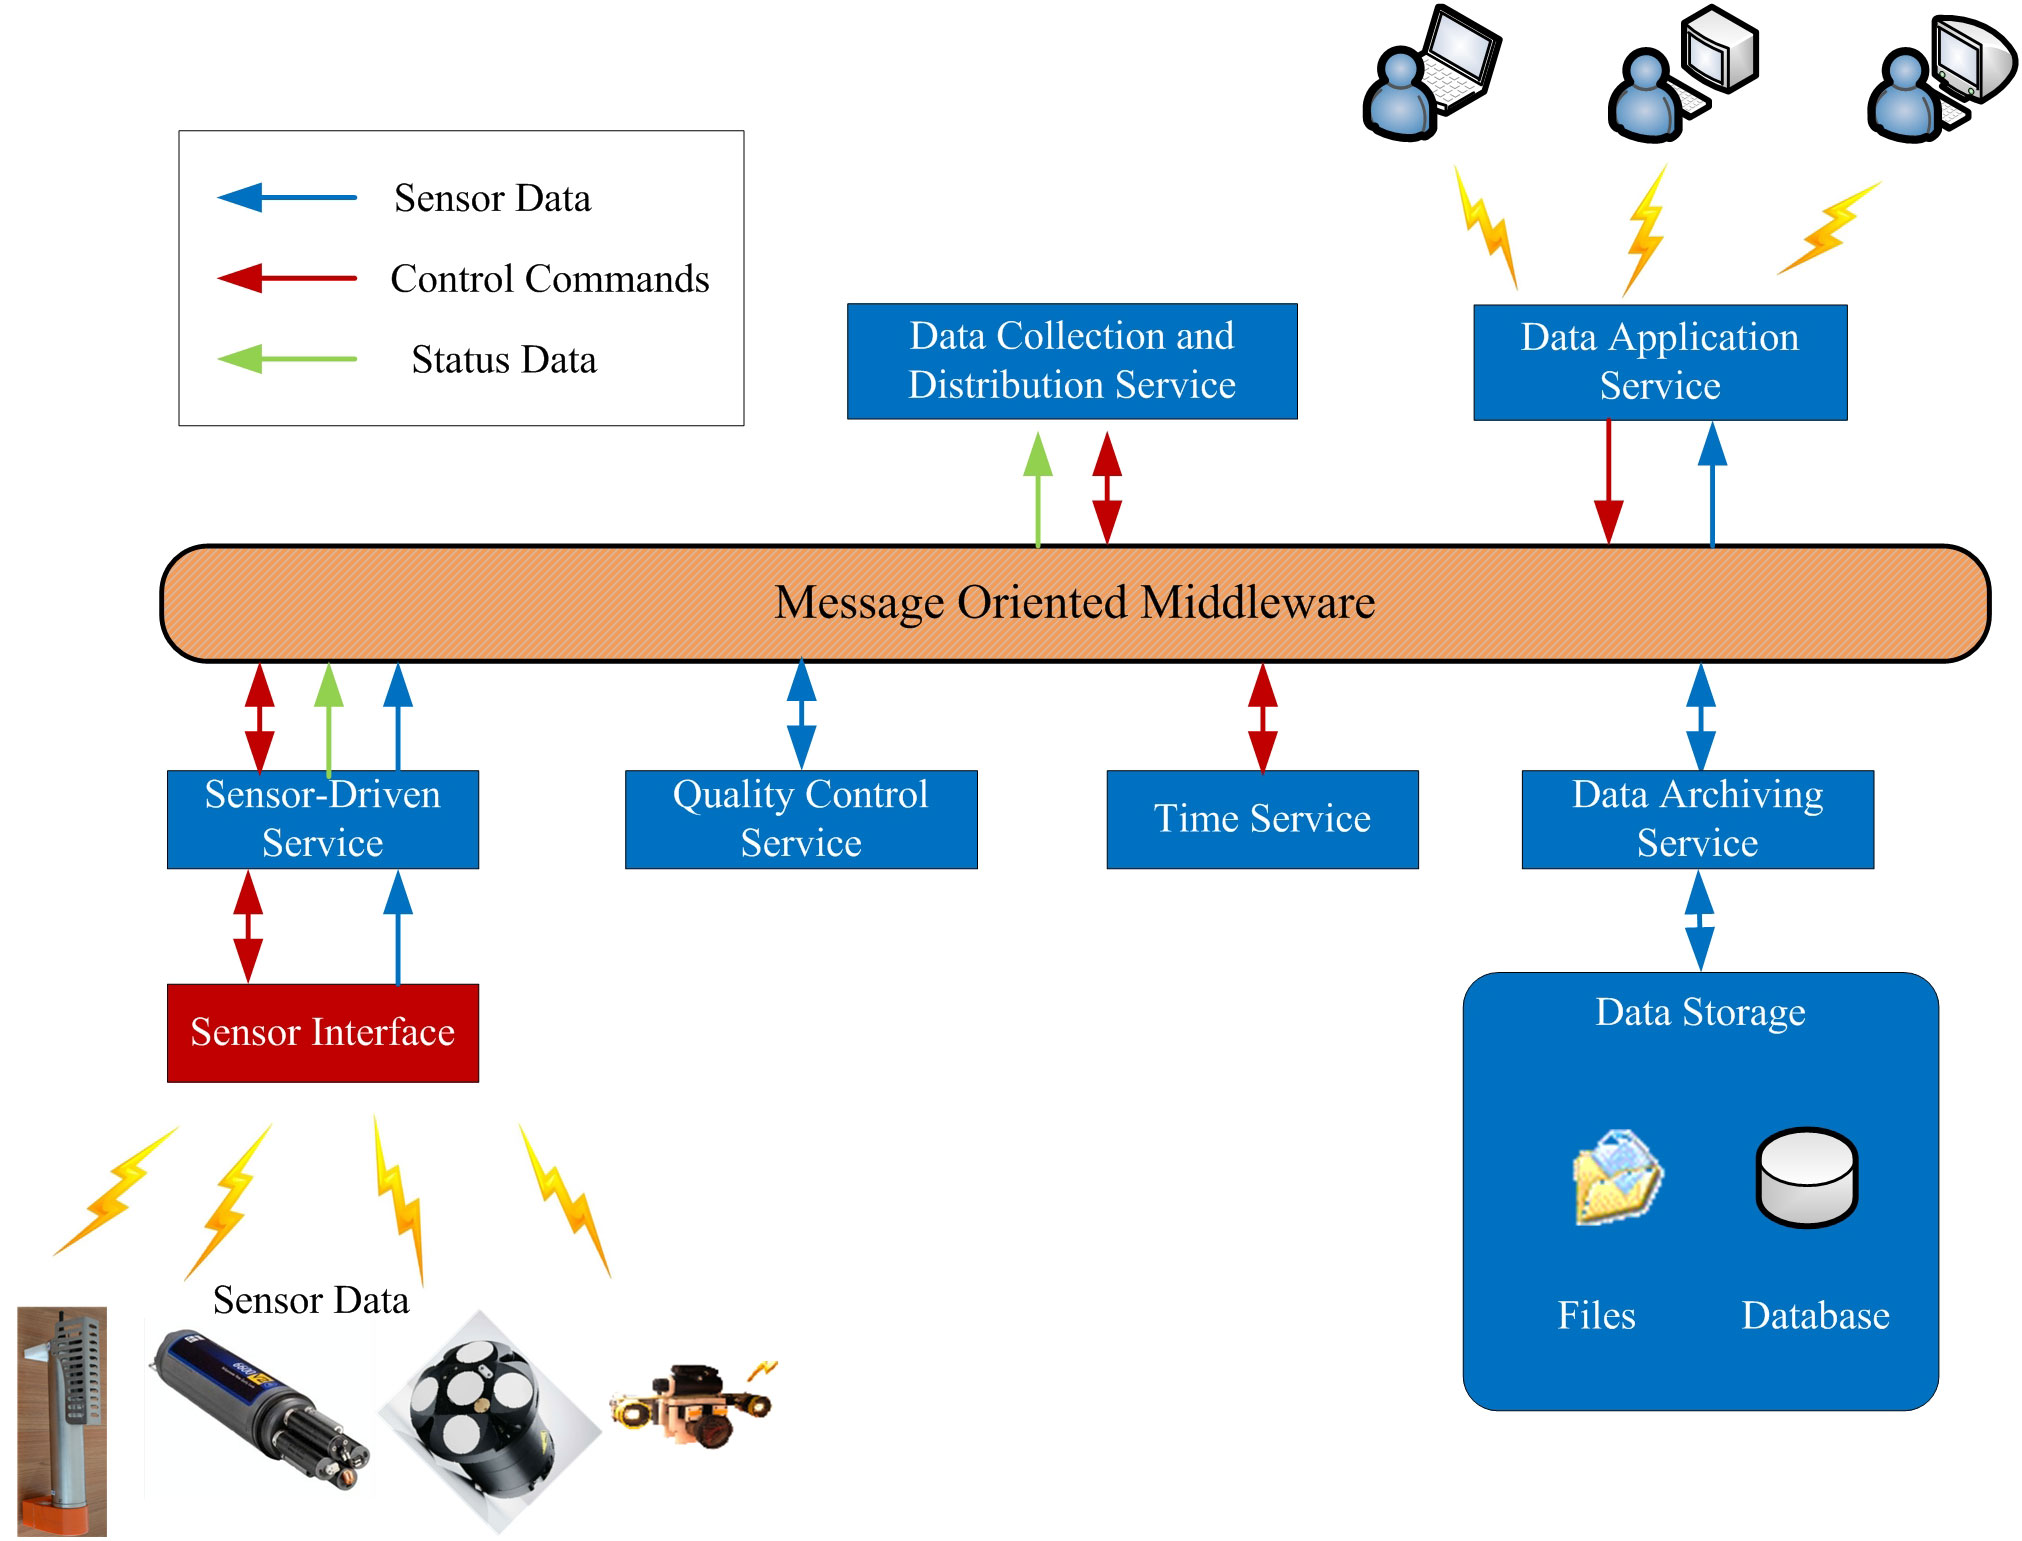
Figure 7 Architecture of data acquisition and management system.
2.6 Deployment
Having designed IMSDCO, it was tested comprehensively in the laboratory and an indoor pool to confirm that all the design specifications and functions were achieved. On 18 September 2021, with the cooperation of partners, the system was deployed at the cold-water intake of the Hainan Changjiang Nuclear Power Plant. The observation node before deployment is shown in Figure 8. We connected the node and the photoelectric composite cable together on the deck of an engineering ship and used the crane on the ship to place the node on the seabed 800 m from the shore at a depth of 15 m. Next, the engineering ship laid the photoelectric composite cable along a preset path to the intertidal zone. The photoelectric composite cable was pulled by people on the shore to the shore station and was connected with the power supply system and communication system after passing through a photoelectric separation box. After a specially assigned person checked and confirmed that the system was connected correctly, we turned on the power supply, switch, server, and other equipment in the shore station, whereupon IMSDCO began to work. The shore station then received data continuously from the underwater scientific sensors, marking the successful deployment of IMSDCO.
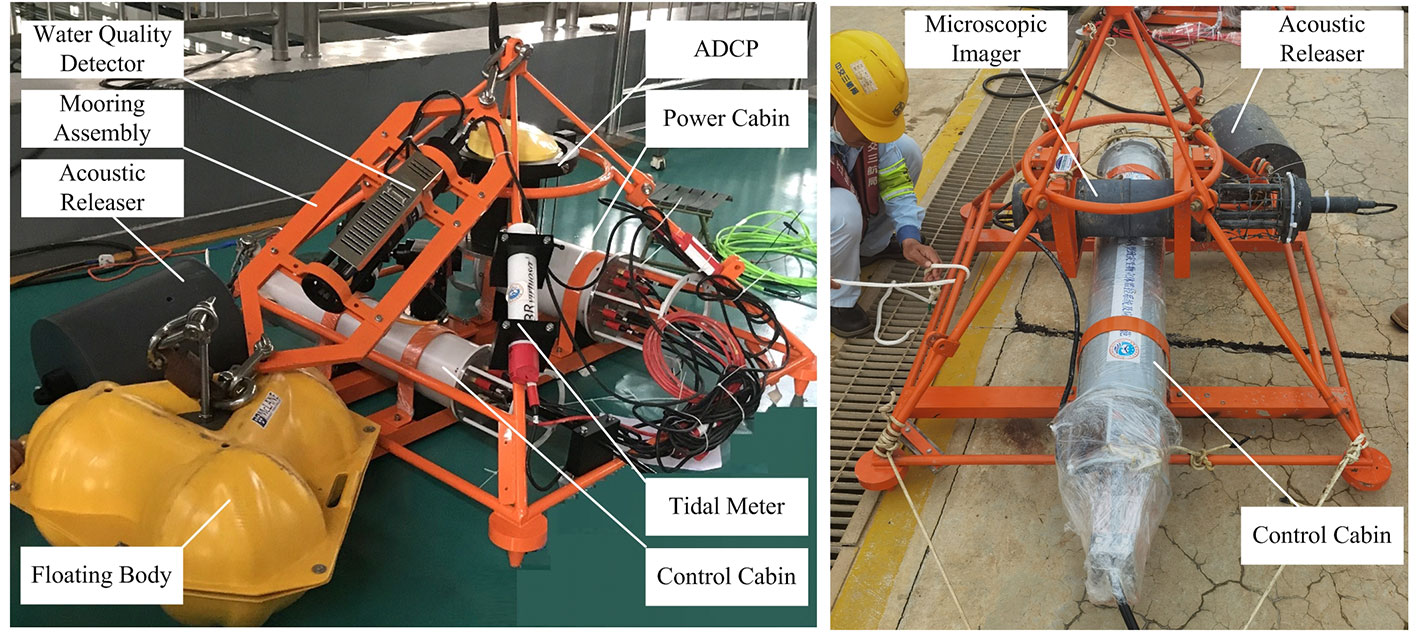
Figure 8 Observation node before deployment.
3 Results and discussion
After deploying IMSDCO, by the end of March 2022 all of its functional modules had been running stably for six months and a large amount of data had been obtained. The 12-V and 24-V voltages output by the DC/DC converter were continuously stable, without over-current, short circuit, or other faults. As shown in Figure 9A, the voltage change was less than 1% even when the load step changed. The state monitoring and control system monitored the voltage, current, radiator temperature, and cabin internal humidity and displayed them via PC software in real time. The communication system had not been interrupted, and the shore station continuously received monitoring data from the scientific sensors and stored them in the database of the data acquisition and management system. Authorized users could access the data at any time, including temperature, salinity, pH, water depth, tide level, ocean current velocity, and images of DCOs. Temperature and salinity data are shown in Figure 9B, and images of DCOs are shown in Figure 10. Based on the data obtained, we used software algorithms to estimate the changes in DCO abundance with time (Figure 11). As shown in Figure 11, large numbers of Acetes chinensis were observed between 00:00 and 09:00, whereas almost none were observed at other times; the reason for this is that the temperature of the sea water near the observation point at night is more appropriate for Acetes chinensis, then when the temperature rises in the day, they migrate to the deep-sea area where the temperature is then more appropriate. Phaeocystis globosa exhibited a similar situation to that of Acetes chinensis, this being because higher temperature is not conducive to forming colonies of Phaeocystis globosa cells (Wang et al., 2021).
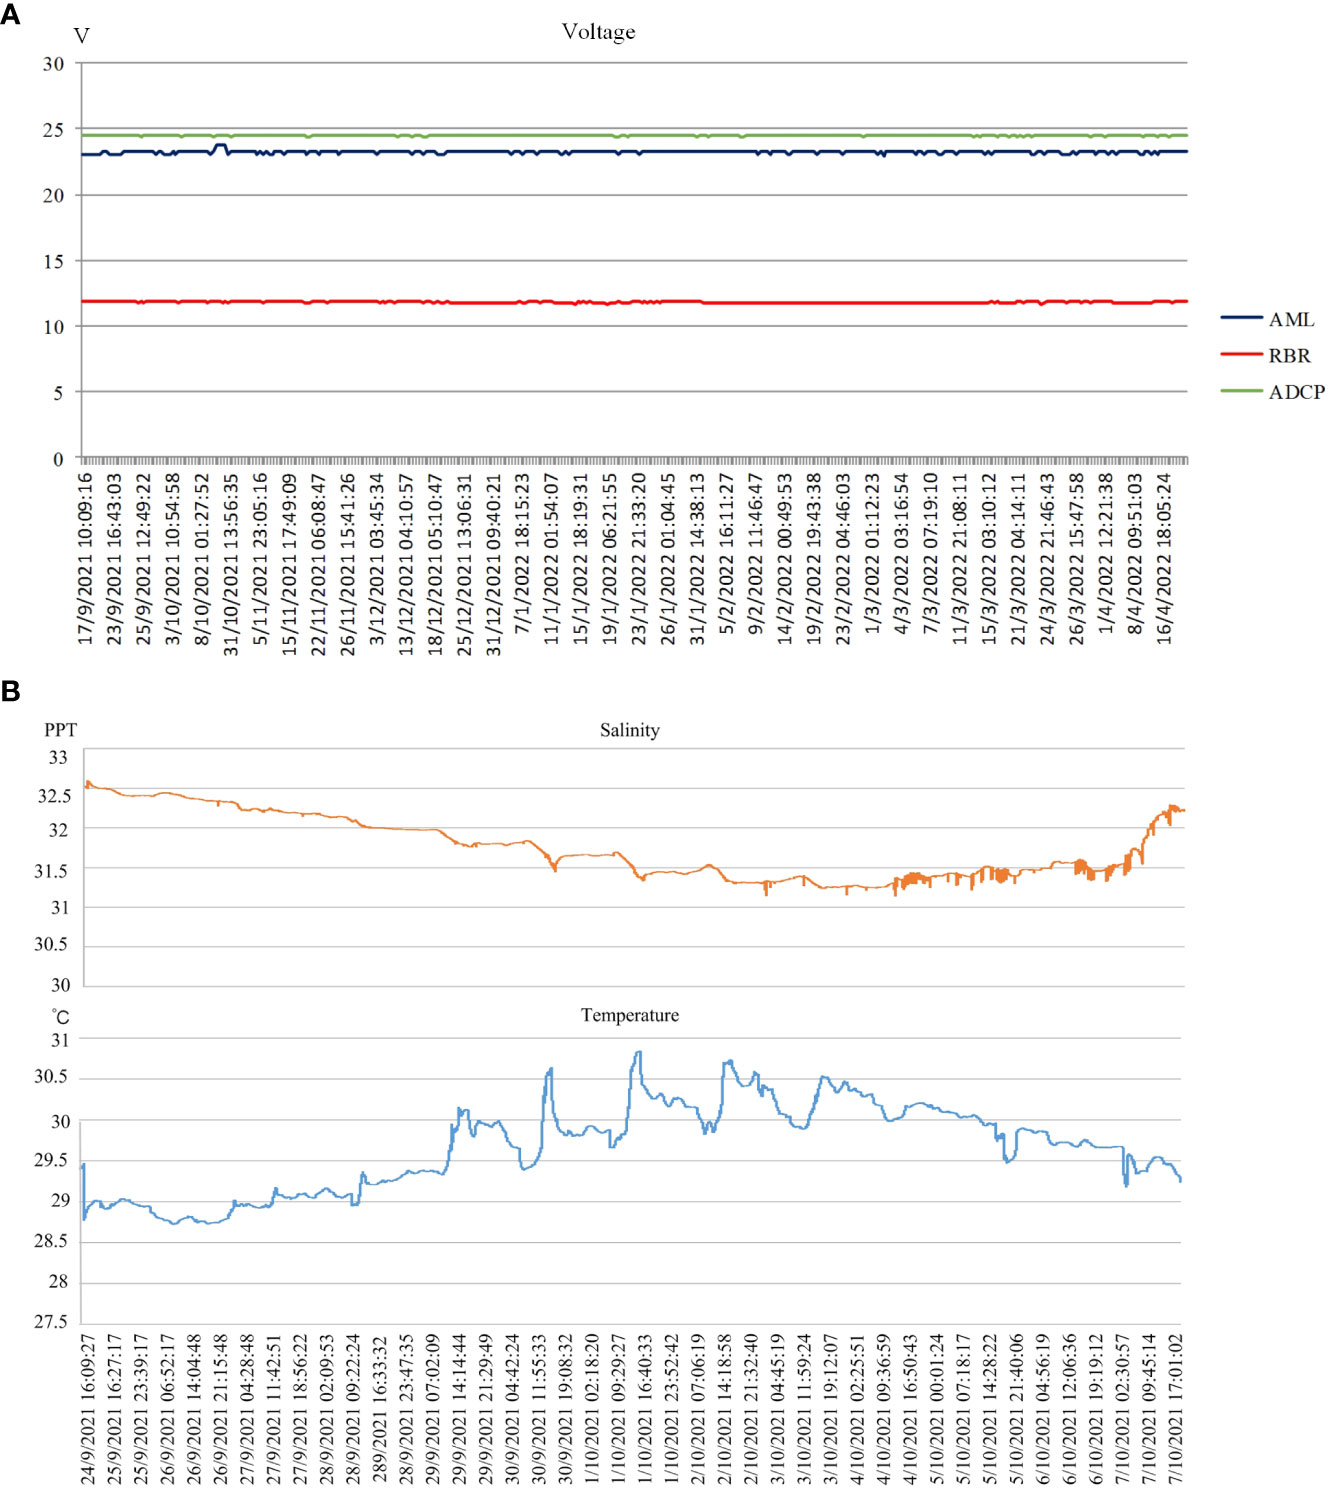
Figure 9 Part of monitoring data:(A) Sensors voltage data;(B) Temperature and salinity data. *Please refer to supplementary material for complete data.
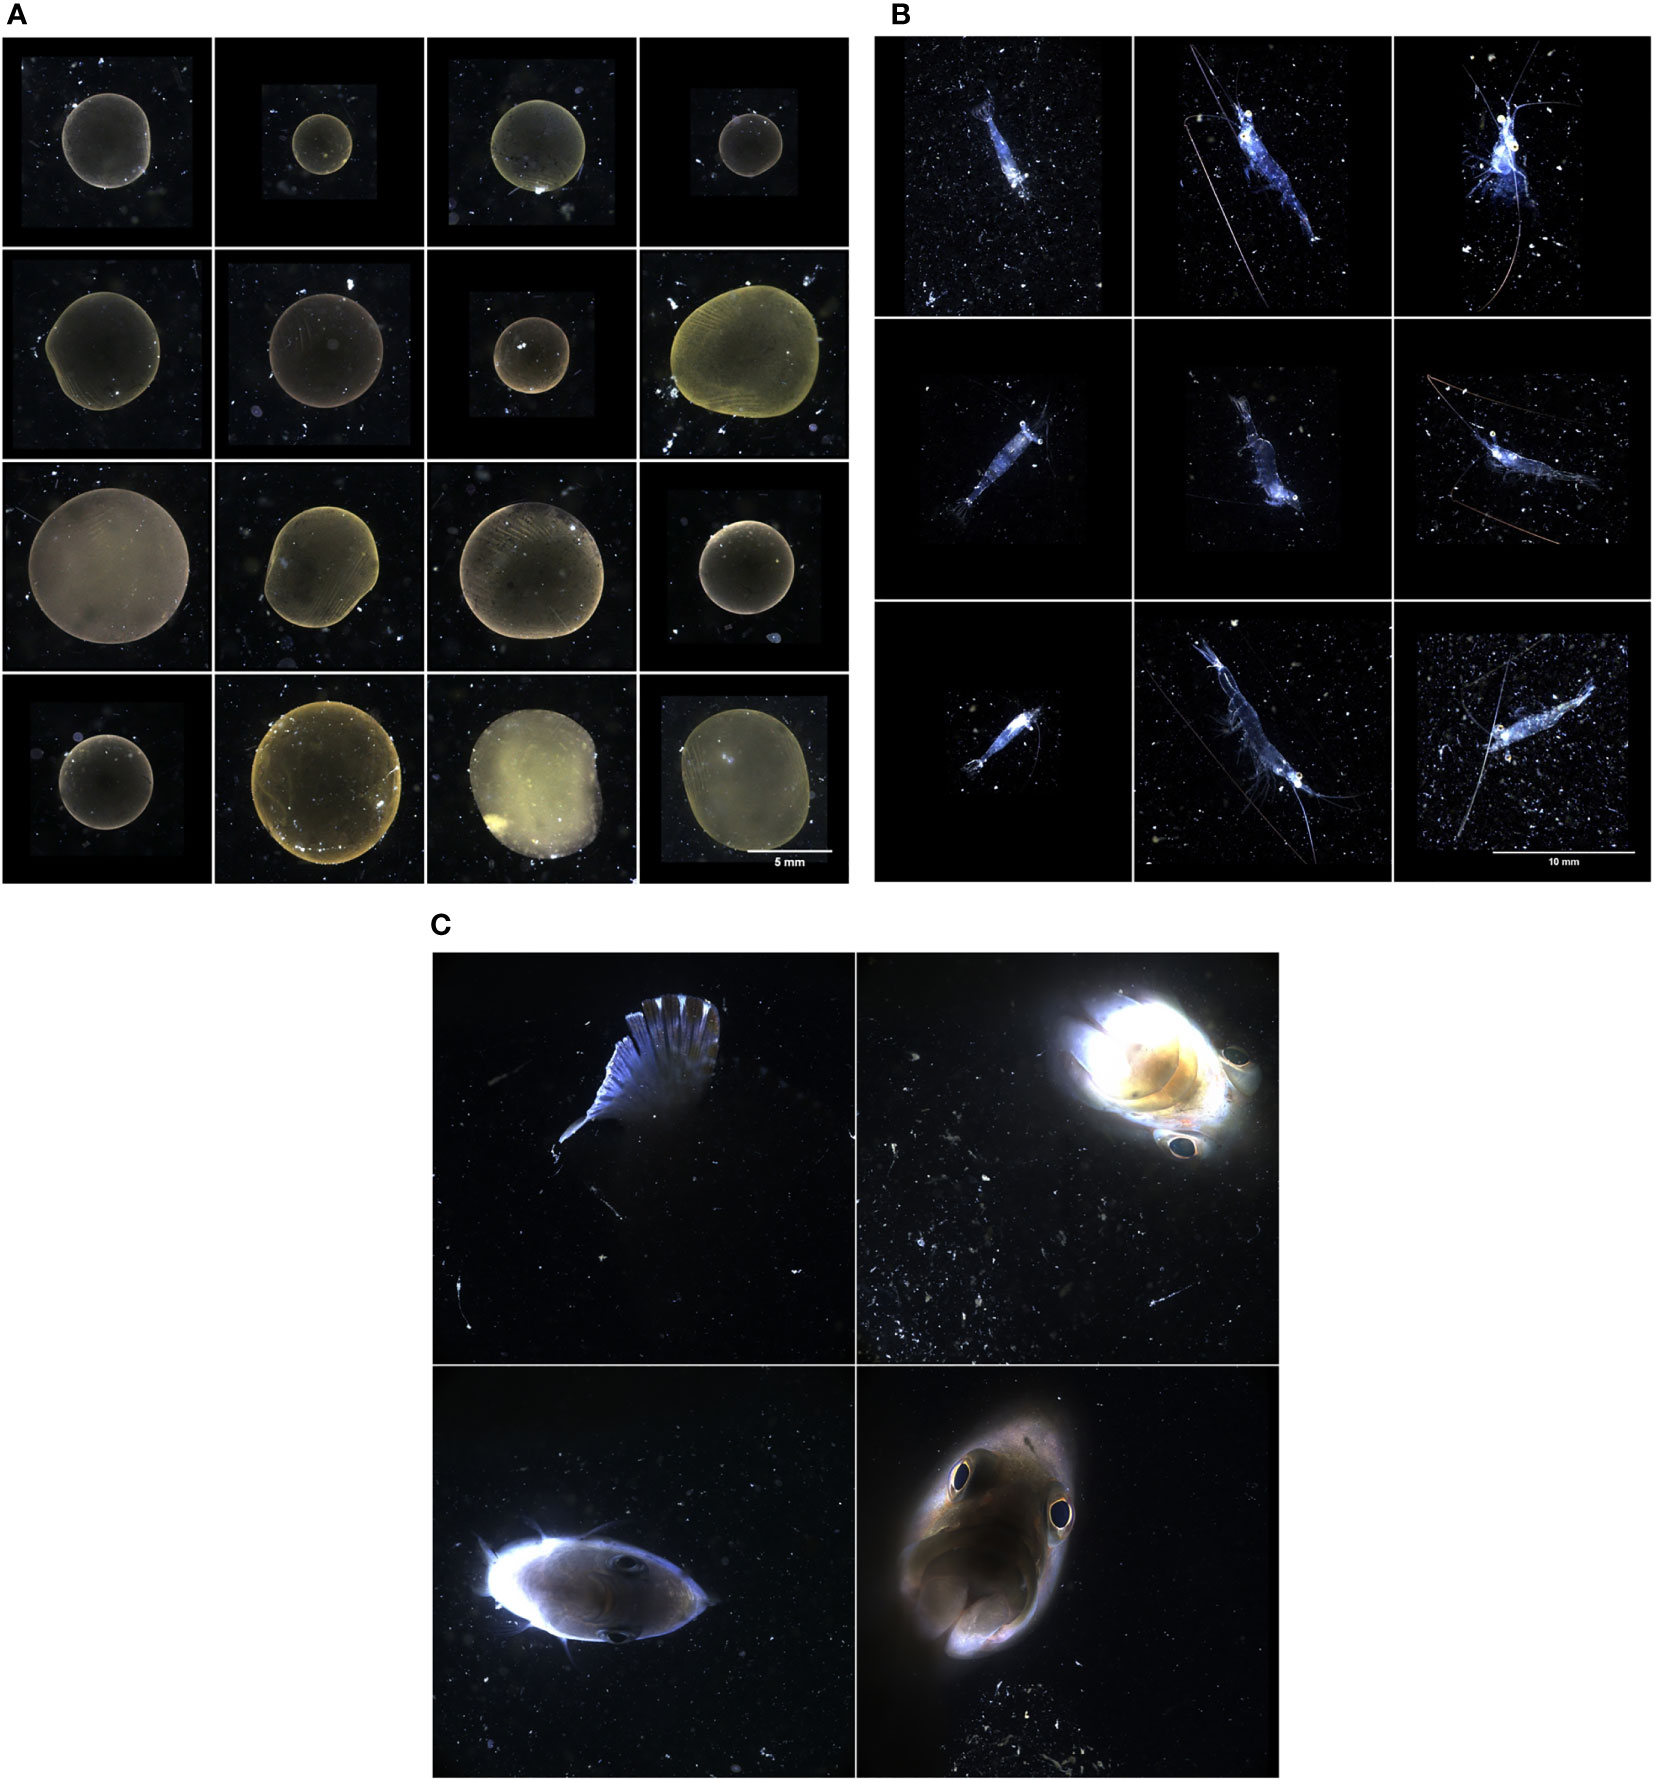
Figure 10 Photographs of some disaster-causing organisms (DCOs):(A) Phaeocystis globosa;(B) Acetes chinensis; (C) small fish. * These pictures are from the team of Dr. Li Jianping from the Shenzhen Institute of Advanced Technology, Chinese Academy of Sciences, who provided the optical microscopic imager.
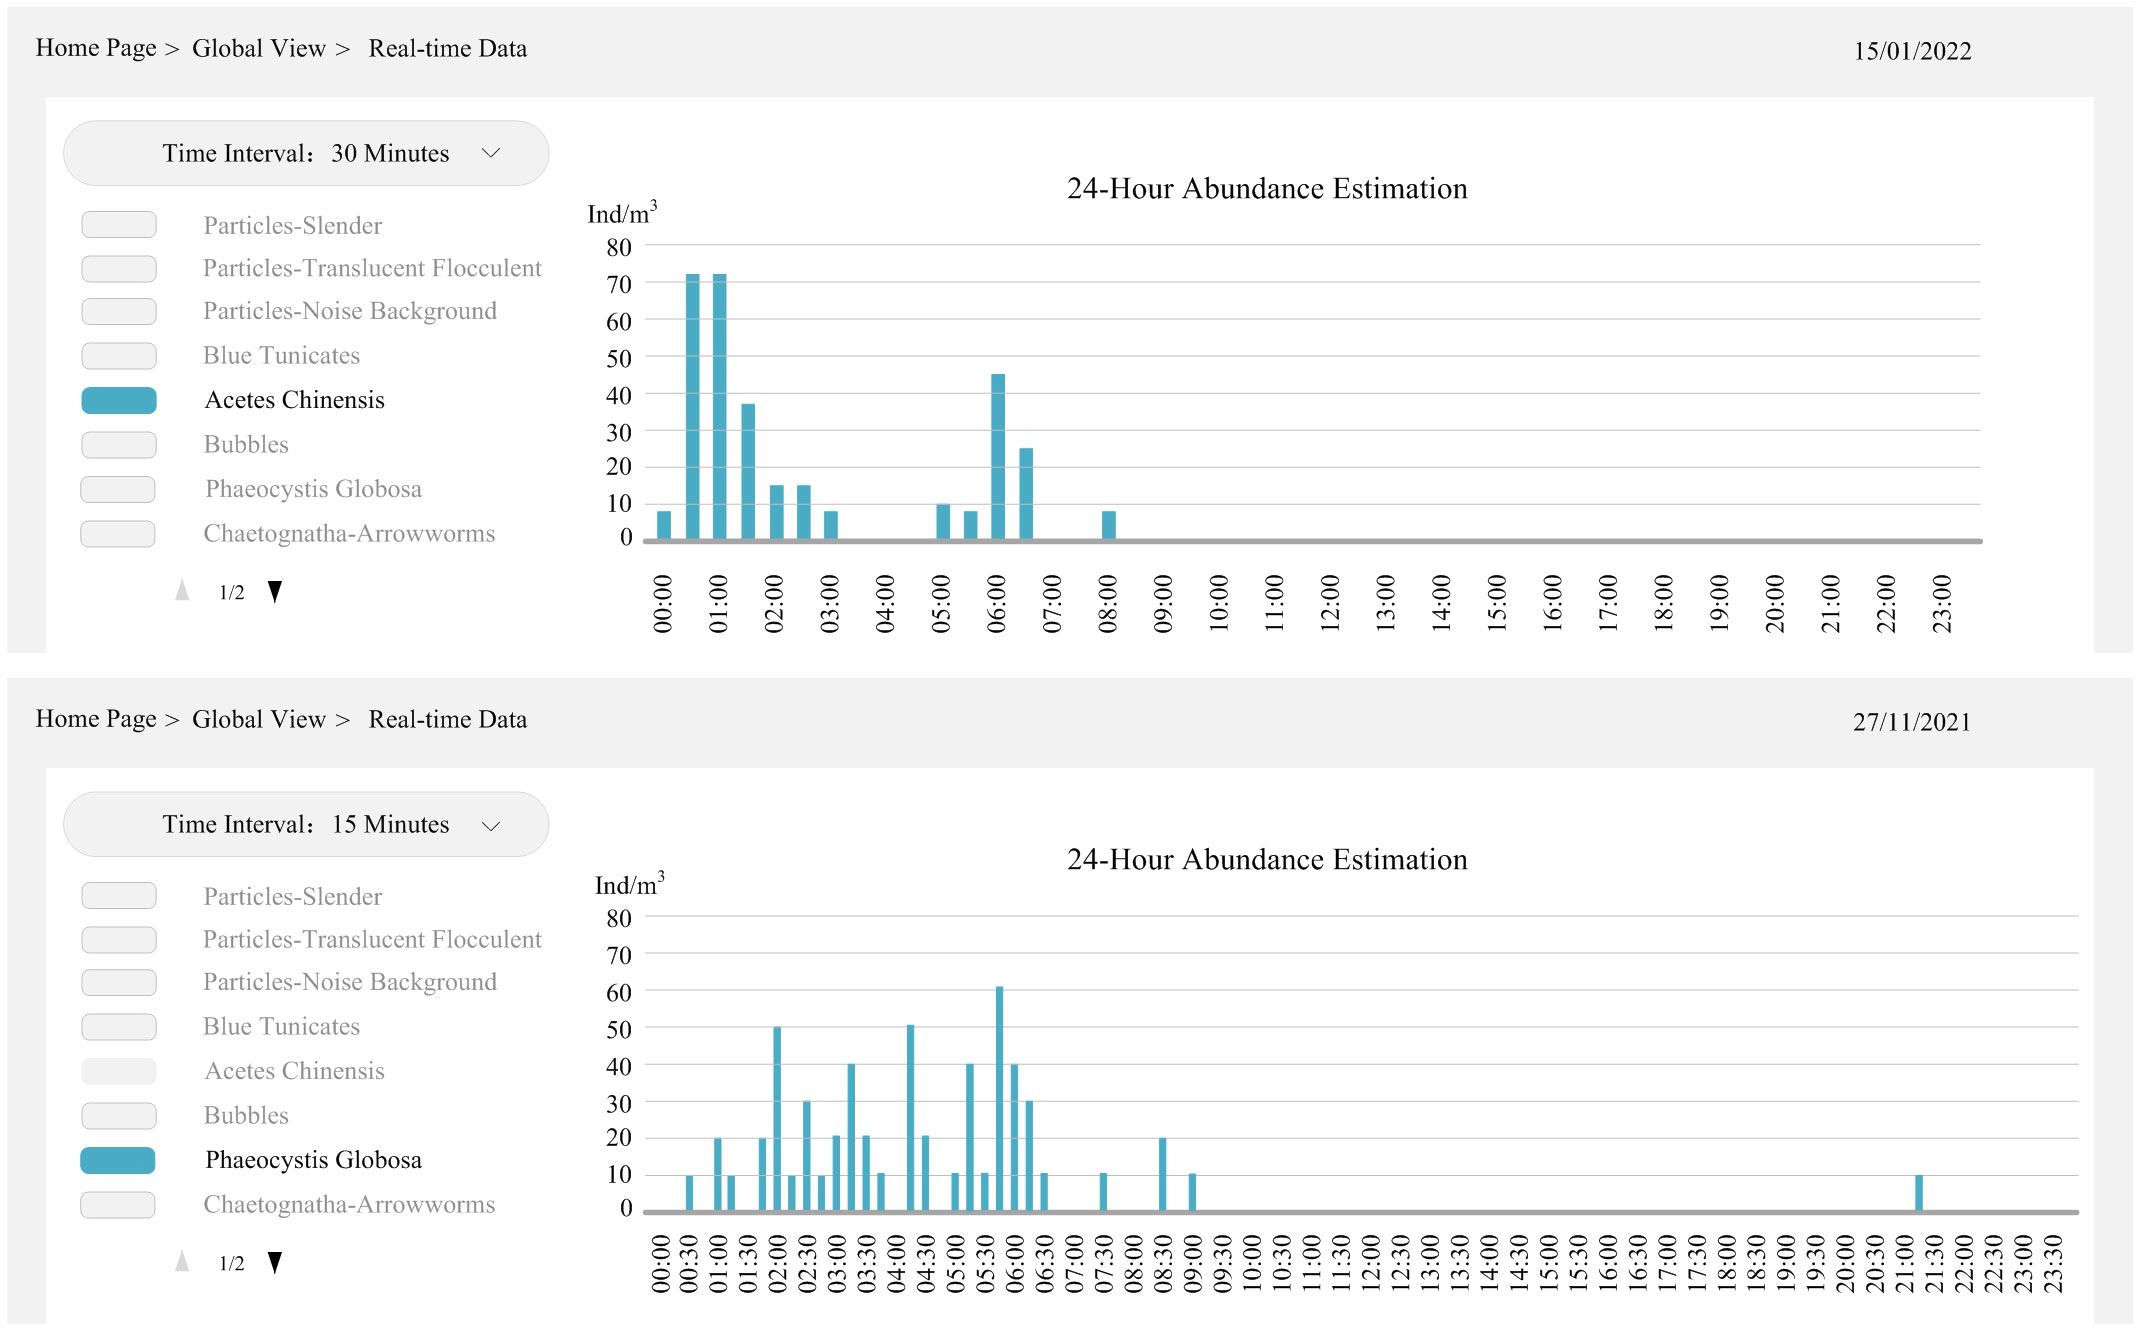
Figure 11 24-hDCO abundance estimation of Acetes chinensis and Phaeocystis globosa.
The theoretical basis for estimating the DCO abundance is as follows:
where Abio is the biological abundance, Q is the total number of identified organisms, V is the total volume of sampled water, K is the water volume corresponding to a single image, and N is the total number of images.
The prediction of DCO trajectories is based on the SCHISM three-dimensional hydrodynamic model, which is established according to the hydrological data of the target sea area, such as tide level, waves, and current. By bringing the number and location information of DCOs at different times into the three-dimensional hydrodynamic model, we can obtain a numerical model of DCO drift and predict the migration trajectories of DCOs. The positions of the DCOs monitored in real time are used as the initial and correction points to continuously modify the trajectory parameters so as to optimize the prediction of DCO trajectories.
The experimental results show that IMSDCO has achieved the design goals, but it still needs to be improved. The estimated DCO abundance is affected by ocean currents, image sampling interval, and biomass of repeated counting in adjacent images, and there will be errors compared with the actual value. The OMI used by IMSDCO can only identify DCOs between 500 µm and 20 mm in size, but large aquatic organisms beyond this range—even aquatic plants and garbage on the sea surface—will also block the water intake; these disaster-causing substances must be monitored by adding sonar, cameras, and radar, which is just one aspect of IMSDCO that needs to be improved. Also, to achieve early warning of a blockage of the water intake of a nuclear power plant, it is necessary to monitor a large sea area near the water intake; however, the spatial distribution of disaster-causing biological data cannot be obtained through only one observation point, which will also result in errors in DCO abundance estimation and trajectory prediction. In future work, we also need to carry out underwater multi-point observation experiments, enrich the monitoring data by increasing the number of observation points, and reduce errors as much as possible.
4 Conclusions
We have studied and implemented a seafloor in situ IMSDCO that provides long-term power and real-time communication for underwater scientific sensors through a cable. The key technologies of power supply, state monitoring and control, multi-protocol communication, and data acquisition and management were proposed and implemented, which improved the reliability and operability of the system. The system was deployed successfully at the cold-water intake of the Hainan Changjiang Nuclear Power Plant. During a six-month sea trial, the system continued to operate stably and obtained long-term hydrological environmental data and a large number of DCO images. Through the software algorithms to analyze the collected images automatically, various DCOs were identified. The monitoring software displayed the DCO abundance in real time, and if it exceeded the alarm threshold, then the software would give a warning. The horizontal movement of the planktonic DCOs is driven mainly by the ocean currents, and their movement track can be predicted by combining the velocity and direction data. The results of the sea trial show that the optically based IMSDCO is feasible, thereby providing a new idea and scientific guidance for DCO early warning and prevention at the cold-water intakes of nuclear power plants.
Data availability statement
The original contributions presented in the study are included in the article/Supplementary Material. Further inquiries can be directed to the corresponding author.
Author contributions
CL, JH, and S-TL conceived and designed the study. CL, Y-ZS, S-TL, and LY carried out all the experiments. JH and Y-ZS analyzed the data. CL wrote the manuscript. JH, Y-ZS, LY, and S-TL edited the manuscript. All authors contributed to the article and approved the submitted version.
Funding
This project was supported by the Innovation Fund of the National Center for Marine Technology [Grant No. Y1200Z006], the Open Research Fund of the Key Laboratory of Marine Ecological Monitoring and Restoration Technologies [Grant No. MEMRT202116], and the National Key R&D Program of the Ministry of Science and Technology of the People’s Republic of China [Grant No. 2018YFC1407506].
Acknowledgments
It was implemented in cooperation with Xiamen University and the Hainan Changjiang Nuclear Power Plant of the China Nuclear Industry Group. The authors sincerely thank the team led by Dr. Li Jianping of the Shenzhen Institute of Advanced Technology of the Chinese Academy of Sciences for their help on the project from the beginning of deployment to the final recovery.
Conflict of interest
The authors declare that the research was conducted in the absence of any commercial or financial relationships that could be construed as a potential conflict of interest.
Publisher’s note
All claims expressed in this article are solely those of the authors and do not necessarily represent those of their affiliated organizations, or those of the publisher, the editors and the reviewers. Any product that may be evaluated in this article, or claim that may be made by its manufacturer, is not guaranteed or endorsed by the publisher.
Supplementary material
The Supplementary Material for this article can be found online at: https://www.frontiersin.org/articles/10.3389/fmars.2022.1089699/full#supplementary-material
References
Azila A., Chong V. C. (2010). Multispecies impingement in a tropical power plant, straits of malacca. Mar. Environ. Res. 70 (1), 13–25. doi: 10.1016/j.marenvres.2010.02.004
Bi H. S., Song J. T., Zhao J., Liu H., Cheng X. M., Wang L. L., et al. (2022). Temporal characteristics of plankton indicators in coastal waters: High-frequency data from PlanktonScope. J. Sea Res. 189, 102283. doi: 10.1016/j.seares.2022.102283
Chen J. C., Xia L. S. (2017). The enlightenment of foreign nuclear power development to the development of nuclear power in China. Value Eng. 26, 237–241. doi: 10.14018/j.cnki.cn13-1085/n.2017.26.097
Cowen R. K., Guigand C. M. (2008). In situ ichthyoplankton imaging system(ISIIS): System design and preliminary results. Limnol. Oceanogr. Methods 6 (2), 126–132. doi: 10.4319/lom.2008.6.126
Deng X. J. (2021). Clean energy cooperation between China and southeast Asia:Opportunities and challenges for nuclear power. Southeast Asian Stud. 5, 156–157. doi: 10.19561/j.cnki.sas.2021.05.093
Du D. P., Lu X., Yan Y. Z. (2018). Design of a surge current suppression circuit on airborne DC/DC. Microelectronics 48 (2), 216–221. doi: 10.13911/j.cnki.1004-3365.170374
Greer A. T., Woodson C. B., Smith C. E., Guigand C. M., Cowen R. K. (2016). Examining mesozooplankton patch structure and its implications for trophic interactions in the northern gulf of Mexico. J. Plankton Res. 38 (4), 1115–1134. doi: 10.1093/plankt/fbw033
Grossmann M. M., Gallager S. M., Mitarai S. (2014). Continuous monitoring of near-bottom mesoplankton communities in the East China Sea during a series of typhoons. J. Oceanogr. 71 (1), 115–124. doi: 10.1007/s10872-014-0268-y
Han R., Ji P., Zhao Y. J., Liu Y., Kang Z. S. (2018). Investigation and analysis of water intake blockage ofcoastalnuclear power plants. Water Wastewater Eng. 44 (S1), 75–80. doi: 10.13789/j.cnki.wwe1964.2018.0265
Howe B. M., Kirkham H., Vorperian V. (2002). Power system considerations for undersea observatories. IEEE J. Ocean Eng. 27 (2), 267–274. doi: 10.1109/JOE.2002.1002481
Jaffe J. (2015). In situ underwater microscopy: A transformative technology for observing small organisms in the sea. Opt. Optoelectron. Technol. 13 (4), 1–3.
Li J. P., Chen T., Yang Z. Y., Chen L. P., Zhang Y. Z., Yu G. W., et al. (2022). Development of a buoy-borne underwater imaging system for In situ mesoplankton monitoring of coastal waters. IEEE J. Ocean Eng. 47 (1), 88–110. doi: 10.1109/JOE.2021.3106122
Li D. J., Wang J., Feng J. S., Yang C. J., Chen Y. H. (2016). Study and design of a heatdissipation system in a junction box for chineseexperimental ocean observatory network. Mar. Technol. Soc J. 50 (2), 63–74. doi: 10.4031/MTSJ.50.2.5
Lin D. D., Li D. J., Yang S. J., Jin B., Chen Y. H., Yang J. C. (2011). Development of power management system based on seafloor observatory network junction box. Ship Eng. 33 (2), 77–80. doi: 10.3969/j.issn.1000-6982.2011.02.019
Liu D.Y., Ke Z., Cai Z.H., Huang H.H., Bi H.S. (2021). Outburst of Creseis acicula in southwest Daya bay in July 2020. Oceanol. Limnol. Sin. 52 1438–1447. doi: 10.11693/hyhz20210400086
Lombard F., Boss E., Waite A. M., Vogt M., Appeltans W. (2019). Globally consistent quantitative observations of planktonic ecosystems. Front. Mar. Sci. 6. doi: 10.3389/fmars.2019.00196
MEE (2020) Letter on notification of multiple unit shutdown operation events caused by marine organisms affecting the water intake system of nuclear power plant. Available at: https://www.mee.gov.cn/xxgk2018/xxgk/xxgk07/202003/t20200331_771924.html (Accessed May 18, 2022).
Meng Y. H., Hu L. S., Li J. W., Zhang J. F. (2019). Research on marine biological monitoring technology to improve the cold source safety of nuclear power plant. Electr. Saf. Technol. 21 (3), 33–39. doi: 10.3969/j.issn.1008-6226.2019.03.010
Merz E., Kozakiewicz T., Reyes M., Ebi C., Isles P., Baity-Jesi M., et al. (2021). Underwater dual-magnification imaging for automated lake plankton monitoring. Water Res. 203, 117524. doi: 10.1016/j.watres.2021.117524
MOC (2021) Utilization of nuclear energy in EU. Available at: http://at.mofcom.gov.cn/article/jmxw/202112/20211203233311.shtml (Accessed July 15, 2022).
Ohman M. D., Davis R. E., Sherman J. T., Grindley K. R., Ellen J. S. (2019). Zooglider: An autonomous vehicle for optical andacoustic sensing of zooplankton. Limnol. Oceanogr.Methods 17 (1), 69–86. doi: 10.1002/lom3.10301
Picheral M., Guidi L., Stemmann L., Karl D. M., Iddaoud G., Gorsky G. (2010). The underwater vision profiler 5: An advanced instrument for high spatial resolution studies of particle size spectra and zooplankton. Limnol. Oceanogr. Methods 8 (9), 462–473. doi: 10.4319/lom.2010.8.462
Purcell J. E., Uye S., Lo W. (2007). Anthropogenic causes of jellyfish blooms and their direct consequences for humans: A review. Mar. Ecol. Prog. Ser. 350, 153–174. doi: 10.3354/meps07093
Ruan G. P. (2015). Reason analysis and corresponding strategy for cooling water intake blockage at nuclear power plants. Nucl. Power Eng. 36 (S1), 151–154. doi: 10.13832/j.jnpe.2015.S1.0151
Song J. J., Ren B., Song L. (2012). The design and realization of a spectrum acquisition unit based on the MSP430F149 MCU. Appl. Mech. Mater. 246–247, 230–234. doi: 10.4028/www.scientific.net/AMM.246-247.230
Wang K., Chen B. H., Gao Y. H., Lin H. (2021). Harmful algal blooms caused by phaeocystis globosafrom 1997 to 2018 in Chinese coastal waters. Mar. pollut. Bull. 173 (A), 112949. doi: 10.1016/j.marpolbul.2021.112949
Wang Z., Fu Y. Y. (2021). Monitoring of cold source biomass at water intake of hongyanhe nuclear plant by using acoustic methods. Sci. Technol. Innov. 36, 169–172. doi: 10.3969/j.issn.1673-1328.2021.36.053
Xu S. X. (2020). Present situation, problems and countermeasures of nuclear power development in China. J. North China Electric Power Univ. (Soc. Sci.) 5, 1–9. doi: 10.14092/j.cnki.cn11-3956/c.2020.05.001
Yang Z.Y., Li J.P., Chen T., Pu Y.C., Feng Z.H. (2022). Contrastive learning-based image retrieval for automatic recognition of in situ marine plankton images. ICES J. Mar. Sci. 79 (10), 2643–2655. doi: 10.1093/icesjms/fsac198
Yu W. J., Li Z. G., Sun K., Qin B. C., Li M. Z., Feng Y. B. (2013). Study on power management and control system for ocean cabled observatory. Mach. Des. Manuf. 5, 252–255. doi: 10.3969/j.issn.1001-3997.2013.05.078
Zeng L., Chen G., Wang T., Zhang S., Dai M., Yu J., et al. (2021). Acoustic study on the outbreak of creseise acicula nearby the daya bay nuclear power plant base during the summer of 2020. Mar. pollut. Bull. 165, 112144. doi: 10.1016/j.marpolbul.2021.112144
Zhang Y. (2021). Analysis on the development trend of nuclear energy in China under the dual carbon target. Nucl. Sci. Eng. 41 (6), 1347–1351. doi: 10.3969/j.issn.0258-0918.2021.06.034
Keywords: nuclear power plant, water intake, disaster-causing organism, monitoring system, abundance estimation, optical microscopic imager
Citation: Li C, Huo J-l, Song Y-z, Yang L and Liu S-t (2023) An integrated monitoring system for disaster-causing organisms in the water intake areas of coastal nuclear power plants. Front. Mar. Sci. 9:1089699. doi: 10.3389/fmars.2022.1089699
Received: 04 November 2022; Accepted: 20 December 2022;
Published: 10 January 2023.
Edited by:
Huang Honghui, South China Sea Fisheries Research Institute (CAFS), ChinaReviewed by:
Bin Liu, Hebei University of Technology, ChinaGuoliang Wei, Nuclear and Radiation Safety Center, China
Ma Xin, Ocean University of China, China
Copyright © 2023 Li, Huo, Song, Yang and Liu. This is an open-access article distributed under the terms of the Creative Commons Attribution License (CC BY). The use, distribution or reproduction in other forums is permitted, provided the original author(s) and the copyright owner(s) are credited and that the original publication in this journal is cited, in accordance with accepted academic practice. No use, distribution or reproduction is permitted which does not comply with these terms.
*Correspondence: Jian-ling Huo, aHVvX2pvYkAxNjMuQ29t