
95% of researchers rate our articles as excellent or good
Learn more about the work of our research integrity team to safeguard the quality of each article we publish.
Find out more
ORIGINAL RESEARCH article
Front. Mar. Sci. , 19 January 2023
Sec. Marine Ecosystem Ecology
Volume 9 - 2022 | https://doi.org/10.3389/fmars.2022.1079418
This article is part of the Research Topic Eddy-Current Interactions in the Ocean and their Impacts on Climate, Ecology, and Biology View all 16 articles
 Lingjing Xu1,2,3,4
 Dezhou Yang1,2,3,4,5*
 Xingru Feng1,2,3,4,5
 Junchuan Sun2,6
 Guandong Gao1,2,3,4,5Xuan Cui1,2,3,4
 Baoshu Yin1,2,3,4,5*
The Kuroshio Current flows northeastward along the East China Sea (ECS) shelf break, carrying a large amount of nutrients, and is thus an important source of nutrients for the ECS. The mainstream and transport of the Kuroshio Current are significantly affected by mesoscale eddies. However, the influence of mesoscale eddies on the Kuroshio nutrient input into the ECS is unknown. We add constructed cyclonic and anticyclonic eddies to a hydrodynamic model to explore the influence of mesoscale eddies on cross-shelf Kuroshio phosphate input into the ECS. This model suitably reproduces the fate of mesoscale eddies and the variation in the Kuroshio Current during eddy-current interactions. The simulation results reveal that during the strong interaction between the Kuroshio Current and mesoscale eddy east of Taiwan, the cyclonic eddy reduces the on-shelf phosphate flux, while the anticyclonic eddy increases the Kuroshio phosphate input to the ECS. When the anticyclonic eddy moves to the Okinawa Trough, it reduces the Kuroshio phosphate input into the ECS.These basic features are not sensitive to the initial latitude of the eddy center east of Taiwan. The change in cross-shelf phosphate flux is caused by the changes in cross-shelf velocity and phosphate concentration along the shelf. Momentum balance analyses suggest that the change in cross-shelf velocity is mainly caused by the change in the pressure gradient term due to eddy-induced changes in sea surface height in the horizontal direction and isotherm tilting in the vertical direction. The advection-diffusion equation analysis shows that the change in phosphate concentration along the shelf is attributed to changes in the upper horizontal advection and lower vertical advection of phosphate, which are induced by the upper phosphate change and vertical velocity change along the shelf, respectively. This study has important implications for the possible response of the ECS ecosystem to mesoscale eddies that are partly triggered by enhanced typhoons east of Taiwan under global warming.
The Kuroshio Current is an important western boundary current among the global oceans that originates from the northern branch of the North Equatorial Countercurrent and flows northeast along the eastern coast of Taiwan. It collides with the zonal continental slope northeast of Taiwan and quickly deflects eastward. Then, it moves northeastward mainly along the East China Sea (ECS) continental shelf and finally flows eastward into the Pacific Ocean through the Tokara Strait (Nitani, 1972). Along its path, the Kuroshio Current strongly interacts with the Chinese continental marginal seas. It has been revealed that both the Kuroshio surface and subsurface water can intrude into the South China Sea and ECS, which significantly affecting the dynamic characteristics in these marginal seas (e.g., Yang et al., 2012; Lian et al., 2016; Wu et al., 2017; Chen et al., 2020; Liu et al., 2021; Wu et al., 2021; Chang et al., 2022).
The water mass transport provides an important passageway for material and energy exchange in the world ocean (e.g., Dodd et al., 2009; Puerta et al., 2020; Lao et al., 2022). Therefore, the Kuroshio intrusion not only inputs a large amount of water but also inputs many oceanic biochemical substances into the ECS (Chen et al., 1994; Xu et al., 2020; Xu et al., 2021). The nutrients carried by the Kuroshio intrusion have become an important source of nutrients to the ECS continental shelf (Chen, 1996). Observations have revealed that the nutrient concentration of the Kuroshio surface water is relatively low, while that of the Kuroshio subsurface water is relatively high (Chen et al., 1995; Zhang et al., 2007; Chen, 2009). Along the 200 m isobaths, the Kuroshio subsurface water continues upwelling, providing a large amount of nutrients to the ECS continental shelf. Regardless of whether in summer or winter, the Kuroshio Current inputs more nutrients onto the ECS continental shelf than the river input, especially of phosphate, which far exceeds the input of the Yangtze River and Yellow River (Chen and Wang, 1999; Zhang et al., 2007). Northeast Taiwan and southwest Kyushu are two main areas of Kuroshio nutrient input into the ECS (Zhao & Guo, 2011). Liu et al. (2000) found that nutrient inputs from the Kuroshio intrusion northeast of Taiwan alone are significantly greater than those from rivers. Meanwhile, the phosphate transported by the intrusion of the Kuroshio Current is found to be the main nutrient controlling algal blooms in the Zhejiang coastal area on the ECS continental shelf (Yang et al., 2013; Zhou et al., 2019; Xu et al., 2020).
Changes in the Kuroshio Current and Kuroshio intrusion have also been extensively studied and found to be closely related to the multi-scale motions and variations in ocean interior, such as, ENSO, PTO, PDO, and mesoscale eddies (e.g., Hsin et al., 2013; Soeyanto et al., 2014; Wang and Oey, 2014; Wu et al., 2014; Zheng et al., 2019). The subtropical frontal area is one of the areas with large eddy kinetic energy in the North Pacific Ocean (Liu et al., 2012; Chow et al., 2017; Yang et al., 2017). Due to barotropic and baroclinic instabilities in the North Pacific Subtropical Countercurrent, large numbers of mesoscale eddies form and then move westward under the effect of planet vorticity gradient (Gill et al., 1974; Qiu, 1999; Sutyrin et al., 2003; Chelton et al., 2011). Some of these eddies reach the western boundary of the North Pacific Ocean and interact with the western boundary current – the Kuroshio Current mainly around the Luzon Strait and east of Taiwan (Lee et al., 2013; Cheng et al., 2017). If the radius of the mesoscale eddy is larger than 150 km, it significantly alters the Kuroshio Current (Zheng et al., 2011). Mesoscale eddies can influence the volume transport of the Kuroshio Current east of Taiwan by altering the difference in sea surface height in addition to the Kuroshio Current, changing the slope of the pycnocline, and causing water convergence and divergence (Lien et al., 2014; Chang et al., 2015; Tsai et al., 2015; Yan et al., 2016). The westward mesoscale eddy is also an important factor affecting the path of the Kuroshio Current (Waseda, 2002; Miyazawa et al., 2004; Hsu et al., 2016). When interacting with mesoscale eddies, the Kuroshio Current changes frequently in the form of cutting-off, meandering or branching in the Luzon Strait and migrates eastward east of Taiwan (Hsu et al., 2016; Zheng et al., 2019).
Meanwhile, these eddies can alter the intrusion of the Kuroshio Current into the ECS (Yin et al., 2014; Wu et al., 2017; Yin et al., 2017). On the one hand, mesoscale eddies change the intrusion intensity of the Kuroshio by changing its incidence angle (Vélez-Belchí et al., 2013). On the other hand, mesoscale eddies can adjust the volume transport of the Kuroshio and then change its cross-shelf intrusion into the ECS (Lien et al., 2014; Liu et al., 2014). Previous studies have shown that weakened cyclonic eddies moved the Kuroshio offshore northeast of Taiwan and weakened its intrusion in northeast Taiwan to the ECS. However, enhanced cyclonic eddies weakened the volume transport of the Kuroshio and made it migrate shoreward, strengthening its intrusion into the ECS northeast of Taiwan (Wu et al., 2017). In addition, cyclonic eddies bring positive vorticity fluxes and adjust the local vertical stratification, which reduces the restriction of the potential vorticity gradient across the continental shelf and the land slope on the upper layer flow and is conducive to the intrusion of the Kuroshio Current northeast of Taiwan. Anticyclone eddies have the reverse effects (Yin et al., 2017).
Although previous studies have revealed that the nutrient input, especially the phosphate input, from the Kuroshio Current is rather important to the ECS and that the westward mesoscale eddy can exert a significant impact on the Kuroshio Current and its intrusion into the ECS, studies on the influence of mesoscale eddies on the cross-shelf transport of Kuroshio nutrients are still rare. Due to the unpredictability of mesoscale eddies and sparse field observations, an ideal eddy constructed based on the statistical features of eddies has been used to study the influence of mesoscale eddies on the global oceans (Yang et al., 2017; Geng et al., 2018). Therefore, this study aims to explore the influence of mesoscale eddies on the cross-shelf transport of phosphate to the ECS continental shelf via the Kuroshio Current and reveal the possible underlying mechanisms based on a numerical model with constructed eddies.
The regional ocean model used in this study was developed by 2012; Yang et al. (2011) based on the Regional Ocean Model System (ROMS; Shchepetkin & McWilliams, 2005). The model domain extends from 116°E to 136°E and from 21°N to 41°N, covering parts of the northwest Pacific Ocean and the entire ECS (Figure 1). The model is eddy-resolved with a horizontal resolution of 1/12° and is vertically divided into 26 layers in terrain‐following coordinates. It is forced by climatological monthly wind stress, heat flux, and freshwater flux extracted from the Comprehensive Ocean‐Atmosphere Data Set (COADS) (Diaz et al., 2002) and 10 tidal constituents extracted from the TOPEX/Poseidon global tidal model (TPXO7) (Egbert and Erofeeva, 2002). The initial and open boundary conditions, including temperature, salinity, velocity, and sea surface height, are derived from the outputs of a larger-domain model developed by Yang et al. (2011). The Changjiang River is also included in the coastal boundary with monthly discharge data obtained from Liu et al. (2002). See Yang et al. (2011); Yang et al. (2012) for more details on the model configuration. This model is well validated by comparisons with various data from field observations, satellite observations, and previous works and is successfully used to study the biogeochemical processes on the ECS continental shelf (Yang et al., 2011; Yang et al., 2012; Xu et al., 2018; Xu et al., 2020; Xu et al., 2021).

Figure 1 The domain of the numerical model. The gray lines are the 50 m, 100 m, 200 m, and 500 m isobaths. The 200 m isobaths along the ECS continental shelf are highlighted in red lines. The blue arrows indicate the Kuroshio Current and Kuroshio branch current (KBC).
Satellite observations and Argo float data reveal that oceanic mesoscale eddies have a universal spatial structure with a Gaussian-type profile (Chen et al., 2010; Zhang et al., 2013). Based on this discovery, a series of idealized mesoscale eddies are constructed and added to the background flow field to study eddy-mean flow interactions (e.g., Kuo and Chern, 2011; Yang et al., 2017; Geng et al., 2018; Yang et al., 2019).
To diagnose the influence of mesoscale eddies on nutrient transport from the Kuroshio Current to the ECS, we construct a pair of ideal cyclone and anticyclone eddies with Gaussian-type profiles based on previous studies (Itoh and Sugimoto, 2001; Geng et al., 2018). First, the three-dimensional temperature structure of the eddy is calculated by an equation considering the depth z and the distance r from the eddy center (x0,y0):
where ΔTmax, h0, and r0 denote the eddy’s maximum temperature anomaly, thickness, and radius, respectively, obtained from the statistical characteristics. Then, the density distribution is calculated by the linear state equation (Jackett and Mcdougall, 1995). Finally, the sea surface height and three-dimensional horizontal velocity of eddies are calculated according to the pressure distribution and geostrophic relationship. According to the statistics of mesoscale eddies east of Taiwan (Yan et al., 2016; Yin et al., 2017), the centers of cyclonic and anticyclonic eddies are established as 22.5°N, 124°E and 22.9°N, 124°E, respectively, and ΔTmax, h0, and r0 are set to -7°C (7°C), 150 m, and 80 km, respectively, for cyclonic (anticyclonic) eddy. Figure 2 presents the distributions of the temperature and density anomalies along the section across the eddy center and the sea surface height and surface current anomalies in the eddy. The temperature anomaly is greatest at a depth of 150 m in the eddy center and decreases with increasing distance from the maximum center in both cyclonic and anticyclonic eddies (Figures 2A, C). Accordingly, the positive density anomaly appears in the cyclonic eddy and the negative density anomaly appears in the anticyclonic eddy. The maximum sea surface height anomaly is also located in the eddy center and decreases as the distance r from the eddy center (x0,y0) increases (Figures 2B, D). The surface currents tangent to the sea surface height contour exhibits counterclockwise and clockwise structures in cyclonic and anticyclonic eddies, respectively.
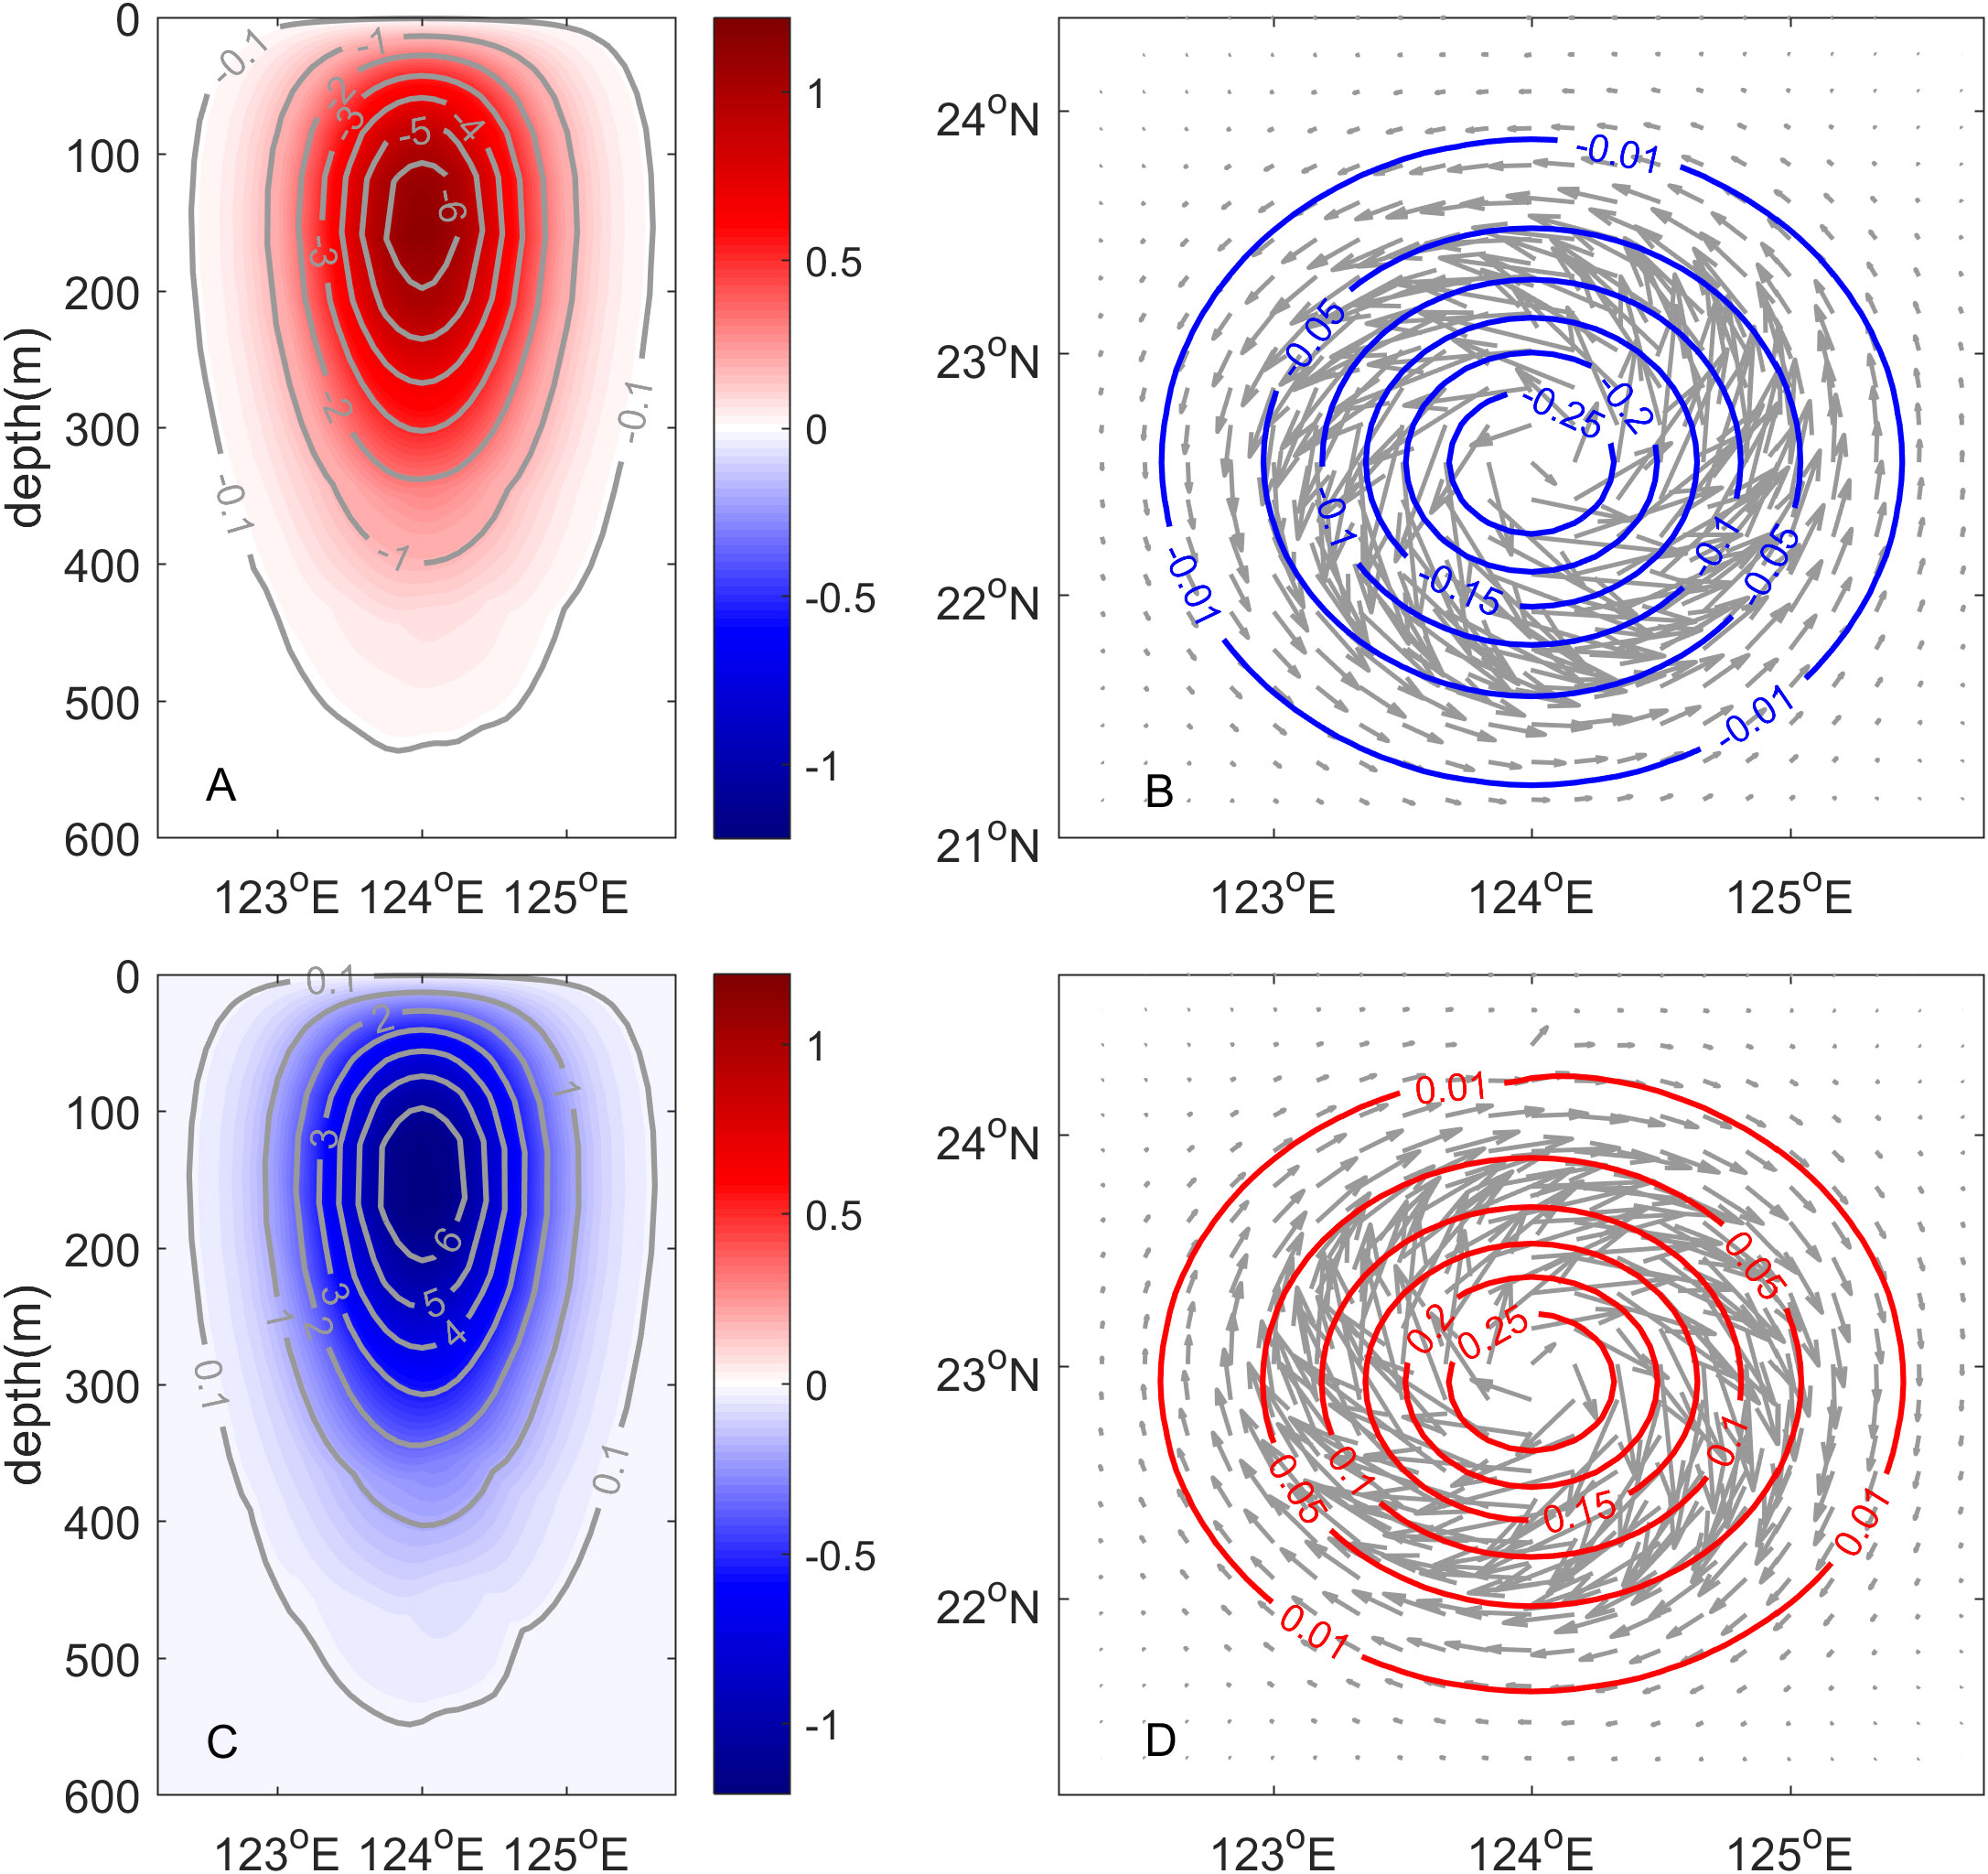
Figure 2 The (A, C) temperature (°C) and density (kg/m3) profiles, (B, D) sea surface height (m) and surface current of constructed Gaussian-type (upper panel) cyclonic and (lower panel) anticyclonic eddies.
To study the influence of mesoscale eddies, three experiments are designed (Table 1). The Ctrl experiment is configured as described in section 2.1. The model spin-up runs for 19 years. Then, monthly average phosphate obtained from WOA18 is supplied in the southern open boundary from the surface to the bottom as a passive tracer for another 4 years to obtain a relatively stable distribution in the model domain. As phytoplankton blooms in the ECS occur frequently in spring (Zhou et al., 2003; Liu et al., 2010; Yu et al., 2018), the model output on May 1st of the 24th year is selected as the initial field of the Ctrl experiment. In eddy experiments, the temperature, sea surface height, and current field anomalies of the constructed cyclonic and anticyclonic eddies are added to the initial field of the control run as the initial fields of the CE and AE experiments, respectively. As shown in Figure 3, there is an obvious low (high) sea surface height and a counterclockwise (clockwise) flow around the eddy center in the initial field of the CE (AE) experiment. Except for the initial field, the settings of the eddy experiments are the same as those of the Ctrl experiment. All experiments are run for two months with phosphate distributed in the initial fields and supplied in the southern open boundary. Moreover, to quantify the cross-shelf exchange, we divide the 200 m isobaths equally along the ECS continental shelf (Figures 1 and Figure 3) and interpolate daily simulation results to the isobaths with a vertical interval of 5 m.

Table 1 Description of numerical experiments on the influence of mesoscale eddies.

Figure 3 The initial sea surface heights (m) and surface current fields in the (A) CE and (B) AE experiments. The dashed red lines represent the 200 m isobaths along the ECS continental shelf, which are thickened with solid lines northeast of Taiwan. The red stars indicate the initial location of the eddy center.
Under climatological conditions, the Kuroshio Current flows northeastward along Taiwan Island with a relatively straight mainstream (Figures 4A, D). Then, it deflects eastward in northeastern Taiwan due to the deflection of the ECS continental shelf. Along the edge of the ECS continental shelf, the Kuroshio Current can cross the 200 m isobaths in some areas and intrude into the ECS. The surface Kuroshio intrusion is significant in northeastern Taiwan as a Kuroshio branch current. After mesoscale eddies are added east of Taiwan at t=0 day, they propagate westward and interact with the Kuroshio Current (Figures 3 and 4B-F). Both cyclonic and anticyclonic eddies strongly interact with the Kuroshio Current east of Taiwan on approximately the 30th day (t=30 days) (Figures 4B, C). Then, the cyclonic eddy decays and halts east of Taiwan on the 37th day (t=37 days) (Figure 4E). The anticyclonic eddy intensifies and moves into the Okinawa Trough with the Kuroshio Current on the 37th day (Figure 4F). When the cyclonic eddy approaches east of Taiwan on the 30th day, the mainstream of the Kuroshio Current migrates eastward east of Taiwan and westward northeast of Taiwan, resulting in weakened transport east of Taiwan and westward onshore movement of the Kuroshio branch current (Figure 4B). When the anticyclonic eddy approaches, the mainstream of the Kuroshio Current moves westward east of Taiwan but moves eastward northeast of Taiwan, resulting in enhanced Kuroshio transport east of Taiwan and eastward offshore movement of the Kuroshio branch current northeast of Taiwan (Figure 4C). As for the evolution and movement of mesoscale eddies, the mainstream of the Kuroshio Current on the 37th day has similar but weaker variations than on the 30th day under the influence of cyclonic eddies, as does the Kuroshio branch current (Figure 4E). However, under the influence of anticyclonic eddies, both the mainstream and the branch current of the Kuroshio Current strengthen on the 37th day and move farther offshore northeast of Taiwan than on the 30th day (Figure 4F).
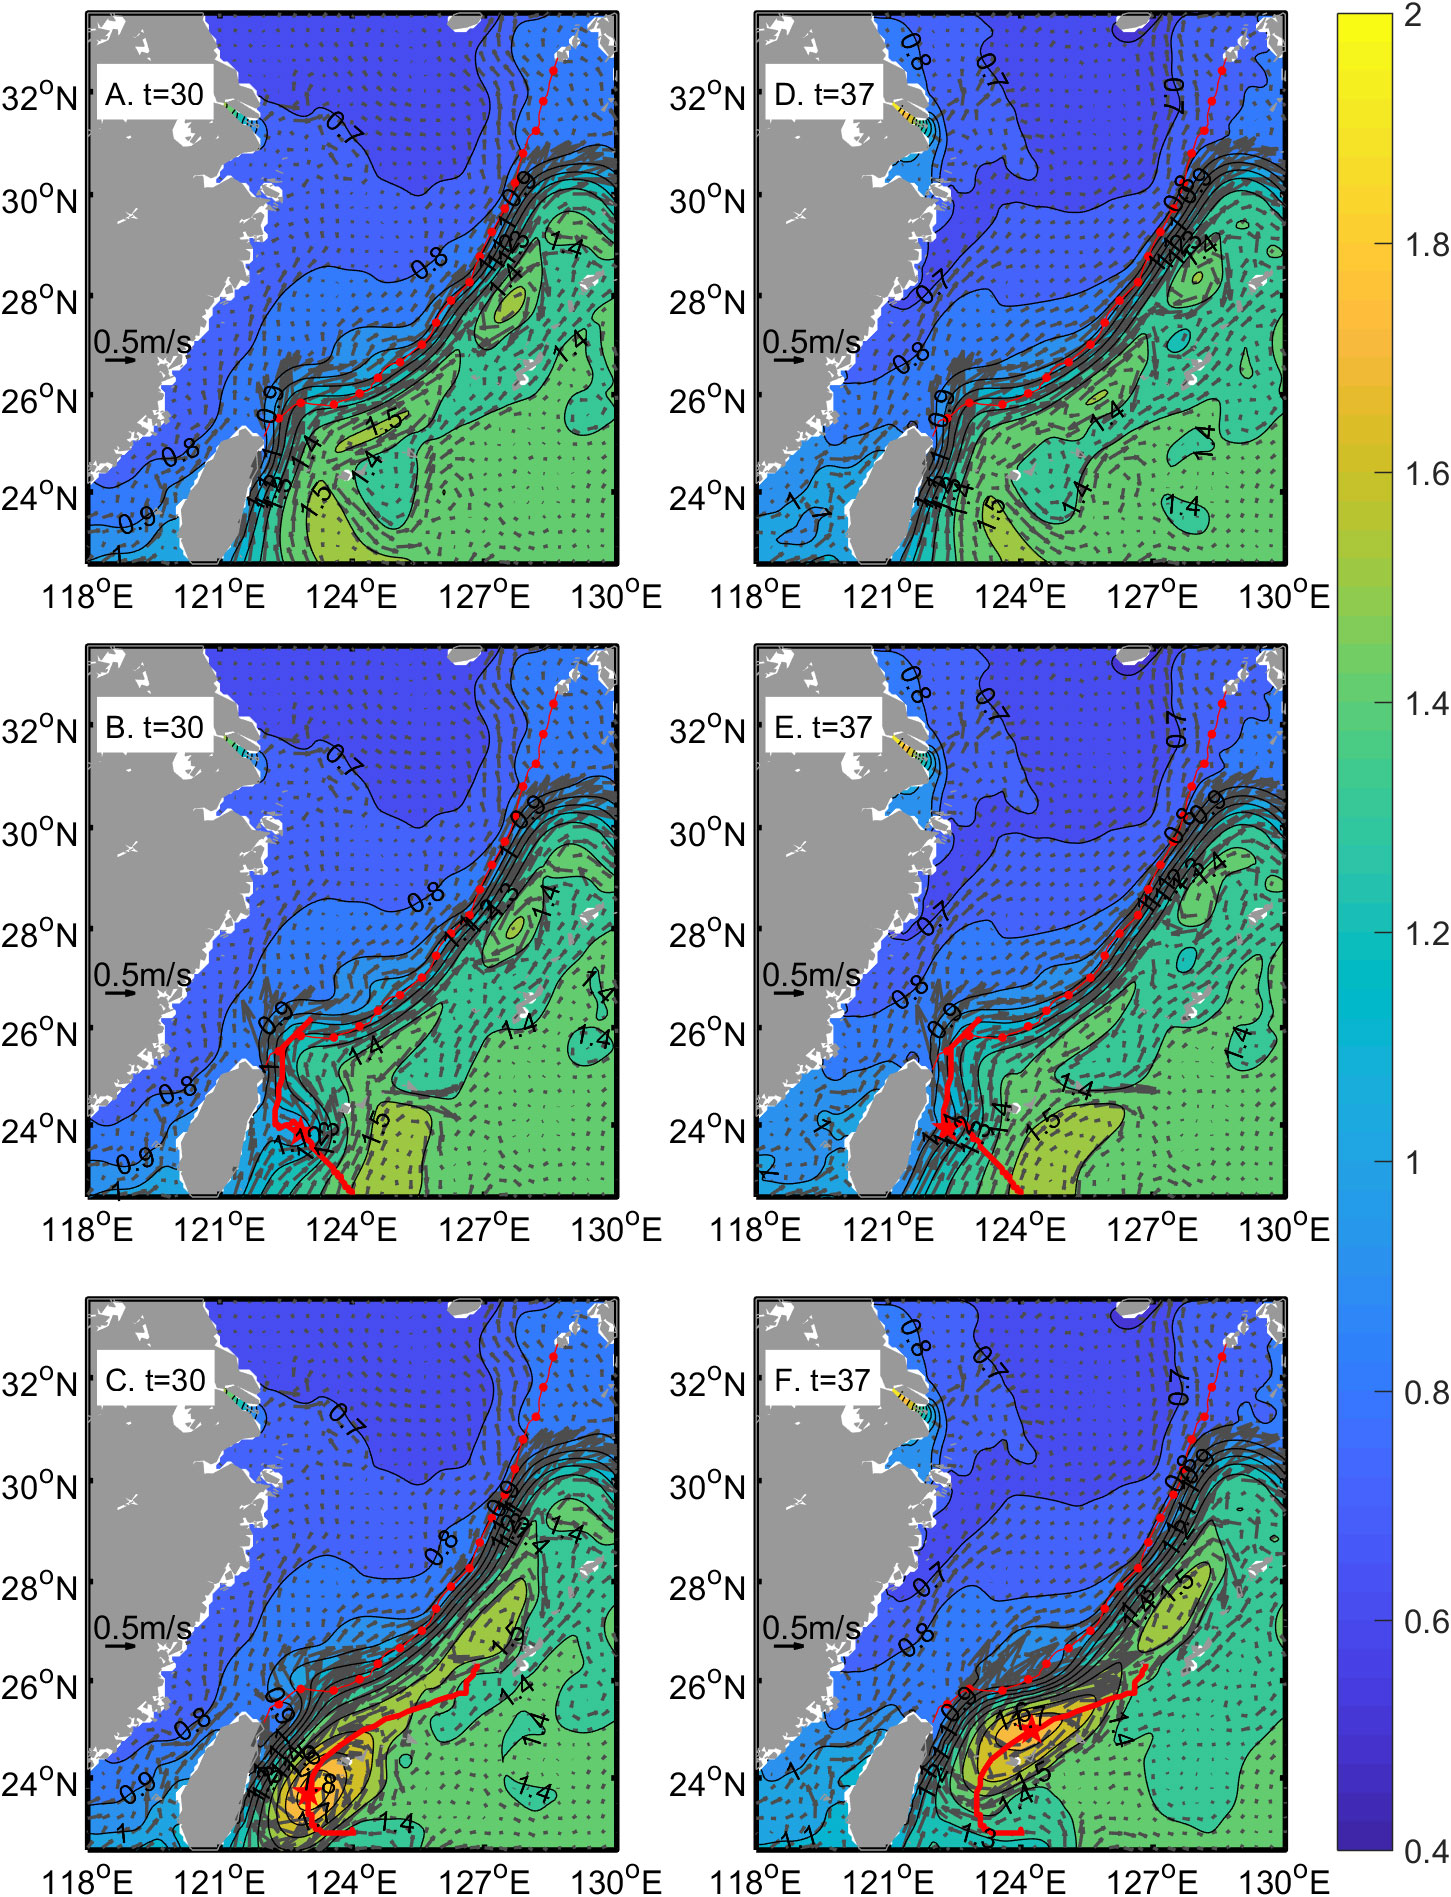
Figure 4 The sea surface height (m) and surface current fields in the (A, D) Ctrl, (B, E) CE, and (C, F) AE experiments at t=30 days and t=37 days. The dashed and solid red lines indicate the 200 m isobaths and the tracks of eddies, respectively. The red stars indicate the location of the eddy center.
These results indicate that the numerical model successfully reproduces the westward propagation of the mesoscale eddy and its interaction with the Kuroshio Current that are reported in previous studies. Both the modeling results in this work and observations from previous studies find that during eddy-current interactions, cyclonic eddies decay and anticyclonic eddies are enhanced (Chern and Wang, 2005; Kuo and Chern, 2011; Kuo et al., 2017). The Kuroshio transport east of Taiwan decreases during the cyclonic eddy-Kuroshio Current interaction, while it increases during the anticyclonic eddy-Kuroshio Current (e.g., Zhang et al., 2001; Lee et al., 2013; Chang et al., 2015). The Kuroshio mainstream east of Taiwan migrates eastward under the influence of cyclonic eddies (Hsu et al., 2016). However, the Kuroshio mainstream northeast of Taiwan migrates westward onshore under the influence of cyclonic eddies and migrates eastward offshore under the influence of anticyclonic eddies (Wu et al., 2017). The reproduced variation in the surface Kuroshio branch current northeast of Taiwan is also in good agreement with the results in Wu et al. (2017). Combined with the verification of the numerical model in our previous study (e.g., Yang et al., 2011; Yang et al., 2012; Xu et al., 2018; Xu et al., 2020; Xu et al., 2021), these results show that it is feasible and effective to construct an ideal eddy to study the influence of mesoscale eddies east of Taiwan on the Kuroshio Current and its transport onto the ECS continental shelf.
Along the 200 m isobaths, the Kuroshio Current mainly intrudes into the ECS northeast of Taiwan. Therefore, the vertical average water flux is significant in the western part of the isobaths in the on-shelf direction and is statistically insignificant elsewhere with alternate on-shelf and off-shelf directions and changes slightly over time (Figure 5A). The pattern of vertical average phosphate flux is similar to that of the water flux across the 200 m isobaths under climatological conditions (Figure 5B). Under the influence of mesoscale eddies, the vertical average water and phosphate fluxes change with time and space (Figures 5B, C and E-F). The influence of mesoscale eddies on the cross-shelf fluxes is small before t=20 days. Then, during the whole simulation period from t=20 days to t=60 days, the influence of cyclonic eddies on vertically averaged water and phosphate fluxes mainly occurs west of 124°E (Figures 5B, E). However, the influence region of the anticyclonic eddy moves eastward over time (Figures 5C, F). From t=20 days to t=34 days, the influence region of the anticyclonic eddy is concentrated west of 124°E. When t=40 days, the influence region extends to 125.5°E. After t=46 days, the influence region of the anticyclonic eddy moves to the east of 124.5°E with very little influence on the region west of 124°E.
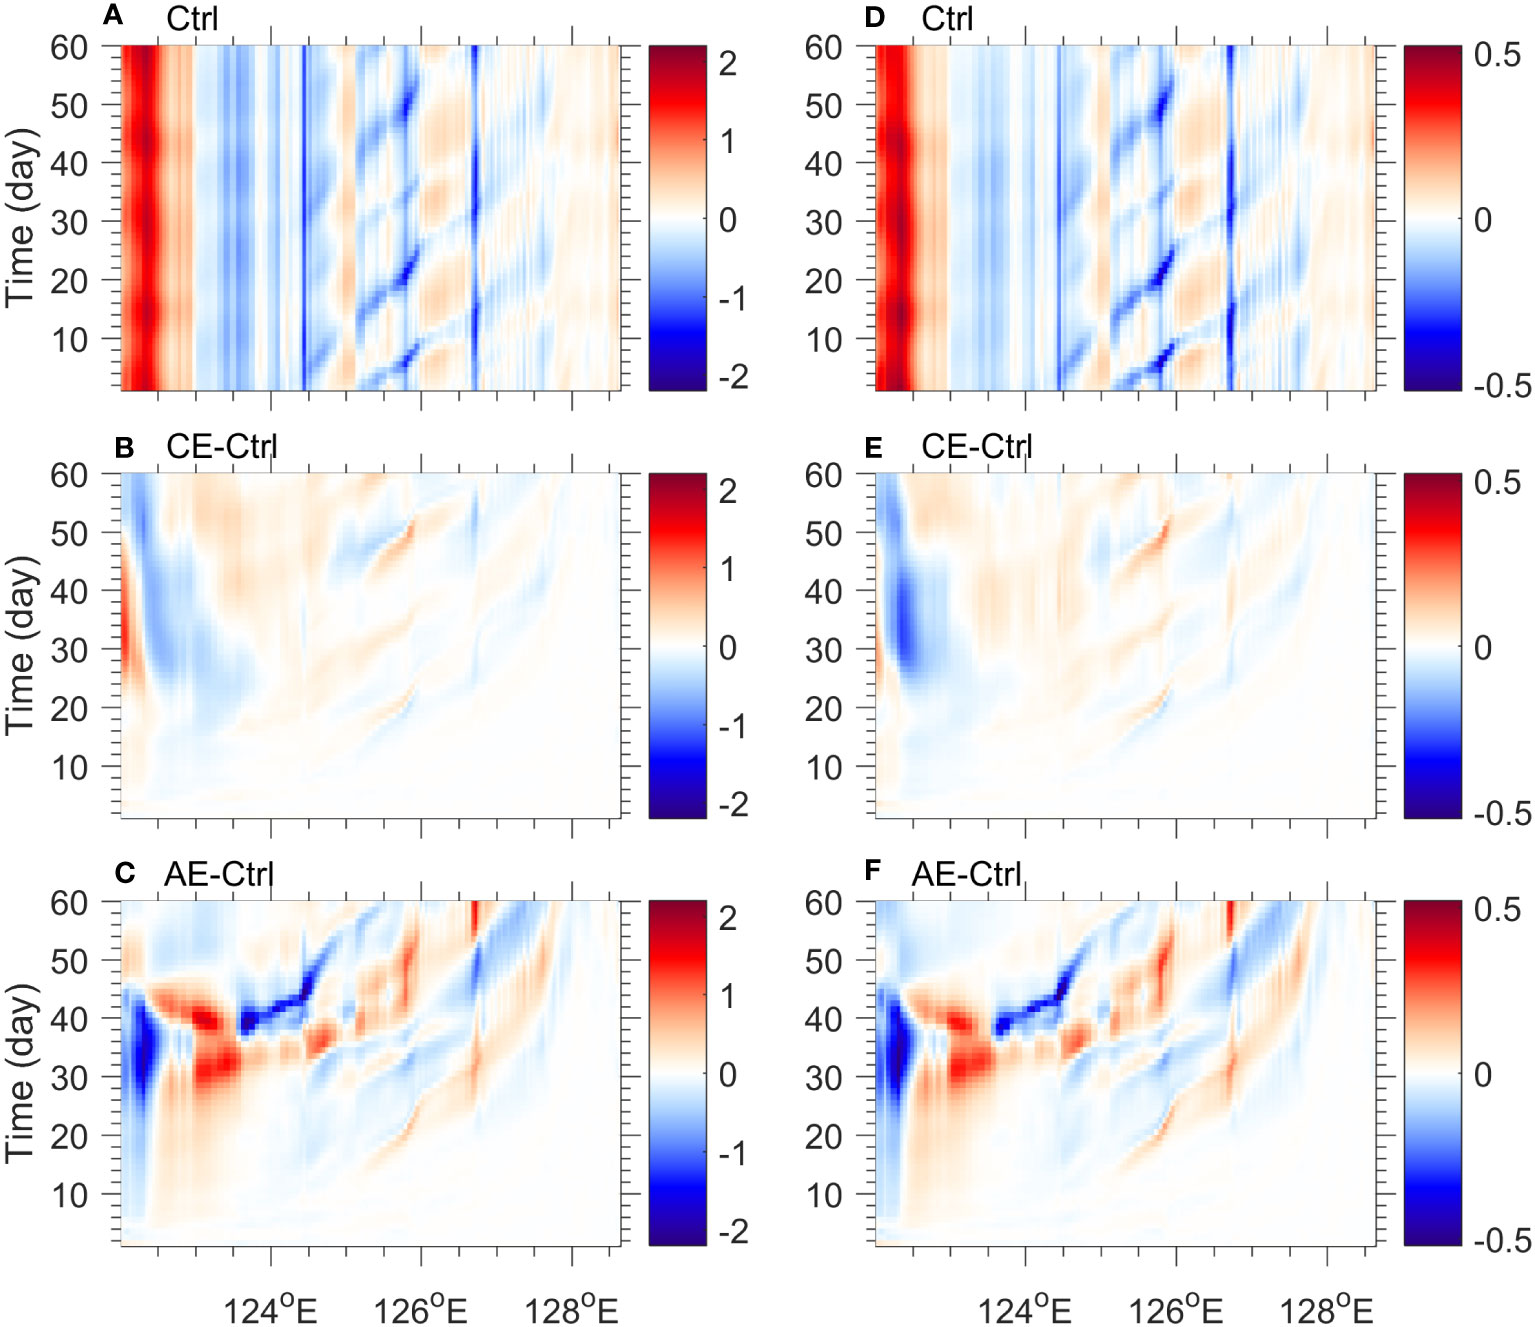
Figure 5 Vertical average (left panels) water (m2/s) and (right panels) phosphate (kg/ms) fluxes along the 200 m isobaths from t=1 day to t=60 days in the (A, D) Ctrl experiment, and their variations under the effect of (B, E) cyclonic and (C, F) anticyclonic eddies. In Figures (A, D) the positive value indicates the onshore flux onto the ECS continental shelf, while the negative value indicates the offshore flux to the open ocean.
Since the cross-shelf flux mainly occurs in the region west of 124°E northeast of Taiwan, we average the simulation results along the entire volume of 200m isobaths west of 124°E and obtain the volume-averaged velocity and cross-shelf flux. The time series of eddy-induced variations in the volume-averaged cross-shelf phosphate flux and velocity west of 124.17°E are shown in Figure 6. This figure shows that the cyclonic eddy decreases the phosphate flux onto the ECS continental shelf during its interaction with the Kuroshio Current. The decrease in phosphate flux gradually increases before t=30 days and weakens after t=30 days under the influence of cyclonic eddies (Figure 6A). However, the anticyclonic eddy first increases the phosphate flux to the continental shelf and then decreases the phosphate flux. The maximum enhancement effect occurs at t=30 days, and the maximum weakening effect occurs at t=37 days (Figure 6A). The variations in cross-shelf velocity caused by mesoscale eddies are similar to those of cross-shelf phosphate flux, but there are some differences (Figure 6B). For example, while the enhancement effect of anticyclonic eddies on the cross-shelf velocity is comparable to the weakening effect of cyclonic eddies, the enhancement effect of anticyclonic eddies on phosphate flux is less than the weakening effect of cyclonic eddies. The maximum weakening effect of cyclonic eddies on cross-shelf velocity occurs at t=28 days, and the maximum enhancement effect of anticyclonic eddies on cross-shelf velocity occurs at t=31 days, which has a phase difference from its effects on phosphate flux. Meanwhile, the anticyclonic eddy has an enhancement effect on the cross-shelf velocity but a weakening effect on the phosphate flux from t=43 days to t=48 days.
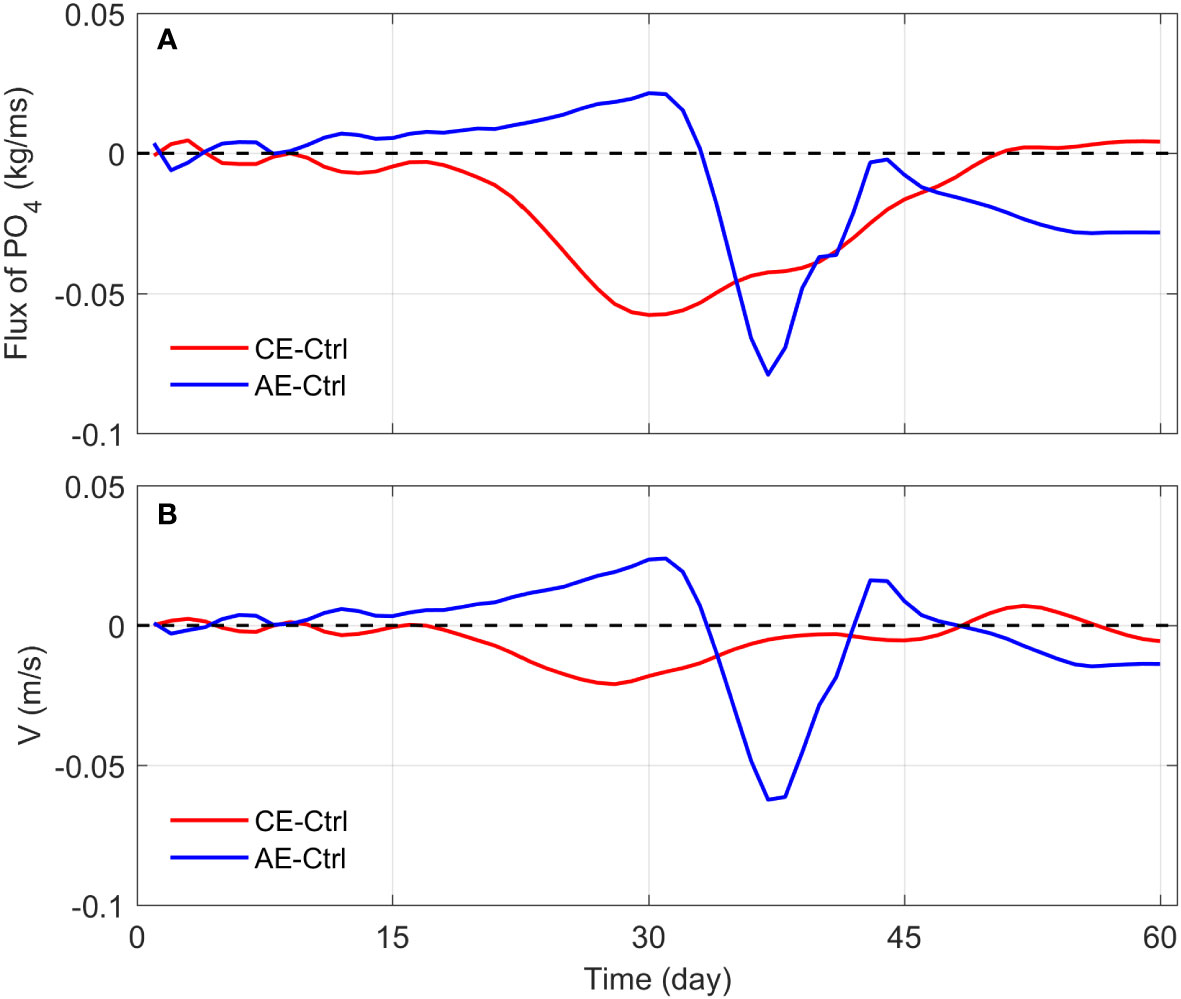
Figure 6 Time series of differences in volume-averaged cross-shelf (A) phosphate flux and (B) velocity west of 124.17°E between the eddy experiments and control run.
As the Kuroshio Current and mesoscale eddy strongly interact east of Taiwan at approximately t=30 days (Figure 6), Figure 7 further shows the vertical profiles of the cross-shelf velocity and phosphate flux west of 124.17°E along the 200 m isobaths at t=30 days. In the control run, the cross-shelf velocity and phosphate flux to the ECS continental shelf are significant to the east of 123.0°E, with the largest positive value appearing in the surface layer (Figures 7A, D). The cross-shelf velocity and phosphate flux from 123.0°E to 124.0°E are mainly toward the open ocean. Under the influence of cyclonic eddies, the on-shelf phosphate flux increases in the narrow nearshore area and decreases from 122.25°E to 123°E. The seaward phosphate flux in the far offshore area east of 123.5°E also decreases (Figure 7E). Under the influence of anticyclonic eddies, the phosphate flux decreases in the nearshore area west of 122.5°E and increases in the offshore area east of 122.5°E (Figure 7F). The variation in the cross-shelf velocity under the influence of mesoscale eddies is slightly different from that of the cross-shelf phosphate flux (Figures 7B, C). Especially under the influence of cyclonic eddies, the cross-shelf velocity obviously increases in a wider region west of 122.3°E (Figure 7B). The simulated patterns of cross-shelf velocity variation due to mesoscale eddies are consistent with the findings in Yin et al. (2017), which further illustrates the credibility of the modeling results.
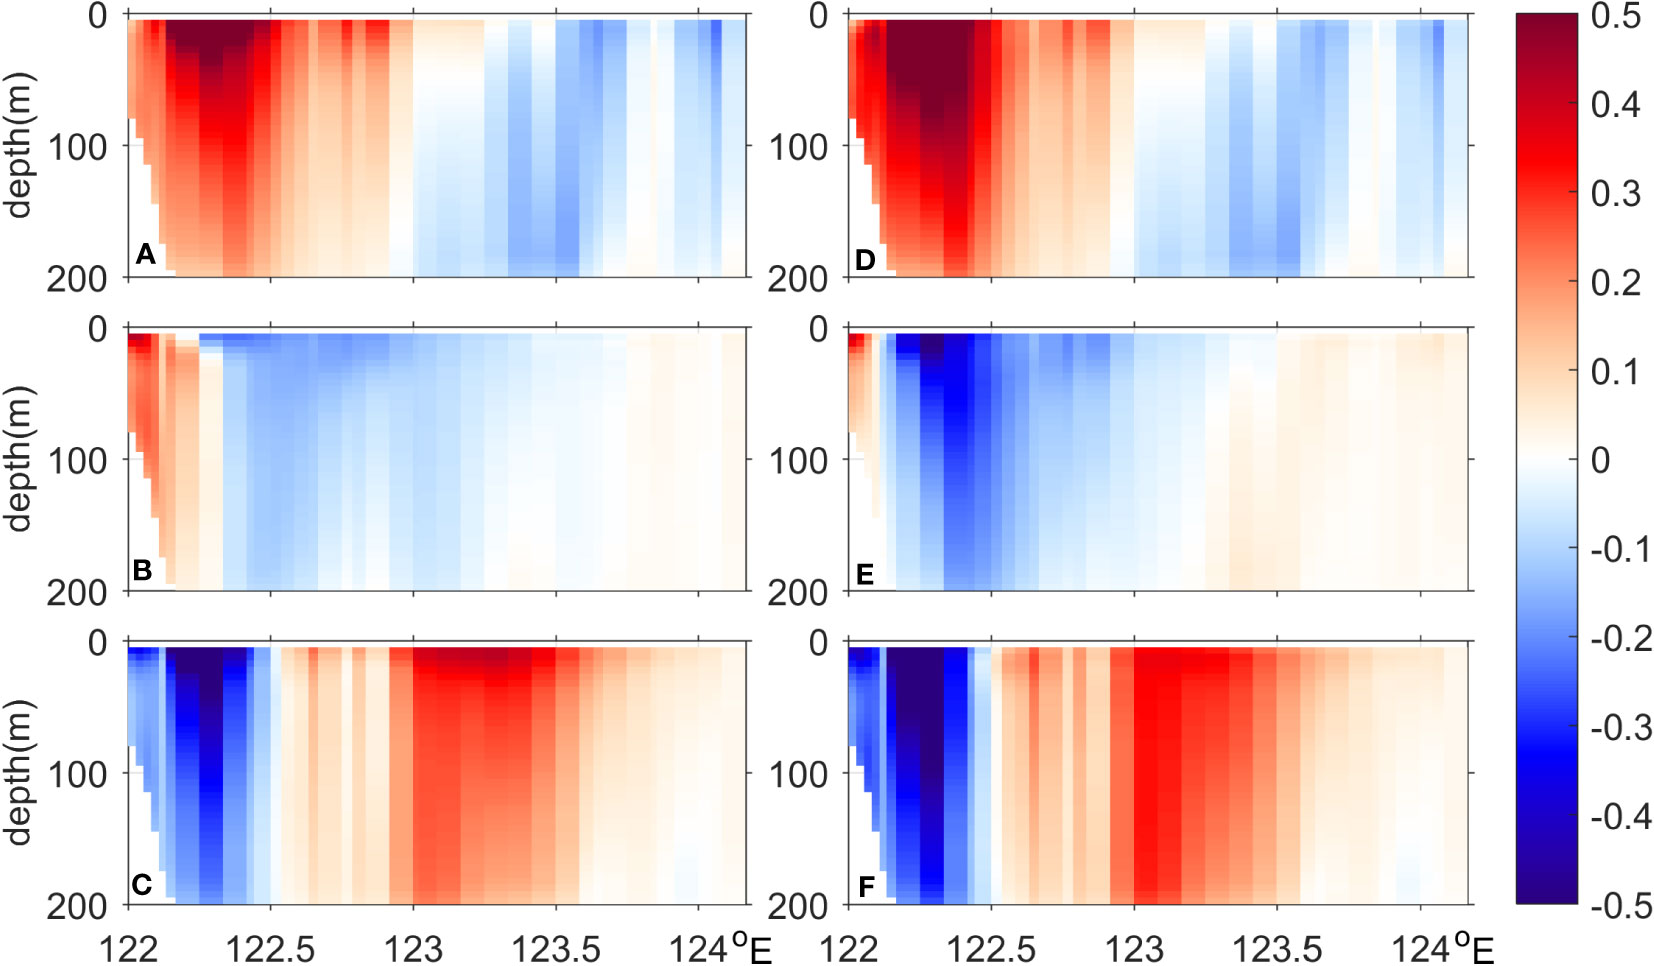
Figure 7 The (left panel) cross-shelf velocity (m/s) and (right panel) phosphate flux (kg/ms) in the (A, D) control run, and their variations under the effect of (B, E) cyclonic and (C, F) anticyclonic eddies at t=30 days.
The difference between the changes in the cross-shelf velocity and phosphate flux indicates that the eddy-induced change in the cross-shelf phosphate flux is not only controlled by the changes in the cross-shelf velocity but also affected by the changes in phosphate concentrations along the shelf. Therefore, the mechanism analysis is divided into two parts. First, we consider the dynamic mechanism of mesoscale eddies affecting the cross-shelf velocity. Second, we consider the mechanism controlling the variation in phosphate concentration along the continental shelf during the eddy-current interaction.
The dynamic mechanism inducing the variation in cross-shelf velocity is diagnosed by the three-dimensional, along-shelf momentum balance equation:
Where , and u,v,and w are zonal, meridional, and vertical velocities, respectively, f is the Coriolis parameter,p is pressure, and uH and uv represent horizontal and vertical eddy viscosity coefficients, respectively. All momentum terms are calculated instantaneously, and then the daily average results are output from the Ctrl, CE, and AE experiments. The diagnostic results during the strong interaction of the mesoscale eddy and Kuroshio Current east of Taiwan at t=30 days are analyzed.
In the Ctrl experiment, the cross-shelf velocity northeast of Taiwan is controlled by multiple processes. The contributions of the acceleration (Vaccel) and the horizontal eddy diffusion terms (Vhvisc) are negligible (Figures 8B0, F0). The contributions of the advection term (Vadv) are relatively small and show a negative effect on cross-shelf transport (Figure 8C0). The contribution of the vertical eddy viscosity term (Vvisc) is negligible in most of the sections except the near-bottom region, in which there are negative effects (Figure 8E0). The along-shelf pressure gradient term (Vprsgrd) provides a dominant contribution to the cross-shelf velocity (Figure 8D0). Figures 8A1-F1 and A2-F2 show the difference in each term between the CE and Ctrl experiments and between the AE and Ctrl experiments, respectively. The results show that the effects of cyclonic eddies and anticyclonic eddies on cross-shelf velocity are different (Figures 8A1, A2). Under the influence of cyclonic eddies, the along-shelf pressure gradient term (Vprsgrd) increases west of 122.3°E and decreases from 122.3°E to 123.7°E, which contributes the most to the change in cross-shelf velocity (Figures 8A1, D1). The advection term (Vadv) in the upper layer west of 122.3°E is also significantly changed by the cyclonic eddy and positively contributes to the increase in velocity (Figure 8C1). The increase in the vertical eddy viscosity term (Vvvisc) at the bottom of the nearshore area somewhat cancels the decrease in the advection term in the nearshore area (Figures 8C1-E1). Under the influence of anticyclonic eddies, the change in cross-shelf velocity is also mainly attributed to the change in the pressure gradient term (Vprsgrd) (Figures 8A2, D2). The change in the horizontal advection term (Vadv) shows an opposite pattern to the change in velocity (Figures 8C2). The change in the vertical eddy viscosity term (Vvvisc) at the bottom also shows a negative contribution to the increase in velocity east of 122.5°E (Figures 8E2). The eddy-induced changes in the acceleration term (Vaccel) and horizontal eddy diffusion terms (Vhvis) are also negligible (Figures 8B1, F1, B2, and F2).
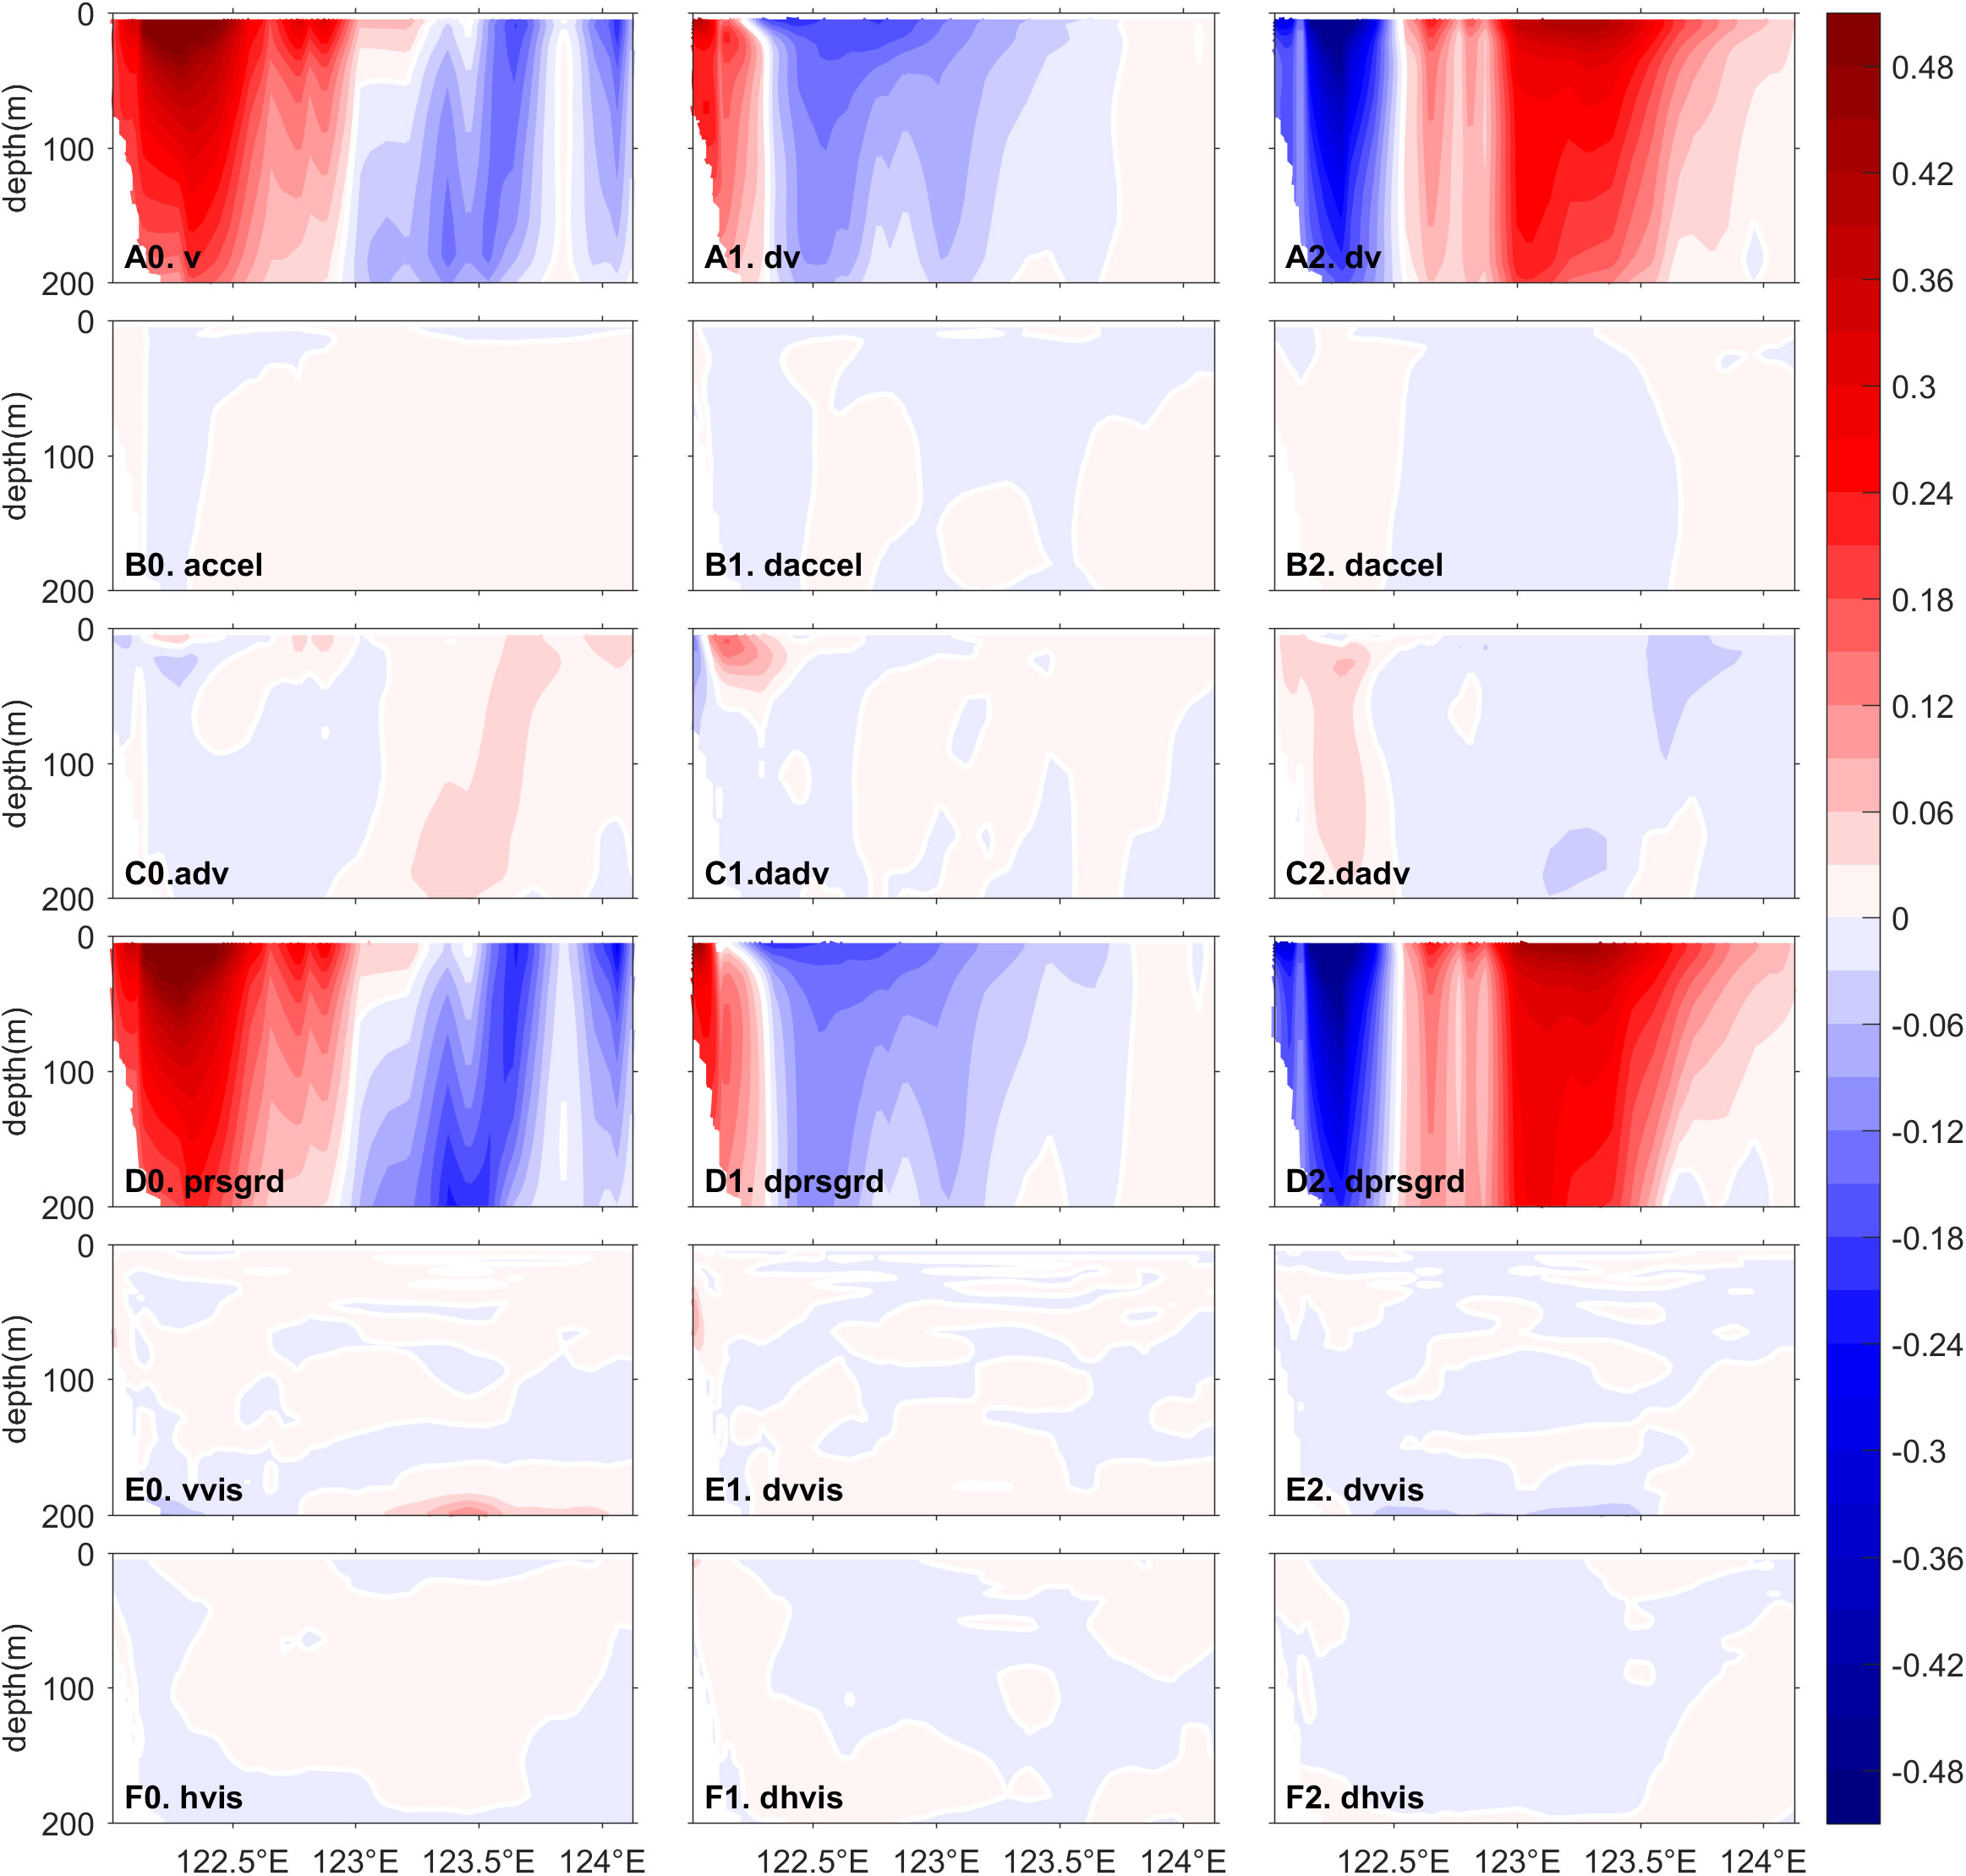
Figure 8 The cross-shelf velocity along the 200 m isobaths at t=30 days and its contributions to the cross-shelf velocity in the (A0-F0) Ctrl experiment and their variations under the effect of (A1-F1) cyclonic and (A2-F2) anticyclonic eddies (m/s). The cross-shelf velocity and contributions are the terms in momentum balance equation (2).
Therefore, the eddy-induced change in the cross-shelf geographic flow that is controlled by the along-shelf pressure gradient and the cross-shelf ageographic flow that is controlled by nonlinear advection and bottom Ekman effects together determine the change in cross-shelf velocity. The change in geographic flow has a primary positive contribution to the change in cross-shelf velocity induced by both cyclonic and anticyclonic eddies. The change in ageographic flow has a positive contribution to the change in velocity that is induced by cyclonic eddies in most of the upper layer but has a negative effect in the lower layer. However, the change in ageographic flow has a negative effect on the velocity change caused by anticyclonic eddies.
In the along-shelf momentum balance equation (2), the pressure gradient term consists of barotropic and baroclinic pressure gradient terms: , where ρ0 and g are the reference density of sea water (1025 kg/m3) and gravitational acceleration (9.8 m/s2), respectively; n and pρ represent the sea surface height and the baroclinic pressure caused by density variations, respectively. Therefore, eddy-induced changes in the along-shelf pressure gradient term can be divided into changes in the barotropic pressure gradient and baroclinic pressure gradient terms (Figure 9). The change in barotropic pressure gradient caused by mesoscale eddies determines the east–west opposite spatial pattern of the cross-shelf velocity change (Figures 9A, B). The baroclinic pressure gradient term determines the difference in velocity change between the upper and lower layers (Figures 9C, D). During the cyclonic eddy-Kuroshio Current interaction, the zonal pressure gradient in the western part of the transect increases in the nearshore area and decreases from 122.3°E to 123.7°E due to the Kuroshio mainstream migrating shoreward (Figures 4B; Hsu et al., 2016). Due to the influence of the anticyclonic eddy, the mainstream of the Kuroshio Current moves offshore northeast of Taiwan, inducing a decreased or even reverse zonal pressure gradient in the western part of the transect but inducing a significant increase in the zonal pressure gradient in the eastern part of the transect (Figures 4C). As the surface Kuroshio Current intensifies in the AE experiment and weakens in the CE experiment (e.g., Zhang et al., 2001; Lee et al., 2013; Chang et al., 2015), the effect of anticyclonic eddies on the cross-shelf velocity is more significant than that of cyclonic eddies. The mesoscale eddy not only influences the hydrodynamic feature in the upper layer but also exerts a comparable influence in the lower layer. Under the influence of cyclonic eddies, the isotherms tilt upward in most of the upper layer and the lower layer in the eastern part of the along-shelf transect but tilt downward in the nearshore area and the lower layer of the western part (Figure 10A). Therefore, the change in baroclinic geostrophic flow weakens the on-shelf velocity in the upper layer and strengthens the on-shelf velocity in the lower layer on most of the isobath transect (Figure 9C). Under the influence of anticyclonic eddies, the isotherms tilt upward in the western part and tilt downward in the upper layer of the narrow nearshore area and eastern part, inducing a maximum density increase at 122.5°E (Figure 10B). Hence, the baroclinic geostrophic flow associated with the density induced by anticyclonic eddies strengthens the on-shelf velocity in the lower layer west of 122.5°E and in the upper layer east of 122.5°E. However, it weakens the on-shelf velocity in the upper layer of the nearshore region west of 122.5°E and in the lower layer east of 122.5°E (Figure 9D).
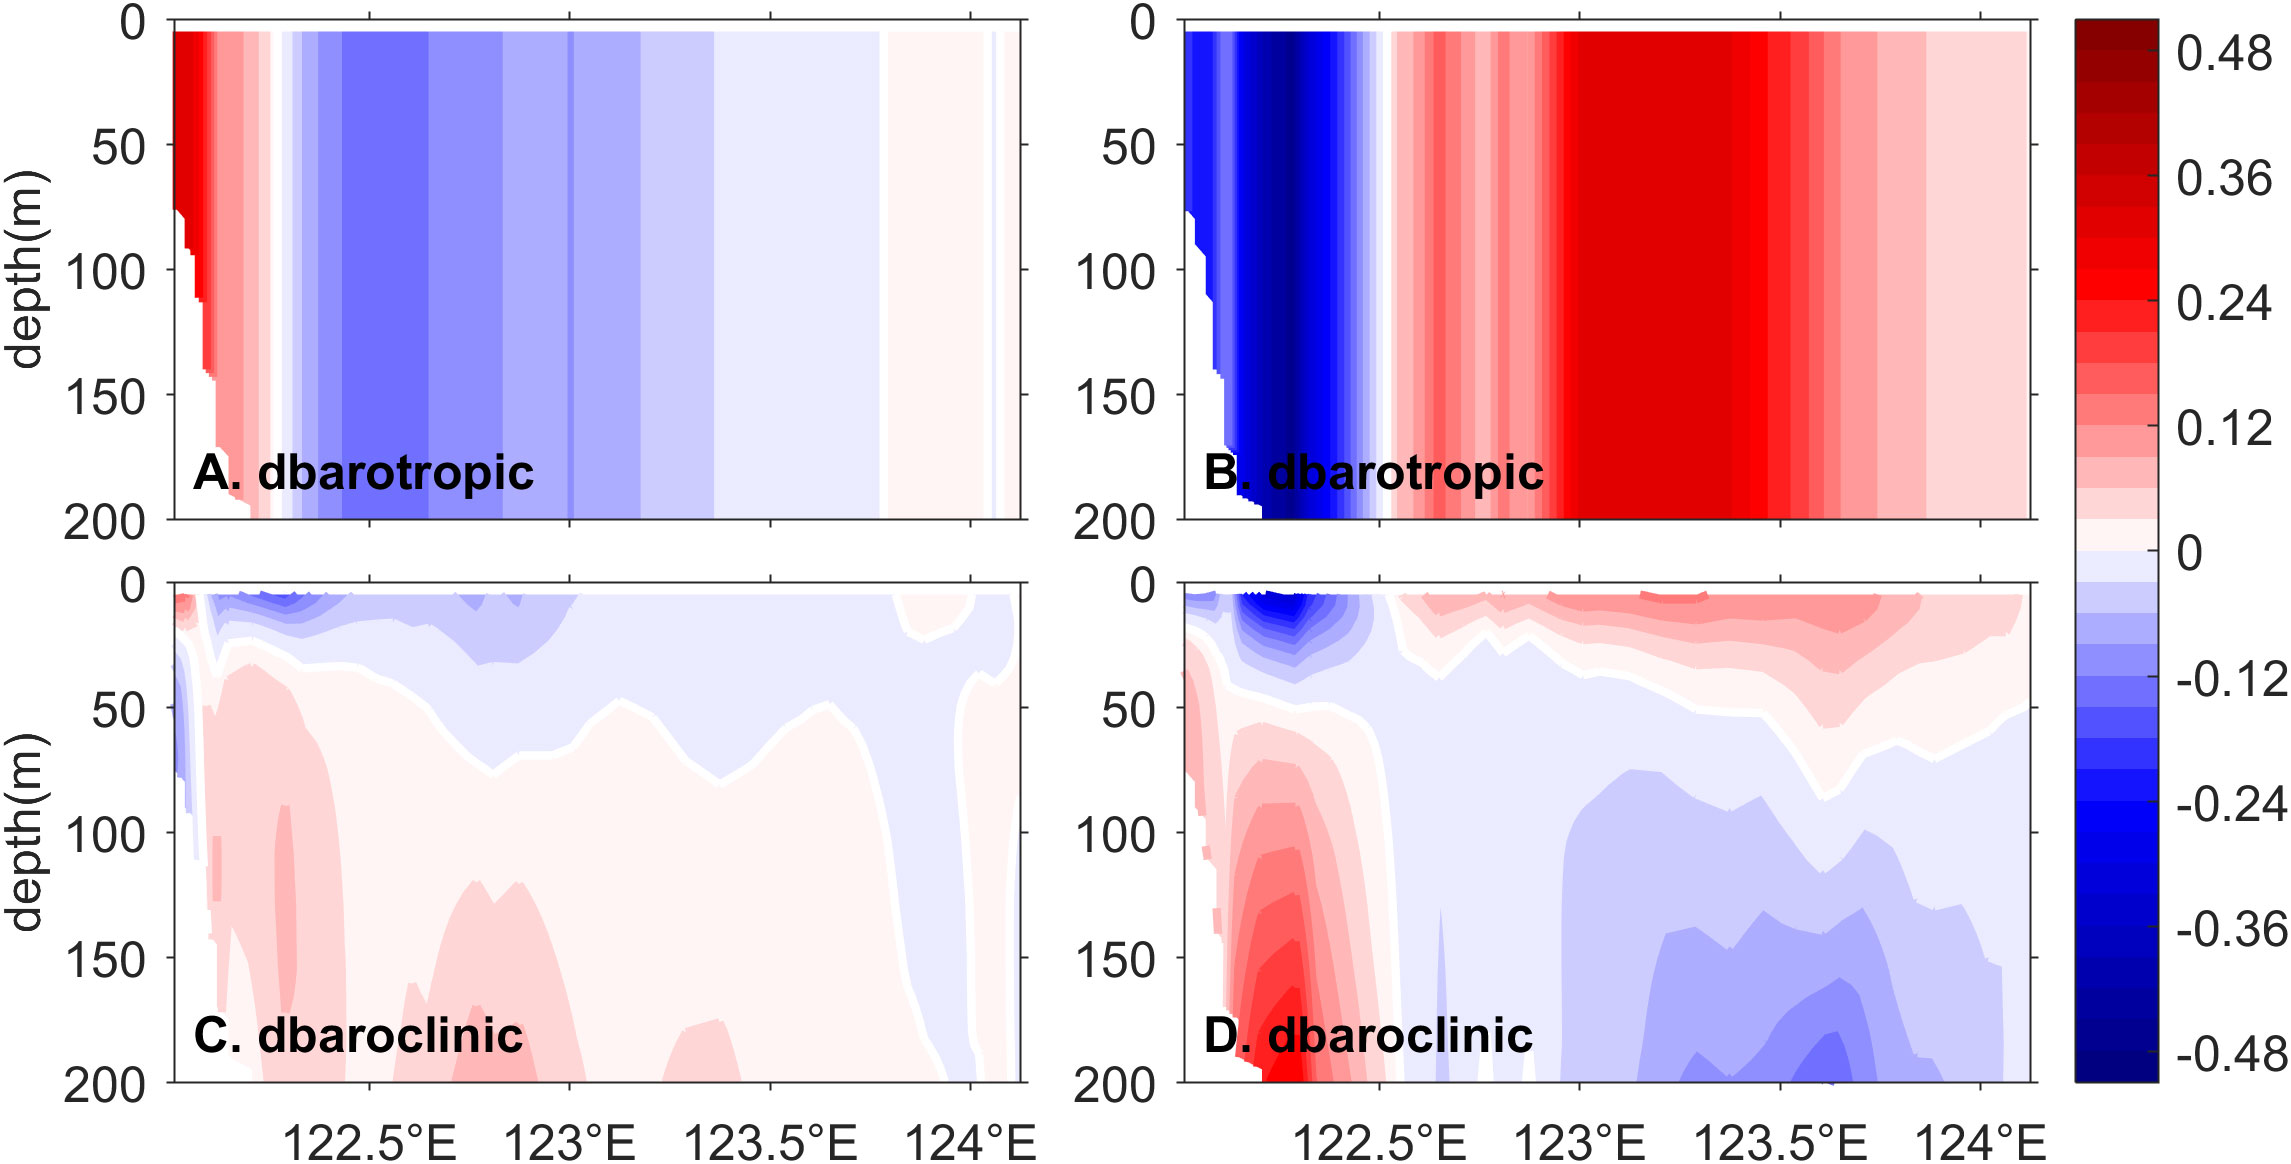
Figure 9 The decomposition of the variation in the pressure gradient contribution term (m/s) along the 200 m isobaths at t=30 days under the influence of (A, C) cyclonic and (B, D) anticyclonic eddies.
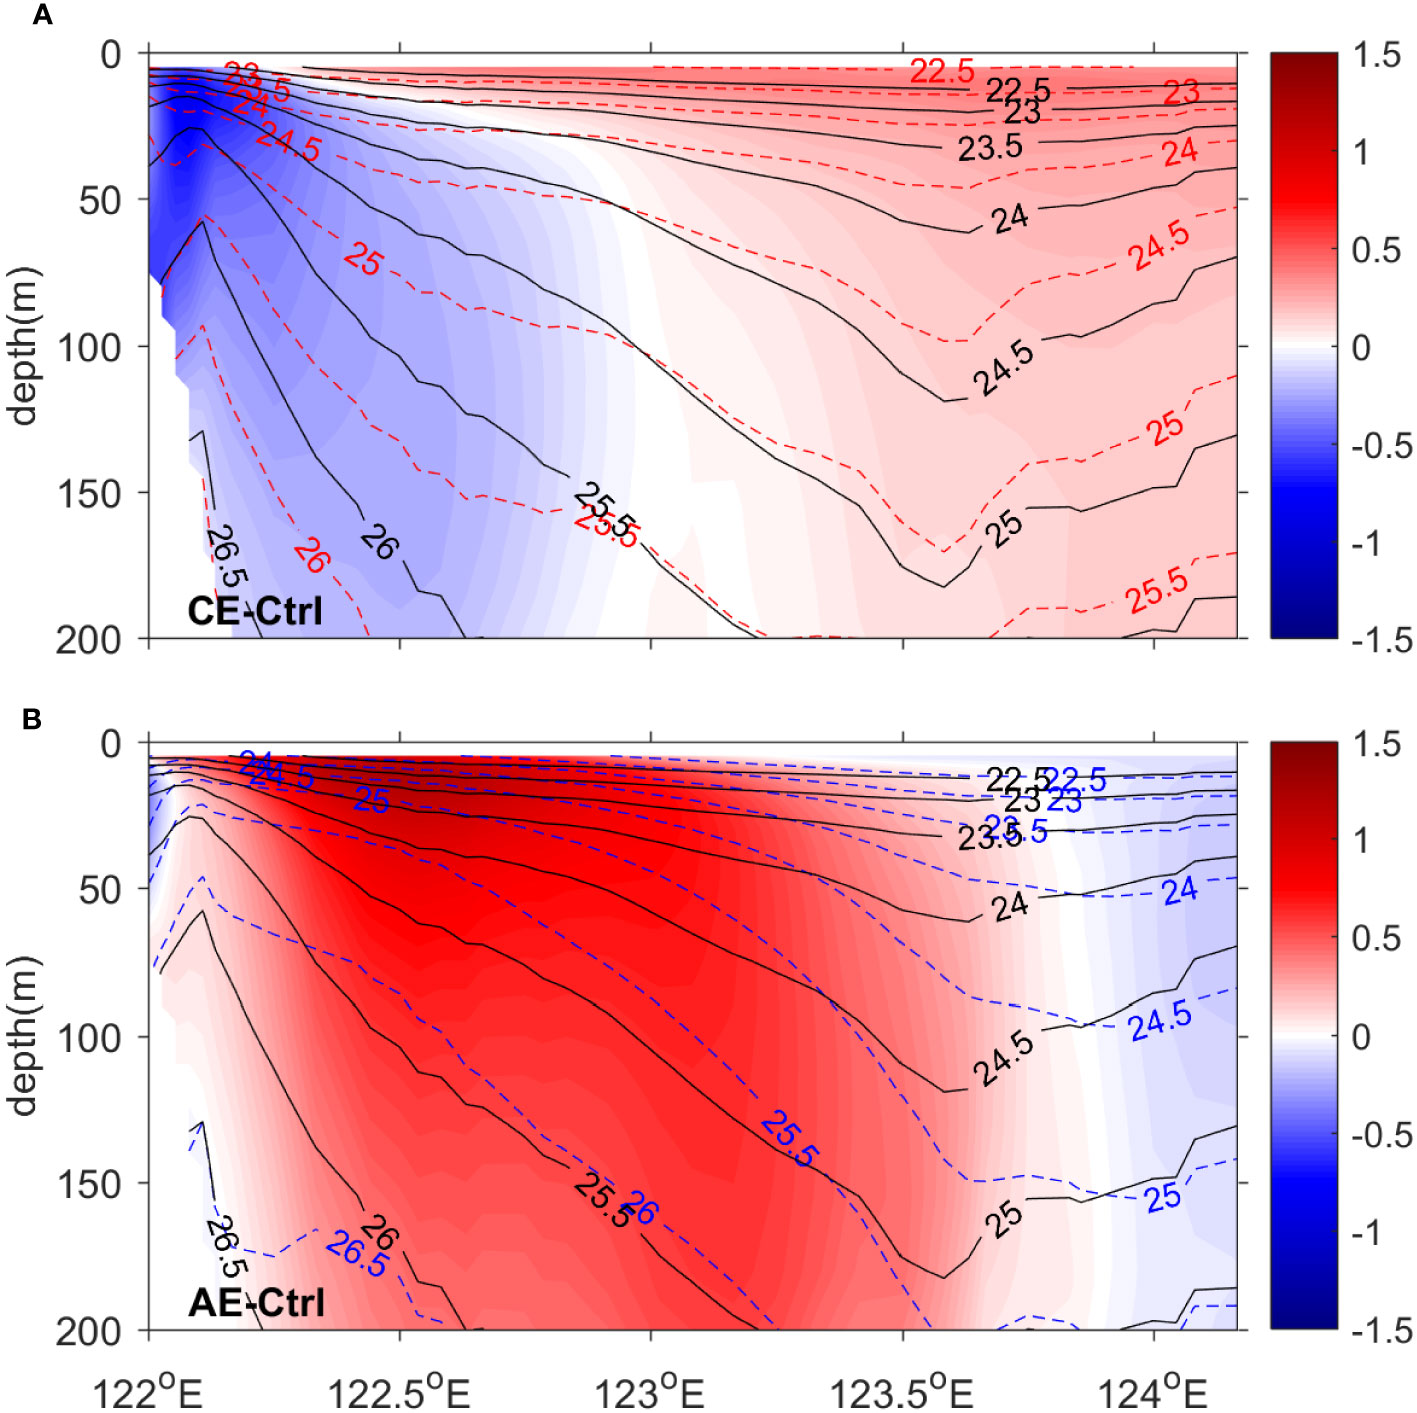
Figure 10 Difference in density (kg/m3) along the 200 m isobaths between (A) the CE and Ctrl experiments and (B) the AE and Ctrl experiments. The density contours in the Ctrl, CE, and AE experiments are labeled by black solid lines, red dashed lines, and blue dashed lines, respectively.
Due to the upwelling and mixing processes during the intrusion of the Kuroshio Current onto the ECS continental shelf, the phosphate concentration is relatively high along the 200 m isobaths west of 123°E in the Ctrl experiment (Figure 11A). Meanwhile, the phosphate concentration is higher in the lower layer than in the upper layer, which is consistent with the observations of previous studies (Chen et al., 1994; Chen et al., 1995; Xu et al., 2020). Under the influence of cyclonic eddies, the phosphate concentration decreases along the entire transect, with the largest decrease occurring in the subsurface layer (Figure 11B). The decrease in phosphate concentration west of 122.5°E is significant, resulting in a difference between the cross-shelf velocity change and phosphate flux change from 122.1°E to 122.3°E and a significant decrease in phosphate flux from 122.1°E to 122.35°E (Figures 7B, E). Under the influence of the anticyclonic eddy, the phosphate concentration increases in the whole water column west of 123.4°E and in the lower layer east of 123.4°E but decreases in the upper layer east of 123.4°E (Figure 11C). The change in phosphate concentration induced by anticyclonic eddies is relatively small, especially in the region west of 122.3°E. Thus, the phosphate flux decreases west of 122.5°E and increases east of 122.5°E, similar to the cross-shelf velocity (Figures 7C, F).
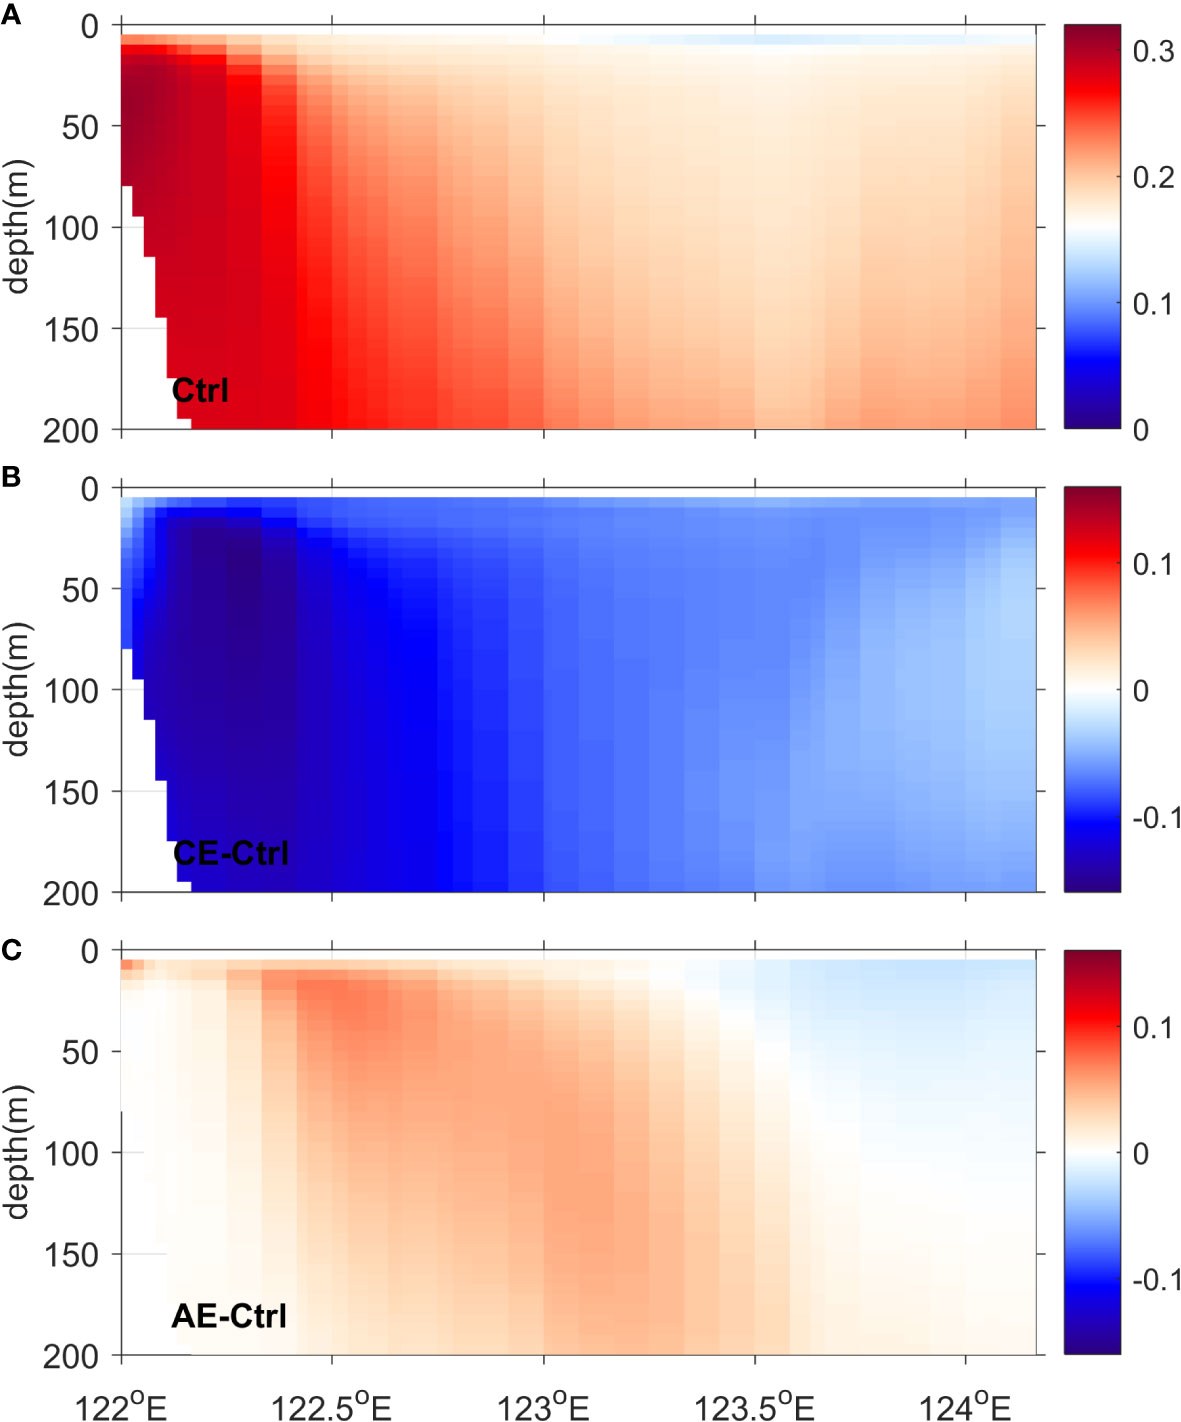
Figure 11 The phosphate concentration (kg/m3) along the 200 m isobaths in the (A) Ctrl experiment, and their variations under the influence of (B) cyclonic and (C) anticyclonic eddies at t=30 days.
Without biochemical processes, the change in phosphate concentration is controlled by the advection-diffusion equation:
where Pt is the phosphate concentration; u,v, and w are the velocities in different directions that are calculated by the hydrodynamic model; KPt represents the vertical diffusivity coefficient; and DPt and SPt represent the horizontal diffusion term and the external source term, respectively. By integrating this equation, the causes of phosphate variation can be clarified. In this study, there is no external source (exsrc=0). Figure 12 presents the eddy-induced changes in the other contribution terms in equation (3) that are integrated from t=1 day to t=30. It shows that whether under the influence of cyclonic or anticyclonic eddies, the changes in the horizontal and vertical advection terms are one order of magnitude larger than those of the other terms. The variation in phosphate concentration is determined by the horizontal and vertical advection terms and slightly regulated by the horizontal diffusion terms (Figures 12A-H). The changes in the vertical diffusion term are negligible (Figures 12I, J). Under the influence of cyclonic eddies, most of the decrease in phosphate concentration is caused by significant decreases in the horizontal advection term in the upper layer and decreases in the vertical advection term in the lower layer (Figures 12A, C and E). The opposite pattern appears only in a narrow area near 122.3°E. The change in the horizontal diffusion term tends to intensify the decrease in the bottom layer (Figure 12G). Under the influence of anticyclonic eddies, except for the narrow area near 122.3°E, the changes in the upper horizontal advection term and lower vertical advection term also contribute the most to the changes in the phosphate concentration (Figures 12B, D and F). The horizontal diffusion term tends to intensify the increase in the nearshore area and the bottom layer (Figure 12H). Thus, under the influence of cyclonic and anticyclonic eddies, what are the major reasons for the changes in the upper horizontal advection term and lower vertical advection term? To answer this question, we analyze the horizontal evolution processes of the phosphate change in the surface layer and the variation in the vertical velocity along the 200 m isobaths.
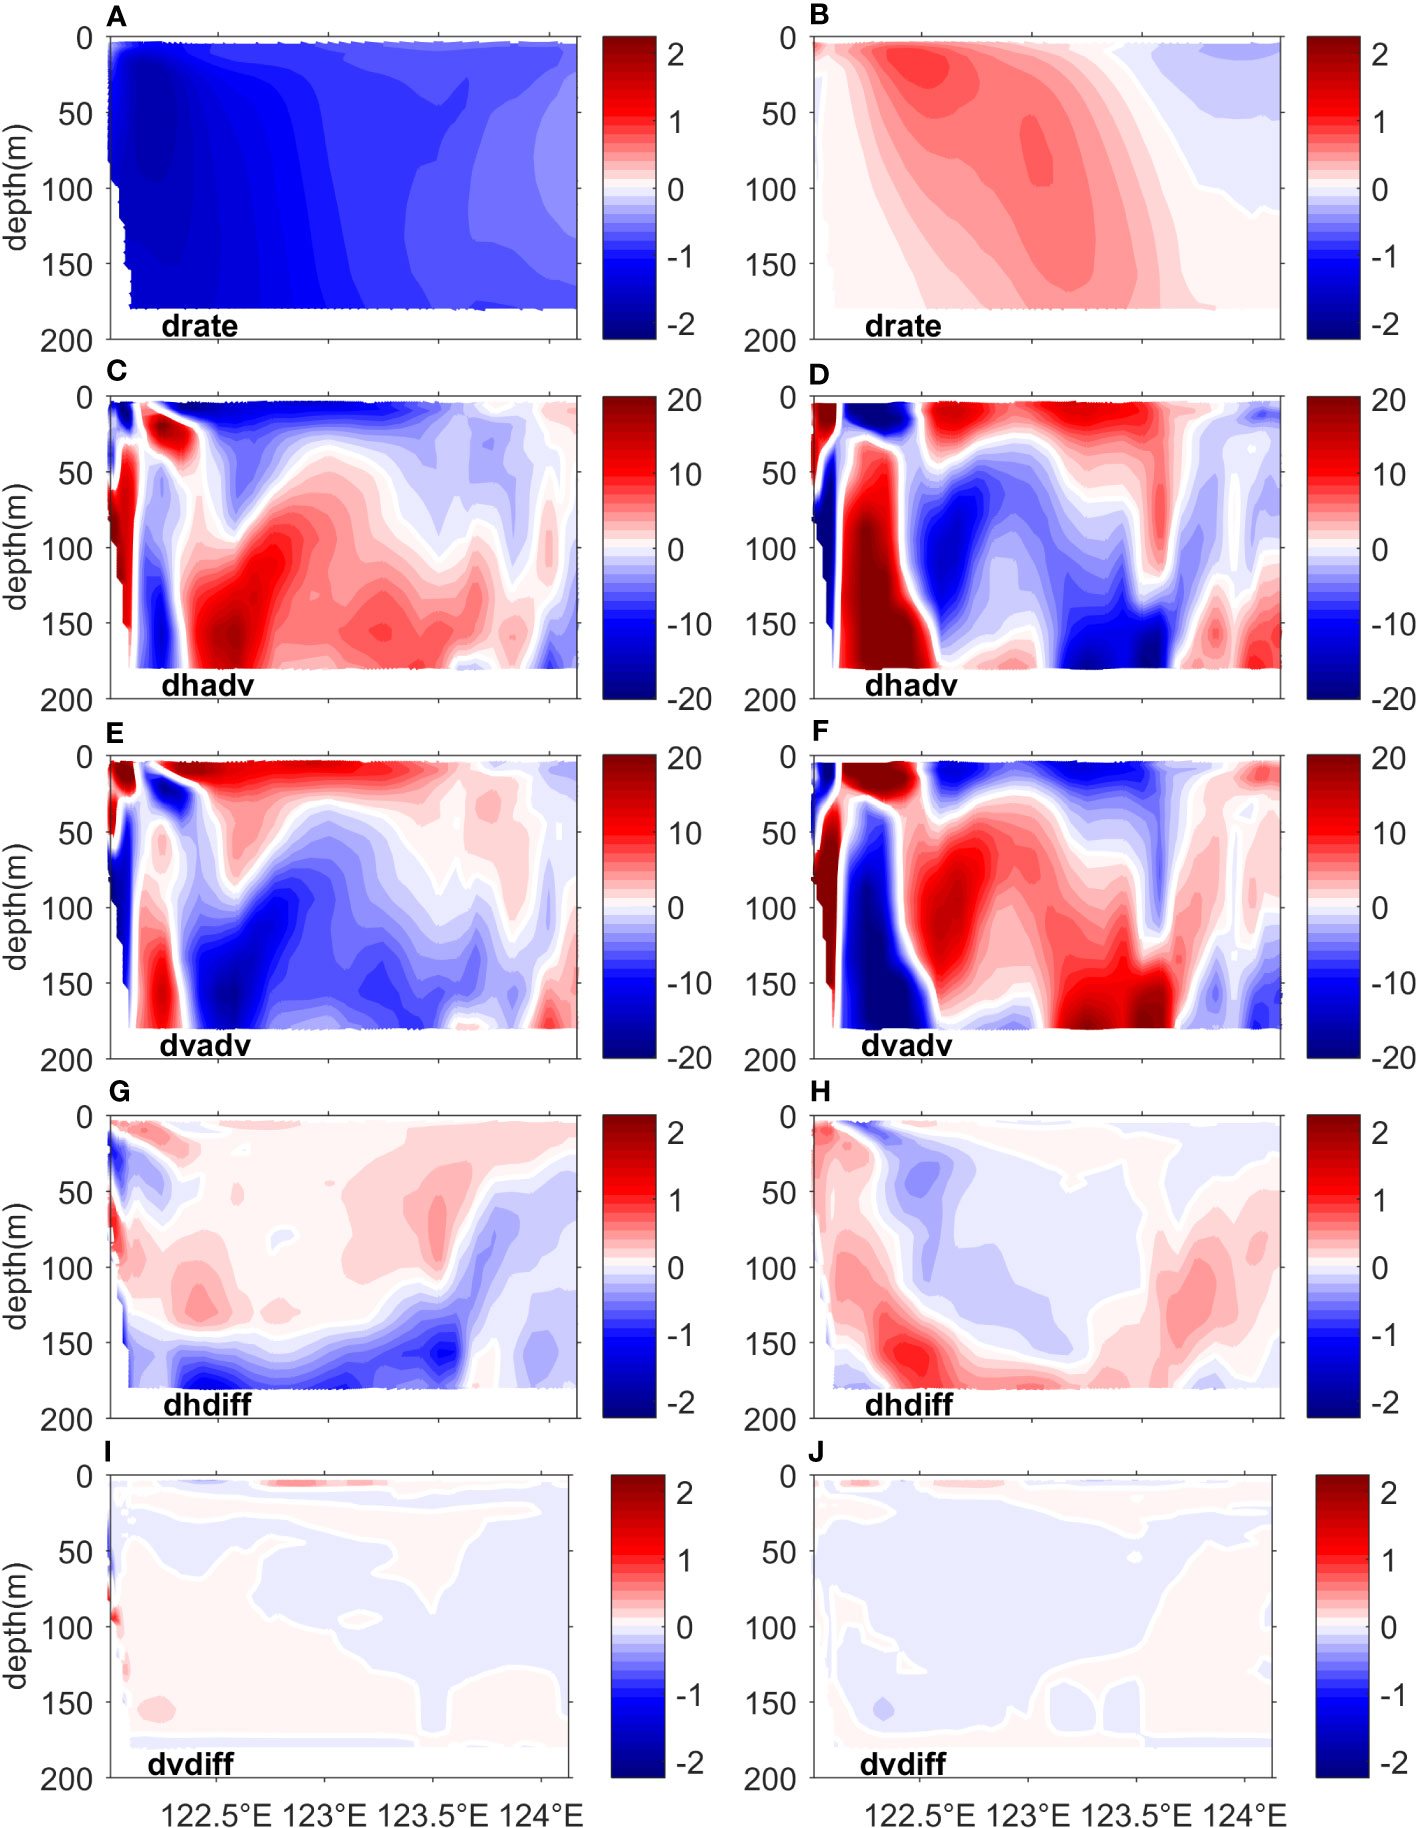
Figure 12 The variation in time-integrated contribution terms (10-6 kg/m3/s) in the diffusion equation (3) along the 200 m isobaths from t=1 day to t=30 days under the effect of (A, C, E, G and I) cyclonic and (B, D, F, H and J) anticyclonic eddies.
Figure 13 presents the changes in the surface phosphate concentration under the influence of cyclonic and anticyclonic eddies at t=1 day, 10 days, 20 days, and 30 days. The phosphate concentration decreases (increases) southwest of the cyclonic (anticyclonic) eddy center at the earliest time step (Figures 13A, B). This decrease (increase) in phosphate rapidly expands northward over time due to the northward Kuroshio Current, resulting in a decrease (increase) in phosphate concentration along the 200 m isobaths (Figures 13C-H). Based on observations and numerical simulations, previous studies have indicated mass convergence and divergence in different locations from the eddy center during their interaction with the Kuroshio Current (Kuo and Chern, 2011; Yang et al., 2013; Chang et al., 2015; Yan et al., 2016). The convergence and divergence of the water mass affect the vertical transport of materials. The consistent change in the vertical advection term (Figures S1E, F) and change trend term (Figures S1A, B) further shows that convergence and divergence during the eddy-Kuroshio interaction lead to changes in vertical advection, which then cause a change in phosphate concentration of the upper layer.
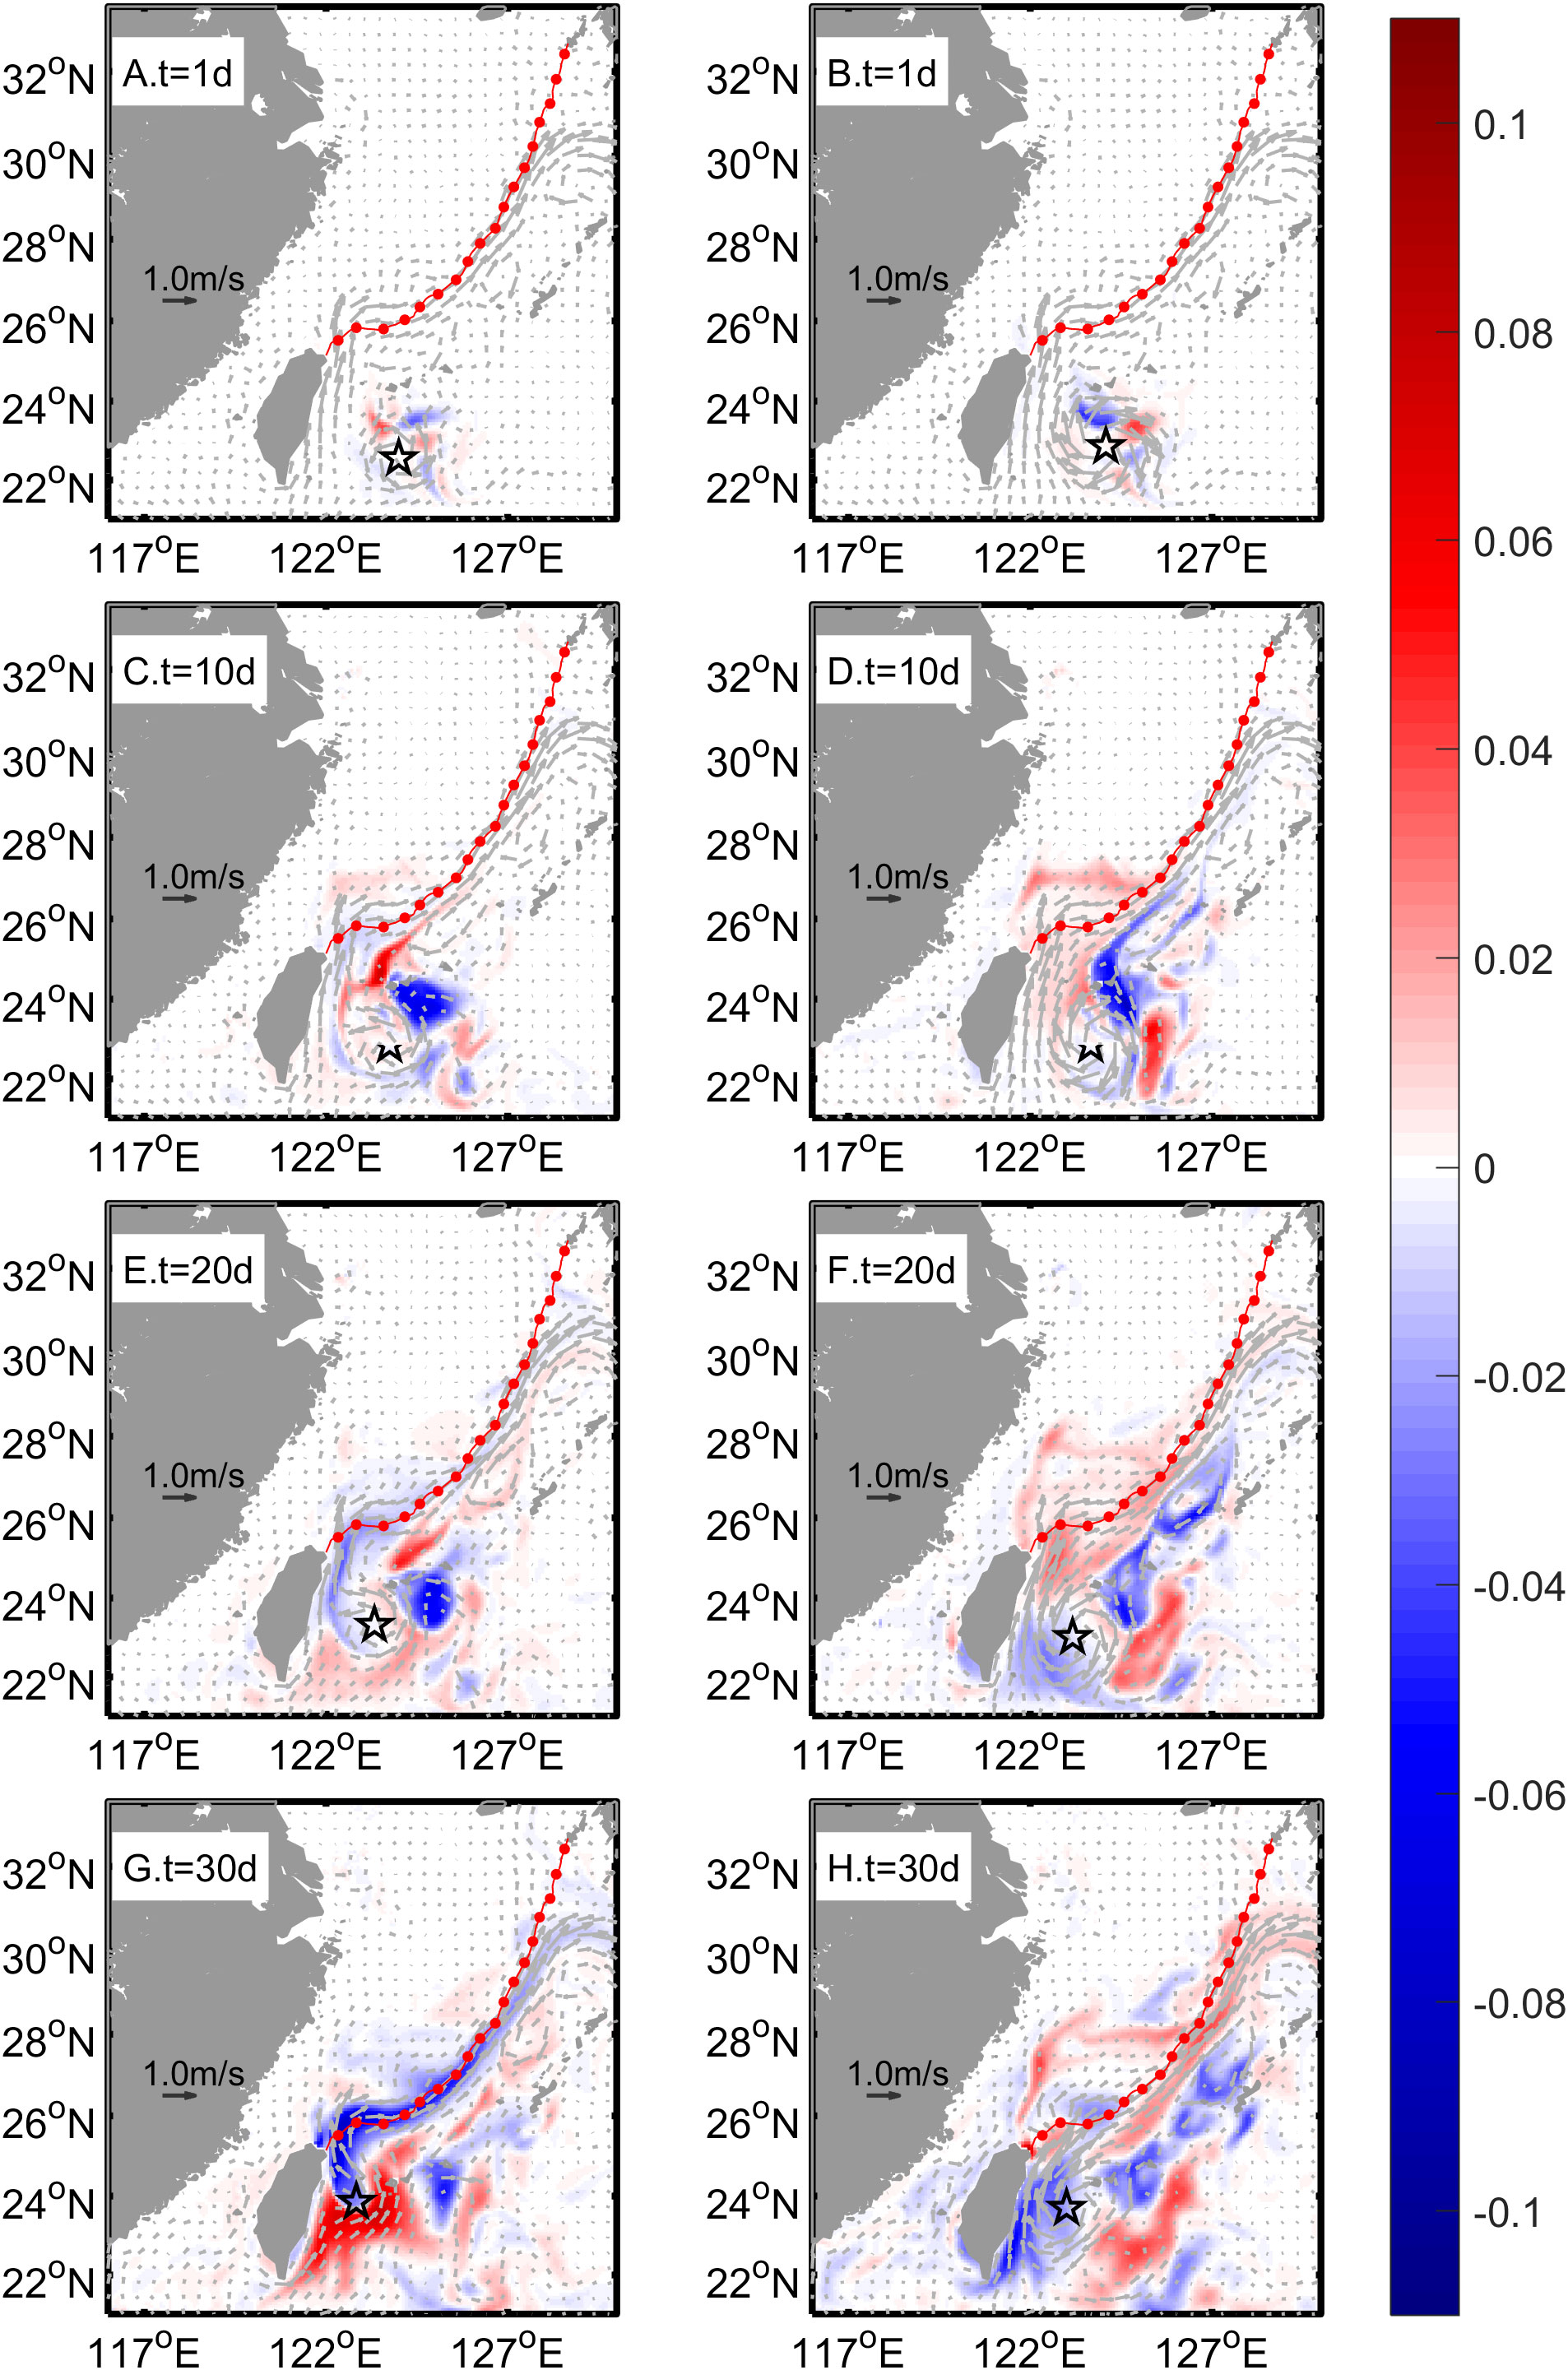
Figure 13 The variations in surface phosphate concentration (kg/m3) under the influence of (left panels) cyclonic and (right panels) anticyclonic eddies at t=(A, B) 1 day, (C, D) 10 days, (E, F) 20 days, and (G, H) 30days. The surface current fields at different times are included. The red dashed lines indicate the 200 m isobaths. The black stars indicate the location of the eddy center.
Over the slope, the vertical velocity in the water column between the top and bottom Ekman layers can be simplified as follows (Pedlosky, 1986; Yang et al., 2018):
Where φ(z) is a function of the depth, is the horizontal velocity in the ocean interior, and ∇hB is the topography gradient. According to equation (4), the vertical velocity along the 200 m isobaths is closely related to the cross-shelf velocity. Under the influence of cyclonic (anticyclonic) eddies, the cross-shelf velocity increases (decreases) in the narrow western part of the 200 m isobaths and decreases (increases) in the wide area in the east (Figures 7B, C), which correspondingly leads to a vertical velocity decrease (increase) in the east and increase (decrease) in the wide western part (Figures S2B, C). Compared with the change in the vertical advection term in Figures 12E, F, the change in vertical velocity along the 200 m isobaths is inferred to causes the change in vertical advection, leading to the change in the phosphate concentration. In other words, under the influence of cyclonic (anticyclonic) eddies, the decrease (increase) in vertical velocity weakens (intensifies) the upwelling of deeper nutrient-rich water, leading to a decrease (increase) in the phosphate concentration of the lower layer along the 200 m isobaths.
It has been reported that the intensity of Kuroshio inflow is closely related with the latitude of the eddy’s center east of Taiwan (Yan et al., 2016). Therefore, eight experiments are further designed. The initial latitudes of the eddy center are 22.93°N (CE01/AE01), 22.55°N (CE02/AE02), 22.16°N (CE03/AE03), and 21.85°N (CE04/AE04), respectively. The initial longitudes of the eddy center in all eight experiments are 124°E (Figure 14A). Figures 14B and 14C show the time series of volume-averaged cross-shelf phosphate flux variations in different experiments. Under the influence of cyclonic eddies, variation in the cross-shelf phosphate flux delays with the initial position of eddies moving equatorward (Figure 14B). When the cyclonic eddy initially locates at 22.55°N, the phosphate flux decreases the most, while the maximum decreases in other experiments are comparable. Although cyclonic eddies generally reduce the cross-shelf phosphate flux, when attention is paid to variations at specific times, the southernmost eddy causes the opposite effect on cross-shelf phosphate flux compared with eddies at other initial positions at t=30 days. Therefore, it is very important to clarify the time when exploring the influence of eddies at different positions. Under the influence of anticyclonic eddies, the occurrence time of the maximum variation in phosphate flux also delays with the initial position of eddies moving equatorward (Figure 14C). Meanwhile, the intensity of the maximum variation decreases with the equatorward moving of the initial position. Above all, the cyclonic eddies still weaken the cross-shelf phosphate flux and the anticyclonic eddies still increase the cross-shelf phosphate flux during their strong interactions with the Kuroshio Current east of Taiwan. In summary, although the intensity and time of the influencing of mesoscale eddies on the cross-shelf phosphate flux varies with initial latitude of eddy center, the essential characteristics of their influence on the cross-shelf phosphate flux is consistent.
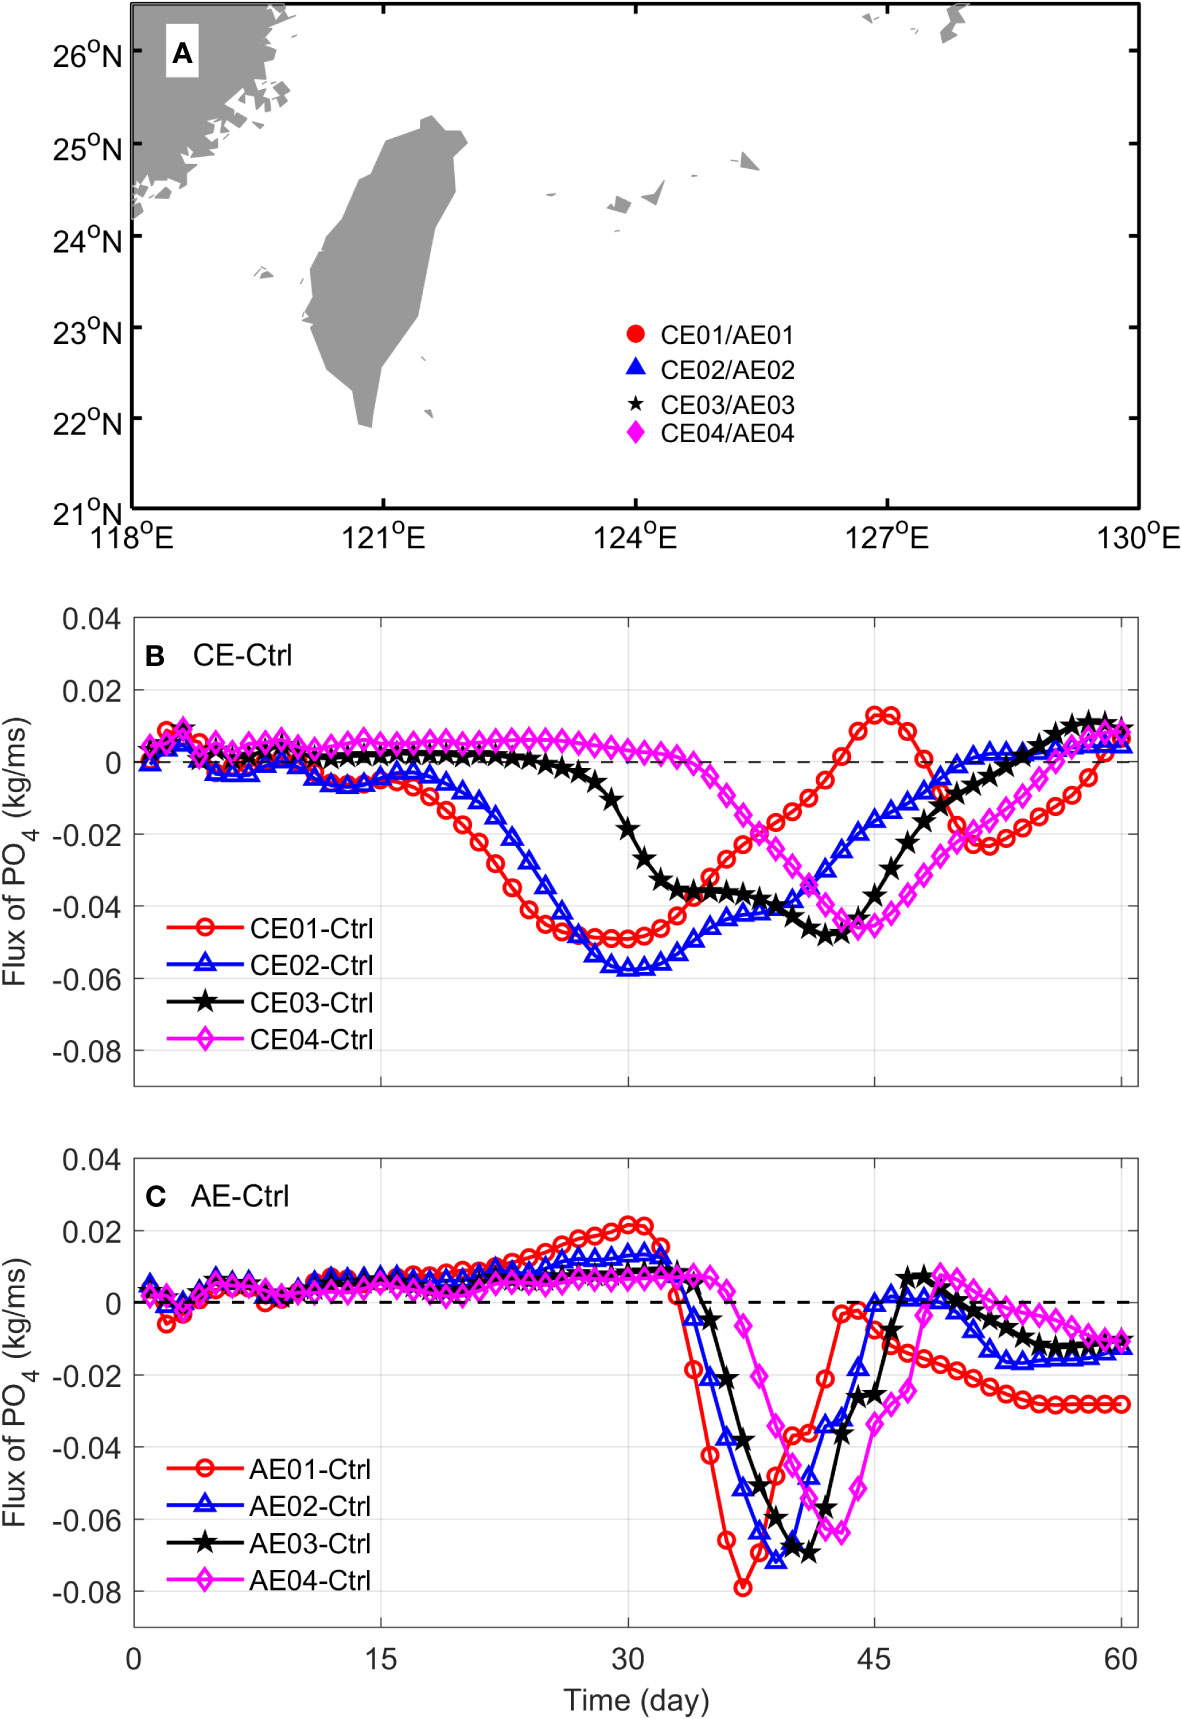
Figure 14 The (A) initial location of eddies for different experiments and (B, C) time series of differences in volume-averaged cross-shelf phosphate flux west of 124.17°E between the eddy experiments and control run.
It is worth noting that the above experiments and analyses consider only physical processes, in effort to elucidate the influence of mesoscale eddies on the phosphate transport across the continental shelf and its underlying mechanism from a dynamic perspective. However, in the real ocean, the distribution of nutrients is also affected by biochemical processes, which are complex and cannot be ignored. For example, the increased phosphate concentration induced by the anticyclonic eddy can feed more phytoplankton, which may in turn lead to a reduced phosphate concentration in the euphotic layer. Therefore, more comprehensive studies are needed to provide a better understanding of the effects of mesoscale eddies on cross-shelf nutrient transport and biogeochemical processes on the ECS continental shelf in the future.
The influence of mesoscale eddies on cross-shelf Kuroshio phosphate transport to the ECS continental shelf is explored based on a hydrodynamic model with constructed ideal cyclonic and anticyclonic eddies. The simulation results reveal the different effects of cyclonic and anticyclonic eddies on the cross-shelf phosphate flux along the 200 m isobaths. During the strong eddy-current interaction east of Taiwan, the cyclonic eddy reduces the volume-averaged phosphate flux, which increases in the western and eastern parts and decreases in the middle of the region. However, the anticyclonic eddy increases the volume-averaged phosphate flux with a decreasing spatial pattern in the western part and an increase in the central and eastern part of the region. As the cyclonic eddies decay, their influence on the cross-shelf phosphate flux northeast of Taiwan is weakened. With the strengthening and eastward movement of the anticyclonic eddies, the on-shelf phosphate flux northeast of Taiwan decreases, and the affected area extends eastward.
The variation in the cross-shelf phosphate flux is controlled by variations in the cross-shelf velocity and the along-shelf phosphate concentration. The momentum balance analysis suggests that the change in the cross-shelf velocity is caused mainly by the change in the pressure gradient and modulated by the change in the nonlinear contribution term. The barotropic variation associated with sea surface height is attributed to the horizontal migration of the Kuroshio mainstream under the influence of mesoscale eddies. The baroclinic variation is associated with isotherm tilting in the vertical direction. Analysis of the advection-diffusion equation indicates that the variation in the phosphate concentration along the shelf is mainly attributed to the significant changes in horizontal advection in the upper layer and vertical advection in the lower layer that are induced by changes in the Kuroshio surface phosphate concentration and the vertical velocity along the 200 m isobaths, respectively. Further experiments reveal that the initial latitude of the eddy center affects the timing and magnitude of the cross-shelf phosphate flux but does not change the basic pattern of variation in the phosphate flux under the influences of cyclonic and anticyclonic eddies.
This study reveals the opposite effects of cyclonic and anticyclonic eddies on the cross-shelf phosphate flux during strong eddy-current interactions and the opposite changes in the phosphate flux with the evolution and movement of anticyclonic eddies. This result implies the importance of the eddy-Kuroshio interaction location and provides important implications for the possible responses of the ECS ecosystem to mesoscale eddies that may be triggered by enhanced typhoons in the northwestern Pacific Ocean under global warming. In addition, the difference between the eddy-induced changes in cross-shelf phosphate flux and changes in the water flux indicates the necessity of a specific study on material flux across the shelf.
The datasets presented in this study can be found in online repositories. (http://dx.doi.org/10.12157/IOCAS.20221025.015).
LX and DY designed the original ideas. LX and XF performed the data processing and analyses. DY, JS, and BY contribute to the concept of the manuscript. LX wrote the original manuscript, XF, JS, GG, XC and BY revised and improved the manuscript. All authors contributed to the article and approved the submitted version.
This study was supported by the Strategic Priority Research Program of the Chinese Academy of Sciences (No. XDA19060203), National Natural Science Foundation of China (NSFC) (Nos. 42206011, 92158202, 41876019, 42076022, and 42090044), project supported by Shandong Provincial Natural Science Foundation (ZR2020QD064), project funded by China Postdoctoral Science Foundation (2020M682218), Strategic Priority Research Program of the Chinese Academy of Sciences (Nos. XDB42000000 and XDA19060202), and Laoshan Laboratory Science and Technology Innovation Project (No.LSKJ202202504), It was also supported by the High Performance Computing Center at the IOCAS, and the Youth Innovation Promotion Association CAS.
The authors declare that the research was conducted in the absence of any commercial or financial relationships that could be construed as a potential conflict of interest.
All claims expressed in this article are solely those of the authors and do not necessarily represent those of their affiliated organizations, or those of the publisher, the editors and the reviewers. Any product that may be evaluated in this article, or claim that may be made by its manufacturer, is not guaranteed or endorsed by the publisher.
The Supplementary Material for this article can be found online at: https://www.frontiersin.org/articles/10.3389/fmars.2022.1079418/full#supplementary-material
Supplementary Figure 1 | The variation in contribution terms (10-6 kg/m3/s) in the diffusion equation (3) in the surface layer at t=1 day under the effect of (left panels) cyclonic and (right panels) anticyclonic eddies. The black circles indicate the eddy centers. The orthogonal black solid lines are reference lines.
Supplementary Figure 2 | The time-integrated vertical velocities (m/s) along the 200 m isobaths in the (A) Ctrl experiment, and their variations under the influence of (B) cyclonic and (C) anticyclonic eddies from t=1 day to t=30 days.
Chang Y., Miyazawa Y., Guo X. (2015). Effects of the STCC eddies on the kuroshio based on the 20-year JCOPE2 reanalysis results. Prog. Oceanogr. 135, 64–76. doi: 10.1016/j.pocean.2015.04.006
Chang Y., Shih Y.-Y., Tsai Y.-C., Lu Y.-H., Liu J. T., Hsu T.-Y., et al. (2022). Decreasing trend of kuroshio intrusion and its effect on the chlorophyll-a concentration in the Luzon strait, south China Sea. GISci. Remote Sens. 59 (1), 633–647. doi: 10.1080/15481603.2022.2051384
Chelton D. B., Gaube P., Schlax M. G., Early J. J., Samelson R. M. (2011). The influence of nonlinear mesoscale eddies on near-surface oceanic chlorophyll. Science 334, 328–332. doi: 10.1126/science.1208897
Chen C. (1996). The kuroshio intermediate water is the major source of nutrients on the East China Sea continental shelf. Oceanologica Acta 19, 523–527.
Chen C. A. (2009). Chemical and physical fronts in the bohai, yellow and East China seas. J. Mar. Syst. 78, 394–410. doi: 10.1016/j.jmarsys.2008.11.016
Cheng Y., Ho C., Zheng Q., Qiu B., Hu J., Kuo N. (2017). Statistical features of eddies approaching the kuroshio east of Taiwan island and Luzon island. J. Oceanogr. 73, 427–438. doi: 10.1007/s10872-017-0411-7
Chen G., Hou Y., Zhang Q., Chu X. (2010). The eddy pair off eastern Vietnam: Interannual variability and impact on thermohaline structure. Continental Shelf Res. 30, 715–723. doi: 10.1016/j.csr.2009.11.013
Chen D., Lian E., Shu Y., Yang S., Li Y., Li C., et al. (2020). Origin of the springtime south China Sea warm current in the southwestern Taiwan strait: Evidence from seawater oxygen isotope. Scince China Earth Sci. 63, 1564–1576. doi: 10.1007/s11430-019-9642-8
Chen C. T. A., Liu C. T., Pai S. C. (1994). Transport of oxygen, nutrients and carbonates by the kuroshio current. Chin. J. Oceanol. Limnol. 12, 220–227. doi: 10.1007/BF02845167
Chen C. T. A., Ruo R., Paid S. C., Liu C. T., Wong G. T. F. (1995). Exchange of water masses between the East China Sea and the kuroshio off northeastern Taiwan. Continental Shelf Res. 15, 19–39. doi: 10.1016/0278-4343(93)E0001-O
Chen C. A., Wang S. (1999). Carbon, alkalinity and nutrient budgets on the East China Sea continental shelf. J. Geophysical Res.: Oceans 104, 20675–20686. doi: 10.1029/1999JC900055
Chern C., Wang J. (2005). Interactions of mesoscale eddy and Western boundary current: A reduced-gravity numerical model study. J. Oceanogr. 61, 271–282. doi: 10.1007/s10872-005-0037-z
Chow C. H., Tseng Y., Hsu H., Young C. (2017). Interannual variability of the subtropical countercurrent eddies in the north pacific associated with the Western-pacific teleconnection pattern. Continental Shelf Res. 143, 175–184. doi: 10.1016/j.csr.2016.08.006
Diaz H., Folland C., Manabe P., Reynolds D., Woodruff S. (2002). Workshop on advances in the use of historical marine climate data. Bulletin of the World Meteorological Organization, 51(4), 377–380.
Dodd P. A., Heywood K. J., Meredith M. P., Naveira-Garabato A. C., Marca A. D., Falkner K. K. (2009). Sources and fate of freshwater exported in the East Greenland current. Geophysical Res. Lett. 36, L19608. doi: 10.1029/2009GL039663
Egbert G. D., Erofeeva S. Y. (2002). Efficient inverse modeling of barotropic ocean tides. Journal of Atmospheric and Oceanic Technology,19(2), 183–204. doi: 10.1175/1520-0426(2002)019<0183:EIMOBO>2.0.CO;2
Geng W., Xie Q., Chen G., Liu Q., Wang D. (2018). A three-dimensional modeling study on eddy-mean flow interaction between a Gaussian-type anticyclonic eddy and kuroshio. J. Oceanogr. 74, 23–37. doi: 10.1007/s10872-017-0435-z
Gill A. E., Green J. S. A., Simmons A. J. (1974). Energy partition in the large-scale ocean circulation and the production of mid-ocean eddies. Deep Sea Res. Oceanographic Abstracts 21, 499–528. doi: 10.1016/0011-7471(74)90010-2
Hsin Y.-C., Qiu B., Chiang T.-L., Wu C.-R. (2013). Seasonal to interannual variations in the intensity and central position of the surface kuroshio east of Taiwan. J. Geophysical Res.: Oceans 118, 4305–4316. doi: 10.1002/j
Hsu P., Lin C., Huang S., Ho C. (2016). Effects of cold eddy on kuroshio meander and its surface properties, East of Taiwan. IEEE Journal of Selected Topics in Applied Earth Observations and Remote Sensing, 9(11), 5055–5063. doi: 10.1109/JSTARS.2016.2524698
Itoh S., Sugimoto T. (2001). Numerical experiments on the movement of a warm-core ring with the bottom slope of a western boundary. J. Geophysical Res.: Oceans 106, 26851–26862. doi: 10.1029/2001JC000789
Jackett D. R., Mcdougall T. J. (1995). Minimal adjustment of hydrographic profiles to achieve static stability. J. Atmospheric Oceanic Technol. 12, 381–389. doi: 10.1175/1520-0426(1995)012<0381:MAOHPT>2.0.CO;2
Kuo Y., Chern C. (2011). Numerical study on the interactions between a mesoscale eddy and a western boundary current. J. Oceanogr. 67, 263–272. doi: 10.1007/s10872-011-0026-3
Kuo Y., Chern C., Zheng Z. (2017). Numerical study on the interactions between the kuroshio current in the Luzon strait and a mesoscale eddy. Ocean Dynamics 67, 369–381. doi: 10.1007/s10236-017-1038-3
Lao Q., Zhang S., Li Z., Chen F., Zhou X., Jin G., et al. (2022). Quantification of the seasonal intrusion of water masses and their impact on nutrients in the beibu gulf using dual water isotopes. J. Geophysical Res.: Oceans 127, e2021JC018065. doi: 10.1029/2021JC018065
Lee I., Ko D. S., Wang Y., Centurioni L., Wang D. (2013). The mesoscale eddies and kuroshio transport in the western north pacific east of Taiwan from 8-year, (2003–2010) model reanalysis. Ocean Dynamics 63, 1027–1040. doi: 10.1007/s10236-013-0643-z
Lian E., Yang S., Wu H., Yang C., Li C., Liu J. T. (2016). Kuroshio subsurface water feeds the wintertime Taiwan warm current on the inner East China Sea shelf. J. Geophysical Res.: Oceans 121, 4790–4803. doi: 10.1002/2016JC01
Lien R., Ma B., Cheng Y., Ho C., Qiu B., Lee C. M., et al. (2014). Modulation of kuroshio transport by mesoscale eddies at the Luzon strait entrance. J. Geophysical Res.: Oceans 119, 2129–2142. doi: 10.1002/2013JC009548
Liu K., Chao S., Lee H., Gong G., Teng Y. (2010). Seasonal variation of primary productivity in the East China Sea: A numerical study based on coupled physical-biogeochemical model. Deep Sea Res. Part II: Topical Stud. Oceanogr. 57 (19–20), 1762–1782. doi: 10.1016/j.dsr2.2010.04.003
Liu Y., Dong C., Guan Y., Chen D., McWilliams J., Nencioli F. (2012). Eddy analysis in the subtropical zonal band of the north pacific ocean. Deep Sea Res. Part I: Oceanographic Res. Papers 68, 54–67. doi: 10.1016/j.dsr.2012.06.001
Liu Z., Gan J., Hu J., Wu H., Cai Z., Deng Y. (2021). Progress on circulation dynamics in the East China Sea and southern yellow Sea: Origination, pathways, and destinations of shelf currents. Prog. Oceanogr. 193, 102553. doi: 10.1016/j.pocean.2021.102553
Liu X., Shen H., Huang Q. (2002). Concentration variation and flux estimation of dissolved inorgnic nutrient from the changjiang river into its estuary. Oceanologia Et Limnologia Sin. (in Chinese) 33, 332–340.
Liu C., Wang F., Chen X., von Storch J. (2014). Interannual variability of the kuroshio onshore intrusion along the East China Sea shelf break: Effect of the kuroshio volume transport. J. Geophysical Res.: Oceans 119, 6190–6209. doi: 10.1002/2013JC009653
Liu K., Yung Tang T., Gong G., Chen L., Shiah F. (2000). Cross-shelf and along-shelf nutrient fluxes derived from flow fields and chemical hydrography observed in the southern East China Sea off northern Taiwan. Continental Shelf Res. 20, 493–523. doi: 10.1016/S0278-4343(99)00083-7
Miyazawa Y., Guo X., Yamagata T. (2004). Roles of mesoscale eddies in the kuroshio paths. J. Phys. Oceanogr. 34, 2203–2222. doi: 10.1175/1520-0485(2004)034<2203:ROMEIT>2.0.CO;2
Nitani H. (1972). “Beginning of the kuroshio,” in Kuroshio: Its physical aspects (Tokyo: Univ. of Tokyo Press).
Puerta P., Johnson C., Carreiro-Silva M., Henry L.-A., Kenchington E., Morato T., et al. (2020). Influence of water masses on the biodiversity and biogeography of deep-Sea benthic ecosystems in the north Atlantic. Front. Mar. Sci. 7. doi: 10.3389/fmars.2020.00239
Qiu B. (1999). Seasonal eddy field modulation of the north pacific subtropical countercurrent: TOPEX/Poseidon observations and theory. J. Phys. Oceanogr. 29, 2471–2486. doi: 10.1175/1520-0485(1999)029<2471:SEFMOT>2.0.CO;2
Shchepetkin A. F., McWilliams J. C. (2005). The regional oceanic modeling system (ROMS): a split-explicit, free-surface, topography-following-coordinate oceanic model. Ocean Model. 9, 347–404. doi: 10.1016/j.ocemod.2004.08.002
Soeyanto E., Guo X., Ono J., Miyazawa Y. (2014). Interannual variations of kuroshio transport in the East China Sea and its relation to the pacific decadal oscillation and mesoscale eddies. J. Geophysical Res.: Oceans 119, 3595–3616. doi: 10.1002/2013JC0
Sutyrin G. G., Rowe G. D., Rothstein L. M., Ginis I. (2003). Baroclinic eddy interactions with continental slopes and shelves. J. Phys. Oceanogr. 33, 283–291. doi: 10.1175/1520-0485(2003)033<0283:BEIWCS>2.0.CO;2
Tsai C. J., Andres M., Jan S., Mensah V., Sanford T. B., Lien R. C., et al. (2015). Eddy-kuroshio interaction processes revealed by mooring observations off Taiwan and Luzon. Geophysical Res. Lett. 42, 8098–8105. doi: 10.1002/2015GL065814
Vélez-Belchí P., Centurioni L. R., Lee D. K., Jan S., Niiler P. P. (2013). Eddy induced kuroshio intrusions onto the continental shelf of the East China Sea. J. Mar. Res. 1-2, 83–107. doi: 10.1357/002224013807343470
Wang J., Oey L.-Y. (2014). Inter-annual and decadal fluctuations of the kuroshio in East China Sea and connection with surface fluxes of momentum and heat. Geophysical Res. Lett. 41, 8538–8546. doi: 10.1002/2014GL062118
Waseda T. (2002). On the eddy-kuroshio interaction: Evolution of the mesoscale eddy. J. Geophysical Res. 107(C8), 3088. doi: 10.1029/2000JC000756
Wu C.-R., Hsin Y.-C., Chiang T.-L., Lin Y.-F., Tsui I.-F. (2014). Seasonal and interannual changes of the kuroshio intrusion onto the East China Sea shelf. J. Geophysical Res.: Oceans 119, 5039–5051. doi: 10.1002/2013JC009748
Wu J., Lao Q., Chen F., Huang C., Zhang S., Wang C., et al. (2021). Water mass processes between the south China Sea and the Western pacific through the Luzon strait: Insights from hydrogen and oxygen isotopes. J. Geophysical Res.: Oceans 126, e2021JC017484. doi: 10.1029/2021JC017484
Wu C., Wang Y., Lin Y., Chao S. (2017). Intrusion of the kuroshio into the south and East China seas. Sci. Rep. 7(1), 7895. doi: 10.1038/s41598-017-08206-4
Xu L., Yang D., Benthuysen J. A., Yin B. (2018). Key dynamical factors driving the kuroshio subsurface water to reach the zhejiang coastal area. J. Geophysical Res.: Oceans 123, 9061–9081. doi: 10.1029/2018JC014219
Xu L., Yang D., Greenwood J., Feng X., Gao G., Qi J., et al. (2020). Riverine and oceanic nutrients govern different algal bloom domain near the changjiang estuary in summer. J. Geophysical Res.: Biogeosciences 125, e2020JG005727. doi: 10.1029/2020JG005727
Xu L., Yang D., Yu R., Feng X., Gao G., Cui X., et al. (2021). Nonlocal population sources triggering dinoflagellate blooms in the changjiang estuary and adjacent seas: A modeling study. J. Geophysical Res.: Biogeosciences 126, e2021JG006424. doi: 10.1029/2021JG006424
Yang D., Huang R. X., Yin B., Feng X., Chen H., Qi J., et al. (2018). Topographic beta spiral and onshore intrusion of the kuroshio current. Geophysical Res. Lett. 45, 287–296. doi: 10.1002/2017GL076614
Yang Y., San Liang X., Qiu B., Chen S. (2017). On the decadal variability of the eddy kinetic energy in the kuroshio extension. J. Phys. Oceanogr. 47, 1169–1187. doi: 10.1175/JPO-D-16-0201.1
Yang G., Wang F., Li Y., Lin P. (2013). Mesoscale eddies in the northwestern subtropical pacific ocean: Statistical characteristics and three-dimensional structures. J. Geophysical Res.: Oceans 118, 1906–1925. doi: 10.1002/jgrc.20164
Yang S., Xing J., Chen D., Chen S. (2017). A modelling study of eddy-splitting by an island/seamount. Ocean Sci. 13, 837–849. doi: 10.5194/os-13-837-2017
Yang S., Xing J., Sheng J., Chen S., Chen D. (2019). A process study of interactions between a warm eddy and the kuroshio current in Luzon strait: The fate of eddies. J. Mar. Syst. 194, 66–80. doi: 10.1016/j.jmarsys.2019.02.009
Yang D., Yin B., Liu Z., Bai T., Qi J., Chen H. (2012). Numerical study on the pattern and origins of kuroshio branches in the bottom water of southern East China Sea in summer. J. Geophysical Res.: Oceans 117, C02014. doi: 10.1029/2011JC007528
Yang D., Yin B., Liu Z., Feng X. (2011). Numerical study of the ocean circulation on the East China Sea shelf and a kuroshio bottom branch northeast of Taiwan in summer. J. Geophysical Res. 116, C05015. doi: 10.1029/2010JC006777
Yang D., Yin B., Sun J., Zhang Y. (2013). Numerical study on the origins and the forcing mechanism of the phosphate in upwelling areas off the coast of zhejiang province, China in summer. J. Mar. Syst. 123-124, 1–18. doi: 10.1016/j.jmarsys.2013.04.002
Yan X., Zhu X., Pang C., Zhang L. (2016). Effects of mesoscale eddies on the volume transport and branch pattern of the kuroshio east of Taiwan. J. Geophysical Res.: Oceans 121, 7683–7700. doi: 10.1002/2016JC012038
Yin Y., Lin X., He R., Hou Y. (2017). Impact of mesoscale eddies on kuroshio intrusion variability northeast of Taiwan. J. Geophysical Res.: Oceans 122, 3021–3040. doi: 10.1002/2016JC012263
Yin Y., Lin X., Li Y., Zeng X. (2014). Seasonal variability of kuroshio intrusion northeast of Taiwan island as revealed by self-organizing map. Chin. J. Oceanol. Limnol. 32, 1435–1442. doi: 10.1007/s00343-015-4017-x
Yu R., Lü S., Liang Y. (2018). “Harmful algal blooms in the coastal waters of China,” in Global ecology and oceanography of harmful algal blooms. Eds. Glibert P. M., Berdalet E., Burford M. A., Pitcher G. C., Zhou &M. (Springer International Publishing), 309–316. doi: 10.1007/978-3-319-70069-4_15
Zhang D., Lee T. N., Johns W. E., Liu C., Zantopp R. (2001). The kuroshio East of Taiwan: Modes of variability and relationship to interior ocean mesoscale eddies. J. Phys. Oceanogr. 31, 1054–1074. doi: 10.1175/1520-0485(2001)031<1054:TKEOTM>2.0.CO;2
Zhang J., Liu S. M., Ren J. L., Wu Y., Zhang G. L. (2007). Nutrient gradients from the eutrophic changjiang (Yangtze river) estuary to the oligotrophic kuroshio waters and re-evaluation of budgets for the East China Sea shelf. Prog. Oceanogr. 74, 449–478. doi: 10.1016/j.pocean.2007.04.019
Zhang Z., Zhang Y., Wang W., Huang R. X. (2013). Universal structure of mesoscale eddies in the ocean. Geophysical Res. Lett. 40, 3677–3681. doi: 10.1002/grl.50736
Zhao L., Guo X. (2011). Influence of cross-shelf water transport on nutrients and phytoplankton in the East China Sea: a model study. Ocean Sci. 7, 27–43. doi: 10.5194/os-7-27-2011
Zheng Q., Ho C., Xie L., Li M. (2019). A case study of a kuroshio main path cut-off event and impacts on the south China Sea in fall-winter 2013–2014. Acta Oceanologica Sin. 38, 12–19. doi: 10.1007/s13131-019-1411-9
Zheng Q., Tai C., Hu J., Lin H., Zhang R., Su F., et al. (2011). Satellite altimeter observations of nonlinear rossby eddy–kuroshio interaction at the Luzon strait. J. Oceanogr. 67, 365–376. doi: 10.1007/s10872-011-0035-2
Zhou M., Yan T., Zhou J. (2003). Preliminary analysis of the characteristics of red tide areas in changjiang river estuary and its adjacent sea. Chin. J. Appl. Ecol. 14, 1031–1038.
Keywords: cross-shelf transport, Kuroshio Current, mesoscale eddy, phosphate, numerical simulation
Citation: Xu L, Yang D, Feng X, Sun J, Gao G, Cui X and Yin B (2023) Influence of mesoscale eddies on the cross-shelf phosphate transport of the Kuroshio Current northeast of Taiwan: A modeling study. Front. Mar. Sci. 9:1079418. doi: 10.3389/fmars.2022.1079418
Received: 25 October 2022; Accepted: 29 December 2022;
Published: 19 January 2023.
Edited by:
Zhengui Wang, College of William & Mary, United StatesReviewed by:
Hailun He, Ministry of Natural Resources, ChinaCopyright © 2023 Xu, Yang, Feng, Sun, Gao, Cui and Yin. This is an open-access article distributed under the terms of the Creative Commons Attribution License (CC BY). The use, distribution or reproduction in other forums is permitted, provided the original author(s) and the copyright owner(s) are credited and that the original publication in this journal is cited, in accordance with accepted academic practice. No use, distribution or reproduction is permitted which does not comply with these terms.
*Correspondence: Dezhou Yang, eWFuZ2RlemhvdUBxZGlvLmFjLmNu; Baoshu Yin, YnN5aW5AcWRpby5hYy5jbg==
Disclaimer: All claims expressed in this article are solely those of the authors and do not necessarily represent those of their affiliated organizations, or those of the publisher, the editors and the reviewers. Any product that may be evaluated in this article or claim that may be made by its manufacturer is not guaranteed or endorsed by the publisher.
Research integrity at Frontiers
Learn more about the work of our research integrity team to safeguard the quality of each article we publish.