 Xitong Cen1,2,3†
 Gege Zhang
 Gaoyou Yao
 Wenguang Liu
- 1CAS Key Laboratory of Tropical Marine Bio-resources and Ecology, South China Sea Institute of Oceanology, Chinese Academy of Sciences, Guangzhou, China
- 2Guangdong Provincial Key Laboratory of Applied Marine Biology, South China Sea Institute of Oceanology, Chinese Academy of Sciences, Guangzhou, China
- 3University of Chinese Academy of Sciences, Beijing, China
- 4Tianjin Key Laboratory of Aqua-Ecology and Aquaculture, Department of Fishery Sciences, Tianjin Agricultural University, Tianjin, China
The giant triton snail (Charonia tritonis) is widely distributed in tropical coral reefs in the Indo-West Pacific. Its distribution areas in China include the Penghu Islands, Hengchun Peninsula, and Xisha Islands. In this study, we use Multivariate Analysis of Variance (MANOVA) to compare the live weight and shell length between different shell colors of C. tritonis. In addition, we conducted sequence analysis of the mitochondrial cytochrome oxidase (COI) gene to assess the affinity of C. tritonis with two different shell colors based on the sample we obtained. Then, we constructed phylogenetic trees using the maximum likelihood (ML) and Bayesian Inference methods, and constructed haplotype network diagrams. In addition, we performed Tajima’s D and Fu’s neutrality tests. The results show that The Partial mitochondrial COI sequences of 28 C. tritonis were all 603 base pairs in length, and seven haplotypes were detected from the samples, besides, the gene flow was calculated to be 11.78, the genetic differentiation coefficient was 0.02078. Our results indicated that the population size of C. tritonis remained relatively stable. Besides, the genetic and size differentiation between the two different shell colors was small, and individuals of C. tritonis with different shell colors belong to the same genetic clade. In fact, the two morphotypes could not be distinguished by both genetic and morphometric data. The mitochondrial COI gene fragments of the two different shell colors were sequenced and analyzed to accumulate information about the population genetics of C. tritonis and to provide a scientific basis for the conservation of its species resources.The giant triton snail (Charonia tritonis) is widely distributed in tropical coral reefs in the Indo-West Pacific. Its distribution areas in China include the Penghu Islands, Hengchun Peninsula, and Xisha Islands. In this study, we use Multivariate Analysis of Variance (MANOVA) to compare the live weight and shell length between different shell colors of C. tritonis. In addition, we conducted sequence analysis of the mitochondrial cytochrome oxidase (COI) gene to assess the affinity of C. tritonis with two different shell colors based on the sample we obtained. Then, we constructed phylogenetic trees using the maximum likelihood (ML) and Bayesian Inference methods, and constructed haplotype network diagrams. In addition, we performed Tajima’s D and Fu’s neutrality tests. The results show that The Partial mitochondrial COI sequences of 28 C. tritonis were all 603 base pairs in length, and seven haplotypes were detected from the samples, besides, the gene flow was calculated to be 11.78, the genetic differentiation coefficient was 0.02078. Our results indicated that the population size of C. tritonis remained relatively stable. Besides, the genetic and size differentiation between the two different shell colors was small, and individuals of C. tritonis with different shell colors belong to the same genetic clade. In fact, the two morphotypes could not be distinguished by both genetic and morphometric data. The mitochondrial COI gene fragments of the two different shell colors were sequenced and analyzed to accumulate information about the population genetics of C. tritonis and to provide a scientific basis for the conservation of its species resources.
1. Introduction
The giant triton snail (Charonia tritonis) is one of the world’s largest gastropod snails, and it is protected by a narrow shell that can reach half a meter in length (Hall et al., 2017). As a predator of echinoderms, this snail plays an important role in protecting coral reef ecosystems, especially from the crown-of-thorns starfish (COTS). Even though an adult C. tritonis only eats 1.5 COTS a week on average, its presence can change the behavior of COTS (Evan et al., 2005), which can effectively reduce the density of COTS and the severity of COTS outbreaks. However, overfishing, water pollution, and lack of understanding of the biology of C. tritonis have negatively impacted its habitat, resulting in a sharp decline in wild populations of this species (Bellwood et al., 2004; Feng et al., 2018), and C. tritonis is now as well listed as a national second-class protected animal in China (Ren et al., 2022). Therefore, studies are needed to better understand the basic biology and population structure of C. tritonis.
The shells of mollusks are extremely colorful and diverse in morphology. They have been a fascinating subject throughout human history and are highly sought after by conchologists and shell enthusiasts (Liu et al., 2009). C. tritonis shells have a shiny surface, with a creamy white to yellowish-brown shell surface and half-moon or triangular dark brown markings and crescent-shaped markings (Qi, 1998). In the wild, C. tritonis with either white or flowery shells are widespread. Such color polymorphism usually has a simple genetic basis, which makes them an ideal system for studying the evolutionary mechanisms that maintain biodiversity (Estévez et al., 2020). In some marine gastropods, environmental factors (Creese and Underwood, 1976), genetic factors (Stolbova, 1996), and diet can impact shell coloration. The ability of a single genotype to alter its phenotype in a heterogeneous environment is an example of phenotypic plasticity (Houston and Mcnamara, 1992), and although environmentally induced alterations to shell color are usually not heritable, once formed they are stable and persistent (Liu et al., 2009). Accordingly, shell characters have historically played an important role in discrimination among species (Wilke and Falniowski, 2001).
The mitochondrial DNA genome is widely used in several research fields, including genetics, evolution, and species genetic diversity, due to its unique structural features and genetic characteristics (Brown et al., 1982; Wang et al., 2019; Zhang et al., 2021), and it has become a very important molecular genetics tool. The mitochondrial genome has been widely used in the study of genetic variation and phylogeny of gastropod populations (Grande et al., 2008; Groenenberg et al., 2012; Groenenberg et al., 2017). Mitochondrial cytochrome oxidase (COI) genes in mitochondrial DNA are very conserved and highly homologous and are often used to analyze and explore population phylogenetic relationships (Miya et al., 2001). The COI sequence, which encodes only about 650 nucleotides, contains an extremely rich phylogenetic signal that evolves at a moderate rate, allowing species to exhibit more pronounced intraspecific and interspecific variation (Kelly and Palumbi, 2009). Therefore, COI genes are considered to be the most desirable molecular markers for genetic structure studies, phylogenetic analysis, and species identification (Rydzanicz et al., 2011).
In the present study, the genetic diversity of two collected shell color populations (white shells and flower shells) of C. tritonis were studied by using partial sequences of mitochondrial COI. The purpose of this study is to provide comprehensive information about this genetic resource, clarify the genetic relationship between these two shell colors, and provide a scientific reference for the protection of C. tritonis.
2. Materials and methods
2.1. Sample collection
C. tritonis were collected from Tree Island, Xisha, South China Sea, Hainan Province, China in March 2020 by SCUBA diving. Since C. tritonis is a national second-class protected animal, it is precious and scarce in China, so we only obtained 28 individuals (6 with white shells and 22 with flower shells) in this study. It can be observed in Figure 1 that there are regular brown and black interlaced convex stripes on the surface of C. tritonis with flower shells, while the surface of C. tritonis with white shells is flat and without obvious stripes. The specimens were transported back to the breeding base and temporarily reared in water that was aerated and changed daily. Small pieces of the foot muscle of each specimen were excised and stored in 95% alcohol without harming the animal. Tissue samples were stored at 4°C in a freezer.
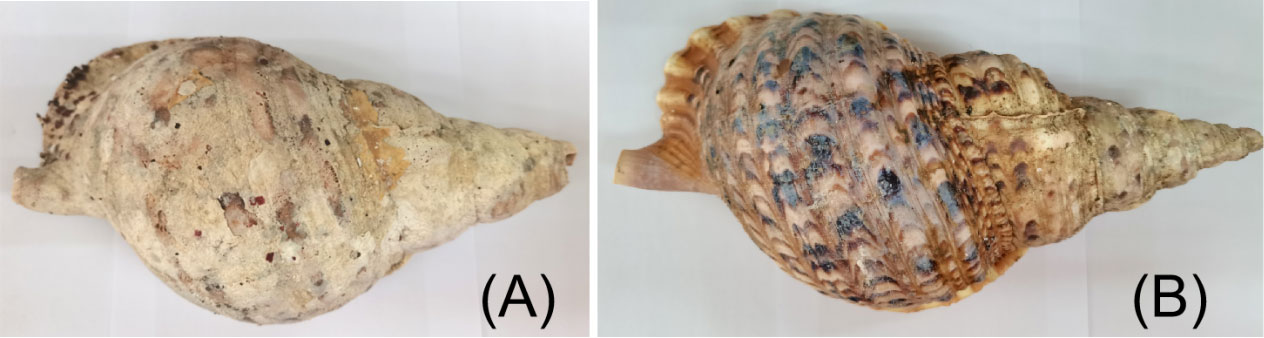
Figure 1 C tritonis with white shell (A), C tritonis with flower shell (B).
2.2. Mitochondrial sequencing
We isolated total DNA from the muscle tissue samples using the EasyPure® Marine Animal Genomic DNA Kit for marine organisms. The extracted DNA was subsequently examined by 1.2% agarose gel electrophoresis (Figure 2). The nucleic acid concentration and purity were evaluated using NanoDrop (Thermo Fisher Scientific, Waltham, MA, United States). Then, all samples were stored at 4°C.
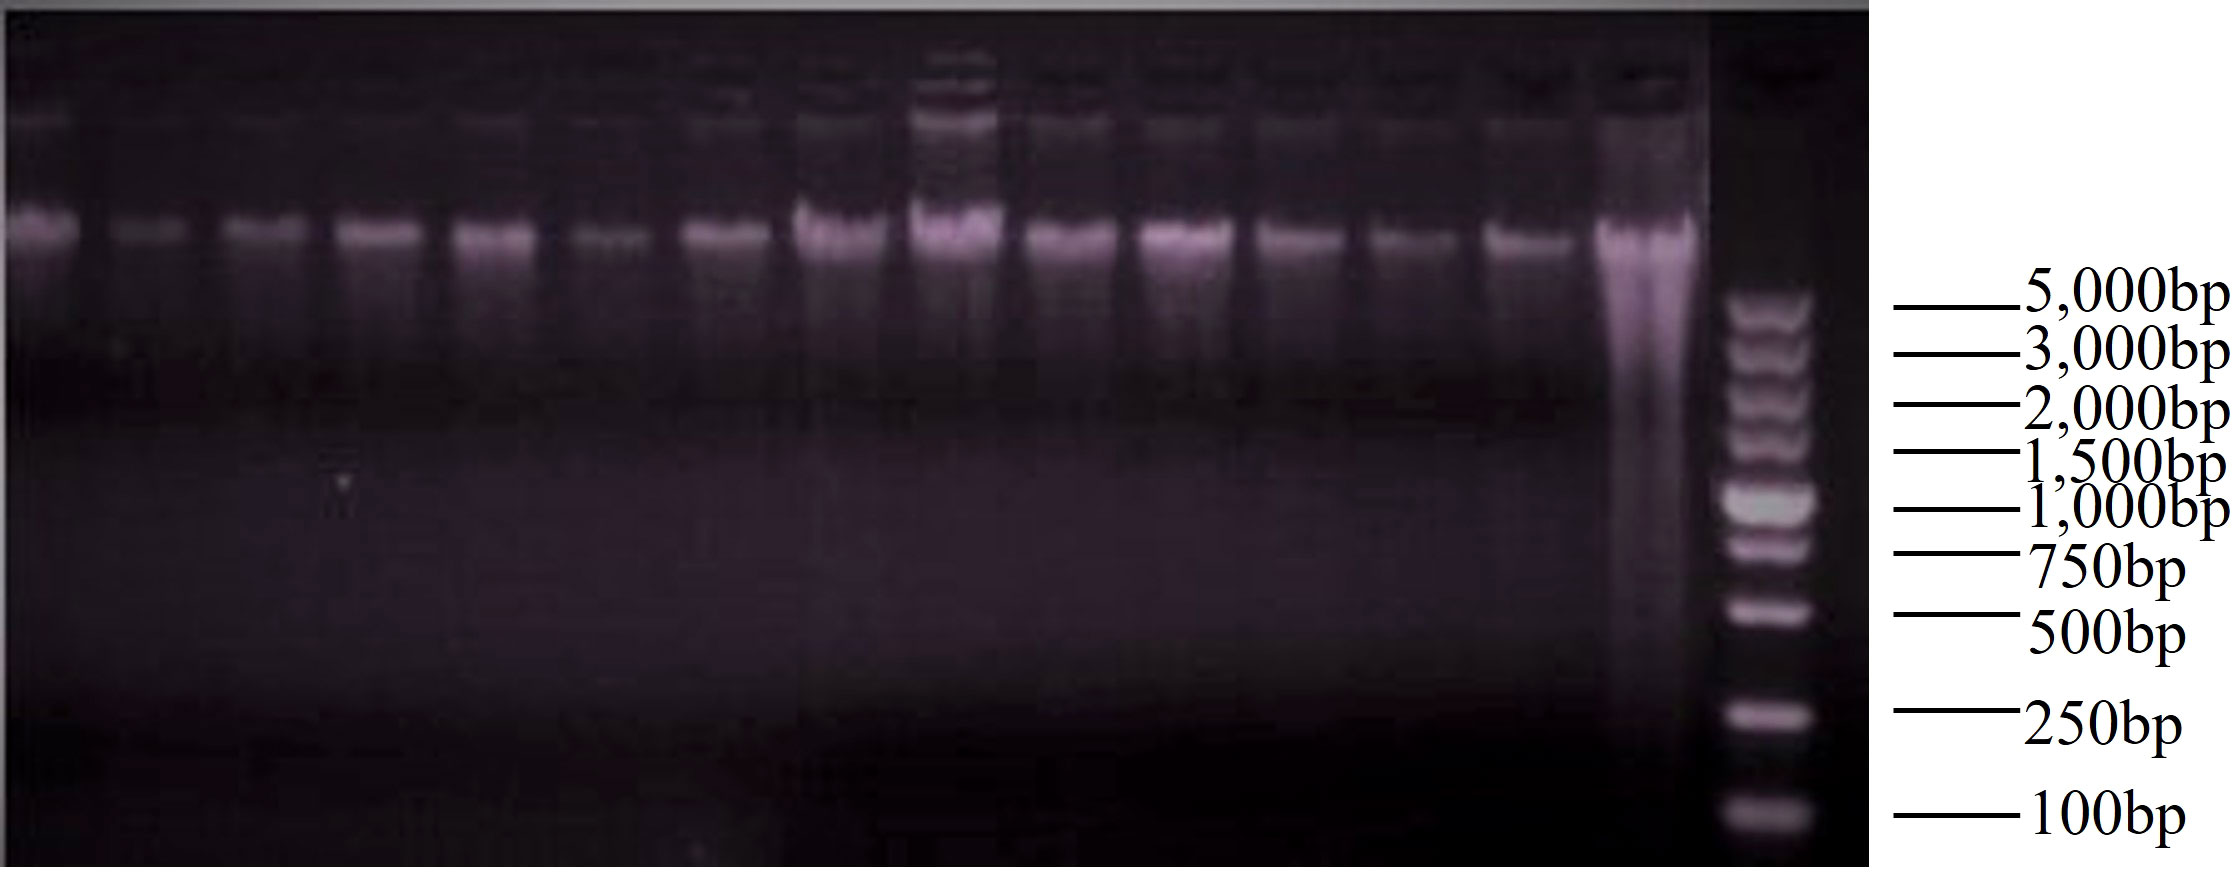
Figure 2 Part of the electrophoresis results of the genomic DNA of C. tritonis.
The existing mitochondrial genome sequence (Query IDlcl|Query_276583) of C. tritonis was downloaded from NCBI (https://www.ncbi.nlm.nih.gov/), and subsequently the conserved regions were identified using BioEdit software comparison analysis. We designed the primers using Primer Premier 6.0, and the primers were synthesized by Beijing Liuhe Huada Gene Technology Co. (Beijing, China). PCR amplification of the synthesized primer pairs was carried out using DNA from the 28 C. tritonis specimens. The pairs of primers with single amplified bands and high efficiency were screened by agarose gel electrophoresis, and the specific primer sequences were:
COIa: 5′-GGTCAACAAATCATAAAGATATTGG-3′;
COIb: 5′- TAAACTTCAGGGTGACCAAAAAATCA-3′.
The 50 µL reaction system for PCR amplification contained 25 μL of 2 × Es taq enzyme (TransGen Biotech,Guangzhou, China), 2 mM forward primer/reverse primer, 100 ng of DNA template, and ultra-pure water to bring the solution to 50 μL. The PCR procedure was as follows: pre-denaturation at 94°C for 2 min; denaturation at 94°C for 30 s; annealing at 55°C for 30 s; and extension at 72°C for 1 min, with 34 cycles of pre-denaturation, annealing, and extension, 1 cycle of denaturation, and final extension at 72°C for 5 min.
The PCR products were detected on a 1.2% agarose gel (Figure 3), and purification was performed using a gel recovery kit (Omega, Atlanta, GA, United States). The purified PCR products were sent to Guangzhou Tianyi Huiyuan Biotechnology Co., Ltd. (Guangzhou, China) for double-end sequencing using amplification primers.
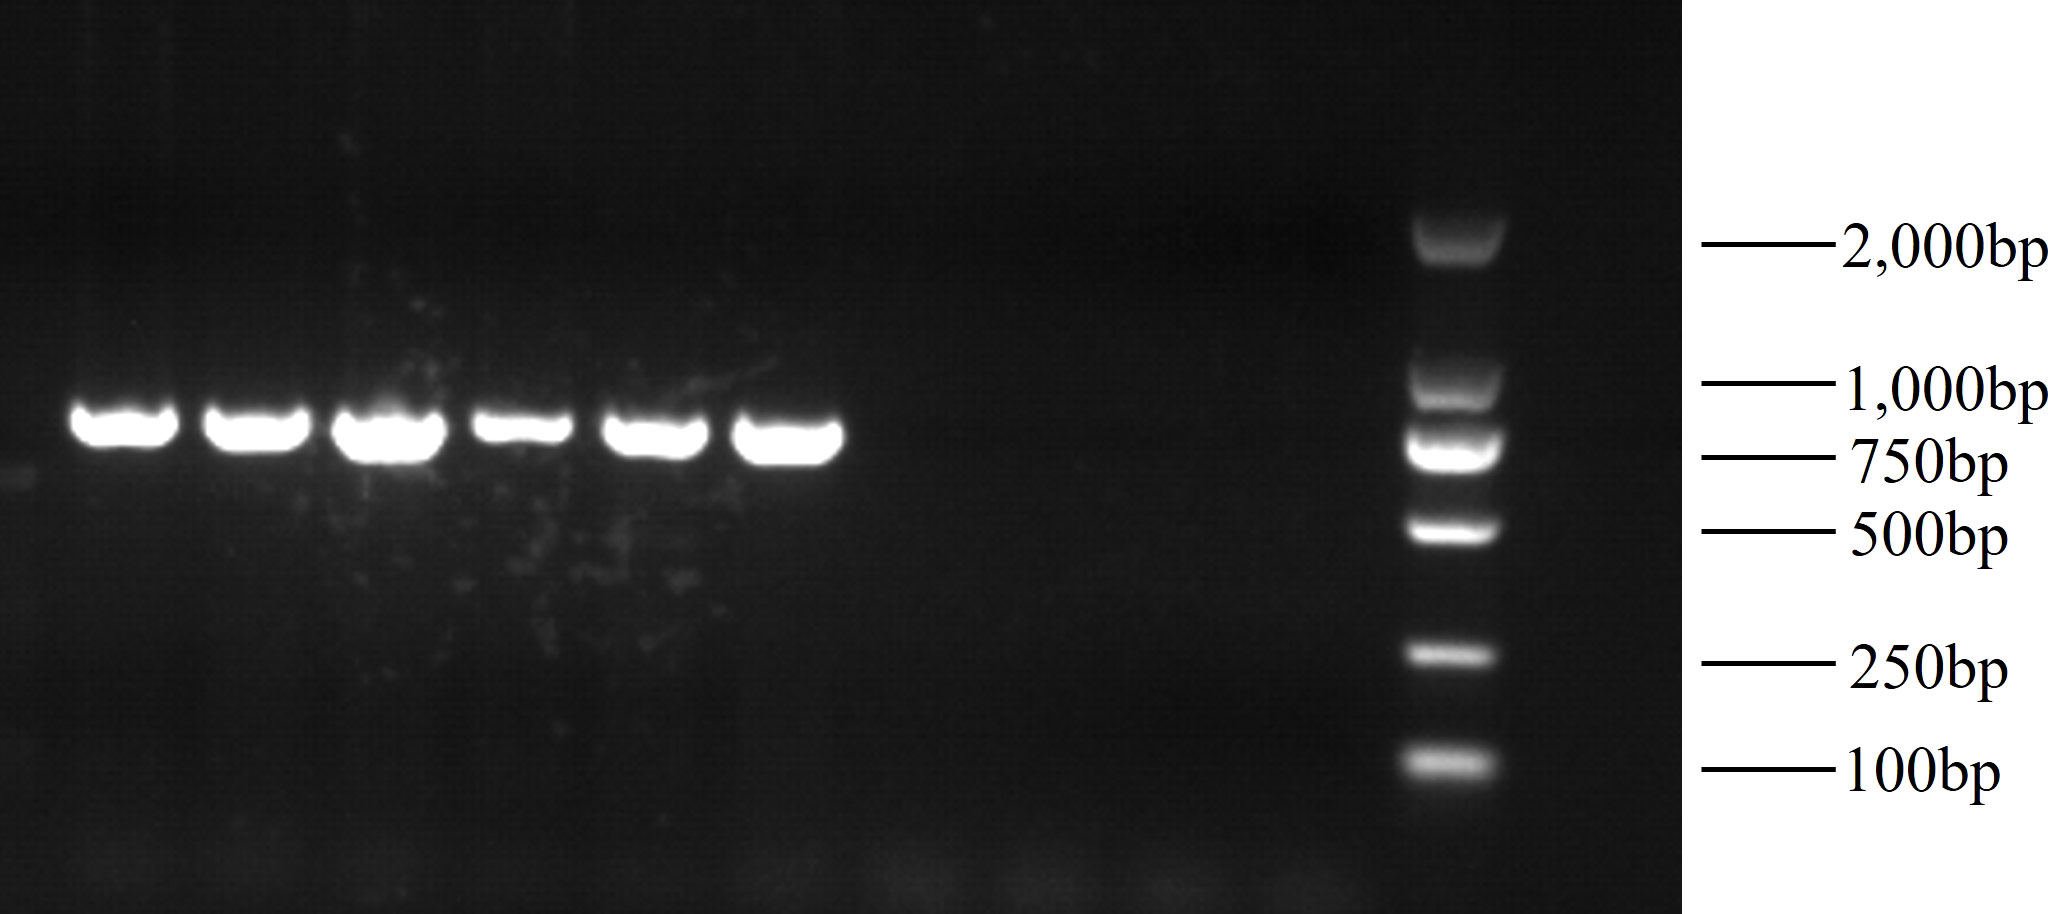
Figure 3 Part of the electrophoresis results of amplification of the C. tritonis COI gene.
The original image of Figures 2, 3 are in Supplementary Materials (Supplementary Figures 1, 2).
2.3. Sequence organization
We integrated and converted the 28 mitochondrial COI gene sequences into FASTA format and the 28 mitochondrial COI gene sequences of C. tritonis can be found here: NCBI, OP810573 to OP810600 (https://www.ncbi.nlm.nih.gov/nuccore/OP810600.1).
2.4. Sequence characterization
We used Mega6.0 software to analyze the base characteristics of the mitochondrial COI sequences and to determine the length of the COI sequences of the 28 C. tritonis. We then calculated the conserved sites, variable sites, parsimony sites, and singleton sites of the COI sequences, the proportion of bases A, T, C, and G in the sequences, the presence of base substitutions, and the ratio of reversal to conversion.
2.5. Building a phylogenetic tree
The COI sequence of Ranella olearium, a family of Cymatiidae, was downloaded by NCBI and used as an outer group. The ML phylogenetic tree was constructed by K2 model. The confidence of the nodes of the ML phylogenetic tree was estimated by Bootstrap value, and the reliability of the relationship tree was evaluated by 1,000 repeated sampling.
Bayesian evolutionary analysis sampling tree were constructed using MrBayes (Huelsenbeck and Ronquist, 2001), version 3.2.7. After using MrMTgui 1.01 to calculate the recommended model, results were produced from one chain with 30 million steps, sampled every 1,000 steps based on Markov Chain Monte Carlo (MCMC).
2.6. Data analysis
The live weight and shell length of all samples were measured, and these data were averaged and analyzed by MANOVA. MANOVA was conducted by SPSS25.0 with the shell color of C. tritonis as the independent variable and the body length and live weight of C. tritonis as the dependent variables.
The mitochondrial COI gene sequence of C. tritonis was transformed into FASTA format and then homology matched them using Clustal W in Mega6.0 software. After that, sequences with obvious differences were selected for reverse complementation, followed by secondary homology matching by Clustal W. Redundant sequences at both ends caused by sequencing technology limitations were removed by manual splicing to generate the COI gene sequence set. They were exported into FASTA format and used for subsequent data analysis.
Then, we used DnaSP 6.0 software to analyze the genetic diversity of the COI gene sequences and to calculate values for the following: number of polymorphic sites, number of haplotypes, haplotype diversity, nucleotide diversity, mean nucleotide differences, gene flow, Tajima’s D and Fu’s neutrality tests. The molecular variance analysis (AMOVA) method in Arlequin 3.1 software was used to estimate the distribution of genetic variation between and within populations, and the genetic differentiation coefficient (Fst) and its P value among populations were calculated. We then constructed a parsimonious haplotype network using PopART to analyze the evolutionary relationships among haplotypes.
3. Results
3.1. Morphological variation analysis
All samples were measured and the average shell length was 28.7 cm, with mean live weight 2.57 kg. We can observe from the Table 1 that in the test results for shell color of C. tritonis, the significance of shell length was 0.314 and the significance of body weight was 0.253, both of which were greater than 0.05, indicating that there were no significant differences in shell length and body weight levels of C. tritonis between different shell colors.
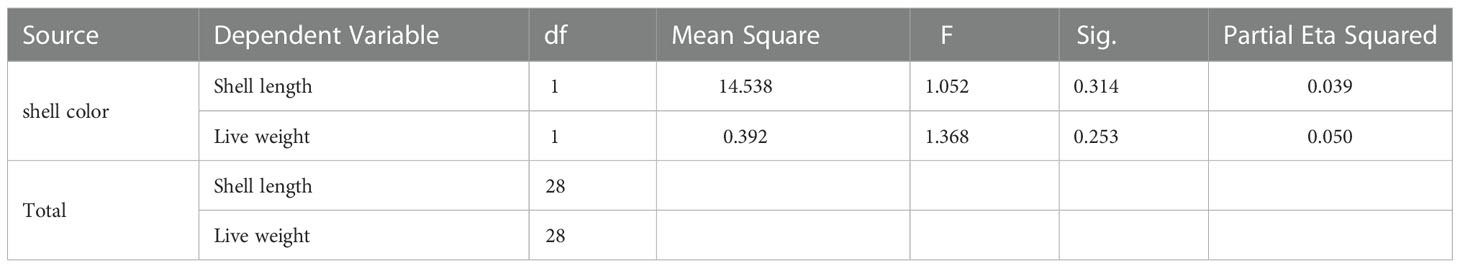
Table 1 Results of the multivariate analysis of variance (MANOVA) showing the difference of live weight and shell length of C. Tritonis with different shell colors.
3.2. Sequence analysis of the mitochondrial COI gene fragment of C. tritonis
In this study, we were able to stably amplify the mitochondrial COI sequences of the 28 C. tritonis samples, and the PCR amplification products showed bright and clear bands 600–700 bp in size. After the amplification products were purified and sequenced, the mitochondrial COI sequences were analyzed using Mega6.0 software, which revealed 588 conserved sites and 14 variable sites. Among the 14 variant sites, 9 were parsimony informative sites and the rest were single variant sites (Table 2). Table 3 shows the proportions of bases A, T, C, and G in the sequences of the fascias of the two different shell colors. The A+T content was higher than the G+C content, which was consistent with the characteristics of the mitochondrial base composition.
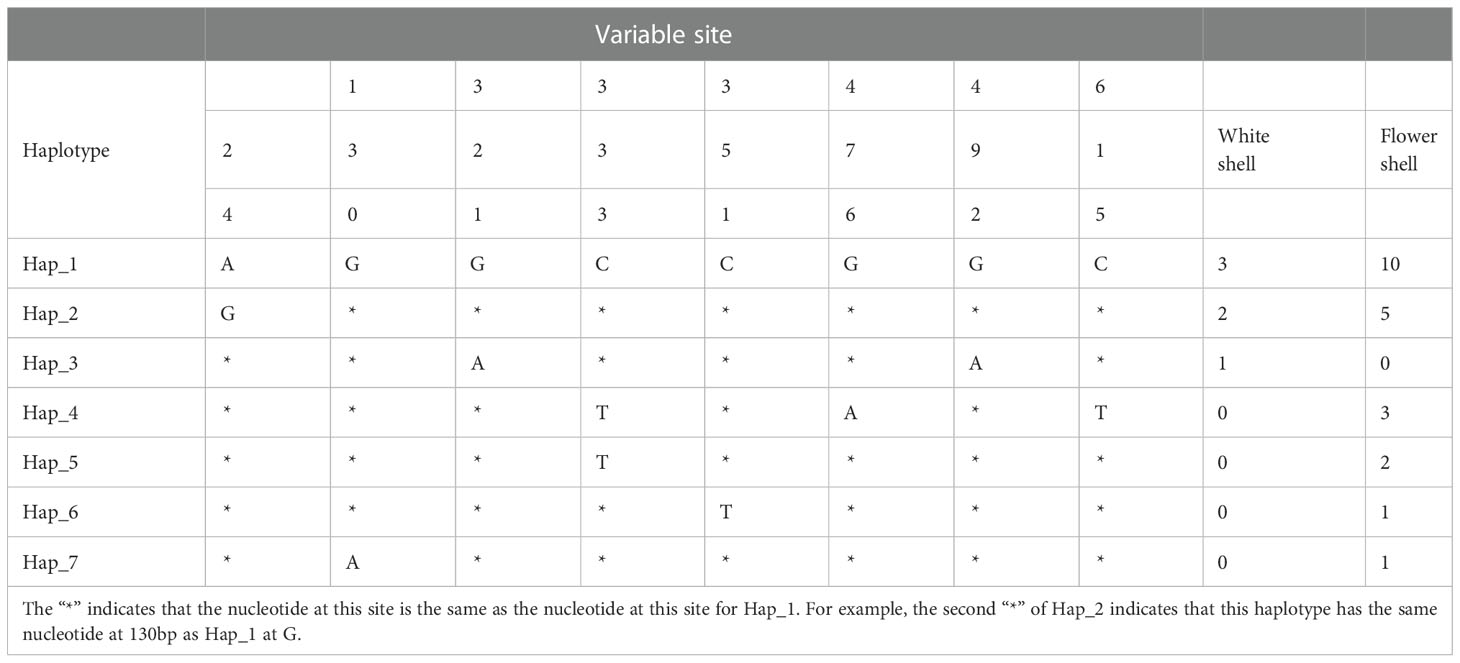
Table 2 Variable sites of the mitochondrial COI gene of C. tritonis.
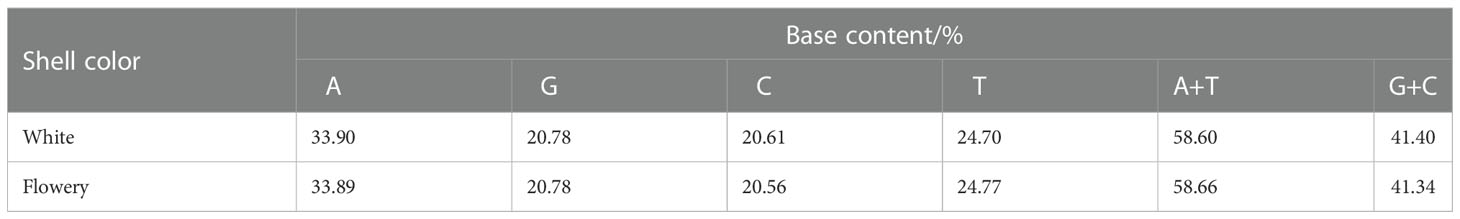
Table 3 Base composition of the COI gene in C. tritonis.
3.3. Genetic diversity of C. tritonis based on mitochondrial COI gene sequence information
Analysis of the codon distribution of COI gene sequences showed that the effective codon number was 52.715. The ratio of transitions to reversals was 2.8, and a value > 2 indicated that the mitochondrial COI gene sequences of C. tritonis were not yet saturated with mutations. Therefore, the results obtained from the subsequent genetic diversity analysis of COI genes were reliable.
Table 4 shows the results of the genetic diversity analysis based on mitochondrial COI gene sequence information. C. tritonis haplotype diversity reached 0.728 ± 0.067, which indicated high genetic diversity (Grant and Bowen, 1998).

Table 4 Genetic diversity based on COI gene sequences of C. tritonis.
The gene flow was 11.78, which is greater than 1, indicating that flow between the two types of C. tritonis was high, which could reduce the genetic differentiation between populations generated by genetic drift to some extent. The analysis of variance (AMOVA) results for the two populations of C. tritonis are shown in Table 5, which shows that the genetic variation in the two C. tritonis populations occurred mainly within the population, accounting for 98.96%, while the among populations genetic variation accounted for 1.04%. Also, according to Table 5, the Fixation Index (Fst) is 0.01040 and the statistical results were not significant (p > 0.05), indicating that the two types of C. tritonis were closely related.

Table 5 AMOVA analysis of two C. tritonis populations base on COI gene sequences.
The Tajima’s D neutrality test value for the C. tritonis population in this study was –1.37771 and P > 0.05, and the Fu’s Fs statistic neutrality test value for the C. tritonis population in this study was –3.180 and P > 0.05 (Table 6), indicating that the population may not have experienced expansion and continuous growth patterns, and the population size remained relatively stable.
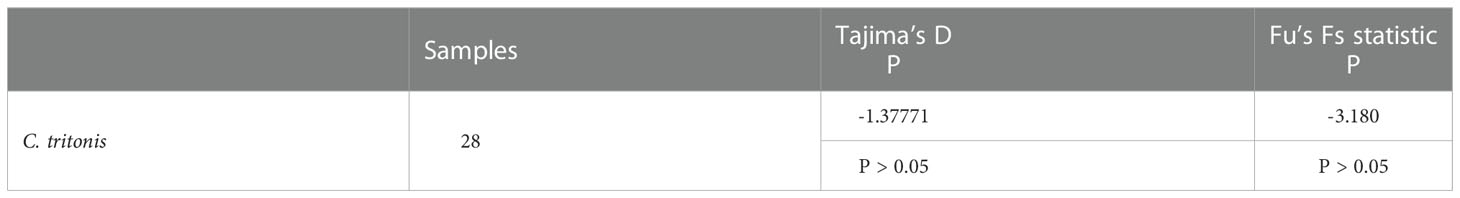
Table 6 Tajima’s D and Fu’s F statistic among C. tritonis.
3.4. Phylogenetic relationships of C. tritonis
Taking the COI sequence of the triton Ranella olearium as the outgroup, we used the ML and Bayesian inference methods to construct phylogenetic trees and analyze the phylogenetic relationship among Ranella olearium and C. tritonis with different shell colors. Among them, the COI sequences of C. tritonis with white shells are represented by W1 to W6, while those of the other 22 C. tritonis with flower shells are represented by NW1 to NW22 (Figures 4, 5). The phylogenetic trees constructed by the two methods showed a consistent topology, with individuals of different shell colors of C. tritonis clustering together without any obvious group clustering first.
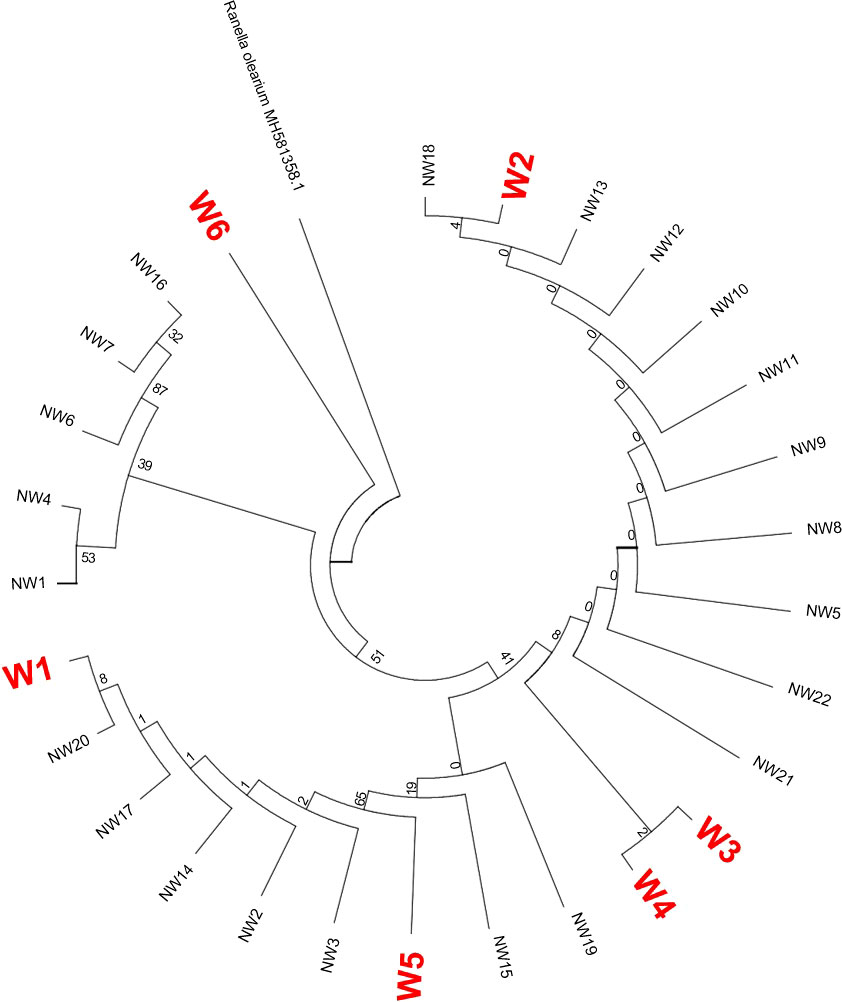
Figure 4 Maximum likelihood (ML) tree based on COI sequences.

Figure 5 Bayesian evolutionary analysis sampling tree (BEAST) based on COI sequences.
Figure 6 is a haplotype network diagram that shows the presence of seven haplotypes. Hap_1 includes the largest number of samples, and only Hap_1 and Hap_2 is common to both shell colors of C. tritonis. The other haplotypes that are unique to each shell color indicated that the different shell colors had their own genetic advantages.
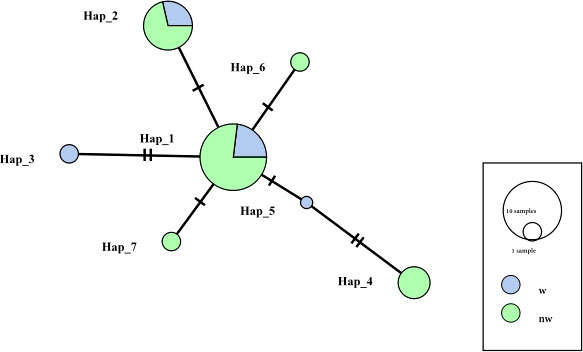
Figure 6 Computational haplotype network map of the C. tritonis mitochondrial COI gene.
4. Discussion
Mollusks are often known for their different shell forms, carvings and colors, and shell characteristics have historically played an important role in distinguishing species (Wilke and Falniowski, 2001). The Multivariate Analysis of Variance (MANOVA) indeed suggests that different shell length and live weight have no significant effect on the shell colors of C. tritonis. Similar results were observed in Heleobia opachensis, Cyclonaias infucata and Echinolittorina malaccana (Gonzalo et al., 2016; Lopes-Lima et al., 2019; Marshall et al., 2021), and this result corresponds to that reflected by the phylogenetic tree.
Genetic diversity of species is an important component of biodiversity and an important parameter in the assessment of the status of biological resources, while rich genetic diversity helps to enhance the adaptability of species to the environment (Wu et al., 2022). C. tritonis with different shell colors showed almost no genetic differences and exhibited high haplotype diversity, indicating high genetic diversity and abundant genetic resources, in addition C. tritonis exhibited low nucleotide diversity, which can result from large population sizes and different environments (Gollner et al., 2016), and we speculated that the high haplotype diversity of the C. tritonis population our study was most likely due to variable environmental factors. What we need to mention here is the special life history of the snail, The mating to spawning period for C. tritonis is about 130 days (Strathmann, 1987), and subsequently C. tritonis can maintain its floating life state for about 10 months without metamorphosis (Nugranad et al., 2000), therefore, when marine organisms are classified by ecological type, C. tritonis is a meroplankton, a fact that is consistent with the larger gene flow of the phasmid found in our study (Dunphy and Hamrick, 2005). Genetic data confirm that historic events have had a significant impact on the distribution of populations (Athanasios et al., 2006; Nakano and Ozawa, 2007). According to the theory of population genetics, a longer planktonic larval stage will lead to increased gene flow between geographically distant populations and, therefore, their level of genetic differentiation will decrease (Kelly and Palumbi, 2009). There are many examples of maintaining population connectivity through the dispersal of larvae, such as the main currents flowing along the Atlantic coast of Iberia could have been responsible for maintaining connectivity of populations of Patella rustica through occasional larval transport across a considerable stretch of inhospitable habitat (Ribeiro et al., 2010); Two economically important spiny lobsters, Panulirus homarus and Panulirus ornatus show no genetic differences from the western Indian Ocean to the Indo-Malay archipelago, because larval stage of lobster species had to go through a long floating state (Permana et al., 2019). Contrary to species with long planktonic period, species with short planktonic larval period can show strong population structure, such as the clam Macridiscus multifarius, which planktonic larval stage is about 10 days, high level and significant FST values were obtained among the different localities of M. multifarius on the basis of either COI or 12S rRNA gene, indicating a high degree of genetic differentiation among the populations (Ye et al., 2015). The two shell colors of C. tritonis in this study had high haplotype diversity as well as high gene flow and high genetic similarity, so we concluded that the different shell colors produced by C. tritonis in this study were not caused by genetic differences.
According to the standard put forward by Balloux et al. (Balloux and Lugon-Moulin, 2002), Fst values of 0-0.05, 0.05-0.15, and 0.15-0.25 indicate low, medium, and high levels of genetic differentiation between populations, respectively. In this study, the ANOVA results showed that the coefficient of genetic differentiation (FST) between populations was 0.01040, indicating that the genetic differences between the two populations of C. tritonis were not significant and there was no obvious genetic structure of the population. In addition, the results of AMOVA analysis showed that the variation of individuals within the population was the main source of genetic variation and that different shell color C. tritonis did not form a separate genetic structure, so we could not judge the shell color of C. tritonis by COI gene.
The shells of mollusks are produced by the outer folds of the mantle, and shell growth and pigmentation are under the control of neurosecretion (Boettiger et al., 2009; Budd et al., 2014). The shell pigmentation is caused by uroporphyrin I and that the amount of pigment produced is not genetically controlled but is influenced by environmental factors (Creese and Underwood, 1976), in addition, Comfort suggests that the porphyrins found in gastropod shells may be derived from the animal’s diet (Comfort, 1950). According to Manriquez et al. The shell color pattern of the abalone Cocholepas concholepas during early development depends on the color of the more abundant prey consumed, and they even change their shell color to adapt to different prey. Etter (Etter, 1988) found that the whelk Nucella lapillus showed considerable shell color variation both within and between populations. They reported that populations from high wave energy shores tended to be highly polymorphic and predominantly brown, while those located in more secluded locations showed less polymorphism and are predominantly white, which was in fact a selective gradient response to physiological stress. The frequency of the snail Littorina fabalis shell coloration and sexual competence were significantly correlated, showing a negative frequency-dependent selection pattern (i.e., high asymmetry in color mating) (Estévez et al., 2020). L. fabalis also exhibited a preference for rare or novel color patterns in mate selection. Due to the high dispersal of C. tritonis larvae, and C. tritonis feeds mainly on sea cucumbers, sea stars, and mother-of-pearl mussels. Thus, local adaptation to one prey species was impossible for C. tritonis, and natural selection drove the evolution of corresponding adaptations and flexibility, such as color plasticity. Different shell colors resulting from phenotypic plasticity due to environmental factors are indistinguishable by genetic information. It was found that three genetic species of Mactra chinensis could not be determined reliably based on analysis of the shell coloration due to the plasticity of these morphological characters (Reunov et al., 2021); in Corbicula population, morphotypes defined by internal shell color were indistinguishable in genetic background (Li et al., 2022), and there are also examples of different species with the same shell color (Williams et al., 2016), different species of marine snails Clanculus pharaonius and Clanculus margaritarius were examined that contained different pigments but produced similar colors. This fact shows that there may be some adaptive value for these colors and patterns despite differences in their habitats. The above examples show that the difference of shell color of C. tritonis may be the result of phenotypic plasticity due to adaptation to the environment, but this difference cannot be distinguished by COI gene, and it also shows that shell color may be a bad taxonomic feature for C. tritonis.
Both seaweeds and barnacles are similar to C. tritonis in that currents have a certain influence on their distribution. However, their evolutionary driving forces are different. Dietary specialization on particular prey types was crucial in the evolution of gastropods (Wagele, 2004; Goodheart et al., 2017), Conus geographus that belong to the same gastropods as C. tritonis, in order to catch as many fish as possible, Conus geographus evolved special adaptive ability, which made it possible for snails to catch a whole group of fish by net fishing strategy (Olivera et al., 2015). The maritime environment helps drive plant community homogenization (Gurgel et al., 2014), many seaweed species float on the sea surface and go with the currents after leaving their benthic habitats (Macaya et al., 2016). Different ecological niches will have different evolutionary driving forces, unlike C. tritonis which is a predator, seaweed as a primary producer in the ocean, are influenced by a variety of factors, including abiotic stress (Seapy and Littler, 1982), nutritional availability (Bracken and Nielsen, 2004; Kraufvelin et al., 2010) and herbivore (Nielsen, 2003; Altieri et al., 2009). In addition, the barnacles are sessile crustaceans with planktonic larval stages (Maruzzo et al., 2012), similar to C. tritonis, which is influenced by ocean currents. However, adult barnacles live permanently in a parasitic state attached to a wide range of substrates and other organisms (Power et al., 2010). Different lifestyles stimulate different driving forces for evolution, unlike C. tritonis, differentiation of barnacles is considered to be related to their hosts (Via, 2001). Invasion and subsequent adaptation to new hosts will promote reproductive isolation by selecting unsuitable hybrids, leading to genetic differentiation and eventually species differentiation (Schluter, 2001; Turelli et al., 2001). A high degree of morphological and genetic variation can be exhibited in barnacle populations from different coral hosts, such as Savignium dentatum (Mokady et al., 1999). In contrast, some coral barnacles, such as Cantellius species, can appear on a wide range of hosts and invade different kinds of corals and these barnacles were similar to the C. tritonis observed in this study, showing obvious phenotypic differences but lack of genetic differentiation (Mokady et al., 1999). Seaweeds and barnacles have similar planktonic stages to C. tritonis, but different lifestyles lead to different evolutionary drivers, with seaweeds evolving for fuller photosynthesis, barnacles evolving for host adaptation, and C. tritonis evolving for dietary specialization, according to Goodheart and Wagele’s theory (Wagele, 2004; Goodheart et al., 2017). Perhaps C. tritonis of different shell colors differ in their food preferences, but due to the lack of geographic isolation, they can only show distinct phenotypic differences and cannot produce differences at the genetic level.
In summary, in this study we used morphological data and DNA sequences of the COI gene to analyze differences between C. tritonis with two different shell colors. It was found that different shell lengths and live weight had no significant effect on the shell coloration of C. tritonis, and we hardly detected any genetic differences between the two shell colors. This fact suggests that the variation of shell color of C. tritonis may be the result of phenotypic plasticity caused by environmental factors or genetic differences, independent of body length and body weight, also, without forming independent genetic structures. Our research will provide essential information for the conservation of C. tritonis.
Data availability statement
The data presented in the study are deposited in the NCBI repository, accession number is from OP810573 to OP810600.
Author contributions
CX and GZ: Experiment, writing, and editing. MH: Reviewing.and supervision. WL: Project administration and approval. All authors contributed to the article and approved the submitted version.
Funding
This work was supported by National Natural Science Foundation of China (42176129), Natural Science Foundation of Guangdong Province (2022A1515010779), Planning Project of Guangdong Province, China. Guangdong Provincial Key Laboratory of Applied Marine Biology (2020B1212060058).
Conflict of interest
The authors declare that the research was conducted in the absence of any commercial or financial relationships that could be construed as a potential conflict of interest.
The handling editor FX declared a shared affiliation with theauthors at the time of review.
Publisher’s note
All claims expressed in this article are solely those of the authors and do not necessarily represent those of their affiliated organizations, or those of the publisher, the editors and the reviewers. Any product that may be evaluated in this article, or claim that may be made by its manufacturer, is not guaranteed or endorsed by the publisher.
Supplementary material
The Supplementary Material for this article can be found online at: https://www.frontiersin.org/articles/10.3389/fmars.2022.1066750/full#supplementary-material
References
Altieri A. H., Trussell G. C., Ewanchuk P. J., Bernatchez G., Bracken M. E. S., Sandin S. A. (2009). Consumers control diversity and functioning of a natural marine ecosystem. PloS One 4 (4), e5291. doi: 10.1371/journal.pone.0005291
Athanasios D. B., Ilias K., Theodore J. A. (2006). Molecular phylogenetics and asexuality in the brine shrimp artemia. Mol. Phylogenet. Evol. 40 (3), 724–738. doi: 10.1016/j.ympev.2006.04.010
Balloux F., Lugon-Moulin N. (2002). The estimation of population differentiation with microsatellite markers. Mol. Ecol. 11 (2), 155–165. doi: 10.1046/j.0962-1083.2001.01436.x
Bellwood D. R., Hughes T. P., Folke C., Nystrom M. (2004). Confronting the coral reef crisis. Nature 429 (6994), 827–833. doi: 10.1038/nature02691
Boettiger A., Ermentrout B., Oster G. (2009). The neural origins of shell structure and pattern in aquatic mollusks. Proceedings of the National Academy of Sciences. 106 (16), 6837–6842. doi: 10.1073/pnas.0810311106
Bracken M. E. S., Nielsen K. J. (2004). Diversity of intertidal macroalgae increases with nitrogen loading by invertebrates. Ecol. (Durham) 85 (10), 2828–2836. doi: 10.1890/03-0651
Brown W. M., Prager E. M., Wang A., Wilson A. C. (1982). Mitochondrial DNA sequences of primates: Tempo and mode of evolution. J. Mol. Evol. 18 (4), 225–239. doi: 10.1007/BF01734101
Budd A., McDougall C., Green K., Degnan B. M. (2014). Control of shell pigmentation by secretory tubules in the abalone mantle. Front. Zool. 11 (62), 1–9. doi: 10.1186/s12983-014-0062-0
Comfort A. (1950). A subsidiary shell pigment of haliotis cracherodii leach. Nature 166 (4213), 194–195. doi: 10.1038/166194b0
Creese R. G., Underwood A. J. (1976). Observations on the biology of the trochid gastropod Austrocochlea constricta (Lamarck) (Prosobranchia). II. The effects of available food on shell-banding pattern. J. Exp. Mar. Biol. Ecol. 23 (3), 211–228. doi: 10.1016/0022-0981(76)90021-6
Dunphy B. K., Hamrick J. L. (2005). Gene flow among established Puerto Rican populations of the exotic tree species, Albizia lebbeck. Heredity 94(4), 215–232. doi: 10.1038/sj.hdy.6800622
Estévez D., Kozminsky E., Carvajal R. A., Caballero A., Faria R., Galindo J., et al. (2020). Mate choice contributes to the maintenance of shell color polymorphism in a marine snail via frequency-dependent sexual Selection. Front. Mar. Sci. 7. doi: 10.3389/fmars.2020.614237
Etter R. J. (1988). Physiological stress and color polymorphism in the intertidal snail nucella lapillus. Evolution 42 (4), 660–680. doi: 10.1111/j.1558-5646.1988.tb02485.x
Evan L. P., Daniel I. B., Michael E. B. (2005). Scared to death? the effects of intimidation and consumption in predator-prey interactions. Ecology 86 (2), 501–509. doi: 10.1890/04-0719
Feng H., Zhang Y., Wu Z., Wu S., Bao W.. (2018). Analysis of codon usage patterns of MUC4 Gene in 13 Species of Mammals. Chinese J. Agri. Biotechnol. 26 (09), 1546–1556. doi: 10.3969/j.issn.1674-7968.2018.09.009
Gollner S., Stuckas H., Kihara T. C., Laurent S., Kodami S., Martinez Arbizu P., et al. (2016). Mitochondrial DNA analyses indicate high diversity, expansive population growth and high genetic connectivity of vent copepods (Dirivultidae) across different oceans. PloS One 11 (10), e163776. doi: 10.1371/journal.pone.0163776
Gonzalo A. C., Moisés A. V., Marco A. M. (2016). Unravelling cryptic species of freshwater snails (Caenogastropoda, truncatelloidea) in the loa river basin, atacama desert. Syst. Biodivers. 14 (4), 417–429. doi: 10.1080/14772000.2016.1153526
Goodheart J. A., Bazinet A. L., Valdés Á., Collins A. G., Cummings M. P. (2017). Prey preference follows phylogeny: Evolutionary dietary patterns within the marine gastropod group cladobranchia (Gastropoda: Heterobranchia: Nudibranchia). BMC Evol. Biol. 17 (1), 221. doi: 10.1186/s12862-017-1066-0
Grande C., Templado J., Zardoya R. (2008). Evolution of gastropod mitochondrial genome arrangements. BMC Evol. Biol. 8, 61. doi: 10.1186/1471-2148-8-61
Grant W., Bowen B. W. (1998). Shallow population histories in deep evolutionary lineages of marine fishes: Insights from sardines and anchovies and lessons for conservation. J. Hered. 89 (5), 415–426. doi: 10.1093/jhered/89.5.415
Groenenberg D. S. J., Harl J., Duijm E., Gittenberger E. (2017). The complete mitogenome of orcula dolium (Draparnaud 1801); ultra-deep sequencing from a single long-range PCR using the ion-torrent PGM. Hereditas 154 (1), 1494–1495. doi: 10.1186/s41065-017-0028-2
Groenenberg D. S. J., Pirovano W., Gittenberger E., Schilthuizen M. (2012). The complete mitogenome of cylindrus obtusus (Helicidae, ariantinae) using illumina next generation sequencing. BMC Genomics 13 (1), 114. doi: 10.1186/1471-2164-13-114
Gurgel C. F. D., Wernberg T., Thomsen M. S., Russell B. D., Adam P., Waters J. M., et al. (2014). Shared patterns of species turnover between seaweeds and seed plants break down at increasing distances from the sea. Ecol. Evol. 4 (1), 27–34. doi: 10.1002/ece3.893
Hall M. R., Kocot K. M., Baughman K. W., Fernandez-Valverde S. L., Gauthier M. E. A., Hatleberg W. L., et al. (2017). The crown-of-thorns starfish genome as a guide for biocontrol of this coral reef pest. Nature 544 (7649), 231–234. doi: 10.1038/nature22033
Houston A. I., Mcnamara J. M. (1992). Phenotypic plasticity as a state-dependent life-history decision. Evol. Ecol. 6 (3), 243–253. doi: 10.1007/BF02214164
Huelsenbeck J. P., Ronquist F. (2001). MRBAYES: Bayesian inference of phylogenetic trees. Bioinf. (Oxford England) 17 (8), 754–755. doi: 10.1093/bioinformatics/17.8.754
Kelly R. P., Palumbi S. R. (2009). General-use polymerase chain reaction primers for amplification and direct sequencing of enolase, a single-copy nuclear gene, from different animal phyla. Mol. Ecol. Resour. 9 (1), 144–147. doi: 10.1111/j.1755-0998.2008.02210.x
Kraufvelin P., Lindholm A., Pedersen M. F., Kirkerud L. A., Bonsdorff E. (2010). Biomass, diversity and production of rocky shore macroalgae at two nutrient enrichment and wave action levels. Mar. Biol. 157 (1), 29–47. doi: 10.1007/s00227-009-1293-z
Li J., Jia M. X., Cheng F., Wang Z., Hou G., Shu F. Y., et al. (2022). Two morphotypes with genetic divergence, different ploidy, and habitat preference in an exploited corbicula population in china. J. Shellfish Res. 41 (2), 263–276. doi: 10.2983/035.041.0212
Liu X., Wu F. C., Zhao H. G., Zhang G. F., Guo X. M. (2009). A novel shell color variant of the pacific abalone haliotis discus hannai ino subject to genetic control and dietary influence. J. Shellfish Res. 28 (2), 419–424. doi: 10.2983/035.028.0226
Lopes-Lima M., Burlakova L., Karatayev A. Y., Gomes-dos-Santos A., Zieritz A., Froufe E., et al (2019). Revisiting the North American freshwater mussel genus Quadrula sensu lato (Bivalvia Unionidae): Phylogeny, taxonomy and species delineation. Zool. Scr. 48 (3), 313–336. doi: 10.1111/zsc.12344
Macaya E. C., López B., Tala F., Tellier F., Thiel M. (2016). Float and raft: Role of buoyant seaweeds in the phylogeography and genetic structure of non-buoyant associated flora (97-130) (Dordrecht: Springer Netherlands).
Marshall D. J., Taha H., Brahim A., Abdelhady A. A. (2021). Supratidal existence drives phenotypic divergence, but not speciation, in tropical rocky-shore snails. Biol. J. Linn. Soc. 132 (1), 1–16. doi: 10.1093/biolinnean/blaa164
Maruzzo D., Aldred N., Clare A. S., Høeg J. T., Dupont S. (2012). Metamorphosis in the cirripede crustacean balanus amphitrite. PloS One 7 (5), e37408. doi: 10.1371/journal.pone.0037408
Miya M., Kawaguchi A., Nishida M. (2001). Mitogenomic exploration of higher teleostean phylogenies: A case study for moderate-scale evolutionary genomics with 38 newly determined complete mitochondrial DNA sequences. Mol. Biol. Evol. 18 (11), 1993–2009. doi: 10.1093/oxfordjournals.molbev.a003741
Mokady O., Loya Y., Achituv Y., Geffen E., Graur D., Rozenblatt S., et al. (1999). Speciation versus phenotypic plasticity in coral inhabiting barnacles: Darwin's observations in an ecological context. J. Mol. Evol. 49 (3), 367–375. doi: 10.1007/PL00006560
Nakano T., Ozawa T. (2007). Worldwide phylogeography of limpets of the order patellogastropoda: Molecular, morphological and palaeontological evidence. J. Mollus. Stud. 73 (1), 79–99. doi: 10.1093/mollus/eym001.
Nielsen K. J. (2003). Nutrient loading and consumers: Agents of change in open-coast macrophyte assemblages. Proc. Natl. Acad. Sci. - PNAS 100 (13), 7660–7665. doi: 10.1073/pnas.0932534100
Nugranad J., Chantrapornsilp S., Varapibal T.(2000). Feeding and spawning behaviour of the trumpet triton, charonia tritonis (L. 1758) in captivity. Phuket Mar. Biol. Center Special Publ. 21 (1), 51–56.
Olivera B. M., Seger J., Horvath M. P., Fedosov A. E. (2015). Prey-capture strategies of fish-hunting cone snails: Behavior, neurobiology and evolution. Brain Behav. Evol. 86 (1), 58–74. doi: 10.1159/000438449
Permana G. N., Slamet B., Permana B. A., Dewi A. K., Mahardika G. N. (2019). Population genetic structure of spiny lobsters, panulirus homarus and panulirus ornatus, in the INDIAN OCEAN, CORAL TRIANGLE, and SOUTH CHINA SEA. Indonesian Aquacult. J. 14 (1), 7–14. doi: 10.15578/iaj.14.1.2019.7-14.
Power A. M., Klepal W., Zheden V., Jonker J., McEvilly P., von Byern J. (2010). “Mechanisms of adhesion in adult barnacles,” in Biological Adhesive Systems. Editors von Byern J., Grunwald I. (Vienna, Austria: Springer Vienna), 153–168. doi: 10.1007/978-3-7091-0286-2_9.
Qi Z. (1998). Economic mollusks in China. Building 18, Maizidian Street, Beijing: China Agricultural Press.
Ren T., Yu D., Zhai Z., Tan C., He J., Shang D., et al. (2022) 53 (5), 1379–1387. doi: 10.3969/j.issn.2095-1191.2022.05.020
Reunov A., Lutaenko K., Vekhova E., Zhang J., Zakharov E., Sharina S., et al. (2021). In the Asia-pacific region, the COI DNA test revealed the divergence of the bivalve mollusc mactra chinensis into three species; can these species be distinguished using shell coloration and sperm structure? Helgoland Mar. Res. 75 (1), 1–19. doi: 10.1186/s10152-021-00553-0
Ribeiro P. A., Branco M., Hawkins S. J., Santos A. M. (2010). Recent changes in the distribution of a marine gastropod. patella rustica, across the Iberian Atlantic coast did not result in diminished genetic diversity or increased connectivity. J. Biogeogr. 37 (9), 1782–1796. doi: 10.1111/j.1365-2699.2010.02330.x.
Rydzanicz M., Cywinska K., Wrobel M., Pollak A., Gawecki W., Wojsyk-Banaszak I., et al. (2011). The contribution of the mitochondrial COI/tRNA(Ser(UCN)) gene mutations to non-syndromic and aminoglycoside-induced hearing loss in polish patients. Mol. Genet. Metab. 104 (1-2), 153–159. doi: 10.1016/j.ymgme.2011.05.004
Schluter D. (2001). Ecology and the origin of species: Special issue on speciation. Trends Ecol. Evol. (Amsterdam) 16 (7), 372–380. doi: 10.1016/S0169-5347(01)02198-X
Seapy R. R., Littler M. M. (1982). Population and species diversity fluctuations in a rocky intertidal community relative to severe aerial exposure and sediment burial. Mar. Biol. 71 (1), 87–96. doi: 10.1007/BF00396995
Stolbova N. G., Pirkova A. V., Ladygina L. V. (1996). Inheritance of shell color in mussel Mytilus galloprovincialis Lam. Cytol. Genet.+. 30 (6), 61–63.
Strathmann M. F. (1987). Reproduction and development of marine invertebrates of the northern pacific coast: Data and methods for the study of eggs, embryos, and larvae. Seattle, Washington: University of Washington Press.
Turelli M., Barton N. H., Coyne J. A. (2001). Theory and speciation Vol. 16 (England: Elsevier Ltd), 330–343.
Via S. (2001). Sympatric speciation in animals : The ugly duckling grows up: Special issue on speciation. Trends Ecol. Evol. (Amsterdam) 16 (7), 381–390. doi: 10.1016/S0169-5347(01)02188-7
Wagele H. (2004). Potential key characters in opisthobranchia (Gastropoda, Mollusca) enhancing adaptive radiation. Org. Divers. Evol. 4 (3), 175–188. doi: 10.1016/j.ode.2004.03.002
Wang X., Zhang Y., Zhang H., Qin G., Lin Q. (2019). Complete mitochondrial genomes of eight seahorses and pipefishes (Syngnathiformes: Syngnathidae): Insight into the adaptive radiation of syngnathid fishes. BMC Evol. Biol. 19 (1), 119. doi: 10.1186/s12862-019-1430-3
Wilke T., Falniowski A. (2001). The genus adriohydrobia (Hydrobiidae: Gastropoda): Polytypic species or polymorphic populations? J. Zool. Syst. Evol. Res. 39 (4), 227–234. doi: 10.1046/j.1439-0469.2001.00171.x
Williams S. T., Ito S., Wakamatsu K., Goral T., Edwards N. P., Wogelius R. A., et al. (2016). Identification of shell colour pigments in marine snails clanculus pharaonius and c. margaritarius (Trochoidea; Gastropoda). PloS One 11 (7), e156664. doi: 10.1371/journal.pone.0156664
Wu Z., Zhou L., Chi Z., Wu B., Sun X., Liu Z., et al. (2022). Effects of southern culture pattern on PopulationGenetic structure of haliotis discus hannai based onMitochondrial COl and cytb gene sequences. J. fisheries Chian, 1–10.
Ye Y. Y., Wu C. W., Li J. J. (2015). Genetic population structure of macridiscus multifarius (Mollusca: Bivalvia) on the basis of mitochondrial markers: Strong population structure in a species with a short planktonic larval stage. PloS One 10 (12), 1–13. doi: 10.1371/journal.pone.0146260
Keywords: C. tritonis, mitochondrial COI gene, haplotypes, genetic differentiation, shell color
Citation: Cen X, Zhang G, Liu H, Yao G, Xiong P, He M and Liu W (2023) Analysis of genetic diversity in two different shell colors of the giant triton snail (Charonia tritonis) based on mitochondrial COI sequences. Front. Mar. Sci. 9:1066750. doi: 10.3389/fmars.2022.1066750
Received: 11 October 2022; Accepted: 14 December 2022;
Published: 06 January 2023.
Edited by:
Fei Xu, Institute of Oceanology, Chinese Academy of Sciences (CAS), ChinaReviewed by:
Zhiqiang Han, Zhejiang Ocean University, ChinaJianmin Zhao, Yantai Institute of Coastal Zone Research, Chinese Academy of Sciences (CAS), China
Chi Chiu Cheang, The Education University of Hong Kong, Hong Kong SAR, China
Copyright © 2023 Cen, Zhang, Liu, Yao, Xiong, He and Liu. This is an open-access article distributed under the terms of the Creative Commons Attribution License (CC BY). The use, distribution or reproduction in other forums is permitted, provided the original author(s) and the copyright owner(s) are credited and that the original publication in this journal is cited, in accordance with accepted academic practice. No use, distribution or reproduction is permitted which does not comply with these terms.
*Correspondence: Wenguang Liu, bHdnQHNjc2lvLmFjLmNu
†These authors share first authorship