 Cong Xiao1
 Xiao-Hua Zhu1,2,3*
 Zenan Zhu1
 Chuanzheng Zhang1
 Hua Zheng1,3
 Zhensheng Zhang1Jiwen Zhong4Lixin Wei4
- 1State Key Laboratory of Satellite Ocean Environment Dynamics, Second Institute of Oceanography, Ministry of Natural Resources, Hangzhou, China
- 2Southern Marine Science and Engineering Guangdong Laboratory (Zhuhai), Zhuhai, China
- 3School of Oceanography, Shanghai Jiao Tong University, Shanghai, China
- 4Lower Changjiang River Bureau of Hydrological and Water Resources Survey, Hydrology Bureau of Changjiang Water Resources Commission, Nanjing, China
The streamflow characteristics within the Yangtze River Basin have experienced substantial fluctuations in recent years because of the combined effects of environmental factors and intensive human activities. In this study, at the Datong station, two coastal acoustic tomography (CAT) systems were used to track the Yangtze River discharge from July 2018 to January 2021. The stage–discharge relationship presented large uncertainties because of the Three Gorges Dam (TGD) operations, whereas the CAT method performed effectively in discharge monitoring even during extreme flood events. The distribution of downstream discharge was concentrated because of the regulation by the TGD. Analysis of the potential drivers in the downstream river hydrology reveals that the effect of rainfall events (leading to a maximum of ~40% changes) was heavily influenced by the regulation by the TGD (at least 50% contribution). Additionally, the river–tide process is also sensitive to the discharge regulated by the TGD. The discharge induced by tidal waves was negligible (a maximum of 1.11% change). This work demonstrates that an acoustic method can effectively monitor the massive flood discharge in unsteady flow conditions in large rivers, thereby facilitating the management of large-scale dam- and tide-influenced river systems.
Introduction
River discharge is a key hydrological issue for the river and water resources management. The continuous and real-time monitoring of water discharge and its variation at different time scales are of prime importance (Mei et al., 2019), especially for large river basins. Thus, establishing technology and methods for river discharge monitoring is pertinent. Usually, river discharge is estimated based on stage–discharge relationships using the rating curve (RC) method (Gore and Banning, 2017). Usually a one-to-one relationship between the river stage and water discharge is not established under unsteady flow conditions (Baldassarre and Montanari, 2009), thereby posing a challenge in measuring the cross-sectional velocity and discharge in unsteady flows or during extreme flood events. Recently, a variety of hydroacoustic instruments, for example, acoustic velocity meters (Ruhl and Derose, 2004) and horizontal acoustic Doppler profilers (Hoitink et al., 2009), have been employed to measure river discharge. However, these shipboard measurements lead to short duration estimates and are labor-intensive, and observations during extreme hydrological events are difficult and dangerous, especially for large river channels.
The Yangtze River (YR), China’s largest river, has attracted extensive attention from various research fields (e.g., ecology, hydrology, and climatology) in recent decades, particularly since the Three Gorges Dam (TGD) commenced operations in 2003 (Dai et al., 2010; Guo et al., 2012; Sun et al., 2012; Lai et al., 2014; Lyu et al., 2018; Cai et al., 2019; Gao et al., 2021). Effective monitoring and control of floods in the Yangtze River Basin (YRB) ensure China’s national water security (Xia and Chen, 2021). Historically, frequent and massive floods have significantly halted social advancement of the YRB (Zhang et al., 2021). Floods from the upstream Yichang station (~1,800 km upstream from the estuary) typically take at least 15–20 days to reach the estuary, and coupled with the incoming discharge from the middle–lower reaches, the floods remain for a long duration, which makes the middle–lower regions of the YRB vulnerable to water disasters (Jia et al., 2022). Therefore, an accurate estimation of water discharge in the middle–lower regions of the YRB, especially the precise determination of the instantaneous flood peak, is essential for the management and control of floods in the YRB (Luo et al., 2015).
Coastal acoustic tomography (CAT) is a novel flow measurement technique (Kaneko et al., 2020) that does not disturb shipping traffic and fishing activity, and it is extensively utilized to gauge water currents and discharge in estuaries and tidal rivers (Zhu et al., 2012; Kawanisi et al., 2017). Compared with traditional gauging stations or acoustic Doppler current profiler (ADCP) transect water discharge measurements, the depth- and section-averaged velocities along the sound ray path can be easily gauged using the acoustic tomography method at a high temporal resolution (Kawanisi et al., 2018). Unlike conventional methods, CAT can immediately and in real-time observe the cross-sectional average velocity based on its sound reciprocal travel time without using complicated post-processing procedures. A previous study demonstrated the feasibility of using CAT to estimate discharge at the Datong (DT) station of the YR for 2.5 years (Zhu et al., 2021) and they successfully reported two massive floods with a peak discharge of > 80,000 m3/s; however, it did not discuss the roles of the TGD in discharge control and the tidal effect on the discharge. This inspired us to use the CAT dataset to study the temporal runoff characteristics at the DT hydrometric station. Consequently, the primary objective of this study was to estimate the continuous discharge in large river using CAT and investigate the hydrological runoff characteristics in a critical location in the large river basin along the YR. A comprehensive understanding of the influence of the dam and the barrier effects of tidal waves on YR discharge would contribute to better water resource use and flood prevention in the YRB.
Data and methods
Field observations
In this study, the CAT observation region was located at the DT station (Figure 1). The locations of the observation area and the two CAT systems are shown in Figure 1B. the horizontal distance between the two CAT stations is 3,015 m and the angle between the NS line and the north riverbank is ~31°
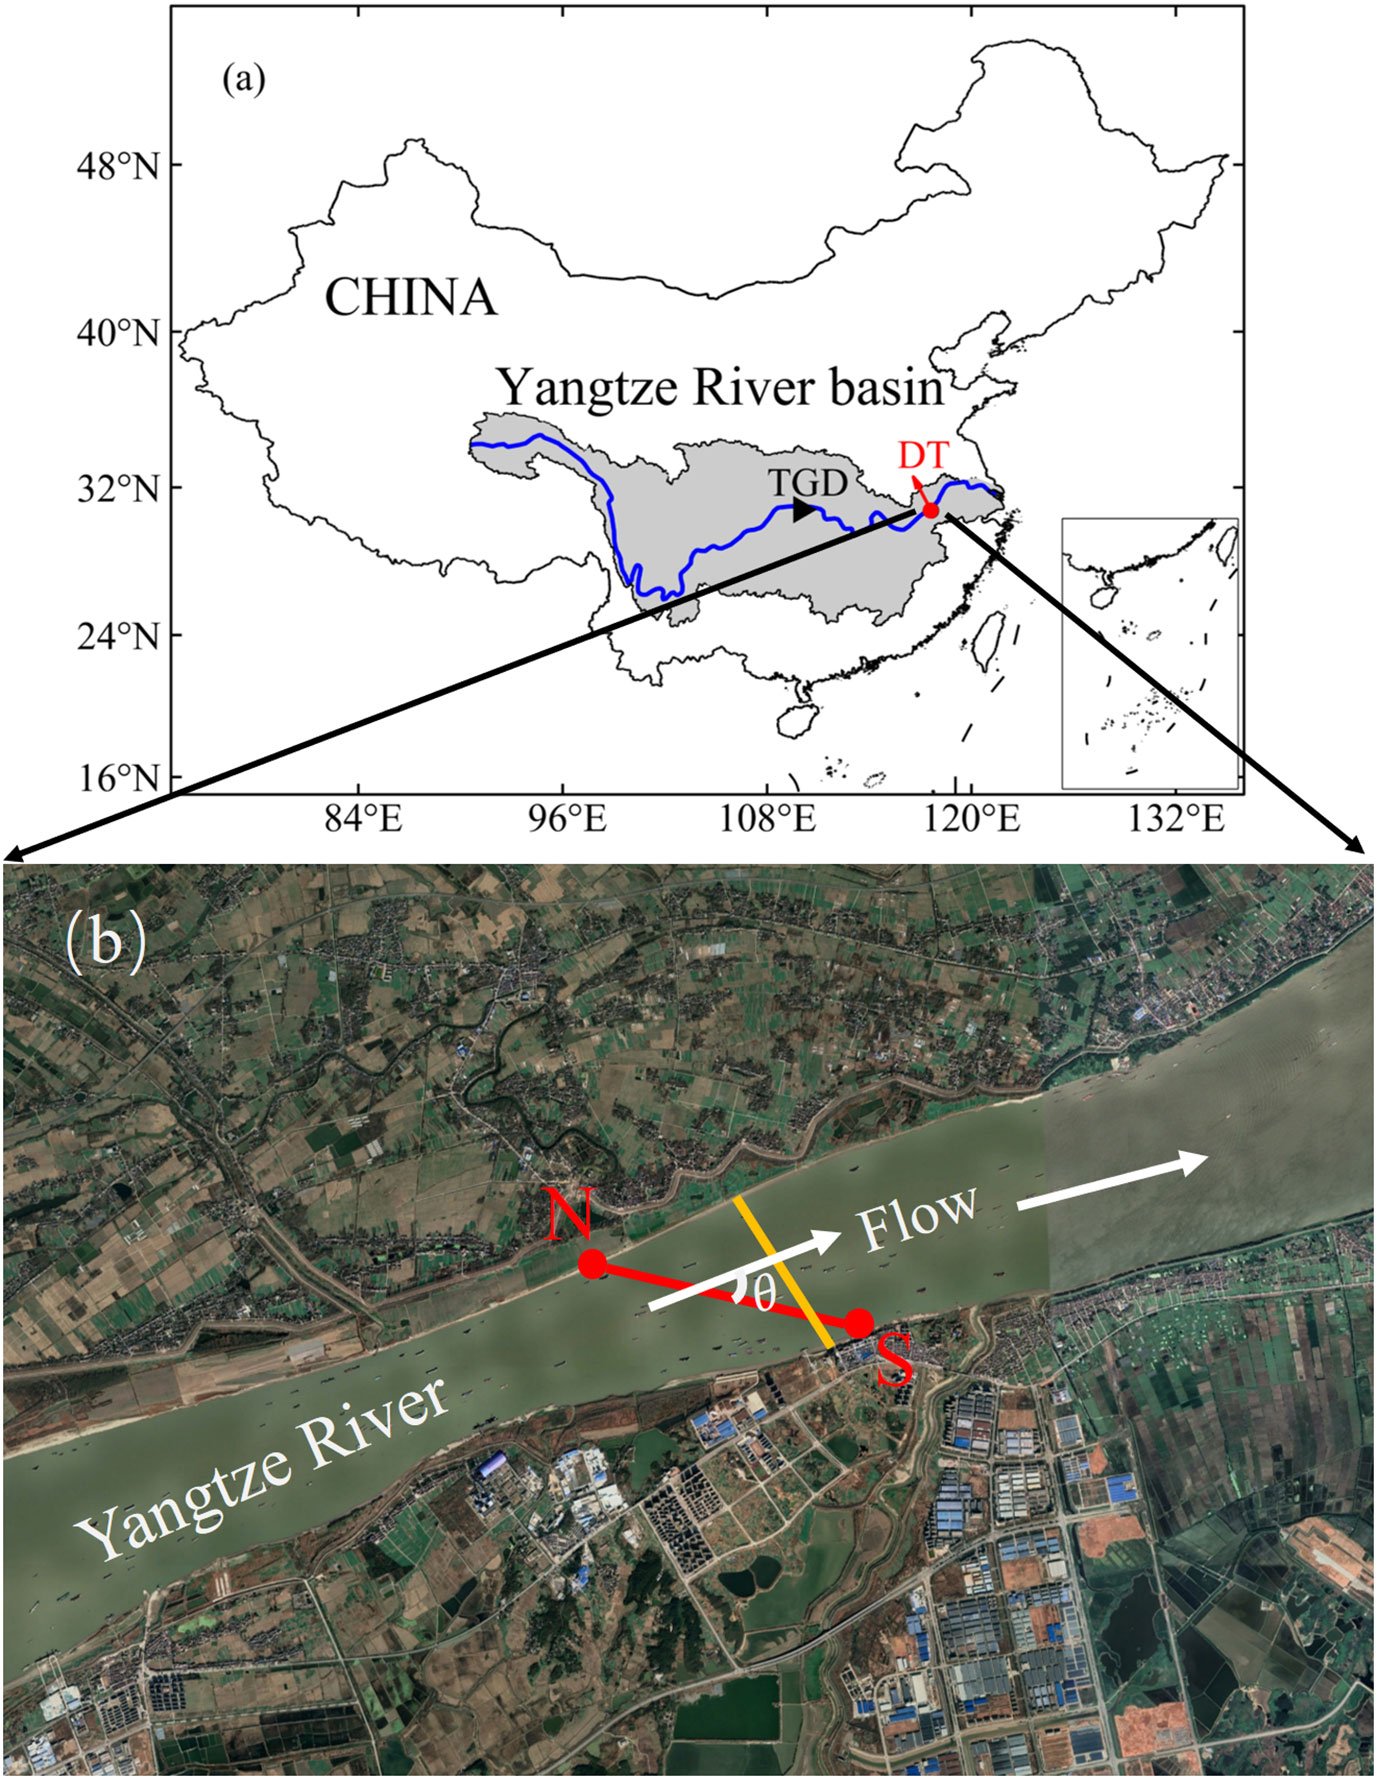
Figure 1 (A) Map of the Yangtze River Basin and the main channel of Yangtze River (blue line); (B) Map of the observation site and positions of two CAT stations (N and S), θ represents the angle between the main flow direction and ray path of two CAT stations projected to the horizontal plane, the station S is near the Datong (DT) hydrometric station, the yellow line denotes the transect of the moving-boat ADCP. The black triangle denotes the position of the Three Gorges Dam (TGD), and the red dot denotes the location of the DT station.
The DT station is the first hydrometric station along the main channel of the YR, situated ~1,100 km downstream of the TGD and ~630 km upstream from the estuary (Cai et al., 2019; Mei et al., 2021). Additionally, the DT station is the most widely acknowledged location of the topmost boundary of the tide, and the discharge is not altered by the tide (Shi et al., 2018). In the middle–lower reaches of the YR, the water levels frequently exceeded the warning levels owing to the continuous heavy rainfall during the rainy season. Thus, monitoring water discharge using CAT at the DT station is crucial for flood management in the middle–lower reaches of the YR.
The YR is ~6,300 km long and the area of YRB is 1.8 million km2. The total annual water flow through the YR is 961.6 billion m3, accounting for 36% of the total runoff in Chinese rivers (Yu et al., 2020). The world’s largest hydroelectric project, the TGD, is situated in the middle reaches of the YR, it measures 2,309.5 meters in length and 185 m in height. There is an artificial lake (Three Gorges Reservoir) formed upon the accomplishment of the TGD, covering 1,084 km2 with a total reservoir capacity of 39.3 billion m3 (Wang et al., 2020).
Precipitation in the YRB showed distinct seasonal patterns from 2018 to 2021 (Figure 2). Precipitation data were obtained from the fifth generation European Centre for Medium-Range Weather Forecasts reanalysis (ERA5) hourly data (https://cds.climate.copernicus.eu) for global climate and weather. Precipitation in the YRB is typically high from March to May, followed by the plum-rain season over the middle–lower river areas from June to early July (Dai, 2021) (Figure 2B). During summer, the entire river catchment may be covered by the rain belt from June to August (Figure 2C). The runoff of the YRB exhibits a high consistency with rainfall and progressively declines from southeast to northwest (Gao et al., 2021), with low rainfall from November to February (Figure 2A) and high rainfall from June to August (Dai, 2021) (Figure 2C).
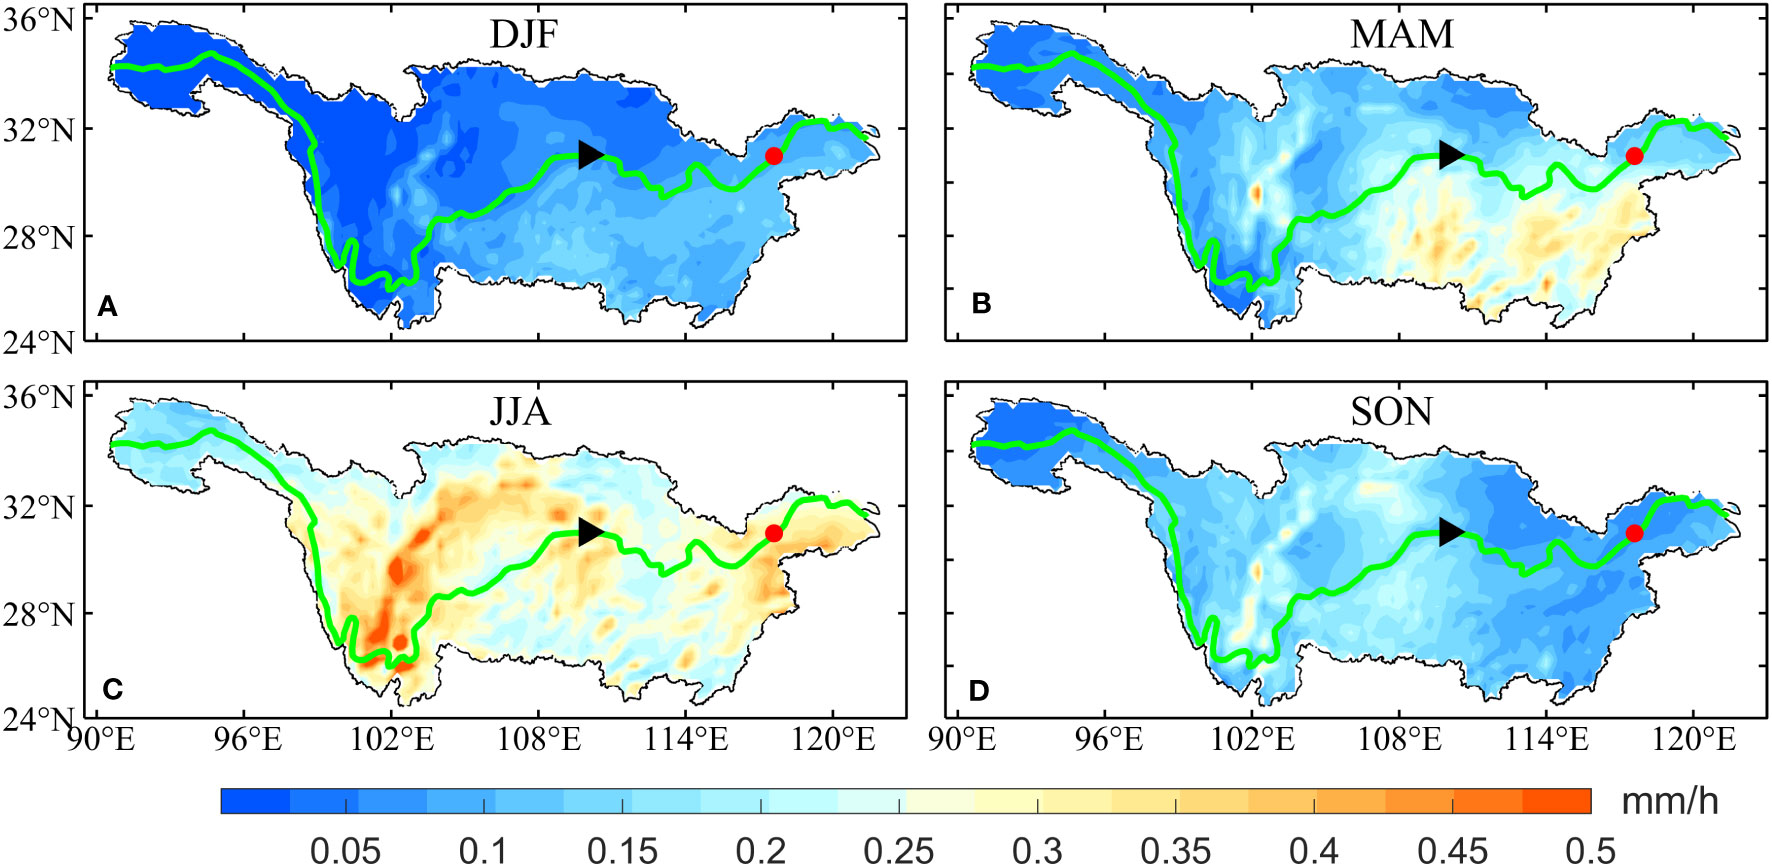
Figure 2 Seasonal climatological distributions of precipitation (A) December–January–February (DJF), (B) March–April–May (MAM), (C) June–July–August (JJA), and (D) September–October–November (SON) over the Yangtze River Basin from 2018 to 2021. The black triangle shows the position of the Three Gorges Dam (TGD), and the red dot shows the location of the Datong (DT) station.
Overview and measurements using CAT
Discharge measurements were conducted using CAT for ~2.5 years (July 2018–January 2021) at the DT hydrometric station (near station S). As shown in Figure 1B, two CAT systems were set on both north (N) and south (S) riverbanks, with a distance of 3,015 m between the two stations. The monitoring systems were placed on a floating barge, and the CAT transducers were suspended 2 m under water. The CAT systems were supplied with a clock from GPS receivers to maintain and guarantee simultaneous operations of the systems. During the observation period, the acoustic pulse was modulated by an 11-order M sequence, and acoustic pulses were simultaneously transmitted from both transducers every 5 min with a central frequency of 9 kHz.
The travel-time method was used in CAT, assuming the same reciprocal travel path between two stations; therefore, the travel time of the acoustic signals from site N to site S (tNS) and site S to site N (tSN) can be represented as
where L represents the oblique distance between the two stations, cCAT and uCAT represent the section-averaged sound speed and velocity, respectively.
The discharge obtained by CAT (QCAT) can be written as:
where θ is the flow angle, and A is the cross-sectional area. A was estimated using the mean water depth and mean distance, since two stations were fixed, and the error of A was mostly related to the water depth error. As Zhu et al. (2021) showed that an error of 0.19 m in mean water depth would induce an ~1% (~329 m2) error in the estimation of mean area.
ADCP measurements and establishing the rating curve
During the CAT observation period, many moving-boat ADCP (600 kHz Rio Grande Workhorse, California, USA) observations were conducted to collect reference discharge data at the DT station. For each campaign, the ADCP was arranged under water (0.5 m), a differential GPS receiver was fixed above the ADCP to record the real-time position. During each campaign, ADCP sampling was conducted each 2 s using the ADCP bottom tracking mode. The bin number was set at 70 and each bin size was 0.5 m and the unmeasurable surface depth was 0.25 m. The accuracy of velocity was ± 0.25% of the measured velocity with a resolution of 0.1 cm/s.
Owing to the limitations of the moving-boat ADCP method, there are a blank area and the underwater depth of the ADCP in the surface layer and the near-bed flow velocity could not be measured by ADCP. Hence, water discharge in the surface and bottom layers and areas adjoining riverbanks were not measured. Generally, the discharge in these unmeasured areas can be ignored in small river systems; however, in large river systems such as the YR, estimation of the water discharge in these unmeasured areas is necessary. Hence, in this study, the velocities in the surface and near-bed layers were estimated using linear extrapolation of data of the nearest bin, that is, the surface velocity was estimated from data of the first bin and the bottom velocity was estimated from data of the deepest bin. The boat is difficult to start from the river bank, there will be a certain distance from the bank. The velocity in areas close to river banks was derived through extrapolation, assuming that the near-bank water column progressively became shallow with a steady water slope until it extended to the river bank (Gordon, 1989). Finally, the discharge of each ADCP transect was estimated via integration.
Missing ADCP data in the surface layer accounted for the largest fraction, with a range of 543 to 3,863 m3/s. Missing data in the bottom layer varied from 650 to 3,389 m3/s, whereas missing data in the left and right areas were negligible with their averages accounting for 0.2 and 0.3% of the total discharge, respectively. In total, 140 discharge estimates (QADCP) were collected through the moving-boat ADCP during the CAT observation period. The QADCP ranged from 11,969 to 83,055 m3/s.
A HOBO water level logger with a pressure sensor (U20L-01) was attached at station S near the riverbed to measure the water depth (H) every 10 min with a precision of ± 0.1 cm and a typical error of ± 0.1% of the measured range of 1.0 cm. The collected water depth was further utilized to estimate the cross-sectional area and build an RC.
An RC relationship (Kawanisi et al., 2016) was established between the moving-boat ADCP discharges and water depths at station S as follows:
where c1 and c2 are the calibration constants and they are determined using the least-squares method.
Extraction of baseflow and stormflow
Understanding the response of runoff to precipitation events and anthropogenic activities is essential for hydrological applications and water resource management (Wang et al., 2022). Baseflow is an essential component of runoff in hydrological basins (Dai et al., 2010), whereas stormflow is usually at a higher volume over a short period following major rainfall events. Estimating baseflow and stormflow can provide important references for the sustainability of water resources in the YRB. Hence, the HydRun toolbox (Tang and Carey, 2017), which can automatically distinguish baseflow and stormflow based on the recursive digital filter technique, was utilized in this work. HydRun can also match stormflow with their accompanying rainfall events using a flexible time step. Further details are available in Tang and Carey (2017).
Grouped frequency distribution
The grouped frequency distribution is usually recommended when a large number of continuous variables must be evaluated (Mei et al., 2015), and it first groups parameters into different intervals based on their values, and then, gives each class a frequency. Thus, the relative frequency (RF) is determined by
where Ni represents the number that falls in a specific class and N is the amount of data.
Grouped frequency analysis was applied at the DT station (QCAT) to determine the occurrence probabilities of water discharge and TGD outflow at different intervals.
Results
Rating curve and index velocity methods
Figure 3A shows the relationship between water depth (H) at station S and moving-boat ADCP discharge (QADCP). The power function in Eq. 4 is fitted to the relation to establish the RC, the RC (red line) and the 95% confidence intervals (gray lines) are presented in Figure 3A. In addition, a linear relationship (R2 = 0.997) was established between the moving-boat ADCP-determined cross-sectional area and the water depth (H) at station S (Figure 3B). This empirical relationship was used to estimate the time series of the cross-sectional area.
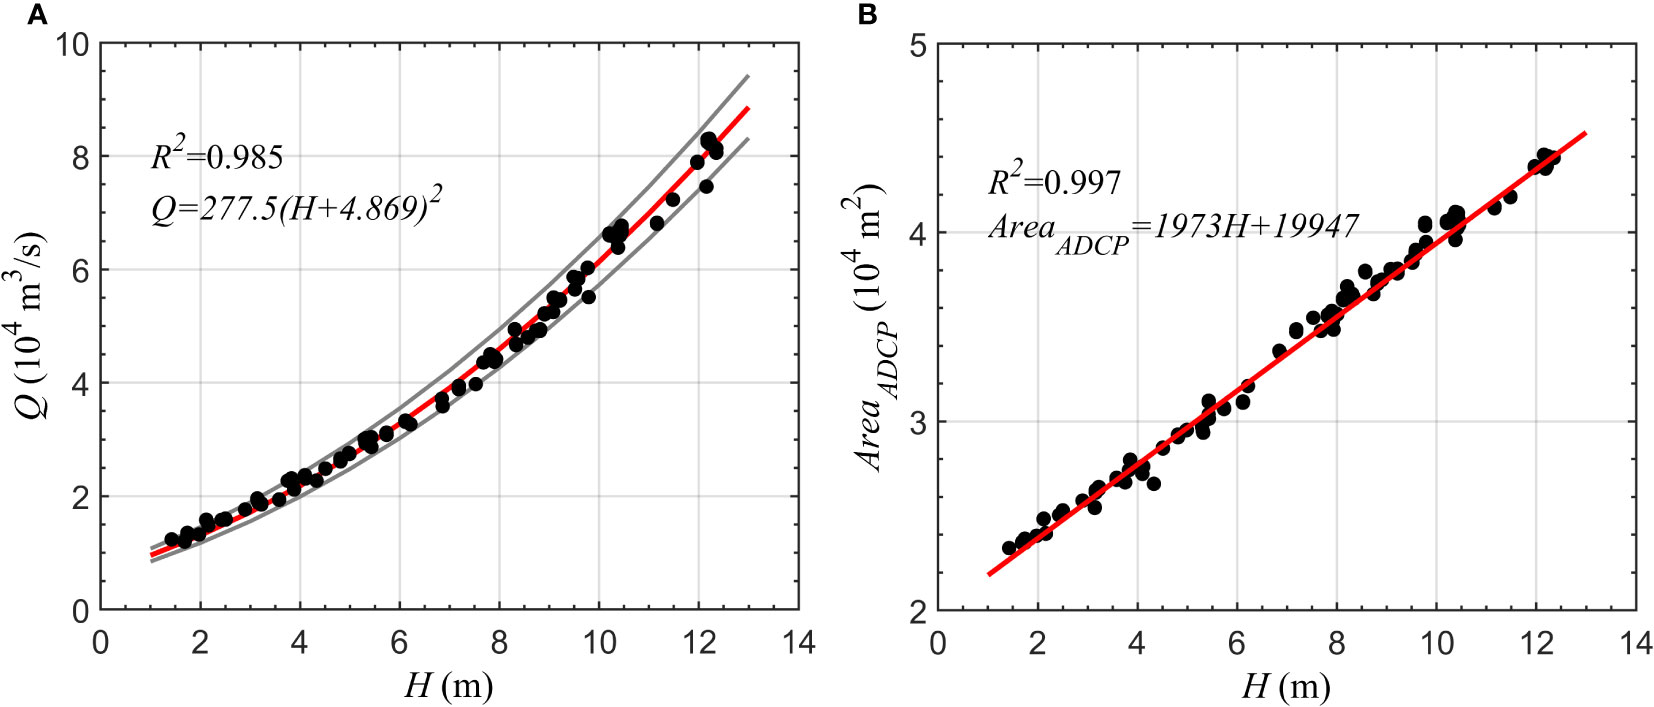
Figure 3 (A) RC relationship (red line) build using moving-boat ADCP results, gray lines represent the 95% confidence level; (B) Linear empirical relationship between the water depth (H) and moving-boat ADCP measured area (AreaADCP).
Kawanisi et al. (2013) stated that the incorrect resolve of angle (θ) between the transmission line and the main flow direction might cause a considerable discharge estimation error and revealed that variations of ±1° could induce relative discharge errors of −5.4 and 5.5%. Hence, this study utilized an index velocity for uCAT to avoid estimating flow direction. The index velocity ratings are shown in Figure 4. The index velocity curve for CAT was resolved using linear regression, the measured section-averaged velocity uADCP = QADCP/AADCP, with QADCP representing the moving-boat ADCP discharge and AADCP representing the sectional area along the ADCP transect. Finally, the streamflow of CAT can be computed by:
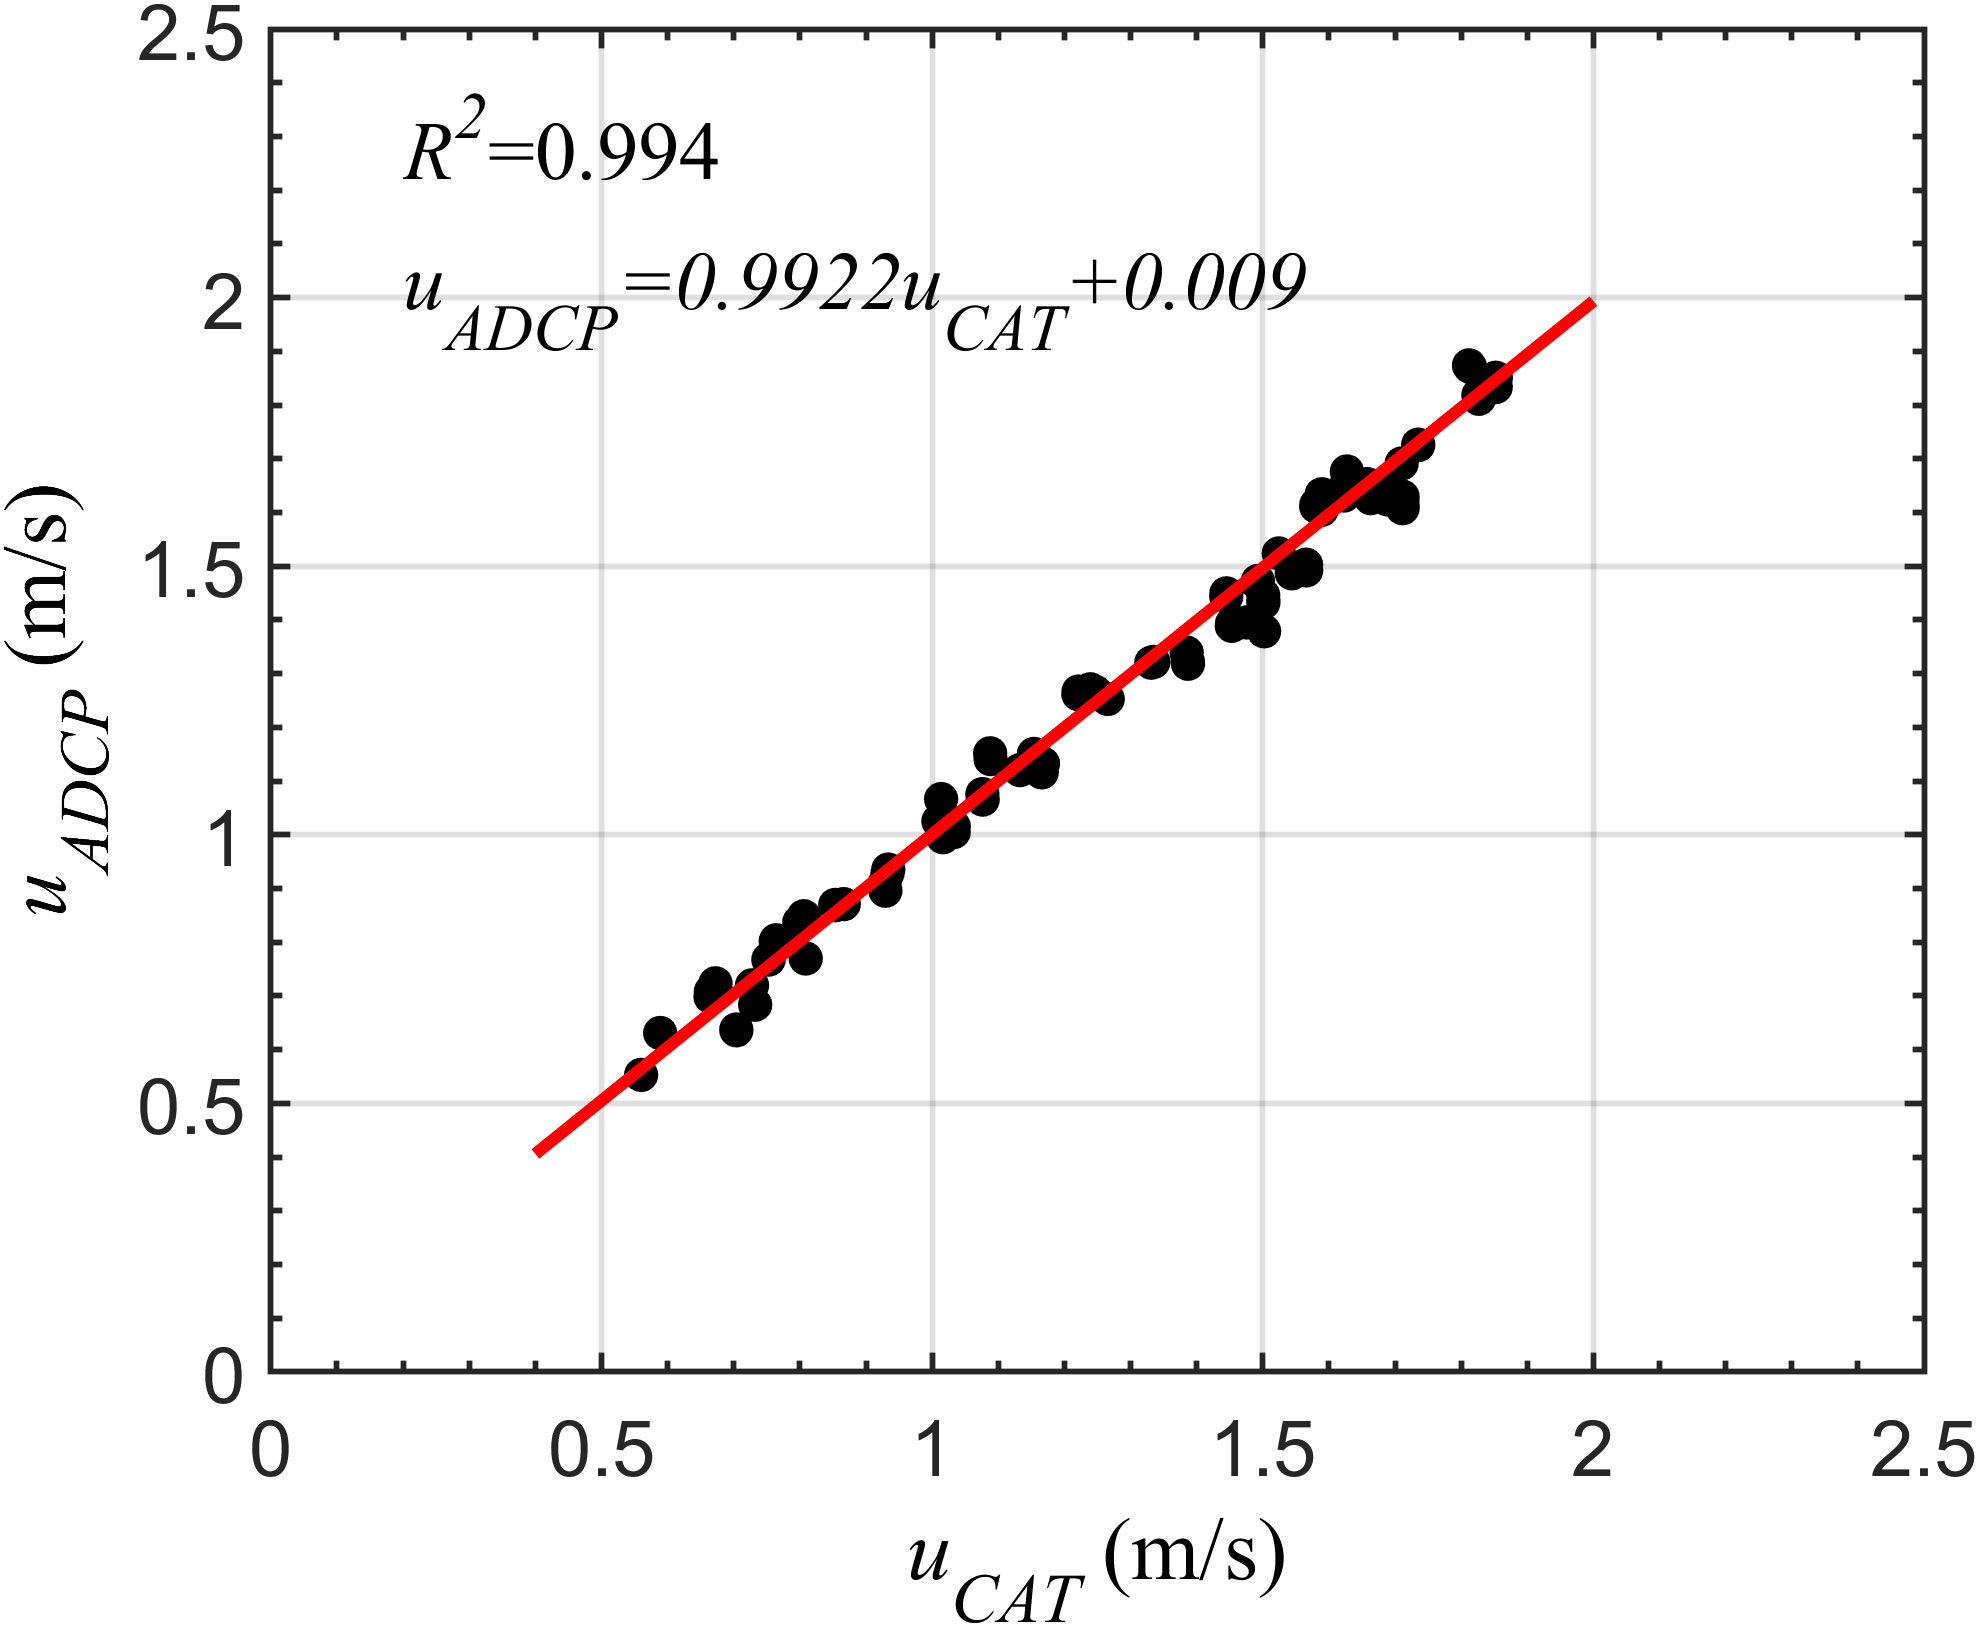
Figure 4 Index velocity relationship of uCAT and uADCP.
Time series of discharge and TGD outflow
CAT- and RC-derived discharges are shown in Figure 5A. Discharges of the YR ranged from 11,059 to 82,206 m3/s from July 2018 to January 2021 and displayed an evident seasonal variation. The discharge exhibits high consistency with the rainfall pattern, with fluctuations of high discharge and precipitation in summer and low discharge and precipitation in winter (Figure 5A). CAT shows a good consistency with the moving-boat ADCP results. The comparison between QADCP and QCAT showed a good correlation with R2 = 0.999 and RMSE = 891.9 m3/s (Figure 6). Compared with previous studies (Zhu et al., 2021), the results of this study are higher by approximately 1%, which is mainly due to the index method and the consideration of the flow angle.
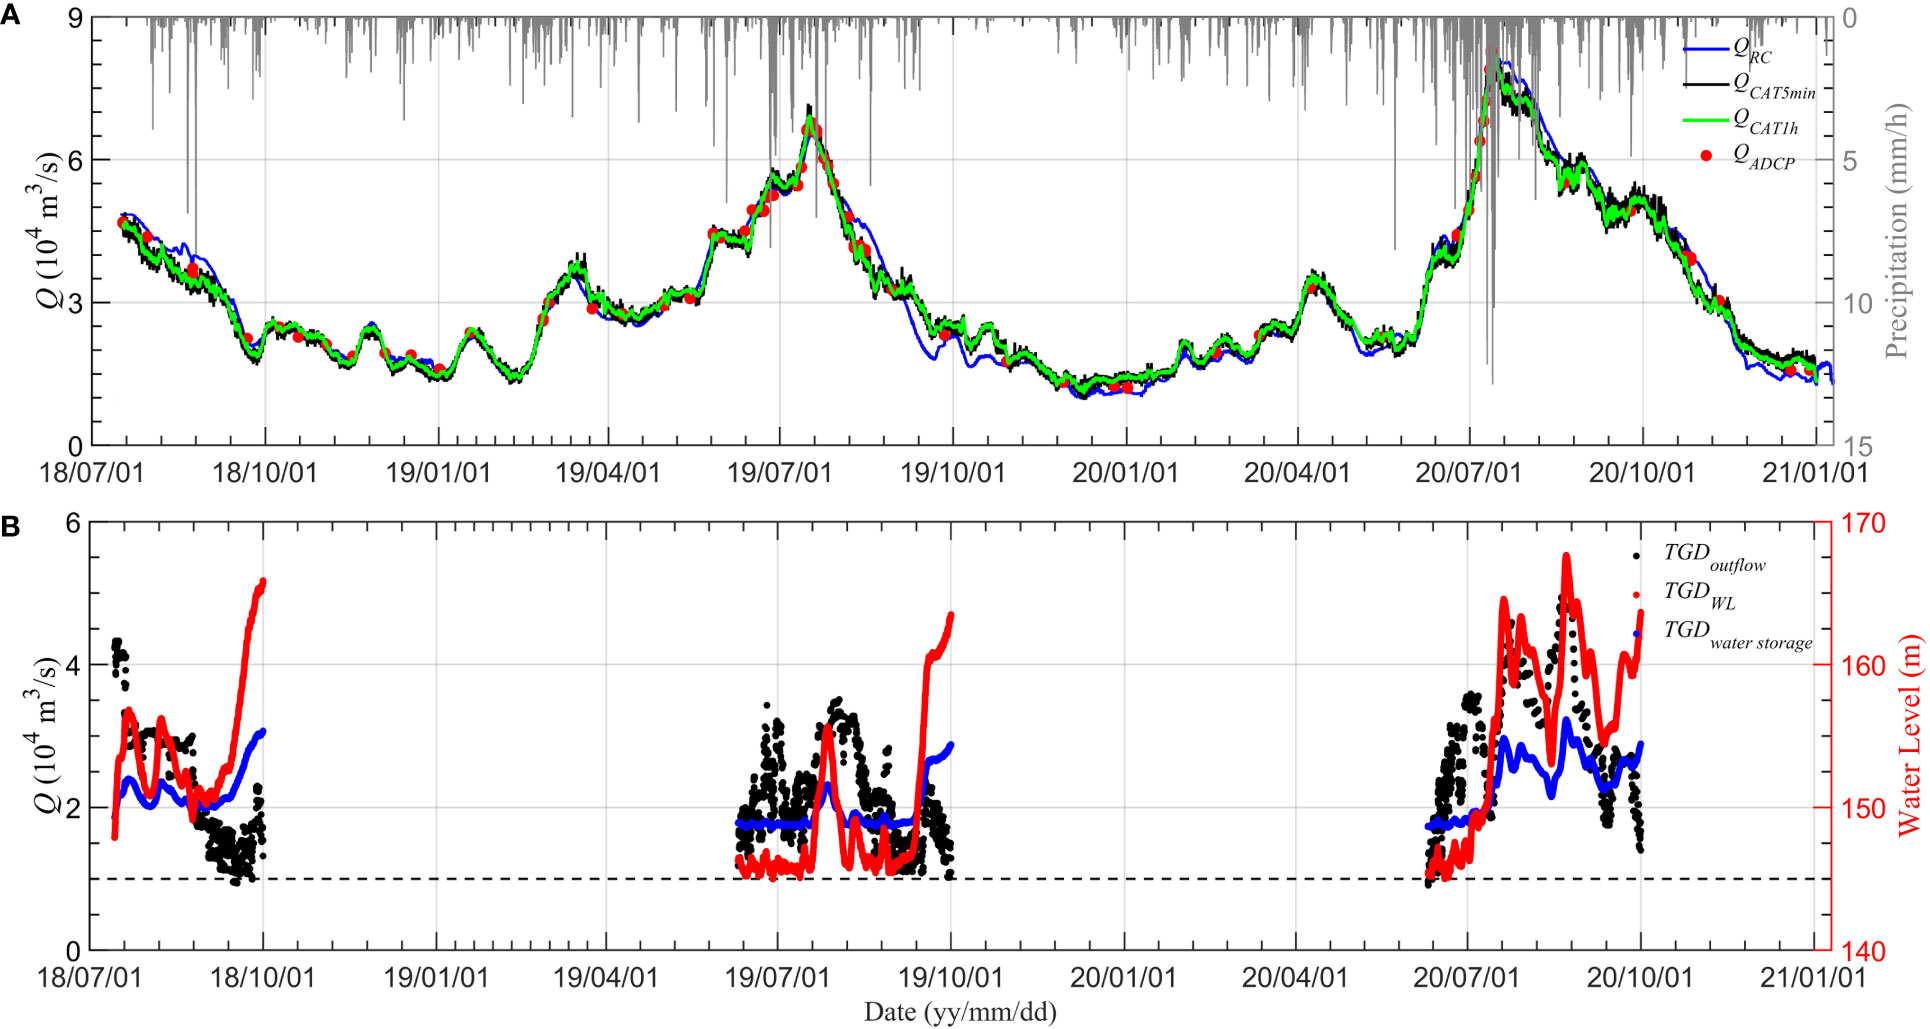
Figure 5 (A) Discharge time series during the observation period (July 2018 to January 2021) for different methods, RC (blue) and CAT. The black line represents the raw 5-min interval of CAT data and the green line represents the 1-h moving average. Red dots represent results obtained using the moving-boat ADCP. The gray bar shows hourly precipitation data near the Datong station obtained from ERA5 data; (B) TGD outflow, water storage, and water level time series during the observation period.
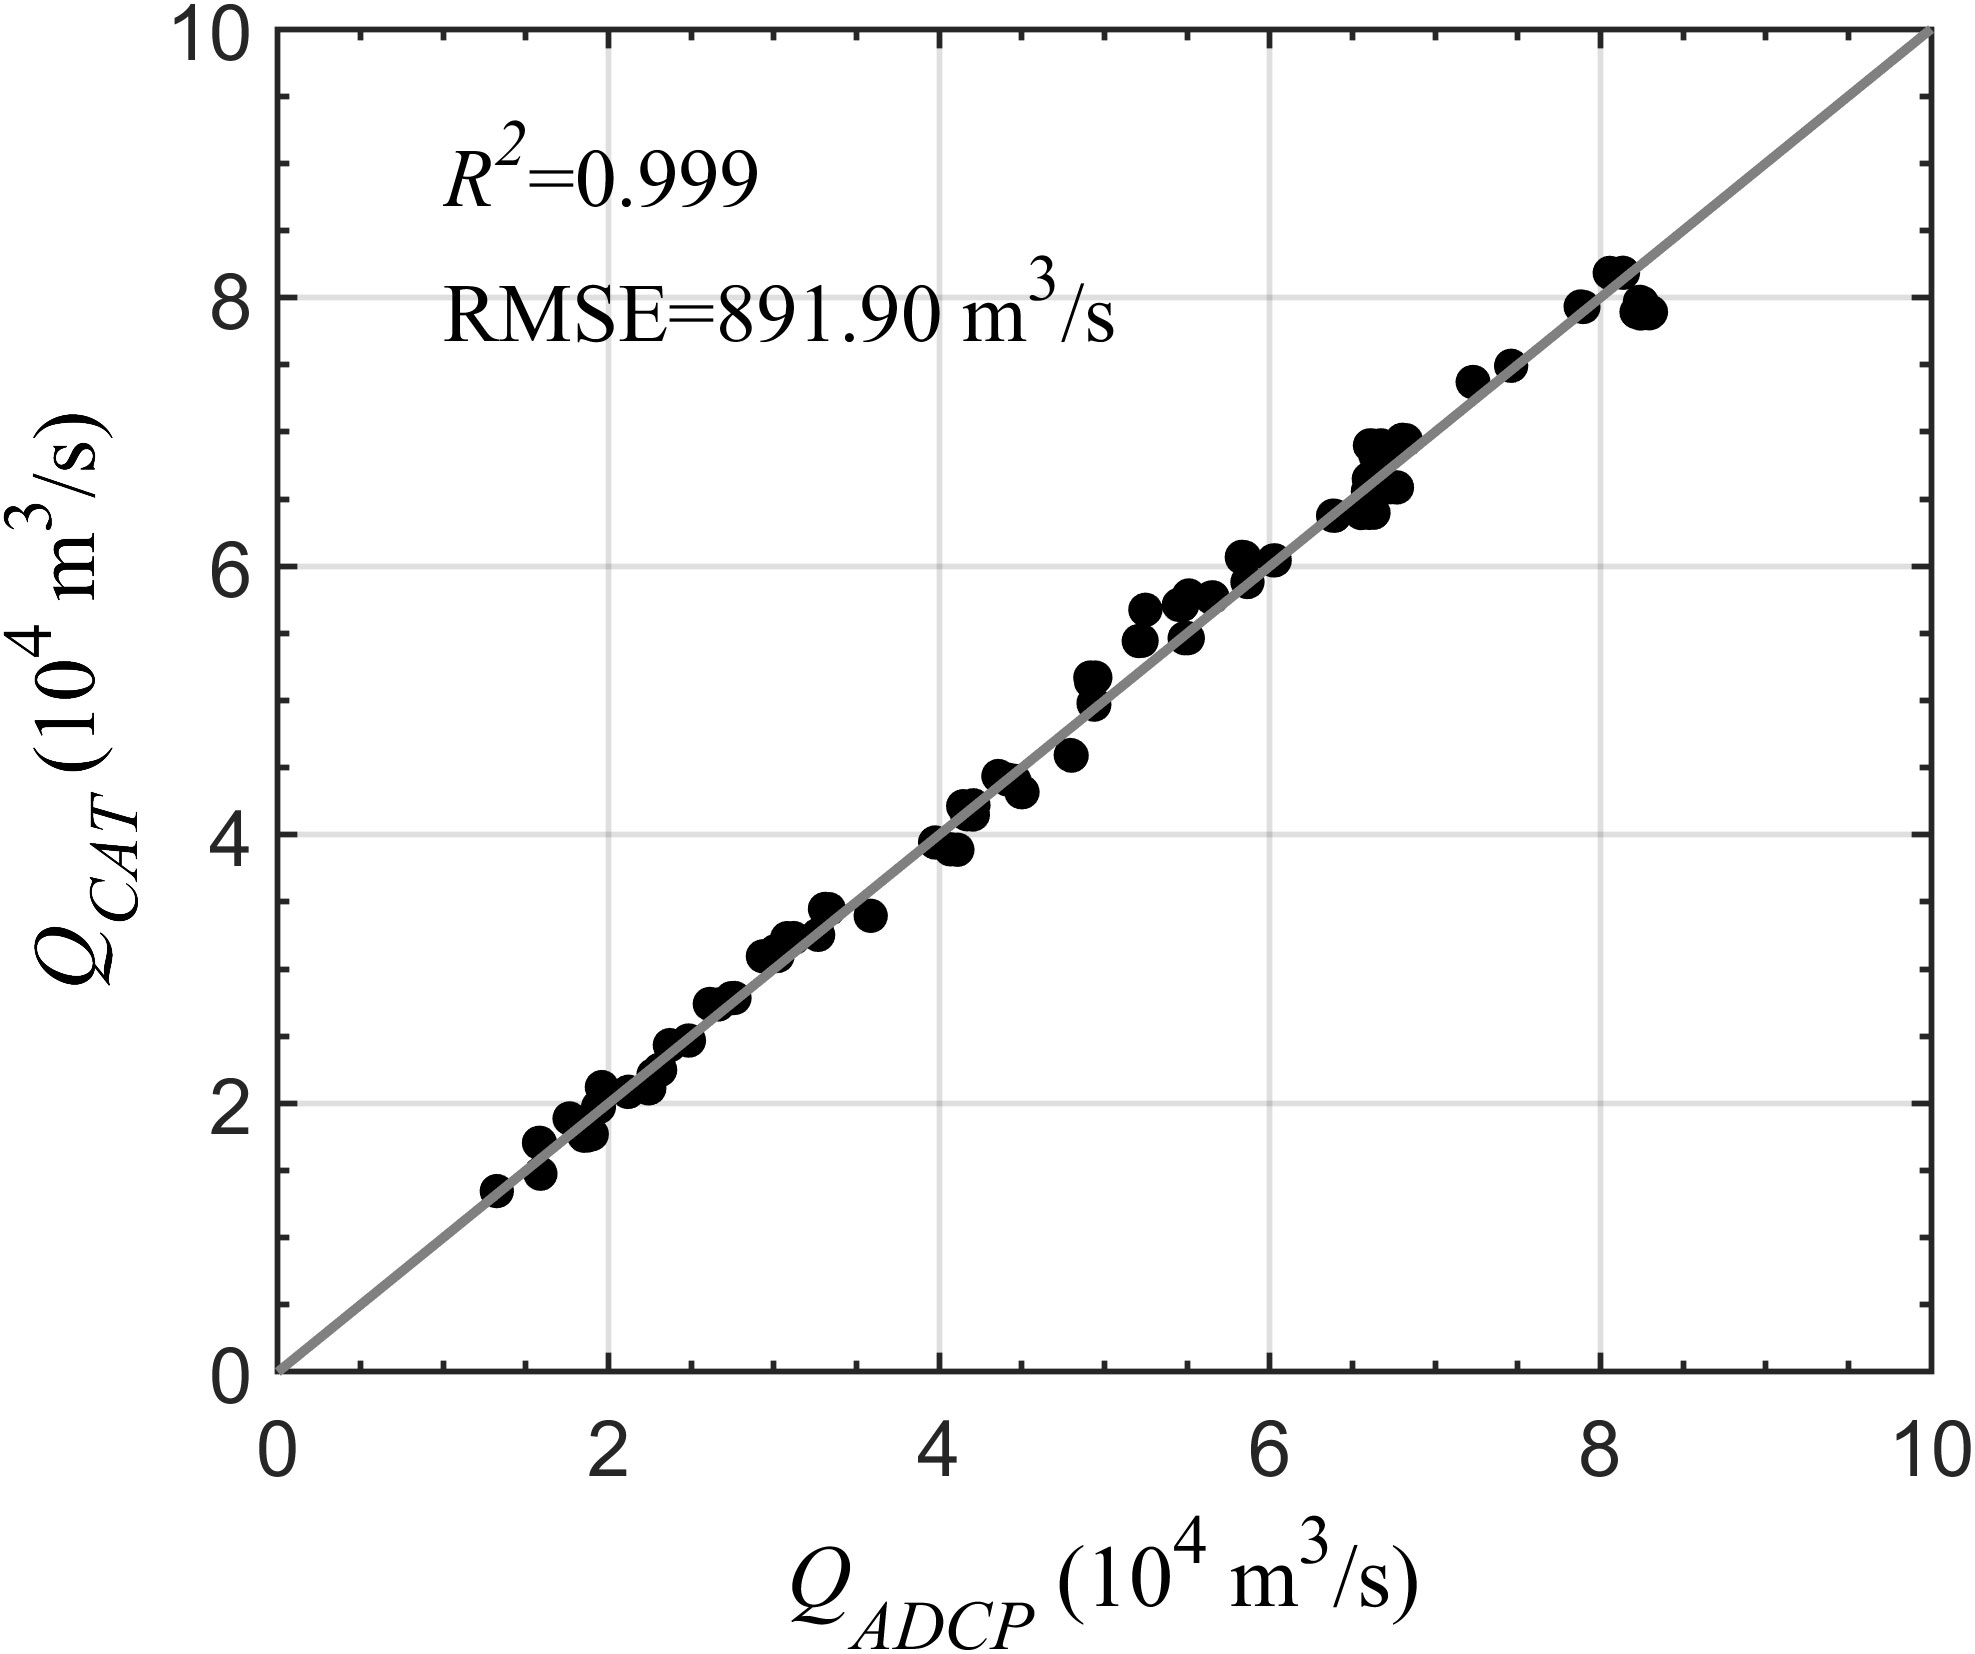
Figure 6 Comparison of discharge obtained by CAT and moving-boat ADCP.
Figure 5B shows the outflow, water storage, and water level in the TGD. TGD data were collected from the National Rain and Water Discharge website (http://xxfb.mwr.cn/index.html); however, only data with 6-h intervals during the wet season (June to September) were collected. As shown in Figure 5B, during the observation period, the TGD outflow varied from 7,900 to 49,400 m3/s. Since 2010, the water level of the Three Gorges Reservoir has been planned to control downstream floods and minimize downstream sedimentation. Generally, the release of water from the TGD is scheduled to maintain a flood-restricted level of 145 m during the flood season (Figure 5B).
Significantly, a detail example of QADCP, QCAT, and QRC presents in Appendix, during the period of water release from the TGD (July–September) and during the period of higher precipitation, the discrepancy between QRC and QADCP were obvious, whereas QCAT continued to match well with the results of QADCP (Figure 5). Specifically, during the period of the TGD outflow, the uncertainty of QRC compared to QADCP was within ± 20%, whereas the uncertainty was within ± 7% of QCAT compared to QADCP. This revealed that the dam outflow or huge rainfall events induced dramatic fluctuations in the water level at the DT station, indicating that the uncertainties and errors obtained by RC were too large to be ignored, especially under unsteady flow conditions, and demonstrated the advantages of using CAT in large river channels.
Baseflow and stormflow
Baseflow and stormflow were estimated from QRC and QCAT, respectively. Although both revealed similar fluctuations, the stormflow from the QRC was smoother, and it was difficult to capture the short- and high-frequency variations induced by rainfall events. Baseflow and stormflow obtained from QCAT at the DT station during the observation period are shown in Figure 7. The baseflow varied from 11,059 to 62,231 m3/s with a mean of 25,485 m3/s. The stormflow, which mostly resulted from precipitation, varied from 0 to 34,822 m3/s with a mean of 5,918.1 m3/s. The mean proportions of baseflow and stormflow were 81.1 and 18.8%, respectively. The ratios of baseflow and stormflow in the flood and dry seasons were 80.9 and 81.7% and 19.1 and 18.3%, respectively. These values are similar to previous studies; for example, Dai et al. (2010) investigated the proportion of baseflow at several stations along the YR and revealed that its mean proportion at the DT station was ~82% and in the flood and dry seasons, it was ~81 and ~83%, respectively.

Figure 7 Time series of baseflow and stormflow obtained from QCAT during the observation period (July 2018 to January 2021).
Discussions
Effects of the TGD on runoff at the Datong station
Grouped frequency analysis was applied to the TGD outflow, and the class interval for discharge was set to 10,000 m3/s in this study. The contribution of each month during the TGD outflow period is shown in Figure 8. At the DT station, during the TGD dam outflow period, the water discharge is in the range of 30,000 to 60,000 m3/s, accounting for 70% of total intervals (Figure 8A). The occurrence probabilities of large flood events exhibited declining trends. The proportion of extreme discharge (> 60,000 m3/s) reduced from 6.9 to 0.7% (Figure 8A). In addition, the grouped distribution of the TGD outflow and the contributions of the TGD outflow to the grouped discharge at the DT station (QDT) are also presented in Figures 8B, C. The TGD outflow occurred mainly in the range of 20,000 to 30,000 m3/s with a proportion of 43.5–77.6% over the 2.5-year period of observation (Figure 8B). For the class QDT > 30,000 m3/s, QDT increased from 30,000 to 80,000 m3/s and the proportion of TGD outflow gradually decreased from 54.2 to 43.5% in June, from 77.6 to 24.7% in July, and from 73.6 to 51.5% in August (Figures 8B, C). Taken together, the TGD organizes downstream runoff by boosting the proportion of normal streamflow and lowering the proportion of exceptional streamflow. Consequently, the management of the TGD forces the distribution of downstream runoff to become more centralized.

Figure 8 Grouped distributions of TGD outflow varied with the DT discharge (QDT) during the wet season (June–September). (A) Relative frequency (RF) of TGD outflow; (B) Grouped TGD outflow in each QDT class; (C) The proportions of TGD outflow in each QDT class.
The TGD has been in operation since 2003. Previous studies have stated that the TGD has significantly flattened river discharge hydrographs, such as by increasing the discharge of 500–2,000 m3/s in the dry season and decreasing the annual flood peak flow by up to 20,000 m3/s (Guo et al., 2015). Especially, the regulation and management of the TGD have considerably eased river flow processes in the middle–lower reaches of the YR (Cai et al., 2019). Additionally, Mei et al. (2015) reported that from low- to high-runoff situations, obvious declining trends have led to low- and normal-runoff situations from 2003. Instead, the high-runoff situation presented uniform states without noticeable gradient patterns. Consequently, the role of the TGD on downstream hydrological processes is substantially more significant in the dry season than those in the flood season (Chen et al., 2016).
Effects of rainfall on runoff at the Datong station
Seasonal areal precipitation characteristics during the observation period are shown in Figure 2. Along the YR, during June–July–August (JJA), two maximum precipitation areas occurred upstream of the TGD and near the DT, respectively; therefore, the strong flood processes at the DT station during summer can be partially clarified by areal precipitation, but additional factors might affect changes in discharge downstream of the YR (such as the TGD effect). As shown in Figure 7, compared with the baseflow, the stormflow, which mainly results from precipitation, accounted for 0 to 47.7% with a mean of 18.8%. Mei et al. (2015) argued that the hydrological processes of the YR were largely structured by the TGD and that rainfall events had little force on the discharge.
To enrich the cognition of the role of rainfall on the QDT of the YR, we followed Liang, 2014; Liang, 2015) to evaluate the cause–effect relationship between precipitation and discharge at the DT station (QDT). The information flow (IF) in the natural unit of information (nat) per unit time (nat/h) during the CAT observation period was estimated. Causality was computed as the time rate of IF from one time series to another. When only two time series, that is, X1 (QDT) and X2 (Train) are considered, a model to fulfill the IF evaluation was given by Liang (2014), and the rate of IF from Train to QDT can be written as
where Cij (i, j = 1 (i.e., Q), 2 (i.e., rain)) denotes the covariance between Train and QDT, Ci,dj represents the covariance between Xi and , and is the difference approximation of dXj/dt using the Euler forward scheme.
IFrain→Q represents the rate of IF from Train to QDT, which can be zero or nonzero. If IFrain→Q is zero, Train does not cause QDT; if the value is nonzero, it is causative. When there is a causal relationship, two cases can be discerned as stated by the sign of the IF: the positive value suggests that Train works to cause QDT more uncertain, whereas the negative value denotes that Train would stabilize QDT. Additionally, IFrain→Q can be normalized to assess the importance of the influence of Train on QDTrelative to other processes (Liang, 2015).
One-way causality analysis was used to assess the sensitivity of discharge at the DT station to the regions and changes of precipitation in the YRB. Positive IF ranging from 0 to 0.05 nat/h (Figure 9A) occurred in the upper and lower areas of the YRB, with the highest values around the DT station. The computed relative IF rates were up to ~40% near the DT station (Figure 9B). These demonstrate that during summer the flood processes at the DT station are partially caused by areal precipitation in the downstream reaches of the YR. A positive IF in the upstream can be interpreted as runoff caused by precipitation gradually entering the baseflow and eventually affecting the streamflow at the DT station. On the contrary, the non-positive IF exhibited in the middle areas of the YRB revealed the role of the TGD, which means that the runoff induced by the rainfall events in the middle areas would be controlled by the TGD, and the TGD would stabilize the downstream discharge. Mei et al. (2015) investigated and compared the characteristics of monthly areal precipitation during the pre-TGD and post-TGD periods and found that precipitation showed a minor decreasing trend since 2003 and stated that this decreasing trend was not adequately strong to support the vast changes in runoff along the YR, proving that TGD regulation significantly disturbed the hydrology of the YR.
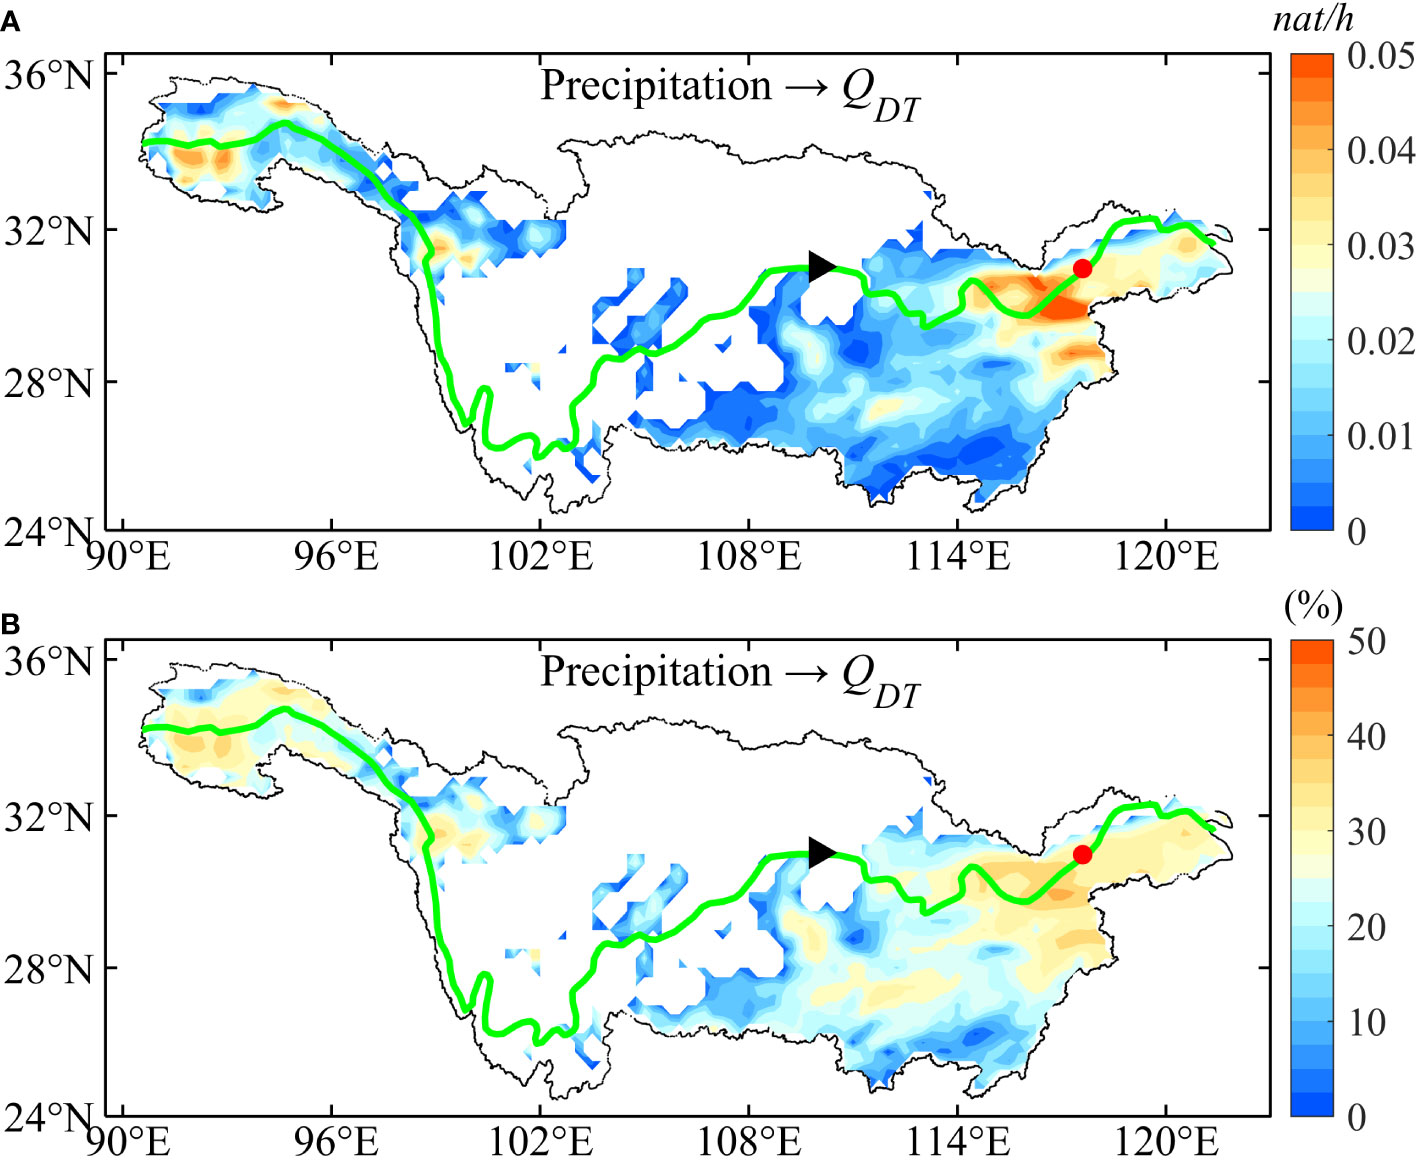
Figure 9 Distributions of results of the one-way causality analysis in the Yangtze River Basin. (A) Rate of information flow (IF) from precipitation to discharge at the DT station (QDT); (B) Relative IF from precipitation to discharge at the DT station (QDT). Since the precipitation data is of hourly interval, the hourly QDT was picked up to match the time of precipitation data. Only positive values are presented in the figure, while the non-positive values are masked by white.
In summary, we investigated the contributions of the TGD (human activities) and rainfall (natural factor) on the discharge and revealed the relationships between the river flow, rainfall, and dam outflow (Figures 8, 9). The YR is the China’s largest river and covers a vast river basin, natural factors (e.g., Typhoon, rainfall) are easy to induce flood events and enhance flood risk to human activities. Generally, variations of discharge are consistent with those of precipitation in natural hydrological conditions; nevertheless, the low and high flows are strongly altered by the TGD. Therefore, in this study, a quantitative understanding of the contributions of rainfall and the TGD are helpful for the development of effective flood control strategies.
Relationships between runoff and tide at the Datong station
The DT station is a widely recognized site for the tidal limit position; however, the geographical and temporal distributions of runoff in the YRB has changed significantly over the past decades owning to many large-scale water conservation projects along its course. Some studies suggested that the location of the recent tidal limit in the YR fluctuates from Jiujiang (~220 km upstream from the DT station) to DT. During the dry season, the upper limit of the tide is near Jiujiang, whereas during the flood season, the lowest bound of the tidal zone is near DT (Shi et al., 2018).
The continuous wavelet transform (CWT) method was used to investigate the characteristics of tidal species and the temporal evolution of tidal frequency spectra at the DT station (Sassi and Hoitink, 2013). CWT analysis can determine different tidal species, for example, the semi-diurnal (D2) tidal species, but specific tidal components (e.g., M2) cannot be resolved (Guo et al., 2015). More information on the CWT method and settings used to determine the specific tidal species are described in Guo et al. (2015). Here, the CWT method was applied to data on water depth at station S, velocity obtained by CAT (uCAT), and discharge at the DT station (QCAT) to decompose the time series data into the D2 tidal species because the semi-diurnal tide is evident along the YR.
At the DT station, the tidal signal was very weak, but the seasonal signals, which were driven by fluctuating river discharges, remained noteworthy (Figure 10). The temporal fluctuations in the D2 amplitudes are shown in Figure 10A. Evidently, D2 showed a clear seasonal fluctuation of high amplitudes in winter and low amplitudes in summer. A high river discharge improves tidal amplitudes by boosting the nonlinear effect and promoting the transfer of astronomical tidal energy to shallow-water tides, which is the primary cause of lower amplitudes during the wet season (Godin, 1985). In addition, the attenuation of tidal amplitudes is related to frequency; generally, lower-frequency tidal components damp more slowly than higher-frequency tidal components (Godin, 1985). The amplitudes of water level in the D2 bands present an evident significant seasonal signal, with values fluctuating from 0 to 0.08 m, respectively. In the flood and dry seasons, D2 contributed 0.30% and 1.16%, respectively, to the water level at the DT station (Figure 10A). The tidal velocity in the D2 band also presented a significant seasonal signal with a maximum value of 0.086 m/s, and the mean proportions of the velocity during the flood and dry seasons were 2.90% and 6.27%, respectively (Figure 10B). Both were directly driven by fluctuating river discharges.
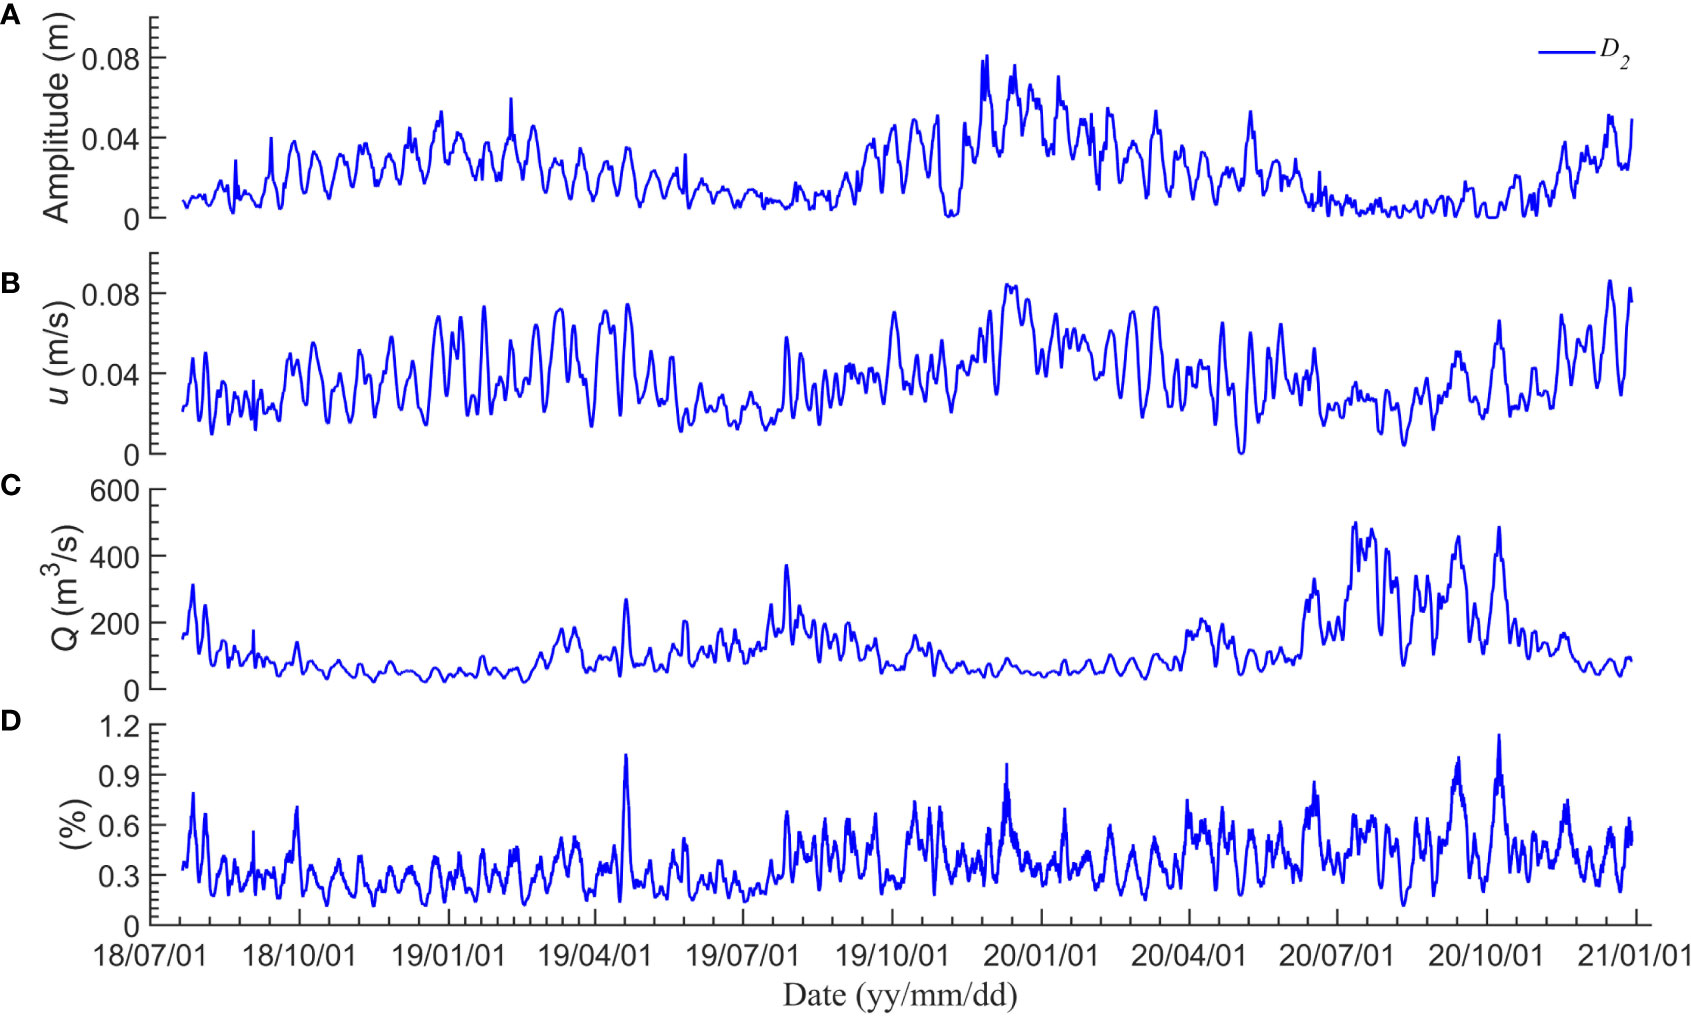
Figure 10 Time series of the results of the continuous wavelet transform (CWT) results at the Datong station. (A–C) Amplitude, velocity, and discharge in the semi-diurnal (D2) band; (D) Proportion of the semi-diurnal discharge in the total discharge.
Significant fortnightly tidal signals were detected at the DT station simultaneously (Figure 10). A similar phenomenon was exhibited by Guo et al. (2015), who stated that this clear fortnightly signal was mostly generated inside the estuary owing to tidal interactions rather than river flow or oceanic tides. As oceanic tides and river flow have limited energy at the fortnightly frequency, tidal interactions are central sources of tidal semi-monthly or monthly changes. For example, the interaction between M2 and S2 causes fortnightly (spring and neap) variations. In such a long river tidal system, this result strongly suggests the spatial evolution of tidal dynamics caused by mixed tidal and fluvial processes.
The CWT analysis of the discharge showed fluctuations in the D2 bands (Figures 10C, D) that were different from the amplitude and velocity (Figures 10A, B), which mostly resulted from the tidal damping processes. The high (low) discharges in summer (winter) lead to a stronger (weaker) tidal damping process and generate a low (high) tidal discharge in summer (winter). The discharge in D2 bands varied from 19.4 to 502.9 m3/s, respectively, accounting for 0.11–1.11% of the total discharge. The velocity resolution (ur) of CAT is as follows:
where f means the frequency and L and C are the distances between two stations and sound speed, respectively. The velocity resolution considered in this study is 0.02 m/s, the precision of the water level is 0.5 cm, assuming the distance (~3,015 m) between two stations caused by the tidal wave was negligible, the theoretical minimum discharge estimated using the velocity-area method is ~0.3 m3/s, and thus, the CWT results are within the observation resolution and are reliable.
Results of CWT demonstrate that the effects of tidal waves on river transport were insignificant at the DT station, probably because the tidal wave propagated to the DT station; however, owing to the river discharge–controlled systems, the direction and velocity of flow did not change significantly, and the changes in water level and cross-sectional area caused by the tidal wave were negligible. In fact, tides assert a barrier impact on the discharge of the YR, which can be attributed mainly to the Stokes flux. Nevertheless, in the middle–lower reaches of the YR (i.e., at the DT station), river flow significantly controls river and tidal dynamics (Guo et al., 2015).
Taken together, the discharge regulated by the TGD takes a significant influence on the tidal propagation process along the YR; that is, a decrease in discharge can cause the tidal wave to move upstream and lead to an increase in tidal amplitude, even if the TGD is situated ~1,800 km upstream from the mouth of the YR. Hence, more attention should be paid to this man-made effect on tidal processes and the river–tide interactions since it would be easily overlooked as the TGD is sited far away from the river mouth. Additionally, understanding tidal wave effects in the middle–lower reaches of the YR is of significant social value for tidal prediction and water management in channels.
Review of the present study and scope of the future studies
One objective of this study was to highlight the performance of CAT in continuously monitoring large river discharges in YR. The main drawback of traditional instruments (e.g., ADCP) is the insufficient number of velocity sample points in the cross-section for estimating cross-sectional average velocity. Unlike the traditional hydroacoustic systems, the CAT enables continuous and real-time observations of the depth- and range-averaged velocity with a transect, without disturbing shipping traffic in YR. The method of CAT in real-time could help in the increased ability to monitor the flood events and provide reference data to flood risk management.
Although some of our findings are preliminary, our results are encouraging. The CAT is capable of capturing discharge in large river basin; therefore, future studies should consider longer periods to determine the variations of floods in the YR and the role of the TGD. In addition, a preliminary result of discharge induced by tidal wave was revealed here, however, the YR has a vast area affected by tides, monitoring the tidal discharge in different sections of the YR is useful to study the river-tidal interactions in the YR.
Conclusions
Since the construction of the TGD, several studies on the hydrological processes of the YRB. We investigated and analyzed streamflow behavior in the YR considering the effects of a large dam (TGD) and other natural activities using the CAT system at the DT hydrometric station. We installed two CAT systems at the DT station to continuously monitor YR discharge from July 2018 to January 2021. The RC method for the YR leads to large uncertainties in the wet season, especially during the TGD outflow period. In contrast, the CAT method can directly measure the sectional-average velocity, allowing for the precise acquisition of instantaneous flood discharge; for example, two huge flood events, with peak discharges of 69,164 and 82,206 m3/s were demonstrated by CAT. The comparison between the discharge estimated by ADCP and CAT showed a good correlation with an RMSE of 891.9 m3/s.
Changes in discharge of the YR at the DT station induced by the TGD and rainfall are discussed in detail. Results demonstrated that the streamflow of the YR is primarily influenced by the TGD. Moreover, results of causality analysis proved that the discharge at the DT station was partially influenced by rainfall in the middle–lower areas of the YRB, with a maximum contribution of ~40% changes in runoff. As a result of the regulation by the TGD, the distribution of the downstream discharge at DT became more centralized in the wet season. Additionally, discharge controlled by the TGD can affect the tidal propagation process along the YR, and the decrease in discharge during the dry season can cause an increase in downstream tidal amplitude. Results of CWT revealed that although the tidal wave affected the water level at the DT station, the tidal wave-induced discharge was negligible, with a maximum of 1.11% change.
This study offers an acoustic method (CAT) for accurate, continuous, and real-time monitoring of the discharge of large rivers, even during massive flood events. Hence, the application of CAT over a longer time scale (e.g., decades) and monitoring tidal discharge in tidal rivers is necessary to determine various patterns of flood events and hydrological processes. Results of this study suggest a strong need for strategies to balance the role of the TGD in flood control and management of the YR.
Data availability statement
The original contributions presented in the study are included in the article/Supplementary Material. Further inquiries can be directed to the corresponding author.
Author contributions
CX and X-HZ contributed to conception and design of the study. ZNZ, CZ and ZSZ organized the observational data. CX performed the statistical analysis. ZNZ, CZ, HZ, ZSZ, JZ and LW obtain the field data. CX, X-HZ, ZNZ and CZ wrote the first draft of the article. All authors contributed to the article and approved the submitted version.
Funding
This research was funded by the National Natural Science Foundation of China (grants 41920104006, 41906024, 52071293), the Scientific Research Fund of the Second Institute of Oceanography, MNR (JZ2001), the Project of State Key Laboratory of Satellite Ocean Environment Dynamics, Second Institute of Oceanography (SOEDZZ2106 and SOEDZZ2207), and the Innovation Group Project of the Southern Marine Science and Engineering Guangdong Laboratory, Zhuhai (No. 311020004).
Acknowledgments
The authors are grateful to the National Rain and Water Discharge (http://xxfb.mwr.cn/index.html) for sharing their data. We acknowledge the students in the laboratory for their assistance in data collection. We are thankful to Editage (www.editage.com) for providing assistance with English language editing.
Conflict of interest
The authors declare that the research was conducted in the absence of any commercial or financial relationships that could be construed as a potential conflict of interest.
Publisher’s note
All claims expressed in this article are solely those of the authors and do not necessarily represent those of their affiliated organizations, or those of the publisher, the editors and the reviewers. Any product that may be evaluated in this article, or claim that may be made by its manufacturer, is not guaranteed or endorsed by the publisher.
Supplementary material
The Supplementary Material for this article can be found online at: https://www.frontiersin.org/articles/10.3389/fmars.2022.1066693/full#supplementary-material
References
Baldassarre G., Montanari A. (2009). Uncertainty in river discharge observations: a quantitative analysis. Hydrol. Earth Syst. Sci. 13, 913–921. doi: 10.5194/hess-13-913-2009
Cai H., Zhang X., Zhang M., Guo L., Liu F., Yang Q. (2019). Impacts of three gorges dam’s operation on spatial-temporal patterns of tide-river dynamics in the Yangtze river estuary, China. Ocean Sci. 15, 583–599. doi: 10.5194/os-15-583-2019
Chen J., Finlayson B. L., Wei T., Sun Q., Webber M., Li M., et al. (2016). Changes in monthly flows in the Yangtze river, China - with special reference to the three gorges dam. J. Hydrol. 536, 293–301. doi: 10.1016/j.jhydrol.2016.03.008
Dai Z. (2021). Changjiang riverine and estuarine hydro-morphodynamic processes (Gateway East: Singapore Springer). doi: 10.1007/978-981-16-3771-1
Dai Z. J., Chu A., Du J. Z., Stive M., Hong Y. (2010). Assessment of extreme drought and human interference on baseflow of the Yangtze river. Hydrol. Process. 24, 749–757. doi: 10.1002/hyp.7505
Gao Y., Chen L., Zhang W., Li X., Xu Q. (2021). Spatiotemporal variations in characteristic discharge in the Yangtze river downstream of the three gorges dam. Sci. Total Environ. 785, 147343. doi: 10.1016/j.scitotenv.2021.147343
Godin G. (1985). Modification of river tides by the discharge. J. Waterw. Port, Coastal, Ocean Eng. 111, 257–274. doi: 10.1061/(ASCE)0733-950X(1985)111:2(257)
Gordon R. L. (1989). Acoustic measurement of river discharge. J. Hydraul. Eng. 115, 925–936. doi: 10.1061/(ASCE)0733-9429(1989)115:7(925
Gore J. A., Banning J. (2017). “Discharge measurements and streamflow analysis,” in Methods in stream ecology, Volume 1. (New York, United States: Academic Press), 49–70.
Guo H., Hu Q., Zhang Q., Feng S. (2012). Effects of the three gorges dam on Yangtze river flow and river interaction with poyang lake, China: 2003-2008. J. Hydrol. 416–417, 19–27. doi: 10.1016/j.jhydrol.2011.11.027
Guo L., van der Wegen M., Jay D. A., Matte P., Wang Z. B., Roelvink D., et al. (2015). River-tide dynamics: Exploration of nonstationary and nonlinear tidal behavior in the Yangtze river estuary. J. Geophys. Res. Ocean. 120, 3499–3521. doi: 10.1002/2014JC010491
Hoitink A. J. F., Buschman F. A., Vermeulen B. (2009). Continuous measurements of discharge from a horizontal acoustic Doppler current profiler in a tidal river. Water Resour. Res. 45, 1–13. doi: 10.1029/2009WR007791
Jia H., Chen F., Pan D., Du E., Wang L., Wang N., et al. (2022). Flood risk management in the Yangtze river basin —comparison of 1998 and 2020 events. Int. J. Disaster Risk Reduct. 68, 102724. doi: 10.1016/j.ijdrr.2021.102724
Kaneko A., Zhu X.-H., Lin J. (2020). Coastal acoustic tomography (Amsterdam, Netherlands: Elsevier). doi: 10.1016/B978-0-12-818507-0.00003-2
Kawanisi K., Al Sawaf M. B., Danial M. M. (2018). Automated real-time streamflow acquisition in a mountainous river using acoustic tomography. J. Hydrol. Eng. 23, 04017059. doi: 10.1061/(asce)he.1943-5584.0001604
Kawanisi K., Bahrainimotlagh M., Al Sawaf M. B., Razaz M. (2016). High-frequency streamflow acquisition and bed level/flow angle estimates in a mountainous river using shallow-water acoustic tomography. Hydrol. Process. 30, 2247–2254. doi: 10.1002/hyp.10796
Kawanisi K., Razaz M., Yano J., Ishikawa K. (2013). Continuous monitoring of a dam flush in a shallow river using two crossing ultrasonic transmission lines. Meas. Sci. Technol. 24, 1–10. doi: 10.1088/0957-0233/24/5/055303
Kawanisi K., Zhu X. H., Fan X., Nistor I. (2017). Monitoring tidal bores using acoustic tomography system. J. Coast. Res. 33, 96–104. doi: 10.2112/JCOASTRES-D-15-00172.1
Lai X., Jiang J., Yang G., Lu X. X. (2014). Should the three gorges dam be blamed for the extremely low water levels in the middle-lower Yangtze river? Hydrol. Process. 28, 150–160. doi: 10.1002/hyp.10077
Liang X. S. (2014). Unraveling the cause-effect relation between time series. Phys. Rev. E - Stat. Nonlinear Soft Matter Phys. 90, 1–11. doi: 10.1103/PhysRevE.90.052150
Liang X. S. (2015). Normalizing the causality between time series. Phys. Rev. E - Stat. Nonlinear Soft Matter Phys. 92, 1–6. doi: 10.1103/PhysRevE.92.022126
Luo P., He B., Takara K., Xiong Y. E., Nover D., Duan W., et al. (2015). Historical assessment of Chinese and Japanese flood management policies and implications for managing future floods. Environ. Sci. Policy 48, 265–277. doi: 10.1016/j.envsci.2014.12.015
Lyu Y., Zheng S., Tan G., Shu C. (2018). Effects of three gorges dam operation on spatial distribution and evolution of channel thalweg in the yichang-chenglingji reach of the middle Yangtze river, China. J. Hydrol. 565, 429–442. doi: 10.1016/j.jhydrol.2018.08.042
Mei X., Dai Z., Darby S. E., Zhang M., Cai H., Wang J., et al. (2021). Landward shifts of the maximum accretion zone in the tidal reach of the changjiang estuary following construction of the three gorges dam. J. Hydrol. 592, 125789. doi: 10.1016/j.jhydrol.2020.125789
Mei X., Dai Z., Gelder P. H. A. J. M., Gao J. (2015). Linking three gorges dam and downstream hydrological regimes along the Yangtze river, China. Earth Sp. Sci. 2, 94–106. doi: 10.1002/2014EA000052
Mei X., Zhang M., Dai Z., Wei W., Li W. (2019). Large Addition of freshwater to the tidal reaches of the Yangtze (Changjiang) river. Estuaries Coasts 42, 629–640. doi: 10.1007/s12237-019-00518-0
Ruhl C. A., Derose J. B. (2004). Investigation of hydroacoustic flow-monitoring alternatives at the Sacramento river at Freeport, California: results of the 2002-2004 pilot study. US Geol. Surv. 5172, 1–18. doi: 10.3133/sir20045172
Sassi M. G., Hoitink A. J. F. (2013). River flow controls on tides and tide-mean water level profiles in a tidal freshwater river. J. Geophys. Res. Ocean. 118, 4139–4151. doi: 10.1002/jgrc.20297
Shi S., Cheng H., Xuan X., Hu F., Yuan X., Jiang Y., et al. (2018). Fluctuations in the tidal limit of the Yangtze river estuary in the last decade. Sci. China Earth Sci. 61, 1136–1147. doi: 10.1007/s11430-017-9200-4
Sun Z., Huang Q., Opp C., Hennig T., Marold U. (2012). Impacts and implications of major changes caused by the three gorges dam in the middle reaches of the Yangtze river, China. Water Resour. Manage. 26, 3367–3378. doi: 10.1007/s11269-012-0076-3
Tang W., Carey S. K. (2017). HydRun: A MATLAB toolbox for rainfall–runoff analysis. Hydrol. Process. 31, 2670–2682. doi: 10.1002/hyp.11185
Wang S., Cao Z., Luo P., Zhu W. (2022). Spatiotemporal variations and climatological trends in precipitation indices in shaanxi province, China. Atmosphere (Basel). 13, 1–22. doi: 10.3390/atmos13050744
Wang H., Sun F., Liu W. (2020). Characteristics of streamflow in the main stream of changjiang river and the impact of the three gorges dam. Catena 189, 104498. doi: 10.1016/j.catena.2020.104498
Xia J., Chen J. (2021). A new era of flood control strategies from the perspective of managing the 2020 Yangtze river flood. Sci. China Earth Sci. 64, 1–9. doi: 10.1007/s11430-020-9699-8
Yu X., Zhang W., Hoitink A. J. F. (2020). Impact of river discharge seasonality change on tidal duration asymmetry in the Yangtze river estuary. Sci. Rep. 10, 1–17. doi: 10.1038/s41598-020-62432-x
Zhang Y., Fang G., Tang Z., Wen X., Zhang H., Ding Z., et al. (2021). Changes in flood regime of the upper Yangtze river. Front. Earth Sci. 9. doi: 10.3389/feart.2021.650882
Zhu X. H., Zhang C., Wu Q., Kaneko A., Fan X., Li B. (2012). Measuring discharge in a river with tidal bores by use of the coastal acoustic tomography system. Estuar. Coast. Shelf Sci. 104–105, 54–65. doi: 10.1016/j.ecss.2012.03.022
Keywords: coastal acoustic tomography, discharge of Yangtze River, Three Gorges Dam, precipitation, tidal wave
Citation: Xiao C, Zhu X-H, Zhu Z, Zhang C, Zheng H, Zhang Z, Zhong J and Wei L (2022) Effect of dam discharges and tides to transport of Yangtze River using coastal acoustic tomography systems. Front. Mar. Sci. 9:1066693. doi: 10.3389/fmars.2022.1066693
Received: 11 October 2022; Accepted: 21 November 2022;
Published: 01 December 2022.
Edited by:
Xuebo Zhang, Northwest Normal University, ChinaReviewed by:
Haocai Huang, Zhejiang University, ChinaEnjin Zhao, China University of Geosciences Wuhan, China
Copyright © 2022 Xiao, Zhu, Zhu, Zhang, Zheng, Zhang, Zhong and Wei. This is an open-access article distributed under the terms of the Creative Commons Attribution License (CC BY). The use, distribution or reproduction in other forums is permitted, provided the original author(s) and the copyright owner(s) are credited and that the original publication in this journal is cited, in accordance with accepted academic practice. No use, distribution or reproduction is permitted which does not comply with these terms.
*Correspondence: Xiao-Hua Zhu, eGh6aHVAc2lvLm9yZy5jbg==