- 1State Key Laboratory of Satellite Ocean Environment Dynamics, Second Institute of Oceanography, Ministry of Natural Resources, Hangzhou, China
- 2Southern Marine Science and Engineering Guangdong Laboratory (Zhuhai), Zhuhai, China
- 3School of Oceanography, Shanghai Jiao Tong University, Shanghai, China
- 4State Key Laboratory of Tropical Oceanography, South China Sea Institute of Oceanology, Chinese Academy of Sciences, Guangzhou, China
- 5Ocean College, Zhe Jiang University, Zhoushan, China
Recent mooring observations on the continental slope on the east side of the Dongsha Island in the northeastern South China Sea (SCS) showed that an along-slope bottom current can be generated when internal tides obliquely incident to the slope are dissipated near the seafloor. In this study, new mooring data collected on the south side of the Dongsha Island are used to explore the universality of internal wave driven the bottom currents and test the ability of the previous theory in estimating the along-slope current. The data show strong near-bottom energy dissipation due to the critical reflection of diurnal internal tides on the continental slope, with a time-mean depth-integrated dissipation rate of ~4.8×10⁻³ W/m2. Because of the obliquely incident of diurnal internal tides to the slope, near-bottom dissipation of internal tides generates a southwestward along-slope current, with the maximum velocity exceeding 6 cm/s. By comparing the observations, the previous theory for internal wave induced mean flows developed by Thorpe (1999) shows a good ability to estimate the along-slope bottom current velocity. Based on the theory, as well as modelled energy dissipation on the entire continental slope in the northeastern SCS, a map is obtained to quantitatively describe the along-slope bottom flow caused by internal tide breaking on the slope.
1. Introduction
Internal tides are internal gravity waves with tidal or quasi-tidal frequency, and mixing driven by these waves play an important role in large-scale ocean circulation, material transport and global climate change (Munk and Wunsch, 1998; Ferrari and Wunsch, 2009). It is well known that internal tides are primarily generated by astronomical tides interacting with rough topography such as seamounts, ridges, and continental slopes (Wunsch, 1975; Baines, 1982; Merrifield et al., 2001; Legg, 2004; Baines, 2007; Xie et al., 2015). Previous studies have documented that when barotropic tides interact with topography, a part of their energy is converted into high-mode internal tides that dissipate locally, but most of them propagate out of their generation region for a long distance in the form of low-mode internal tides (Klymak and Gregg, 2004; Klymak et al., 2006; Alford et al., 2015). When these low-mode internal tides impinge on topography, they may scatter into high-mode internal waves, resulting in strong energy dissipation and mixing (Klymak et al., 2008; Peacock et al., 2009; Klymak et al., 2011; Wang et al., 2019; Xie and Chen, 2021). On the other hand, if internal tides approach a slope at an oblique angle, their dissipation may cause the generation of the along-slope bottom currents (Thorpe, 1999; Zikanov and Slinn, 2001; Xie et al., 2018).
The pioneer work for wave-induced mean currents in the along-isobath direction focused on surface gravity waves; that is, when the surface waves obliquely approach a coastal beach, a mean current tends to be set up in parallel to the shoreline in the surf zone (Putnam et al., 1949; Galvin, 1967). Using the concept of radiation stress to describe the fluxes of momentum associated with the incoming waves, Bowen (1969) developed a theoretical framework that was successfully used to estimate the along-slope current via comparing laboratory data. Longuet-Higgins (1970a); Longuet-Higgins (1970b) also conducted a similar theory model to estimate the mean currents generated by surface waves breaking. Their estimated results were consistent with the field observations and laboratory experiments. By performing laboratory experiments in a rectangular tank, Dunkerton et al. (1998) observed, for the first time, generation of the along-slope current by internal waves travelling obliquely to a slope. Subsequently, Thorpe (1999) extended the radiation stress theory to internal wave field and derived a set of theoretical formulas which may be used to estimate the along-slope currents generated by waves breaking at a sloping bottom boundary. Since internal waves may be significantly dissipated at critical topography where the propagation direction of internal waves is parallel to the topographic slope (Moum et al., 2002; Nash et al., 2004; Nash et al., 2007; Klymak et al., 2011), Zikanov and Slinn (2001) conducted idealistic high-resolution numerical simulations with internal waves obliquely incident to a critical slope. They found that strong near-bottom dissipation of internal waves due to the critical reflection on the slope can produce a continuously widening bottom flow in the along-slope direction.
In the real ocean, the critical reflection of internal tides on continental slopes is quite common (Moum et al., 2002; Nash et al., 2004; Nash et al., 2007; Klymak et al., 2011; Xie et al., 2018). A typical example is the continental slope in the northern South China Sea (SCS). Recent field observations at a mooring site with a water depth of ~850 m on the continental slope east of the Dongsha Island in the northeastern SCS, where the slope is near-critical with respect to diurnal internal tides, showed that along-slope current is generated during diurnal spring tides (Xie et al., 2018). It is hypothesized that when low-mode diurnal internal tides generated from the Luzon Strait propagate westward to the continental slope at an oblique angle, they are largely dissipated near the seafloor due to the critical reflection, generating a strong southwestward along-slope bottom current. Since the oblique incidence of internal tides is common in the whole northeastern slope of the SCS, these authors also estimated a cyclonic circulation along the slope. In this study, new data collected at a mooring site on the continental slope south of the Dongsha Island is used to further investigate the generation of the along-slope bottom currents due to internal tide dissipation and explore the possibility of the cyclonic circulation.
A detailed description of the moored data, topographical condition and data analysis methods are given in section 2. The theoretical background of the along-slope bottom current caused by wave breaking is introduced in section 3. Observations and theoretical estimation are presented in section 4. Section 5 discusses a diagram for the generation of along-slope bottom currents caused by internal tide breaking on the northeastern slope of the SCS. A summary is shown in section 6.
2. Data and methods
2.1. Data
The mooring data were collected at site M1 (~1900 m water depth) on the continental slope south of the Dongsha Island in the northeastern SCS (Figure 1A). The mooring was equipped with a McLane Moored Profiler (MMP), consisting of a CTD (SBE 52-MP CTD, Sea-Bird Scientific, USA) and a current meter (FSI 3D-MP ACM) which were used to measure temperature, conductivity, and horizontal velocity at a sampling rate of 1 Hz between depths of 385 and 1840 m (Figure 1B). The MMP completed a single upward or downward profile every 4 hours. Its observation period was from July 15, 2018, to October 20, 2018. However, since typhoon Mangkhut had a great influence on the instruments after mid-September, data from September 5 to October 20 were not used in this study. In addition, an upward-looking 75-kHz RDI Acoustic Doppler Current Profile (ADCP) was deployed at a depth of 270 m. The ADCP recorded data every 30 min with 8-m vertical depth bins from July 18, 2018, to September 15, 2019. The horizontal velocity is decomposed into along-slope (x) and cross-slope (y) components ([u, v]). The positive x and y directions are defined as 42° and 312° at M1, measured clockwise from the true north direction (Figure 1A).
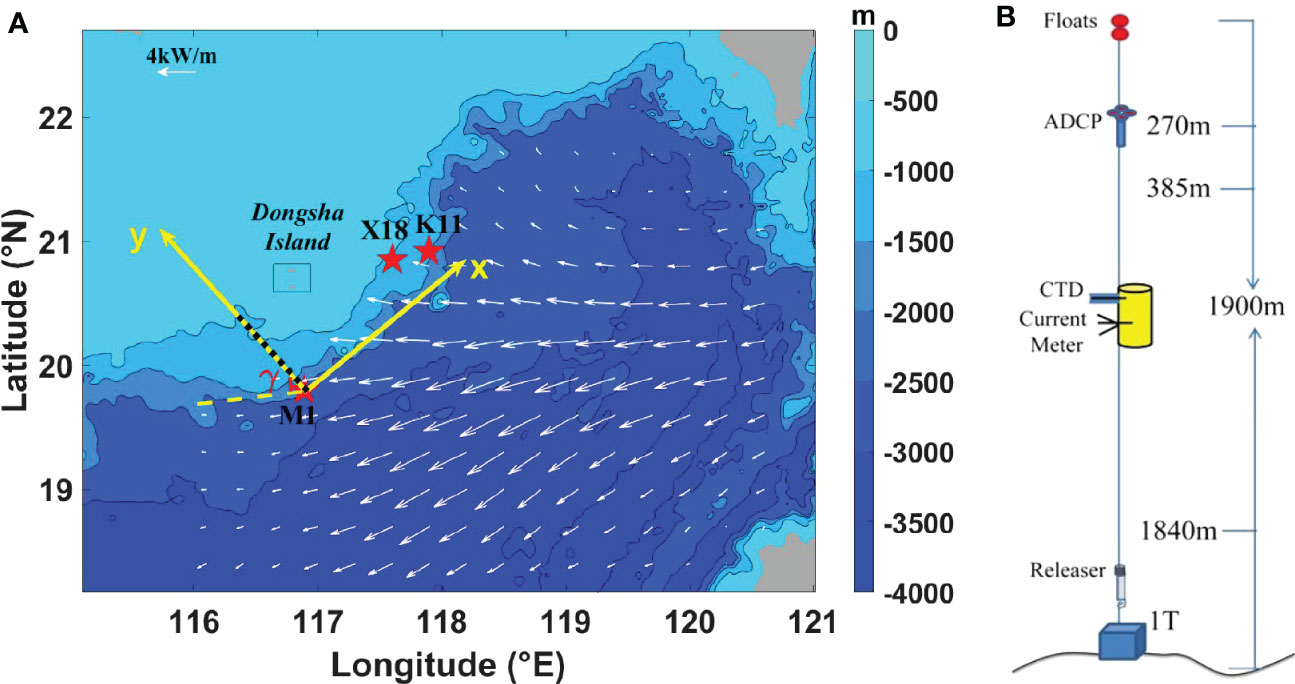
Figure 1 (A) The map showing bathymetry and mooring sites (stars) in the northeastern SCS. The axis x and y represent the along-slope and cross-slope directions at M1. The yellow dashed line shows the incident direction of diurnal internal tides near the M1 site, producing an incline angle γ with respect to the y-axis. The black dotted line indicates the cross-slope section crossing M1, shown in Figure 2B. The white arrows are the energy fluxes of K1 diurnal internal tides from satellite altimeter observations (Zhao, 2014). The X18 and K11 are mooring sites in Xie et al. (2018) and Klymak et al. (2011), respectively. (B) Schematic diagram of the M1 mooring.
In this study, the bathymetry is obtained from the General Bathymetric Chart of the Oceans’ gridded bathymetric data with a 30-arc sec resolution (http://www.gebco.net/). We also use the climatological temperature and salinity of the 2018 World Ocean Atlas (http://www.nodc.noaa.gov/OC5/WOA18) to obtain the full-depth buoyancy frequency Nw (Figure 2A). This buoyancy frequency profile Nwshows good consistency with Nmcomputed from MMP data at 385 m and 1840 m. Based on the full-depth Nw, the ray path of internal waves with frequency ω can be computed by
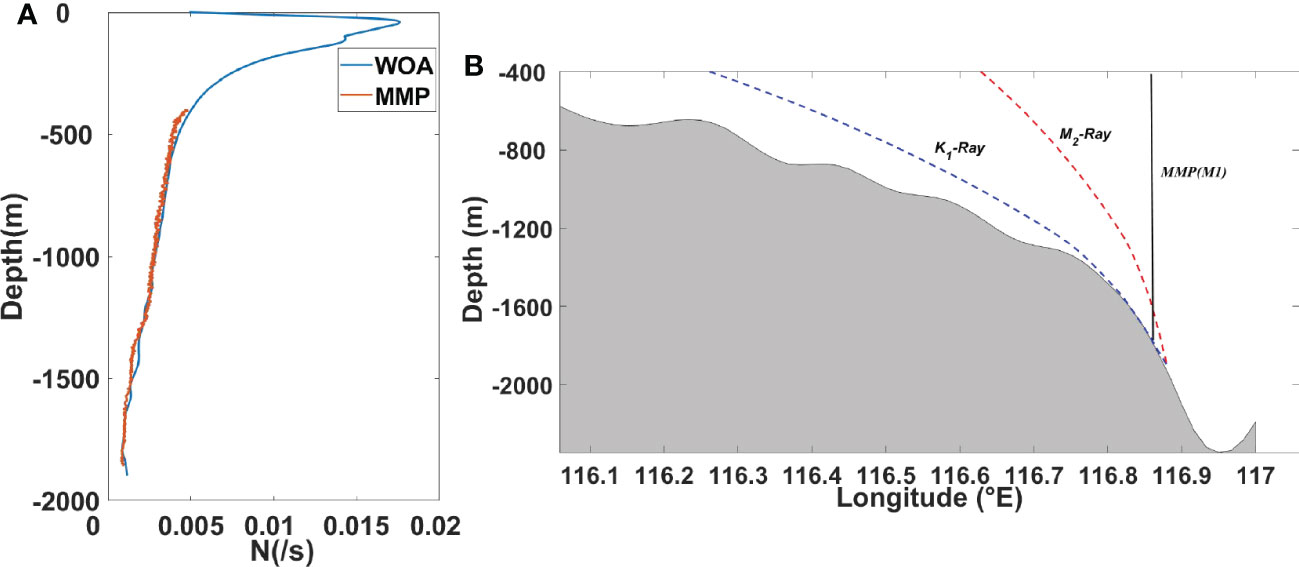
Figure 2 (A) Profiles of Nw (blue) and Nm(red) are computed from climatological data near M1 and from the mooring data, respectively. (B) A cross-slope section crossing M1. The blue and red dotted line are the ray paths of K1and M2, respectively. The black thick line is the mooring position.
where β is the slope of the internal wave group velocity with respect to the horizontal direction and f is the local inertial frequency. Near M1, the topographic slope is near-critical and subcritical with respect to diurnal and semidiurnal internal tides, respectively (Figure 2B).
2.2. Bandpass filtering
We focus on diurnal internal tides and low-frequency flow. The diurnal component is extracted by a second-order Butterworth band-pass filter, with the cutoff frequency of [0.85, 1.15] cpd (cycles per day), while the low-frequency flow is extracted using the low-pass filter with a cutoff period of 3 days.
2.3. Decomposition of modes
The baroclonic velocity signals (that is, the raw velocity minus the barotropic velocity [uT(t), vT(t)] defined as the depth-averaged velocity) are projected into vertical modes. The baroclinic signals can be represented by a superposition of discrete vertical modes that depend on N2(z).
where Φn(z) and Πn(z) are the vertical structure of modes for vertical displacement and horizontal velocity, respectively, cn is the eigenspeed and n is the mode number (Gill, 1982). The least square mode fitting method is used to calculate the time-varying velocity of the first three baroclinic modes [u′n(t), v′n(t)] from the observed velocity profiles (Alford, 2003; Nash et al., 2005). The baroclinic velocities u′(z, t) and v′(z,t) are expressed as
High mode velocities (n≥4) are obtained by the raw baroclinic velocities minus the sum of the first three mode velocities.
2.4. Dissipation rate
Overturning from Thorpe-sorted profiles (Thorpe, 1977) is used to calculate the turbulent dissipation rate ϵ at M1. Klymak et al. (2011) suggested that stratification in the SCS largely depends on temperature, and there are no salinity-compensated intrusions. Therefore, to eliminate data errors from the salinity sensor, potential temperature profiles are directly used to identify overturning. In the original profile, each potential temperature is associated with a depth Do. After sorted vertically, the sorted temperature is associated with another depth Dr. LT is the Thorpe scale and is calculated from the root-mean-square of Ld,
where Ni is Nmunder the sorting and C is a constant of proportionality. Following Dillon (1982), C is set to be 0.8.
3. Theoretical background
When internal tides impact on a slope at an oblique angle γ (with respect to the positive y; Figure 1A), a net radiation stress Sx in the along-slope direction may be generated due to the difference between the radiation stresses of the incident and reflected waves (Thorpe, 1999):
where SIx and SRx are the along-slope radiation stresses caused by incident and reflected internal tides, respectively. Based on previous studies (Longuet-Higgins, 1970a; Longuet-Higgins, 1970b), where SIx - SRx = (FIy - FRy)/Cpx, Sx becomes
where FIy and FRy are the cross-slope energy fluxes of the incident and reflected internal tides, respectively, Cp is the phase velocity of incident waves, and Cpx is its along-slope component. When internal tides reflect from the slope, they may be dissipated so that there is a difference between FIy and FRy, which can be computed as
where ρ0 is sea water density, ϵ is the turbulent dissipation rate and h is the thickness of internal tide breaking layer. Then, the net radiation stress becomes
Assuming a balance between the radiation stress and the bottom friction stress,
where CD is the bottom drag coefficient and |Vit| is the velocity magnitude of internal tides and U is the along-slope bottom current velocity. Combining Equations (5-10), we can get
4. Results
4.1. Overview of internal tides
Strong internal tidal motions are clearly visible at M1 (Figure 3A). The near-bottom isotherms show large vertical excursions with diurnal period, whose maximum displacement exceeds 100 m (Figure 3A). In the band-pass-filtered diurnal velocity field, the near-bottom intensification of diurnal internal tides are also observed, with the maximum velocity exceeding 0.1 m/s. These bottom-enhanced diurnal internal tides show a clear ~14-day spring-neap cycle, whose phase lags that of the local barotropic tides for ~3 days (Figure 3B), suggesting that internal tides do not result from the local barotropic forcing. Instead, the 3-day time difference is approximately equal to the propagation time of the mode-1 diurnal internal tides from the Luzon Strait to M1 (Figures 3A, B), suggesting their generation source of the Luzon Strait, as previously reported in Zhao (2014); Zhao (2020). However, the bottom-enhanced diurnal internal tides observed at the mooring site are mainly composed of higher modes (n≥4; Figure 4). This indicates that low-mode internal tides are scattered into higher modes when they travel westward from the Luzon Strait to the near-critical continental slope (Klymak et al., 2011; Xie et al., 2018).
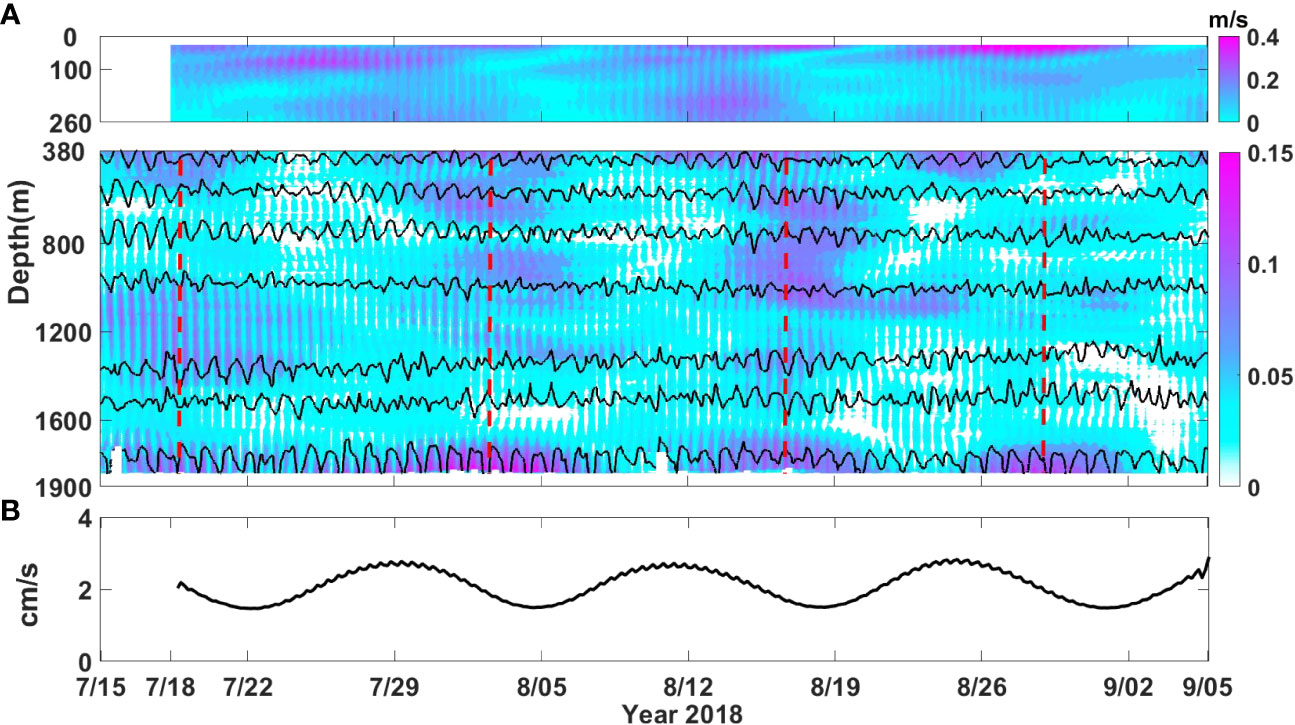
Figure 3 (A) Time-depth maps of diurnal current variances (u2+v2)1/2 (colors) at M1. Black contours are isotherms of 2.4, 2.7, 3.0, 4.5, 6.0, 7.5 and 9.0°C. (B) The diurnal (K1 + O1) barotropic tides current amplitude.
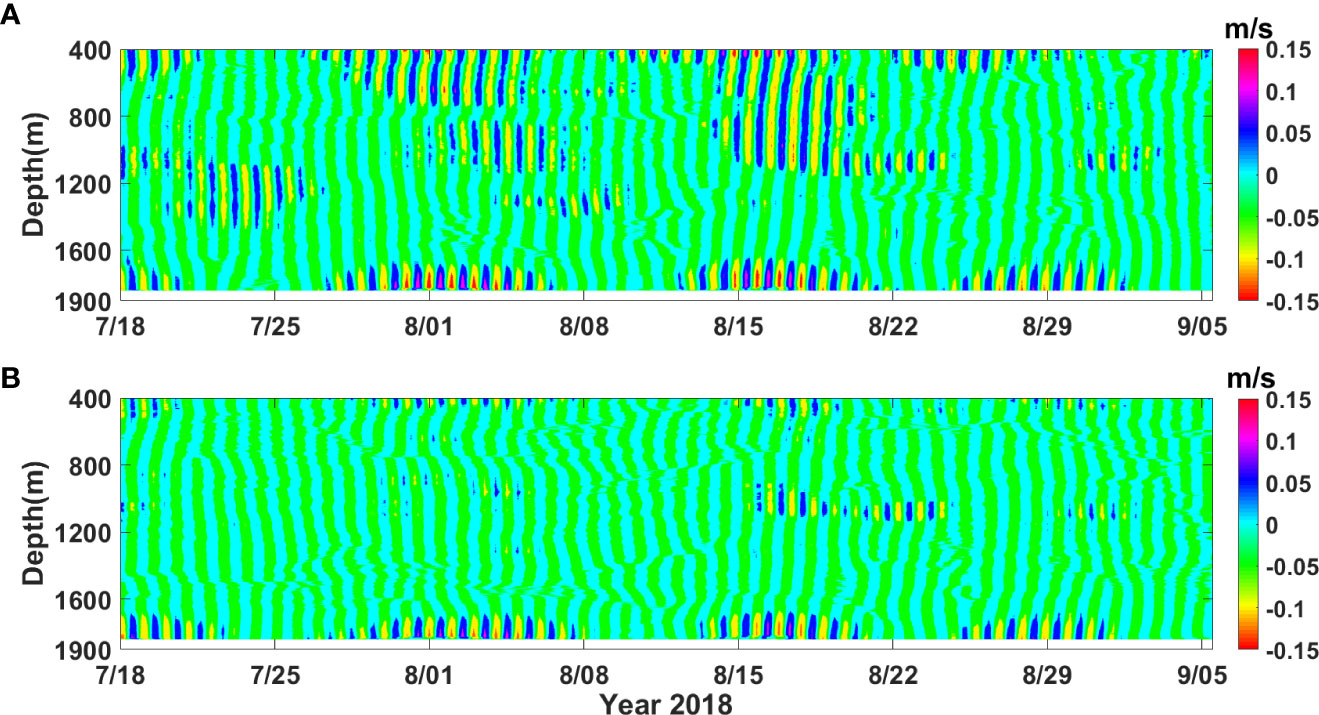
Figure 4 (A) Time-depth map of band-pass filtered diurnal velocities (along-slope component). (B) High-mode (n ≥ 4) diurnal velocities.
To identify the propagating direction of diurnal internal tides, the modal decomposition of the velocity field is performed based on equation (2). The mode-1 and mode-2 are dominant, occupying more than 55% of the total energy (Figures 5A, B). The mode-1 diurnal internal tide shows an elongated current ellipse, while the mode-2 wave is near-circularly polarized (Figure 5C). Since mode-1 is larger than mode-2, the major axis of its current ellipse is regarded as the along-beam direction of internal tides (Alford and Zhao, 2007). Assuming that diurnal internal tides westward from the Luzon Strait to the slope, their incident angles with respect to positive y direction during four diurnal springs are γ1 =23°, γ2 =40°, γ3 =51°and γ4=43°, respectively (Figure 5C). This is consistent with the satellite altimeter observations near M1 for mode-1 internal tides (γ = 46°; Zhao et al., 2020), except at the first spring during which the modal decomposition may have large errors due to the absence of the upper ADCP data.
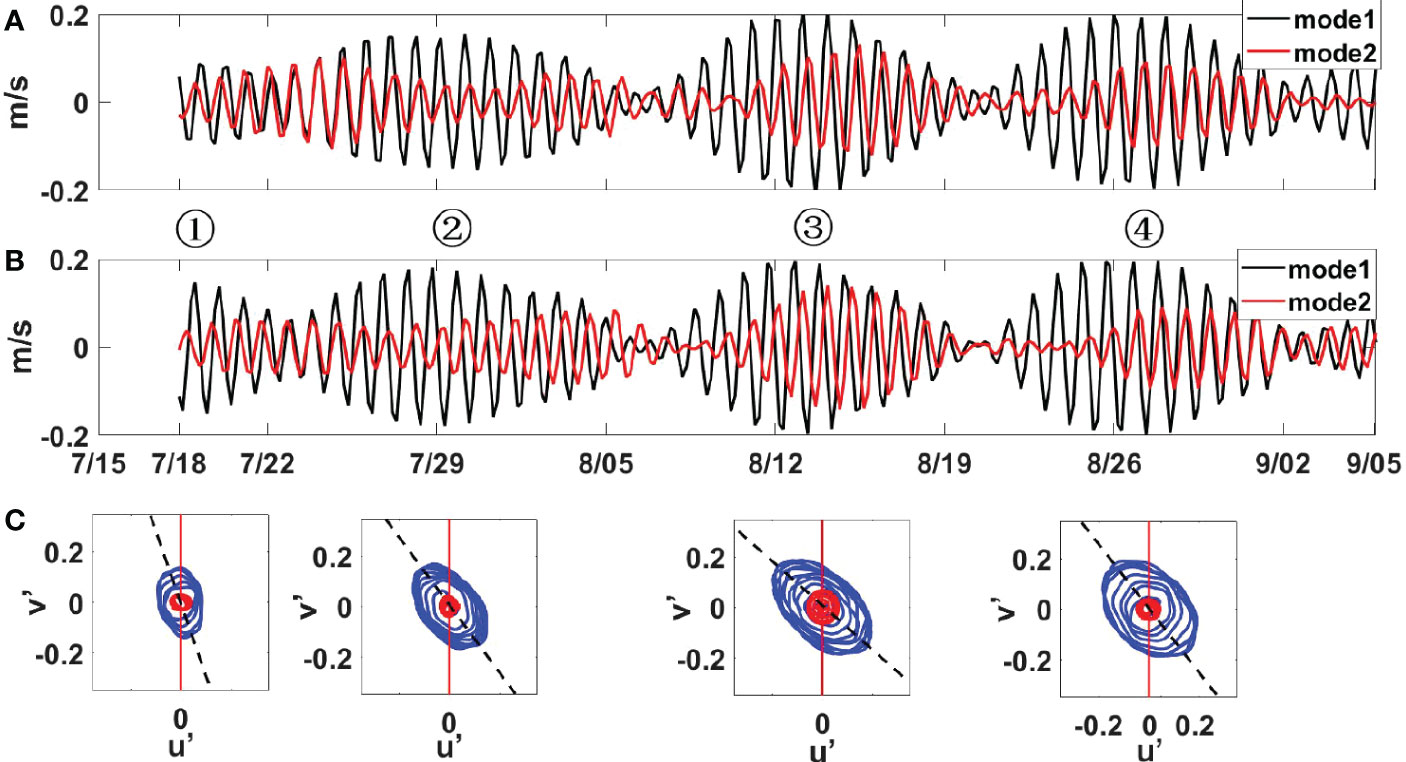
Figure 5 (A) Time series of mode-1(black) and mode-2 (red) diurnal along-slope velocities (u′). (B) Time series of mode-1(black) and mode-2 (red) diurnal cross-slope velocities (v′). (C) The diurnal u′ v′ hodographs of mode-1 (blue) and mode-2 (red) components at each spring period. The red lines represent the cross-slope direction. Black dashed lines are the along-beam direction of mode-1 internal tides.
4.2. Dissipation of internal tides on the continental slope
Below 1600 m, strong dissipation is observed due to overturning and breaking of high-mode internal tides, with the maximum dissipation rate exceeding 3.9×10⁻⁷ W/kg (Figures 6A, B). Enhanced dissipation rate is often phase-locked to diurnal internal tides. The depth-integrated dissipation rate D near the bottom layer largely depends on diurnal velocity amplitude (Figure 7A), and elevated D also shows a spring-neap cycle whose phase is the same as that of diurnal tides (Figures 6A, B). Clearly, the near-bottom enhancement of diurnal internal tides and strong turbulent dissipation can be attributed to their critical reflection on the continental slope (Figure 2B), as shown in the previous studies (Klymak et al., 2011; Xie et al., 2018). The depth-integrated dissipation rate D (= ) averaged over available data due to near-bottom dissipation of diurnal internal tides is 4.8×10⁻³ W/m2. This turbulent dissipation is one order of magnitude lower than that (D = 7×10⁻² W/m2) estimated by Klymak et al. (2011) based on the similar MMP measurements on the continental slope east of the Dongsha Island, where diurnal internal tides were much stronger than those observed at M1.
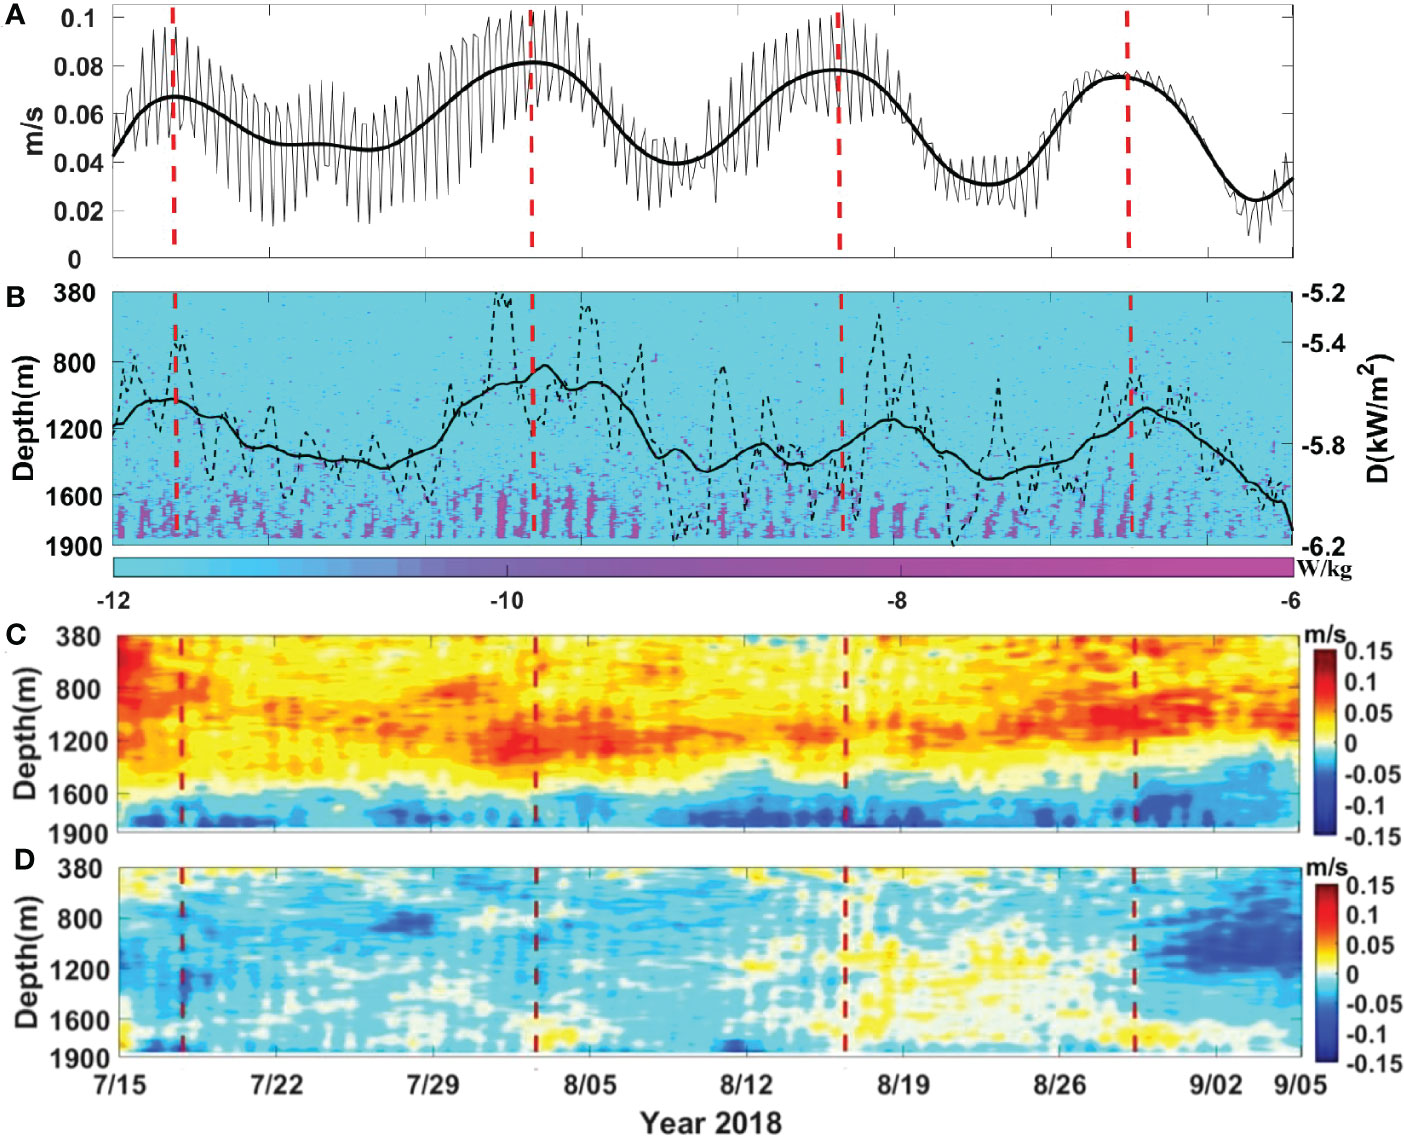
Figure 6 (A) Time series of diurnal velocity variances (u2+v2)1/2 averaged over depths of 1600 and 1840 m. The thick line is a smoothed result. (B) The dissipation rate ϵ based on equation (4). The black dotted line is depth-integrated dissipation rate, and the thick line is its smoothed result. (C, D) Time-depth maps of low-pass filtered along-slope (C) and cross-slope (D) velocities. The vertical dash lines indicate four diurnal springs.
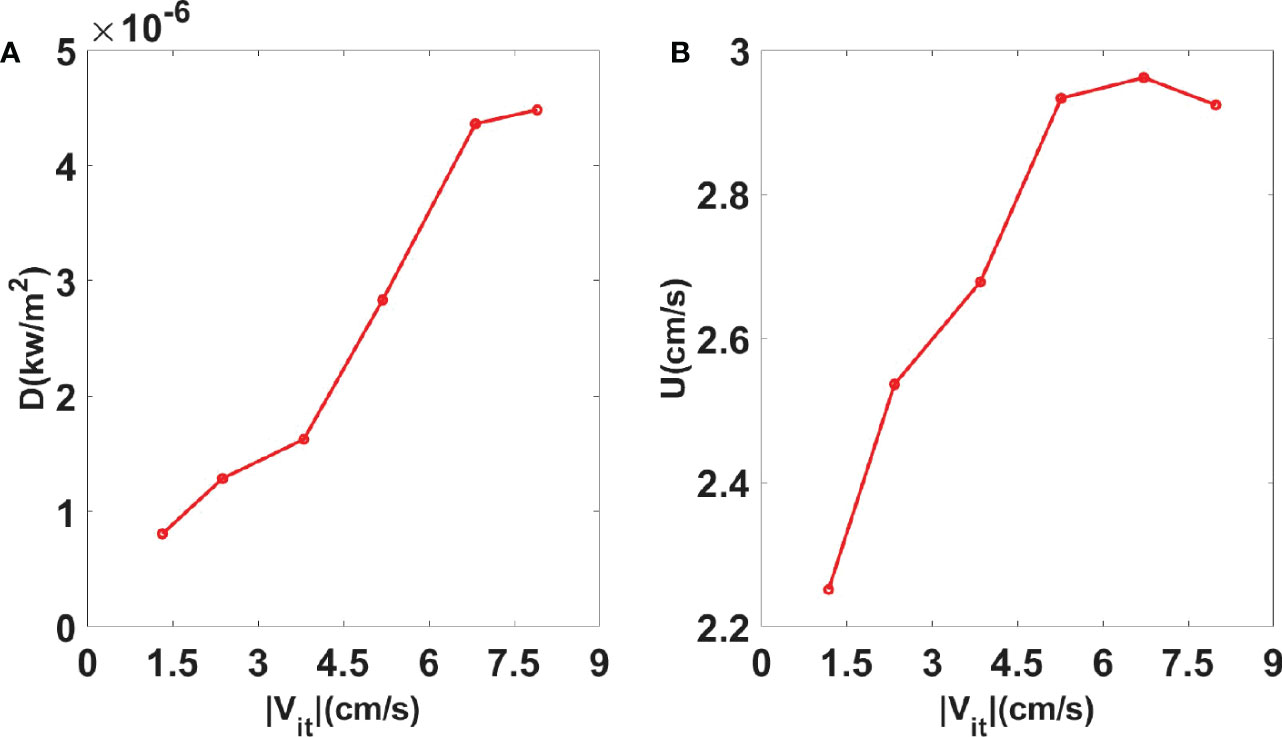
Figure 7 (A) Averaged depth-integrated dissipation rate D and (B) averaged along-slope bottom velocity U against near-bottom diurnal velocity variance |Vit| (1.5 cm/s velocity bin) at M1.
4.3. Generation of along-slope bottom currents
Since diurnal internal tides obliquely impinge on the near-critical continental slope, enhanced bottom dissipation due to their breaking is expected to generate a southwestward along-slope bottom current (Xie et al., 2018). To confirm it, along-slope (U) and cross-slope (V) low-frequency velocities are shown in Figures 6C, D, respectively. A southwestward low-frequency flow (U<0) is observed below 1600 m where the turbulent dissipation rate is elevated due to breaking internal tides (Figure 6B), with the maximum velocities reaching 6 cm/s (Figure 6C). Note that the along-slope velocity is often much larger than the cross-slope velocity, suggesting dominant along-slope currents (compare Figures 6C, D). The southwestward flow is enhanced at diurnal springs (compare Figures 6A, C), whose magnitude shows a correlation with near-bottom diurnal velocity (Figure 7B). The correlation between enhanced U and diurnal velocities suggests that the southwestward bottom current may be generated by breaking diurnal internal tides on the near-critical continental slope, as reported in Xie et al. (2018). However, as shown in Figure 7B, the along-slope current velocity does not increase when Vit is larger than 6.5 cm/s. It may be because U in equation (11) is inversely proportional to Vit although the bottom-enhanced dissipation always increases as Vitincreases (Figure 7A).
The southwestward on the deep slope may also be caused by the deep western boundary current (hereafter referred to DWBC; Wang et al., 2011; Zhou et al., 2017; Zhao et al., 2020; Zhou et al., 2020). Using mooring data collected near our mooring site M1, Zheng et al. (2022) estimated that the DWBC was weak during August, 2018 corresponding to our observation period, with a velocity of 0.54 cm/s. This small velocity is consistent with our observations (~0.6 cm/s) at neap tides. Therefore, DWBC may affect the southwestward bottom flow near M1, but their effects are secondary at diurnal spring tides.
4.4. Theoretical prediction of along-slope bottom currents
The above observations have suggested near-bottom dissipation of diurnal internal tides and the subsequent generation of the southwestward bottom currents on the near-critical continental slope. Based on equation (11), it is possible to estimate internal wave-induced along-slope current. Since the phase speed Cp of high-mode internal tides (Cp< 1 m/s for n≥4) are much smaller than that of low-mode internal tides (Cp = 3.2 m/s for mode-1 internal tides), the choice of Cp can significantly affect the estimation in equation (11). Although it is assumed that low-mode internal tides are obliquely incident to the continental slope, breaking of high modes (n≥4) are essential to the bottom-enhanced dissipation (Figure 4). Here we use the following dispersion relation to estimate Cp:
where k is the horizontal wavenumber and m is the vertical wavenumber. The vertical wave number m can be deduced from the near-bottom diurnal velocity (Figures 4A, B) and is approximately 2π/1000 m. Taking N =1.5×10⁻³ s-1 below 1600 m (Figure 2A), Cp is approximately equal to 0.35 m/s. The depth integrated dissipation rate ϵ from 1600 m to the seafloor (h = 300 m) during four diurnal springs are used to compute the along-slope flow velocity, respectively. The result is shown in Table 1.
As shown in Table 1, the estimated U are in magnitude consistent with the observational values at all diurnal springs. Note that observed U in Table 1 have removed the background velocity at neap tides (~0.6 cm/s). If Cp of high-mode internal tides in equation (11) is replaced by that of low-mode internal tides (e.g., mode-1), the predicted along-slope bottom velocity is one order of magnitude smaller than the observed value, even smaller than the background velocities during neap tides.
Using the full-depth MMP measurements at a mooring site on the continental slope east of the Dongsha Island (i.e., site K11; Figure 1A), Klymak et al. (2011) showed that near-bottom breaking of diurnal internal tides caused energy dissipation of ~7×10⁻² W/m2 on the near-critical slope. Their mooring site was close to X18 (Figure 1A), where the along-slope bottom current caused by near-bottom dissipation of diurnal internal tides was also observed, with velocity amplitude of ~0.1 m/s (Xie et al., 2018). Using the dissipation rate (D = ~7×10⁻² W/m2) estimated by Klymak et al. (2011), U at X18 is estimated to be 0.11 m/s based on equation (11), where |u| = 0.2 m/s, γ= 20°, and Cp = 0.5 m/s (Xie et al., 2018). The result is also consistent with the along-slope (southwestward) bottom velocity observed at X18. It should be pointed out that energy dissipation of internal tides cannot be completely converted into the mean flow. Parts of them may drive the local turbulent mixing and increase mean potential energy (Klymak et al., 2011). Osborn (1980) estimated that the upper limit mixing efficient was ~0.2. Such mixing efficient does not essentially change the estimated result in equation (11).
5. Discussion
On the entire continental slope in the northeastern SCS, namely the slope south-southeast-east-northeast of the Dongsha Island, Xie et al. (2018) estimated a cyclonic bottom circulation caused by breaking diurnal internal tides because of their oblique incidence. Observations from satellite altimeters (Zhao, 2020) and numerical models (Wang et al. (2021)) revealed the spatial inhomogeneity of diurnal flux magnitudes when they approach the continental slope (Figure 8). Therefore, the along-slope currents caused by internal tide dissipation may also have a spatial variation (Table 2).
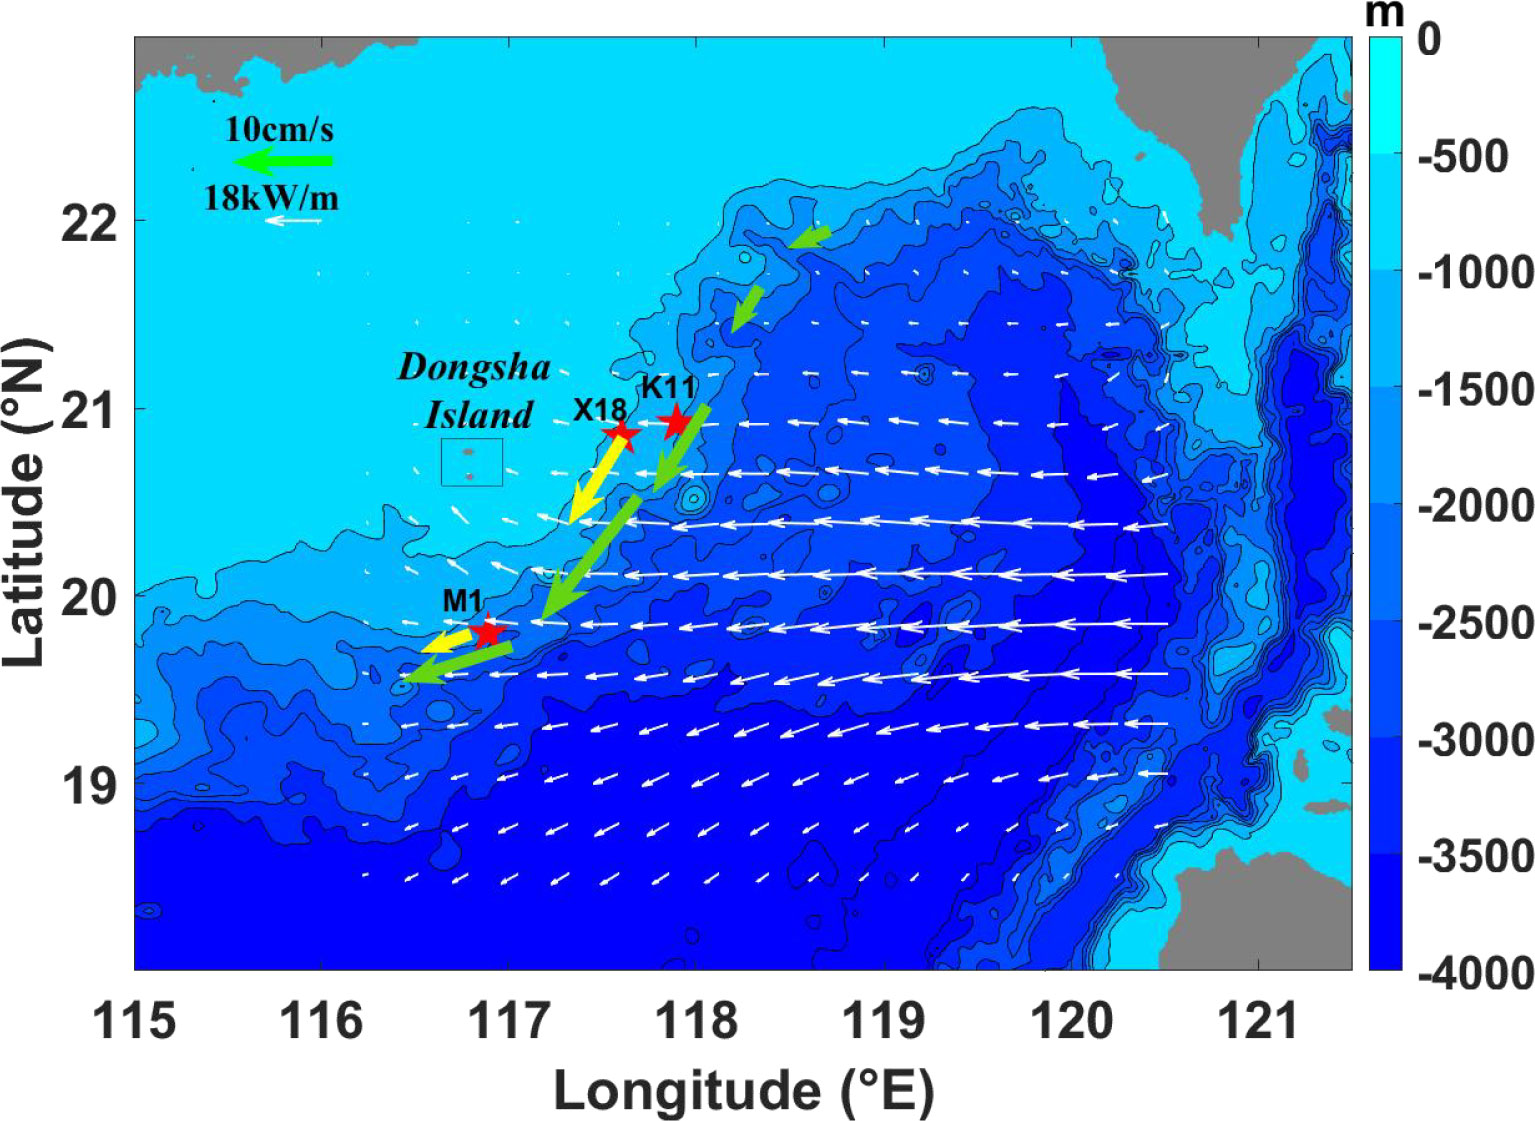
Figure 8 Spatial distribution of the estimated along-slope bottom velocity U (green arrows) caused by breaking diurnal internal tides on the northeastern continental slope of the SCS based on the modeled dissipation of diurnal internal tides in the MITgcm simulations of Wang et al. (2021). The white arrows indicate the energy fluxes of modeled K1 internal tides (Wang et al. (2021)). The yellow arrows are the observed U at M1 and X18.
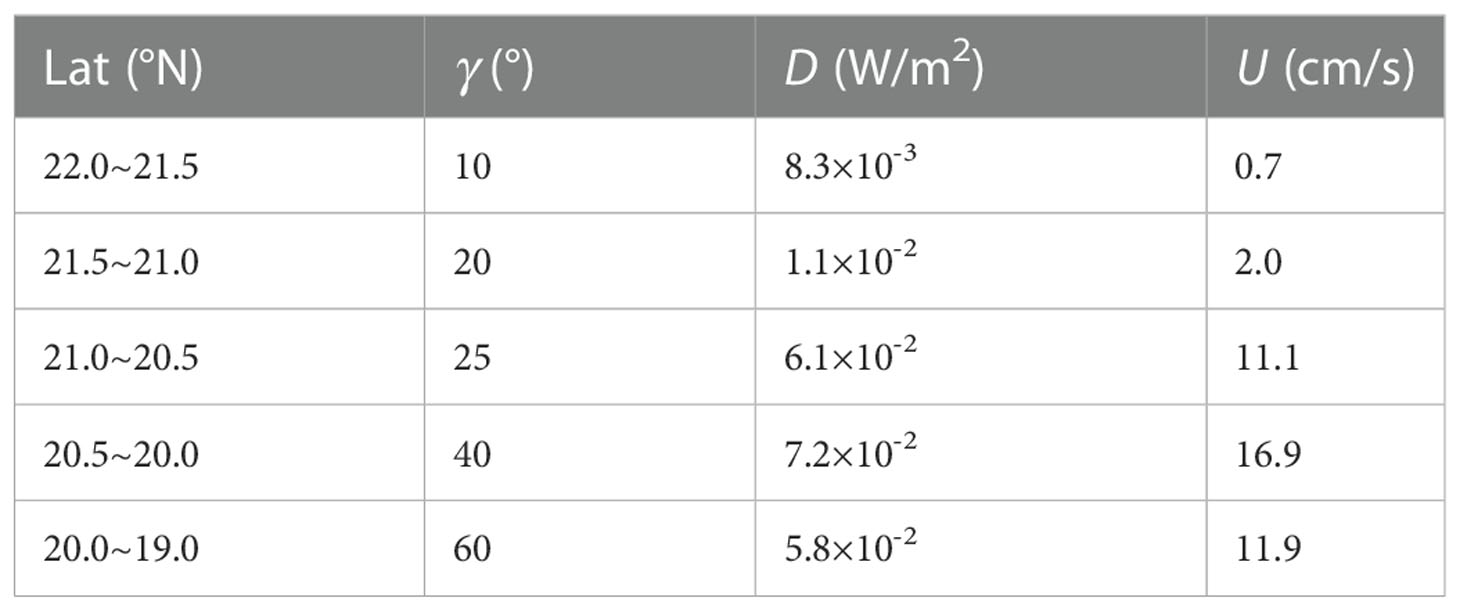
Table 2 The theoretically predicted values of the along-slope bottom flow velocity U at different latitudes on the northeastern continental slope of the SCS based on the simulations of Wang et al. (2021).
Assuming that energy dissipation (D) of internal tides on the continental slope is equal to the difference between flux magnitudes of diurnal internal tides incident to the slope and transmitted onto the continental shelf based on the simulations of Wang et al. (2021), it is possible to estimate the intensity of the along-slope bottom flow associated with internal tide breaking on the entire slope in the northeastern SCS. The result is shown in Table 2 and Figure 8.
As expected, the along-slope current velocity associated with internal tide breaking showed a significant spatial variation. The largest along-slope bottom flow appears at 20-20.5°N, with the current velocity reaching 17 cm/s. On the east side of the Dongsha Island, the dissipation of diurnal internal tides is close to the observations of Klymak et al. (2011), and the estimated U based on the model data can be, therefore, consistent with the observations. However, on the continental slope in the south (below 20°N), the dissipation rate in the model is much larger than the observation at M1. This may be because a strong, southeastward beam of diurnal internal tides reflected by the Donsha Island passed over this region (Wang et al. (2021)), so that D of diurnal internal tides on the continental slope is largely overestimated. The estimated U at M1 based on the model data is one order of magnitude larger than that based on the observation.
6. Conclusion
Using moored observations carried out on the continental slope south of the Dongsha Island in the northeastern SCS, we have examined the dissipation of obliquely incident low-mode internal tides originating from Luzon Strait and the generation of the along-slope bottom currents associated with internal tide dissipation. The observed diurnal internal tides showed near-bottom enhancement and dissipation due to their near-critical reflection on the slope. Since internal tides were obliquely incident to the continental slope, a southwestward along-slope current was generated by their breaking near the seafloor. The previous theory developed by Thorpe (1999) roughly reproduced the observed along-slope bottom current velocity by using the phase speed of high-mode internal tides driving bottom dissipation on the continental slope. The theory, as well as the model data, is also used to depict a map of the along-slope bottom velocity caused by dissipation of diurnal internal tides on the northeastern slope of the SCS. A significant spatial variation for internal tide driven along-slope bottom flow on the continental slope was revealed, with the maximum velocity reaching 0.17 m/s. Strong bottom currents caused by internal tide breaking may play an important role in transporting bottom nutrients and sediments on the slope. It should be pointed out that the bottom flow pattern estimated by the model data did not completely reproduce the observations due to the uncertainty of dissipation of internal tides on the continental slope. To obtain the map for internal wave driven the along-slope bottom flow more exactly, more field data and simulations for energy budget of internal tides on the continental slope are necessary.
Data availability statement
The raw data supporting the conclusions of this article will be made available by the authors, without undue reservation. The climatological data are available in NoAA National Oceanographic Data Center (https://www.nodc.noaa.gov/OC5/woa18). The field data in this study can be requested from the corresponding author. The 2018 World Ocean Atlas is produced and made available by NOAA National Oceanographic Data Center (https://www.nodc.noaa.gov/OC5/woa18/). The observation data for this paper can be requested from XiaohuiXie (eHhpZUBzaW8ub3JnLmNu).
Author contributions
XX and HZ designed the experiment and conducted the fieldwork. JW processed the data and performed analyses with guidance from XX. JW wrote the initial manuscript, with significant input from XX, SL and WL. All authors contributed to the article and approved the submitted version.
Funding
The work was supported by Natural Science Foundation of China (41876016 and 42227901), the National Key R&D Program of China (2022YFF0800103), Natural Science Foundation of Zhejiang Province (LR20D060001), and the Project of Southern Marine Science and Engineering Guangdong Laboratory (Zhuhai) (No. SML2021SP207).
Acknowledgments
The authors thank Dr. Shuya Wang and Dr. Anzhou Cao for providing the numerical simulation results of diurnal internal tides in the SCS. We also thank two reviewers for their insightful comments that helped improved the manuscript.
Conflict of interest
The authors declare that the research was conducted in the absence of any commercial or financial relationships that could be construed as a potential conflict of interest.
Publisher’s note
All claims expressed in this article are solely those of the authors and do not necessarily represent those of their affiliated organizations, or those of the publisher, the editors and the reviewers. Any product that may be evaluated in this article, or claim that may be made by its manufacturer, is not guaranteed or endorsed by the publisher.
References
Alford M. H., Peacock T., MacKinnon J. A., Nash J. D., Buijsman M. C., Centuroni L. R., et al. (2015). The formation and fate of internal waves in the. South China Sea. Nature 521(7550), 65–69. doi: 10.1038/nature14399
Alford M. H. (2003). Redistribution of energy available for ocean mixing by long-range propagation of internal waves. Nature 423, 159–162. doi: 10.1038/nature01628
Alford M. H., Zhao Z. (2007). Global patterns of low-mode internal-wave propagation. part I: Energy and energy flux. J. Phys. Oceanogr. 37, 1829–1848. doi: 10.1175/JPO3085.1
Baines P. G. (1982). On internal tide generation models. Deep-Sea. Res. 29 (3), 307–338. doi: 10.1016/0198-0149(82)90098-X
Baines P. G. (2007). Internal tide generation by seamounts. Deep Sea. Res. Part I: Oceanogr. Res. 54 (9), 1486–1508. doi: 10.1016/j.dsr.2007.05.009
Bowen A. J. (1969). The generation of longshore currents on a plane beach. J. Mar. Res. 27 (2), 206–215.
Dillon T. M. (1982). Vertical overturns: A comparison of Thorpe and ozmidov scales. J. Geophys. Res. 87, 9601–9613. doi: 10.1029/JC087iC12p09601
Dunkerton T. J., Delisi D. P., Lelong M. P. (1998). Alongslope current generated by obliquely incident internal gravity waves. Geophys. Res. Lett. 25 (20), 3871–3874. doi: 10.1029/1998GL900031
Ferrari R., Wunsch C. (2009). Ocean circulation kinetic energy: Reservoirs, sources, and sinks. Annu. Rev. Fluid Mech. 41, 253–282. doi: 10.1146/annurev.fluid.40.111406.102139
Galvin C. J. (1967). Longshore current velocity, a review of theory and data. Rev. Geophys. 5 (3), 287–304. doi: 10.1029/RG005i003p00287
Klymak J. M., Alford M. H., Lien R. C., Yang Y. J., Tang T. Y. (2011). The breaking and scattering of the internal tide on a continental slope. J. Phys. Oceanogr. 41 (5), 926–945. doi: 10.1175/2010JPO4500.1
Klymak J. M., Gregg M. C. (2004). Tidally generated turbulence over the knight inlet sill. J. Phys. Oceanogr. 34, 1135–1151. doi: 10.1175/1520-0485(2004)034<1135:TGTOTK>2.0.CO;2
Klymak J. M., Moum J. N., Nash J. D., et al. (2006). An estimate of tidal energy lost to turbulence at the Hawaiian ridge. J. Phys. Oceanogr. 36, 1148–1164. doi: 10.1175/JPO2885.1
Klymak J. M., Pinkel R., Rainville L. (2008). Direct breaking of the internal tide near topography: Kaena ridge, Hawaii. J. Phys. Oceanogr. 38, 380–399. doi: 10.1175/2007JPO3728.1
Legg S. (2004). Internal tides generated on a corrugated continental slope. part II: Along-slope barotropic forcing. J. Phys. Oceanogr. 34, 1824–1838. doi: 10.1175/1520-0485(2004)034<1824:ITGOAC>2.0.CO;2
Longuet-Higgins M. S. (1970a). Longshore currents generated by obliquely incident sea waves:1. J. Geophys. Res. 75, 6783–6789. doi: 10.1029/JC075i033p06778
Longuet-Higgins M. S. (1970b). Longshore currents generated by obliquely incident sea waves:2. J. Geophys. Res. 75, 6790–6801. doi: 10.1029/JC075i033p06790
Merrifield M. A., Holloway P. E., Johnston T. M. S. (2001). The generation of internal tides at the Hawaiian ridge. Geophys. Res. Lett. 28 (4), 559–562. doi: 10.1029/2000GL011749
Moum J., Caldwell D., Nash J., Gunderson G. (2002). Observations of boundary mixing over the continental slope. J. Phys. Oceanogr. 32, 2113–2130. doi: 10.1175/1520-0485(2002)032<2113:OOBMOT>2.0.CO;2
Munk W., Wunsch C. (1998). Abyssal recipes II: Energetics of tidal and wind mixing. Deep Sea. Res. Part I: Oceanogr. Res. 45, 1977–2010. doi: 10.1016/S0967-0637(98)00070-3
Nash J. D., Alford M. H., Kunze E. (2005). Estimating internal wave energy fluxes in the ocean. J. Atmos. Oceanic Technol. 22, 1551–1570. doi: 10.1175/JTECH1784.1
Nash J. D., Kunze E., Toole J. M., Martini K., Kelly S. (2007). Hotspots of deep ocean mixing on the Oregon continental slope. Geophys. Res. Lett. 34, L01605. doi: 10.1029/2006GL028170
Nash J. D., Kunze E., Toole J. M., Schmitt R. W. (2004). Internal tide reflection and turbulent mixing on the continental slope. J. Phys. Oceanogr. 34, 1117–1134. doi: 10.1175/1520-0485(2004)034<1117:ITRATM>2.0.CO;2
Osborn T. R. (1980). Estimates of the local rate of vertical diffusion from dissipation measurements. J. Phys. Oceanogr. 10, 83–89. doi: 10.1175/1520-0485(1980)010<0083:EOTLRO>2.0.CO;2
Peacock T., Mercier M. J., Didelle H., Viboud S., Dauxois T. (2009). A laboratory study of low-mode internal tide scattering by finite-amplitude topography. Phys. Fluids 21, 121702. doi: 10.1063/1.3267096
Putnam J. A., Munk W. H., Traylor M. A. (1949). The prediction of longshore currents. Eos. Trans. Amer. Geophys. Un. 30, 337–345. doi: 10.1029/TR030i003p00337
Thorpe S. A. (1977). Turbulence and mixing in a Scottish loch. Philos. Trans. R. Soc. London A: Math. Phys. Eng. Sci. 286, 125–181. doi: 10.1098/rsta.1977.0112
Thorpe S. A. (1999). The generation of alongslope currents by breaking internal waves. J. Phys. Oceanogr. 29, 29–38. doi: 10.1175/1520-0485(1999)029<0029:TGOACB>2.0.CO;2
Wang S. Y., Chen X., Wang J. H., Li Q., Meng J., Xu Y. (2019). Scattering of low-mode internal tides at a continental shelf. J. Phys. Oceanogr. 49 (2), 453–468. doi: 10.1175/JPO-D-18-0179.1
Wang G., Xie S. P., Qu T., Huang R. X. (2011). Deep south China sea circulation. Geophys. Res. Lett. 38, L05601. doi: 10.1029/2010GL046626
Wang S., Cao A., Li Q., Chen X. (2021). Reflection of K1 internal tides at the continental slope in the northern South China Sea. Journal of Geophysical Research: Oceans 126, e2021JC017260. doi: 10.1029/2021JC017260.
Wunsch C. (1975). Internal tides in the ocean. Rev. Geophys. 13 (1), 167–182. doi: 10.1029/RG013i001p00167
Xie X. H., Chen D. K. (2021). Near-surface reflection and nonlinear effects of low-mode internal tides on a continental slope. J. Phys. Oceanogr. 51 (4), 1037–1051. doi: 10.1175/JPO-D-20-0197.1
Xie X. H., Cuypers Y., Bouruet-Aubeitot P., Pichon A., Lourenco A., Ferron B. (2015). Generation and propagation of internal tides and solitary waves at the shelf edge of the bay of Biscay. J. Geophys. Res.: Oceans 120, 6603–6621. doi: 10.1002/2015JC010827
Xie X. H., Liu Q., Zhao Z., Shang X. D., Cai S. Q., Wang D. X., et al. (2018). Deep sea currents driven by breaking internal tides on the continental slope. Geophys. Res. Lett. 45, 6160–6166. doi: 10.1029/2018GL078372
Zhao Z. (2014). Internal tide radiation from the Luzon strait. J. Geophys. Res.: Oceans 119, 5434–5448. doi: 10.1002/2014JC010014
Zhao Z. (2020). Southward internal tides in the northeastern south China Sea. J. Geophys. Res.: Oceans 125(11), e2020JC016554. doi: 10.1029/2020JC016554
Zhao X., Zhou C., Xu X., Ye R., Zhao W. (2020). Deep circulation in the south China Sea simulated in a regional model. Ocean Dyna. 70 (11), 1461–1473. doi: 10.1007/s10236-020-01411-2
Zheng H., Zhu X. H., Zhang C., Zhao R., Zhu Z. N., Ren Q., et al. (2022). Observation of abyssal circulation to the west of the Luzon strait, south China Sea. J. Phys. Oceanogr. 52, 2091–2109. doi: 10.1175/JPO-D-21-0284.1
Zhou M., Wang G., Liu W., Chen C. (2020). Variability of the observed deep western boundary current in the south China Sea. J. Phys. Oceanogr. 50, 2953–2963. doi: 10.1175/JPO-D-20-0013.1
Zhou C., Zhao W., Tian J., Zhao X., Zhu Y., Yang Q., et al. (2017). Deep western boundary current in the south China Sea. Sci. Rep. 7 (1), 9303. doi: 10.1038/s41598-017-09436-2
Keywords: along-slope bottom currents, internal tides, turbulent dissipation, critical slopes, South China Sea
Citation: Wang J, Xie X, Li S, Zhang H and Li W (2023) Along-slope bottom currents driven by dissipation of internal tides in the northeastern South China Sea. Front. Mar. Sci. 9:1065824. doi: 10.3389/fmars.2022.1065824
Received: 10 October 2022; Accepted: 28 December 2022;
Published: 18 January 2023.
Edited by:
Youyu Lu, Bedford Institute of Oceanography (BIO), CanadaReviewed by:
Jae-Hun Park, Inha University, Republic of KoreaDezhou Yang, Institute of Oceanology, Chinese Academy of Sciences (CAS), China
Copyright © 2023 Wang, Xie, Li, Zhang and Li. This is an open-access article distributed under the terms of the Creative Commons Attribution License (CC BY). The use, distribution or reproduction in other forums is permitted, provided the original author(s) and the copyright owner(s) are credited and that the original publication in this journal is cited, in accordance with accepted academic practice. No use, distribution or reproduction is permitted which does not comply with these terms.
*Correspondence: Xiaohui Xie, eHhpZUBzaW8ub3JnLmNu
 Jiannan Wang
 Xiaohui Xie
 Shaofeng Li1,2
 Han Zhang