
95% of researchers rate our articles as excellent or good
Learn more about the work of our research integrity team to safeguard the quality of each article we publish.
Find out more
ORIGINAL RESEARCH article
Front. Mar. Sci. , 09 December 2022
Sec. Marine Ecosystem Ecology
Volume 9 - 2022 | https://doi.org/10.3389/fmars.2022.1063007
This article is part of the Research Topic Seascape Ecology: from characterization to evaluation of state and change over time View all 10 articles
 Laura R. de Almeida1
 S. Valery Ávila-Mosqueda2
 Rodolfo Silva1*
 Edgar Mendoza1
 Brigitta I. van Tussenbroek2
The physical and ecological importance of seagrass meadows in coastal processes is widely recognized, and the development of tools facilitating characterization of their structure and distribution is important for improving our understanding of these processes. Mixed (multi-specific) meadows in a Mexican Caribbean reef lagoon were mapped employing a multiparameter approach, using PlanetScope remote sensing images, and supervised classification based on parameters related to the structure of the seagrasses meadows, including the cover percentages of seagrass/algae/sediment, algae thalli and seagrass shoot densities, canopy heights and estimated leaf area index (LAI). The cover, seagrass and algae densities, and seagrass canopy heights were obtained using ground truth sampling, while the LAI was estimated using data obtained from long-term monitoring programs. The maps do not show the differentiation of seagrass species, but ground truthing contemplated characterization of the density of Thalassia testudinum, Syringodium filiforme and Halodule wrightii and their respective LAIs. S. filiforme was the dominant species in terms of shoot density, and T. testudinum was dominant in terms of LAI. In the multiparameter-based map four classes were defined, based on the cover and structural characteristics, and its overall accuracy was very high (~90%). Maps based on sediment cover and LAI alone also had 4 classes, but they were less accurate than the multiparameter-based map (~70% and ~80%, respectively). The multiparameter-based seagrass map provided spatially-explicit data on the abundance and structure of seagrasses, useful for future monitoring of the changes in the meadows, and also for studies of that require data of large-scale meadow structure, such as inventories of associated biota, blue carbon storage, or modelling of the local hydrodynamics.
Seagrass meadows provide a wide range of ecosystem services. These include the provision of habitat and refuge for many species, the improvement of water quality, coastal protection, erosion control, carbon sequestration, and services related to tourism, education and recreation (Barbier et al., 2011). Seagrass canopies attenuate the energy of waves and currents, contributing to sedimentation, and their root and rhizome systems trap and stabilize sediments (Madsen et al., 2001; Chen et al., 2007; Koch et al., 2009). In tropical reef lagoons, the seagrass meadows are interconnected with other coastal ecosystems, such as coral reefs and beach/dune systems. The reefs provide a suitable environment for the colonization and development of seagrass in the reef lagoons, while the seagrasses assimilate nutrients, entrap sediment and particles, thus improving the quality of coastal waters and favoring the growth of the coral reefs. Both coral reefs and seagrass meadows dampen wave and current energy, stabilizing the coast, and shaping the morphology of the beach/dune systems (Moberg and Rönnbäck, 2003; de Almeida et al., 2022). Spatially explicit information on the distribution of the seagrasses and their characteristics can provide a useful tool for understanding the dynamics of the meadows themselves, their impact on local hydro- and sediments dynamics, as well as interactions with other neighboring systems.
Spatially explicit information obtained by mapping the distribution of seagrasses in shallow waters using satellite images (especially those with high spatial resolution, i.e.<10 m pixel size) and field data, provide a quantitative and cost effective alternative for intensive in situ monitoring programs (Baumstark et al., 2013). Criteria used for seagrass maps are typically presence/absence (e.g. Hossain et al., 2015), the percentage of seagrass/sediment cover (e.g. Roelfsema et al., 2009) or spatial distribution of seagrass meadows (e.g. Kovacs et al., 2018). Such maps can be improved with the addition of information regarding the seagrass landscape, such as the density of the seagrasses and algae, seagrass canopy heights and their foliar area, which could then allow a better evaluation of ecosystem interactions and the services offered by the meadows.
For example, the propagation/dissipation of waves and currents, and consequent sediment dynamics, are determined by the extension and structure of the meadows in relation to the direction of wave propagation (Chen et al., 2007), the density of the plants (Gambi et al., 1990), the seagrass species, and the height of the canopy, and its ratio to the relative water submergence (Fonseca and Cahalan, 1992). Maps that reflect these parameters (multiparameter classes) can also be useful for the determination of blue carbon budgets and studies of infauna communities. Such maps could also be used as input for numerical models (e.g. Silva et al., 2020), incorporating mechanical traits (Soissons et al., 2018), friction, or damping coefficients, obtained from laboratory experiments (Stratigaki et al., 2011; Koftis et al., 2013; Schaefer and Nepf, 2022). Such experimentally determined coefficients are vital in the calibration and validation of hydrodynamic numerical models (e.g. Paquier et al., 2021). However, without information on the distribution and structure of the seagrass meadows, numerical models may be inaccurate in reproducing the actual coastal processes, as explained by Escudero et al. (2021).
The main aim of this study was to see whether it is possible to map seagrasses beyond mere cover, and to incorporate data on specific composition and structure to provide spatially explicit information that may be useful in studies that require such information. A map was created as a function of seagrass density, algae density, canopy height, seagrass the leaf area index (LAI) and percentage of seabed coverage (multiparameter map), for a shallow reef lagoon with clear waters in the Mexican Caribbean. Maps with classes defined only by LAI and sediment cover were also created to compare with the multiparameter class map. The advantages and disadvantages of each mapping method were evaluated.
The study site is part of a reef lagoon in the north of the Marine Protected Area of Puerto Morelos, (20° 57’ - 21° 00’ N; 86° 47’ - 86° 49’W), in front of the Moon Palace Resort, in the Mexican Caribbean, with a surface of 12.5 km2 (Figure 1).
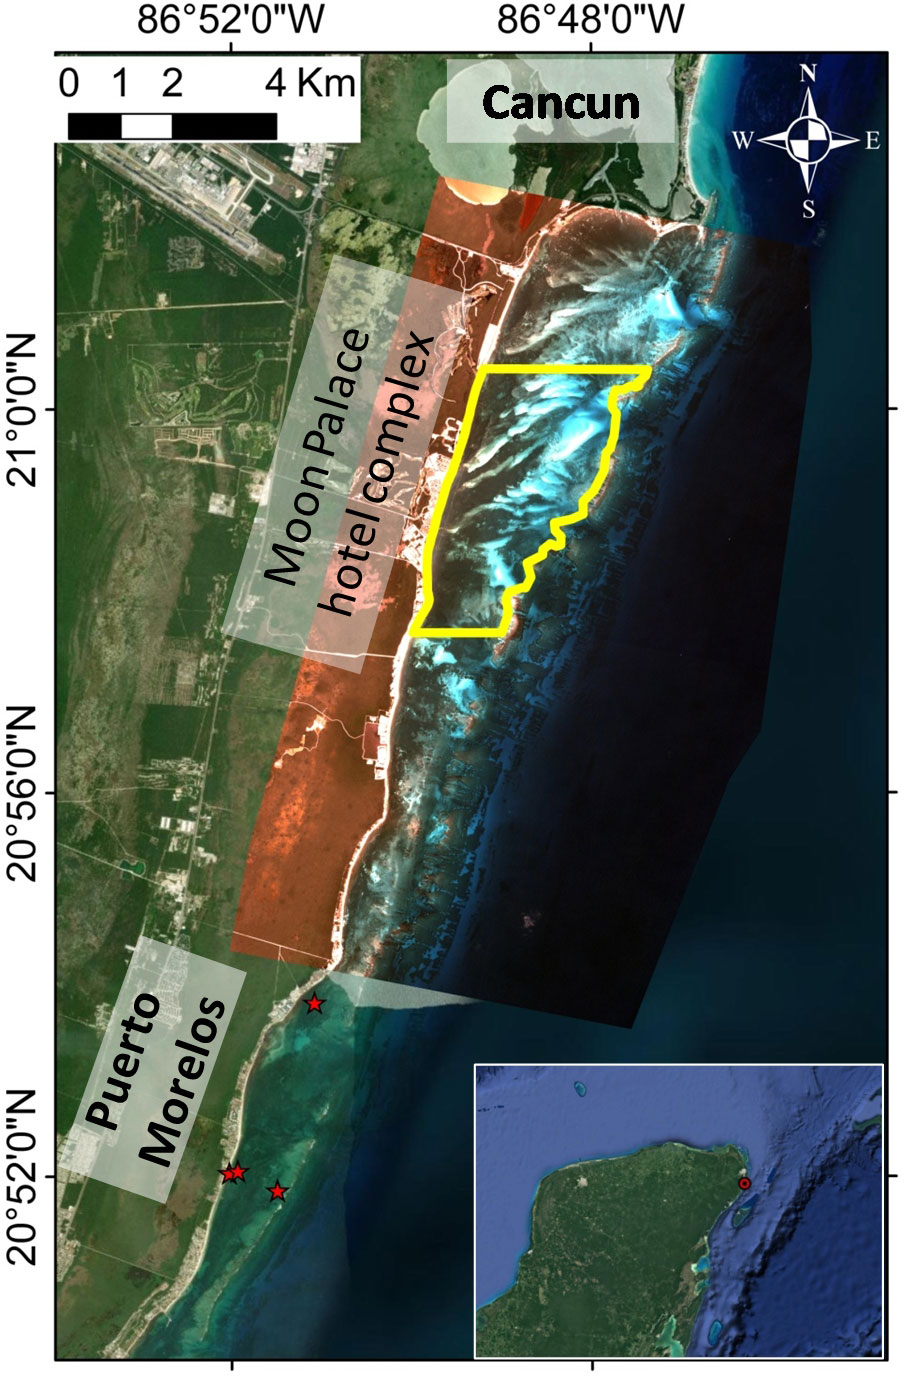
Figure 1 Study area (yellow outline) and long-term seagrass monitoring stations (red stars, acquired during the Caribbean Coral Reef Productivity Program (CARICOMP), from 1993 to 2016.
The fringing reefs, part of the Mesoamerican Reef System, are 1.7 – 3.1 km from the coast in the study area. The reef lagoon is relatively shallow, with an average depth of 3-4 m and maximum depth of 8 m (data measured in this study). The lagoon floor is usually composed of calcareous sand, and seagrass meadows are interspersed with underwater dunes consisting of loose calcareous sands devoid of vegetation. The dominant seagrass species is Thalassia testudinum, which is considered the climax species in the Caribbean, along with Syringodium filiforme, Halodule wrightii and rhizophytic algae (van Tussenbroek, 2011; Hedley et al., 2021).
The climate at Puerto Morelos is tropical. Mean surface-water temperatures vary from 25.1°C, in mid-winter, and 29.9°C, in late summer (Rodríguez-Martínez et al., 2010). Average annual rainfall is 1000 - 1400 mm, with a tendency of heavier rain in summer (June-October) (Martínez et al., 2014). The coast has a microtidal regime with semidiurnal spring and neap tidal ranges of 0.32 and 0.07 m, respectively (Coronado et al., 2007). The wave climate is characterized by calm conditions most of the time: significant wave heights (Hs) of 1-1.5 m and short wave periods (Tm) of 4-7 s. Swell waves are rare, occurring from November to April, associated with northerly cold fronts; Hs ~ 2-3 m, Tm ~ 6-8 s, or in the hurricane season, May to October; Hs ~ 6-15 m, Tm ~ 8-12 s (Escudero-Castillo et al., 2018; Rioja-Nieto et al., 2018). However, the coral reef in the study area can reduce the incident wave height by up to 85% (Ruiz de Alegria-Arzaburu et al., 2013).
Surface rivers are absent (Ortíz Pérez and de la Lanza Espino, 2006) and precipitation flows to the sea through underground rivers that discharge into the sea through submarine springs (Kachadourian-Marras et al., 2020), meaning that the seawater tends to be clear, facilitating the use of satellite images for mapping the bottom of the reef lagoon.
PlanetScope satellite images from 23/01/2021, with 0% cloud cover and without sun glint, were used. These images are Ortho Scene Product, orthorectified and radiometrically-, sensor-, and geometrically corrected. Atmospheric effects were corrected using the 6SV2.1 radiative transfer code. AOD, water vapor and ozone inputs were retrieved from MODIS near-real-time data (MOD09CMA, MOD09CMG and MOD08-D3). The data of the pixels is expressed in reflectance units, with a spatial resolution of 3x3 m, radiometric resolution of 16 bits and 4 bands (PS2 sensor; B1-Blue: 455 - 515 nm; B2-Green: 500 - 590 nm; B3-Red: 590 - 670 nm; B4-Near Infra Red: 780 - 860 nm) (Planet Labs Inc, 2022).
The software SNAP from the European Space Agency (ESA) was used to preprocess and run the supervised classifications of the images. Although the images had an atmospheric correction, a dark object subtraction method was applied to each image before the construction of the mosaic, following the indications of Frazier and Hemingway (2021). A mask was applied to select a smaller area than the satellite image, of water only, from the shoreline towards the open sea. Using the Sen2Coral toolbox (Serco Italia SPA, 2019) on ESA’s SNAP software, Cloud and White Cap Mask Algorithm was applied. Polygons were drawn manually over the areas to be excluded, including boat trails, structures (e.g. an anti-sargasso barrier) and other elements that the previous mask did not detect. Depth Invariant Indices (DI, also included in Sen2Coral) were calculated for water column correction, using the DI result for each pair of bands (B1+B2; B1+B3; B2+B3) as input for the supervised classifications together with B1, B2 and B3 bands. Finally, a mask was applied to select the study area only for the classifications.
A total of 105 points were defined, chosen based on visual assessment of the existing imagery, unsupervised classifications in combination with expert knowledge of the system, to provide an adequate representation of the variety of seagrass meadow throughout the area (Figure 2). In the field these points were located, using a GPS (Garmin, GPSMAP 65s) and they were slightly offset if necessary, to ensure that the bottom features were homogeneous within a radius of a least 10m, to consider descriptors as homogeneous within each 3x3m pixel. The survey was carried out between April 3rd and June 2nd, 2021, to define bottom and phytobenthos features used in a classification map (seed pixels). In the time between the seed pixels survey and satellite image no significant event occurred that would have affected the seagrass meadows. At each point, two photos were taken for the analysis. The first, from a 100 x 100cm quadrat to estimate the benthos coverage and the second, from a 25 x 25 cm quadrat to corroborate the phytobenthos characteristics.
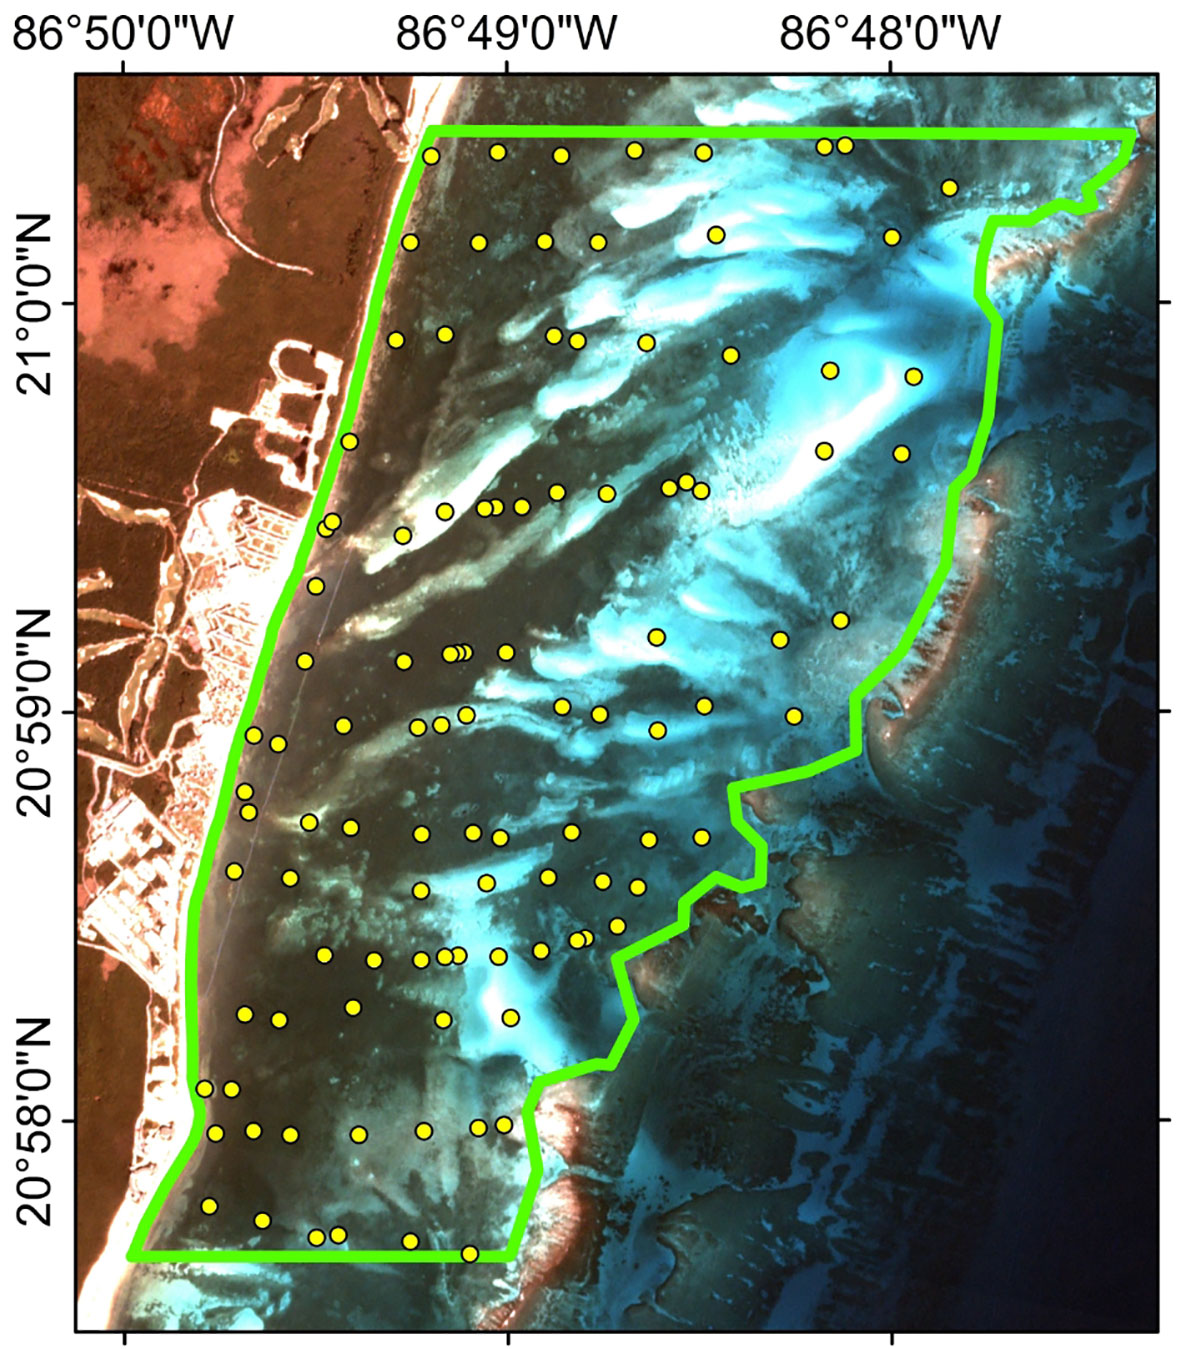
Figure 2 Location of the 105 points sampled to obtain ground truth data (between April 3rd and June 2nd, 2021) to be used as seed pixels in supervised classification.
Using the 25 x 25 cm quadrat, density was verified in situ by counting the foliar shoots for each seagrass species, and the thalli for algae (without species differentiation). The canopy height of the meadow was measured in situ from the sea bottom to the upper limit of the seagrass canopy with a ruler (1 mm resolution), regardless of the species. The depth of each sample point was measured using a Garmin STRIKER VIVID 5CV echo sounder. The photographs of the 100 x 100 cm quadrats were analyzed using a MATLAB coded routine to compute the percentage of sand cover, converting the images to binary following the method of Otsu (1979) (Yamamuro et al., 2002). To estimate the abundance and percentage cover of macroalgae and seagrass, the Braun-Banquet scale was applied (Molina-Hernández and Van Tussenbroek, 2014).
Seagrass data from four stations of the Caribbean Coral Reef Productivity Program (CARICOMP) in Puerto Morelos (1993-2016; CARICOMP, 2001; Rodríguez-Martínez et al., 2010; van Tussenbroek et al., 2014; Cortés et al., 2019) (Figure 1) were used to obtain data on the structure of the meadow, particularly to complement the data to estimate the Leaf Area Index (LAI) of the seed pixel points.
For the climax seagrass Thalassia testudinum, data from two periods were used, 1997 to 2000 (twice a year) and 2014 to 2016 (once a year). Six samples were taken at each of the monitored stations for each date. Foliar shoots were sampled in 10 x 20 cm quadrats to obtain the following parameters: shoot density/m2, foliar dry weight (above-ground biomass) per m2, the number of leaves per shoot, and the length and width of each leaf. The mean length of the 2nd youngest leaf per shoot per sample was considered to be equivalent to the height of the canopy, as this is a fully grown leaf on a shoot.
For the seagrass Syringodium filiforme, data from 1993 to 2000 (twice a year) and 2014 to 2016 (once a year) were used, and 3 core samples (20 cm diameter) were taken at each station to obtain leaf density per m2 and foliar dry weight (above-ground biomass) per m2. The lengths and diameters of the longest 10 leaves in a sample were measured. The mean length of these leaves was considered equivalent to canopy height.
Since the CARICOMP project did not monitor the pioneer seagrass Halodule wrightii, data on this species were obtained from Molina-Hernández and Van Tussenbroek (2014) and unpublished data from the same reef lagoon, surveyed between 2011 and 2015 (once a year) with a 11.2 cm diameter core. The data obtained were: shoot density/m2, leaf density per m2 and foliar dry weight (above-ground biomass) per m2. In each foliar shoot evaluated, the length and width of the 2nd youngest leaf were recorded and the mean length in each sample was considered to be equivalent to the height of the canopy.
The data obtained in the study area (points of seed pixels) were canopy height (in meters) and shoot density (shoots/m2). As data on leaf width/diameter (Wm and Dm) and number of leaves per shoot were needed for the calculation of LAI, median data from long-term monitoring were used to obtain these parameters. For T. testudinum and H. wrightii tape-like leaves were considered, and the equation (1) was applied:
As S. filiforme leaves are cylindrical, the leaf area index was calculated as canopy height multiplied by the area of half a cylinder obtained by the median leaf diameter (Dm) (equation (2)). It was considered that each shoot contains only 1 leaf equivalent to the height of the canopy.
LAI gives the total leaf area per seabed area (m2/m2) and is usually reported as unitless, a convention used throughout the manuscript.
To test LAI estimates, using median data of width/diameter and number of leaves per shoot, the same equations were applied to the long-term monitoring data. This estimated LAI was correlated with the leaf biomass data (for the 3 species), since the LAI must reflect the leaf biomass (Lebrasse et al., 2022). The coefficient of determination R2 was used to verify the goodness of fit. In the case of T. testudinum, long-term monitoring data allow the calculation of real LAI, which is the sum of the total leaf area (total length (L) multiplied by the total width (W)) in a sample with n leaves (equation (3)).
The first step in separating the seed pixels into classes was to analyze the proportional cover of sediment, algae and seagrass. Data were analyzed with Rstudio software. No normalization was applied to the data, since they are percentages. A cluster analysis using Bray-Curtis distance was performed to group the sites with similar cover characteristics. Then the seed pixels were explored, including the other parameters (seagrass density, algae density, canopy height, sediment cover and LAI). A detailed analysis was carried out for each sample point in order to establish the final class according to previous analyses, called multiparameter classes. For each point, a polygon was generated, encompassing 4-6 pixels, to classify and validate the map.
Based on the different ranges defined in the multiparameter classes, LAI and sediment cover classes were defined, to allow maps using multiparameter seeds to be compared with maps using only one parameter (such as the LAI or the percentage of sediment coverage).
Two algorithms were used to produce the maps of the different classes defined, based on pixel classification. Both algorithms were used to classify the benthic communities, such as seagrasses (Lyons et al., 2011; Effrosynidis et al., 2018; Pham et al., 2019; Rende et al., 2020). The first, Maximum Likelihood (ML), classifies the data assuming a normal distribution of the pixels, and calculates the likelihood of them belonging to one class or another. The second algorithm, K-nearest neighbors (KNN), is a non-parametric method that assumes similar things exist in proximity and compares nearest neighbors to assign a pixel to a class. Within each class, 70% of the seed pixels were randomly defined for supervised classification. To verify the accuracy of the maps, the remaining 30% of the seed pixels were used as ground-truth ROIs module in ENVI 5.3 software, to generate a confusion matrix. In addition to the assessment of User’s and Producer Accuracy for individual classes, this analysis estimates indicators of classification accuracy, overall accuracy and Kappa coefficient.
The median leaf width of all CARICOMP samples (Wm) was 0.94 cm (IC95% 0.02 cm) and the median number of leaves per shoot was 1.89 (IC95% 0.04). The linear regression between the real LAI values and the above ground biomass (Figure 3A) showed a high correlation (R2 = 0.95).
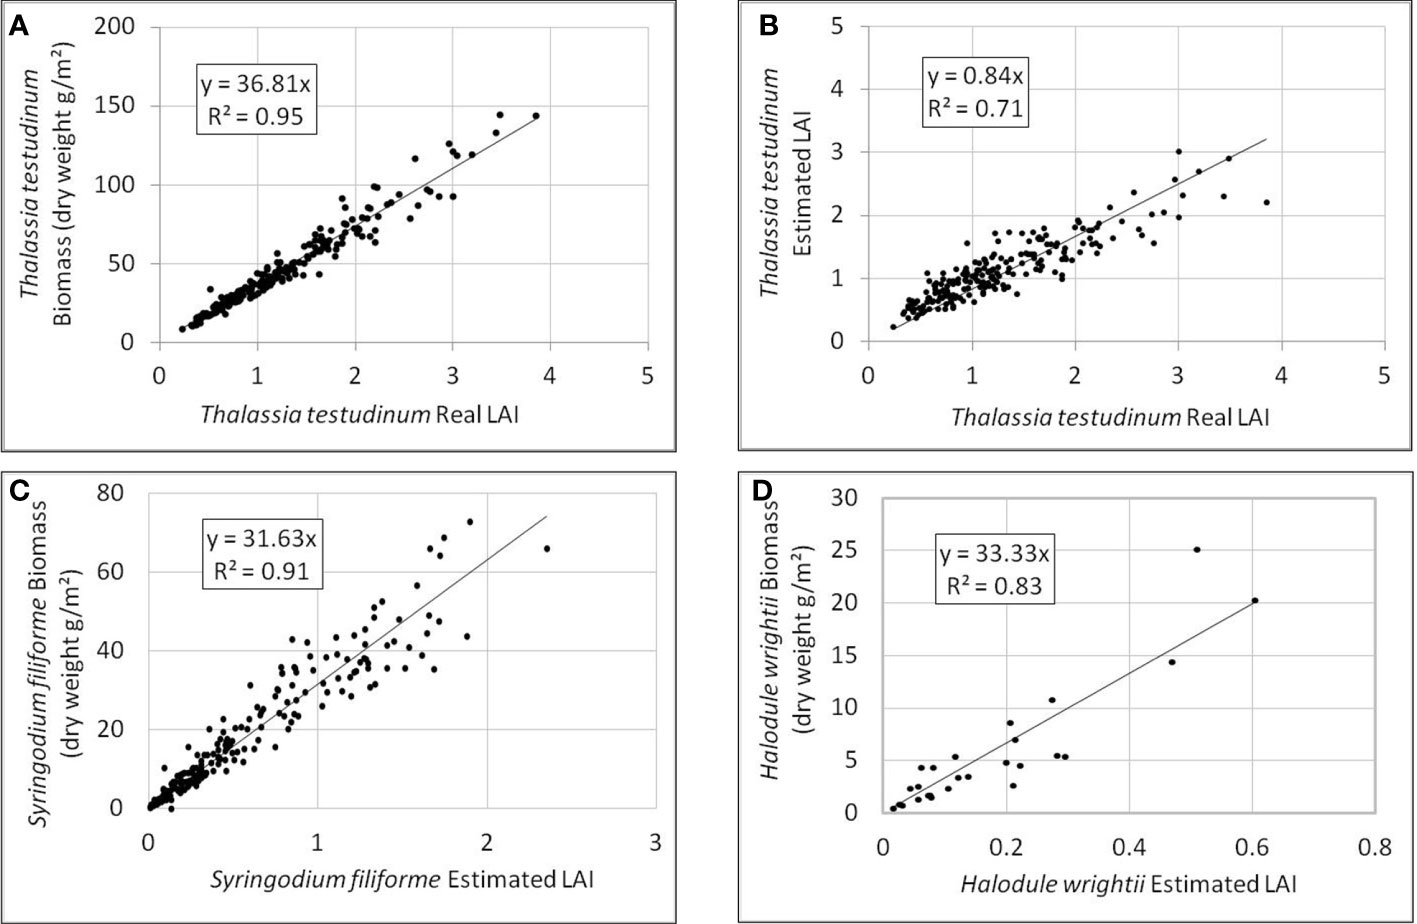
Figure 3 Relationships to verify the estimation of LAI. For Thalassia testudinum data (n data = 206) (A) real LAI vs above-ground biomass; (B) real LAI vs estimated LAI (using fixed values of leaf width (0.94 cm) and number of leaves/shoot (1.89). For the other species, relationship between estimated LAI and above-ground biomass for: (C) Syringodium filiforme (n data = 215); (D) Halodule wrightii (n data = 26).
The linear regression between the real LAI and the estimated LAI (determined from mean shoot density and canopy height) showed a strong correlation (R2 = 0.71) (Figure 3B). Although the estimated LAI is slightly underestimated, it was considered sufficiently precise to estimate the LAI of seed samples.
The median leaf diameter (Dm) of all CARICOMP samples was 1.3 mm (IC95% 0.02 mm). Using these data, the LAI was estimated applying the equation (2). Unfortunately, there were not enough data to calculate the real LAI for this species and compare it with the estimated LAI. Nevertheless, correlation of the linear regression between the estimated LAI and above ground biomass was very strong (Figure 3C, R2 = 0.91) showing that the estimate of the LAI closely represents above ground biomass.
The median leaf width of all samples (Wm) was 0.87 mm (IC95% 0.05 mm) and the median number of leaves per shoot was 2.0 (IC95% 0.1). The estimated LAI, using equation (1), was compared with above ground biomass by a linear regression (Figure 3D).
The species of seagrasses analyzed were those commonly found in the Mexican Caribbean, T. testudinum, S. filiforme and H. wrightti. The general characteristics of depth, seagrass shoot density, canopy height, seagrass estimated LAI, algae density and sediment cover percentage, for all the points sampled, are shown in Supplementary Figure 1.
The depth of the sample points varied between 0.9 and 7.8 m. The highest shoot densities were found in an H. wrightii monospecific meadow near the coast (6528 shoots/m2), and in S. filiforme-dominated meadows (over 3000 shoots/m2). The highest density of T. testudinum was found in a monospecific meadow near the coast (1920 shoots/m2). Canopy height showed great variation (4 - 50 cm). In some points quite high densities of algae were seen (more than 1000 thalli/m2).
In terms of shoot density, S. filiforme dominated (in ~70% of the samples with seagrass, Figure 4A). However, in terms of estimated LAI, T. testudinum dominates in ~ 74% of the samples with seagrass (Figure 4B). Nevertheless, the contribution of S. filiforme in the total LAI is important, dominating in 16% of the samples (15 of the 93 points with seagrass had over 50% LAI) and contributing to over 15% of the LAI in an additional 45% of the samples (42 of the 93 points with seagrass).
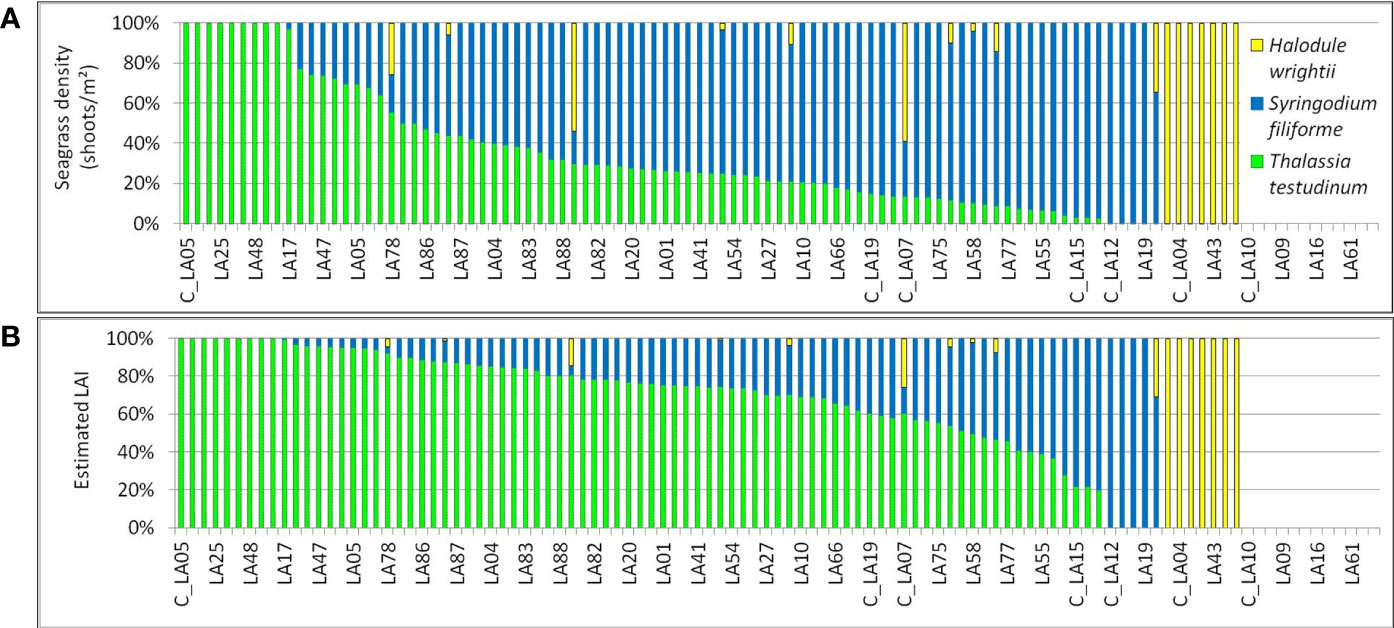
Figure 4 Percentages of seagrass species found in the study area, based on: (A) recorded density; and (B) estimated LAI.
A good correlation between LAI and sediment cover was found (logarithmic, R2 = 0.79, Figure 5).
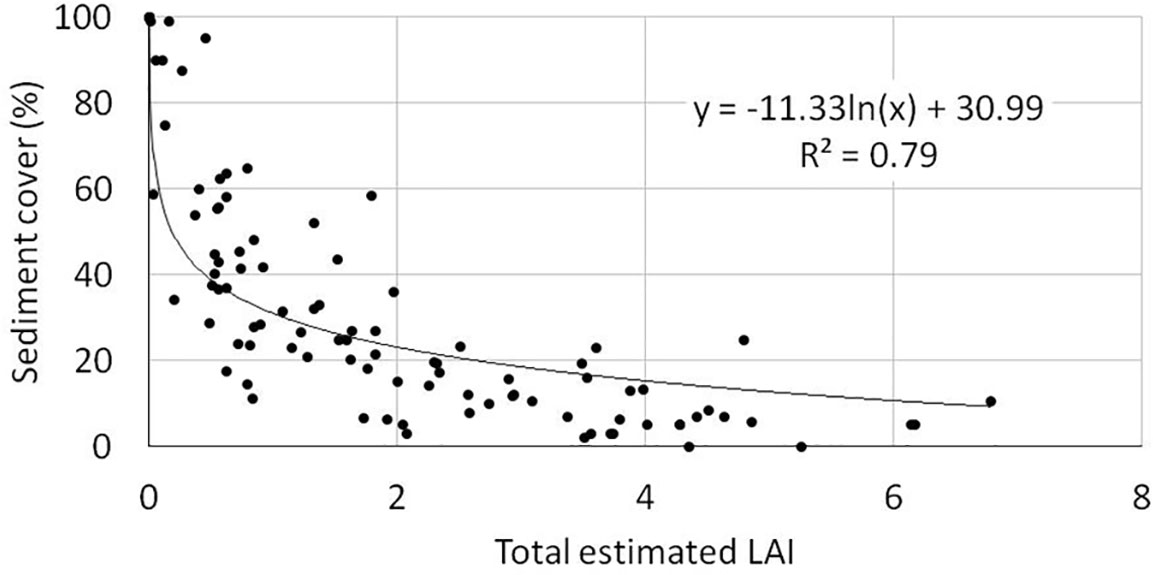
Figure 5 Relationship between total estimated LAI and bottom sediment cover (n=105).
For the study area, four multiparameter classes of bottom cover were defined through the cluster analysis (Supplementary Figure 2). Taking into consideration the density of seagrass and algae (green, brown, red and cyanophytes), canopy height and estimated LAI, 8.6% of the seeds (9 seeds) changed to another, more accurate, class cluster. The separation of species in the class definition process was not feasible, mainly because the seagrass meadows of this study area were usually mixed albeit with differing specific dominance, and in addition species had similar spectral signatures (Thorhaug et al., 2007; Hedley et al., 2017).
The classes and their characteristics (Figures 6, 7) were:
i. C1 (Dense seagrasses) seagrass beds, mainly T. testudinum and S. filiforme, with high density (average 2598 shoots/m2) and relatively higher canopy height (between 12 and 50 cm; average 27 cm), with none or few algae (average density of 292 thalli/m2). The mean estimated LAI was 3.4 ± 0.4 (95% CI). Average sediment coverage was 10%.
ii. C2 (Dense mixed vegetation) seagrass density was slightly lower than class C1 (mean 1716 shoots/m2), as was canopy height (between 9 and 23 cm; mean 15 cm), with slightly higher density of algae with an average of 578 thalli/m2. Mean sediment coverage was 24%, and mean estimated LAI of seagrasses was 1.5 ± 0.3.
iii. C3 (Low density seagrasses and algae) with measured seagrass density of 804 shoots/m2 and algae density of 331 thalli/m2. The canopy height between 7 and 17 cm (average 12 cm) and the estimated LAI was 0.8 ± 0.2. The sediment was more exposed, with an average coverage of 50%.
iv. C4 (Sediment) bottoms with very low seagrass or algae coverage, average sediment coverage of 96%. Occasionally, vegetation was present, usually H. wrightii with a mean LAI ( ± 95% CI) of 0.05 ± 0.06.
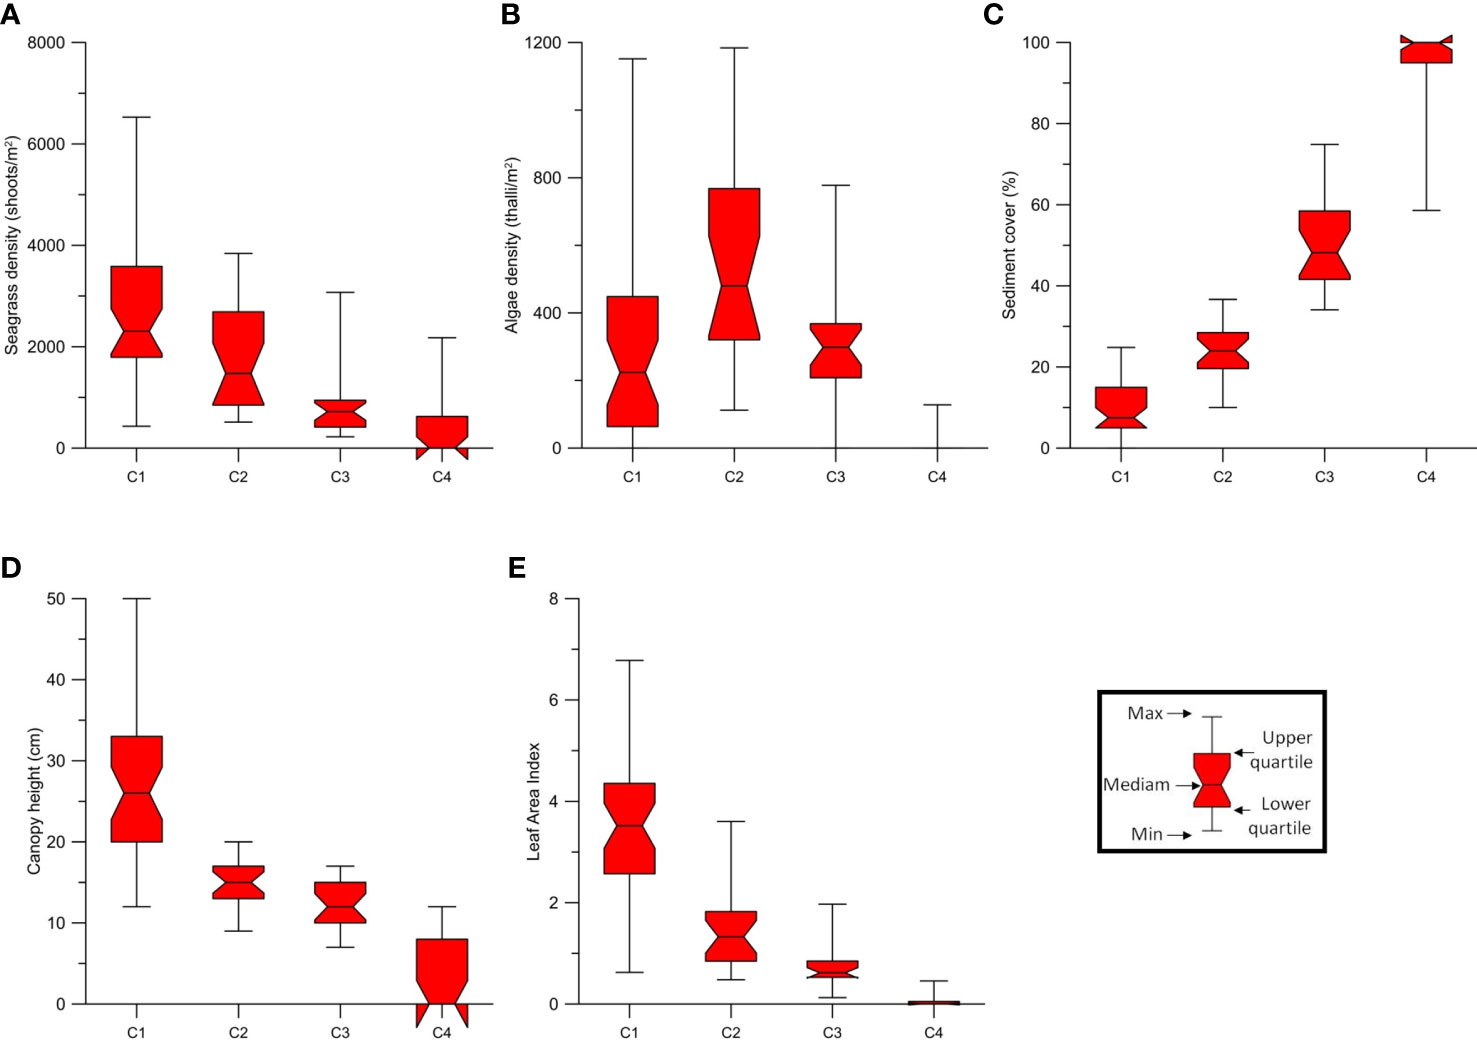
Figure 6 Characteristics of each multiparameter classes C1 (Dense seagrasses), C2 (Dense mixed vegetation), C3 (Low density seagrasses and algae) and C4 (Sediment) relative to: (A) seagrass density; (B) Algae density; (C) Sediment cover; (D) Seagrass canopy height; (E) Estimated Leaf Area Index (LAI).
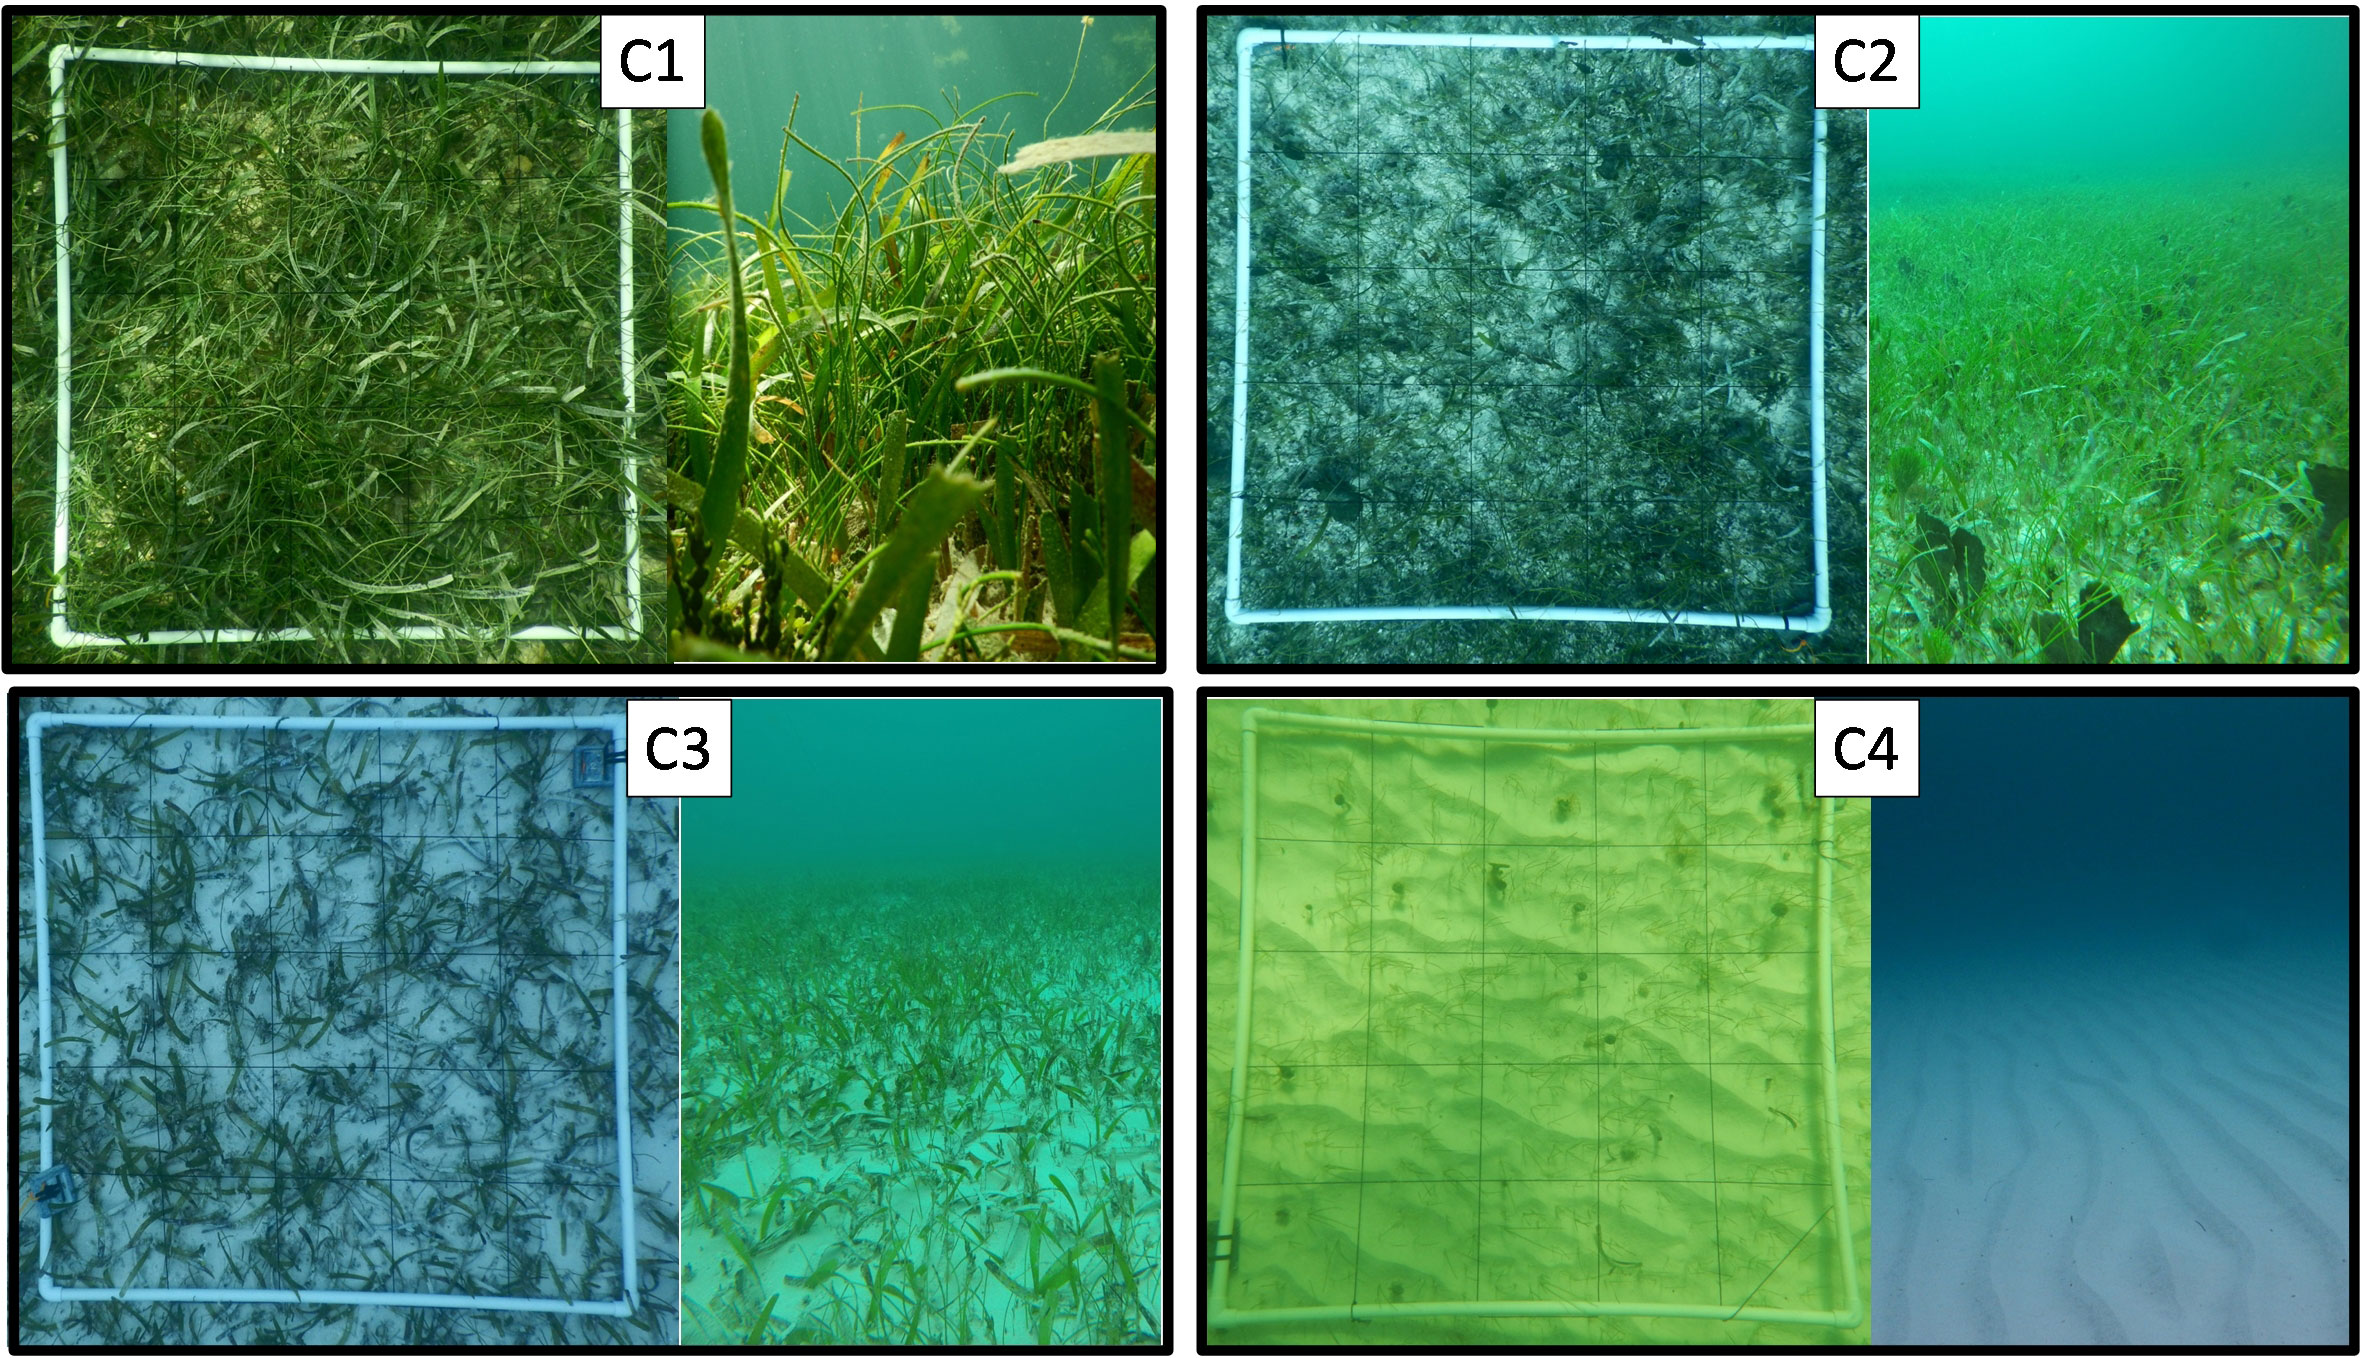
Figure 7 Examples of each multiparameter classes: C1 (Dense seagrasses), C2 (Dense mixed vegetation), C3 (Low density seagrasses and algae) and C4 (Sediment).
To compare the different seed class criteria, the classes using LAI and sediment cover data were defined based on the value ranges of each parameter (Table 1) verified in multiparameter classes, for the upper and lower quartiles (Figure 6).

Table 1 Value range of LAI and sediment cover to define the classes.
The classified maps obtained with the multiparameter criteria are presented in Figure 8, and visually, the differences obtained by the two different classification algorithms were minimal (Table 2). The accuracy of both maps is very high (~90%), although the K-nearest neighbors (KNN) algorithm is more accurate than Maximum likelihood (ML), since KNN gave higher values of overall accuracy (91.05%), Kappa (0.88) and user accuracy (77-97%).
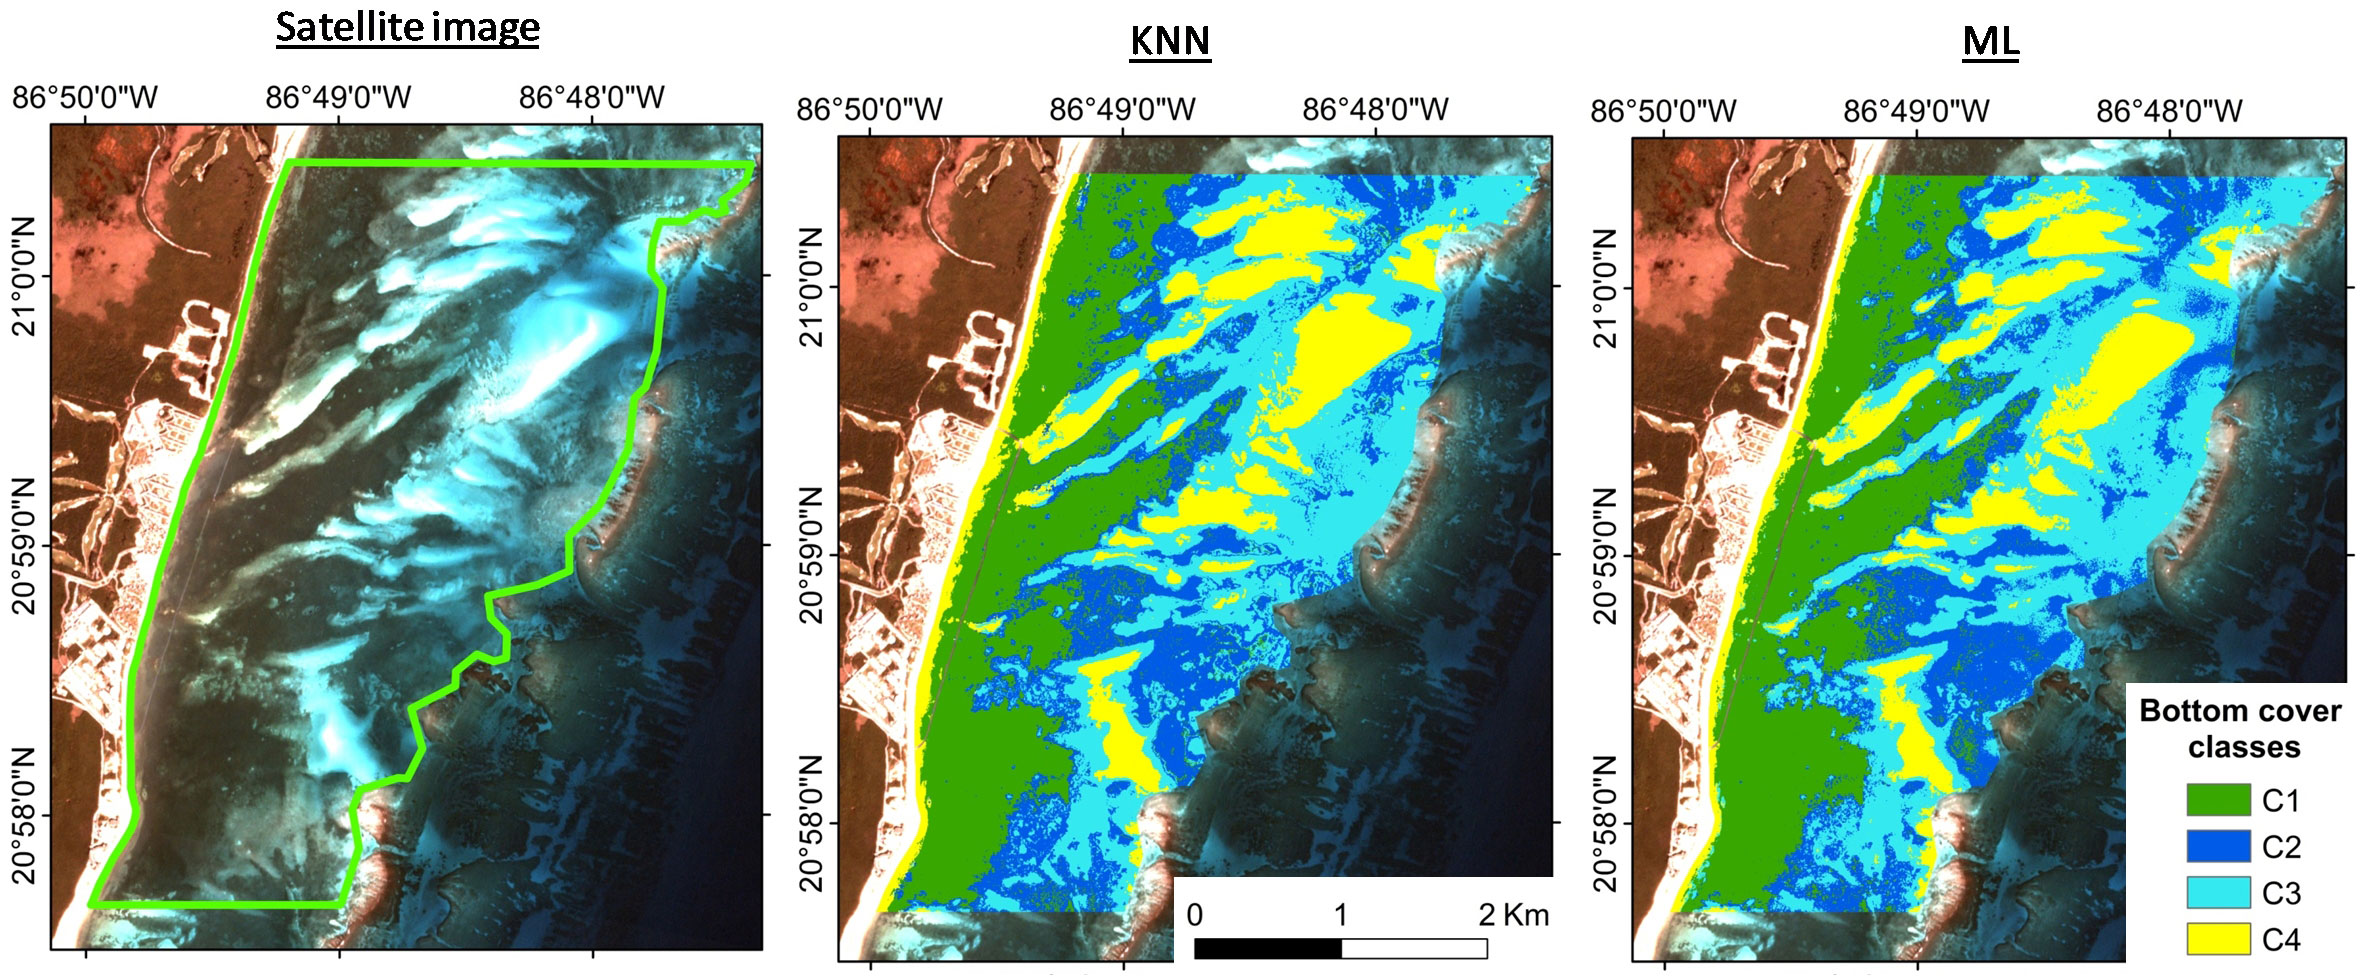
Figure 8 Supervised classification results obtained with multiparameter seeds, using K-nearest neighbors (KNN) and Maximum likelihood (ML) algorithms.
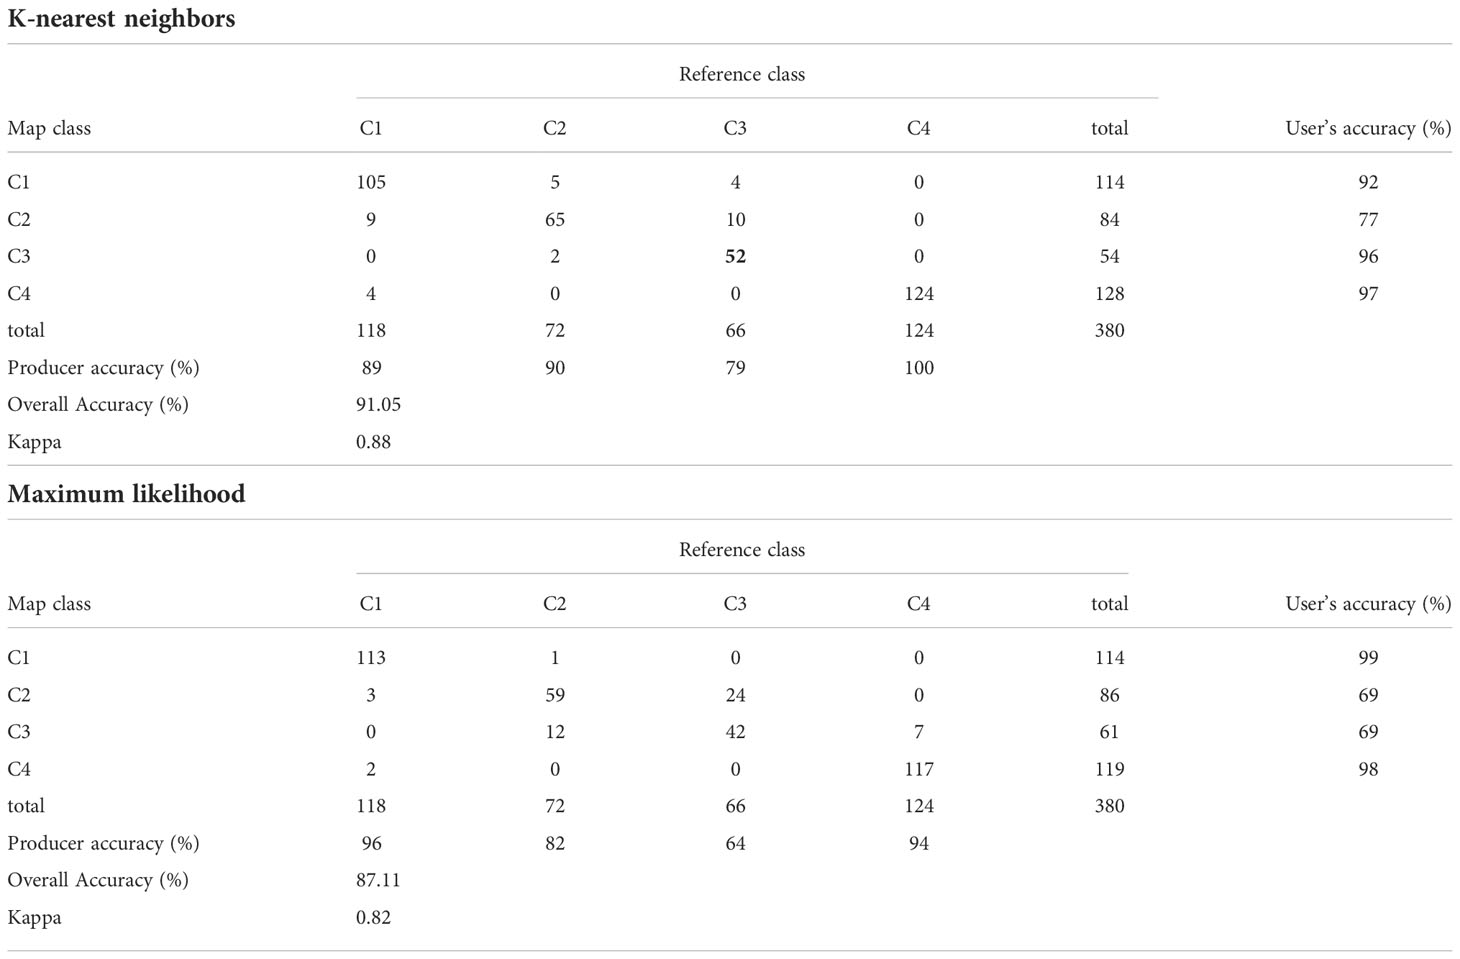
Table 2 Confusion matrix obtained as result of supervised classification using multiparameter seeds applying K-nearest neighbors and Maximum likelihood algorithms.
When evaluating the confusion matrix, class C2 presented the lowest probability that a pixel belonged to this class (user’s accuracy =77% and 69% respectively for KNN and ML), erroneously including pixels that corresponded to class C1 or C3. Algorithms misclassified class C3 as C2 for most pixels (producer accuracy =79% and 64% respectively for C3 for KNN and ML).
When the classification was carried out using the seeds only with sediment cover or LAI data, the overall accuracy of the maps was lower (~70% and ~80%, respectively) than using multiparameter seeds. The algorithms were not able to correctly classify the intermediate classes (C2.1; C3.1; C2.2 and C3.2), as indicated by less than 45% of producer accuracy (Table 3 for KNN algorithm and Supplementary Table 1 for ML algorithm). The accuracy of each class in the maps, indicated by the user accuracy, also had lower values than the multiparameter map. The classification, using seeds determined by the percentage of sediment, seems to overestimate class C4.2, classifying mainly C3.2 as C4.2 (e.g. user accuracy = 82% for C4.2, KNN algorithm, Table 3). Figure 9 shows the comparison between the map obtained with multiparameter seeds, LAI seeds and sediment cover seeds, using the most accurate KNN algorithm and the classes were better defined with the multiparameter seeds. Classification maps for sediment and LAI seeds, using the ML algorithm, are presented in Supplementary Figure 3.
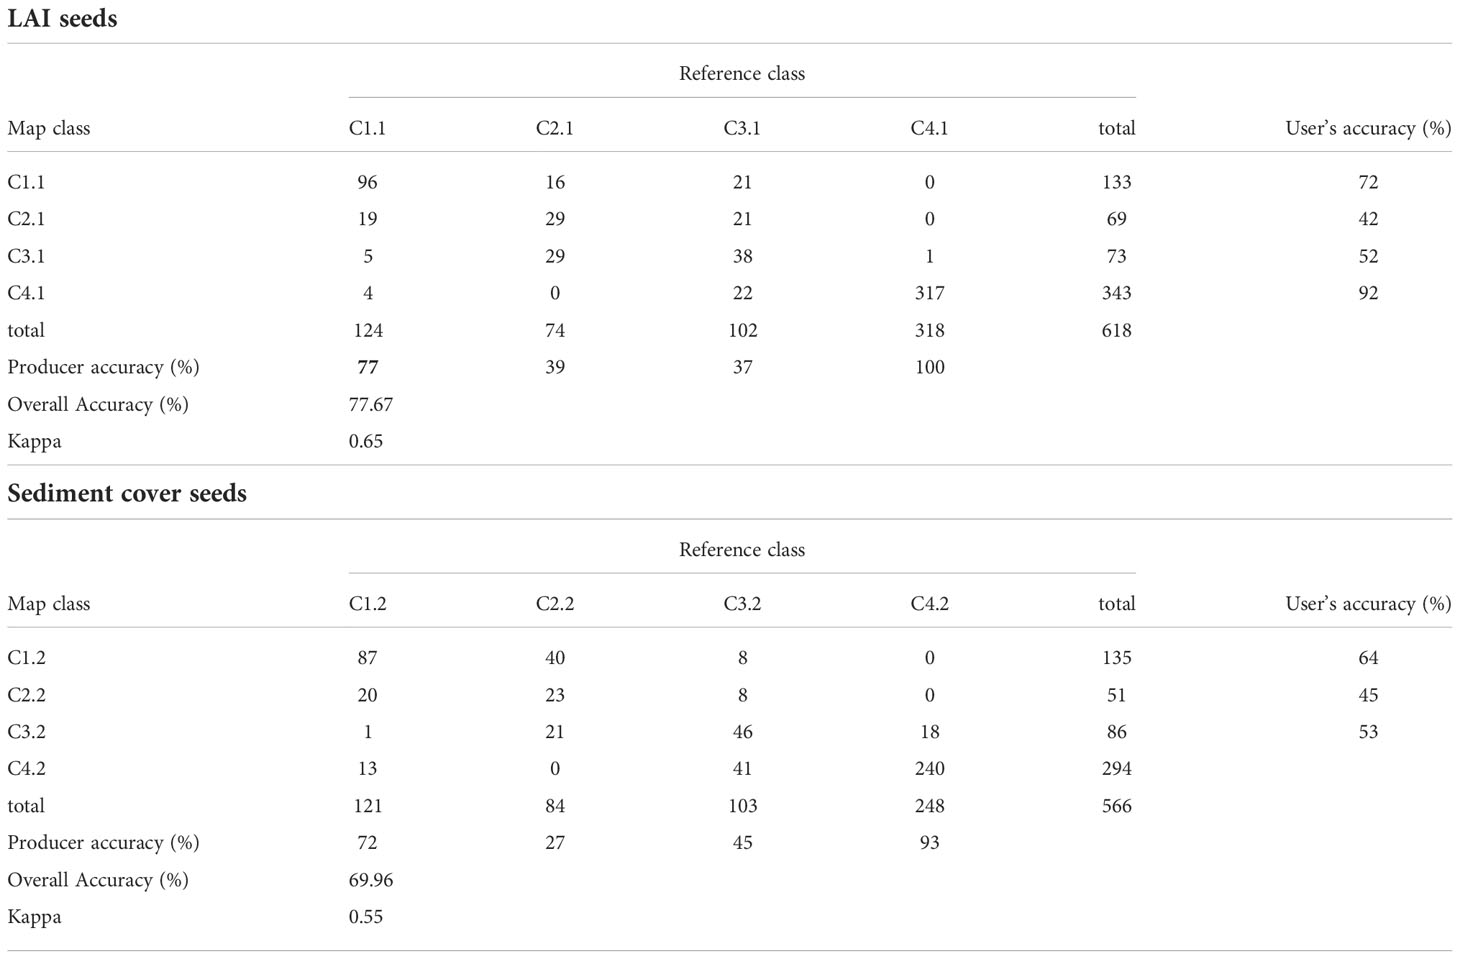
Table 3 Confusion matrix obtained with KNN supervised classification, for different seed criteria.
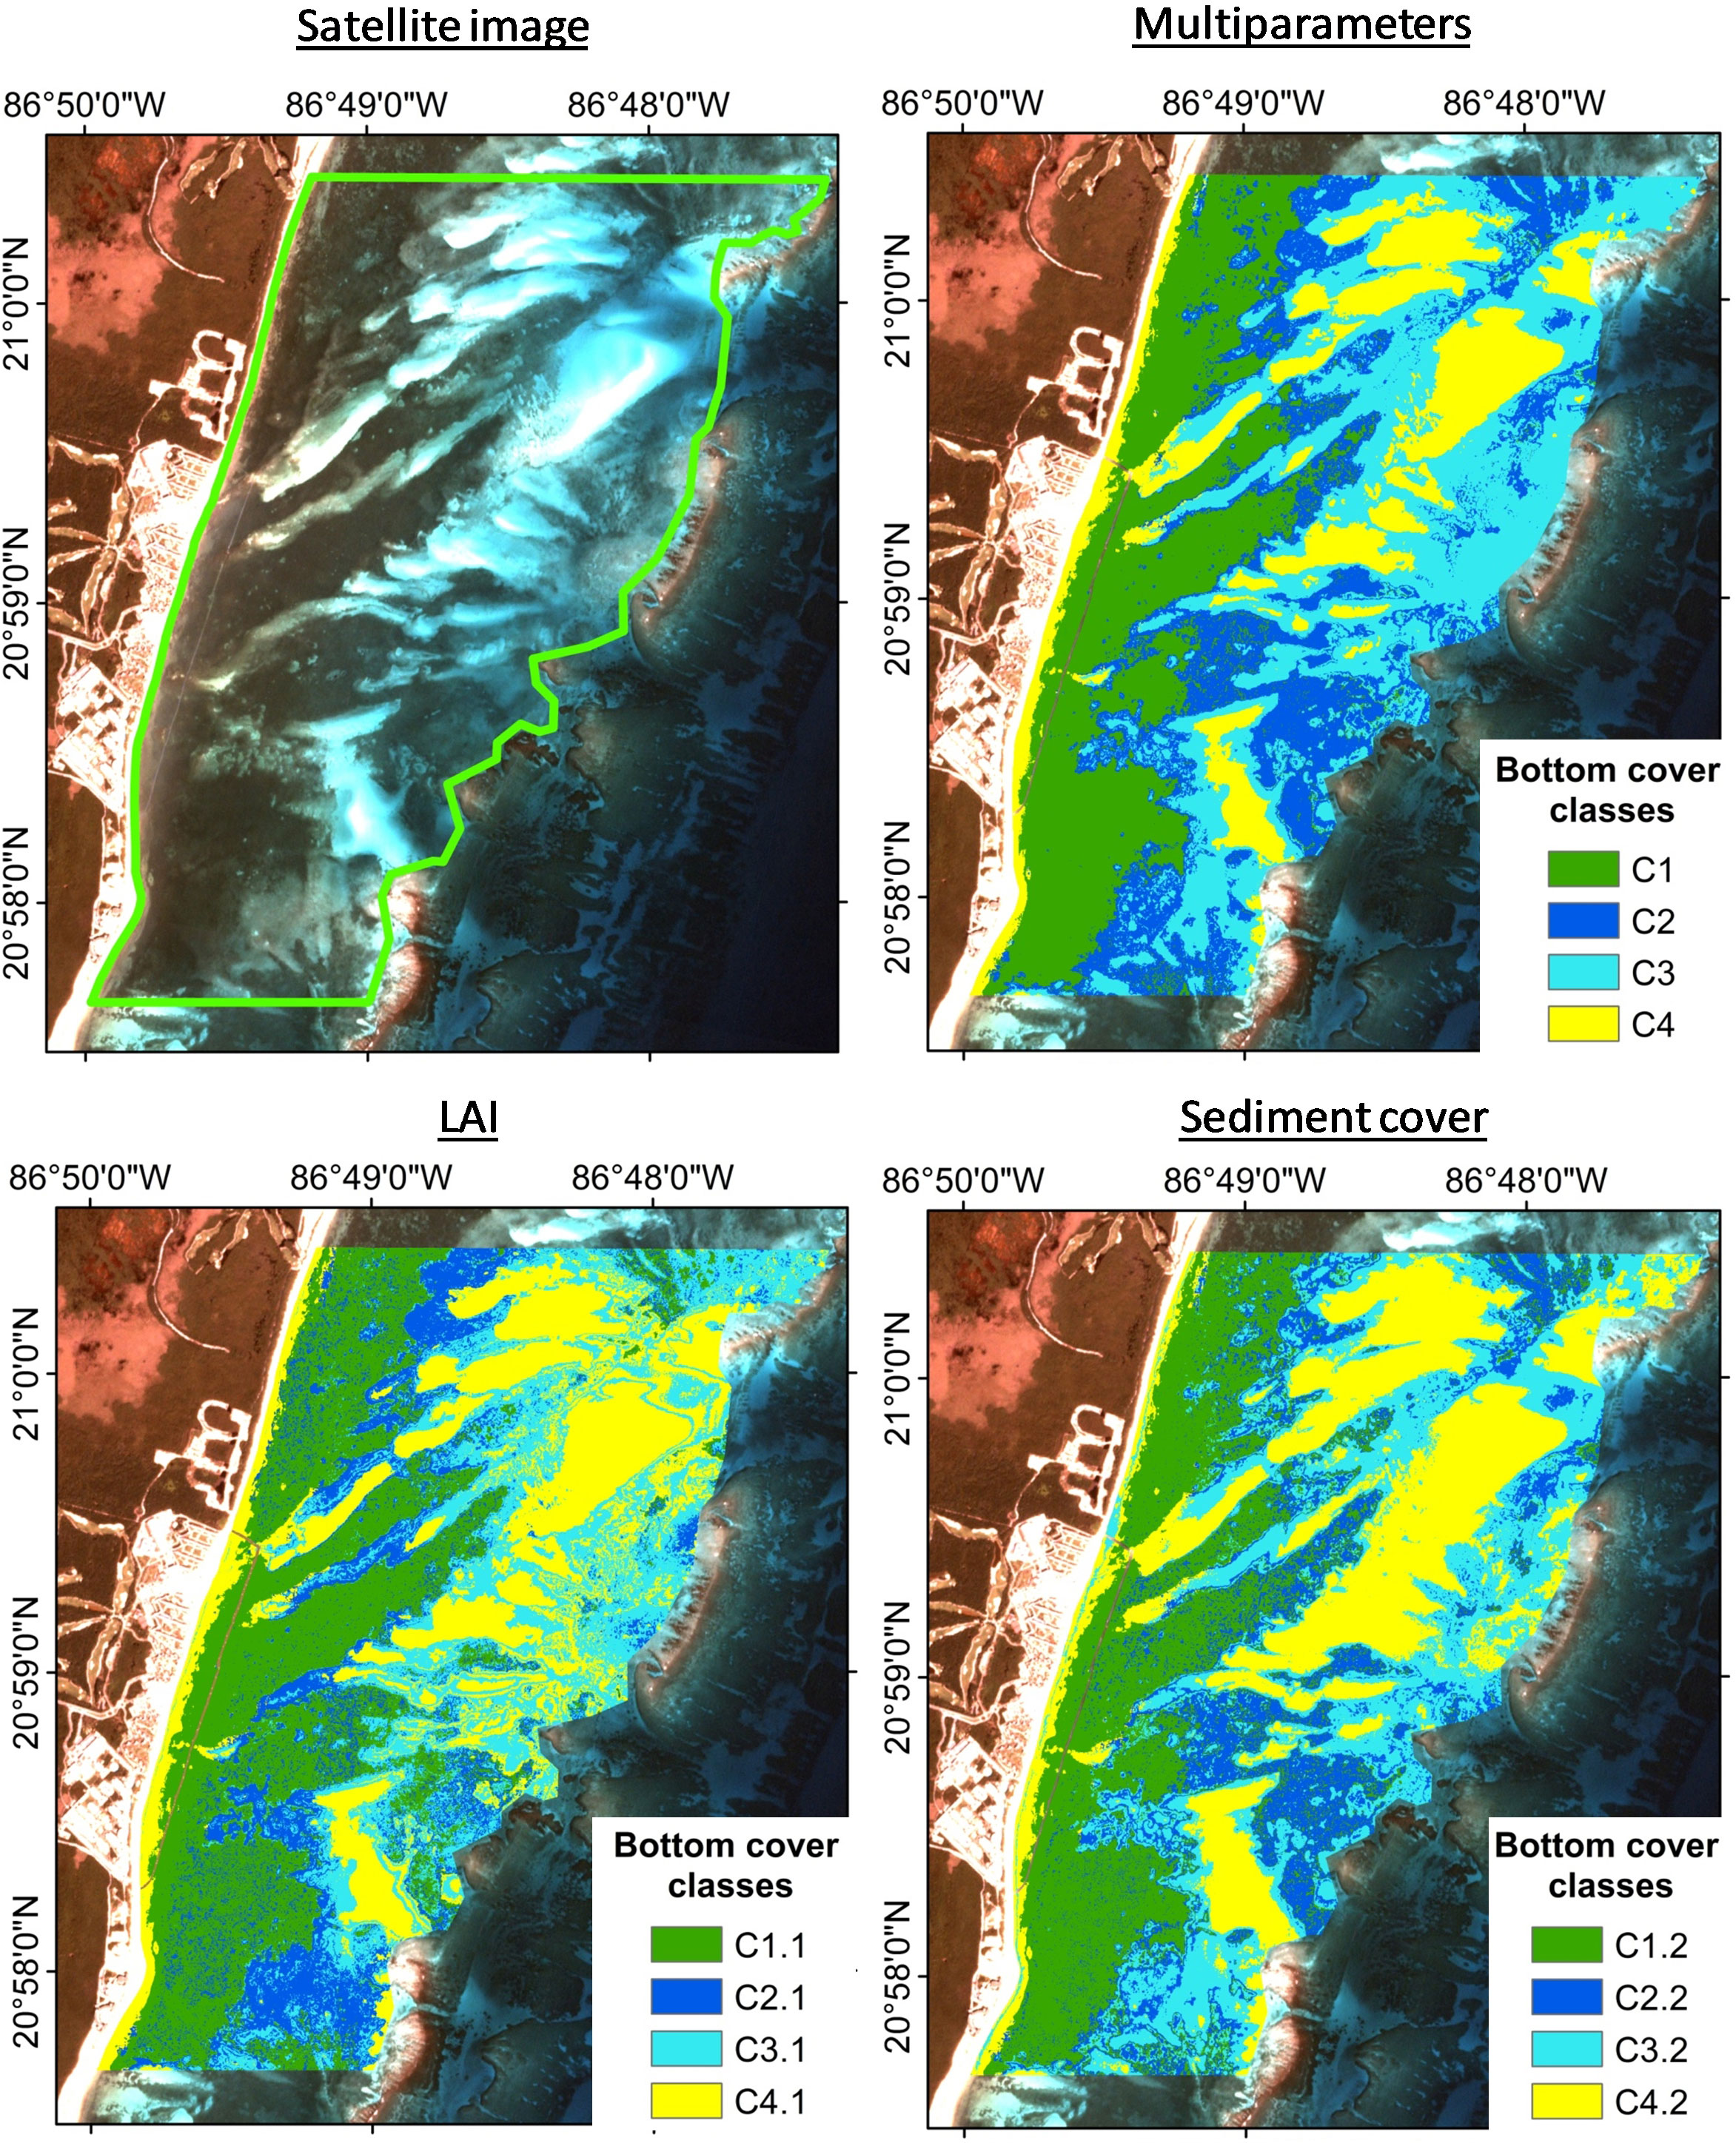
Figure 9 Comparison of supervised classification results obtained with multiparameter seeds, LAI seeds, and sediment cover seed, using the KNN algorithm.
Approximate foliar biomass was calculated, as LAI map application example. Foliar biomass was derived from linear fit equations of dry biomass as a function of LAI, per species (Figures 3A, C, D) at each of the seed points (Supplementary Figure 1). From the classification map, based on LAI data (Figure 9 and Supplementary Figure 3), the total area of each class was obtained and the mean value of biomass for each class was applied to estimate the leaf biomass of the study area (Table 4). The results indicate that there are approximately 670-710 tons (dry weight) of seagrass biomass above ground in the study area (12.5 km2).
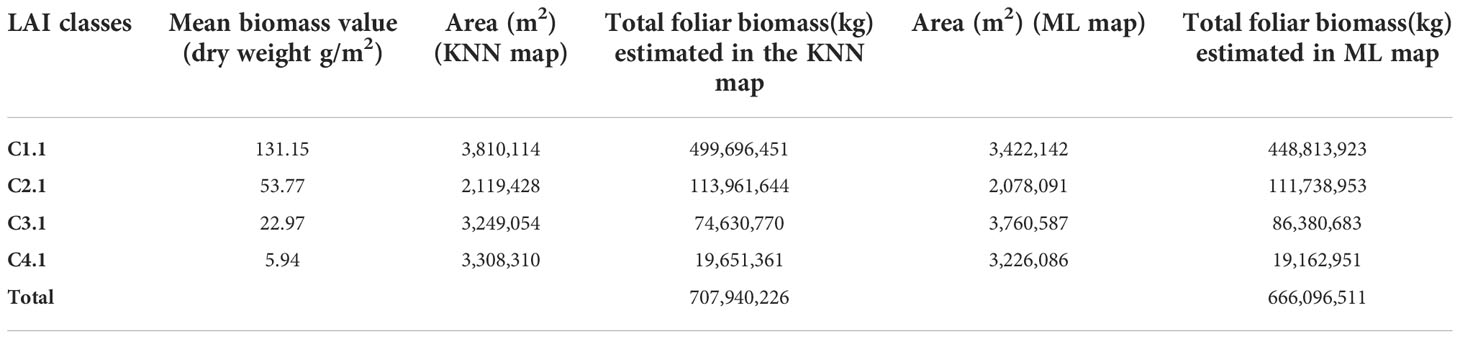
Table 4 Estimation of seagrass foliar biomass in the study area.
The spatial information obtained from mapping seagrass characteristics, using satellite images, is useful in coastal management and in decision making. Several scientific articles have published maps of seagrass cover obtained using satellite images (e.g. Roelfsema et al., 2009; Baumstark et al., 2013; Hossain et al., 2015; Coffer et al., 2020; Fauzan et al., 2021). In marine ecosystems, the use of PlanetScope satellite imagens has become a powerful tool for obtaining information about landscape characteristics and spatio temporal changes (Kim et al., 2015; Purnamasari et al., 2021). This is the first time that PlanetScope images were used to obtain maps of the mixed seagrass meadows in the Caribbean. These images have high spatial (3x3 m) and temporal resolution (daily) which is an advantage in detecting the spatio-temporal variability of coastal ecosystems, such as seagrass meadows (Wicaksono and Hafizt, 2013; Wicaksono and Lazuardi, 2018; Schill et al., 2021). Nevertheless, it is important to perform a detailed pre-selection of the scenes before analyzing the images (segmentation, classifications, indexes, etc.) and pre-processing, to overcome deficiencies in the products, for example, variation in radiometric and geometric quality (Frazier and Hemingway, 2021; Wicaksono et al., 2022). In this study, with PlanetScope images it was possible to classify four different types of bottoms covered with seagrass meadows. Seagrass meadows are often classified in only one or two categories; i.e. absent/present, as obtaining high-resolution images is difficult, or because the studies focus on mapping the coral reef system (Goodman et al., 2013; Wicaksono and Hafizt, 2013; Schill et al., 2021). This means that the complexity and variability of these ecosystems are lost and therefore, so too, the possibility of understanding more complex biophysical functions on seagrass meadows.
There are few articles that have included more complex parameters in mapping, such as LAI biomass or composition (Phinn et al., 2008; Dierssen et al., 2010; Wicaksono and Hafizt, 2013). No scientific publications on seagrass mapping using multiparameter-defined classes have been found. The multiparameter approach for the mixed, multi-specific meadow described here, allowed a more precise mapping of the meadow characteristics (such as shoot density and canopy height), important for further understanding of the seagrass landscapes, as well as the influence of extensive seagrass meadows on local biogeochemical, such as diurnal pH and O2 fluctuations (Berg et al., 2019; James et al., 2020) or organic carbon storage (López-Mendoza et al., 2020). This map also should provide data sets to support studies for understanding the influence of different seagrass/bottom classes in the local hydrodynamics, since these parameters can influence the friction and drag force exerted by seagrasses on the propagation of waves and currents and on sediment transport (Fonseca and Cahalan, 1992; Mendez and Losada, 2004; Chen et al., 2007; Paul et al., 2012). In the study area, it was possible to define four bottom classes with different characteristics (Figures 6, 7). These classes were defined based on seagrass, algae and sediment cover data mainly, but also on the density of seagrasses and algae, canopy height and the LAI at each point. This definition, to a certain extent, depended on the local characteristics of the seagrasses, and has to be determined separately for meadows in different settings or environments, but the accuracy of the maps was high, and the map provided spatially explicit data on general meadow structure, in addition to cover.
The determination of real LAI and foliar biomass requires destructive sampling. Median values of leaf width/diameter, number of leaves per shoot, and the relationship between LAI and foliar biomass, obtained from long-term monitoring data, can be used for a reasonably reliable estimate of LAI and leaf biomass based only on shoot density per species and canopy height, which can be obtained in a non-destructive manner. The estimated LAI of Thalassia testudinum, from median data of leaves width, median number of leaves per m2, shoot density and canopy height, compared well to the actual LAI (Figure 3B). However, such detailed verification was not possible for Syringodium filiforme and Halodule wrightii, but the good relationship between dry foliar biomass and estimated LAI (Figures 3C, D) indicated that the estimation is likely a good one, as LAI and biomass are usually closely related (Lebrasse et al., 2022). Dierssen et al. (2010) found a strong correlation between LAI and seagrass shoot density for meadows in the Bahama Banks (with R2 0.83). To prove the influence of seagrass density in the variability of real LAI, this was examined for CARICOMP data (for T. testudinum, Supplementary Figure 4), but their relationship were weak. The lengths of the leaves greatly influence LAI and this must be taken into account, especially when the lengths vary greatly in the target area, as is the case in this study (van Tussenbroek, 1995). Another important point to consider is that S. filiforme was present at almost all seed pixel stations and, despite its high density, its LAI is lower than that of T. testudinum. In other words, in a mixed meadow, the canopy height, shoot density and estimation must be considered for each species, separately, to obtain a reliable estimation of LAI. It is worth emphasizing that a good inverse relationship (logarithm) has been found between LAI and the percentage of sediment cover. Using this relationship would help to estimate the LAI at the community level, similar to the work done by Wicaksono and Hafizt (2013). However, the percentage of sediment cover can also be influenced by the cover of algae or organic matter on the bottom, and may not reflect the LAI of seagrass alone.
In the study area, T. testudium dominated when considering LAI (and foliar biomass), but S. filiforme had the highest shoot density (Figure 4). T. testudinum has the greatest resistance to hurricane events, and it is most effective in providing services such as coastal stabilization, due to its deep root structure and large biomass above, and below ground (van Tussenbroek, 2011; van Tussenbroek et al., 2014). However, the relative importance of this species is decreasing in many areas, including the study area, due to ongoing eutrophication or increasing turbidity (van Tussenbroek, 2011; van Tussenbroek et al., 2014). In the study area, groundwater discharges through submarine springs (Carruthers et al., 2005; Hernández-Terrones et al., 2011) and the massive sargasso influxes (van Tussenbroek et al., 2017) are of special concern. The maps obtained in this study provide baseline information on the seagrass meadows, to document possible changes in the meadow due to environmental pressures. This type of monitoring is important, as such changes can bring serious local consequences, such as lower resilience to hurricanes and major storms, as well as changes in the associated biota. Increasing dominance of less robust species, such as S. filiforme (with possible consequences for system structure, functioning and resilience), cannot be determined by remote sensing alone. The study by Hedley et al. (2021) carried out in the same system supposed a T. testudinum dominated vegetation, which is still correct, but may be changing in the future due to continuing pressures on this system. This only exemplifies the need for continuous ground truthing, as already proposed by Neckles et al. (2012).
The multiparameter maps obtained through the supervised classification method showed that class C1 (Dense seagrasses) was closer to the coast, interrupted by bare areas of submarine dunes (class C4). As they migrate inland, these submarine dunes bury the seagrass meadows. Some areas of these submarine dunes, as well as their edges, were covered with vegetation of class 3 (low density seagrasses and algae). Class C3 vegetation was also found in the shallow (up to 4 m) back reef area, with T. testudinum dominating, though with reduced canopies, due to the environmental conditions, such as higher hydrodynamic forcing and lower nutrient contents of the sediments (van Tussenbroek, 1995). A narrow strip of unvegetated seabed (C4 class), was found closest to the shore, landward of the dense seagrass (C1 class). This abrupt change from bare soil to highly productive seagrass beds at the shore was observed in the study area by Enríquez et al. (2019) and is thought to be a consequence of sargasso brown tides (van Tussenbroek et al., 2017). The loss of dense nearshore meadows probably means further destabilization of the coast (James et al., 2019). Class C2 was found in the transition zones between class C1 and C3 areas, or near the barrier reef at greater depths (average 6m), where dense seagrasses and algae occurred. Macroalgae were mostly ignored in the classifications, due to the difficulty of distinguishing them with remote sensing techniques (Wicaksono and Lazuardi, 2018). Nevertheless, using the multiparameter method and a detailed analysis of the seed pixels, it was possible to obtain a good classification with low class confusion (Table 2). Further incorporation of macroalgae in classification may be useful in future monitoring, as changes in macroalgae cover could indicate disturbances in this community (van Tussenbroek, 2011; van Tussenbroek et al., 2017), with consequences on the stabilization of sediments and coastal protection from hurricanes (Cruz-Palacios and van Tussenbroek, 2005).
Classification maps that use only sediment cover, or LAI values, proved to be less accurate than the multiparameter-based map, but their accuracy was still acceptable. They have the advantage of using ranges to define classes, making them less subjective, but the algorithms do not make clear the class separations with these ranges, mainly for intermediate classes (2 and 3), which presented low values of producer accuracy (< 50%). These maps can be useful for monitoring seagrasses, and in helping to define suitable areas for restoration projects. An example of its use is the foliar biomass estimation did for the study area, based on the LAI class map and the relationships of LAI with biomass (Table 4). An above ground biomass of 700 tons implies 245 tons of organic carbon stock in the leaves alone, using the conversion factor (from dry weight to organic carbon) of 0.35 proposed by Fourqurean et al. (2012). As they comprise on average only 11.1% of total biomass in the area (CARICOMP data), the total estimated organic carbon stock in live seagrass tissue was in total 6300 tons in the study area (12.5 km2), without considering the likely larger organic carbon stock in the sediments (López-Mendoza et al., 2020), showing that higher precision maps, can aid in obtaining better estimates of organic carbon stocks in seagrass meadows.
The presented tool in this study, to determine seagrass meadows structure (cover percentages of seagrass/algae/sediment, seagrass shoot densities, canopy heights and LAI) and its distribution along the coast, based on satellite images, has immediate application in understanding the hydrodynamics associated with seagrass meadows. Further information on the role of seagrass in controlling wave energy, when coupled with specific local data on its distribution allows field measurements of waves and currents to be better planned. Similarly, hydrodynamic numerical modelling may be more realistic and accurate if the proper drag and damping coefficient maps reproduce accurately the seagrass distribution. If a time series of satellite images exist, then the maps can also be updated in time using long-term numerical runs. The tool is also useful for coastal management, as coastal protection strategies depend on knowledge of the submerged ecosystems. Nature-based solutions, often involving seagrass restoration, as well as ecosystem conservation, will benefit from spatial explicit information, for proper planning as well as monitoring of effectiveness of implemented measures.
The raw data supporting the conclusions of this article will be made available by the authors, without undue reservation.
LA, RS, EM and BT contributed to conception of the study. LA and SVA-M performed the field work and data analysis. BT provided historical data from long-term monitoring of seagrasses. LA wrote the first draft of the manuscript. All authors contributed to the article and approved the submitted version.
The study received financial support of DGAPA (Dirección General de Asuntos del Personal Académico, UNAM, Project No. PAPIIT AG100321), the “Newton Fund Impact Scheme CONACYT-British Council 2019” - Project 318671 “Technology development towards sustainable marine current energy harvesting for coastal communities in Mexico” and CEMIE-Océano (CONACYT -SENER-Fondo de Sustentabilidad Energética project: FSE-2014-06-249795). The first author received a Postdoctoral Grant of DGAPA-UNAM.
Thanks to the Academic Service for Meteorological and Oceanographic Monitoring (SAMMO) of UNAM, especially to Edgar Escalante and Miguel Gómez Reali, and Guadalupe Barba-Santos for technical support. Thank you also to Moon Palace Resort for facilitating this investigation.
The authors declare that the research was conducted in the absence of any commercial or financial relationships that could be construed as a potential conflict of interest.
All claims expressed in this article are solely those of the authors and do not necessarily represent those of their affiliated organizations, or those of the publisher, the editors and the reviewers. Any product that may be evaluated in this article, or claim that may be made by its manufacturer, is not guaranteed or endorsed by the publisher.
The Supplementary Material for this article can be found online at: https://www.frontiersin.org/articles/10.3389/fmars.2022.1063007/full#supplementary-material
Barbier E. B., Hacker S. D., Kennedy C., Koch E. W., Stier A. C., Silliman B. R. (2011). The value of estuarine and coastal ecosystem services. Ecol. Monogr. 81, 169–193. doi: 10.1890/10-1510.1
Baumstark R., Dixon B., Carlson P., Palandro D., Kolasa K. (2013). Alternative spatially enhanced integrative techniques for mapping seagrass in florida’s marine ecosystem. Int. J. Remote Sens. 34, 1248–1264. doi: 10.1080/01431161.2012.721941
Berg P., Delgard M. L., Polsenaere P., McGlathery K. J., Doney S. C., Berger A. C. (2019). Dynamics of benthic metabolism, O2, and pCO2 in a temperate seagrass meadow. Limnol. Oceanogr. 64, 2586–2604. doi: 10.1002/lno.11236
CARICOMP (2001). CARICOMP methods manual, levels 1 and 2 (St. Petersburg Florida, U.S.A: CARICOMP Data Management Center: Centre for Marine Sciences, University of the West Indies, Mona, Kingston, Jamaica, and Florida Institute of Oceanography, University of South Florida).
Carruthers T. J. B., Van Tussenbroek B. I., Dennison W. C. (2005). Influence of submarine springs and wastewater on nutrient dynamics of Caribbean seagrass meadows. Estuar. Coast. Shelf. Sci. 64, 191–199. doi: 10.1016/j.ecss.2005.01.015
Chen S. N., Sanford L. P., Koch E. W., Shi F., North E. W. (2007). A nearshore model to investigate the effects of seagrass bed geometry on wave attenuation and suspended sediment transport. Estuaries. Coasts. 30, 296–310. doi: 10.1007/BF02700172
Coffer M. M., Schaeffer B. A., Zimmerman R. C., Hill V., Li J., Islam K. A., et al. (2020). Performance across WorldView-2 and RapidEye for reproducible seagrass mapping. Remote Sens. Environ. 250, 11203. doi: 10.1016/j.rse.2020.112036
Coronado C., Candela J., Iglesias-Prieto R., Sheinbaum J., López M., Ocampo-Torres F. J. (2007). On the circulation in the Puerto morelos fringing reef lagoon. Coral. Reefs. 26, 149–163. doi: 10.1007/s00338-006-0175-9
Cortés J., Oxenford H. A., van Tussenbroek B. I., Jordán-Dahlgren E., Cróquer A., Bastidas C., et al. (2019). The CARICOMP network of caribbean marine laboratories (1985-2007): History, key findings, and lessons learned. Front. Mar. Sci. 5, 1–18. doi: 10.3389/fmars.2018.00519
Cruz-Palacios V., van Tussenbroek B. I. (2005). Simulation of hurricane-like disturbances on a Caribbean seagrass bed. J. Exp. Mar. Bio. Ecol. 324, 44–60. doi: 10.1016/j.jembe.2005.04.002
de Almeida L. R., Silva R., Martínez M. L. (2022). The relationships between environmental conditions and parallel ecosystems on the coastal dunes of the Mexican Caribbean. Geomorphology 397, 108006. doi: 10.1016/j.geomorph.2021.108006
Dierssen H. M., Zimmerman R. C., Drake L. A., Burdige D. (2010). Benthic ecology from space: Optics and net primary production in seagrass and benthic algae across the great bahama bank. Mar. Ecol. Prog. Ser. 411, 1–15. doi: 10.3354/meps08665
Effrosynidis D., Arampatzis A., Sylaios G. (2018). Seagrass detection in the mediterranean: A supervised learning approach. Ecol. Inform. 48, 158–170. doi: 10.1016/j.ecoinf.2018.09.004
Enríquez S., Olivé I., Cayabyab N., Hedley J. D. (2019). Structural complexity governs seagrass acclimatization to depth with relevant consequences for meadow production, macrophyte diversity and habitat carbon storage capacity. Sci. Rep. 9, 1–14. doi: 10.1038/s41598-019-51248-z
Escudero-Castillo M., Felix-Delgado A., Silva R., Mariño-Tapia I., Mendoza E. (2018). Beach erosion and loss of protection environmental services in cancun, Mexico. Ocean. Coast. Manage. 156, 183–197. doi: 10.1016/j.ocecoaman.2017.06.015
Escudero M., Reguero B. G., Mendoza E., Secaira F., Silva R. (2021). Coral reef geometry and hydrodynamics in beach erosion control in north quintana roo, Mexico. Front. Mar. Sci. 8. doi: 10.3389/fmars.2021.684732
Fauzan M. A., Wicaksono P., Hartono (2021). Characterizing derawan seagrass cover change with time-series sentinel-2 images. Reg. Stud. Mar. Sci. 48, 102048. doi: 10.1016/j.rsma.2021.102048
Fonseca M. S., Cahalan J. A. (1992). A preliminary evaluation of wave attenuation by four species of seagrass. Estuar. Coast. Shelf. Sci. 35, 565–576. doi: 10.1016/S0272-7714(05)80039-3
Fourqurean J. W., Duarte C. M., Kennedy H., Marbà N., Holmer M., Mateo M. A., et al. (2012). Seagrass ecosystems as a globally significant carbon stock. Nat. Geosci. 5, 505–509. doi: 10.1038/ngeo1477
Frazier A. E., Hemingway B. L. (2021). A technical review of planet smallsat data: Practical considerations for processing and using PlanetScope imagery. Remote Sens. 13, 3930. doi: 10.3390/rs13193930
Gambi M., Nowell A., Jumars P. (1990). Flume observations on flow dynamics in zostera marina (eelgrass) beds. Mar. Ecol. Prog. Ser. 61, 159–169. doi: 10.3354/meps061159
Goodman J. A., Purkis S. J., Phinn S. R. (2013). Coral reef remote sensing. Eds. Goodman J. A., Purkis S. J., Phinn S. R. (Dordrecht: Springer Netherlands). doi: 10.1007/978-90-481-9292-2
Hedley J. D., Russell B. J., Randolph K., Pérez-Castro M., Vásquez-Elizondo R. M., Enríquez S., et al. (2017). Remote sensing of seagrass leaf area index and species: The capability of a model inversion method assessed by sensitivity analysis and hyperspectral data of Florida bay. Front. Mar. Sci. 4. doi: 10.3389/fmars.2017.00362
Hedley J. D., Velázquez-Ochoa R., Enríquez S. (2021). Seagrass depth distribution mirrors coastal development in the Mexican Caribbean – an automated analysis of 800 satellite images. Front. Mar. Sci. 8. doi: 10.3389/fmars.2021.733169
Hernández-Terrones L., Rebolledo-Vieyra M., Merino-Ibarra M., Soto M., Le-Cossec A., Monroy-Ríos E. (2011). Groundwater pollution in a karstic region (NE yucatan): Baseline nutrient content and flux to coastal ecosystems. Water. Air. Soil pollut. 218, 517–528. doi: 10.1007/s11270-010-0664-x
Hossain M. S., Bujang J. S., Zakaria M. H., Hashim M. (2015). Application of landsat images to seagrass areal cover change analysis for lawas, terengganu and kelantan of Malaysia. Cont. Shelf. Res. 110, 124–148. doi: 10.1016/j.csr.2015.10.009
James R. K., Silva R., Van Tussenbroek B. I., Escudero-Castillo M., Mariño-Tapia I., Dijkstra H. A., et al. (2019). Maintaining tropical beaches with seagrass and algae: A promising alternative to engineering solutions. Bioscience 69, 136–142. doi: 10.1093/biosci/biy154
James R. K., van Katwijk M. M., van Tussenbroek B. I., van der Heide T., Dijkstra H. A., van Westen R. M., et al. (2020). Water motion and vegetation control the pH dynamics in seagrass-dominated bays. Limnol. Oceanogr. 65, 349–362. doi: 10.1002/lno.11303
Kachadourian-Marras A., Alconada-Magliano M. M., Carrillo-Rivera J. J., Mendoza E., Herrerías-Azcue F., Silva R. (2020). Characterization of surface evidence of groundwater flow systems in continental Mexico. Water 12, 2459. doi: 10.3390/w12092459
Kim K., Choi J.-K., Ryu J.-H., Jeong H. J., Lee K., Park M. G., et al. (2015). Observation of typhoon-induced seagrass die-off using remote sensing. Estuar. Coast. Shelf. Sci. 154, 111–121. doi: 10.1016/j.ecss.2014.12.036
Koch E. W., Barbier E. B., Silliman B. R., Reed D. J., Perillo G. M. E., Hacker S. D., et al. (2009). Non-linearity in ecosystem services: Temporal and spatial variability in coastal protection. Front. Ecol. Environ. 7, 29–37. doi: 10.1890/080126
Koftis T., Prinos P., Stratigaki V. (2013). Wave damping over artificial posidonia oceanica meadow: A large-scale experimental study. Coast. Eng. 73, 71–83. doi: 10.1016/j.coastaleng.2012.10.007
Kovacs E., Roelfsema C., Lyons M., Zhao S., Phinn S. (2018). Seagrass habitat mapping: How do landsat 8 OLI, sentinel-2, ZY-3A, and worldview-3 perform? Remote Sens. Lett. 9, 686–695. doi: 10.1080/2150704X.2018.1468101
Lebrasse M. C., Schaeffer B. A., Coffer M. M., Whitman P. J., Zimmerman R. C., Hill V. J., et al. (2022). Temporal stability of seagrass extent, leaf area, and carbon storage in st. Joseph bay, Florida: A semi-automated remote sensing analysis. Estuaries. Coasts 45, 2082–2101. doi: 10.1007/s12237-022-01050-4
López-Mendoza P. G., Ruiz-Fernández A. C., Sanchez-Cabeza J. A., van Tussenbroek B. I., Cuellar-Martinez T., Pérez-Bernal L. H. (2020). Temporal trends of organic carbon accumulation in seagrass meadows from the northern Mexican Caribbean. CATENA 194, 104645. doi: 10.1016/j.catena.2020.104645
Lyons M., Phinn S., Roelfsema C. (2011). Integrating quickbird multi-spectral satellite and field data: Mapping bathymetry, seagrass cover, seagrass species and change in moreton bay, Australia in 2004 and 2007. Remote Sens. 3, 42–64. doi: 10.3390/rs3010042
Madsen J. D., Chambers P. A., James W. F., Koch E. W., Westlake D. F. (2001). The interaction between water movement, sediment dynamics and submersed macrophytes. Hydrobiologia 444, 71–84. doi: 10.1023/A:1017520800568
Martínez M. L., Moreno-Casasola P., Espejel I., Oroci O. J., Mata D. I., Revelo N. R., et al. (2014). Diagnóstico general de las dunas costeras de méxico (Ciudad de México: SEMARNAT).
Mendez F. J., Losada I. J. (2004). An empirical model to estimate the propagation of random breaking and nonbreaking waves over vegetation fields. Coast. Eng. 51, 103–118. doi: 10.1016/j.coastaleng.2003.11.003
Moberg F., Rönnbäck P. (2003). Ecosystem services of the tropical seascape: Interactions, substitutions and restoration. Ocean. Coast. Manage. 46, 27–46. doi: 10.1016/S0964-5691(02)00119-9
Molina-Hernández A. L., Van Tussenbroek B. I. (2014). Patch dynamics and species shifts in seagrass communities under moderate and high grazing pressure by green sea turtles. Mar. Ecol. Prog. Ser. 517, 143–157. doi: 10.3354/meps11068
Neckles H. A., Kopp B. S., Peterson B. J., Pooler P. S. (2012). Integrating scales of seagrass monitoring to meet conservation needs. Estuaries. Coasts. 35, 23–46. doi: 10.1007/s12237-011-9410-x
Ortíz Pérez M. A., de la Lanza Espino G. (2006). Diferenciación del espacio costero de méxico: un inventario regional (México: Instituto de Geografía UNAM).
Otsu N. (1979). A tlreshold selection method from Gray-level histograms. IEEE Trans. Syst. Man. Cybern. 9, 62–66. doi: 10.1109/TSMC.1979.4310076
Paquier A. E., Oudart T., Le Bouteiller C., Meulé S., Larroudé P., Dalrymple R. A. (2021). 3D numerical simulation of seagrass movement under waves and currents with GPUSPH. Int. J. Sediment. Res. 36, 711–722. doi: 10.1016/j.ijsrc.2020.08.003
Paul M., Bouma T. J., Amos C. L. (2012). Wave attenuation by submerged vegetation: Combining the effect of organism traits and tidal current. Mar. Ecol. Prog. Ser. 444, 31–41. doi: 10.3354/meps09489
Pham T. D., Xia J., Ha N. T., Bui D. T., Le N. N., Tekeuchi W. (2019). A review of remote sensing approaches for monitoring blue carbon ecosystems: Mangroves, seagrasses and salt marshes during 2010–2018. Sensors 19, 1933. doi: 10.3390/s19081933
Phinn S., Roelfsema C., Dekker A., Brando V., Anstee J. (2008). Mapping seagrass species, cover and biomass in shallow waters: An assessment of satellite multi-spectral and airborne hyper-spectral imaging systems in moreton bay (Australia). Remote Sens. Environ. 112, 3413–3425. doi: 10.1016/j.rse.2007.09.017
Planet Labs Inc (2022) Planet imagery products specifications. Available at: https://assets.planet.com/docs/Planet_Combined_Imagery_Product_Specs_letter_screen.pdf (Accessed June 01, 2022).
Purnamasari E., Kamal M., Wicaksono P. (2021). Comparison of vegetation indices for estimating above-ground mangrove carbon stocks using PlanetScope image. Reg. Stud. Mar. Sci. 44, 101730. doi: 10.1016/j.rsma.2021.101730
Rende S. F., Bosman A., Di Mento R., Bruno F., Lagudi A., Irving A. D., et al. (2020). Ultra-High-Resolution mapping of posidonia oceanica (L.) delile meadows through acoustic, optical data and object-based image classification. J. Mar. Sci. Eng. 8, 647. doi: 10.3390/jmse8090647
Rioja-Nieto R., Garza-Pérez R., Álvarez-Filip L., Mariño-Tapia I., Enríquez C. (2018). “The Mexican Caribbean: From xcalak to holbox,” in World seas: An environmental evaluation volume I: Europe, the americas and West Africa. Ed. Sheppard C. (London: Elsevier), 637–653. doi: 10.1016/B978-0-12-805068-2.00033-4
Rodríguez-Martínez R. E., Ruíz-Rentería F., van Tussenbroek B., Barba-Santos G., Escalante-Mancera E., Jordán-Garza G., et al. (2010). Environmental state and tendencies of the Puerto morelos CARICOMP site, Mexico. Rev. Biol. Trop. 58, 23–43. doi: 10.15517/rbt.v58i0.20039
Roelfsema C. M., Phinn S. R., Udy N., Maxwell P. (2009). An integrated field and remote sensing approach for mapping seagrass cover, moreton bay, Australia. J. Spat. Sci. 54, 45–62. doi: 10.1080/14498596.2009.9635166
Ruiz de Alegria-Arzaburu A., Mariño-Tapia I., Enriquez C., Silva R., González-Leija M. (2013). The role of fringing coral reefs on beach morphodynamics. Geomorphology 198, 69–83. doi: 10.1016/j.geomorph.2013.05.013
Schaefer R. B., Nepf H. (2022). Wave damping by seagrass meadows in combined wave-current conditions. Limnol. Oceanogr. 67, 1554–1565. doi: 10.1002/lno.12102
Schill S. R., McNulty V. P., Pollock F. J., Lüthje F., Li J., Knapp D. E., et al. (2021). Regional high-resolution benthic habitat data from planet dove imagery for conservation decision-making and marine planning. Remote Sens. 13, 4215. doi: 10.3390/rs13214215
Serco Italia SPA (2019) Sen2Coral toolbox for coral reef monitoring, great barrier reef (version 1.1). Available at: https://rus-copernicus.eu/portal/wp-content/uploads/library/education/training/OCEA05_Sen2Coral_GBR_Tutorial.pdf (Accessed March 13, 2021).
Silva R., Martínez M. L., van Tussenbroek B. I., Guzmán-rodríguez L. O., Mendoza E., López-portillo J. (2020). A framework to manage coastal squeeze. Sustain 12, 1–21. doi: 10.3390/su122410610
Soissons L. M., van Katwijk M. M., Peralta G., Brun F. G., Cardoso P. G., Grilo T. F., et al. (2018). Seasonal and latitudinal variation in seagrass mechanical traits across Europe: The influence of local nutrient status and morphometric plasticity. Limnol. Oceanogr. 63, 37–46. doi: 10.1002/lno.10611
Stratigaki V., Manca E., Prinos P., Losada I. J., Lara J. L., Sclavo M., et al. (2011). Large-Scale experiments on wave propagation over posidonia oceanica. J. Hydraul. Res. 49, 31–43. doi: 10.1080/00221686.2011.583388
Thorhaug A., Richardson A. D., Berlyn G. P. (2007). Spectral reflectance of the seagrasses: Thalassia testudinum, halodule wrightii, syringodium filiforme and five marine algae. Int. J. Remote Sens. 28, 1487–1501. doi: 10.1080/01431160600954662
van Tussenbroek B. I. (1995). Thalassia testudinum leaf dynamics in a Mexican Caribbean coral reef lagoon. Mar. Biol. 122, 33–40. doi: 10.1007/BF00349275
van Tussenbroek B. (2011). Dynamics of seagrasses and associated algae in coral reef lagoons dinámica de los pastos marinos y macroalgas asociadas en lagunas arrecifales. Hidrobiológica 21, 293–310.
van Tussenbroek B. I., Cortés J., Collin R., Fonseca A. C., Gayle P. M. H., Guzmán H. M., et al. (2014). Caribbean-Wide, long-term study of seagrass beds reveals local variations, shifts in community structure and occasional collapse. PloS One 9, e90600. doi: 10.1371/journal.pone.0090600
van Tussenbroek B. I., Hernández Arana H. A., Rodríguez-Martínez R. E., Espinoza-Avalos J., Canizales-Flores H. M., González-Godoy C. E., et al. (2017). Severe impacts of brown tides caused by sargassum spp. on near-shore Caribbean seagrass communities. Mar. Pollut. Bull. 122, 272–281. doi: 10.1016/j.marpolbul.2017.06.057
Wicaksono P., Hafizt M. (2013). Mapping seagrass from space: Addressing the complexity of seagrass LAI mapping. Eur. J. Remote Sens. 46, 18–39. doi: 10.5721/EuJRS20134602
Wicaksono P., Lazuardi W. (2018). Assessment of PlanetScope images for benthic habitat and seagrass species mapping in a complex optically shallow water environment. Int. J. Remote Sens. 39, 5739–5765. doi: 10.1080/01431161.2018.1506951
Wicaksono P., Maishella A., Lazuardi W., Muhammad F. H. (2022). Consistency assessment of multi-date PlanetScope imagery for seagrass percent cover mapping in different seagrass meadows. Geocarto. Int. 0, 1–26. doi: 10.1080/10106049.2022.2096122
Yamamuro M., Nishimura K., Kishimoto K., Nozaki K., Kato K., Negishi A., et al. (2002). “Mapping tropical seagrass beds with an underwater remotely operated vehicle (ROV)” in: Recent Advances in Marine Science and Technology, ed. Saxena N.. (Yokosuka: Japan International Marine Science and Technology Federation).
Keywords: seagrass mapping, LAI estimation, multiparameter classification, PlanetScope satellite image, reef lagoon
Citation: de Almeida LR, Ávila-Mosqueda SV, Silva R, Mendoza E and van Tussenbroek BI (2022) Mapping the structure of mixed seagrass meadows in the Mexican Caribbean. Front. Mar. Sci. 9:1063007. doi: 10.3389/fmars.2022.1063007
Received: 06 October 2022; Accepted: 22 November 2022;
Published: 09 December 2022.
Edited by:
Monica Montefalcone, University of Genoa, ItalyReviewed by:
Edoardo Casoli, Sapienza University of Rome, ItalyCopyright © 2022 de Almeida, Ávila-Mosqueda, Silva, Mendoza and van Tussenbroek. This is an open-access article distributed under the terms of the Creative Commons Attribution License (CC BY). The use, distribution or reproduction in other forums is permitted, provided the original author(s) and the copyright owner(s) are credited and that the original publication in this journal is cited, in accordance with accepted academic practice. No use, distribution or reproduction is permitted which does not comply with these terms.
*Correspondence: Rodolfo Silva, UlNpbHZhQ0BpaW5nZW4udW5hbS5teA==
Disclaimer: All claims expressed in this article are solely those of the authors and do not necessarily represent those of their affiliated organizations, or those of the publisher, the editors and the reviewers. Any product that may be evaluated in this article or claim that may be made by its manufacturer is not guaranteed or endorsed by the publisher.
Research integrity at Frontiers
Learn more about the work of our research integrity team to safeguard the quality of each article we publish.