
95% of researchers rate our articles as excellent or good
Learn more about the work of our research integrity team to safeguard the quality of each article we publish.
Find out more
ORIGINAL RESEARCH article
Front. Mar. Sci. , 13 January 2023
Sec. Marine Biogeochemistry
Volume 9 - 2022 | https://doi.org/10.3389/fmars.2022.1058730
This article is part of the Research Topic Biogeochemistry and Genomics of Silicification and Silicifiers, volume II View all 11 articles
 Dongdong Zhu1,2,3
 Jill N. Sutton3*
 Aude Leynaert3
 Paul J. Tréguer3
 Jonas Schoelynck4
 Morgane Gallinari3
 Yuwei Ma1,2
 Su Mei Liu1,2*
The Coastal and Continental Margin Zones (CCMZs) contribute to 40% of the total burial flux of biogenic silica (bSi) of the world ocean. However, the accurate determination of the bSi content (bSiO2%) in marine sediments remains a challenge. The alkaline methods commonly used to quantitatively determine bSiO2% can completely digest the amorphous silica of diatoms but are less effective at digesting radiolarians and sponge spicules. In addition, the lithogenic silica (lSi) found in sediments is partly digested during these alkaline extractions, which can bias the accuracy of the determined bSiO2%. This is of importance in CCMZs where the lSi:bSi ratio is high. In this study, we examined sediments collected in the CCMZs of East China seas, an environment of peculiar interest given the large amount of lSi deposited by the Yellow River and the Yangtze River. The results show that alkaline digestions using stronger solutions and pretreatment steps resulted in an overestimate of the bSiO2% due to increased leaching of silica mainly from authigenic silicates and clays, whereas weak digestions underestimated the bSiO2% owing to incomplete digestion of sponge spicules. We found that the use of the Si/Al method accurately corrects for the lSi fraction in marine sediments, and thereby improves the determinations of bSiO2% in the sediments of East China seas CCMZs. Ensuring full digestion of all bSi remains challenging, in particular for sponge spicules, motivating both verifications via microscopy and longer extraction times. To emphasize the influence of these methodological differences, we revised the bSi burial flux in the East China seas and provide a new estimate of 253 (± 286) Gmol-SiO2 yr-1, which is one third of the previous estimates. We discuss the potential contribution from radiolarian and sponges and we propose a new general protocol for the determination of bSi in sediments that minimizes the methodological bias in bSi determination.
Coastal and Continental Margin Zones (CCMZs) are distinct settings for the interrogation of global marine biogeochemical cycling of silica (Si), climate change and marine ecological processes (Jeandel and Oelkers, 2015; Jeandel, 2016; Tréguer et al., 2018; Rahman et al., 2019). The CCMZs represent approximately 10% of the global marine surface area (3.61 × 10⁸ km2) (Costello et al., 2010), and account for 40% of the total biogenic silica (bSi) burial (~9.2 Tmol-Si yr-1) in the global ocean (DeMaster, 2019; Tréguer et al., 2021). This estimate was based solely on the burial of diatom bSi. However, marine Si is also removed through reverse weathering in major tropical and subtropical deltas (Rahman et al., 2016; Rahman et al., 2017), the burial of siliceous sponges spicules predominantly on the continental shelf and margins (DeMaster, 2019; Maldonado et al., 2019), and the burial of radiolarian tests (Maldonado et al., 2019). Recent work estimated that if all of these processes are taken into account, the burial flux of Si that occurs mainly within the CCMZs, removes 5.0 to 10.1 Tmol-Si yr-1 (DeMaster, 2019; Tréguer et al., 2021), which is equivalent to roughly one to two-thirds of the global Si output flux (15.6 Tmol-Si yr-1) from the marine environment (DeMaster, 2019; Tréguer et al., 2021).
The calculation of the marine Si budget at the global or local level is dependent on the precision and accuracy of the bSi measurements (DeMaster, 1991). Within the CCMZs, the combination of lSi with bSi decreases the reactive surface area of biogenic opal and lowers its solubility (Dixit and Van Cappellen, 2003; Varkouhi et al., 2020a; Varkouhi and Wells, 2020), which enhances the bSi burial efficiency. However, high precipitation rates of terrestrial lSi dilute the bSi and result in an opal-depleted coastal sediment (DeMaster, 2002; Wu et al., 2017; Wu and Liu, 2020). Therefore, accurate determination of the bSi content (bSiO2%) in the CCMZs sediment is particularly challenging owing to its characteristically low bSiO2%, high lithogenic silica (lSi; clay mineral, authigenic aluminosilicate, quartz) content (DeMaster, 1991), and complexity of bSi types (e.g. diatoms, phytolith, radiolarians, sponge spicules; Figure 1A) (DeMaster, 1991; Maldonado et al., 2019). Among several different techniques (e.g., X-ray Diffraction (Goldberg, 1958; Eisma and van der Gaast, 1971), point counts of siliceous microfossil (Pudsey, 1993; Varkouhi et al., 2020b), infrared analysis (Fröhlich, 1989), normative calculation technique (Leinen, 1977), wet chemical method (DeMaster, 1981; Mortlock and Froelich, 1989; Müller and Schneider, 1993)), wet chemical method is the most commonly used method for determining the bSiO2% in marine sediments (Conley, 1998). Considering the complex sediment composition of CCMZs sediments, a mild alkaline leach (0.1 M Na2CO3) is recommended to minimize the interference of lSi in bSi determination when using the wet chemical method (DeMaster, 1981). However, a mild alkaline leach underestimates the quantity of bSi due to an incomplete extraction of more resistant bSi (Figure 1A), such as radiolarians (Mortlock and Froelich, 1989; Müller and Schneider, 1993) and siliceous sponge spicules (Maldonado et al., 2019). Nonetheless, complete digestion of resistant bSi using a strong alkaline solution can introduce additional bias due to the inevitable attack on lSi. To accurately determine bSiO2% in sediment from different marine environments, various kinds of wet alkaline methods with different digestion conditions (i.e., alkaline solution, sample to solution ratio, extraction temperature, duration of extraction and pre-treatment of sediment by HCl and H2O2 prior to alkaline digestion) have been proposed and applied in the literature (DeMaster, 1981; Mortlock and Froelich, 1989; Müller and Schneider, 1993; Kamatani and Oku, 2000; Conley and Schelske, 2001; Koning et al., 2002; Liu et al., 2002; Olivarez Lyle and Lyle, 2002). These methods were grouped into two different types: (1) Si/time alkaline digestion and (2) Si/Al alkaline digestion (Swann, 2010). The Si/time method (Figure 1B), which is the conventional wet alkaline method, requires the measurement of alkaline extracted Si concentration and corrects the lSi fraction based on the assumption of the difference in dissolution kinetics between bSi (non-linear dissolution) and lSi (linear dissolution) (DeMaster, 1981). The Si/Al alkaline digestion method (Figure 1B) requires the measurement of alkaline extracted Si and Al concentrations, and corrects the lSi fraction based on the assumption that the Si:Al ratio of lSi is low (Si:Al< 5, Figure 1A) and the extracted Al is mainly lSi origin (Kamatani and Oku, 2000; Koning et al., 2002). Previous studies found methodological differences in the bSiO2% between Si/time and Si/Al methods in both lacustrine (Swann, 2010) and marine sediments (Barão et al., 2015). It has been noted that major biases in the bSiO2% can be generated among different wet alkaline methods (DeMaster, 1991; Gehlen and van Raaphorst, 1993; Schlüter and Rickert, 1998; Kamatani and Oku, 2000; Barão et al., 2015), influencing the estimation of the bSi burial flux especially in the opal-depleted (bSiO2-depleted) sediment of the CCMZs (DeMaster, 1991; DeMaster, 2002; Tréguer et al., 2021).
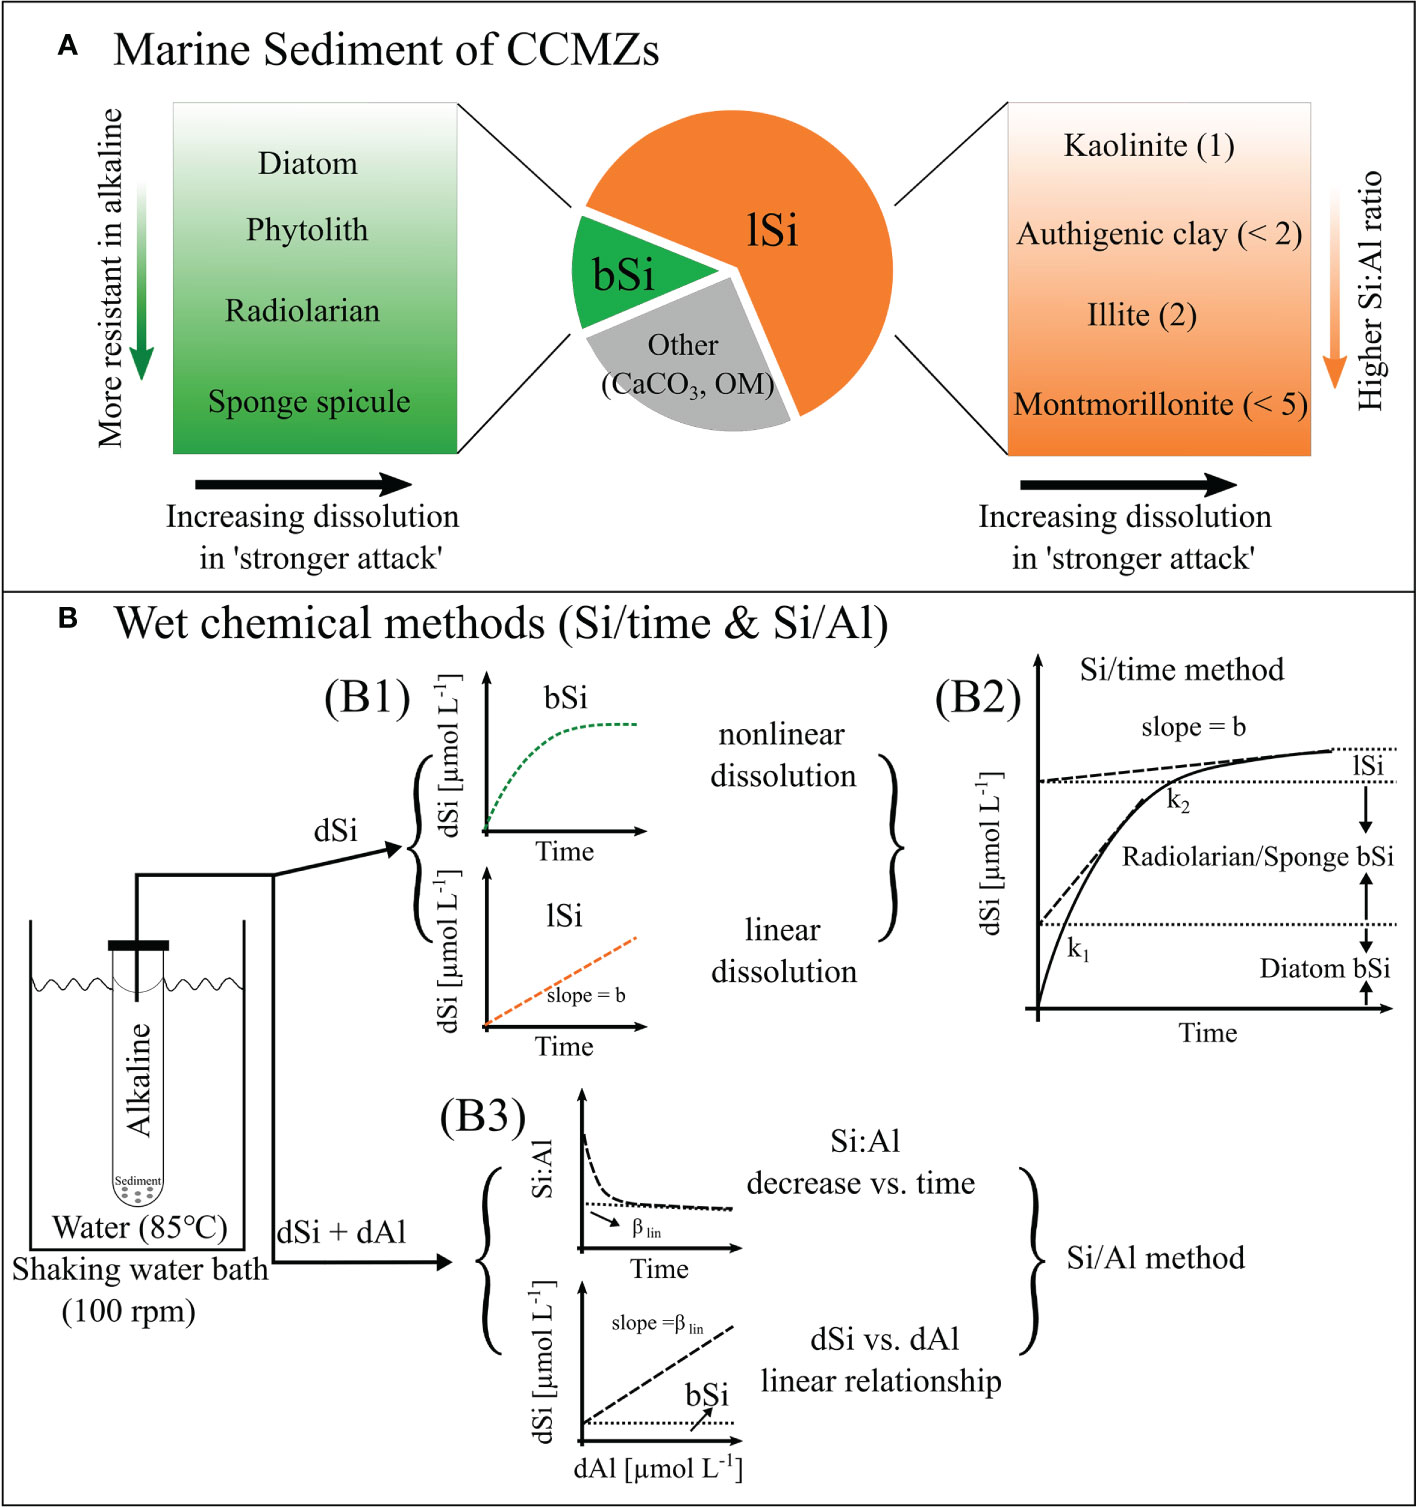
Figure 1 The schematic diagram shows the: (A) components in the sediment of CCMZs and (B) Wet chemical methods (B1: Si/time method; B2: Si/Al method). (A) shows the types of bSi in sediment and their dissolution capability: diatom< phytolith< radiolarian< sponge spicule (Mortlock and Froelich, 1989; Müller and Schneider, 1993; Meunier et al., 2014) and types of lSi in sediment and their Si:Al ratio: authigenic clay: Si:Al< 2 (Mackin, 1989; Michalopoulos and Aller, 1995); Kaolinite: Si:Al = 1, Illite: Si:Al = 2, Montmorillonite: Si:Al< 5 (Koning et al., 2002). The ‘stronger attack’ represents high alkaline concentration/pH, longer extraction time and sample pretreatment with acid (e.g. HCl) and/or oxidizing agents (e.g. H2O2). (B) shows the alkaline digestion (85°C) of bSi and correction of lSi using the Si/time method (B1) modified from DeMaster (1981), the Si/time method (B2) modified from Conley and Schelske (2001) and the Si/Al method (B3) modified from Kamatani and Oku (2000). The Si/time method (B1 and B2) assumes the bSi dissolves non-linearly through time whereas the lSi dissolves linearly (the slope equals to dissolution rate ‘b’) through time, the different types of bSi (diatom, radiolarian and sponge spicules) can be quantified based on their dissolution rate (k1, and k2). The Si/Al method (B3) assumes that the ratio of alkaline extractable Si vs. Al is constant, and the alkaline extractable Al is mainly lSi origin, the Si:Al ratio of bSi is higher (> 5) than lSi (< 5) (Koning et al., 2002). The Si: Al vs. time plot shows a decrease of Si:Al ratios to constant value after a complete digestion of bSi.
The East China seas, which consists of the Bohai Sea (BH), the Yellow Sea (YS), and the East China Sea (ECS), is one of the largest CCMZs in the Northwest Pacific Ocean. The East China seas are characterized by high sedimentation rates (Qiao et al., 2017), low bSiO2% (< 3%) and high lithogenic material content (> 70%) (Liu et al., 2002; Wu et al., 2017; Wu and Liu, 2020). Previous studies demonstrated that the burial of bSi in the East China seas is 924 (± 693) Gmol-SiO2 yr-1 (Liu et al., 2016; Wu et al., 2017; Wu and Liu, 2020), accounting for ~5% of the bSi burial in the global ocean. These estimations were based on the bSiO2% determined using several alkaline digestion techniques, such as using different concentrations of alkaline solution (0.1 M Na2CO3, 2% Na2CO3, 2.0 M Na2CO3), duration of the alkaline digestion (5 h, 8 h) and pre-treatment process (with HCl and H2O2 prior to alkaline extraction) that may underestimate or overestimate the bSi content due to the incomplete digestion of bSi or the interference of lSi in bSi determination (Kamatani and Oku, 2000; Barão et al., 2015) and leaching of authigenic silicates activated by acid treatment (Michalopoulos and Aller, 2004; Rahman et al., 2016; Pickering et al., 2020). Such an under- or overestimate of the bSi content will influence the magnitude of the burial flux of bSi determined for the CCMZs where the sediment load is high and the bSi content is low. In addition, diatoms, radiolarians (Liu et al., 2017; Qu et al., 2020a; Qu et al., 2020b), sponge spicules (Chou et al., 2012) and living siliceous sponges (Zhang et al., 2003) were observed in the sediment of the East China seas. However, the influence of their presence on the determination of bSi content and consequent role in marine Si cycling for this region, is still not defined. The radiolarians and siliceous sponge spicules are more resistant to alkaline attacks than diatoms (DeMaster, 1981; Müller and Schneider, 1993), thus the types of bSi need to be considered when characterizing the bSi content of sediments (DeMaster, 1991).
This study aims to provide an accurate determination of the burial flux of the East China seas CCMZs by conducting a thorough evaluation of the potential methodological biases influencing the determination of bSi. To evaluate these methodological biases, multiple samples of characteristically diverse marine sediment from the East China seas were measured for bSiO2% using different alkaline solution concentrations (0.1 M, 0.2 M, 2.0 M Na2CO3), with and without pretreatment. In addition, the types of marine bio-siliceous structures (diatoms, radiolarian tests, and sponge spicules) and their abundances in the different sediment samples were quantified to select an appropriate wet alkaline method. Further, the bSiO2% determined using the Si/time method (20 h digestion in 0.1 M Na2CO3) and the Si/Al method (1 h digestion in 0.5 M NaOH) were compared for an accurate evaluation of the alkaline extracted Si (bSi and lSi) from sediments of the CCMZs. The detailed evaluation of these methodological biases resulted in the production of a revised evaluation of the burial flux of bSi for the East China seas CCMZ and a discussion on the implementation of a standardized method for the determination of bSiO2% in similar depositional environments.
The East China seas (Figure 2) consists of the BH (surface area: 7.73 × 10⁴ km2), the YS (surface area: 38 × 104 km2), and the ECS (surface area: 77 × 104 km2) (Qiao et al., 2017). The semi-enclosed BH and YS are shallow water bodies with an average water depth of 18 m (maximum 85 m) and 44 m (maximum 140 m) respectively. About 21 large rivers (length of mainstream > 100 km) deliver 782.2 × 10⁹ kg yr-1 of sediment to the BH, with more than 90% delivered by the Yellow River. Roughly 30 rivers discharge 13.0 × 10⁹ kg yr-1 of sediment into the YS (Qiao et al., 2017). However, up to 90% of its total sediment burial flux (414.6 × 10⁹ kg yr-1) is transported from the BH and 5.7% is eroded sediment from the old Yellow River (Qiao et al., 2017). The ECS consists of a broad continental shelf and the Okinawa Trough, with an average water depth of 349 m (maximum 2700 m). About 18 rivers deliver 490.5 × 10⁹ kg yr-1 of sediment into the ECS, of which approximately 80% is delivered from the Yangtze River (Qiao et al., 2017). The bSiO2% in surface sediments of the BH, YS and ECS were 0.92 ± 0.24% (Liu et al., 2002), 2.20 ± 0.79% (Wu et al., 2017) and 1.97 ± 0.53% (Wu and Liu, 2020), respectively, and are considered to be relatively low values (< 3% is considered a threshold value for bSi concentrations) and requires an accurate determination (Koning et al., 2002; Liu et al., 2002; DeMaster, 2019; Tréguer et al., 2021).
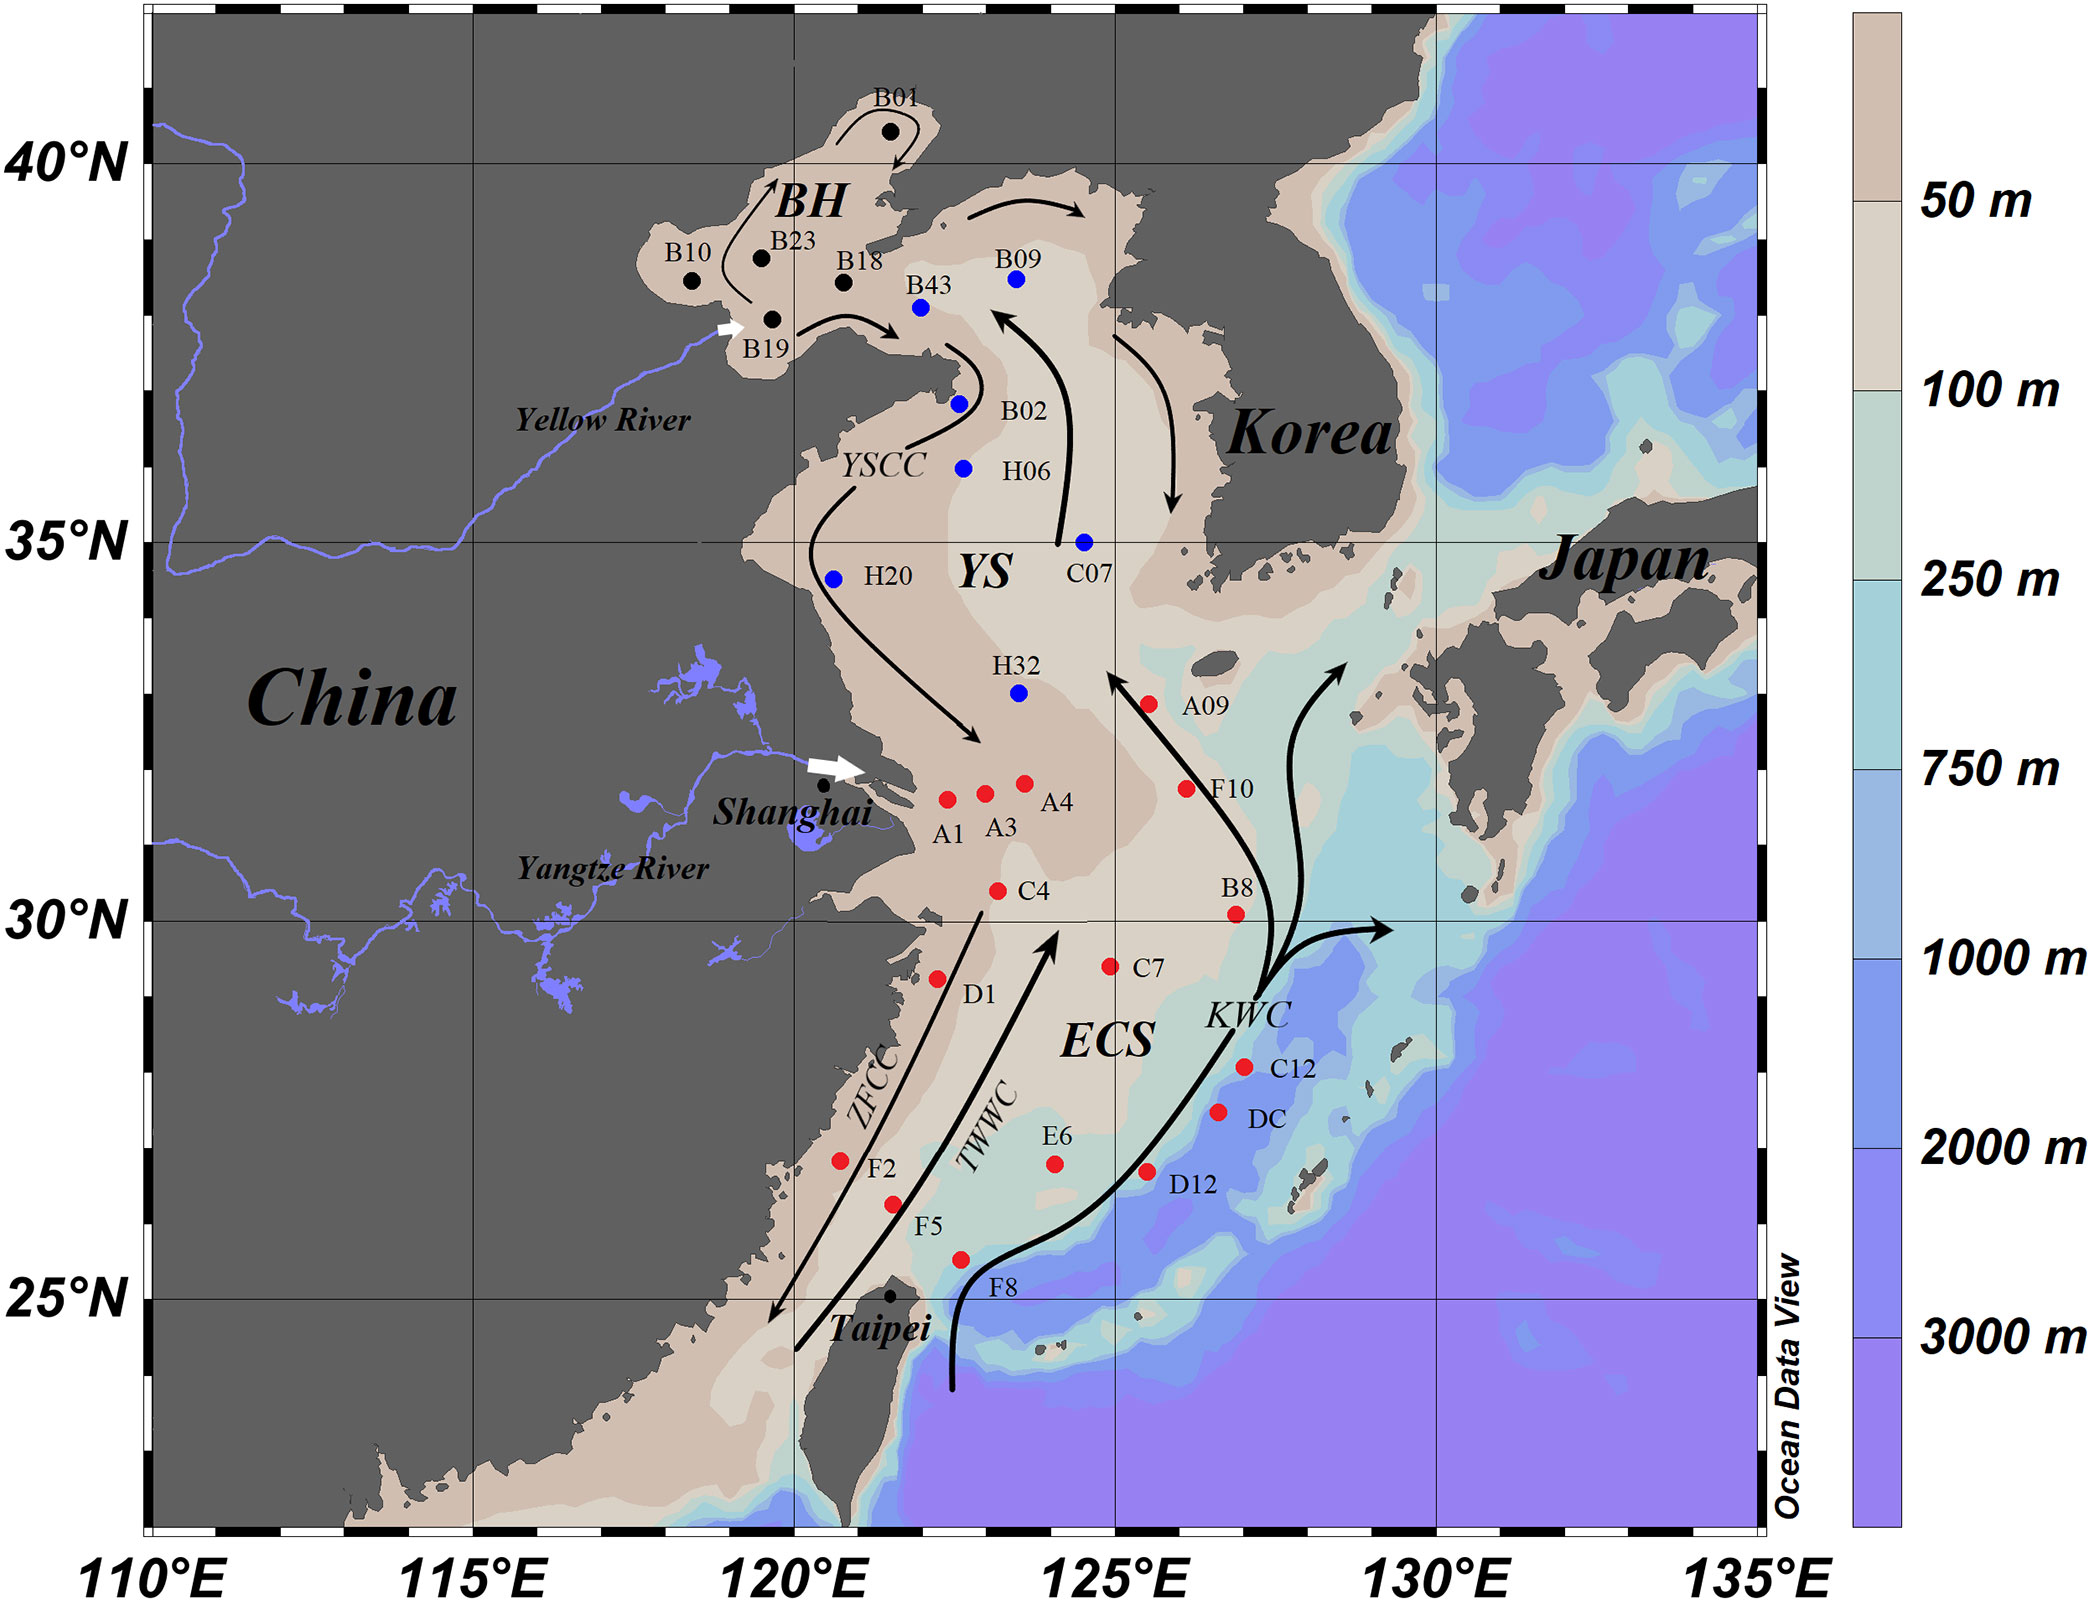
Figure 2 Map of the study area indicating the sampling stations. The location of samples are grouped in different colors at the Bohai Sea (black dots •), Yellow Sea (blue dots •), and the East China Sea (red dots •). The surface sediment samples (0 − 2 cm) were obtained during several research cruises during 2008-2013. The distributions of currents are based on Liu et al. (2007) and Qin et al. (1996). White arrows represent the Yellow River and Yangtze River discharge. (YSCC: Yellow Sea Coastal Current; ZFCC: Zhejiang Fujian Coastal Current; TWWC: Taiwan Warm Current; KWC: Kuroshio Warm Current). The map is created using Ocean Data View (ODV) software (Schlitzer, Reiner, Ocean Data View, https://odv.awi.de, 2021).
Field observations were conducted in the East China seas from 2008 to 2013. The sampling sites are shown in Figure 2. At each sampling site, surface sediment samples (0 − 2 cm) were collected using a stainless-steel box sampler and subsequently packed in sealed plastic bags at -20°C on board. Frozen samples were then freeze-dried in the laboratory and stored at room temperature (~20°C) until analysis. Two sediment samples for interlaboratory comparison (sample code: Still Pond, R-64) were also measured using the Si/time (0.1 M Na2CO3, 20 h digestion) and the Si/Al (0.5 M NaOH, 1 h digestion) alkaline digestion method. The location of these sampled sediments and their descriptions are given in Conley (1998).
The different types of bSi and their abundance in the sediment of the East China seas were determined using an inverted microscope (Zeiss Axio Observer A1) at 10X magnification. The abundance (numbers per gram: 103 g-1 dry sediments) of different marine bSi organisms in samples A3, C4, C7, C12, and F2 were examined optically (see Figure 2 for sample locations). The samples were selected based on their water depth and sediment type (A3, F2: silty-clay; C4, C7: sandy; C12: clay-silt). In order to prepare the samples for microscopic observation, ca. 5 − 10 mg of homogenized dry sediment was pretreated using 1.0 M HCl (10 mL) and 10% H2O2 (10 mL) and heated at 60°C for 2 h. The solution was subsequently discarded after centrifugation (4000 rpm, 5 min) and the residual sediment was rinsed three times using Milli-Q water (18.2 MΩ). The decarbonated sediment samples were homogenized in Milli-Q water (1 mL) and the samples were put on a glass microscope slide for optical observation. The abundance of individuals for different types of bSi (i.e., diatom frustules, radiolarian skeletons and siliceous sponge spicules) was counted and normalized as the number of individuals per gram of dry sediment (103 g-1).
The content of bSi found in the sediments in this study is expressed as bSiO2% (molar mass of bSiO2: 60 g mol-1) to avoid potential errors associated with the difference in bond water content of different types of bSi and/or ages of siliceous organisms.
Two wet chemical methods were used to quantify the bSiO2%: the Si/time method (DeMaster, 1981; Conley and Schelske, 1993; Conley and Schelske, 2001; Liu et al., 2002) and the Si/Al method (Koning et al., 2002; Barão et al., 2014; Barão et al., 2015). For the Si/time alkaline digestion, samples were digested using a 0.1 M Na2CO3 solution for 20 h. Before wet-alkaline digestion, freeze-dried marine sediment was gently ground using an agate pestle and mortar. The grinding process aims to homogenize the sediment. Sediment (~100 mg) was then weighed into a 50 mL polypropylene copolymer centrifuge tube (Nalgene no. 3119-0050; Caps no. DS3132-0024) or 50 mL fluorinated ethylene propylene (FEP) centrifuge tube (Nalgene no. 3114-0050; Caps no. DS3131-0024). An alkaline solution (40 mL, 0.1 M Na2CO3) was added to the centrifuge tube using a calibrated 10 mL pipette (10 ± 0.01 mL, Eppendorf). The sample to liquid ratio (S/L) was ca. 2.5 g/L. The tubes were tightly capped after the addition of the alkaline solution and the sediments were well mixed using a Vortex. Samples were immediately placed into a shaking water bath (Julabo SW22) pre-heated to 85 °C with an oscillation frequency of 100 rpm. An aliquot of 200 µL clear centrifugation supernatant was taken from the extraction solution at each time interval and neutralized using 1.0 M HCl solution. Later, the neutralized samples were diluted by Milli-Q water (18.2 MΩ cm-1) to 10 mL, then the dissolved silicic acid (dSi) was measured following the molybdate-blue method (Grasshoff et al., 1983) using a spectrometer as described in Mortlock and Froelich (1989). Determination of the blanks during each extraction experiment showed the Si from both the reagent and tube were negligible. Additionally, alkaline digestion of pre-treated (P; pretreating the sediment using 1.0 M HCl and 10% H2O2) and non-pretreated (NP) sediment were performed using 0.1 M, 0.2 M, 2.0 M Na2CO3 solutions to determine the effect of the concentration of Na2CO3 and pretreatment process (P vs. NP) on bSi determination.
In this study, the bSiO2% was determined following the calculation method described by Liu et al. (2002) where sediments undergo an 8 h digestion. In addition, the bSiO2% was also calculated following the method described in DeMaster (1981); Liu et al. (2002) and Conley and Schelske (1993, 2001) when sediment was digested in a 0.1 M Na2CO3 solution for 20 h. The method described in Conley and Schelske (1993, 2001) was applied for quantifying the diatom bSi, radiolarian and/or sponge bSi (Figure 1B). Moreover, the bSiO2% analyzed according to the method described by Mortlock and Froelich (1989) was also performed.
The Si/Al method refers to the continuous analysis of Si and Al concentrations in the alkaline digestion at a high sampling resolution time (Figure S1). In this study, bSiO2% was measured following the continuous analysis method (Koning et al., 2002; Barão et al., 2015) at the University of Antwerp (Belgium). The dSi and dissolved Al (dAl) in alkaline solution (0.5 M NaOH) were measured continuously at 1 second (s) resolution (Müller and Schneider, 1993). Freeze-dried sediment samples (~100 mg) were added into a stainless-steel vessel with an initial 180 mL of 0.5 M NaOH pre-heated to 85 °C. The S/L ratios of all the analyses range from 0.56 to 0.89 g/L. The closed vessel (to avoid evaporation) is directly connected to a continuous analyzer (Skalar®, The Netherlands) and a rotating motor continuously homogenizes the sample in the extraction liquid, maintaining a constant S/L ratio. The dSi concentration is determined according to the molybdate-blue method (Grasshoff et al., 1983), while dAl is determined according to the fluorometric method (Hydes and Liss, 1976). Standard samples of dSi and dAl with concentrations of 1 mg L-1, 2 mg L-1, 4 mg L-1, 6 mg L-1, 8 mg L-1, 10 mg L-1, 20 mg L-1, 30 mg L-1, and 40 mg L-1 were used for calibration, and only the linear regression curves with correlation coefficients ≥ 0.999 were accepted according to previous studies (Barão et al., 2015). Two independent reference solutions (with concentrations of 3 mg L-1, and 9 mg L-1 of dSi and dAl) were tested before and after the continuous alkaline extractions to guarantee an analytical error below 5%. The stock standard solutions for Si and Al were made using Na2SiO3·9H2O (Sigma-Aldrich S4392) and KAl (SO4)2·12H2O (Merck 101047).
The observed siliceous organisms in the sediment samples were imaged using Scanning Electron Microscopy (SEM; FEI Quanta 200, and Hitachi TM4000). To chemically characterize the bSi and its associated authigenic aluminosilicate ‘coating’, the Scanning Electron Microscopy was coupled with an Energy Dispersive Spectrometer (SEM-EDS) analysis using FEI Quanta 200 and OXFORD X-MAX Silicon Drift Detector (detector size: 80 mm) at Ifremer-LCG (France). Typically, the bio-siliceous structures were handpicked under a stereomicroscope and mounted on an adhesive carbon tab (Leit) using a brush. The carbon tab was pasted on pin stubs and coated with gold (Cheize et al., 2019). The major elements were quantitatively determined under a high vacuum at 20 kV.
Each extraction in the continuous analysis procedure provides Si and Al concentrations through time at a one-second resolution (Figure S1), and the unit of parameter t in the models (Eq. 1 − 3) was normalized into minutes (min). Determination of the bSiO2% follows the procedure that assumes the presence of two discrete phases: (1) a linear phase indicating lithogenic silicate (lSi) dissolution and (2) a nonlinear phase indicating bSi and/or non-bSi dissolution (DeMaster, 1981; Koning et al., 2002). The bSiO2% was calculated following the 4 models (Eq.1 = Model 1; Eq.2 = Model 2 and Model 3; Eq.3 = Model 4) described by Koning et al. (2002) using the Origin 2021b software.
Model 1 demonstrates the first-order dissolution of a single Si phase (Siextr) as shown in Eq.1:
Here, Siaq and Alaq are the concentrations of silicic acid and aluminum in mg L-1, in the reaction vessel at time t (min). [Siextr]0 is the initial extractable silica present in the vessel in mg L-1, equivalent to the final concentration of Siaq reached when all extractable silica (bSi and lSi) has dissolved, k is the reactivity constant (min-1) and β1 is the atomic ratio of Si and Al released during the dissolution of extractable silica fraction. b (mg L-1 min-1) represents the constant dissolution rate of Si from clay minerals and βlin is the Si:Al ratio in the lithogenic fraction.
Natural sediment samples may consist of several types of extractable bSi. For natural samples containing two Siextr fractions (Siextr1 = ExtrSi1, Siextr2 = ExtrSi2; n = 2), the increases of the silicic acid concentration in the reaction vessel with time can be as the sum of two first-order dissolution processes (Model 2, Eq. 2), using the same parameters as described in Eq.1. For natural samples containing three Siextr fractions (n = 3), the increase in silicic acid concentration with time can be the sum of three first-order dissolution processes (described as Model 3). [Siextr]0,i is the initial extractable silica present in the extractable silica fraction i, ki is the reactivity constant and βi is the Si:Al ratio for fraction i.
Model 4 demonstrates the reactive continuum dissolution of the infinite number of fractions (i) (Eq. 3) (Koning et al., 1997) and can be described as:
Where the parameter α represents the average lifetime of the alkaline extractable components in sediment and v represents a non-dimensional parameter solely related to the shape of the distribution curve. Model 4 allows a continuum of reactivity of bSi and lSi and assumes one Si:Al ratio for all the bSi components, it is not justified by data fitting in this study. The highest number of bSi components justified by model fitting was model 2, in agreement with Barão et al. (2015) and Raimonet et al. (2015).
The alkaline extractable Si (AlkExSi) may contain several non-linear fractions, based on the Si:Al ratio and reactivity constant (k). The origin of different extractable Si fractions (bSi, lSi) can be evaluated (Koning et al., 2002). The lSi fraction (Figure 1A) is normally characterized by low reactivity (Koning et al., 2002) and small Si:Al ratios (authigenic silicates: Si:Al< 2, Mackin, 1989; Michalopoulos and Aller, 1995; Kaolinite: Si:Al = 1, Illite: Si:Al = 2, Montmorillonite, Si:Al< 5, Koning et al., 2002), the bSi fraction is characterized by high reactivity (k > 0.1 min-1 and βi > βlin) and high Si:Al ratios (βi > 5) (Koning et al., 2002; Barão et al., 2015). Moreover, chemically altered bSi structures were characterized by a nonlinear dissolution with low reactivity (k< 0.1 min-1) and low Si:Al ratio (< 5) (Koning et al., 2002).
For the fitted results from the above-mentioned models, optimization was carried out by maximizing the likelihood statistic log(L) (Armstrong et al., 2002; Moriceau et al., 2009) as described as follows:
Where N is the total number of data points, Cj is the measured concentration (mg L-1) for data point j. and the Ĉj is the corresponding model prediction. The difference in log(L) (Δ log(L)) between fits of different models to the same data gives the goodness of fit of one model compared to the other (Figure S1). As described in Moriceau et al., 2009, if the log(L) of one model is at least two points higher per added parameter than another, it is considered a better model (Hilborn and Mangel, 1997). In this study, the results from the fitted model were used for methodology comparison. A non-parametric Aligned Ranks Transformation (ART) Analysis of Variance (ANOVA) was performed using R. studio software to test for significant differences between methods.
The burial flux (Fb) of bSiO2 in sediment can be expressed as follows (Ingall and Jahnke, 1994):
Where C (mol g-1) is the concentration of bSiO2, and is calculated from the bSiO2% determined in dry sediment (in g of SiO2 g-1), and converted to mol g-1 by dividing it by the molecular weight of SiO2 (6 × 10⁻³ g mol-1), w (g cm-2 yr-1) is the mass accumulation rate. The w used in this study is averaged sediment accumulation rate at BH (0.50 g cm-2 yr-1), YS (0.37 g cm-2 yr-1) and ECS (0.26 g cm-2 yr-1) reported previously (Qiao et al., 2017). Note, a primary objective of this study was to determine the potential influence that methodological biases can have on the bSi burial flux Therefore, an average sedimentation rate of the study area was applied. The Fb was then multiplied by the respective area of the BH, the YS and the ECS to calculate the burial flux of bSi of each region and the East China seas.
Table 1 shows the abundance of the three types of marine bSi in sediment obtained from the East China seas (see Figure 2 for sample sites). All of the samples used in this study were examined under a microscope to determine the relative composition of different bSi types. Among the three major types of marine bSi (i.e., diatoms, radiolarians, sponge spicules), diatoms and sponge spicules were observed in the sediments of BH, YS, and ECS. Radiolarian skeletons were only observed in the sediment of YS and ECS. The abundance of sponge spicules and their size (length) and the number of radiolarian tests varied between samples from the BH, the YS and the ECS. Microscopic observations indicated that radiolarian skeletons were rare in the sediment of the YS, whereas more radiolarian tests were found in the sediment samples of ECS. Although sponge spicules were found in all sediment samples (Table 1), the size of sponge spicules in the sediment of the BH (length: 10 − 40 μm), and YS (length: 50 − 300 μm) are smaller than that of the ECS (100 − 500 μm). The abundance of sponge spicules in the sediment of BH and YS is less than what was observed for diatoms. In contrast, the abundance of sponge spicules was greater than diatoms in ECS sediment samples (Table 1).
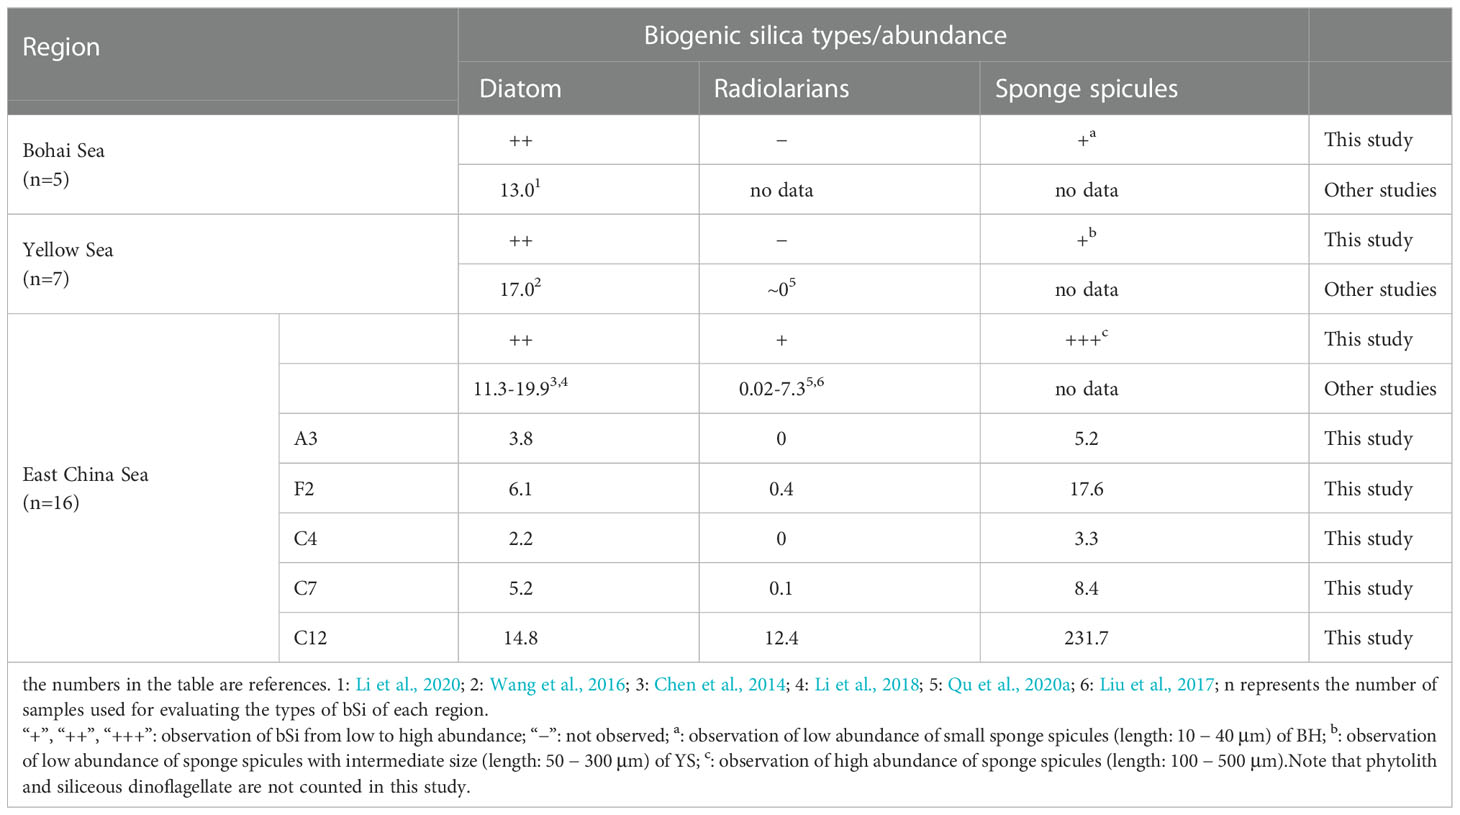
Table 1 Different types of marine bSi (diatoms, radiolarians, sponge spicules) and their abundances (103 g-1 dry sediments) in the surface sediment of East China seas.
We found that radiolarians and sponge spicules were more abundant in the sediment of the ECS than the BH and the YS from the microscopic observations. Therefore, five samples (C4, C7, C12, F2, and A3) were selected from the ECS for determining the abundance of different types of bSi. The radiolarians and sponge spicules are more abundant in the offshore sediment (C7, C12) than in nearshore sediment (A3, F2, C4). The abundance of sponge spicules is greater than that of diatom tests in the 5 samples (C4, C7, C12, F2, A3) from ECS, especially in sample C12 where the abundance of sponge spicules (231.7 × 10³ g-1) is ca. 15 times greater than that of diatoms (14.8 × 10³ g-1). The abundance of diatoms is similar for the BH, YS and ECS, which is in agreement with previous research (Chen et al., 2014; Wang et al., 2016; Li et al., 2018; Li et al., 2020). However, radiolarians and sponge spicules are more abundant in the ECS, especially in the sediment of the outer shelf of the ECS.
Two interlaboratory comparison sediment samples (Still Pond, R-64) were measured using Si/time (Figure S2) and Si/Al (Figure S3) alkaline digestion to assess the accuracy of the biogenic silica measurement. Similar results were obtained to previous works (Table 2), but also showed dependence on the extraction method. The bSiO2% applying a 0.5 M NaOH digestion (Still Pond: 2.74%; R-64: 7.23%) and a 0.1 M Na2CO3 digestion (Still Pond: 2.00 ± 0.05%; R-64: 5.50 ± 0.10%) are within the acceptable range of bSiO2% values (Still Pond: 2.82 ± 1.17%; R-64: 6.49 ± 2.09%) reported in Conley (1998) (Table 2). The wide range of data presented in Conley (1998) is likely due to the influence of methodological differences applied (alkaline solution concentration and/or chemical pretreatment), the act of crushing the sediment prior to the alkaline attack, and the existence of sponge spicules in Still Pond and R-64 which was not previously reported in Conley (1998), because siliceous sponge spicules were observed in both reference samples. The coefficient of variability (i.e., relative standard deviation) for five parallel extractions was< 3%, indicating good reproducibility.
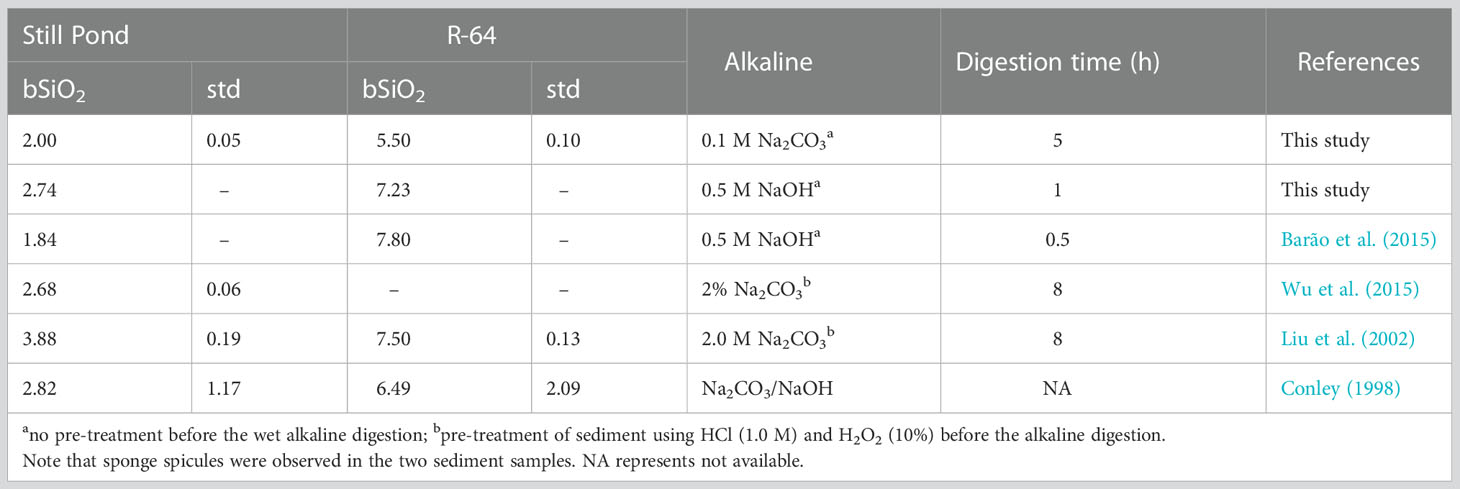
Table 2 The bSiO2% of interlaboratory comparison sediment samples (Still Pond and R-64). The location of the two samples is described in Conley (1998).
The results presented here compare the analysis of bSiO2% determined using different Si/time methods. Triplicate digestion of the pre-treated (P) and non-pretreated (NP) sediment (Figure 3) was performed to determine the influence of the pre-treatment process on bSi determination. As expected, stronger solutions and pretreatment of sediment led to a greater release of silica (Table 3, Figures 3, 4). According to the different alkaline digestion and microscopic observation, this is mainly due to the extraction of lSi rather than bSi (e.g., sponge spicules). The pre-treatment of sediment using HCl (1.0 M) and H2O2 (10%) as described by Mortlock and Froelich (1989) will activate the authigenic silicate phases and the clay minerals, thus cause an overestimation of the bSiO2%.
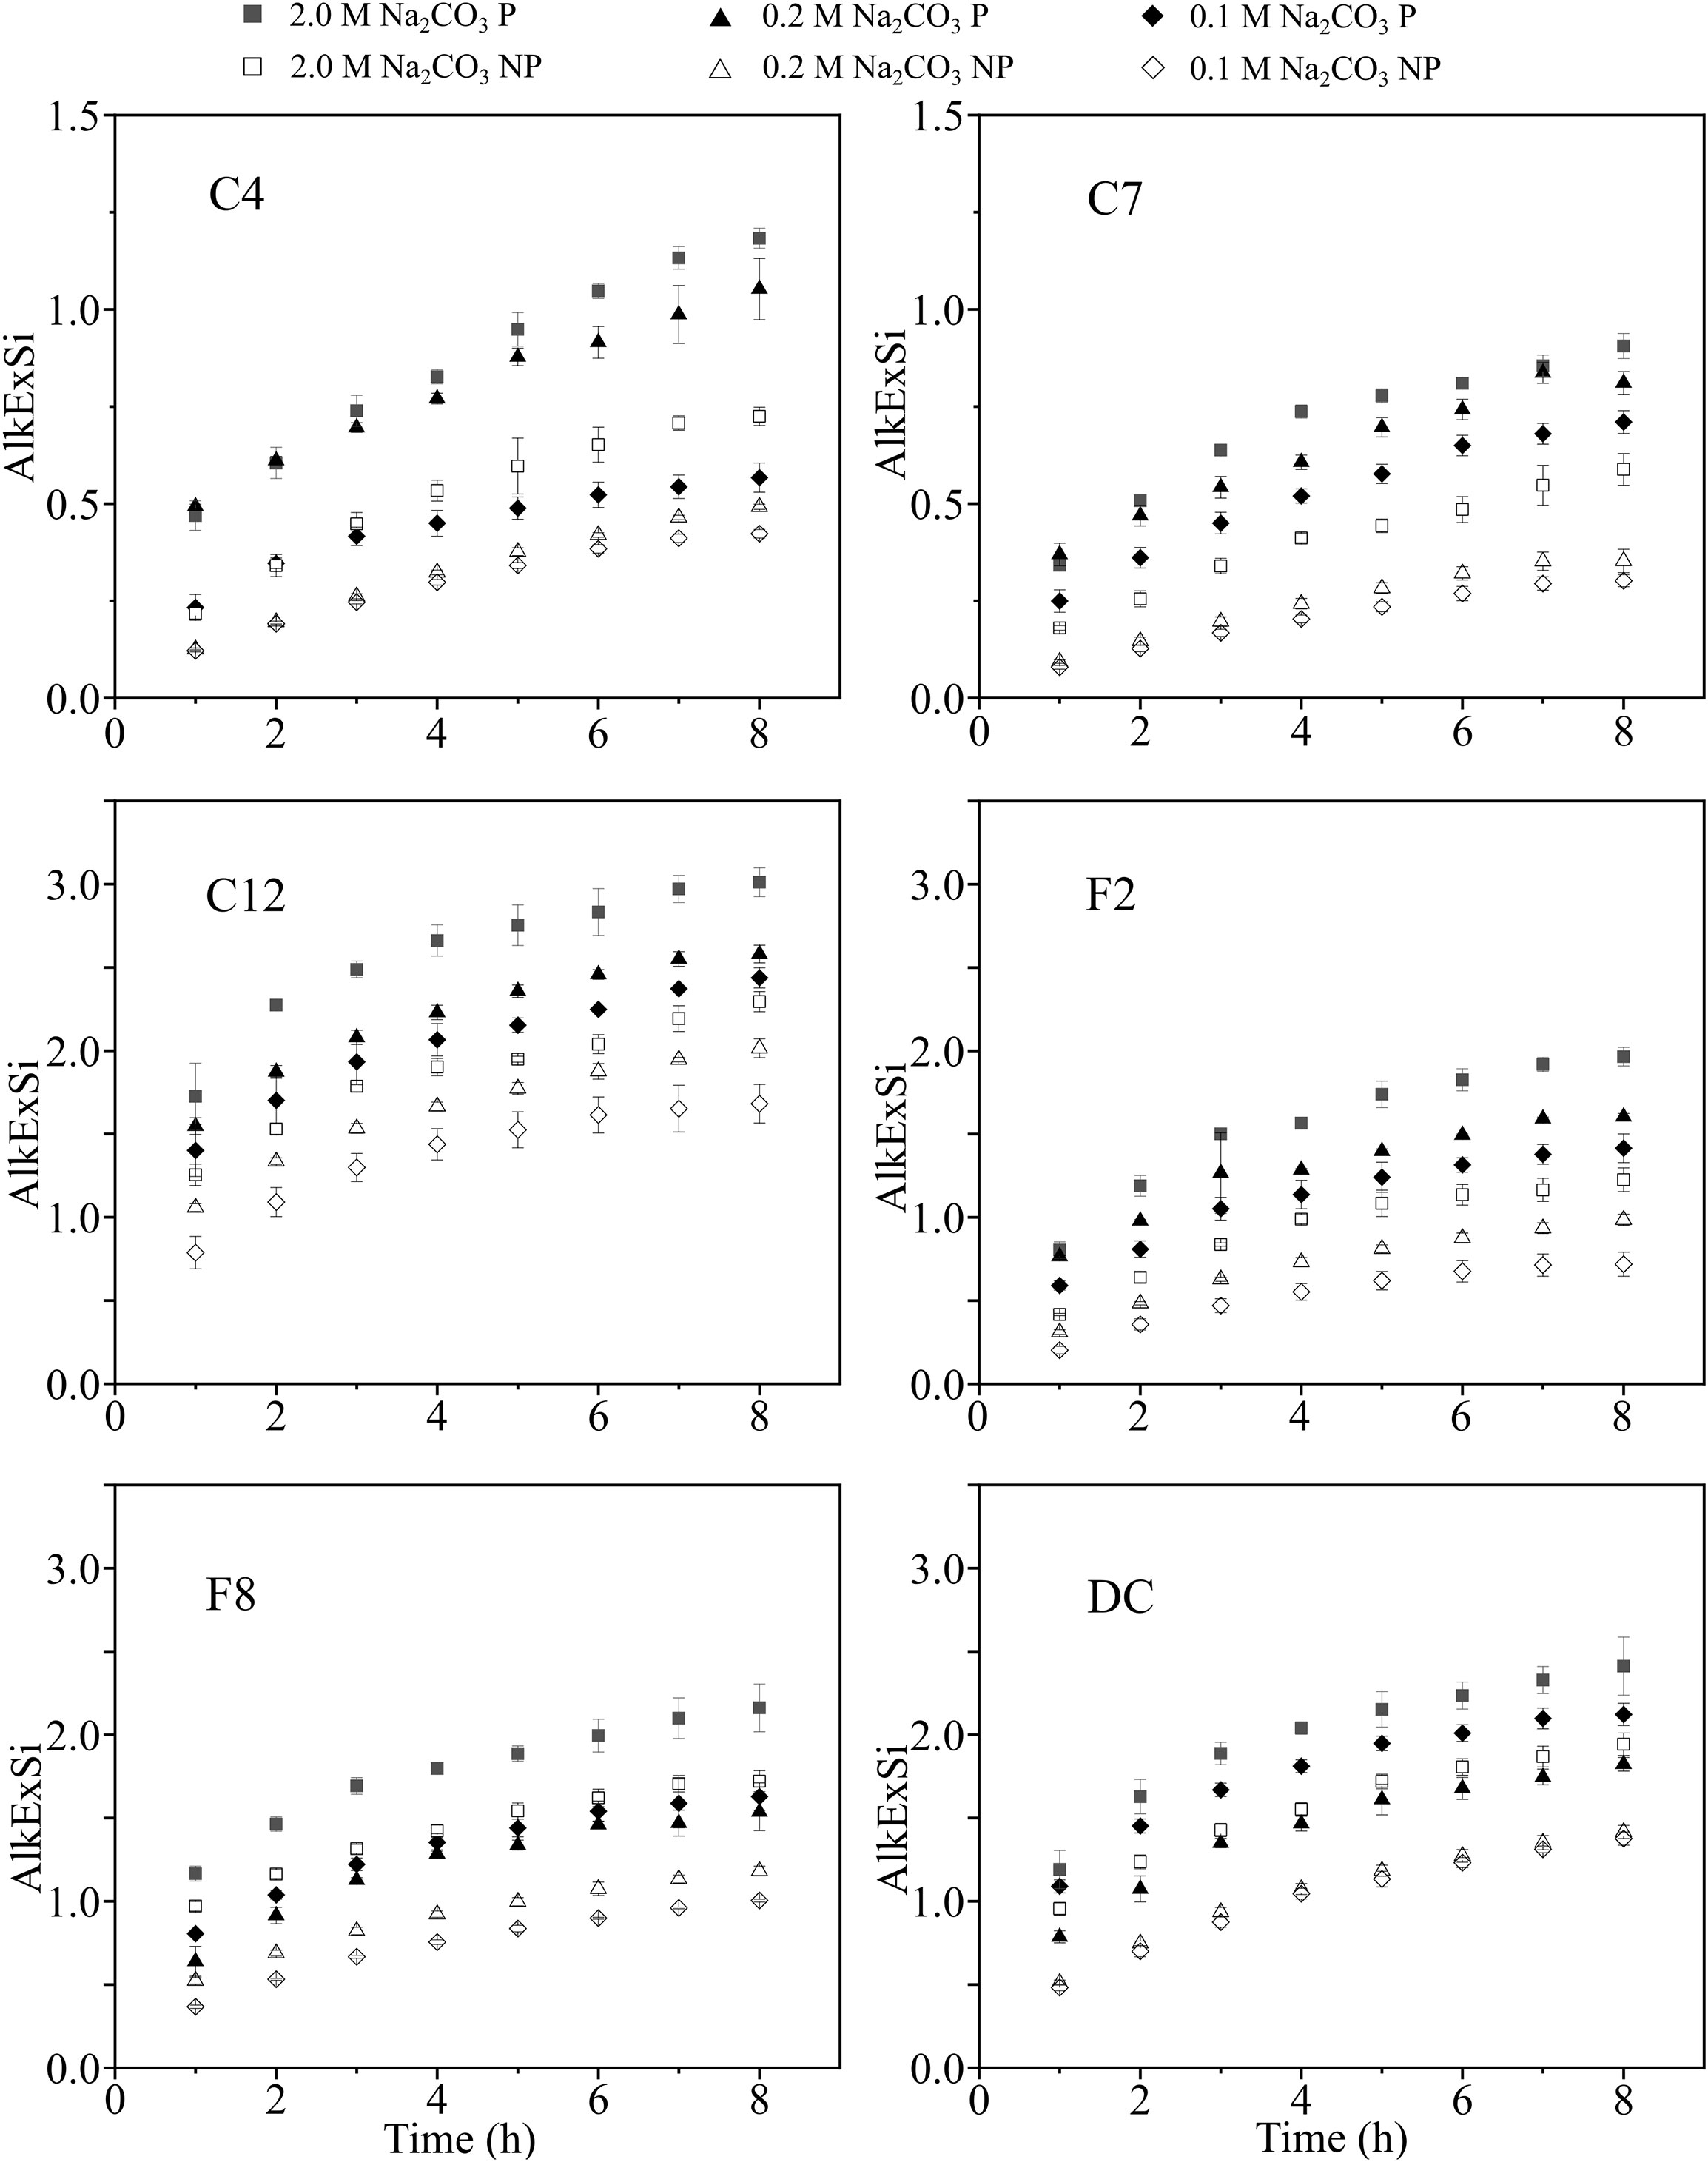
Figure 3 Conventional wet alkaline digestion using Na2CO3 (0.1 M, 0.2 M and 2.0 M; P vs. NP) solution. A subsample was removed at each 1 h with a total extraction of 8 h. The alkaline extracted silica content (SiO2%) was normalized into the dry weight of the sediment. P represents pretreatment of sediment using HCl (1.0 M) and H2O2 (10%) before digestion; NP represents no pretreatment before alkaline digestion. The error bars were averaged from triplicate digestions. The locations of samples C4, C7, C12, F2, F8, and DC are shown in Figure 1.
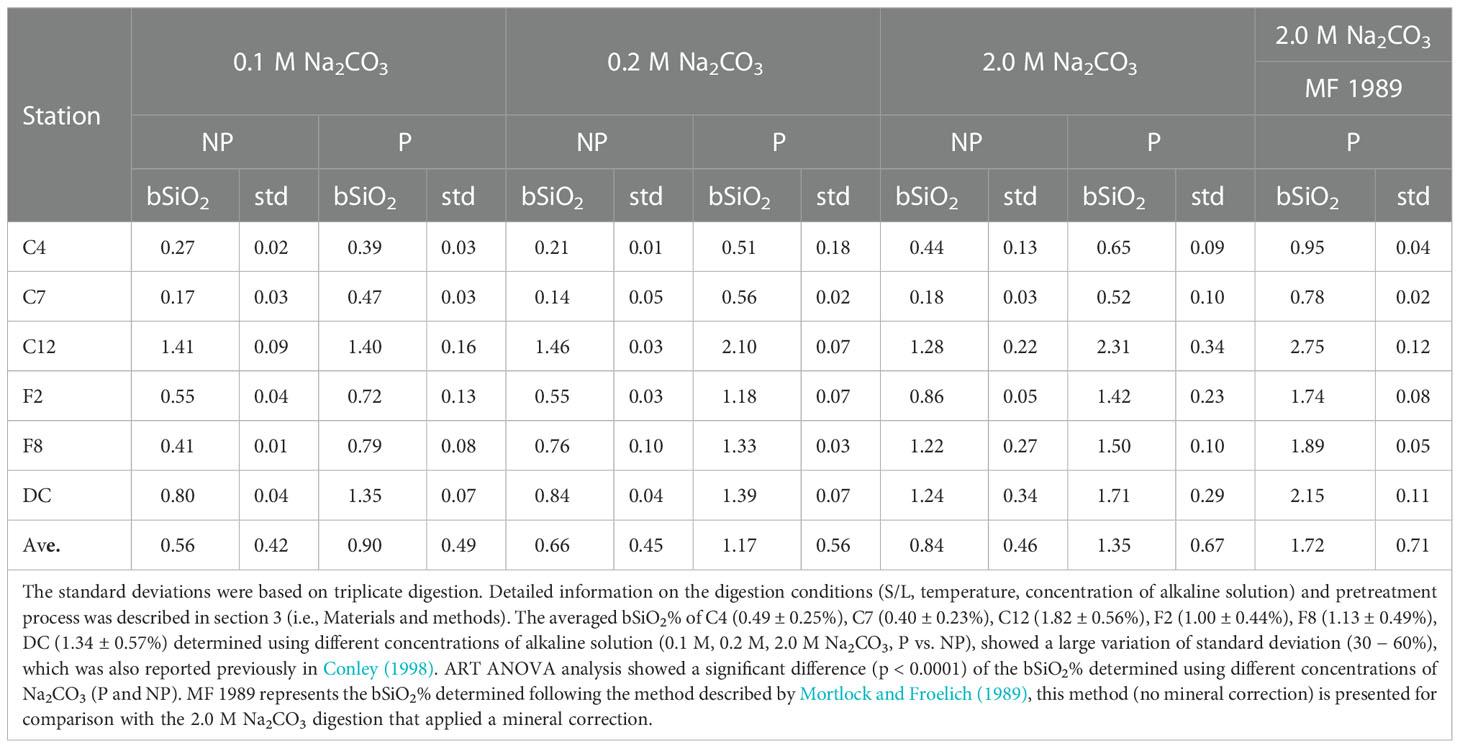
Table 3 The bSiO2% was determined using 0.1 M, 0.2 M and 2.0 M Na2CO3 (P vs. NP).
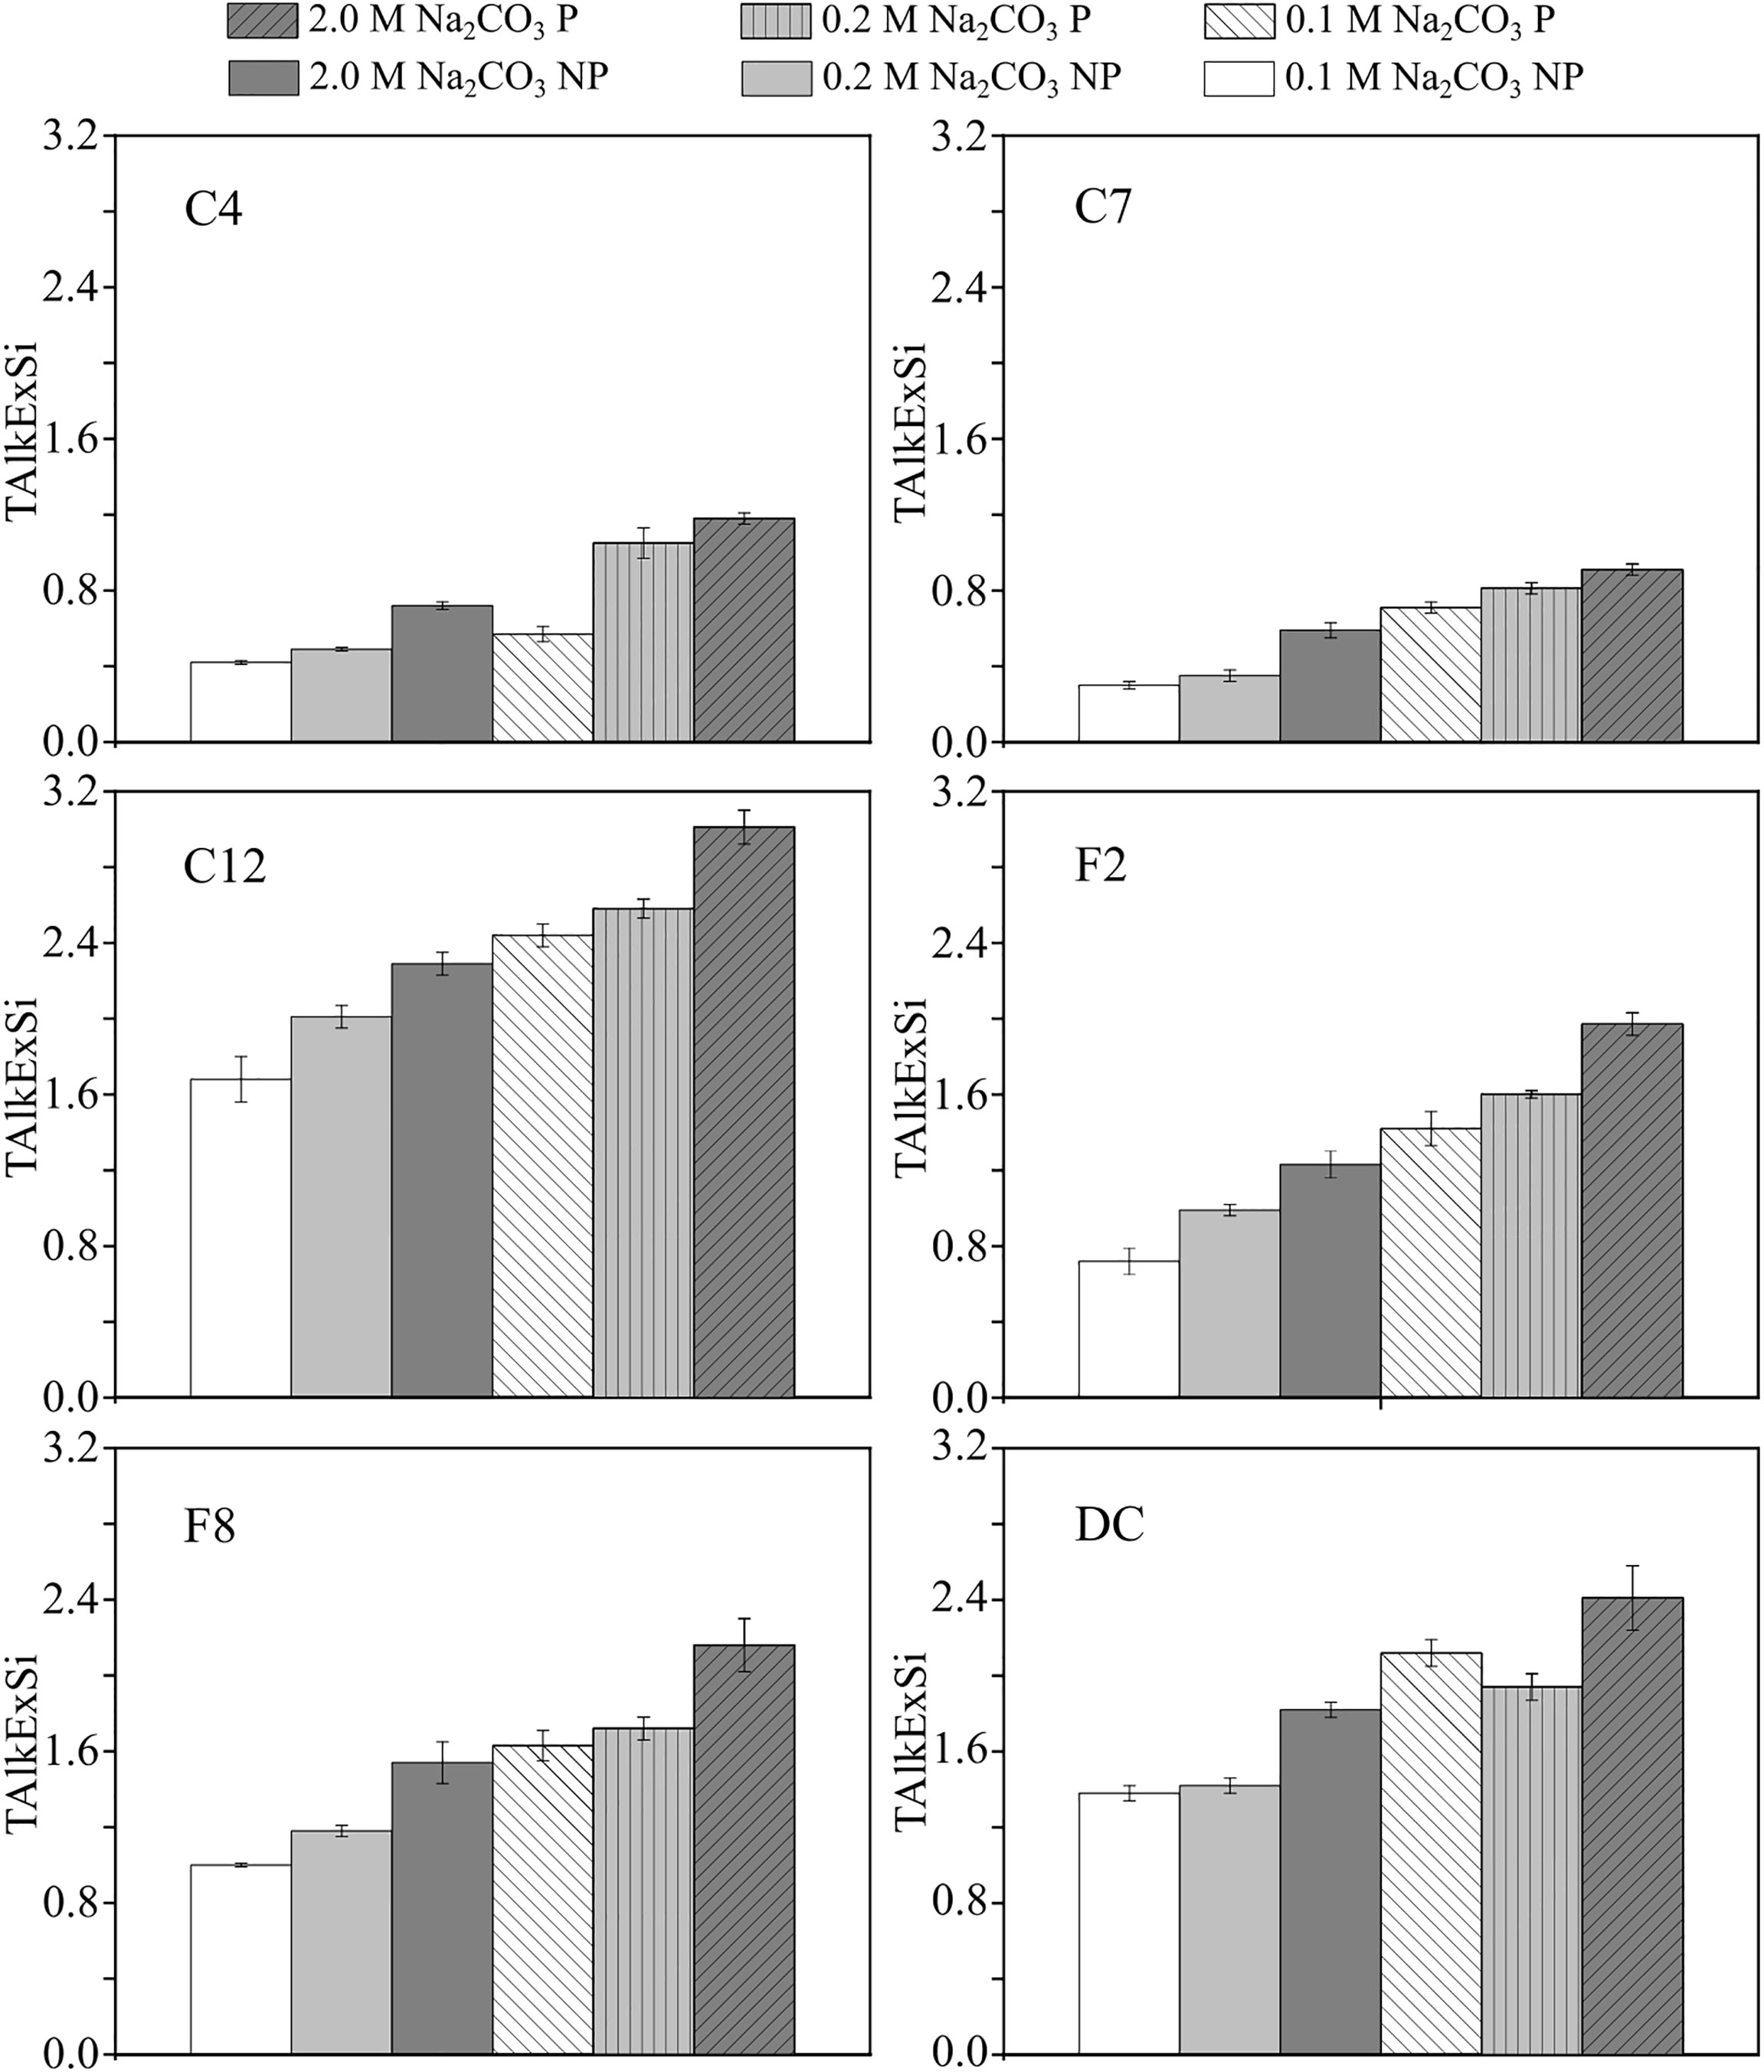
Figure 4 The total alkaline extracted silica content (TAlkExSi) of sample C4, C7, C12, F2, F8, DC using 0.1 M, 0.2 M, 2.0 M Na2CO3 solution (P vs. NP). The results presented are the SiO2% extracted after 8 h. More SiO2% was extracted in a high concentration of the alkaline solution and after the pre-treatment process.
Figure 3 shows a continuous increase of the SiO2% over time. The alkaline extracted silica (AlkExSi) content is higher for the pretreated sediments than the non-pretreated sediments. Similar result was obtained for the total amount of alkaline extracted silica (TAlkExSi) after the 8 h digestion (0.1 M Na2CO3, P > 0.1 M Na2CO3, NP; 0.2 M Na2CO3, P > 0.2 M Na2CO3, NP; 2.0 M Na2CO3, P > 2.0 M Na2CO3, NP; Figure 4). As shown in Figure S4 and Figure S5, most of the SiO2 was leached from sediments during the first 4 h (AlkExSi(1-4)) and less SiO2 was extracted during the 5 h to 8 h digestion (AlkExSi(5-8)). The quantity of AlkExSi(1-4) and AlkExSi(5-8) correspond to 66% − 86% and 14% − 34% of total amount of silica (TAlkExSi; TAlkExSi = AlkExSi(1-4) + AlkExSi(5-8)) extracted during the 8 h alkaline digestion (Figure S5). In addition, the AlkExSi(1-4) leached from the pre-treated sediment was higher than from the non-pretreated sediment (Figures S4, S5), and the amount of the AlkExSi(5-8) was low (< 0.2%SiO2) and showed small variations when digested under different alkaline solutions (0.1 M, 0.2 M and 2.0 M Na2CO3, P vs. NP). Moreover, more silica (AlkExSi(1-4) and AlkExSi(5-8)) can be leached in stronger alkaline, but the proportion of AlkExSi(1-4) and AlkExSi(5-8) to TAlkExSi does not change much (Figure S5).
Table 3 and Figure S6 showed the bSiO2% calculated from the 8 h digestion experiment. Through ART ANOVA analysis, a significant difference between different alkaline digestions was identified (Table S1). ART ANOVA analysis showed the increase of bSiO2% between 0.1 M Na2CO3 (P vs. NP), 0.2 M Na2CO3 (P vs. NP) and 2.0 M Na2CO3 (P vs. NP) were significant (p< 0.0001); Noymer (2008) (Table S1). The yield, expressed as bSiO2%, between the P and the NP alkaline digestions are: 0.1 M Na2CO3 (P) = 194% 0.1 M Na2CO3 (NP), 0.2 M Na2CO3 (P) = 226% 0.2 M Na2CO3 (NP) and 2.0 M Na2CO3 (P) = 185% 2.0 M Na2CO3 (NP) in average (calculated from Table 3). Besides the pre-treatment process, a higher concentration of Na2CO3 can extract more silica significantly (p< 0.0001) than a lower concentration of Na2CO3 (C7, F2, F8 and DC; Figure S6), except for the bSiO2% determined using a 0.2 M Na2CO3 (P) and the 2.0 M Na2CO3 (P) digestion (p = 0.0726). For the non-pretreated (NP) digestion experiment, the average bSiO2% extracted using 2.0 M Na2CO3 solution is 49% and 69% higher than the 0.2 M Na2CO3 and 0.1 M Na2CO3 digestion, respectively. However, the bSiO2% of samples C7 and C12 was approximately the same when the sample was digested using different concentrations of Na2CO3 (0.1, 0.2, 2.0 M), and the bSiO2% of samples C4, F2, F8, and DC was higher when using a higher concentration of Na2CO3 solution (Figure S6). Compared to the alkaline concentration, the pretreatment process has a more important influence on bSi determination. The bSiO2% determined following the single-step alkaline digestion method proposed for abyssal deposits (Mortlock and Froelich, 1989) generated much higher bSiO2% values (p< 0.0001) than all other digestions. Moreover, the bSiO2% determined using 0.1 M Na2CO3 (NP; DeMaster, 1981) was not significantly different (p = 0.0726) compared to the bSiO2% determined using 0.5 M NaOH (NP; Koning et al., 2002) (Table S1). The bSiO2% determined by 2.0 M Na2CO3 (P) is about 2.6 times of the bSiO2% determined by 0.1 M Na2CO3 (NP). The average bSiO2% of samples C4, C7, C12, F2, F8 and DC determined using different methods (0.1 M, 0.2 M, 2.0 M Na2CO3, P vs. NP; Table 3) were 0.49 ± 0.25%, 0.40 ± 0.23%, 1.82 ± 0.56%, 1.00 ± 0.44%, 1.13 ± 0.49% and 1.34 ± 0.57% respectively, showed a large variation (31 − 57%) of the standard deviation. The proportion of standard deviation to the averaged bSiO2% was large for low bSiO2% samples (C4: 51%, C7: 57%) than other samples. After the alkaline digestions, microscopic observations (10X; Zeiss Axio Observer A1) showed complete digestion of diatoms and radiolarians, whereas sponge spicules remain present.
A 20 h-alkaline digestion (Figure S7) was performed for separating different bSi (diatom, radiolarian and sponge) from lSi using the Si dissolution rate (Conley and Schelske, 2001). Microscopic observations of the sediment residual indicated that diatoms and radiolarian skeletons were digested completely while sponge spicules were not fully extracted. The time-dependent methods (e.g., 5 h, DeMaster (1981); 8 h, Liu et al. (2002); 20 h, Conley and Schelske (2001)) all showed variations which emphasize that the fixed duration approach (Mortlock and Froelich, 1989) is insufficient in the study area. The time-dependent methods yield different bSiO2% estimates, that accord with the duration of digestion, i.e., the 5 h digestion with the shortest time showed the least bSiO2% (0.22 ± 0.18%), the moderate duration (8 h) of the attack gave an intermediate bSiO2% (0.40 ± 0.29%), and the longest duration of digestion produce the highest bSiO2% (0.52 ± 0.34%) (Table 4). The ART ANOVA analysis indicated a significant (p< 0.0001) difference in the bSiO2% among the three different time intervals.
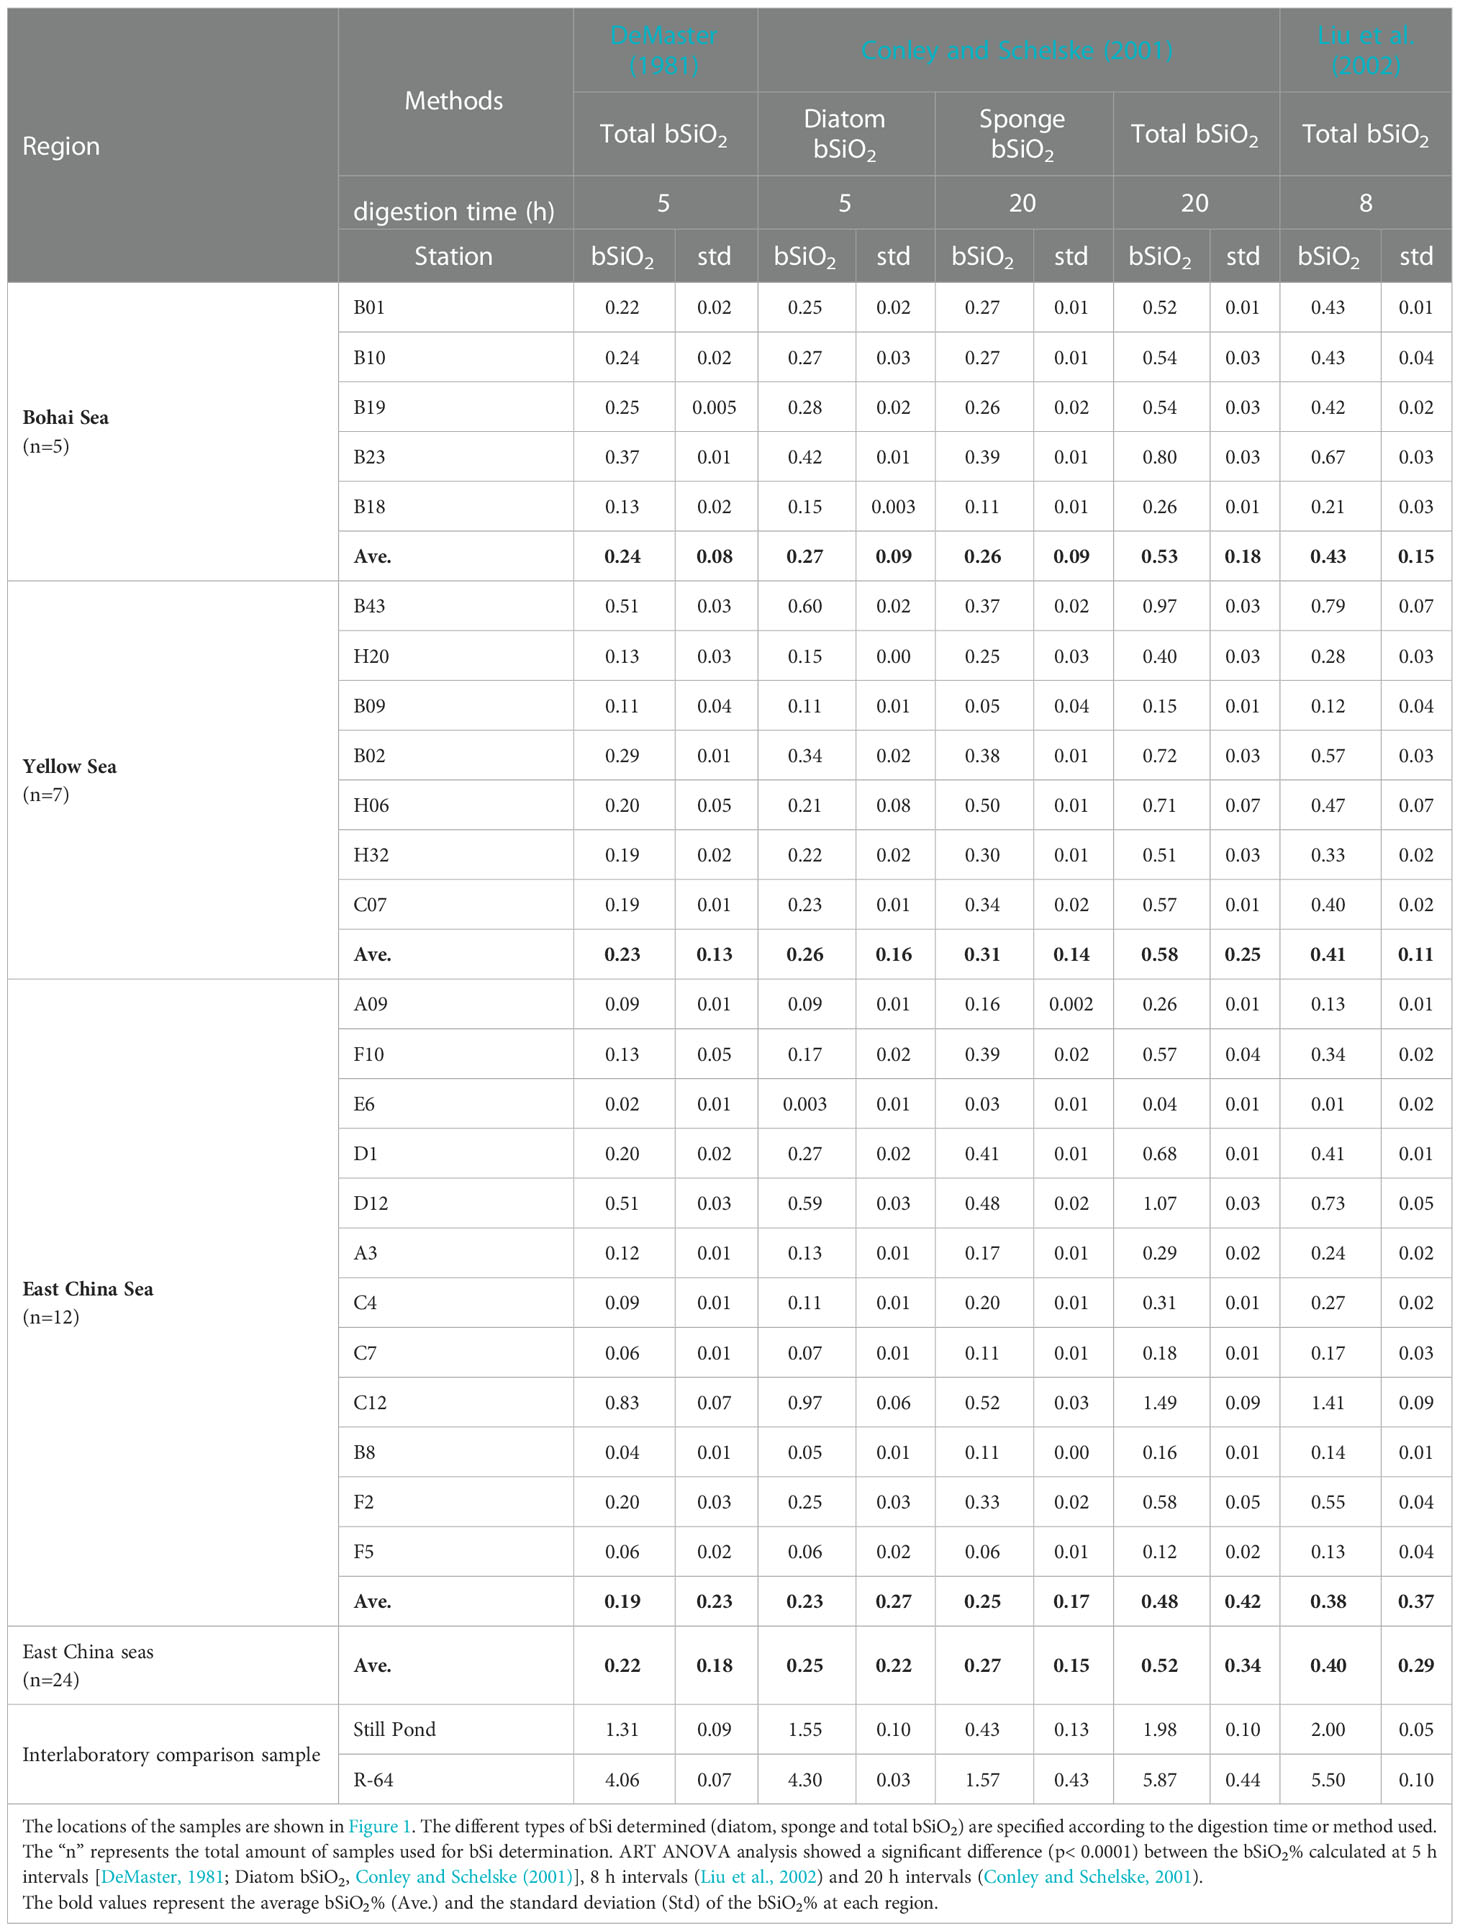
Table 4 The bSiO2% in sediments of the East China seas (BH, YS, ECS) was determined using the Si/time alkaline digestion method (0.1 M Na2CO3; NP).
According to the method described in Conley and Schelske (2001), the diatom bSiO2%, radiolarian and sponge bSiO2% were calculated at a 5 h and 20 h digestion interval, respectively (Table 4, Figure S8). The diatom bSiO2%, radiolarian and sponge bSiO2% and total bSiO2% in sediment used in this study averaged 0.25 ± 0.22% (0.003 – 0.97%), 0.27 ± 0.15% (0.03 – 0.52%) and 0.52 ± 0.34% (0.04 – 1.49%), respectively (Table 4). The amount of diatom bSiO2% is approximately equal to the amount of radiolarian and sponge bSiO2% (Figure S8). ART ANOVA analysis showed a significant difference (p< 0.0001) between diatom bSiO2%, radiolarian and sponge bSiO2% and the total bSiO2%. Detailed calculations of the averaged bSiO2% of the BH, YS and ECS were also presented (Table 4).
The Si/Al method is proposed based on the assumption that Si is extracted continuously from bSi and lSi whereas the Al is extracted mainly from lSi (Koning et al., 1997; Kamatani and Oku, 2000; Koning et al., 2002), therefore the quantity of bSi and lSi can be corrected using the Si:Al ratio (Kamatani and Oku, 2000). The purpose of determining the bSiO2% using the Si/Al method is to fully digest bSi and correct the lSi properly. It should be noted that after 1 h digestion using 0.5 M NaOH, diatoms were not observed whereas a few radiolarian skeletons and some sponge spicules were observed within the residual sediment of ECS samples (Figure S9). Therefore, the Si/Al alkaline digestion method determines mostly diatom bSi and radiolarian bSi and partly sponge bSi, instead of the total bSiO2%.
The measured dSi and dAl results and the best fit models were shown in Figure S3. After the likelihood statistic (Eq. 4) analysis, we found most samples (27/30 samples including sample Still Pond and R-64) were fitted better with 2 components (Model 2) than 1 component (Model 1), and the time evolution of release rates and Si:Al ratios were never sufficient to justify higher component models (Models 3 or 4). Generally, Si and Al were released non-linearly during the first 20 minutes and followed by a linear dissolution, and the AlkExSi was always higher than the AlkExAl (Figure S3). The bulk Si:Al ratios (2< Si:Al< 20) were high at the beginning of digestion and decreased to a relatively constant value (2< Si:Al< 5 for most samples, except D12 and C12) after 30 min (Figure 5), showing a rapid bSi dissolution during the< 30 min and complete extraction of bSi after > 50 min. The TAlkExSi ranged from 0.65 mg-Si g-1 to 24.0 mg-Si g-1, whereas the total alkaline extracted Al content (TAlkExAl) ranged from 0.14 mg-Si g-1 to 6.0 mg-Si g-1, with a relative constant βlin (2.71 ± 0.63, Table 5).
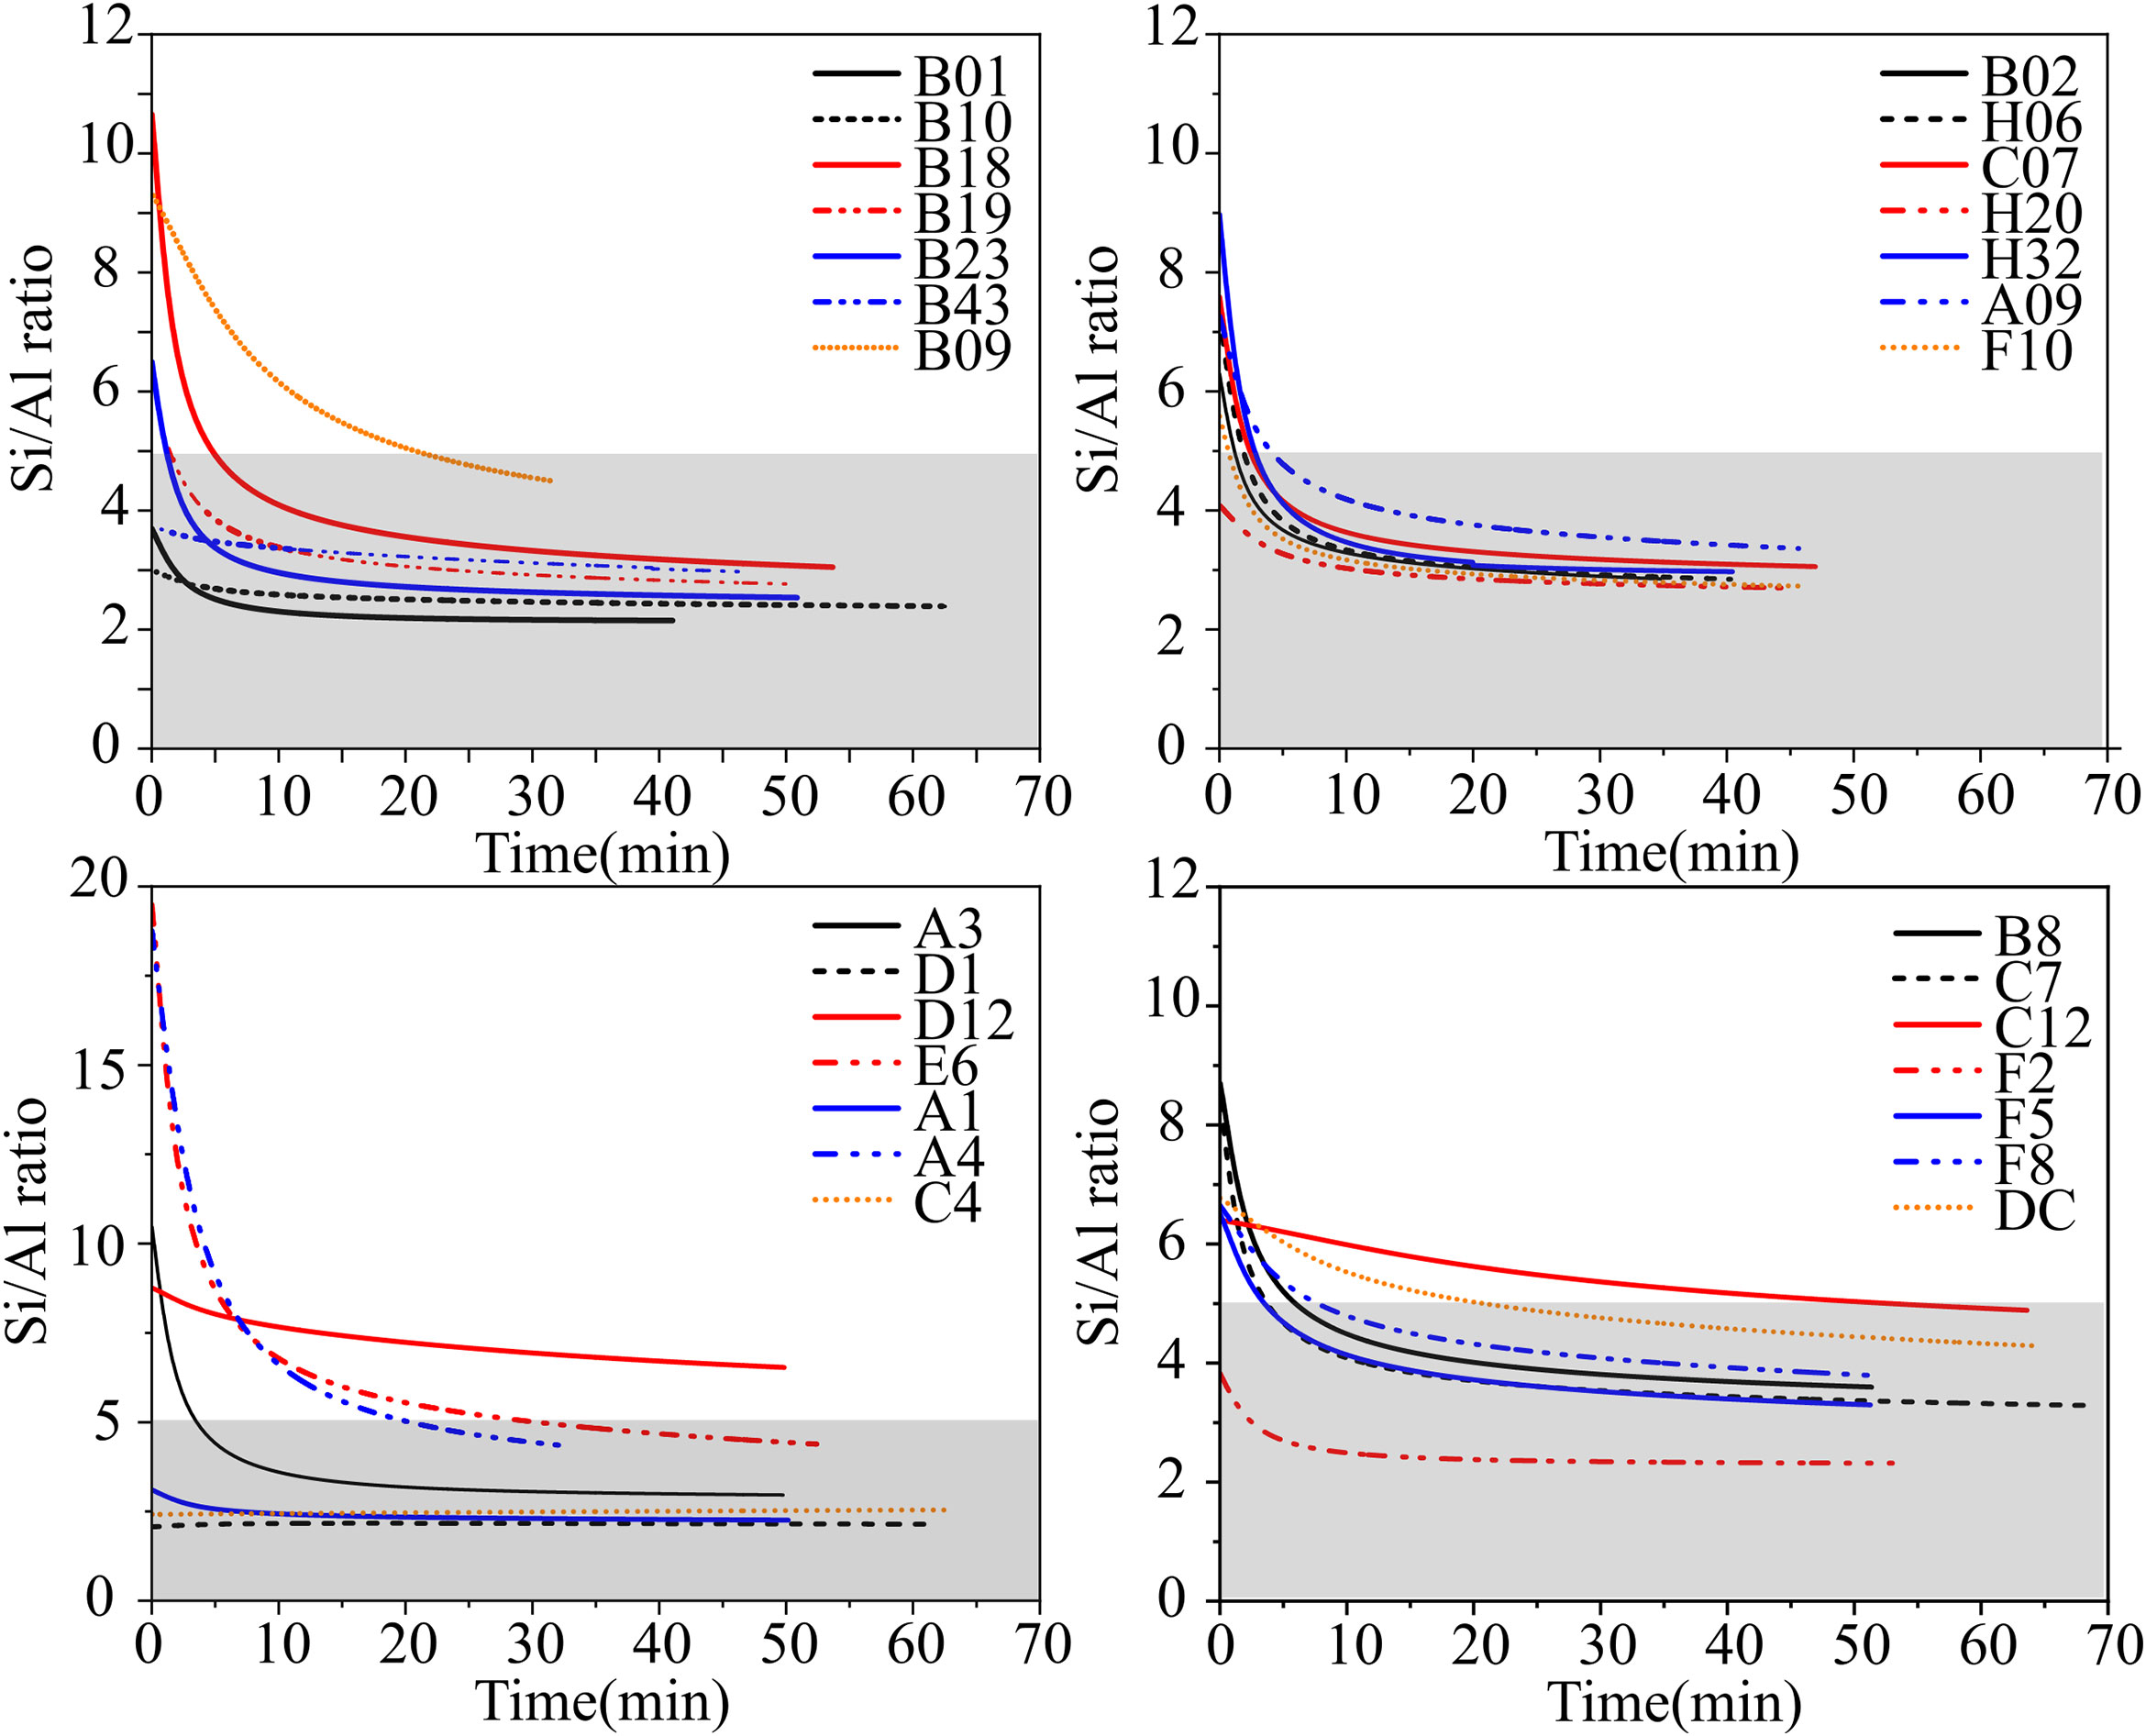
Figure 5 The Si:Al ratio during alkaline digestion. Sediments were digested following the method described in Koning et al. (2002) and Barão et al. (2015). The grey area represents the Si:Al below 5, indicating the extraction of lSi.
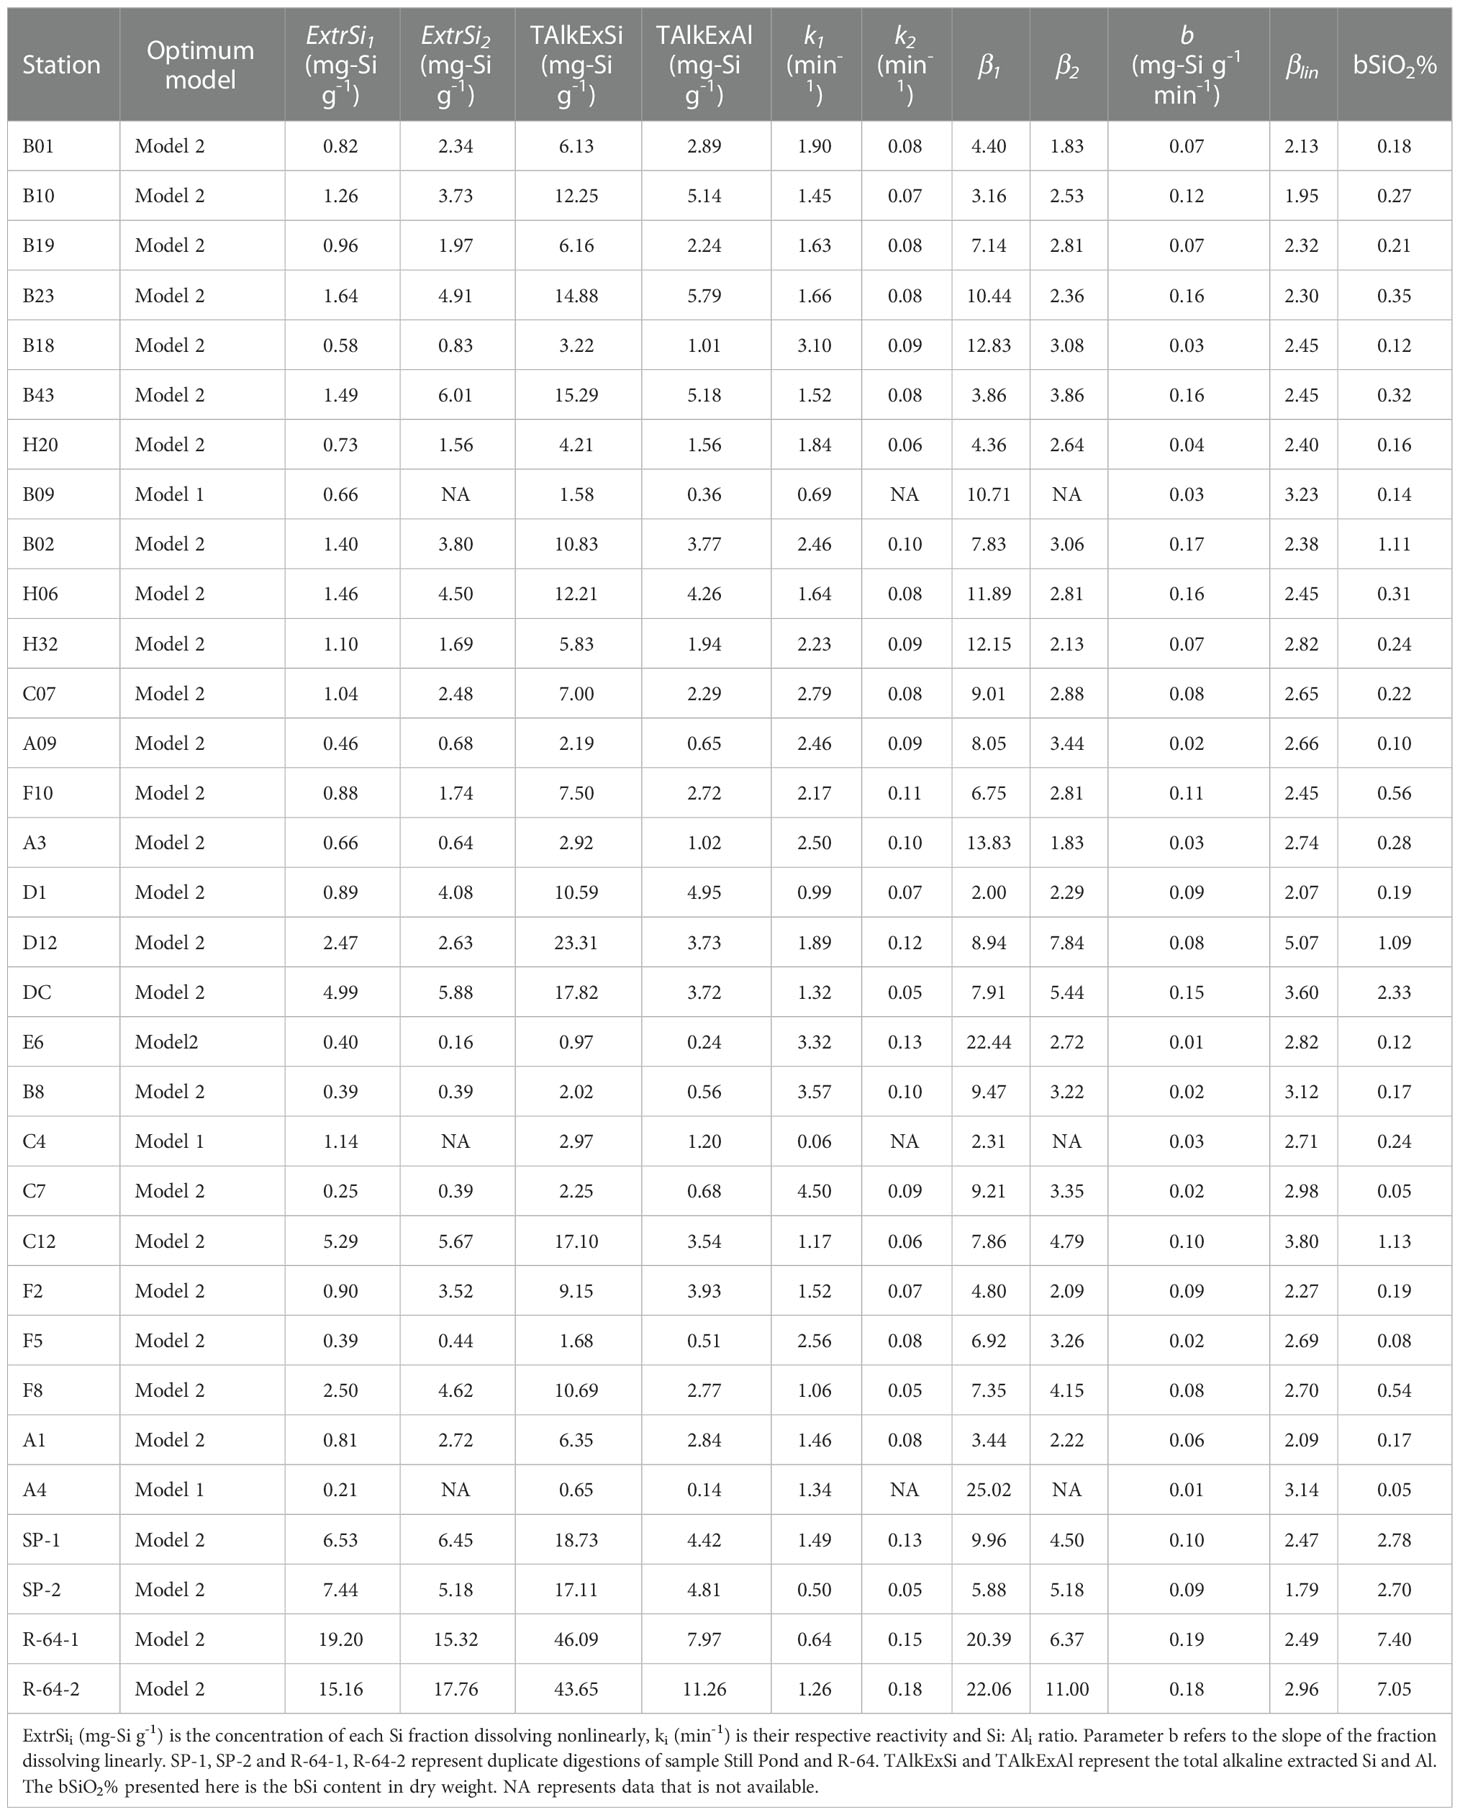
Table 5 Parameters from the Si and Al continuous dissolution (Si/Al method) with 0.5 M NaOH (1 h digestion).
The reactivity constant (k) of the first non-linear fraction (average k1 = 1.96 min-1) was greater than the second fraction (average k2 = 0.084 min-1) (Figure 6), and the β1 is higher than the β2 (except for D1, Table 5). Figure 6 showed a wide range of Si:Al ratios for β1 (2<β1< 25) and k1 (0.5< k1< 5), and small ranges of β2 (2<β2< 8) and k1 (0< k2< 0.2). In addition, β2 has similar Si:Al ratios compare to βlin, and β1 is always higher than the βlin (Figure 6). The ExtrSi1, ExtrSi2 and the linear lSi fraction account for 19.3 ± 9.9%, 27.4 ± 12.6% and 53.3 ± 10.1% of the TAlkExSi, respectively (Table S2). Based on Si:Al ratio (βi) and the reactivity (ki), the calculated bSiO2% (dry weight) and lSiO2% (linear lSi fraction + non-linear lSi fraction) in sediments of East China seas were 1.82 ± 2.28 mg-Si g-1 (0.39 ± 0.49%bSiO2) and 5.95 ± 4.69 mg-Si g-1 (1.28 ± 1.00% bSiO2), respectively (calculated from Table 5). However, the definition of bSi (βi > 5 or βlin< βi< 5 & k > 0.1 min-1) and lSi (1< Si/Al< 4) (Koning et al., 2002; Barão et al., 2015) based on Si/Al ratios and reactivity may limit our understanding of the different Si fractions. Our results showed that sometimes β2< βlin (B01, H32, A3, E6, F2; Table 5), suggest that the ExtrSi2 is lSi origin. However, whether this fraction is authigenic silicate is not clear, because the Si:Al ratio of authigenic silicates (< 2, Mackin (1989); Michalopoulos and Aller (1995)) and clay mineral (1- 4, Koning et al. (2002)) are both below 5. Barão et al. (2015) found the non-linear Si fractions (ExtrSi1, ExtrSi2) obtained using the Si/Al alkaline digestion method is higher than the bSiO2% examined using the Si/time method (0.1 M Na2CO3). However, the ExtrSi1 is approximately equal to diatom bSiO2% (Barão et al., 2015). Implies the reactive non-linear fraction originates from the diatom bSi and the less reactive non-linear fraction originates from less soluble Si fractions (implicating resistant bSi, such as radiolarians, sponge spicules and/or altered diatoms, or lSi). So far, we cannot differentiate the less soluble Si fractions. A future study looking at the alkaline digestion of diatoms, radiolarian skeletons, sponge spicules and synthesized sediment using both Si/Al method and Si/time method would improve our understanding of the definition of different Si fractions.
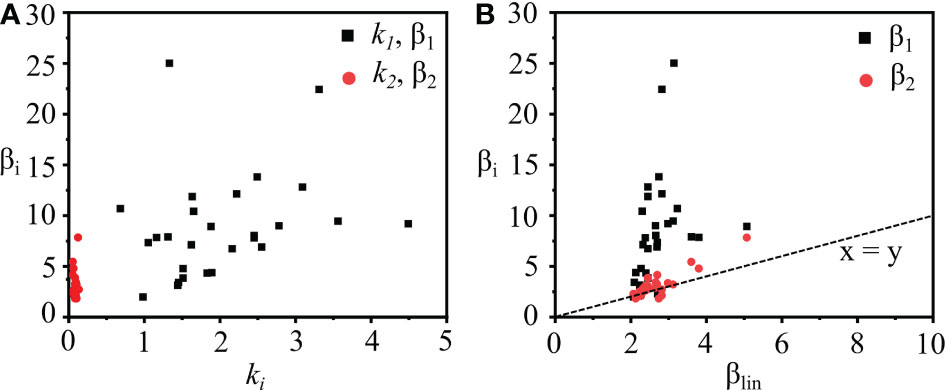
Figure 6 The plots show parameters (βi, βlin, ki) from the modeling results. (A) shows the relationship between the Si:Al ratio (βi) and the reactivity (ki) of the nonlinear dissolution Si fractions, the reactivity of the first nonlinear fraction (k1) is higher than the second nonlinear fraction (k2). The range of β1 (1 < β1< 25) is bigger than β2 (2 < β2< 10). (B) shows the relationship of the Si:Al ratio between the two non-linear dissolving fractions (β1, β2) and lSi (βlin). β1 is bigger than β2 and βlin and β2 is approximately equal to βlin.
The existence of a clay mineral “coating” on the surface of the siliceous organism was observed by SEM (Figure 7, Figure S10) in samples before alkaline digestion. Generally, the diatoms and radiolarian tests were coated with more clay minerals than the siliceous sponge spicules. Diatom frustules in sample A1 were pre-treated using HCl (1.0 M) and H2O2 (10%), showing the partial removal of the coated clay minerals after the pre-treatment process. Additionally, Si, Al, K, Mg, Ca, Fe, Ti, S and As were detected from the diatom tests in sample A1 (Figure S10), indicating incomplete removal of clay materials (authigenic and/or allogenic clays) after pre-treatment. Besides Si and O, the major metal elements from reaction products of the reverse weathering process, such as Al, Mg, K and Fe (Michalopoulos and Aller, 2004), were commonly detected through EDS-SEM analysis (Figure S10).
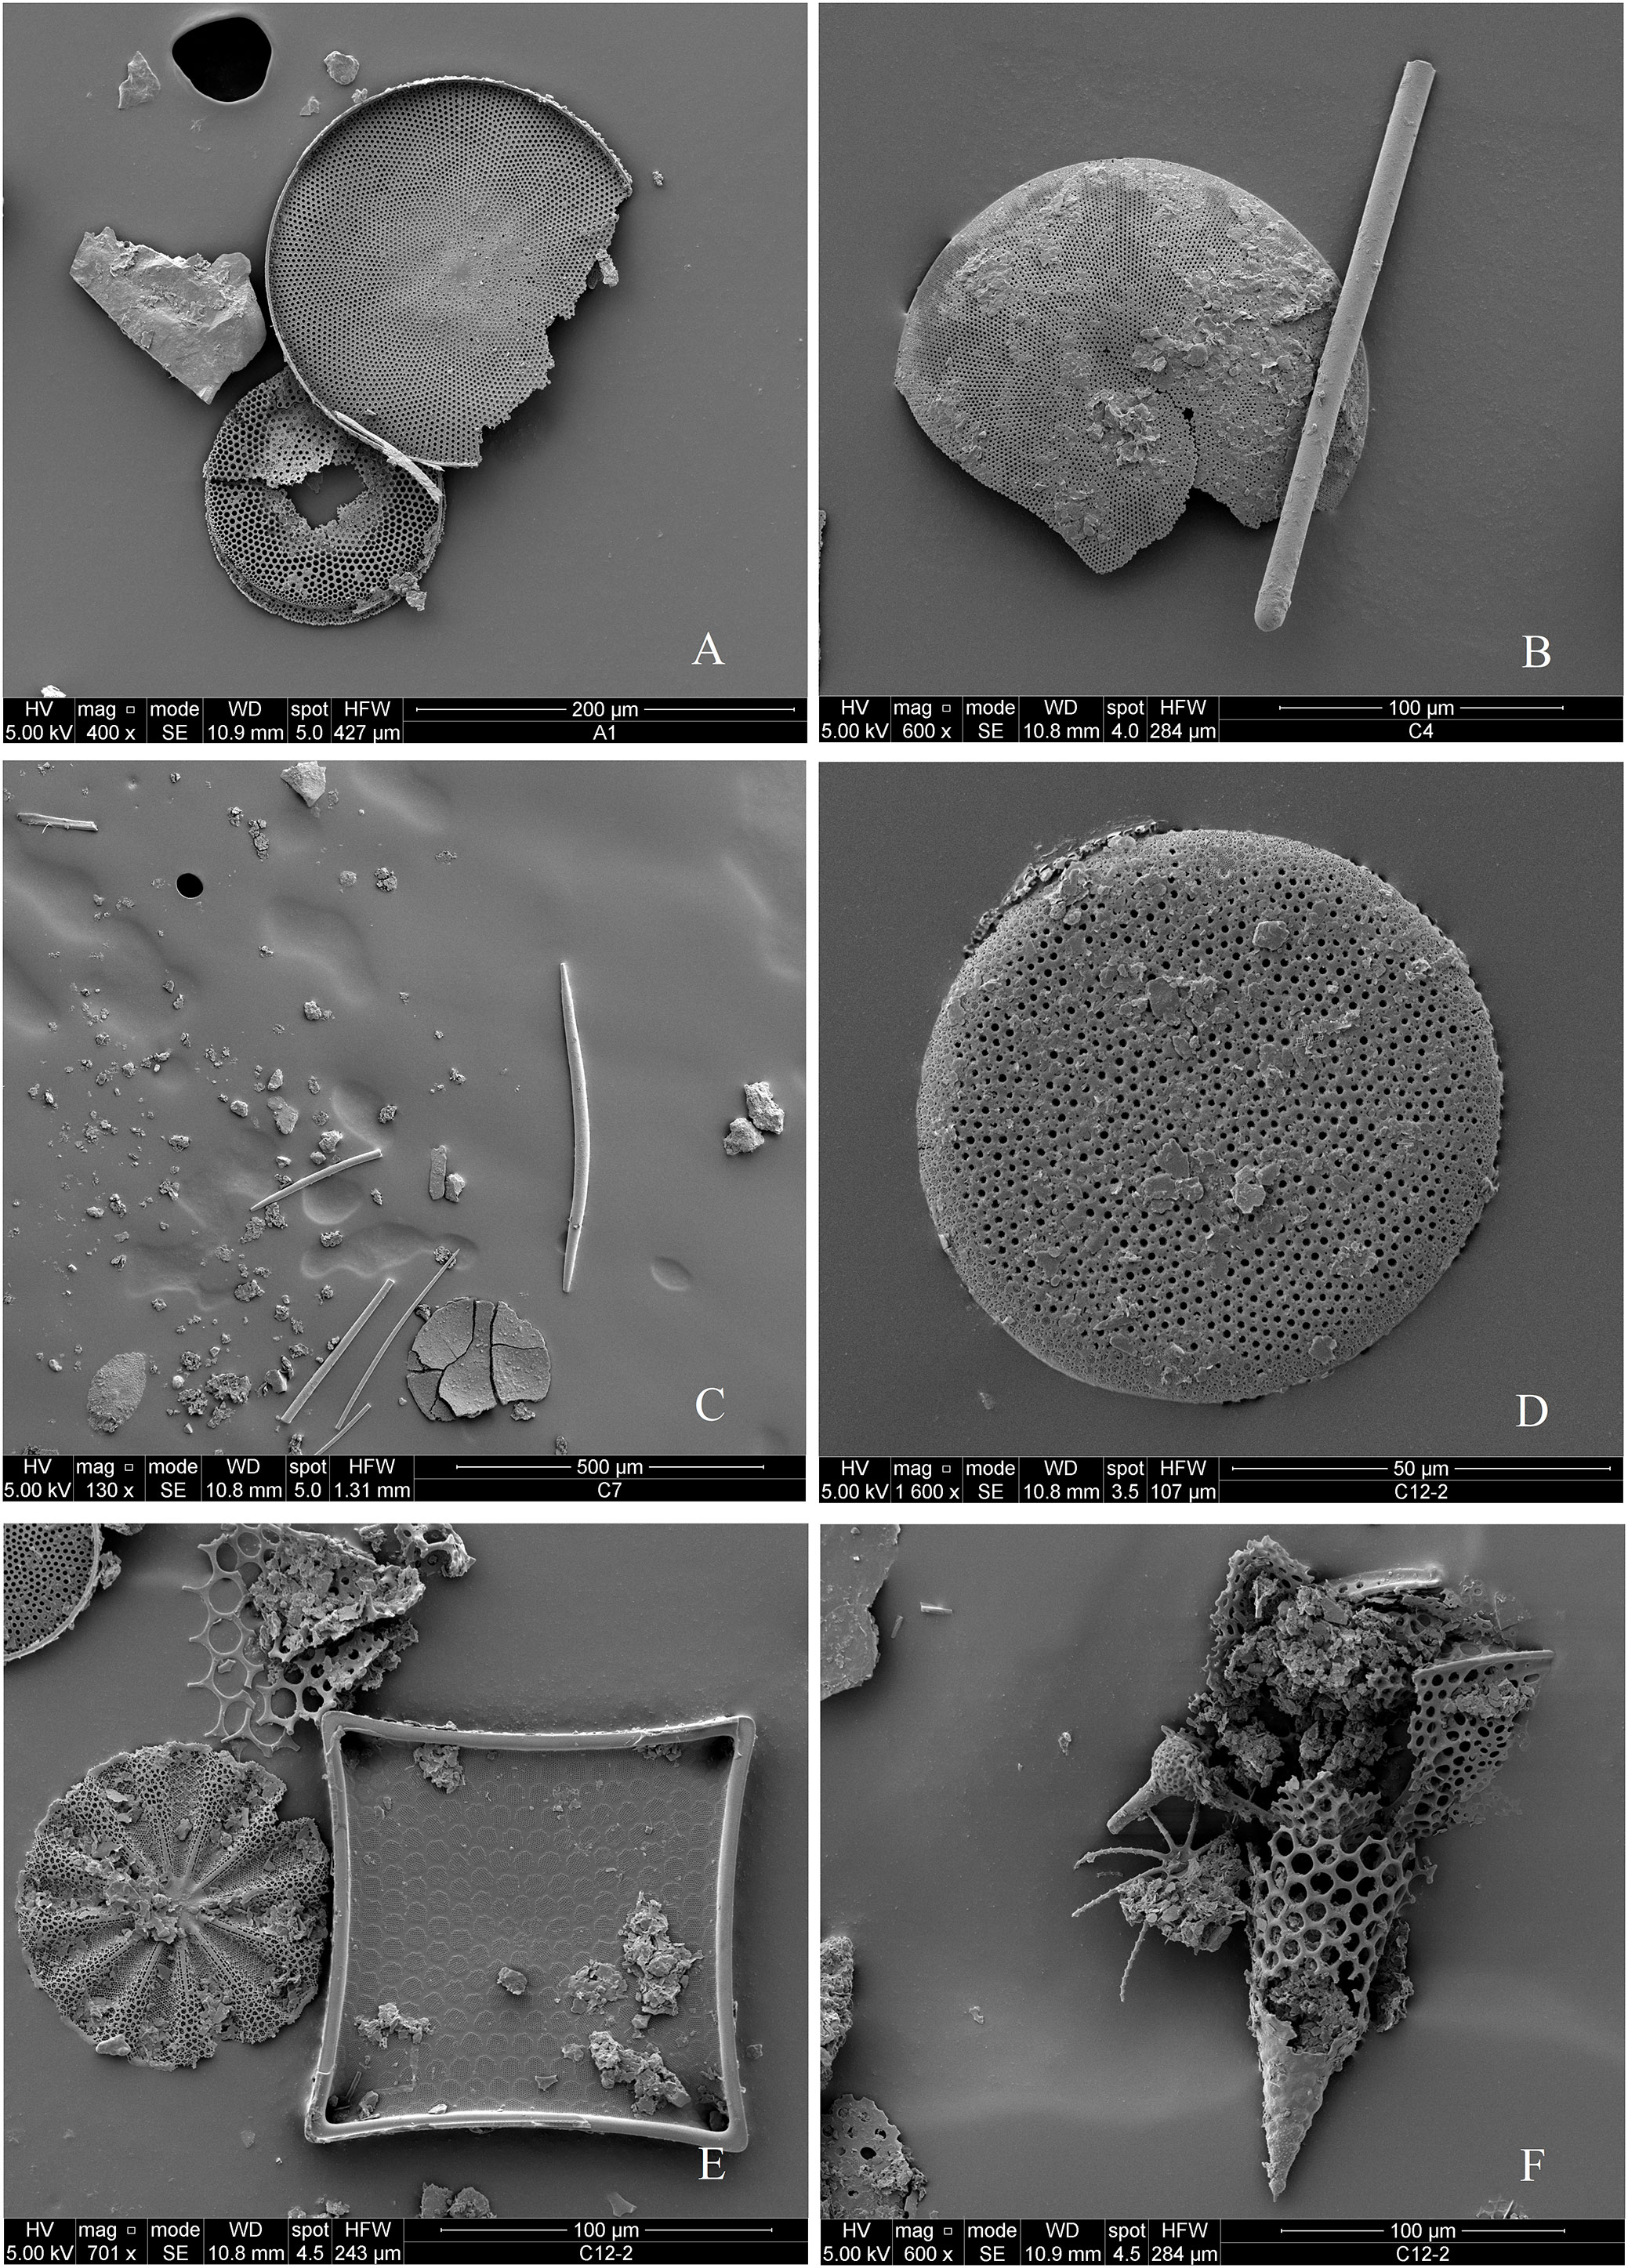
Figure 7 SEM images show different siliceous organisms found in sediment samples (A1, C4, C7, and C12) before alkaline digestion. (A) diatom frustule in sample A1, (B) diatom frustule and sponge spicule in sample C4, (C) diatom frustule and sponge spicule in sample C7, (D-F) diatom frustules and radiolarian skeletons in sample C12. Sample A1 was pretreated using HCl (1.0 M) and H2O2 (10%) for 1 h, sample C4, C7, and C12 were not pretreated.
In addition, diatoms and radiolarian tests were not observed in sediment residuals after the alkaline digestions (0.1 M, 0.2 M, 2.0 M Na2CO3, 8 h digestion, P vs. NP; 0.5 M NaOH, 1 h digestion, NP), whereas sponge spicules were found in the sediment residuals (post-digestion), especially in sediment from the outer shelf and slope of ECS. The digestion and destruction of the sponge spicule structures by the alkaline solution are visible from the SEM image (Figure 8). Different types of sponge spicules (i.e., strongyle, acanthostyle, tignule) were observed and picked from sediment residuals of sample C12, which was previously extracted in a 2.0 M Na2CO3 (P, 85°C) solution for 8 h. Nevertheless, the degree of destruction of the different shapes/types of sponge spicules by alkaline solution is variable. For example, the strongyle sponge spicules (Figures 8G–I) are more heavily digested than the acanthostyle sponge spicules (Figures 8A–C) and the tignule sponge spicules (Figures 8D–F).
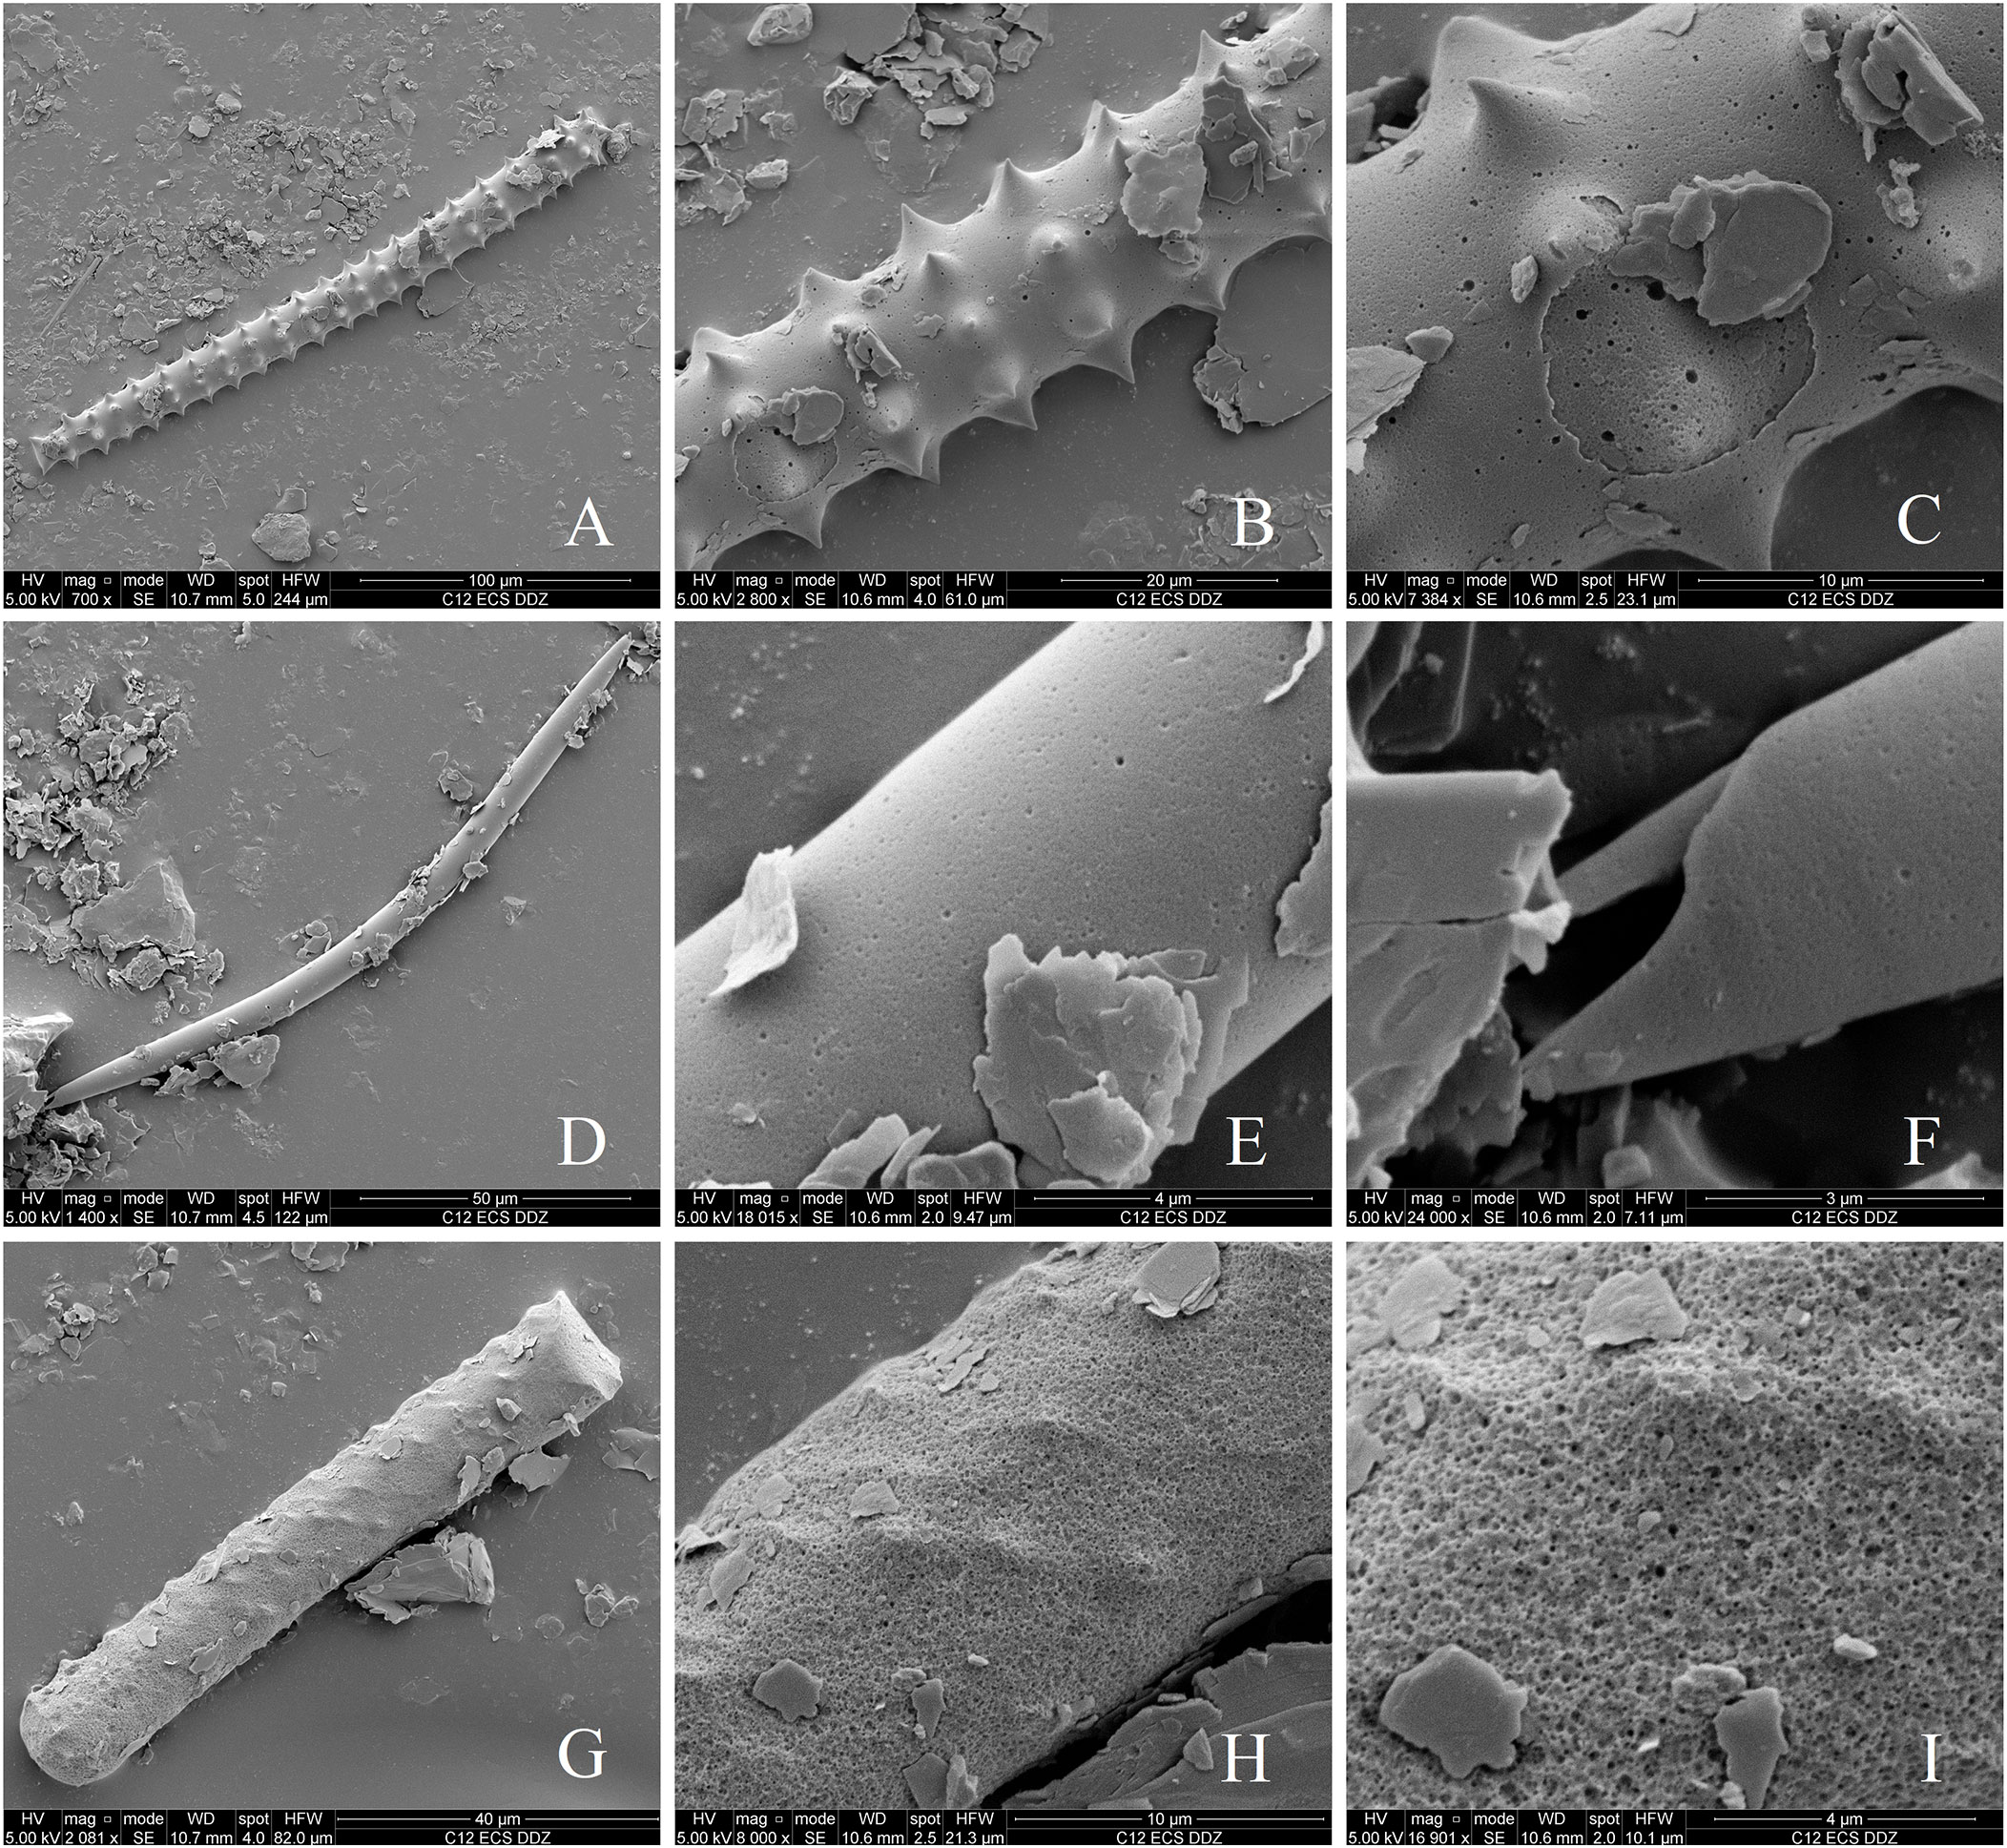
Figure 8 SEM images of three types of siliceous sponge spicule structures observed in the residual sediment of sample C12 after 8 h digestion using 2.0 M Na2CO3 (P). (A-C) acanthostyle sponge spicule, (D-F) tignule sponge spicule, (G-I): strongyle sponge spicule. (B, C, E) and (F, G, I) are zoom-in views of images (A, D, G), respectively.
This study determined the bSiO2% in sediment from the CCMZs of the East China seas using both the Si/time and the Si/Al methods and estimated the abundance of different types of bSi in sediment. The results show that the commonly used pretreatment step and different alkaline digestion methods inherently bias the accurate determination of bSiO2%. For example, this study found that strong alkaline digestion can overestimate bSi content and does not completely digest sponge bSi, in agreement with Maldonado et al. (2019), which are important factors to consider when evaluating total bSi fluxes in the marine environment. These technical biases are important to understand since pretreatment procedures (e.g., HCl and H2O2) can overestimate the burial flux of bSi in CCMZs. To emphasize the influence of these methodological differences, we present a revised bSi burial flux for the East China seas. The causes of the methodological biases are discussed below (section 5.1) and the importance of resistant bSi in the East China seas is presented (section 5.2). Finally, a general procedure (section 5.3) is proposed to ensure that determination of bSi burial flux is supported by an accurate quantification of bSiO2% in coastal sediments.
Considering the complex bSi types (diatoms, radiolarians and sponge spicules) (Table 1) and high AlkExSi from lSi from East China seas sediments (Table 5), an accurate determination of the bSi content is challenging due to the technical problems highlighted by Maldonado et al. (2019) and Koning et al. (2002) for coastal sediments. In this study, we assessed the Si/time and Si/Al methods in order to define the optimal method for the determination of the bSi content. This information is necessary to accurately evaluate bSi burial in the CCMZs of East China seas.
This study found two major limitations for the Si/time method: 1) insufficient correction of the lSi phase and 2) inadequate digestion of the resistant bSi (mainly sponge spicules). Applying a weak alkaline digestion completely digests the diatoms but cannot fully digest sponge spicules (Figure 8), whereas a strong alkaline digestion extracts more lSi from the sediment and resulting in an overestimation of the bSi content. In addition, the AlkExSi concentration continues to increase during an alkaline extraction (Figure 3, Figure S7, Figure S11) and a flat “plateau” as shown in Figure S2 is never reached, suggesting a continuous dissolution of resistant bSi (e.g., sponge spicules) and lSi. Therefore, a complete digestion of the bSi using the Si/time method cannot be defined for the sediment of East China seas, and the use of a simple tangent line to calculate bSi content (DeMaster, 1981) is insufficient.
Furthermore, authigenic silicates precipitate on the structure of bSi (Figure 7, Figure S10) can decrease the reactive surface area of bSi and decrease its solubility (Williams et al., 1985; Varkouhi and Wells, 2020). Applying an acid and peroxide pretreatment procedure can remove the authigenic silicates and enhance the reactivity of bSi (Mortlock and Froelich, 1989; Saad et al., 2020). However, our results showed the bSiO2% increased by more than 100% after the pretreatment (Table 3, Figure S6), a significant (p< 0.0001) statistical increase (Table S1), which is not in agreement with our microscopic observations (Table 1, Figure 8). Ohlendorf and Sturm (2008) and Dai et al. (2017) found that using a pretreatment step increased the bSi yield and they suggested that more bSi was being digested after the removal of the mineral coating. We argue that this observed increase bSi yield is mainly due to an enlarged amount of Si extracted from authigenic silicate and clay minerals. This argument is supported by observations made by Michalopoulos and Aller (2004), who concluded that a mild acid pretreatment step (0.1 M HCl) can activate the authigenic silicate in the Amazon delta sediment. They also suggested that the mild acid pre-treatment can activate the neo-formed reverse weathering product (authigenic silicates) without changing the structure of crystallized clay minerals. However, applying a stronger acid (1.0 M HCl) and peroxide (10% H2O2) pretreatment can weaken the structure of clay minerals (Komadel and Madejová, 2006; Hu et al., 2022), therefore, enhancing the solubility of the clay mineral. The chemical composition differences between bSi and authigenic silicates suggest that they are two different marine Si pools (Michalopoulos and Aller, 2004; Rahman et al., 2016; Pickering et al., 2020). Applying pre-treatment can cause an overestimation of the bSi pool, therefore, further studies on disentangling the different Si pools are required (DeMaster, 1991; Michalopoulos and Aller, 2004; Frings et al., 2014; Ehlert et al., 2016; Rahman et al., 2016; Pickering et al., 2020; Frings et al., 2021a; Frings et al., 2021b).
Although the Si/time method determines the bSi content based on a simple Si vs. time tangent line, the mineral interference still needs to be corrected. This is typically done with the Si/Al method for CCMZs sediment (Koning et al., 2002; Barão et al., 2015). However, the quantification of the bSi content by Si/Al method is underestimated since the sponge bSi is not completely digested (Figure S9). Previous studies concluded that all sponge spicules and most (> 70%) of radiolarians were digested after 1 h continuous alkaline digestion using 0.5 M NaOH (Müller and Schneider, 1993). Maldonado et al. (2019) found that only 10% to 20% of fresh sponge spicules were dissolved after 1.5 h of alkaline digestion using 0.5 M NaOH. The sponge spicules used by Müller and Schneider (1993) were treated in acid solution and 10% H2O2 for removing the organic matter and then ground, thus can be digested completely. However, the sponge spicules used by Maldonado et al. (2019) were not crushed, and were therefore harder to be digested completely. Thus, 30 to 90% of the sponge spicules may not be determined by the Si/Al method. Moreover, crushing the sediment or pre-treating the samples would enhance the digestion efficiency of the sponge bSi, but inevitably increase the surface area of lSi and bring out an overestimation of the bSi content. Therefore, pretreatment of sediment should be applied with caution, and we suggest applying a Si/Al method with an extension of extraction time to > 12 h (Maldonado et al., 2019). Unfortunately, this is not currently possible for the Si/Al method proposed by Koning et al. (2002).
The burial flux of bSi (Fb = C * w) in the CCMZs of the East China seas was re-evaluated, considering the sediment mass accumulation rate (w) from previously published studies and the concentration of bSiO2 in sediments (C). The variations of the estimated bSi burial flux are dependent on the determination of the bSi content of the study area. The total bSi burial flux of the East China seas thus re-evaluated varied from 132 (± 112) Gmol-SiO2 yr-1, 249 (± 158) Gmol-SiO2 yr-1 and 329 (± 209) Gmol-SiO2 yr-1 using the bSiO2% determined at 5 h, 8 h and 20 h digestion interval, respectively. And the estimated bSi burial flux is 253 (± 286) Gmol-SiO2 yr-1 based on the Si/Al method (Table 6). Given the presence of high lSi content in the sediment samples of the East China seas, a well-known opal-depleted CCMZs influenced by the terrestrial input delivered from the Yellow River and the Yangtze River, we opted for the Si/Al (1 h digestion in 0.5 M NaOH) method as the optimal method for the determination of the bSi content in the East China seas. Our best estimate of the burial flux of bSiO2 (253 ± 286 Gmol-SiO2 yr-1) in the East China seas is about one third of the previous studies (924 ± 693 Gmol-SiO2 yr-1; Wu et al., 2017; Wu and Liu, 2020). This is mainly due to the methodological bias, because the previous studies determined the bSiO2% with a pre-treatment (with HCl and H2O2) process (Wu et al., 2017; Wu and Liu, 2020) that overestimate the bSiO2%, subsequently, the bSi burial flux is over-estimated. The Si/Al method can correct the lSi properly, but still digest the sponge spicules insufficiently. Therefore, our estimation of the bSi burial flux is an underestimate.
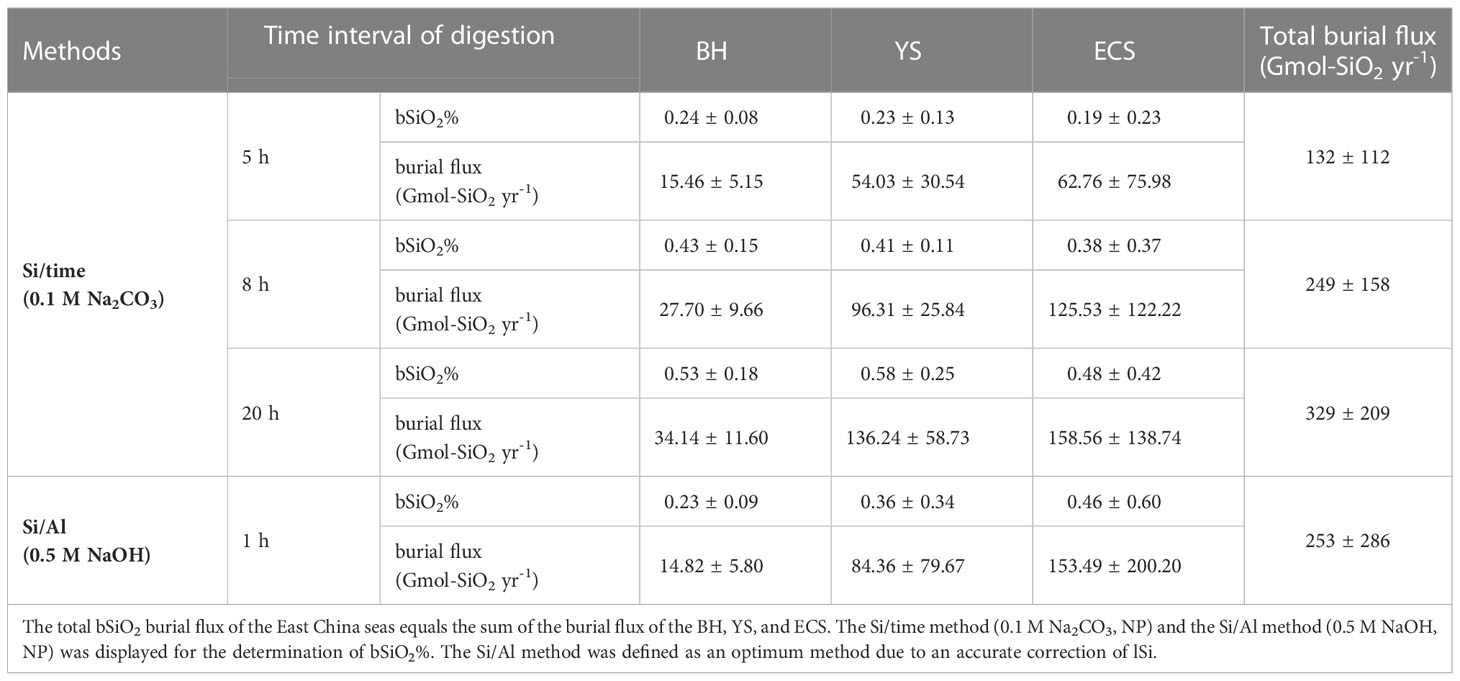
Table 6 Burial flux of bSiO2 (Gmol-SiO2 yr-1) of the BH, the YS, and the ECS.
Notably, the difference in bSi burial flux is also influenced by the sampling technique (sampling at different locations and seasons) and the calculation of sediment mass accumulation rate. We adopted an average mass accumulation rate for the BH, YS and ECS (see section 3.4) and the potential factors (such as riverine sediment input, resuspension of sediment by currents and primary production) that influence the sediment mass accumulation rate were not discussed in this study but are necessary for future works. The substantial decrease in the estimation of Si burial flux in the East China seas raises the question of whether it can have an impact on the global scale and on the balance of the silica cycle in the ocean.
Our findings emphasize that radiolarian and sponge bSi are important sinks of marine Si for the East China seas, especially the ECS. Microscopic observations indicate the sediment of BH is composed principally of diatoms (Li et al., 2020), YS is composed of diatoms (Wang et al., 2016), and the ECS is composed of diatoms (Chen et al., 2014; Li et al., 2018), radiolarians (Liu et al., 2017; Qu et al., 2020b) and sponge spicules (Table 1). No significant differences were observed in the average abundance of diatoms in the surface sediment of BH, YS and ECS. However, the abundance of sponge spicules is of the same magnitude as diatoms in the sediment of ECS (Table 1), and the abundance of radiolarians is of the same magnitude as diatoms in the outer shelf and slope of ECS (Qu et al., 2020a). Besides the observational data, our alkaline digestion results confirm the quantity of the less soluble bSi fraction (i.e., sponge spicules and radiolarians) is approximately equivalent to diatom bSiO2% (Table 4). Our data showed the abundance of radiolarians and sponge spicules was not as important as diatoms in the BH and YS (Table 1), thus the origin of the less soluble bSi in BH and YS may be partly due to phytolith discharged from rivers. Since phytoliths are less soluble than diatoms (Meunier et al., 2014) and can contribute 14% − 64% of bSi in estuaries and coastal sediment (Ran et al., 2017).
Although little is known about the quantity of radiolarian and sponge bSi in the East China seas (Zhang et al., 2003; Liang et al., 2021), the current results imply that the burial of “dark bSi” (radiolarian skeleton and sponge spicules, as defined by Maldonado et al. (2019)) is possibly as important as diatoms in East China seas. The burial of silicon associated with siliceous sponges was mainly found on continental slopes/margins (Maldonado et al., 2019), as one of the largest CCMZs in the Northwest Pacific, the Si burial through siliceous sponges would be more important than previously expected (Chou et al., 2012; Ran et al., 2017).
Our findings emphasize that besides diatoms, the less soluble types of bSi (i.e., radiolarians and sponge spicules) also act as an important marine Si sink in the CCMZs of the East China seas. However, the accurate determination of the magnitude of these marine Si sinks is complicated by different types of methods to determine the bSi content in sediments. The following is a brief summary of the different wet alkaline methods employed in this study and their technical limitations:
(1) The Si/time alkaline method (0.1 M Na2CO3, NP, 5 h digestion) (DeMaster, 1981), which is commonly used to quantitatively determine bSiO2% in the sediment of CCMZs, incompletely digests the skeletal structures of radiolarians and sponge spicules and partly digests lSi, similar to the findings from Maldonado et al. (2019). A 20 h extraction in 0.1 M Na2CO3 solution can digest the diatom and radiolarian bSi and ca. 80% of sponge bSi. The determination of the bSiO2% using a 2.0 M Na2CO3 solution overestimates the bSiO2% because silica is digested from clay minerals, which biases the accuracy of the method.
(2) The one-hour Si/Al method (0.5 M NaOH, NP) (Koning et al., 2002) underestimate the bSiO2% due to incomplete digestion of radiolarian skeleton and sponge spicules. Therefore, an extension of the digestion time is necessary.
(3) The pre-treatment of sediment using HCl (1.0 M) and H2O2 (10%) prior to alkaline digestion can cause an overestimation of the bSiO2% due to the digestion of authigenic silicates and/or clay minerals. Thus, a pre-treatment procedure should be avoided.
To resolve these technical problems, we propose the following general wet alkaline digestion procedure for the appropriate determination of bSi content in the sediments of CCMZs:
(1) Determine the types of bSi in sediment using a microscope.
(2) Selecting an appropriate alkaline solution according to the type of sediments.
- For sediment samples containing mainly diatoms, a 5 h alkaline digestion using 0.1 M Na2CO3 solution is capable of extracting bSi.
- For sediment samples containing diatoms, sponge spicules and/or radiolarian skeletons, alkaline digestion > 2 h in 0.5 M − 1.0 M NaOH (Si/Al method) solution is suggested.
(3) Checking the residue sediment (post-digestion) using a microscope to observe if there are no more radiolarian tests and/or sponge spicules.
Our results showed that alkaline extractions of CCMZs sediments using 2.0 M Na2CO3 solution resulted in an overestimation of the bSiO2% owing to silica being digested from clay minerals. Applying a 0.1 M Na2CO3 digestion (20 h) can minimize the lSi interference on bSi determination, but can cause at least 20% of underestimation of the bSiO2% owing to incomplete digestion of sponge spicules. Our results also show that alkaline extractions that apply a pretreatment procedure overestimate the determined bSiO2% due to the digestion of the authigenic silicate phases and clays and subsequently overestimate the bSi burial flux. Consequently, we propose the general alkaline digestion protocol to accurately determine bSiO2% in marine sediments of CCMZs using the Si/Al method by either applying the continuous analysis method (Koning et al., 2002) or the time-series digestion method (Kamatani and Oku, 2000). Based on these new results and the application of the Si/Al method in order to produce accurate bSiO2% results, we revised the current estimate of bSi burial flux to 253 ± 286 Gmol-SiO2 yr-1, which is one third of the previously reported (924 ± 693 Gmol-SiO2 yr-1). Our estimate still underestimates the bSi burial flux of the East China seas, and further work on examining the resistant bSi (i.e., phytolith, radiolarian and sponge spicule) content is still required. We argue that the pre-treatment process (with HCl and H2O2) applied in previous estimates is the main reason that bSi burial flux was previously over-estimated. In order to ensure the accurate determination of bSi from different depositional settings in the future, we strongly suggest the development of an international intercalibration exercise.
The original contributions presented in the study are included in the article/Supplementary Material. Further inquiries can be directed to the corresponding authors.
DZ, JNS, SL, AL, and PT designed this study. DZ conducted the experiments, did the analysis and wrote the first manuscript. DZ, JNS, SL, AL, PT, JS, MG, and YM edited the manuscript. All authors contributed to the article and approved the submitted version.
This study was funded by the Natural Sciences Foundation of China (NSFC: U1806211, 42176040), the Taishan Scholars Program of Shandong Province, Aoshan Talents Program Supported by the Qingdao National Laboratory for Marine Science and Technology (No. 2015ASTP-OS08), by the French National Research Agency (18-CEO1-0011-01), and the University of Antwerp Bijzonder Onderzoeksfonds (Project ID: 43171). This work was supported by ISblue project, Interdisciplinary graduate school for the blue planet (ANR-17-EURE-0015) and co-funded by a grant from the French government under the program “Investissements d’Avenir” embedded in France 2030.
This study represents partial fulfillment of the requirements for the Ph.D. thesis of DDZ at the Ph.D. course of the Ocean University of China (OUC) and the Université de Bretagne Occidentale (UBO). DDZ would like to thank the doctoral mobility grants from the ISblue, UBO and CHIBIDO LAB (LEMAR: Laboratory of Environmental Marine Sciences). DDZ also would like to thank Dr. Eric Struyf, Mrs. Anne Cools, Mrs. Anke De Boeck and Mr. Tom Van der Spiet for their help and assistance during the alkaline digestion experiment at the Department of Biology, University of Antwerp. Thanks to the interlaboratory sediment samples kindly provided by Prof. Daniel Conley (Lund University).
The authors declare that the research was conducted in the absence of any commercial or financial relationships that could be construed as a potential conflict of interest.
All claims expressed in this article are solely those of the authors and do not necessarily represent those of their affiliated organizations, or those of the publisher, the editors and the reviewers. Any product that may be evaluated in this article, or claim that may be made by its manufacturer, is not guaranteed or endorsed by the publisher.
The Supplementary Material for this article can be found online at: https://www.frontiersin.org/articles/10.3389/fmars.2022.1058730/full#supplementary-material
Armstrong R. A., Lee C., Hedges J. I., Honjo S., Wakeham S. G. (2002). A new, mechanistic model for organic carbon fluxes in the ocean based on the quantitative association of POC with ballast minerals. Deep. Res. Part II Top. Stud. Oceanogr. 49, 219–236. doi: 10.1016/S0967-0645(01)00101-1
Barão L., Clymans W., Vandevenne F., Meire P., Conley D. J., Struyf E. (2014). Pedogenic and biogenic alkaline-extracted silicon distributions along a temperate land-use gradient. Eur. J. Soil Sci. 65, 693–705. doi: 10.1111/ejss.12161
Barão L., Vandevenne F., Clymans W., Frings P., Ragueneau O., Meire P., et al. (2015). Alkaline-extractable silicon from land to ocean: A challenge for biogenic silicon determination. Limnol. Oceanogr. Methods 13, 329–344. doi: 10.1002/lom3.10028
Cheize M., Planquette H. F., Fitzsimmons J. N., Pelleter E., Sherrell R. M., Lambert C., et al. (2019). Contribution of resuspended sedimentary particles to dissolved iron and manganese in the ocean: An experimental study. Chem. Geol. 511, 389–415. doi: 10.1016/j.chemgeo.2018.10.003
Chen C., Zhao G., Chen M., Lan D., Lan B. (2014). Diatom distribution in surface sediments from Chinese inshore waters and the relationship to modern environmental variables. Chin. J. Oceanol. Limnol. 32, 828–844. doi: 10.1007/s00343-014-3194-3
Chou Y., Lou J. Y., Chen C. T. A., Liu L. L. (2012). Spatial distribution of sponge spicules in sediments around Taiwan and the sunda shelf. J. Oceanogr. 68, 905–912. doi: 10.1007/s10872-012-0143-7
Conley D. J. (1998). An interlaboratory comparison for the measurement of biogenic silica in sediments. Mar. Chem. 63, 39–48. doi: 10.1016/S0304-4203(98)00049-8
Conley D. J., Schelske C. L. (1993). Potential role of sponge spicules in influencing the silicon biogeochemistry of Florida lakes. Can. J. Fish. Aquat. Sci. 50, 296–302. doi: 10.1139/f93-034
Conley D. J., Schelske C. L. (2001). ““Biogenic silica,” in biogenic silica,” in Tracking environmental change using lake sediments. Eds. Smol JP L. W., HJB B. (Dordrecht,The Netherlands: KluwerAcademic Publishers), 281–293. doi: 10.1007/0-306-47668-1_14
Costello M. J., Cheung A., De Hauwere N. (2010). Surface area and the seabed area, volume, depth, slope, and topographic variation for the world’s seas, oceans, and countries. Environ. Sci. Technol. 44, 8821–8828. doi: 10.1021/es1012752
Dai Z., Xue Y., Zhang H., Tu C., Luo Y. (2017). Biogenic silica in the surface sediment of the bohai Sea. Mar. Sci. 41, 42–49. doi: 10.11759/hykx20160917002
DeMaster D. J. (1981). The supply and accumulation of silica in the marine environment. Geochim. Cosmochim. Acta 45, 1715–1732. doi: 10.1016/0016-7037(81)90006-5
DeMaster D. J. (2002). The accumulation and cycling of biogenic silica in the southern ocean: Revisiting the marine silica budget. Deep. Res. Part II Top. Stud. Oceanogr. 49, 3155–3167. doi: 10.1016/S0967-0645(02)00076-0
DeMaster D. J. (2019). “The Global Marine Silica Budget: Sources and Sinks” in the Encyclopedia of Ocean Sciences, ed Cochran J. K., Bokuniewicz H. J., Yager P. L., (Academic Press), 473–483. doi: 10.1016/B978-0-12-409548-9.10799-7
DeMaster D. J. (1991). “Measuring Biogenic Silica in Marine Sediments and Suspended Matter,” in Marine Particles: Analysis and Characterization, ed. Hurd D. C., Spencer D. W. (American Geophysical Union Press), 363–367. doi: 10.1029/GM063p0363
Dixit S., Van Cappellen P. (2003). Predicting benthic fluxes of silicic acid from deep-sea sediments. J. Geophys. Res. Ocean. 108, 1–10. doi: 10.1029/2002jc001309
Ehlert C., Doering K., Wallmann K., Scholz F., Sommer S., Grasse P., et al. (2016). Stable silicon isotope signatures of marine pore waters – biogenic opal dissolution versus authigenic clay mineral formation. Geochim. Cosmochim. Acta 191, 102–117. doi: 10.1016/j.gca.2016.07.022
Eisma D., van der Gaast S. J. (1971). Determination of opal in marine sediments by X-ray diffraction. Netherlands J. Sea Res. 5, 382–389. doi: 10.1016/0077-7579(71)90019-6
Frings P. J., de la Rocha C., Struyf E., van Pelt D., Schoelynck J., Hudson M. M., et al. (2014). Tracing silicon cycling in the okavango delta, a sub-tropical flood-pulse wetland using silicon isotopes. Geochim. Cosmochim. Acta 142, 132–148. doi: 10.1016/j.gca.2014.07.007
Frings P. J., Oelze M., Schubring F., Frick D. A., von Blanckenburg F. (2021a). Interpreting silicon isotopes in the critical zone. Am. J. Sci. 321, 1164–1203. doi: 10.2475/08.2021.02
Frings P. J., Schubring F., Oelze M., von Blanckenburg F. (2021b). Quantifying biotic and abiotic Si fluxes in the critical zone with Ge/Si ratios along a gradient of erosion rates. Am. J. Sci. 321, 1204–1245. doi: 10.2475/08.2021.03
Fröhlich F. (1989). Deep-sea biogenic silica: new structural and analytical data from infrared analysis - geological implications. Terra Nova 1, 267–273. doi: 10.1111/j.1365-3121.1989.tb00368.x
Gehlen M., van Raaphorst W. (1993). Early diagenesis of silica in sandy north sea sediments: quantification of the solid phase. Mar. Chem. 42, 71–83. doi: 10.1016/0304-4203(93)90238-J
Grasshoff K., Ehrhardt M., Kremling K. (1983). Methods of seawater analysis. 2nd Edition Vol. 419 (Weinheim: WILEY-VCH Verlag Chemie GmbH).
Hilborn R., Mangel M. (1997). “The ecological detective: confronting models with data,” in Monographs in population biology no. 28. Eds. Levin S. A., Horn H. S. (NJ, USA: Princeton University Press), 315.
Hu B., Zhang C., Zhang X. (2022). The effects of hydrochloric acid pretreatment on different types of clay minerals. minerals. Minerals. 12, 1167–1185. doi: 10.3390/min12091167
Hydes D. J., Liss P. S. (1976). Fluorimetric method for the determination of low concentrations of dissolved aluminium in natural waters. Analyst 101, 922–931. doi: 10.1039/an9760100922
Ingall E., Jahnke R. (1994). Evidence for enhanced phosphorus regeneration from marine sediments overlain by oxygen depleted waters. Geochim. Cosmochim. Acta 58, 2571–2575. doi: 10.1016/0016-7037(94)90033-7
Jeandel C. (2016). Overview of the mechanisms that could explain the “Boundary exchange” at the land-ocean contact. Philos. Trans. R. Soc A Math. Phys. Eng. Sci. 374, 287–300. doi: 10.1098/rsta.2015.0287
Jeandel C., Oelkers E. H. (2015). The influence of terrigenous particulate material dissolution on ocean chemistry and global element cycles. Chem. Geol. 395, 50–66. doi: 10.1016/j.chemgeo.2014.12.001
Kamatani A., Oku O. (2000). Measuring biogenic silica in marine sediments. Mar. Chem. 68, 219–229. doi: 10.1016/S0304-4203(99)00079-1
Komadel P., Madejová J. (2006). Chapter 7.1 acid activation of clay minerals. Dev. Clay Sci. 1, 263–287. doi: 10.1016/S1572-4352(05)01008-1
Koning E., Brummer G. J., Van Raaphorst W., Van Bennekom J., Helder W., Van Iperen J. (1997). Settling, dissolution and burial of biogenic silica in the sediments off Somalia (northwestern Indian ocean). Deep. Res. Part II Top. Stud. Oceanogr. 44, 1341–1360. doi: 10.1016/S0967-0645(97)00018-0
Koning E., Epping E., Van Raaphorst W. (2002). Determining biogenic silica in marine samples by tracking silicate and aluminium concentrations in alkaline leaching solutions. Aquat. Geochemistry 8, 37–67. doi: 10.1023/A:1020318610178
Leinen M. (1977). A normative calculation technique for determining opal in deep-sea sediments. Geochim. Cosmochim. Acta 41, 671–676. doi: 10.1016/0016-7037(77)90304-0
Liang Y., Ran L., Zhang L. (2021). The spatial distribution of biogenic silica content and diatom abundance in the surface sediment of the China seas. Acta Micropaleontol. Sin. 38, 112–130. doi: 10.16087/j.cnki.1000-0674.2021.01.010
Li Y., Fang J., Tian L. Z., Wang F., Chen Y. S. (2020). Diatom assemblages in surface sediments and their reflection on the water migration pathway from the inshore waters of western bohai bay, china. Appl. Ecol. Environ. Res. 18, 2179–2196. doi: 10.15666/aeer/1802_21792196
Liu J. P., Xu K. H., Li A. C., Milliman J. D., Velozzi D. M., Xiao S. B., et al. (2007). Flux and fate of Yangtze river sediment delivered to the East China Sea. Geomorphology 85 (3–4), 208–224. doi: 10.1016/j.geomorph.2006.03.023
Liu S. M., Ye X. W., Zhang J., Zhao Y. F. (2002). Problems with biogenic silica measurement in marginal seas. Mar. Geol. 192, 383–392. doi: 10.1016/S0025-3227(02)00531-5
Liu J., Zang J., Bouwman L., Liu S., Yu Z., Ran X. (2016). Distribution and budget of dissolved and biogenic silica in the bohai Sea and yellow Sea. Biogeochemistry 130, 85–101. doi: 10.1007/s10533-016-0244-2
Liu L., Zhang Q., Chen M. H., Zhang L. L., Xiang R. (2017). Radiolarian biogeography in surface sediments of the Northwest pacific marginal seas. Sci. China Earth Sci. 60, 517–530. doi: 10.1007/s11430-016-5179-4
Li Y., Wang L., Fan D., Chen M., Lin Y. (2018). Distribution of biogenic silica in seafloor sediments on the East China Sea inner shelf: Seasonal variations and typhoon impact. Estuar. Coast. Shelf Sci. 212, 353–364. doi: 10.1016/j.ecss.2018.07.023
Lyle A. O., Lyle M. W. (2002). Determination of biogenic opal in pelagic marine sediments: A simple method revisited. Proc. Ocean Drill. Program 199, 1215–1222. doi: 10.2973/odp.proc.ir.199.106.2002
Mackin J. E. (1989). Relationships between Si, Al, and fe deposited on filter-covered glass substrates in marine sediments and in suspensions of sediments and standard clays. Mar. Chem. 26, 101–117. doi: 10.1016/0304-4203(89)90055-8
Maldonado M., López-Acosta M., Sitjà C., García-Puig M., Galobart C., Ercilla G., et al. (2019). Sponge skeletons as an important sink of silicon in the global oceans. Nat. Geosci. 12, 815–822. doi: 10.1038/s41561-019-0430-7
Meunier J. D., Keller C., Guntzer F., Riotte J., Braun J. J., Anupama K. (2014). Assessment of the 1% Na2CO3 technique to quantify the phytolith pool. Geoderma 216, 30–35. doi: 10.1016/j.geoderma.2013.10.014
Michalopoulos P., Aller R. C. (1995). Rapid clay mineral formation in Amazon delta sediments: Reverse weathering and oceanic elemental cycles. Science 270, 614–617. doi: 10.1126/science.270.5236.614
Michalopoulos P., Aller R. C. (2004). Early diagenesis of biogenic silica in the Amazon delta: Alteration, authigenic clay formation, and storage. Geochim. Cosmochim. Acta 68, 1061–1085. doi: 10.1016/j.gca.2003.07.018
Moriceau B., Goutx M., Guigue C., Lee C., Armstrong R., Duflos M., et al. (2009). Si-C interactions during degradation of the diatom skeletonema marinoi. Deep. Res. Part II Top. Stud. Oceanogr. 56, 1381–1395. doi: 10.1016/j.dsr2.2008.11.026
Mortlock R. A., Froelich P. N. (1989). A simple method for the rapid determination of biogenic opal in pelagic marine sediments. deep Sea res. Part A Oceanogr. Res. Pap. 36, 1415–1426. doi: 10.1016/0198-0149(89)90092-7
Müller P. J., Schneider R. (1993). An automated leaching method for the determination of opal in sediments and particulate matter. Deep. Res. Part I 40, 425–444. doi: 10.1016/0967-0637(93)90140-X
Noymer A. (2008). “Alpha, significance level of test,” in Encyclopedia of survey research methods: Thousand oaks. Ed. Lavrakas P. J. (Sage Publications), 18–18.
Ohlendorf C., Sturm M. (2008). A modified method for biogenic silica determination. J. Paleolimnol. 39, 137–142. doi: 10.1007/s10933-007-9100-7
Pickering R. A., Cassarino L., Hendry K. R., Wang X. L., Maiti K., Krause J. W. (2020). Using stable isotopes to disentangle marine sedimentary signals in reactive silicon pools. Geophys. Res. Lett. 47, 1–11. doi: 10.1029/2020GL087877
Pudsey C. J. (1993). Calibration of a point-counting technique for estimation of biogenic silica in marine sediments. J. Sediment. Res. 63, 760–762. doi: 10.2110/jsr.63.760
Qiao S., Shi X., Wang G., Zhou L., Hu B., Hu L., et al. (2017). Sediment accumulation and budget in the bohai Sea, yellow Sea and East China Sea. Mar. Geol. 390, 270–281. doi: 10.1016/j.margeo.2017.06.004
Qin Y. S., Zhao Y. Y., Chen L. R., Zhao S. L. (1996). Geology of the East China sea. a series of solid earth sciences research in China. Beijing: Science Press.
Qu H., Wang J., Xu Y., Li X. (2020b). Radiolarian assemblage as an indicator of environmental conditions in the marginal seas of the Western north pacific. Mar. Micropaleontol. 157, 101859. doi: 10.1016/j.marmicro.2020.101859
Qu H., Xu Y., Wang J., Li X. Z. (2020a). Radiolarian assemblages in the shelf area of the East China Sea and yellow Sea and their ecological indication of the kuroshio current derivative branches. PeerJ 8, 1–19. doi: 10.7717/peerj.9976
Rahman S., Aller R. C., Cochran J. K. (2016). Cosmogenic 32Si as a tracer of biogenic silica burial and diagenesis: Major deltaic sinks in the silica cycle. Geophys. Res. Lett. 43, 7124–7132. doi: 10.1002/2016GL069929
Rahman S., Aller R. C., Cochran J. K. (2017). The missing silica sink: Revisiting the marine sedimentary Si cycle using cosmogenic 32Si. Global Biogeochem. Cycles 31, 1559–1578. doi: 10.1002/2017GB005746
Rahman S., Tamborski J. J., Charette M. A., Cochran J. K. (2019). Dissolved silica in the subterranean estuary and the impact of submarine groundwater discharge on the global marine silica budget. Mar. Chem. 208, 29–42. doi: 10.1016/j.marchem.2018.11.006
Raimonet M., Ragueneau O., Jacques V., Corvaisier R., Moriceau B., Khripounoff A., et al. (2015). Rapid transport and high accumulation of amorphous silica in the Congo deep-sea fan: A preliminary budget. J. Mar. Syst. 141, 71–79. doi: 10.1016/j.jmarsys.2014.07.010
Ran X., Xu B., Liu J., Zhao C., Liu S., Zang J. (2017). Biogenic silica composition and δ13C abundance in the changjiang (Yangtze) and huanghe (Yellow) rivers with implications for the silicon cycle. Sci. Total Environ. 579, 1541–1549. doi: 10.1016/j.scitotenv.2016.11.161
Saad E. M., Pickering R. A., Shoji K., Hossain M. I., Glover T. G., Krause J. W., et al. (2020). Effect of cleaning methods on the dissolution of diatom frustules. Mar. Chem. 224, 103826. doi: 10.1016/j.marchem.2020.103826
Schlüter M., Rickert D. (1998). Effect of pH on the measurement of biogenic silica. Mar. Chem. 63, 81–92. doi: 10.1016/S0304-4203(98)00052-8
Swann G. E. A. (2010). A comparison of the Si/Al and si/time wet-alkaline digestion methods for measurement of biogenic silica in lake sediments. J. Paleolimnol. 44, 375–385. doi: 10.1007/s10933-009-9308-9
Tréguer P. J., Bowler C., Moriceau B., Dutkiewicz S., Gehlen M., Aumont O., et al. (2018). Influence of diatom diversity on the ocean biological carbon pump. Nat. Geosci. 11, 27–37. doi: 10.1038/s41561-017-0028-x
Tréguer P. J., Sutton J., Brzezinski M., Charette M., Devries T., Dutkiewicz S., et al. (2021). Reviews and syntheses: The biogeochemical cycle of silicon in the modern ocean. Biogeosciences Discuss. 18, 1269–1289. doi: 10.5194/bg-2020-274
Varkouhi S., Cartwright J. A., Tosca N. J. (2020a). Anomalous compaction due to silica diagenesis — textural and mineralogical evidence from hemipelagic deep-sea sediments of the Japan Sea. Mar. Geol. 426, 106204. doi: 10.1016/j.margeo.2020.106204
Varkouhi S., Tosca N. J., Cartwright J. A. (2020b). Pore-water chemistry: A proxy for tracking the signature of ongoing silica diagenesis. Journal of Sedimentary Research. 90, 1037–1067. doi: 10.2110/JSR.2020.56
Varkouhi S., Wells J. (2020). The relation between temperature and silica benthic exchange rates and implications for near-seabed formation of diagenetic opal. Results Geophys. Sci. 1–4, 100002. doi: 10.1016/j.ringps.2020.100002
Wang Y., Liu D., Di B., Shi Y., Wang Y. (2016). Distribution of diatoms and silicoflagellates in surface sediments of the yellow Sea and offshore from the changjiang river, China. Chin. J. Oceanol. Limnol. 34, 44–58. doi: 10.1007/s00343-015-4237-0
Williams L. A., Parks G. A., Crerar D. A. (1985). Silica diagenesis: I. solubility controls. J. Sediment. Petrol. 55, 301–311. doi: 10.1306/212f86ac-2b24-11d7-8648000102c1865d
Wu B., Liu S. M. (2020). Dissolution kinetics of biogenic silica and the recalculated silicon balance of the East China Sea. Sci. Total Environ. 743, 140552. doi: 10.1016/j.scitotenv.2020.140552
Wu B., Liu S. M., Ren J. L. (2017). Dissolution kinetics of biogenic silica and tentative silicon balance in the yellow Sea. Limnol. Oceanogr. 62, 1512–1525. doi: 10.1002/lno.10514
Wu B., Lu C., Liu S. M. (2015). Dynamics of biogenic silica dissolution in Jiaozhou Bay, western Yellow Sea. Marine Chemistry. Mar. Chem. 174, 58–66. doi: 10.1016/j.marchem.2015.05.004
Keywords: biogenic silica, alkaline digestion, analytical methods, burial flux, coastal and continental margin zones, East China seas, marine silicon cycle
Citation: Zhu D, Sutton JN, Leynaert A, Tréguer PJ, Schoelynck J, Gallinari M, Ma Y and Liu SM (2023) Revisiting the biogenic silica burial flux determinations: A case study for the East China seas. Front. Mar. Sci. 9:1058730. doi: 10.3389/fmars.2022.1058730
Received: 30 September 2022; Accepted: 28 December 2022;
Published: 13 January 2023.
Edited by:
Martin F. Soto-Jimenez, Institute of Marine Science and Limnology, National Autonomous University of Mexico, MexicoReviewed by:
Tom Trull, Commonwealth Scientific and Industrial Research Organisation (CSIRO), AustraliaCopyright © 2023 Zhu, Sutton, Leynaert, Tréguer, Schoelynck, Gallinari, Ma and Liu. This is an open-access article distributed under the terms of the Creative Commons Attribution License (CC BY). The use, distribution or reproduction in other forums is permitted, provided the original author(s) and the copyright owner(s) are credited and that the original publication in this journal is cited, in accordance with accepted academic practice. No use, distribution or reproduction is permitted which does not comply with these terms.
*Correspondence: Jill N. Sutton, amlsbC5zdXR0b25AdW5pdi1icmVzdC5mcg==; Su Mei Liu, c3VtZWlsaXVAb3VjLmVkdS5jbg==
Disclaimer: All claims expressed in this article are solely those of the authors and do not necessarily represent those of their affiliated organizations, or those of the publisher, the editors and the reviewers. Any product that may be evaluated in this article or claim that may be made by its manufacturer is not guaranteed or endorsed by the publisher.
Research integrity at Frontiers
Learn more about the work of our research integrity team to safeguard the quality of each article we publish.