 David Lévesque
 Michel Lebeuf1
 Michel Starr
- 1Maurice Lamontagne Institute, Fisheries and Oceans Canada, Mont-Joli, QC, Canada
- 2Québec-Ocean, Université Laval, Québec, QC, Canada
- 3Direction de la qualité des milieux aquatiques, Ministère de l’Environnement et de la Lutte contre les changements climatiques, Québec, QC, Canada
Hypoxia (O2 < 2 mg/L) driven by eutrophication in estuaries and shelves is a worldwide expanding problem. The role of organic matter (OM) inputs is emerging as an important contributor to this issue, beside the well-known implication of inorganic nutrients. The St. Lawrence Estuary, one of the largest and deepest estuarine system in the world is facing strong persistent and increasing hypoxia. In this context, transport and exchange of particulate and dissolved organic matter (POM and DOM, respectively) were investigated as a first step to understand their implication in hypoxia. Tributaries and Gulf contributions were compared to St. Lawrence Estuary inventories for the spring freshet (May), the summer low-flow (August), and the fall-mixing (October). Furthermore, changes in OM ratios were examined along the estuarine gradient from the upper St. Lawrence Estuary (USLE), downstream of the maximum turbidity zone, to the lower estuary (LSLE). For the USLE, net transport was always positive and net export/loading ratios suggested that 64–90% of POM and 30–63% of DOM were either retained or transformed during its course from tributaries to LSLE. Net transport from the USLE toward the LSLE was 3–13 fold more important in May than in August or October. For the LSLE, net transport to the Gulf was generally negative meaning that OM production was the dominating proces. The extremely high net export/loading ratios in August indicate that POM production was 28.8 to 41.4 times the combined inputs of tributaries and Gulf. Net export/loading ratios remained superior to one during May and October (1.7–9.4) for the LSLE. Changes along the upstream–downstream continuum were seen for POM, with a steady increase relative to total suspended matter from 7.3% to 50.2%, but they were not observed for DOM, for which no obvious trends were detected. Our results highlight the importance of explicitly considering OM in eutrophication monitoring programs of the St. Lawrence Estuary, as the mineralisation of a portion of the large OM pool size could influence our understanding of hypoxia and acidification of the deep waters of LSLE.
1. Introduction
Estuaries and shelves are key areas where particulate and dissolved organic matter (POM and DOM, respectively) from tributaries and oceans are mixed together. As such, coastal ecosystems process a significant amount of organic matter (OM) and play a central role in the global carbon cycle (Canuel and Hardison, 2016). Ultimately, estuaries and shelves determine the fluxes of OM that is exported from land to sea and buried in the sediments and returned to the atmosphere as CO2 within their bounds (Bianchi, 2011; Cai, 2011). In large estuaries and shelves, organic matter originates allochthonously from tributaries and the ocean, and autochthonously from primary and secondary production. Tributaries transport an OM mix formed of old terrestrial carbon from soil weathering, recent vegetation detritus from the watershed and newly produce vegetation and phytoplankton (Meybeck, 1982; Ward et al., 2017). These constituents are transformed by intrinsic processes that are modulated by environmental conditions (Raymond et al., 2016; Berggren et al., 2022). Upwelled waters can also bring important amount of dissolved organic matter to deep estuaries and shelves (Walsh, 1991; Bauer et al., 2013), but generally low particulate organic matter to estuaries and coasts. Phytoplankton and coastal vegetation, stimulated by important inorganic and organic nutrient inputs, contribute to the production and cycling of OM in estuaries (Hedges, 2002). The balance between production and consumption of OM is determined by primary production and respiration, defining the ecosystem metabolism, where heterotrophic ecosystems are the ones with primary production < respiration while the reverse situation occurred in autotrophic environments (Smith and Mackenzie, 1987). Although the balance and fate of OM in estuaries and shelves has been the subject of numerous studies for the last 50 years, its complexities make it difficult to generalize across ecosystems (Canuel and Hardison, 2016; Ward et al., 2017).
For instance, estuarine organic matter can be rapidly respired or degraded in surface waters stimulating concurrent primary production through newly generated and transported nutrients (Bauer et al., 2013; Fichot and Benner, 2014). In turn, the mixing of the different sources of organic matter has a direct influence on the magnitude of the primary and secondary production and its potential export to the aphotic layer through the interaction of biological and physical processes (Ducklow et al., 2001). The large amount of organic matter transported by tributaries toward the sea undergoes active exchanges between dissolved and particulate phases and transformation along the increasing salinity gradient. Biodegradation, photodegradation, flocculation, precipitation/dissolution are key intrinsic processes changing organic matter nature throughout its course from tributaries to the sea (Massicotte et al., 2017; Berggren et al., 2022). As a result, the composition of particulate and dissolved organic carbon (POC and DOC, respectively) and nitrogen (PON and DON, respectively) is modified at different rates resulting in changes in POC/PON and DOC/DON ratios, (i.e., preferential remineralisation of N leading to higher ratios as OM ages; Bianchi and Canuel, 2011). Additionally, origin of OM can be investigated as terrestrial OM generally possessed higher POC/PON and DOC/DON ratios than their marine counterpart (Aitkenhead and McDowell, 2000).
The recognition of the close coupling between organic matter and inorganic nutrients in eutrophication processes is slowly emerging (Nixon, 2009). Indeed, anthropogenic inputs of nutrients, including the inorganic and organic fractions, inducing an overproduction of organic material in an ecosystem is referred to as eutrophication (Smith et al., 1999; Andersen et al., 2006). This overproduction of organic matter generates a positive feedback cycle when remineralisation by heterotrophic organisms release inorganic nutrients that can be reused by primary producers (Deininger and Frigstad, 2019). The excess of organic production can be transferred to deep waters by the biological carbon pump, in which organic matter is consumed by aerobic respiration of microorganisms and CO2 is produced. This deoxygenation can generate bottom-water hypoxia in areas where O2 concentrations became lower than 2 mg/L (Malone and Newton, 2020). Hypoxic zones have been expanding since 1950 and are, for the most part, a result of anthropogenic activities through climate change and eutrophication (Breitburg et al., 2018). Deleterious effect occurs as affected areas lose biodiversity, ecosystem functions and the services they provide to society, including fisheries and nutrient cycling (Altieri and Gedan, 2015). Where vertical stratification is present, deoxygenation is often accompanied with water acidification exacerbating the pressure on affected ecosystems (Feely et al., 2010; Mucci et al., 2011; Cai et al., 2021).
Such conditions occurred in the St. Lawrence Estuary (SLE), the world’s largest estuarine system covering an area of about 240 000 km2 (Yang et al., 1996), located in the northeastern part of North America. Over the last century, the oxygen concentrations of the deep waters of the SLE and have declined dramatically from 4 mg/L to less 2 mg/L (Gilbert et al., 2005). Although changes in large-scale ocean circulation in the northwestern Atlantic (i.e., a lower contribution of the cold oxygen-rich water of the Labrador Current replaced by warmer, oxygen-poor water coming from the Gulf Stream), due to climate change, are thought to be responsible for the major portion of the oxygen decline (Gilbert et al., 2005; Claret et al., 2018), another contributing factor to the deoxygenation and acidification of St. Lawrence waters is a substantial increase of nutrient and OM discharge from urban and agricultural activities (Hudon et al., 2017; Jutras et al., 2020). Inputs of nutrients have been previously evaluated (Hudon et al., 2017), but the contribution of OM to hypoxia and eutrophication remain to be investigated.
Despite this importance, earlier studies in the SLE focused on a few chemical groups or localised sampling, preventing comprehensive understanding of organic matter dynamics, transport and fate. Recently, Hudon et al. (2017) described the export of TSM, DOC and DON of the St. Lawrence River (SLR) to the estuary and Lebeuf et al. (2019) estimated TSM and particulate inorganic matter (PIM) inventories and seasonality in the estuary. Overall, studies on organic matter biogeochemistry and inventories in the St. Lawrence Estuary based on comprehensive sampling of TSM, POM, POC, PON, DOC, and DON are still needed to provide a complete overview that could be fully integrated in biochemical models (Lavoie et al., 2021) and improve our knowledge of hypoxia and eutrophication. This study aims to improve our understanding of the organic matter cycle within the St. Lawrence Estuary. Specifically, we report transport of TSM, POM, POC, PON, DOC and DON for the SLE, considering inputs and outputs from tributaries and the Gulf, and compare them to SLE inventories. Additionally, we describe changes along the estuarine gradient by evaluating the conservative/non-conservative processes and their location.
2. Materials and methods
2.1. Study area and sampling
2.1.1. St. Lawrence system
As part of the St. Lawrence system, the SLE connects the Great Lakes, the second most important freshwater reservoir of the world, to the northwest Atlantic Ocean. More than 60 million humans live in its extensive watershed of ≈1.6 million km2 and it is among the world’s most important commercial waterways (Thorp et al., 2005). The SLE watershed is mainly forested (55% of its area), but urban and agricultural areas account for 22% and 20% of the land cover, respectively (excluding the region downstream of the Saguenay Fjord; Revenga et al., 1998). The SLE is traditionally divided into the Upper St. Lawrence Estuary (USLE) and the Lower St. Lawrence Estuary (LSLE) (Figure 1).
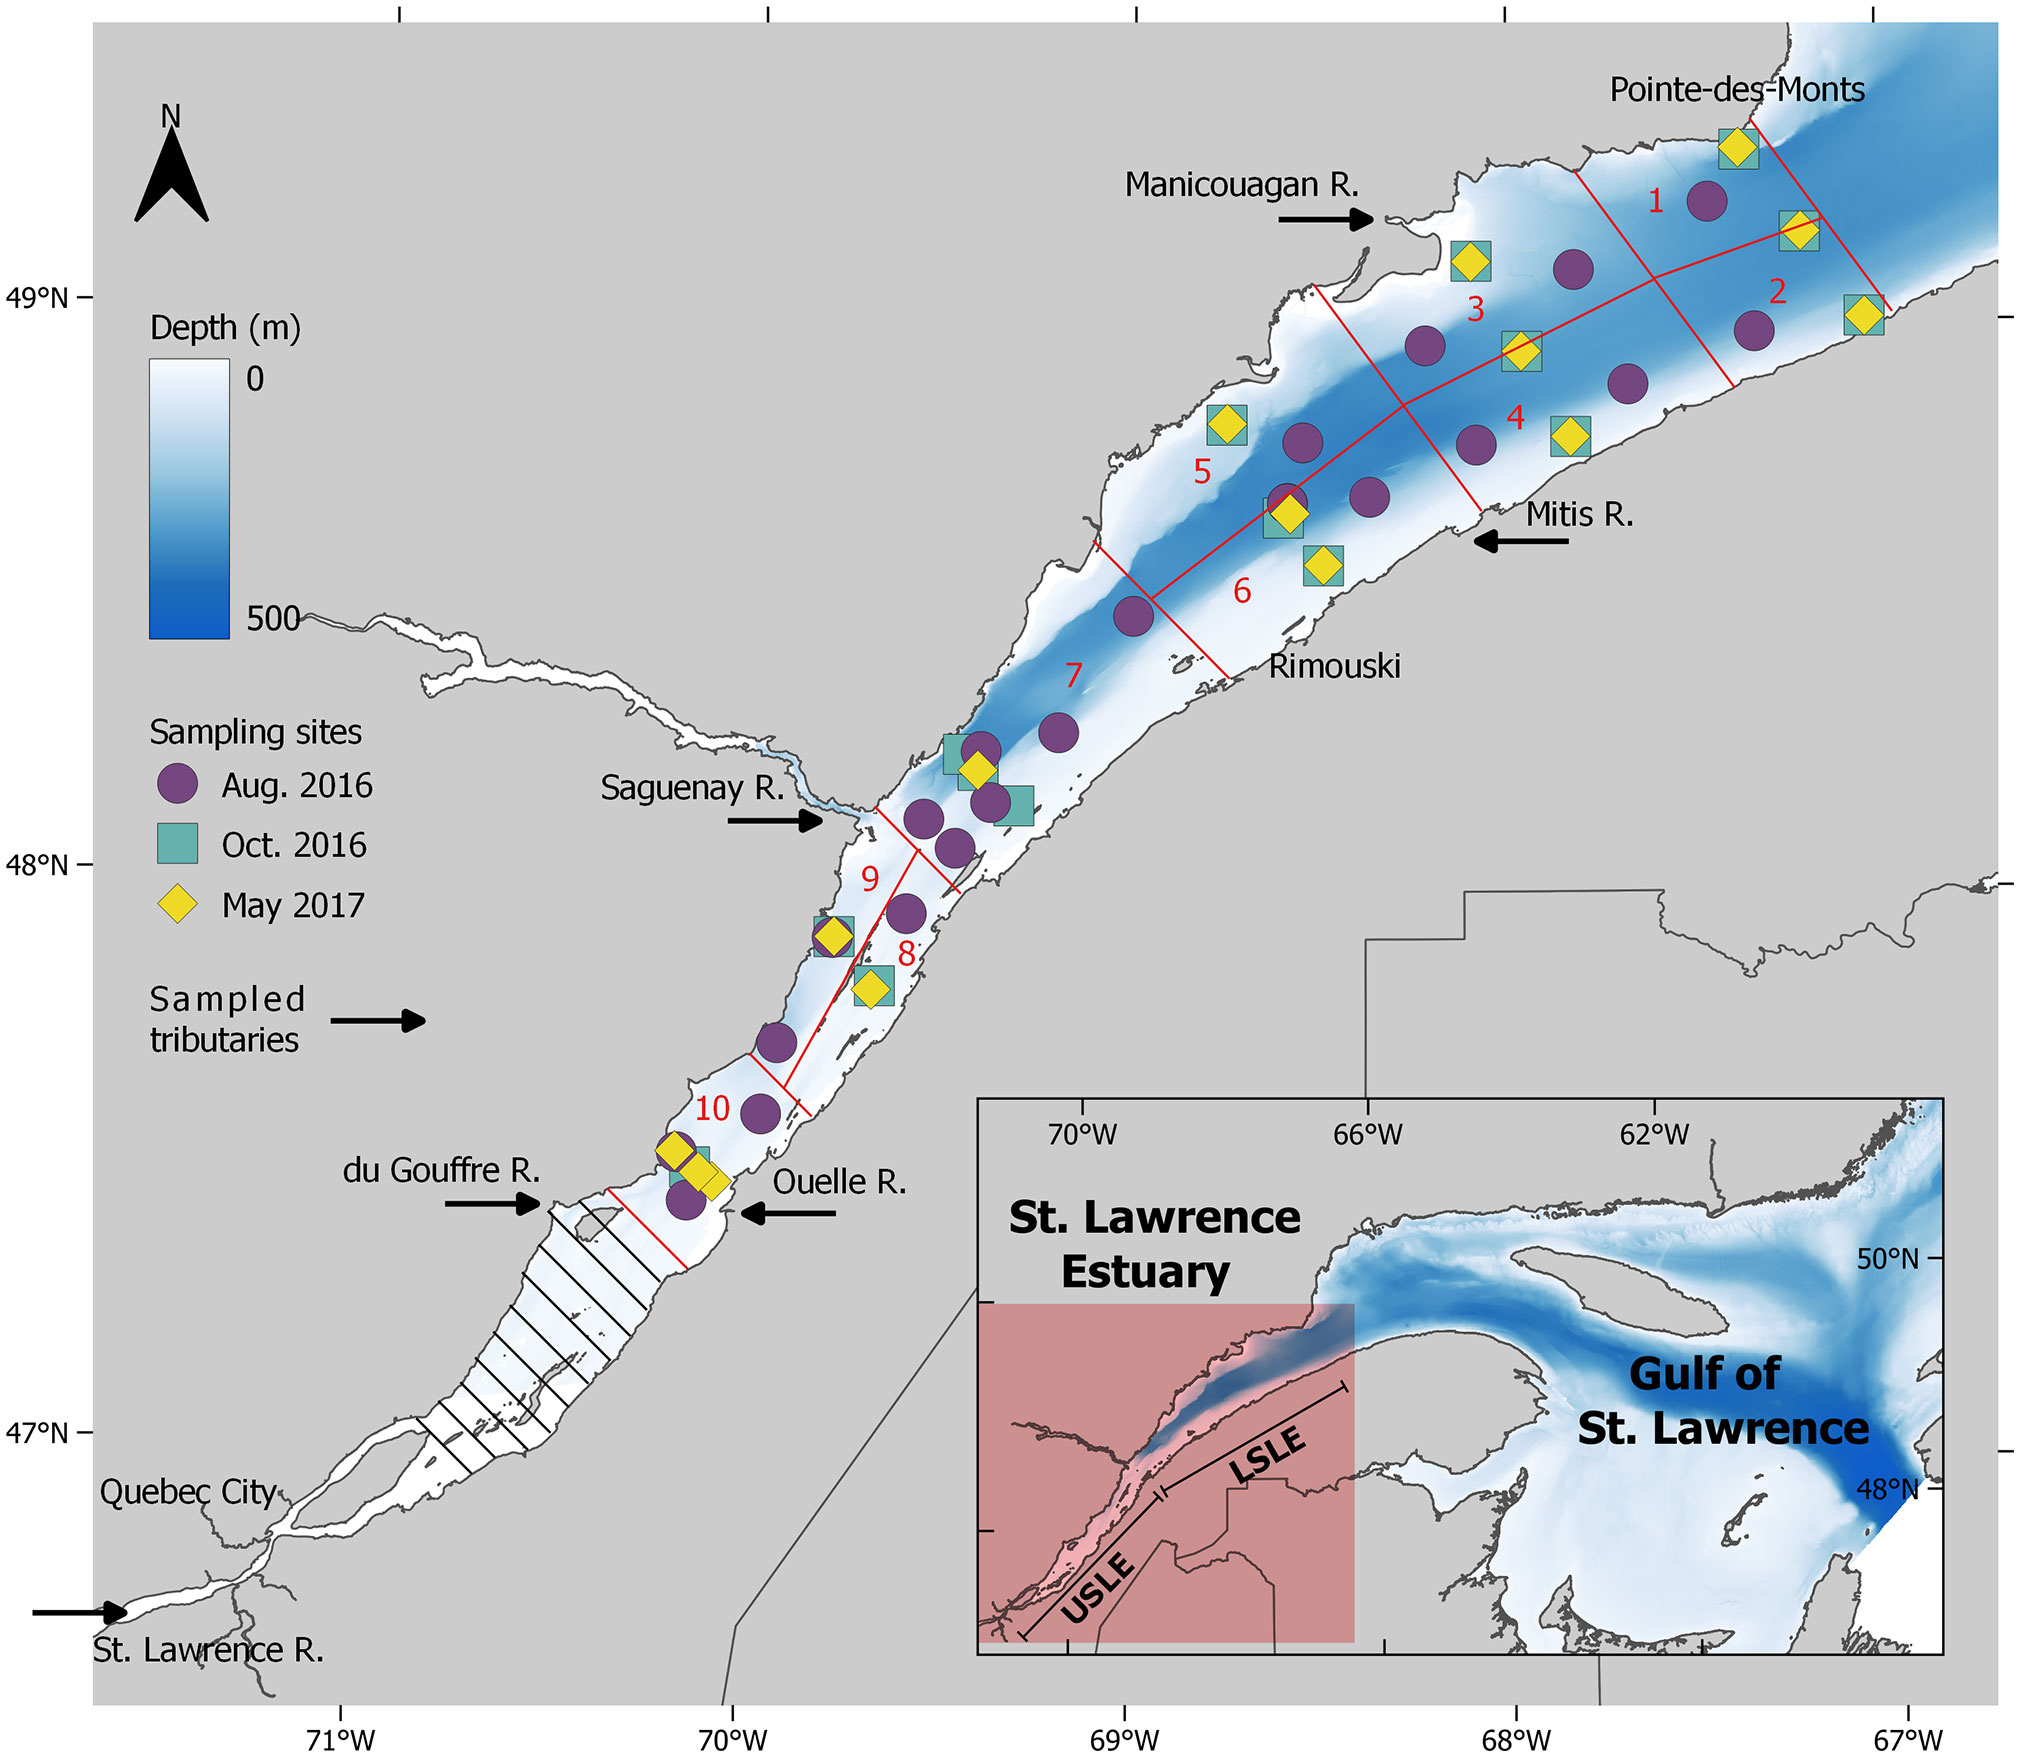
Figure 1 Six sampled tributaries and sampling sites for the August 2016, October 2016 and May 2017 time periods in the lower (sectors 1–7) and upper St. Lawrence Estuary (sectors 8–10) downstream of the maximum turbidity zone (hatched area).
2.1.2. Tributaries
The St. Lawrence River is the most important tributary of the SLE with a mean annual discharge of 12 210 ± 981 m3/s for the 2007–2017 period at Quebec City (Figure 1 and Table 1). On the north shore of the USLE, the du Gouffre River and the Montmorency River are small tributaries of the forested and mountainous landscape of the Canadian shield that have a combined mean annual discharge of 114 ± 17 m3/s (Table 1). The du Sud River and the Ouelle River are the most important tributaries of the south shore of the USLE with a combined modest mean annual discharge of 70 ± 10 m3/s. Their watersheds, located in the Appalachian Province, are mainly forested upstream and agricultural downstream, near their mouths. The Saguenay River is located in the forested Canadian shield and is the second most important discharge (2368 ± 242 m3/s) of the SLE. This river forms a deep (max 275 meters) fjord of 110 km long and ≈2 km wide that connects to the head of the LSLE. On the north shore of the LSLE, numerous rivers drain the forested landscape of the Canadian shield: des Escoumins River, Portneuf River, Sault aux Cochons River, Betsiamites River, des Outardes River, and Manicouagan River. Their global contribution to the SLE discharge is substantial with 2475 ± 93 m3/s. The three largest rivers (Manicouagan, aux Outardes, and Betsiamites) of the region have at least one hydropower dam along their course. Finally, on the south shore of the LSLE, in the Appalachian geological province, are found the Trois-Pistoles River, Rimouski River, Mitis River, and Matane River, which have a total mean annual discharge of 170 ± 23 m3/s (Table 1).
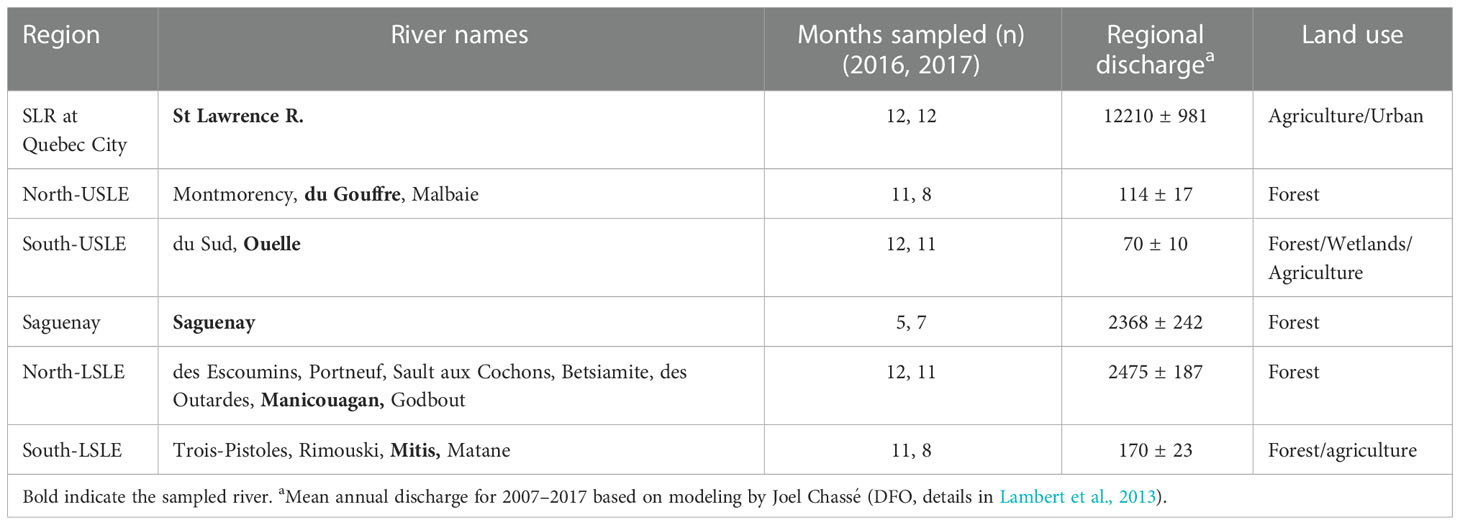
Table 1 Mean annual discharge (m3/s) of tributaries by region of the St Lawrence estuary.
During 2016–2017, we monitored the St. Lawrence River, the Saguenay River, the du Gouffre River, the Manicouagan River, the Ouelle River, and the Mitis River (Table 1). Specifically, these tributaries were chosen on the basis of being representative of the land use of their respective region and on their discharge. TSM and organic matter were measured monthly or fortnightly during summer in the St. Lawrence River at Quebec City as part of the monitoring program of Environment and Climate Change Canada (ECCC MSQE-BOATL Divisions). Collected water was pumped directly in thoroughly rinsed acid-washed bottles. Saguenay River surface water samples (~2 m depth) were also collected at its mouth by Parks Canada using a boat and limited to summer (June–October in 2016 and May–November in 2017). The four remaining tributaries were selected from rivers sampled by the “Ministère de l’Environnement et de la Lutte contre les changements climatiques du Québec” (MELCC) with the monitoring program “Réseau-rivière” (https://www.environnement.gouv.qc.ca/eau/eco_aqua/suivi_mil-aqua/qual_eau-rivieres.htm). At these sampling sites, surface (≤ 1 m) water was collected with a pole sampler.
In all cases, water samples were cold-stored in the field, sent to Maurice Lamontagne Institute (Fisheries and Oceans Canada) laboratory and generally received within 24 hours, but in some cases within 48 hours after the collection.
2.1.3. Estuary
The St. Lawrence Estuary is among the deepest and largest estuarine systems in the world (El-Sabh and Silverberg, 1990) displaying strong spatial and temporal patterns. The USLE is formed by the widening of the St. Laurence River near Quebec City and extends for nearly 200 km to the mouth of the Saguenay Fjord. The USLE being relatively shallow with a mean depth of 30 m and rather narrow with a maximum width around 20 km supports high tides (amplitude of ≈4–6 m) and a large salinity gradient. A maximum turbidity zone forms at the confluence of fresh and salt waters near the eastern tip of Ile d’Orléans and stretches for over 100 km to Baie St-Paul (Figure 1) due to the resuspension of bottom sediments by tides, winds, or waves (Painchaud and Therriault, 1989). The maximum turbidity zone supports highly variable concentrations that quickly oscillate between 10 to more than 200 mg/L for TSM (Lucotte, 1989) and from 0.5 to 1.2 mg C/L for POC (Tan, 1987). The USLE is similar to many well mixed and partially stratified estuaries where flow is dominated by tidal movements modulated by freshwater discharge and winds (El-Sabh and Silverberg, 1990).
The LSLE begins downstream of the mouth of the Saguenay Fjord and ends 250 km seaward to Pointe-des-Monts. Its width gradually increases from 20 km upstream to 50 km near Pointe-des-Monts. Its bathymetry is characterized by the Laurentian channel, a 300–500 m deep channel that stretches over 800 km to Cabot Strait, through the Gulf of St. Lawrence. At the head of the Laurentian channel, an abrupt rise in the floor gives rise to a shallow underwater sill (< 40 m) separating the LSLE from USLE and considerably influencing the hydrodynamic. The LSLE exhibits an estuarine circulation system with three layers. The surface water layer (0–40 m) flows seaward. The intermediate layer (40–140 m), a cold water mass generated during winter in the Gulf (Galbraith, 2006), and the dense and nutrient rich deep-water layer (> 140 m), both flow landward along the bottom of the Laurentian Strait. This landward movement stops when reaching the sill and is partly propagated up the water column generating several hydrodynamic processes (Saucier and Chassé, 2000) near Saguenay River mouth. The deep-water layer originates from the Atlantic Ocean as a mix from the Labrador current and the Gulf Stream (Claret et al., 2018). Therefore, the LSLE exhibits more oceanic properties than most estuaries (El-Sabh and Silverberg, 1990).
Samples were collected in the USLE downstream the maximum turbidity zone and in the LSLE at three time periods onboard of the Canadian coast guard ship Frederick G. Creed in August 2016 and May 2017, and onboard of the Canadian coast guard ship Hudson in October 2016 (Figure 1 and Table S1). At each station, using Niskin bottles attached to a standard conductivity-temperature-depth (CTD) rosette was deployed. The rosette was lowered to a depth of about 10 m above the sediments and water samples were collected during the ascent of the rosette using either 5.5 or 10 L Niskin bottles. Once on the deck, the water was filtered through a 180 μm sieve and stored in a 7.8 L insulated container before being processed aboard the ship or transported to Maurice Lamontagne Institute laboratory within a few hours of sampling. A total of 239 water samples were collected, the number of samples at each station varied between two and eight according to the water column depth of the stations.
2.2. Chemical analyses
TSM concentrations in the samples, reported in mg/L after a blank correction, were obtained by filtering in triplicate through combusted 25 mm glass fiber filters (GF/F, Whatman, 0.7µm pore size) and pre-weighed at precision of 0.001 mg. The volume of water filtered varied between 0.045 L to 1.9 L and was adjusted to form a visible layer of TSM on the filter but not enough to clog the filter. Filters were rinsed with about 30 mL of ultrapure water added in two steps to the filtration unit to remove the salt from the filter. After removing the top of the filtration unit, the ring of the filter was gently rinsed using the same procedure. Filters were stored at −20°C before being dried at 70°C for 4 h, cooled in a desiccator and weighed at the precision of 0.001 mg. POM concentrations were evaluated from the same filters used for TSM determination. After a combustion at 450°C for 5 h, filters were allowed to cool in a desiccator before being weighed at the precision of 0.001 mg, corresponding to the particulate inorganic matter (PIM). POM was calculated as the weight difference between TSM and PIM. The acceptance criterion (coefficient of variation < 20%) for POM was identical to the one of TSM, yielding the precision of 12.0 ± 13.4% and 7.3 ± 6.0%, respectively. When a filter was excluded from the TSM mean calculation (30 out of 1318 analysed filters), it was systematically excluded from the POM mean calculation.
POC (mg C/L) and PON (mg N/L) concentrations in the samples were also obtained by filtering water through combusted 25 mm glass fiber filters (GF/F, Whatman, 0.7µm pore size). Laboratory duplicate were analysed for about 25% of the samples. Filters were placed face up in a Petri dish, wrapped in aluminum foil, and frozen at –20°C before the analyses. Filters were dried at 70°C for 4 h, cooled in a desiccator and encapsulated in an acetone cleaned tin sheet before being analyzed with a Costech ECS 4010 analyser. Analytical precision as the coefficient of variation was 7.1 ± 6.1% for POC and 9.5 ± 9.6% for PON.
For the determination of dissolved inorganic nitrogen (DIN), defined as the sum of nitrite, nitrate, and ammonium, samples were syringe filtered through combusted 25 mm glass fiber filters (GF/F, Whatman, 0.7µm pore size), collected in acid-washed polyethylene tubes, and stored at −80°C. Samples that were filtered aboard the ship were stored at −20°C for the duration of the cruise. Analyses were carried out using a Bran+Luebbe AutoAnalyzer 3. The precision expressed as the coefficient of variation was 3.2 ± 2.0% for DIN. For DOC and total dissolved nitrogen (TDN), the samples were syringe filtered through pre-combusted 25 mm glass fiber filters (GF/F, Whatman, 0.7µm pore size), acidified and stored at 4°C until analysis. DOC and TDN in water samples were measured by high temperature catalytic oxidation on a Shimadzu TOC-VCPN instrument. Analytical precision as the coefficient of variation was 1.7 ± 1.0% for DOC and 2.4 ± 1.9% for TDN. Dissolved organic nitrogen concentrations (DON) were calculated as the difference between TDN and DIN concentrations. DIN, TDN and DOC values for SLR and other tributaries, except Saguenay River, were only partially produced by Maurice Lamontagne Institute laboratory. After a careful statistical comparison, data provided by the laboratory of ECCC (method details in Environment and Climate Change Canada, 2014) and by MELCC (MELCC, 2020) were converted and combined to Maurice Lamontagne Institute laboratory data (Figure S1).
2.3. Calculations and statistical analysis
2.3.1. Tributary loadings and ratios
Concentrations of dissolved and particulate variables in tributaries were generally measured once monthly (Table 1). When more than one measurement was made in a single month, the mean value was calculated. Monthly tributary discharges were obtained from the output of a hydrologic model based on the balance of precipitation minus evapotranspiration, which includes the snowpack formation in winter as well as the snowmelt in spring (Joël Chassé, DFO, personal communication, see Lambert et al., 2013 for a description of the original model). Monthly tributary loadings for each region were calculated by multiplying the product of the discharge of a region with the concentration of the representative sampled tributary for each month individually. When concentrations were missing (23 cases out of 120, Table 1) for a given month, mainly during winter because of the ice cover, they were calculated for each region using the linear regression, between measured concentrations and mean monthly modelled discharge. Similar discharge-concentration relationships have been reported for many dissolved and particulate variables in the St. Lawrence River at Quebec City (Rondeau et al., 2000; Hudon et al., 2017).
The strength of the relation between monthly discharge and concentrations over 24 months was explored for each tributary with Pearson correlations. To evaluate whether the quality of OM reaching the mouth of rivers was similar for each tributary, POM/TSM, POC/PON and DOC/DON ratios were each compared with a nonparametric Kruskal-Wallis test. This test, when significant (p ≤ 0.05), was followed by Dunn’s test for multiple comparisons. For Dunn’s tests, a Holm’s correction of the p-values was applied for the multiple testing.
2.3.2. Estuary inventories and concentrations
The study area was divided in cells of 2.5 by 2.5 km (6.25 km2) as in previous studies (Dutil et al., 2012; Lebeuf et al., 2019). Cells were fused to create 10 sectors that have at least two sampling sites for each month (Figure 1), including sites at the center of the LSLE (sectors 1–6) that were used in two adjacent sectors. The depth of each cell was calculated from the average bathymetric measurements and tidal levels provided by the Canadian Hydrographic Service. Considering vertical water stratification in the SLE, four distinctive water layers were considered: a warm surface layer (first 40 m), an intermediate layer (40–140 m), a deep layer (> 140 m down to 10 m above the bottom), and a 10 m bottom layer (Bewers and Yeats, 1979; Lebeuf et al., 2019). The latter was always kept in our calculations notwithstanding of total depth. Volumes were calculated for each depth layer of each sector for a total volume of 1732 × 109 m3. Partial inventories were obtained in each sector/layer by multiplying the mean concentration of dissolved and particulate variables with the corresponding water volume following the modified rectangular integration approach described in Lebeuf et al., 2019. Inventories were calculated by summing each sector/layer combination for each time period for the USLE downstream of the maximum turbidity zone and the LSLE. Unfortunately, too few measurements precluded the calculation of an inventory for the dissolved variables (DOC and DON) of August 2016.
To exemplify the important upstream–downstream differences arising between USLE and LSLE, the nonparametric Wilcoxon rank test was applied in the comparison of particulate, dissolved, and ratios of OM. Furthermore, trends between ratios and distance from Quebec City were tested with linear regressions as a significant slope could be indicative of OM transformation and non-conservative processes.
To investigate water stratification and OM changes occurring with depth in USLE and LSLE, TSM, POM, POC, PON, DOC, and DON concentrations were compared among depth layers (Surface, IL, deep, bottom) with a nonparametric Kruskal-Wallis test. These tests were followed by Dunn’s test for multiple comparisons when the Kruskal-Wallis test was significant (p ≤ 0.05). For Dunn’s tests, a Holm’s correction of the p-values was applied for the multiple testing.
2.3.3. Transport
Transport of TSM and organic matter in the USLE and LSLE was calculated for the months of May, August and October from tributary inputs and exchanges (input/output) with the Gulf, assuming no major change over a month. For the USLE, inputs from the St. Lawrence River and the sum of north shore and south shore USLE tributaries were considered as seaward transport toward LSLE. LSLE inputs flowing landward to the USLE were considered to be negligible over a tidally average period, i.e., a similar water volume goes upstream during flood tide as the volume that goes downstream during ebb tide (Saucier and Chassé, 2000) The output of the USLE moving seaward to the LSLE was calculated based on the mean concentrations of the five most eastward sampling stations in sectors 8 and 9 (Figure 1) and multiplied by the sum of tributaries volume from the north and south shore of the USLE, and St. Lawrence River. For the LSLE, two other inputs were considered, 1) the sum of inputs from Saguenay River and north shore and south shore LSLE tributaries flowing seaward in the surface layer and 2) the inputs from the Gulf at Pointe-des-Monts, flowing landward at depth, calculated from the monthly volume of upstream transported water (Galbraith et al., 2019) and mean concentrations at depths > 40 m of the six most eastward sampling stations in sectors 1 and 2 (Figure 1). Similarly, the output of the LSLE seaward toward the Gulf was calculated from the mean concentrations at the surface (≤ 40 m) of the six most eastward sampling stations in sectors 1 and 2 and the monthly volume of water transported downstream of Pointe-des-Monts (Galbraith et al., 2019). Errors based on the standard deviation on measurement replicates and a 10% relative error on discharged modelled (tributaries) and 10% relative error on calculated volumes (estuary) were propagated using simplified rules for the propagation of errors in multi-variable functions (Hughes and Hase, 2010).
2.3.4. Evaluation of transport in the USLE and LSLE
To compare the transport of TSM and organic matter between May, August and October, net transport was calculated for USLE and LSLE separately. Net transport is the difference between total inputs and outputs. The atmospheric deposition was considered negligible (< 1%) (Pocklington, 1986). A positive net transport value implies either an increase of the inventory or internal loss (e.g., sedimentation, respiration, removal of biomass, denitrification). A negative net transport value is associated to a decrease of the inventory or internal production (e.g., primary production).
Additionally, the net export/loading ratio was calculated for USLE and LSLE separately. Net export is calculated as the difference between seaward outputs and landward inputs at the seaward boundary of a waterbody (Nixon et al., 1996; Shen et al., 2022). In our case, USLE had no landward inputs from the LSLE while the latter had landward inputs from the Gulf. The net export of each waterbody is then divided by the inputs flowing seaward from their respective tributaries (USLE: SLR + north shore and south shore of the USLE; LSLE: output of the USLE moving seaward + north shore and south shore of the LSLE). The net export/loading ratio represents the fraction of loadings (inputs) that is exported downstream. This value is negative if, at the seaward boundary of a waterbody, landward inputs are larger than seaward outputs and positive in the reverse situation. Shen et al. (2022) described two scenarios for positive net export/loading ratio. The first when net export/loading ratio is between zero and one, indicating that a fraction of the matter is removed from the estuary water before the rest is exported seaward. The second when net export/loading ratio is superior to one signifying that inputs are amplified by autochthonous growth before export.
2.3.5. Mixing evaluation
Since circulation in the SLE is complex and influenced by multiple tributaries, a simple two-endmember mixing model is not appropriate to evaluate how concentrations of TSM, POM, POC, PON, DOC, and DON deviated from the expected conservative mixing values along the estuarine gradient. Instead, a first order approach was applied, based on linear regression, similar to what has been previously used in the Wadden Sea (Seidel et al., 2015), Baltic Sea (Seidel et al., 2017), and in a subtropical estuary (Mori et al., 2019) to investigate this deviation. Briefly, each variable was regressed against practical salinity. If a linear trend was detected at an alpha level of 0.05, deviation patterns were examined in the standardized residuals along distance from Quebec City. If no linear trend was found, data were standardized by subtracting the mean and by dividing by the standard deviation (also termed z-score or standardised score). Both procedures yield unitless values where one unit represents a standard deviation. Moreover, since the salinity effect, and as a corollary the effect of tides, is removed from the data, it is possible to visualise them along the upstream–downstream distance from Quebec City. Standardized values close to zero are associated with a conservative behaviour while positive or negative values can be related to either production and removal, respectively, or by input of water with different TSM and organic matter concentrations.
2.3.6. Statistical software
All statistical analyses were made using the statistical software R (R Core Team, 2022). Linear regression analyses, Wilcoxon rank tests, and Kruskal-Wallis tests were performed with the “stat” library. Dunn’s tests following a significant Kruskal-Wallis test were implemented with “FSA” library (Ogle et al., 2022).
3. Results
3.1. TSM and organic matter transport by the tributaries of the St. Lawrence Estuary
The mean monthly loadings of TSM and organic matter from the St. Lawrence River, showed strong seasonal variations (Figure 2) with maxima in April–May and minima in August–October and moderate increase during November. This trend was observed in other tributaries although their contribution was less important. Indeed, Pearson correlation between discharge and concentrations was generally strong and significant (Table 2). A few exception occurred as south-USLE and north-LSLE tributaries exhibited almost no relationship with discharge. Organic nitrogen (PON and DON) was also poorly associated to discharge.
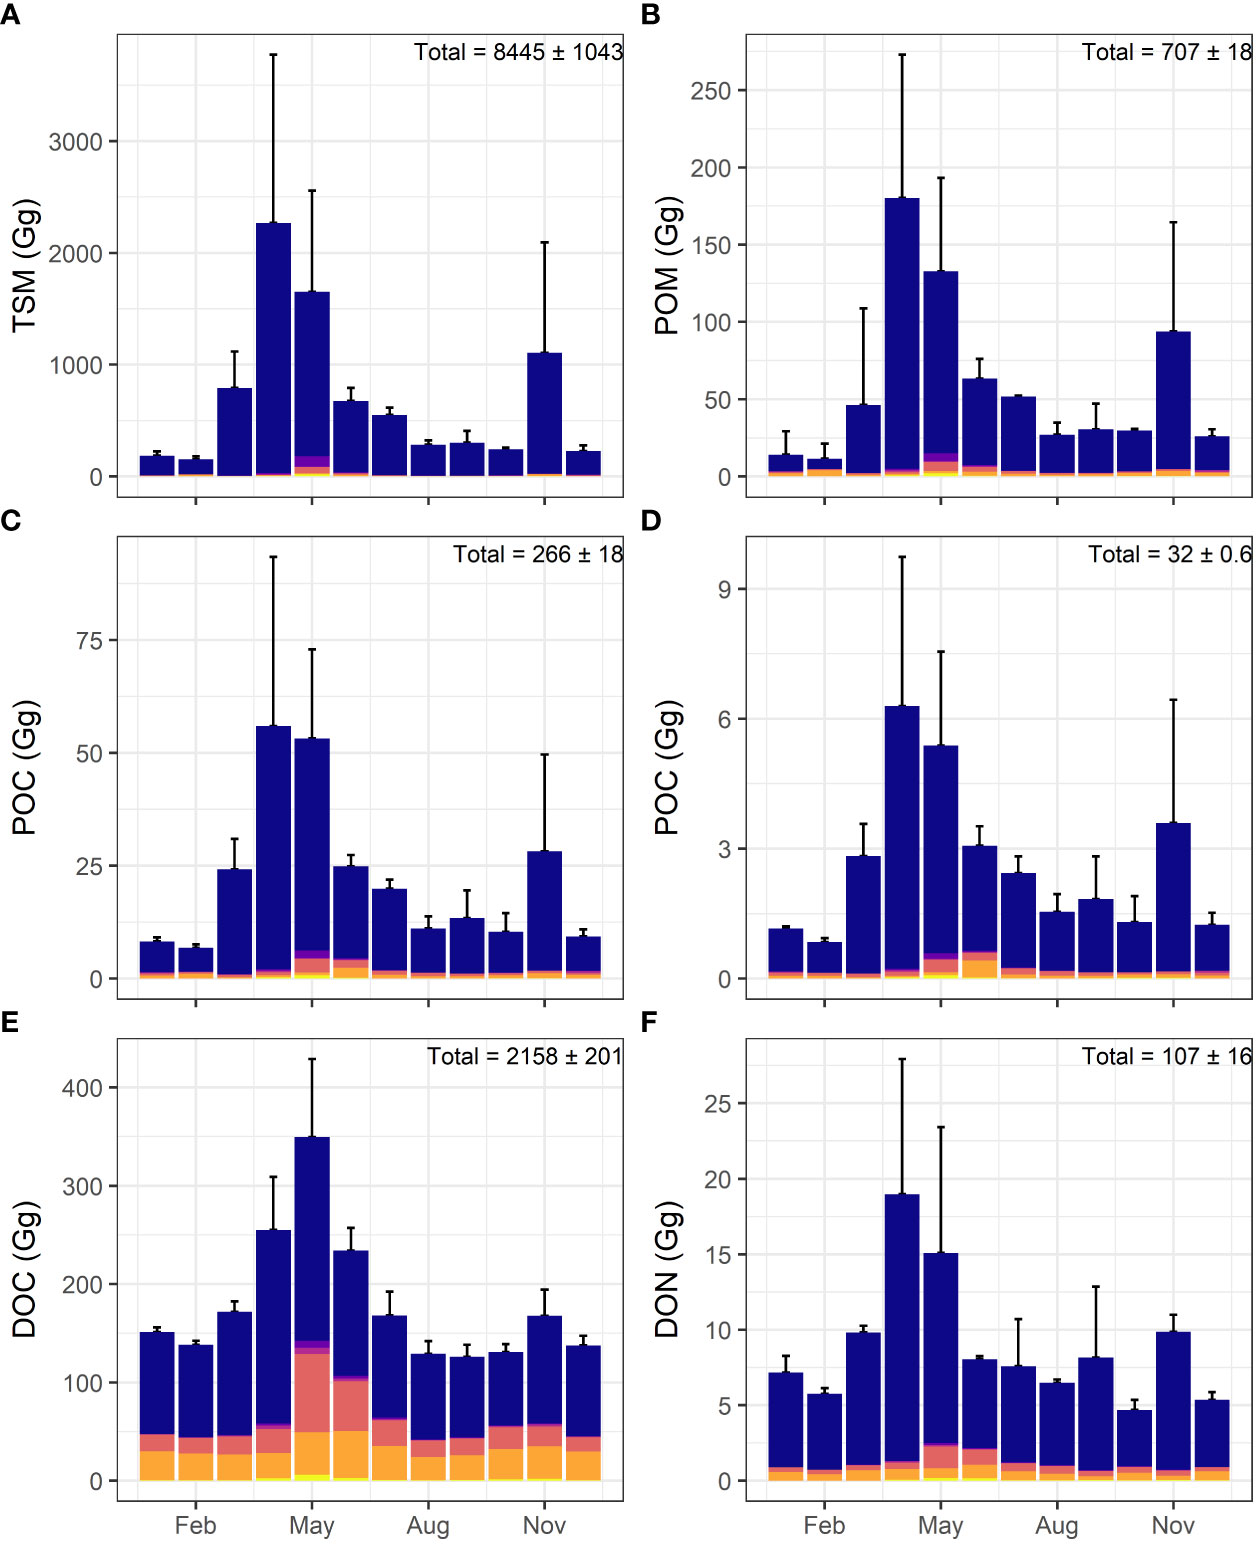
Figure 2 Stacked barplots of St. Lawrence estuary tributaries mean loadings (bars) and cumulative standard deviation (error bars) of (A) TSM, (B) POM, (C) POC, (D) PON, (E) DOC, and (F) DON for 2016–17. From top to bottom: blue = St. Lawrence River, purple = Northshore-USLE tributaries, fuchsia = Southshore-LSLE tributaries, coral = Saguenay River, orange = Northshore-LSLE tributaries, yellow = Southshore-LSLE tributaries.
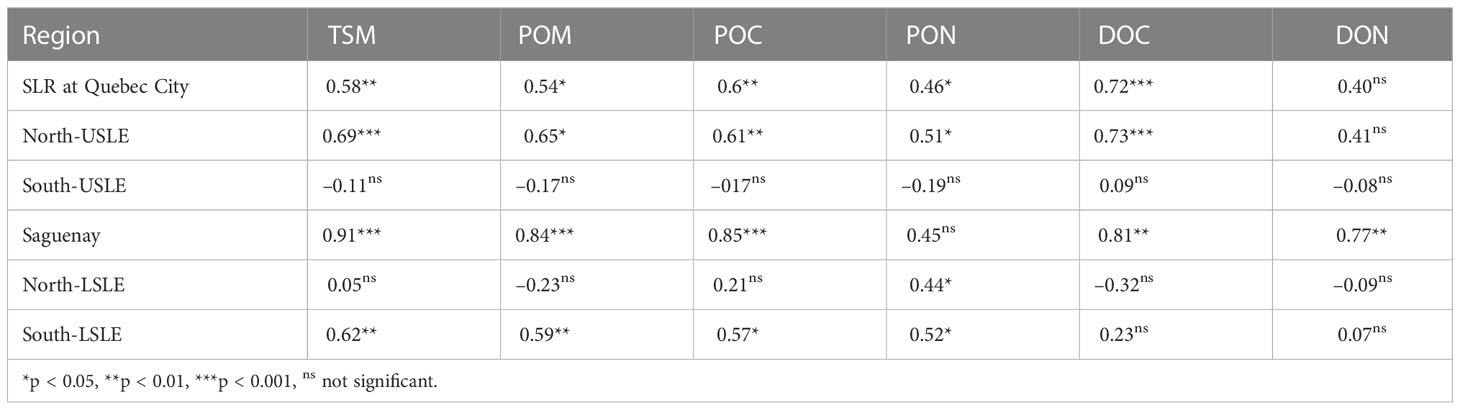
Table 2 Pearson correlations between TSM and OM concentrations and discharge of tributaries of each region.
For all particulate variables (TSM, POM, POC, PON), the St. Lawrence River at Quebec City contributed more than 90% of the total tributary loadings to the St. Lawrence Estuary. The St. Lawrence Estuary received from its tributaries a mean annual loading of POM of 707 ± 18 Gg/y accounting for 8% of the annual TSM loading (8445 ± 1043 Gg/y) for 2016–2017 (Figures 2A, B). Mean annual POC exported by the SLE tributaries was 266 ± 18 Gg/y, roughly the third of the POM carried to the SLE. Adding the 32 ± 0.6 Gg/y of PON, it reaches 42% of POM (Figures 2C, D). For the dissolved fraction, DON exported by the St. Lawrence River also accounted for about 90% of the total estimated loading to 107 ± 16 Gg/y while its contribution was slightly less important for DOC with around two thirds of the total SLE tributary loading evaluated to 2158 ± 201 Gg/y. Compared to particulates, dissolved organic carbon (DOC) and nitrogen (DON) represent about eight times the quantity of POC and 3.4 times the value of PON, respectively (Figures 2E, F). Variability among the two sampling years was weak to moderate ranging from less than 3% for PON and POM to 14% for DON.
3.2. Concentrations and inventories of TSM and organic matter in the St. Lawrence Estuary
Concentrations of TSM and organic matter variables were significantly higher in the USLE than in the LSLE for all depths combined (Wilcoxon rank test for each variable, p < 0.001, n = 131–185) with the only exception being DON concentrations (Wilcoxon rank test, p = 0.058, n = 131) (Figure 3). In the USLE, no difference of concentrations, excepted for DOC, was detected among depth layers (Kruskal-Wallis test followed by Dunn’s test, p > 0.05, n = 50). DOC concentrations were significantly higher (Kruskal-Wallis test followed by Dunn’s tests p = 0.0084, n = 35) in the surface layer than in the intermediate layer with in between values for the deep and bottom layers (Figure 3).
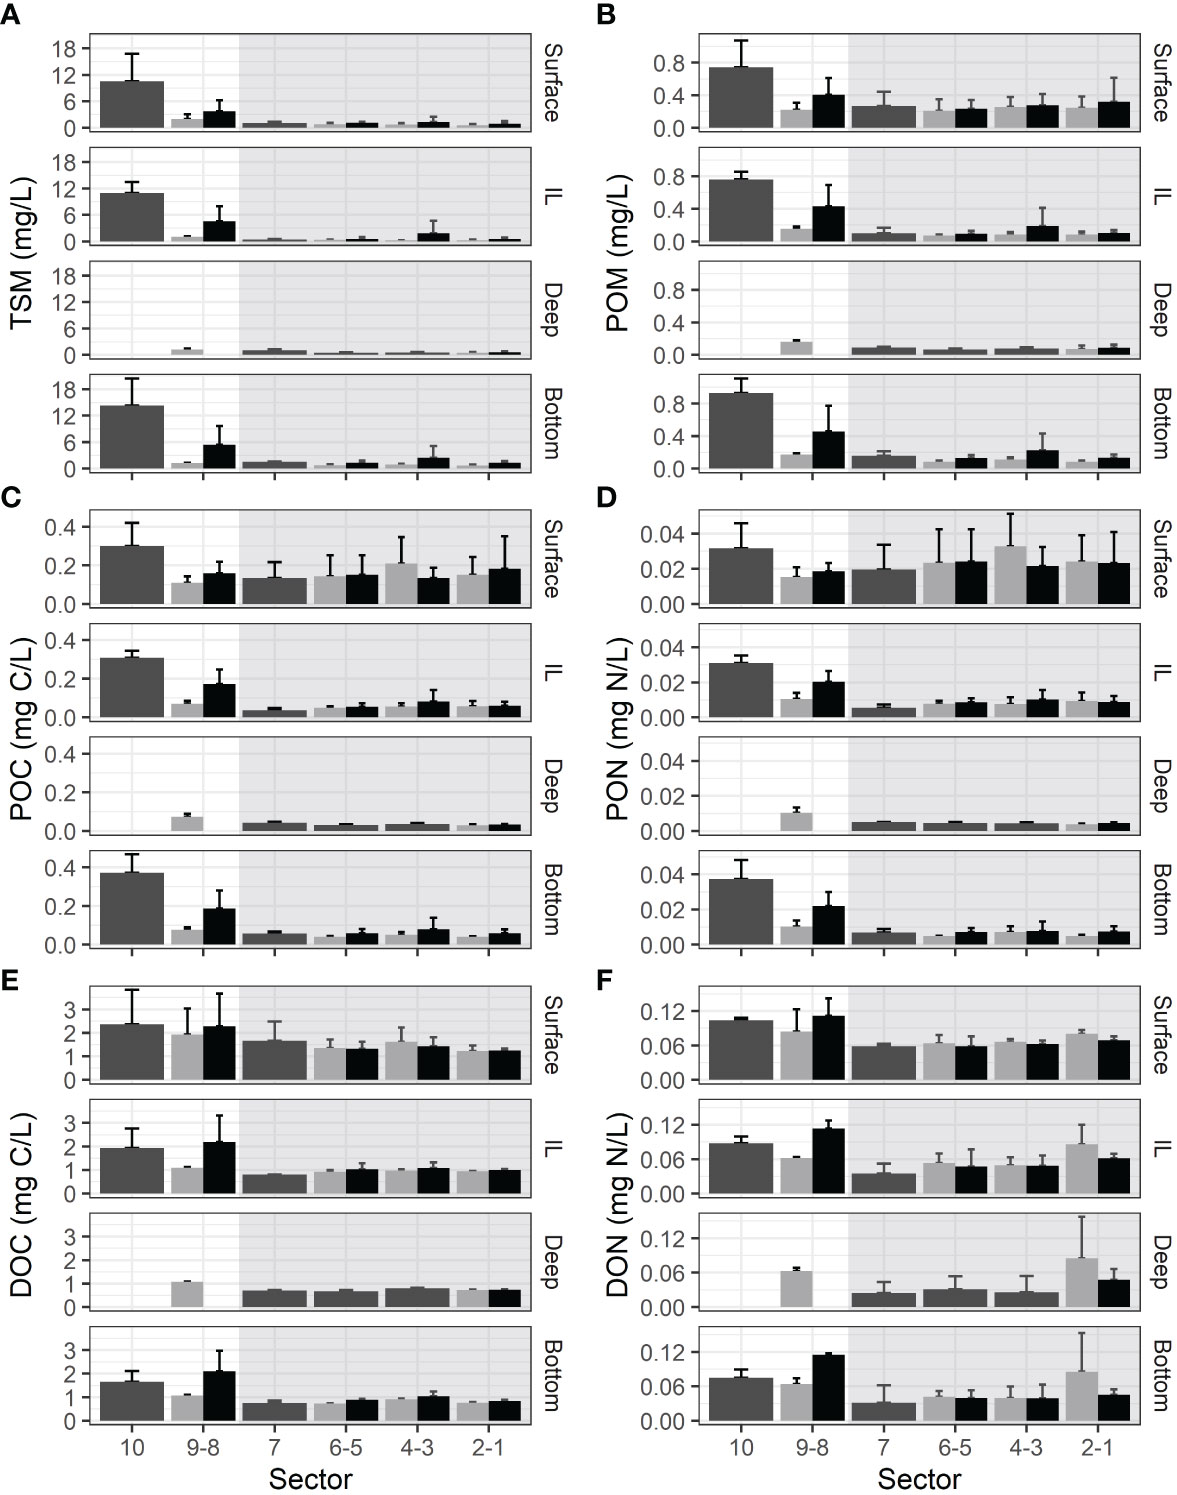
Figure 3 Concentrations (mean ± sd calculated for three time periods) of (A) TSM, (B) POM, (C) POC, (D) PON, (E) DOC, and (F) DON for the St. Lawrence estuary in 10 sectors, for each depth class. Dark gray = whole cross-section, pale gray = north of thalweg, black = south of thalweg. White background = USLE (downstream of the maximum turbidity zone), and gray background = LSLE. The depth of the USLE only reach the deep layer in sector 9.
In the LSLE, surface concentrations were the highest. From there, concentrations exhibited a progressive decrease through the intermediate layer to reach their lowest point in the deep layer. Finally, they showed a slight increase near the bottom. This global C shape pattern, generally associated with the deep sites in the Laurentian channel is observed for all variables to various degrees (Kruskal-Wallis test followed by Dunn’s tests, p < 0.001, n = 96–136) (Table 3). The inclusion of sites in the upwelling zone at the beginning of the Laurentian channel where stratification is weaker and coastal sites where lateral transport is more important, complexified the OM dynamics and weakened the C-shape pattern observed.
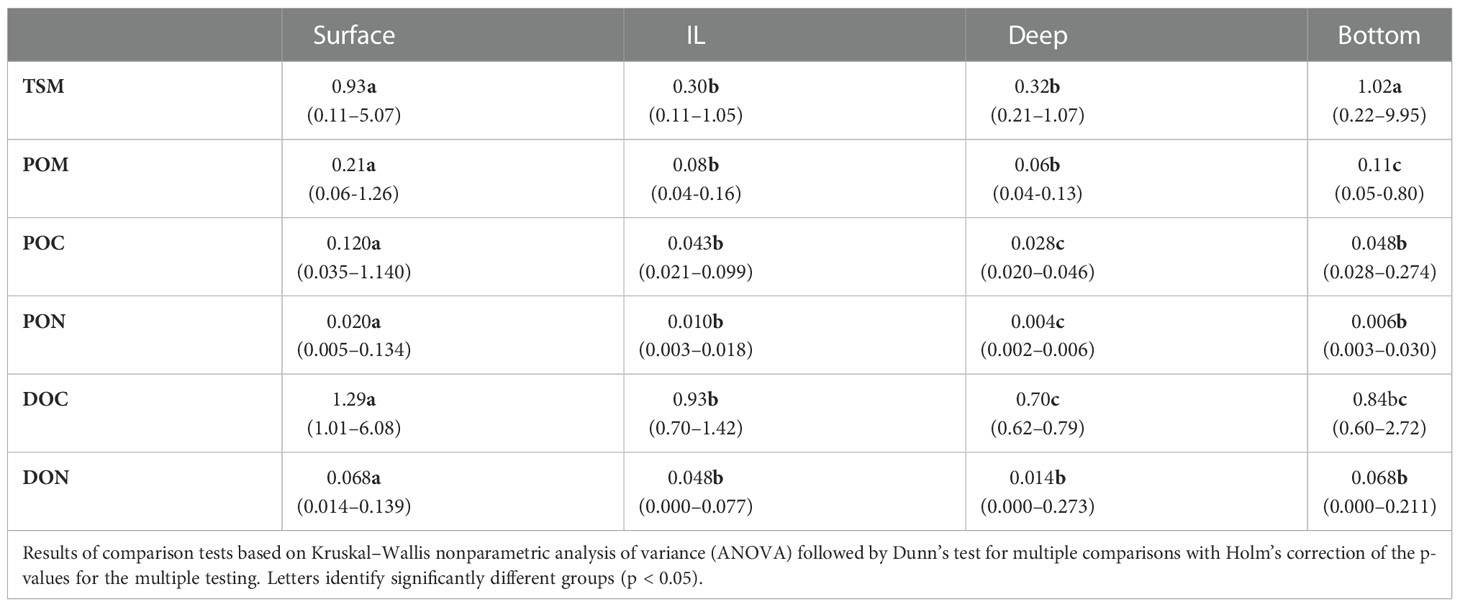
Table 3 Median (min-max) concentrations (mg/L) of particulate and dissolved organic matter in the LSLE for 2016–17.
Inventories (mean ± sd) of particulate and dissolved matter in the SLE (USLE without the maximum turbidity zone and LSLE) was calculated from sampling in May, August and October. Globally, the POM inventory was estimated to 231 ± 72 Gg accounting for 16% of the mean TSM pool (1466 ± 547 Gg) for 2016–2017. POC and PON inventories were respectively, 121 ± 33 Gg and 17.2 ± 5.5 Gg and their sum represented 60% of the POM pool of the SLE. Compared to particulates, the inventory of DOC (1699 ± 246 Gg) and DON (86 ± 14 Gg) represent about fourteen times the quantity of POC and five times the value of PON, respectively.
3.3. TSM and organic matter transport and inventories
TSM and organic matter transport were calculated for May, August and October (Figure 4) along with their associated errors (Figure S2). Transport of TSM and OM can be compared to inventory estimations in USLE and LSLE.
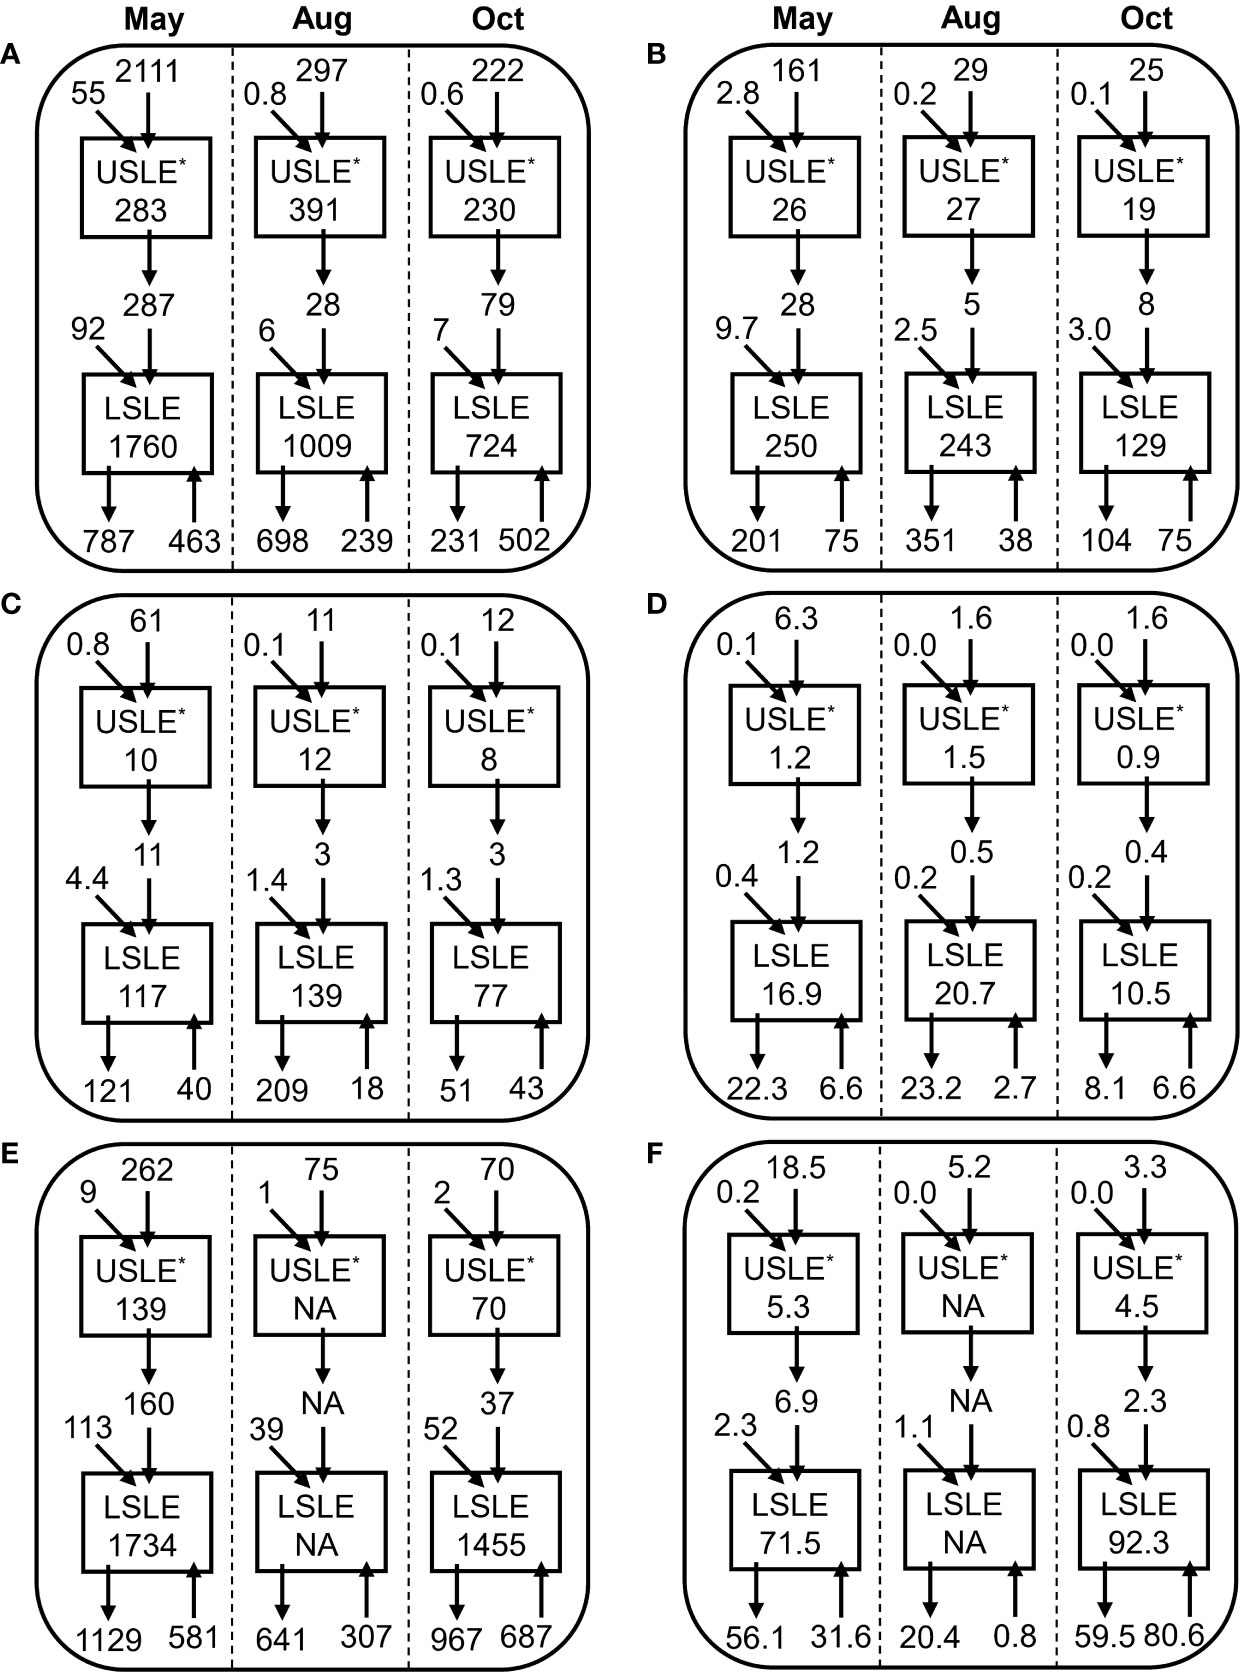
Figure 4 Transport (Gg) of (A) TSM, (B) POM, (C) POC, (D) PON, (E) DOC, and (F) DON by tributaries and Gulf and inventories of the USLE and LSLE for May, August and October. Arrows represent transport and inventories are inside boxes. For each month and each variable, values are presented along the upstream–downstream continuum from top to bottom, namely: SLR transport to USLE (down arrow), north+south USLE tributaries transport to USLE (tilted arrow), USLE inventory (box), transport from the USLE to LSLE (double down arrow), Saguenay + north + south LSLE tributaries transport to LSLE (tilted arrow), LSLE inventory (box), transport from the LSLE to the Gulf (down arrow), and transport from the Gulf to the LSLE (up arrow). *USLE without the MTZ.
SLR inputs going seaward and Gulf inputs moving landward were always the most important contributors to the SLE, but their relative importance varied among the three studied months and between particulate and dissolved forms (Figure 4). For particulate matter, SLR inputs were more important than those from the Gulf in May, of similar magnitude in August and smaller in October. For dissolved variables, Gulf inputs were always more important than those from the SLR excepted for DON in August because inputs from the Gulf were low. Total inputs (i.e., sum of tributaries and Gulf inputs) of TSM and particulate organic matter were invariably at their highest in May but of similar size in August and October. Total inputs of dissolved organic matter were at their highest in May and October driven by important Gulf inputs. Maximum exports from the USLE to the LSLE were highest in May for all variables associated with the high water discharge in that time period. Exports from the LSLE toward the Gulf were highest in August for most particulate variables but lowest for both DOC and DON.
Inventory of TSM in the SLE (sum of the USLE and LSLE) was maximum in May and decreased to its lowest point in October (Figure 4). For POM, high inventories were recorded in May but also in August while a minimum was observed during October. POC and PON were at their maximum in August closely followed by May values whereas minima occurred in October. DOC inventory was higher in May than in October while the opposite was true for DON (Figure 4). The organic matter of the USLE consistently peaked in August while it was not always the case for the LSLE (i.e., TSM and POM).
Errors based on standard error propagation formulas, generally yield low error terms for all variables (2–28%), which do not affect the interpretation of the results with the exception of POM (Figure S2) which results must be interpreted with caution.
Globally, an unbalance in the net transport was noticed for the St. Lawrence Estuary (Table 4). In the USLE, a positive net transport was observed for all variables and time period meaning TSM and organic matter is retained or lost within this zone. Net Transport of matter toward the LSLE was 3–13 fold more important in May than in August or October. Less than 36% of TSM and POM loadings (net export/loading ratio range: 0.095–0.355, Table 4) was exported to the LSLE and, consequently, the difference (64–90%) is either accumulated or transformed within the USLE. For DOC and DON, the situation was reversed with more than 37% of the loadings exported toward the LSLE.
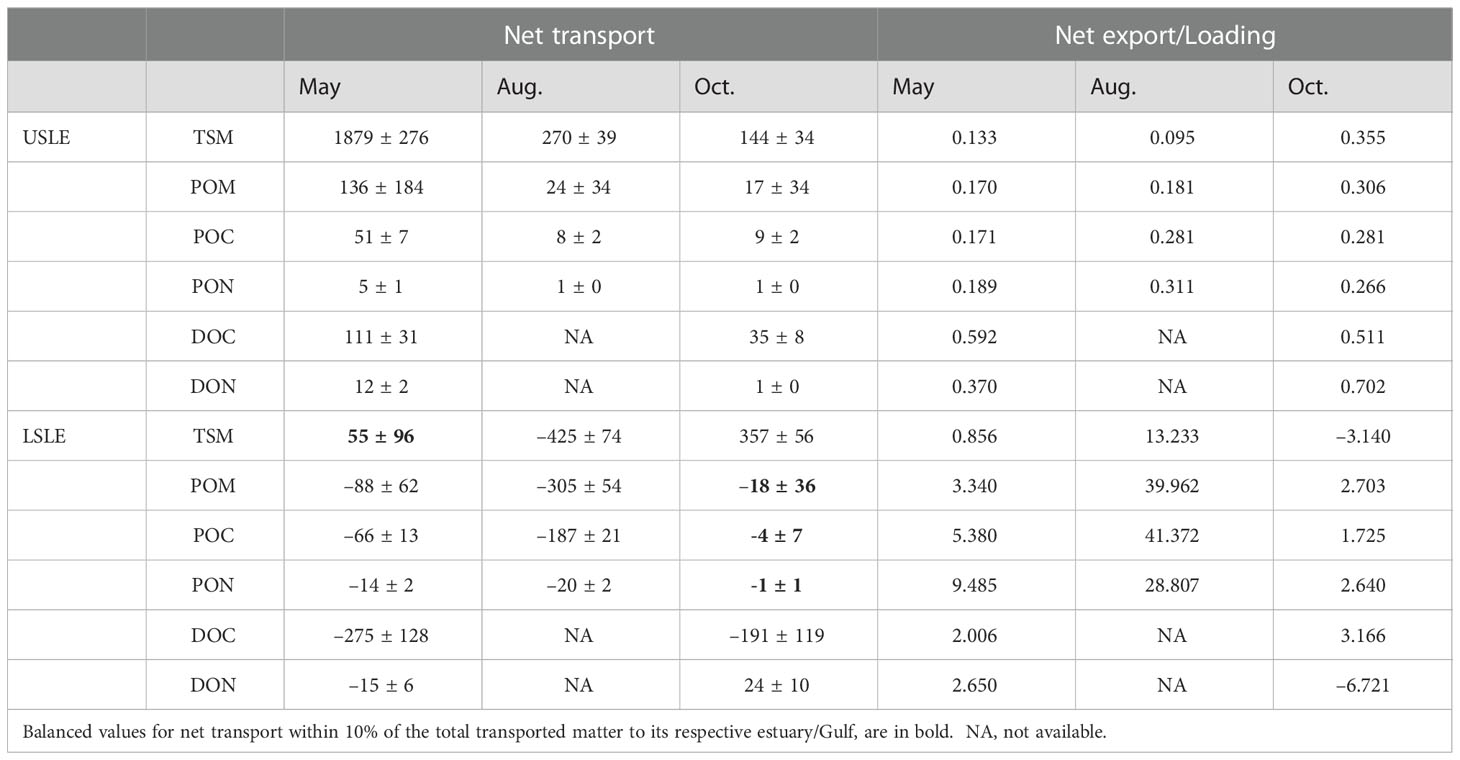
Table 4 Net transport (Gg) and net export/loading ratio of TSM and organic matter in the St. Lawrence estuary.
Net transport from the LSLE to the Gulf of St. Lawrence was generally negative indicating either a decrease of the inventory or, more probably, internal production (Table 4). Some exceptions occurred with TSM in May and POM, POC and PON in October that had a balanced transport within 10% of the total matter to the LSLE. Positive net transport for TSM and DON in October was also observed in the LSLE. Several net export/loading ratios were superior to the unit, a value likely associated with growth, during August and also for POM, POC, PON, and DOC during May and October (Table 4). Negative net export/loading ratios were only obtained for TSM and DON in fall because Gulf inputs to the LSLE are larger than its outputs in the opposite direction. The only net export/loading ratio value between zero and one was 0.86 for TMS in May meaning that 86% of TSM loading were exported toward the Gulf.
3.4. Upstream–downstream patterns in TSM and organic matter
3.4.1. Ratios
The fraction of organic matter content in TSM differed significantly among tributaries as shown by the Kruskal-Wallis rank test (p < 0.001) (Figure 5A). The St. Lawrence River had the lowest POM/TSM ratio (median = 9.0%) which was almost constant throughout the year (range = 8.3–11.5%) while tributaries from the north shore of the LSLE and the Saguenay River exhibited higher medians (41.9 and 32.3%, respectively) and ranges (16.7–56.1% and 10.1–41.1%, respectively). Lower organic matter content in TSM was generally associated with the April–May period while higher values were observed during July and September (Figure 5A). POC/PON molar ratios revealed high variability throughout the year and the Kruskal-Wallis rank test failed to detect significant differences (p = 0.066). Nonetheless, POC/PON molar ratio median values ranged from 9.2 in the St. Lawrence River to 11.1 on the north shore tributaries of the LSLE exemplifying the variation in the quality of the particulate organic matter reaching the estuary among tributaries (Figure 5B). For all tributaries, high POC/PON ratios were seen in the April–May period while low POC/PON ratios were generally recorded between July and September (Figure 5B). Contrary to POC/PON molar ratios, significant differences were detected by the Kruskal-Wallis rank test (p <0.001) for DOC/DON molar ratios reflecting land use and age of OM. DOC/DON ratio median values were lowest for the St. Lawrence River with 20.1 and higher in all other tributaries excepted for the ones of the South-LSLE (Figure 5C). April-May and July–September periods had no clear effects on DOC/DON ratios among tributaries (Figure 5C).
Figure 5 Boxplot of (A) POM/TSM (%), (B) POC/PON (molar), (C) DOC/DON (molar) ratios of the St. Lawrence Estuary tributaries. For each box plot, the median is represented by the bolded line while the 25th and 75th percentile are represented by the bottom and top of the box, respectively. The whiskers represent the minimum and maximum values (1.5 × interquartile range), and outliers are plotted as circles. Orange triangle = mean value from April to May and blue square = mean value from July to September.
Within the SLE, median POM/TSM (%) increased steadily from 7.3% to 50.2% along the upstream–downstream continuum (linear regression against distance from Quebec City, R2 = 0.46, N = 79, p < 0.001), but was highly variable (Figure 6A). Generally, highest POM/TSM (%) values were recorded during August and lowest during May. Median POC/PON ratio decrease in the USLE but remain steady throughout the LSLE (Figure 6B) exhibiting a weak negative linear trend (linear regression against distance from Quebec City, R2 = 0.18, N = 79, p < 0.001). The high variation observed within sectors was not related to time periods, but POC/PON ratios were correlated to particulate inorganic matter (PIM) (R = 0.54, N = 79, p < 0.001) and to DON (R = 0.51, N = 45, p < 0.001). No obvious trends were discernible in the DOC/DON ratios along the upstream-downstream continuum with median ranging from 19.4 to 53.2 (Figure 6C). Generally, the lowest values were found during October whereas a clear maximum was associated to August in some sectors.
Figure 6 Boxplot of (A) POM/TSM (%), (B) POC/PON (molar), (C) DOC/DON (molar) ratios of the surface water of the USLE (white background) and LSLE (grey background). For each box plot, the median is represented by the bolded line while the 25th and 75th percentile are represented by the bottom and top of the box, respectively. The whiskers represent the minimum and maximum values (1.5 × interquartile range). Purple circles = August 2016, turquoise squares = October 2016, yellow diamonds = May 2017.
POM/TSM ratios were lowest in the USLE, exhibited intermediate values in tributaries and were highest in the LSLE (Kruskal-Wallis test followed by Dunn’s tests with Holm’s correction, p < 0.001 for all pairwise comparisons, n = 27–80). POC/PON ratios were not significantly different in tributaries compared to the USLE, but were both higher than values recorded in the LSLE (Kruskal-Wallis test followed by Dunn’s tests with Holm’s correction, p < 0.001 for the two significant pairwise comparisons, n = 25–80). DOC/DON ratios were higher in tributaries than in the LSLE (Kruskal-Wallis test followed by Dunn’s tests with Holm’s correction, p < 0.001 for the significant pairwise comparisons, n = 16–80) with intermediate, but not significantly different, values for the USLE. Seasonality influenced ratios similarly in tributaries and SLE (Figures 5, 6). Overall, tributaries seem to have a moderate influence on the USLE ratios and a weak one on the LSLE ratios.
3.4.2. Conservative/non-conservative mixing of OM within the SLE
Samples collected in the surface layer during the study period covered a large gradient of salinity (2.013–31.297) across 360 km from the USLE to the end of the LSLE near the Gulf of St. Lawrence (Figure S3). TSM in terms of standard deviation peaked in the USLE and reached zero at the entrance of the LSLE (Figure 7A). For the remaining 200 km stretch studied, TSM follows the conservative mixing line for all time periods. For POM, POC and PON, May and October concentrations seem to follow a conservative mixing while some concentrations from August were higher indicating autochthonous production (Figures 7B–D). DOC seems to mix conservatively for May and August time periods (Figure 7E). The inputs from the DOC–rich Saguenay River observed at km 175 were seen at the entrance of the LSLE during May. DON exhibited more variation in May and October (Figure 7F), but concentrations in August had low values, below the conservative line.
Figure 7 Surface water (A) TSM, (B) POM, (C) POC, (D) PON, (E) DOC, and (F) DON (see methods for details). Values from SLR were added to the plot for the corresponding months as the freshwater endmember. One unit represent a standard deviation. Purple circles = August 2016, turquoise squares = October 2016, yellow diamonds = May 2017. USLE = white background and LSLE = gray background. Black line = conservative mixing line.
4. Discussion
4.1. Transport and inventories in the SLE
This study provides a comprehensive view of the transport and inventories of TSM and organic matter for the St. Lawrence Estuary. Recent estimates of the amounts of TSM and OM entering the St. Lawrence Estuary from the St. Lawrence River at Quebec showed values of 5604 Gg/y TSM, 1394 Gg/year DOC, and 59 Gg/y DON (Hudon et al., 2017). Pocklington (1986) estimated total organic carbon coming from the St. Lawrence River at 1980 Gg/y, corresponding to a mean monthly loading of 165 Gg, which falls within our estimation. Pocklington and Tan (1987) also report values for PON and DOC from the SLR that yield mean monthly loadings falling within our estimates. Lucotte et al. (1991) estimated the mean monthly terrigenous input of POC to 25 Gg which also falls within our estimation. On a global perspective, the St. Lawrence River, with an annual discharge of the same magnitude to the Mississippi, exports 60 times less TSM, 2.5 times less POC and 2.3 times less DOC (Degens et al., 1990). Besides, using results from this study and from Hudon et al. (2017), it can be shown that roughly 50% of total nitrogen at Quebec City (269 Gg) is in the organic pool (PON+DON) revealing the importance to consider the OM in eutrophication monitoring programs as proposed by Deininger and Frigstad (2019).
Lebeuf et al. (2019) estimated TSM inventories over the same area of the SLE at 2140 Gg in May 2014, 1280 Gg in August 2016, and 1390 Gg in October 2014. These results compare well with our estimates for the same months, which are respectively 2043 Gg, 1400 Gg (similar data), and 954 Gg. Lebeuf et al. (2019) also confirmed that TSM inventories calculated from Lucotte et al. (1991) were not significantly different than recent inventories. However, when the influence of discharge was taken into consideration, Lebeuf et al. (2019) reported a reduction of 39% of TSM between 1998 and 2016. Few estimates have been made regarding the organic matter of the St. Lawrence Estuary, as most studies focused on the larger and more oceanic Gulf of St. Lawrence (Pocklington, 1986; Savenkoff et al., 1996; Packard et al., 2000). Nonetheless, a few comparisons are possible for similar months of the year assuming no temporal trend. Outputs of the LSLE toward the Gulf have been estimated at 36–43 Gg for POC, which is 3–6 times lower than our estimates, 5.5 Gg of PON, which is 1–4 times lower than our estimates, and 800–1296 Gg for DOC, which is highly similar to our values (Pocklington, 1985). The inputs from the Gulf to the LSLE were previously estimated to 17–39 Gg for POC and 2.5–5.0 Gg for PON, which are both comparable to our estimates, and 638–1279 Gg for DOC, which is 1–4 times superior to our estimate (Pocklington, 1985). Lucotte et al. (1991) estimated the annual inventory of POC in the SLE (sum of USLE inputs from tributaries, macrophyte biomass and primary production) to 1061 Gg, corresponding to a mean monthly value of 88 Gg, which is on the lower range of our values. Considering the wide variability across time and space of TSM and organic matter (Canuel and Hardison, 2016), it remains difficult to disentangle whether data from other studies really differ from ours.
Generally, the SLE tributary loadings increased concomitantly with discharge for all variables with peak values in the spring (April–May), minimum discharge in summer (August–September), and a small increase in fall (October–November) (Figure 2) such as previously suggested by Hudon et al. (2017) and Lebeuf et al. (2019). Such relationships between loads and discharges have been previously found in studies on the SLR (Pocklington and Tan, 1987; Hudon et al., 2017) and in other rivers as hydrological factors are key drivers of the quantity and quality of OM (Esser and Kohlmaier, 1990; Bauer et al., 2013). However, these general discharge-loading relations are far from perfect. For example, relations are stronger for larger tributaries since the relative variability is lower on both concentration and discharge than it is for smaller tributaries (Smith et al., 2003). Also, land use influenced these relationships. In our case, peatland could release more OM via lateral transport (Arsenault et al., 2022) when discharge is weak for South-USLE tributaries and the presence of dams (Ward and Stanford, 1995) near the river mouth of North-LSLE tributaries may explain the poor relationship. Finally, organic carbon tends to be more predictable than organic nitrogen because of its more conservative behaviour. The global increase in tributary loading with discharge translated from tributaries to inventories in the USLE and LSLE, where specific hydrological or biological events, expected to affect organic matter, were targeted for sampling, i.e., the spring freshet in May, the summer low-flow in August, and the fall mixing of the water column upper layer in October.
4.2. Net transport and net export/loading ratio in the USLE and LSLE
Our results support the idea that USLE is a retention zone holding and/or transforming 64–90% of particles emitted by tributaries based on net export/loading ratios. This range of values is in line with Lucotte et al. (1991) who stated that about 75% of terrigenous particulate organic matter introduced in the USLE is deposited or transformed before reaching the Gulf. Around the world, estuaries are known areas of particles deposition sequestering around 90% of particles from rivers (Lisitzin, 1994). According to Lucotte (1989), the USLE is only a temporary retention zone for organic matter that is exported toward the LSLE during fall following primary producers senescence and autumn rainstorms. Our results did not agree with this hypothesis although our sampling may have occurred before the fall export or, alternatively, the OM may be stored during winter and released with the spring freshet and ice drift. The propensity of the USLE to act as a retention zone for particles is hard to evaluate quantitatively because winter and early spring months were not sampled, but the weak net yearly sediment deposition (D’Anglejan, 1990) support this idea. However, winter inventories of OM in the SLE still need to be examined and compared to values from the Gulf (Pocklington, 1985). Dissolved substances were less retained than the particulate fraction in the USLE. From our calculations, 41–49% of DOC and 30–63% of DON are either temporarily accumulated or transformed (i.e., biodegradation, photodegradation, and flocculation) in USLE. These numbers are slightly higher than the global DOC retention by estuaries of 20–40% reported by Lisitzin (1994). Besides, an unknown proportion of the OM is respired in USLE as shown by an increase in dissolved inorganic carbon related to biological activity (Dinauer and Mucci, 2018). The net transport of organic matter in the USLE estimated in the present study, combined with high levels of PIM and low light penetration in the same area (D’Anglejan and Smith, 1973), also favour the notion that the USLE is mostly a heterotrophic environment (i.e., primary production < respiration) as most estuaries in the/or close to the maximum turbidity zone (Canuel and Hardison, 2016), transforming and degrading an important fraction of OM it receives. Knowing whether POM is mineralised and returned to the atmosphere in USLE before reaching the LSLE or mostly export to LSLE, thus potentially contributing to hypoxia urgently need to be assessed.
For the LSLE, the situation was more complex. TSM had a balanced net transport in May (i.e., zero) with a net export/loading ratio showing that only 15% of the particles reach the Gulf. POM, POC, PON, and DON all exhibited negative net transport in May with positive, but moderate, net export/loading ratios, which could be associated with a small autochthonous production or, more likely, unaccounted lateral inputs from diffuse sources and resuspension through upwelled organic matter. In August, the net transport was much more important for POM, POC and PON and their net export/loading ratios substantially higher accounting for a POM production that was 28.8 to 41.4 times the combined inputs of tributaries and Gulf. This may be explained by the high primary production of the LSLE in summer (Levasseur et al., 1984). In October, POM, POC and PON had zero net transport to the Gulf associated with the lower autochthonous production and a positive net transport of DON by important input from the Gulf. DOC exhibits a stronger net transport to the Gulf in May than in October, which may be associated with the release of DOC by macrophytes during late fall and winter senescence (Hudon et al., 2017). Our results on OM, and the decrease in dissolved inorganic carbon related to biological activity (Dinauer and Mucci, 2018), suggest that the LSLE is mostly an autotrophic ecosystem (i.e., primary production > respiration) and behaves more like an outer shelf exporting and producing more organic matter than it receives (Walsh, 1991; Bauer et al., 2013).
Our study shows that the Gulf’s contribution to the dissolved organic matter inventory of the LSLE is always greater than the tributaries’ contribution. This large contribution of the upwelled water was expected since the LSLE is notoriously considered one of the most productive estuaries in the world (Therriault et al., 1990; Simard and Lavoie, 1999), because of the substantial amount of nutrients brought to the surface. Similar magnitudes of ocean contributions have been documented in many estuaries and shelves (Walsh, 1991). In the case of particulates, the relative contribution of the Gulf inputs to inventories, compared to tributaries, was 2–3 fold superior in October, of similar magnitude in August, and lower in May. Those differences could likely be explained by hydrological factors, as the lowest contribution from the Gulf in August may be linked to the lower estuarine ratio (i.e., the outflow of the USLE divided by the net transports) while the reverse situation occurred in fall (Galbraith et al., 2019).
It must be stated that a fair comparison between annual loadings from tributaries and punctual inventories is a challenge in large ecosystems such as the St. Lawrence Estuary. A reason for that includes the time lag associated to the water flowing throughout the system (Lebeuf et al., 2019), stretching the assumption that each box (i.e., USLE an LSLE) is uniformly mixed (Shen et al., 2022). Additionally, our study focuses on transport whereas autochthonous processes were not directly measured i.e., bottom sedimentation, production, respiration (C) and denitrification (N). Moreover, diffuse inputs from the coast and groundwater discharges remain unaccounted for and notoriously difficult to measure (Couturier et al., 2016; Ward et al., 2017).
4.3. Upstream–downstream changes in organic matter
Organic matter is rapidly transformed along the salinity continuum as a succession of changing conditions favour a combination of biotic and abiotic processes including microbial respiration, photooxidation, flocculation or fragmentation, and sedimentation (McCallister et al., 2006; Bauer et al., 2013). In the SLE, these changes were observed through the steady increase along the upstream–downstream gradient of POM/TSM from 7.2% to more 50.3% (Figure 6A), which is similar to the 5 to 40% increase reported 50 years ago (D’Anglejan and Smith, 1973). Furthermore, a decrease of the POC/PON ratios (Figure 6B) could be associated with a decrease in terrigenous OM composition (Gearing and Pocklington, 1990). Indeed, C/N ratios from organic matter of soil in biomes for the SLE was ≈21 in cool conifer forest and ≈ 23 in northern mixed forests (Aitkenhead and McDowell, 2000) compared to ≈7 in the LSLE. The general increase in the OM content of TSM exemplifies the transition from estuarine properties of the USLE to more an oceanographic system in the LSLE. This is supported by the strong correlation of 0.76 between POC and chlorophyll-a found by Painchaud and Therriault (1989). This trend was also captured in the composition of OM of two sediment traps at a depth of 150 m along the upstream-downstream continuum of the LSLE (Colombo et al., 1996a). The significant decrease of POC/PON from upstream to downstream in surface water is also indicative of the mixing of terrestrial matter from land to OM dominated by phytoplankton in ocean. Increases in (DOC + POC)/(DON + PON) have been associated with a decrease in lability of the organic matter through the preferential remineralization of N relative to C by bacteria in tropical rivers and estuaries (Amon and Benner, 1996), sub–tropical rivers (Sun et al., 1997), and coastal systems covering a wide range of latitudes and contrasting continental influences (Lønborg and Álvarez-Salgado, 2012). For LSLE changes in lability were more evident from a seasonal perspective as reflected by the lower POC/PON during summer compared to freshet.
The dissolved OM pool is considered more recalcitrant than the POM pool (Benner, 2002; Hama et al., 2004) which is supported by the steady DOC/DON ratios throughout the upstream–downstream continuum (Figure 6C) associated with a more conservative behaviour. Although these processes are difficult to detect with bulk measurements (Mantoura and Woodward, 1983), production and degradation of DOC and DON have been reported (Uher et al., 2001; Asmala et al., 2014). Even if only a fraction of DOC is produced or consumed, it could represent an important amount as its inventory is generally an order of magnitude higher than POC (Bauer et al., 2013). Another possibility stems from the rapid cycling of labile DOC (i.e., near zero net production and degradation), which would still have an important impact on deoxygenation and acidification through stoichiometry (Bauer et al., 2013). Our results for the SLE confirm that the particulate fraction is generally more labile than the dissolved fractions (Benner and Amon, 2015).
4.4. Changes in organic matter concentrations with depth
The fate of the OM exported to the depths of the LSLE is still debated as it is unclear where most of remineralisation occurs. Some hypothesize that OM is respired and returned to the surface layer to support the increase in nutrients within the estuary (Coote and Yeats, 1979) via measurements of OM (Gearing and Pocklington, 1990), sediment traps and cores (Colombo et al., 1996b), and through modelisation (Bourgault et al., 2012). Others support the hypothesis of a high consumption and burying rate in sediments via measurements of OM in the water column (Savenkoff et al., 1996), stable isotope ratios of dissolved oxygen (Lehmann et al., 2009), and modelisation (Benoit et al., 2006). Our measurements of TSM and organic matter show a significant decrease of POC and PON between the intermediate and deep layer, followed by an increase near the bottom. These results could suggest a benthic-pelagic coupling, where resuspension events, especially at the head of the Laurentian channel, would favour recycling as evoked by amino acid L- and D-enantiomer measurements (Hébert and Tremblay, 2017) but this scenario needs to be further examined.
5. Conclusion
Understanding the organic matter cycle in estuaries is of utmost importance considering their transitional nature between land and sea (Blair and Aller, 2012), their potential contribution to hypoxia (Rabalais et al., 2014), and acidification (Wallace et al., 2014; Cai et al., 2021) in the context of climate change (Canuel et al., 2012). As a starting point toward this goal, this study provides a detailed view of the transport and inventory size of TSM and organic matter over a two-year period in the St. Lawrence Estuary, one of the largest estuary in the world. Our results showed that the pool of organic and inorganic nitrogen transported by SLR could be of similar magnitude, but the former is rarely explicitly considered in eutrophication monitoring programs, urging its inclusion to obtain a more accurate view on the problem. As expected, the St. Lawrence River had the foremost contribution among tributaries. Surprisingly, tributaries were not always the prime contributor of TSM and OM to the SLE, instead, the Gulf brought more matter during fall and summer. The particulate organic matter was more labile than DOC and DON, exhibiting evident changes along the upstream–downstream salinity continuum. The USLE exhibited rapid changes in concentrations and ratios of OM while transporting matter toward LSLE, which is more influenced by water from the Gulf of St. Lawrence and seemed to support more autochthonous processes. These contrasting differences between both areas of the SLE are of importance in our understanding of hypoxia and acidification of the deep water of the LSLE. From a land to ocean perspective, knowing the proportion of OM transformed or respired in the USLE compared to the proportion that is exported toward LSLE, will ultimately determine the contribution of tributaries to LSLE hypoxia and acidification problems and whether regulating on OM discharge should be considered. From the ocean to land angle, the strong contribution of inputs from the Gulf, even for POM, points toward the importance of OM remineralisation, both in the water column and sediments. Indeed, this process is affected by climate change, as bacterial metabolism increased in warmer water, both from the direct temperature increased and the composition changes in the water entering the Gulf of St. Lawrence. Hence, the links among eutrophication, hypoxia, acidification in a changing climate should be better understood in order to identify efficient mitigation measures in the SLE and many other coastal ecosystems.
Data availability statement
The raw data supporting the conclusions of this article will be made available by the authors, without undue reservation.
Author contributions
ML and MS developed the study’s concept. ML, MS, and DM contributed to data acquisition. DL and ML contributed substantially to the data analysis. DL created all figures and drafted the manuscript. ML, MS, CA, and DM critically reviewed the manuscript. All authors contributed to the article and approved the submitted version.
Funding
This research was supported by DFO through the Strategic Program for Ecosystem Research and Advice (SPERA). This work is part of the St. Lawrence Action Plan (SLAP).
Acknowledgments
The authors would like to thank the captains and crews of the CCGS Creed and Hudson. The support of many collaborators and their teams to sample rivers, mainly Serge Hébert (MELCC), Nadia Ménard (Park Canada), and Christiane Hudon (Environment and Climate Change Canada). We acknowledge the support of DAISS, specifically François Villeneuve and is team for CTD deployments and nutrients analyses. We acknowledge the help of Jean-Martin Chamberland that provides us some helpful R codes. Special thanks to Sylvie St-Pierre and Héléna Talbot for their work in the laboratory and in the preparation of the field work.
Conflict of interest
The authors declare that the research was conducted in the absence of any commercial or financial relationships that could be construed as a potential conflict of interest.
Publisher’s note
All claims expressed in this article are solely those of the authors and do not necessarily represent those of their affiliated organizations, or those of the publisher, the editors and the reviewers. Any product that may be evaluated in this article, or claim that may be made by its manufacturer, is not guaranteed or endorsed by the publisher.
Supplementary material
The Supplementary Material for this article can be found online at: https://www.frontiersin.org/articles/10.3389/fmars.2022.1055384/full#supplementary-material
References
Aitkenhead J. A., McDowell W. H. (2000). Soil c: N ratio as a predictor of annual riverine DOC flux at local and global scales. Glob. Biogeochem. Cycles 14 (1), 127–138. doi: 10.1029/1999GB900083
Altieri A. H., Gedan K. B. (2015). Climate change and dead zones. Global Change Biol. 21, 1395–1406. doi: 10.1111/gcb.12754
Amon R. M. W., Benner R. (1996). Bacterial utilization of different size classes of dissolved organic matter. Limnol. Oceanogr. 41, 41–51. doi: 10.4319/lo.1996.41.1.004
Andersen J. H., Schlüter L., Ærtebjerg G. (2006). Coastal eutrophication: recent developments in definitions and implications for monitoring strategies. J. Plankton Res. 28, 621–628. doi: 10.1093/plankt/fbl001
Arsenault J., Talbot J., Brown L. E., Holden J., Martinez-Cruz K., Sepulveda-Jauregui A., et al. (2022). Biogeochemical distinctiveness of peatland ponds, thermokarst waterbodies, and lakes. Geophys. Res. Lett. 49 (11), e2021GL097492. doi: 10.1029/2021GL097492
Asmala E., Bowers D. G., Autio R., Kaartokallio H., Thomas D. N. (2014). Qualitative changes of riverine dissolved organic matter at low salinities due to flocculation. J. Geophys. Res. Biogeosci. 119, 1919–1933. doi: 10.1002/2014JG002722
Bauer J., Cai W. J., Raymond P., Bianchi T. S., Hopkinson C. S., Regnier P. A. G. (2013). The changing carbon cycle of the coastal ocean. Nature 504, 61–70. doi: 10.1038/nature12857
Benner R., Amon R. M. W. (2015). The size-reactivity continuum of major bioelements in the ocean. Annu. Rev. Mar. Sci. 7, 185–205. doi: 10.1146/annurev-marine-010213-135126
Benner R. (2002). “Chemical composition and reactivity,” in Biogeochemistry of marine dissolved organic matter. Eds. Hansell D. A., Carlson C. A. (San Diego, CA: Academic Press), 59–90. doi: 10.1016/B978-012323841-2/50005-1
Benoit P., Gratton Y., Mucci A. (2006). Modeling of dissolved oxygen levels in the bottom waters of the lower st. Lawrence estuary: Coupling of benthic and pelagic processes. Mar. Chem. 102, 13–32. doi: 10.1016/j.marchem.2005.09.015
Berggren M., Guillemette F., Bieroza M., Buffam I., Deininger A., Hawkes J. A., et al. (2022). Unified understanding of intrinsic and extrinsic controls of dissolved organic carbon reactivity in aquatic ecosystems. Ecol 103 (9), e3763. doi: 10.1002/ecy.3763
Bewers J. M., Yeats P. A. (1979). The behaviour of trace metals in estuaries of the st. Lawrence basin. Nat. Can. 106, 149–161.
Bianchi T. S. (2011). The role of terrestrially derived organic carbon in the coastal ocean: A changing paradigm and the priming effect. PNAS 108, (49) 19473–19481. doi: 10.1073/pnas.1017982108
Bianchi T. S., Canuel E. A. (2011). Chemical biomarkers in aquatic ecosystems (New Jersey, NJ: Princeton University Press).
Blair N. E., Aller R. C. (2012). The fate of terrestrial organic carbon in the marine environment. Annu. Rev. Mar. Sci. 24, 401–423. doi: 10.1146/annurev-marine-120709-142717
Bourgault D., Cyr F., Galbraith P. S., Pelletier E. (2012). Relative importance of pelagic and sediment respiration in causing hypoxia in a deep estuary. J. Geophys. Res. 117, C08033. doi: 10.1029/2012JC007902
Breitburg D., Levin L. A., Oschlies A., Grégoire M., Chavez F. P., Conley D. J., et al. (2018). Declining oxygen in the global ocean and coastal waters. Science 359, eaam7240. doi: 10.1126/science.aam7240
Cai W. J. (2011). Estuarine and coastal ocean carbon paradox: CO2 sinks or sites of terrestrial carbon incineration? Ann. Rev. Mar. Sci. 3, 123–145. doi: 10.1146/annurev-marine-120709-142723
Cai W.-J., Feely R. A., Testa J. M., Li M., Evans W., Alin S. R., et al. (2021). Natural and anthropogenic drivers of acidification in large estuaries. Annu. Rev.Mar. Sci. 13, 23–55. doi: 10.1146/annurev-marine-010419-011004
Canuel E. A., Cammer S. S., McIntosh H. A., Pondell C. R. (2012). Climate change impacts on the organic carbon cycle at the land-ocean interface. Annu. Rev. Earth Planet. Sci. 40, 685–711. doi: 10.1146/annurev-earth-042711-105511
Canuel E. A., Hardison A. K. (2016). Sources, ages, and alteration of organic matter in estuaries. Ann. Rev. Mar. Sci. 8, 409–434. doi: 10.1146/annurev-marine-122414-034058
Claret M., Galbraith E. D., Palter J. B., Bianchi D., Fennel K., Gilbert D., et al. (2018). Rapid coastal deoxygenation due to ocean circulation shift in the northwest Atlantic. Nat. Clim. Change 8, 868–872. doi: 10.1038/s41558-018-0263-1
Colombo J. C., Silverberg N., Gearing J. N. (1996a). Biogeochemistry of organic matter in the laurentian trough, i. composition and vertical fluxes of rapidly settling particles. Mar. Chem. 51, 277–293. doi: 10.1016/0304–4203(95)00059-3
Colombo J. C., Silverberg N., Gearing J. N. (1996b). Biogeochemistry of organic matter in the laurentian trough, II. bulk composition of the sediments and relative reactivity of major components during early diagenesis. Mar. Chem. 51, 295–314. doi: 10.1016/0304-4203(95)00060-7
Coote A. R., Yeats P. A. (1979). Distribution of nutrients in the gulf of st. Lawrence. J. Fish. Res. Board Can. 36, 122–131. doi: 10.1139/f79-021
Couturier M., Nozais C., Chaillou G. (2016). Microtidal subterranean estuaries as a source of fresh terrestrial dissolved organic matter to the coastal ocean. Mar. Chem. 186, 46–57. doi: 10.1016/j.marchem.2016.08.001
D’Anglejan B. F. (1990). “Recent sediments and sediment transport processes in the st. Lawrence estuary,” in Oceanography of a large-scale estuarine system: The st. Lawrence. Eds. El-Sabh M. I., Silverberg N. (New-York, NY: Springer-Verlag), 109–129. doi: 10.1007/978-1-4615-7534-4_6
D’Anglejan B. F., Smith E. C. (1973). Distribution, transport, and composition of suspended matter in the st. Lawrence estuary. Can. J. Earth Sci. 10, 1380–1396. doi: 10.1139/e73-128
Degens E. T., Kempe S., Richey J. E. (1990). “Summary: biogeochemistry of major world rivers,” in Biogeochemistry of major world rivers, SCOPE report 42. Eds. Degens E. T., Kempe S., Richey J. E. (New York, NY: John Wiley and Sons), 323–348.
Deininger A., Frigstad H. (2019). Reevaluating the role of organic matter sources for coastal eutrophication, oligotrophication, and ecosystem health. Front. Mar. Sci. 6. doi: 10.3389/fmars.2019.00210
Dinauer A., Mucci A. (2018). Distinguishing between physical and biological controls on the spatial variability of pCO2: a novel approach using OMP water mass analysis (St. Lawrence, Canada). Mar. Chem. 204, 107–120. doi: 10.1016/j.marchem.2018.03.007
Ducklow H. W., Steinberg D. K., Buesseler K. O. (2001). Upper ocean carbon export and the biological pump. Oceanog 14 (4), 50–58. doi: 10.5670/oceanog.2001.06
Dutil J., Proulx S., Galbraith P. S., Chassé J., Lambert N., Laurian C. (2012). Coastal and epipelagic habitats of the estuary and gulf of st. Lawrence. Can. Tech. Rep. Fish. Aquat. Sci. 3009, 87.
El-Sabh M. I., Silverberg N. (1990). “The st. Lawrence estuary: Introduction,” in Oceanography of a large-scale estuarine system: The st. Lawrence. Eds. El-Sabh M. I., Silverberg N. (New-York, NY: Springer-Verlag), 1–9. doi: 10.1029/CE039
Environment Canada (2014). Manuel Des méthodes d’analyses (annexe b) (Montreal, Canada: Scientific and Technical Services Section, St. Lawrence Centre, Environment Canada).
Esser G., Kohlmaier G. H. (1990). “Modelling terrestrial sources of nitrogen, phosphorus, sulphur and organic carbon to rivers,” in Biogeochemistry of major world rivers, SCOPE report 42. Eds. Degens E. T., Kempe S., Richey J. E. (New York, NY: John Wiley and Sons), 297–322.
Feely R. A., Alin S. R., Newton J., Sabine C. L., Warner M., Devol A., et al. (2010). The combined effects of ocean acidification, mixing, and respiration on pH and carbonate saturation in an urbanized estuary. Estuar. Coast. Shelf Sci. 88, 442–449. doi: 10.1016/j.ecss.2010.05.004
Fichot C. G., Benner R. (2014). The fate of terrigenous dissolved organic carbon in a river-influenced ocean margin. Glob. Biogeochem. Cycles 28 (3), 300–318. doi: 10.1002/2013GB004670
Galbraith P. S. (2006). Winter water masses in the gulf of st. Lawrence. J. Geophys. Res. 111, C06022. doi: 10.1029/2005JC003159
Galbraith P. S., Chassé J., Caverhill C., Nicot P., Gilbert D., Lefaivre D., et al. (2019). Physical oceanographic conditions in the gulf of st. Lawrence during 2018. Can. Sci. Advis. Sec. Res. Doc. 79.
Gearing J. N., Pocklington R. (1990). “Organic geochemical studies in the st. Lawrence estuary,” in Oceanography of a large-scale estuarine system: The st. Lawrence. Eds. El-Sabh M. I., Silverberg N. (New-York, NY: Springer-Verlag), 170–201. doi: 10.1029/CE039
Gilbert D., Rabalais N., Diaz R., Zhang J. (2010). Evidence for greater oxygen decline rates in the coastal ocean than in the open ocean. Biogeosciences 7, 2283–2296. doi: 10.5194/bg-7-2283-2010
Gilbert D., Sundby B., Gobeil C., Mucci A., Tremblay G. H. (2005). A seventy-two-year record of diminishing deep-water oxygen in the st. Lawrence estuary: The Northwest Atlantic connection. Limnol. Oceanogr. 50 (5), 1654–1666. doi: 10.4319/lo.2005.50.5.1654
Hama T., Yanagi K., Hama J. (2004). Decrease in molecular weight of photosynthetic products of marine phytoplankton during early diagenesis. Limnol. Oceanogr. 49, 471–481. doi: 10.4319/lo.2004.49.2.0471
Hébert M., Tremblay L. (2017). Production and persistence of bacterial and labile organic matter at the hypoxic water-sediment interface of the st. Lawrence estuary: persistence of OM in hypoxic deep waters. Limnol. Oceanogr. 62, (5) 2154–2167. doi: 10.1002/lno.10556
Hedges J. I. (2002). “Why dissolved organic matter?,” in Biogeochemistry of marine dissolved organic matter. Eds. Hansell D. A., Carlson C. A. (San Diego, CA: Academic Press), 1–33.
Hudon C., Gagnon P., Rondeau M., Hébert S., Gilbert D., Hill B., et al. (2017). Hydrological and biological processes modulate carbon, nitrogen and phosphorus flux from the st. Lawrence river to its estuary (Quebec, Canada). Biogeochemistry 135, (3) 251–276. doi: 10.1007/s10533-017-0371-4
Hughes I. G., Hase T. P. A. (2010). Measurements and their uncertainties: a practical guide to modern error analysis (New York, NY: Oxford University Press Inc).
Jutras M., Dufour C. O., Mucci A., Cyr F., Gilbert D. (2020). Temporal changes in the causes of the observed oxygen decline in the st. Lawrence estuary. Geophys. Res. Oceans 125 (12), e2020JC016577. doi: 10.1029/2020JC016577
Lambert N., Chassé J., Perrie W., Long Z., Guo L., Morrison J. (2013). Projection of future river runoffs in Eastern Atlantic Canada from global and regional climate models. Can. Tech. Rep. Hydrogr. Ocean Sci. 288, 34.
Lavoie D., Lambert N., Starr M., Chassé J., Riche O., Le Clainche Y., et al. (2021). The gulf of st. Lawrence biogeochemical model: A modelling tool for fisheries and ocean management. Front. Mar. Sci. 8. doi: 10.3389/fmars.2021.732269
Lebeuf M., Maltais D., Larouche P., Lavoie D., Lefaivre D., Starr M., et al. (2019). Recent distribution, inventories and temporal trends of suspended particulate matter in the st. Lawrence estuary, Canada. Reg. Stud. Mar. Sci. 29, 100664. doi: 10.1016/j.rsma.2019.100664
Lehmann M. F., Barnett B., Gelinas Y., Gilbert D., Maranger R. J., Mucci A., et al. (2009). Aerobic respiration and hypoxia in the lower st. Lawrence estuary: stable isotope ratios of dissolved oxygen constrain oxygen sink partitioning. Limnol. Oceanogr. 54, 2157–2169. doi: 10.4319/lo.2009.54.6.2157
Levasseur M., Therriault J. C., Legendre L. (1984). Hierarchical control of phytoplankton succession by physical factors. Mar. Ecol. Prog. Ser. 19, 211–222. doi: 10.3354/meps019211
Lucotte M. (1989). Phosphorus reservoirs in the st. Lawrence upper estuary. Can. J. Fish. Aquat. Sci. 46, 59–65. doi: 10.1139/f89-009
Lucotte M., Hillaire-Marcel ,. C., Louchouarn P. (1991). First-order organic budget in the st. Lawrence lower estuary from 13C data. Estuar. Coast. Shelf Sci. 32, 297–312. doi: 10.1016/0272–7714(91)90022-4
Malone T. C., Newton A. (2020). The globalization of cultural eutrophication in the coastal ocean: Causes and consequences. Front. Mar. Sci. 7. doi: 10.3389/fmars.2020.00670
Mantoura R. F. C., Woodward E. M. S. (1983). Conservative behaviour of riverine dissolved organic carbon in the Severn estuary: chemical and geochemical implications. Geochim. Cosmochim. Acta 47, 1293–1309. doi: 10.1016/0016-7037(83)90069-8
Massicotte P., Asmala E., Stedmon C., Markager S. (2017). Global distribution of dissolved organic matter along the aquatic continuum: across rivers, lakes and oceans. Sci. Total Environ. 609, 180–191. doi: 10.1016/j.scitotenv.2017.07.076
McCallister S. L., Bauer J. E., Ducklow H. W., Canuel E. A. (2006). Sources of estuarine dissolved and particulate organic matter: a multi-tracer approach. Org. Geochem. 37 (4), 454–468. doi: 10.1016/j.orggeochem.2005.12.005
MELCC (2020). Méthodes d’analyses du centre d’expertise en analyse environnementale du québec. ministère de l’Environnement et de la lutte contre les changements climatiques (MELCC) (QC, Cananda: Gouvernement du Québec). Available at: https://www.ceaeq.gouv.qc.ca/methodes/methode_para.htm.
Meybeck M. (1982). Carbon, nitrogen, and phosphorus transport by world rivers. Am. J. Sci. 282, 401–450. doi: 10.2475/ajs.282.4.401
Mori C., Santos I. R., Brumsack H., Schnetger B., Dittmar T., Seidel M. (2019). Non-conservative behaviour of dissolved organic matter and trace metals (Mn, fe, ba) driven by porewater exchange in a subtropical mangrove-estuary. Front. Mar. Sci. 6. doi: 10.3389/fmars.2019.00481
Mucci A., Starr M., Gilbert D., Sundby B. (2011). Acidification of lower st. Lawrence estuary bottom waters. Atmos. Ocean 49 (3), 206–218. doi: 10.1080/07055900.2011.599265
Nixon S. W. (2009). Eutrophication and the macroscope. Hydrobiol 629, 5–19. doi: 10.1007/978-90-481-3385-7_2
Nixon S. W., Ammerman J. W., Atkinson L. P., Berounsky V. M., Billen G., Boicourt W. C., et al. (1996). The fate of nitrogen and phosphorus at the land-sea margin of the north Atlantic ocean. Biogeochemistry 35, 141–180. doi: 10.1007/BF02179826
Ogle D. H., Doll J. C., Wheeler P., Dinno. A. (2022) FSA: Fisheries stock analysis. r package version 0.9.3. Available at: https://github.com/fishR-Core-Team/FSA.
Packard T., Chen W., Blasco D., Savenkoff C., Vézina A. F., Tian R., et al. (2000). Dissolved organic carbon in the gulf of st. Lawrence. Deep Sea Res. Pt II 47, 435–459. doi: 10.1016/S0967-0645(99)00114-9
Painchaud J., Therriault J. C. (1989). Relationships between bacteria, phytoplankton and particulate organic carbon in the upper st. Lawrence estuary. Mar. Ecol.-Prog. Ser. 56 (3), 301–311. doi: 10.3354/meps056301
Pocklington R. (1985). Organic matter in the gulf of st. Lawrence in winter. Can. J. Fish. Aquat. Sci. 42, 1556–1561. doi: 10.1139/f85-195
Pocklington R. (1986). The gulf of st. Lawrence and the Baltic Sea: two different organic systems. Dt. Hydrogr. Z. 39, 66–75. doi: 10.1007/BF02302927
Pocklington R., Tan F. C. (1987). Seasonal and annual variations in the organic matter contributed by the st. Lawrence river to the gulf of st. Lawrence. Geochim. Cosmochim. Acta 51, 2579–2586. doi: 10.1016/0016–7037(87)90308-5
Rabalais N. N., Cai W.-J., Carstensen J., Conley D. J., Fry B., Hu X., et al. (2014). Eutrophication-driven deoxygenation in the coastal ocean. Oceanography 27 (1), 172–183. doi: 10.5670/oceanog.2014.21
Raymond P. A., Saiers J. E., Sobczak W. V. (2016). Hydrological and biogeochemical controls on watershed dissolved organic matter transport: pulse-shunt concept. Ecology 97, 5–16. doi: 10.1890/14-1684.1
R Core Team (2022). R: A language and environment for statistical computing (Vienna, Austria: R Foundation for Statistical Computing). Available at: https://www.R-project.org/.
Revenga C., Murray S., Abramovitz J., Hammond A. (1998). Watersheds of the world: ecological value and vulnerability (Washington, D.C: World Resources Institute and Worldwatch Institute).
Rondeau B., Cossa D., Gagnon P., Bilodeau L. (2000). Budget and sources of suspended sediments transported in the st. Lawrence river, Canada. Hydrol. Proc. 1, 21–36. doi: 10.1002/(SICI)1099-1085(200001)14:1<21::AID-HYP907>3.0.CO;2-7
Saucier F. J., Chassé J. (2000). Tidal circulation and buoyancy effects in the st. Lawrence estuary. Atmos. Ocean. 38 (4), 505–556. doi: 10.1080/07055900.2000.9649658
Savenkoff C., Vezina A. F., Packard T. T., Silverberg N., Therriault J. C., Chen W., et al. (1996). Distributions of oxygen, carbon, and respiratory activity in the deep layer of the gulf of st. Lawrence and their implications for the carbon cycle. Can. J. Fish. Aquat. Sci. 53, 2451–2465. doi: 10.1139/f96-198
Seidel M., Beck M., Greskowiak J., Riedel T., Waska H., Suryaputra I. N. A., et al. (2015). Benthic-pelagic coupling of nutrients and dissolved organic matter composition in an intertidal sandy beach. Mar. Chem. 176, 150–163. doi: 10.1016/j.marchem.2015.08.011
Seidel M., Manecki M., Herlemann D. P. R., Deutsch B., Schulz-Bull D., Jürgens K., et al. (2017). Composition and transformation of dissolved organic matter in the Baltic Sea. Front. Earth Sci. 5. doi: 10.3389/feart.2017.00031
Shen J., Du J., Lucas L. V. (2022). Simple relationships between residence time and annual nutrient retention, export, and loading for estuaries. Limnol. Oceanogr. 67 (4), 918–933. doi: 10.1002/lno.12045
Simard Y., Lavoie D. (1999). The rich krill aggregation of the saguenay - st. Lawrence marine park: hydroacoustic and geostatistical biomass estimates, structure, variability, and significance for whales. Can. J. Fish. Aquat. Sci. 56, 1182–1197. doi: 10.1139/f99-063
Smith S. V., Mackenzie F. T. (1987). The ocean as a net heterotrophic system: implications from the carbon biogeochemical cycle. Global Biogeochem. Cycles 1, 187–198. doi: 10.1029/GB001i003p00187
Smith S. V., Swaney D. P., Talaue-Mcmanus L., Bartley J. D., Sandhei P. T., McLaughlin C. J., et al. (2003). Humans, hydrology, and the distribution of inorganic nutrient loading to the ocean. BioScience 53, 235–245. doi: 10.1641/0006-3568(2003)053[0235:HHATDO]2.0.CO;2
Smith V. H., Tilman G. D., Nekola J. C. (1999). Eutrophication: impacts of excess nutrient inputs on freshwater, marine, and terrestrial ecosystems. Environ. pollut. 100, 179–196. doi: 10.1016/S0269-7491(99)00091-3
Sun L., Perdue E. M., Meyer J. L., Weis J. (1997). Use of elemental composition to predict bioavailability of dissolved organic matter in a Georgia river. Limnol. Oceanogr. 42, 714–721. doi: 10.4319/lo.1997.42.4.0714
Tan F. C. (1987). “Discharge and carbon isotope composition of particulate organic carbon from the St Lawrence River, Canada. Transport of Carbon and Minerals in Major World Rivers, SCOPE Rep, Eds. Degens E. T., Kempe S., Gan W.. (Hamburg, Germany) 64, 301–310.
Therriault J.-C., Legendre L., Demers S. (1990). “Oceanography and ecology of phytoplankton in the st. Lawrence estuary,” in Oceanography of a large–scale estuarine system, the st. Lawrence. Eds. El–Sabh M. I., Silververg N. S. (New York, NY: Springer-Verlag), 269–290.
Thorp J. H., Lamberti G. A., Casper A. F. (2005). “St. Lawrence river basin,” in Rivers of north America. Eds. Benke A. C., Cushing C. E. (Burlington, Canada: Elsevier), 982–1028.
Uher G., Hughes C., Henry G., Upstill-Goddard ,. R. C. (2001). Non-conservative mixing behaviour of colored dissolved organic matter in a humic-rich, turbid estuary. Geophys. Res. Lett. 28, 3309–3312. doi: 10.1029/2000GL012509
Wallace R. B., Baumann H., Grear J. S., Aller R. C., Gobler C. J. (2014). Coastal ocean acidification: the other eutrophication problem. Estuar. Coast. Shelf Sci. 148, 1–13. doi: 10.1016/j.ecss.2014.05.027
Walsh J. J. (1991). Importance of continental margins in the marine biogeochemical cycling of carbon and nitrogen. Nature 350, 53–55. doi: 10.1038/350053a0
Ward N. D., Bianchi T. S., Medeiros P. M., Seidel M., Richey J. E., Keil R. G., et al. (2017). Where carbon goes when water flows: Carbon cycling across the aquatic continuum. Front. Mar. Sci. 4. doi: 10.3389/fmars.2017.00007
Ward J. V., Stanford J. A. (1995). The serial discontinuity concept: extending the model to floodplain rivers. Regul. Rivers Res. Manage. 10, 159–168. doi: 10.1002/rrr.3450100211
Keywords: organic matter, St. Lawrence estuary, riverine loads, inventories, carbon, nitrogen
Citation: Lévesque D, Lebeuf M, Maltais D, Anderson C and Starr M (2023) Transport inventories and exchanges of organic matter throughout the St. Lawrence Estuary continuum (Canada). Front. Mar. Sci. 9:1055384. doi: 10.3389/fmars.2022.1055384
Received: 27 September 2022; Accepted: 07 December 2022;
Published: 09 January 2023.
Edited by:
David C. Podgorski, University of New Orleans, United StatesReviewed by:
Richard LaBrie, Technical University Bergakademie Freiberg, GermanyPeng Lin, Texas A&M University at Galveston, United States
Copyright © 2023 Lévesque, Lebeuf, Maltais, Anderson and Starr. This is an open-access article distributed under the terms of the Creative Commons Attribution License (CC BY). The use, distribution or reproduction in other forums is permitted, provided the original author(s) and the copyright owner(s) are credited and that the original publication in this journal is cited, in accordance with accepted academic practice. No use, distribution or reproduction is permitted which does not comply with these terms.
*Correspondence: David Lévesque, RGF2aWQuTGV2ZXNxdWVAZGZvLW1wby5nYy5jYQ==