 Soyeon Kwon1,2
 Inhee Lee1
 Keyhong Park3
 Kyoung-Ho Cho3
 Jinyoung Jung3
 Taewook Park3
 Youngju Lee3
 Chanhyung Jeon1,4
 Seongbong Seo5
 Doshik Hahm1,4*
- 1Department of Oceanography, Pusan National University, Busan, South Korea
- 2Marine Environmental Research Center, Korea Institute of Ocean Science and Technology, Busan, South Korea
- 3Division of Ocean Sciences, Korea Polar Research Institute, Incheon, South Korea
- 4Marine Research Institute, Pusan National University, Busan, South Korea
- 5South Sea Fisheries Research Institute, National Institute of Fisheries Science, Yeosu, South Korea
The Arctic Ocean environment is drastically changing because of global warming. Although warming-induced processes, such as the decrease in sea-ice extent and freshening of the surface layer, have the potential to alter primary production, the changes that will likely occur in their production and their mechanisms are still poorly understood. To assess the potential changes in net community production, which is a measure of biological carbon pump, in response to climate change, we observed the O2/Ar at the surface of the northern Chukchi Sea in the summers of 2017 and 2020. The net community production (NCP) estimates that we derived from O2/Ar measurements were largely in the range of 1 – 11 mmol O2 m-2 d-1 in the northern Chukchi and Beaufort Seas, close to the lower bounds of the values in the global oceans. The average NCP of 1.5 ± 1.7 mmol O2 m-2 d-1 in 2020 was substantially lower than 7.1 ± 7.4 mmol O2 m-2 d-1 in 2017, with the most pronounced decrease occurring in the ice-free region of the northern Chukchi Sea; the NCP of the ice-free region in 2020 was only 12% of that in 2017. The decrease in NCP in 2020 was accompanied by a lower salinity of > 2, which resulted in shallower mixed layer depths and stronger stratification. We speculated that the anomalously low pressure near the east Russian coast and the lack of strong winds contributed to the strong stratification in 2020. With a continuing decrease in the extent of sea ice, the northern Chukchi Sea will likely experience earlier phytoplankton blooms and nitrate exhaustion. Unless winds blow strong enough to break the stratification, the biological pump in late summer is likely to remain weak.
1 Introduction
In the Arctic, the increase in sea surface temperature (SST) (Steele et al., 2008) and the decreases in sea ice thickness and extent have accelerated (Stroeve and Notz, 2018; Parkinson and DiGirolamo, 2021). Two schools of thought regarding the likely alteration in primary production due to the environmental changes in the Arctic Ocean have been expressed. The first school suggests that, as sea ice thins and melts away in summer, more light penetrates the surface layers and promotes photosynthesis. Additionally, it is argued that winds enhance the nutrients supplied to the surface layer through vertical mixing under ice-free conditions. This suggests that the primary production in the Arctic will increase in the future (Arrigo and van Dijken, 2011; Ardyna and Arrigo, 2020). In contrast, the second school suggests that reinforced stratification by sea ice melting limits the nutrient supply to the sea surface and results in a decrease in the primary production (McLaughlin and Carmack, 2010; Coupel et al., 2015; Yun et al., 2016).
Contradictory views on the changes that will be likely in primary production hinder predictions of changes in the biological pump in the Arctic. The Arctic absorbs 166 – 180 Tg C yr-1 of atmospheric CO2 (MacGilchrist et al., 2014; Yasunaka et al., 2018), corresponding to 12% – 13% of the global net absorption by the ocean (Takahashi et al., 2009), and much of the Arctic absorption is driven by a biological pump of 102 ± 26 Tg C yr-1 (MacGilchrist et al., 2014). According to a recent estimate of the primary production of 310 – 390 Tg C yr-1 (Ardyna and Arrigo, 2020), the biological pump in the Arctic transports approximately 30% of the fixed carbon to the subsurface layers. The biological pump, often measured by the rates of new, export, or net community production (Falkowski et al., 2003), is strongly affected by changes in primary production and the environment.
Nitrate, together with light, may be the limiting factors on the primary production in the Arctic Ocean (Tremblay et al., 2015; Randelhoff et al., 2020). Although some other nitrogen sources, such as urea, amino acids (Varela et al., 2013; Baer et al., 2017), and nitrogen fixation (Harding et al., 2018; Shiozaki et al., 2018), may be locally important in shelf regions, nitrate appears to be the dominant and limiting nutrient at the regional scale (Tremblay et al., 2015; Randelhoff et al., 2020). Randelhoff et al. (2020) reported nitrate fluxes estimated from in situ turbulence measurements and argued that vertical turbulent nitrate flux is an accurate predictor of the magnitudes of new production (NP) on an annual scale in the Arctic. The NP is defined as the production supported by newly available nitrogen (Dugdale and Goering, 1967) and considered as another measure of biological pump (Falkowski et al., 2003). However, whether the biological pump in the northern Chukchi Sea during summer is limited by nitrate fluxes is unclear, given the lack of measurements of nitrate flux and the potential mismatch between nitrate fluxes and NP on short time scales of a month or season. Randelhoff et al. (2020) suggested that the mismatch is partly due to the constraint of the 15N-incubation method which considers only the particulate pool and ignores dissolved organic nitrogen content.
To evaluate the magnitude of biological pump and its influencing factors, we estimated the net community production (NCP) of the northern Chukchi Sea in August 2017 and 2020. Our NCP estimates, defined as the difference between gross primary production and community respiration, were based on continuous surface measurements of O2/Ar that were obtained using an equilibrator inlet mass spectrometer (Cassar et al., 2009). Although the shelf areas of the Chukchi Sea are some of the most productive seas in the Arctic, our understanding of the spatial and temporal variability in the biological pump in the northern part of the sea is limited, as most studies have been conducted in the shelf areas (e.g. Yun et al., 2016; Juranek et al., 2019). We found that the NCP in August 2020 was only 20% of that in 2017, and we discuss potential causes of the large difference in NCP estimates between the two years.
2 Material and methods
2.1. Division of the study area
The study area was located north of the Chukchi Shelf, terminating near 73N°, and included several prominent geological features, such as the Mendeleev Ridge, Chukchi Plateau, and Northwind Ridge (Figure 1A). The upper layer of the study area, down to about 200 m, consists of surface mixed layer and the halocline. The surface layer is influenced by several circulation components, such as Bering Strait inflow, Siberian Coastal Current, and Beaufort Gyre (Talley et al., 2011). The halocline layer of the area is affected by several water masses, including the Pacific Water (PW), Atlantic Water (AW), and East Siberian Shelf Water (ESSW). The PW, which carries freshwater, heat, and nutrients into the Chuckhi Sea, is expected to melt sea ice and support high primary production (Torres-Valdés et al., 2013; Tremblay et al., 2015; Brown et al., 2020). The AW, which is relatively high in salinity, forms a counterclockwise boundary current and progresses east into the study area (Woodgate et al., 2007; Aksenov et al., 2011). The ESSW at the south of the study area carries high nitrate concentration and episodic intrusion of the water is known to be responsible for a large inter-annual variation in biological production at southern part of the study area (Nishino et al., 2013; Kim et al., 2021). The BG forms the eastern boundary of the study area. The anticyclonic gyre, which converges freshwater from Arctic rivers, has a relatively low density, and its strong density gradient against the subsurface water inhibits vertical mixing with the saline and nutrient-rich PW (Zhuang et al., 2021).
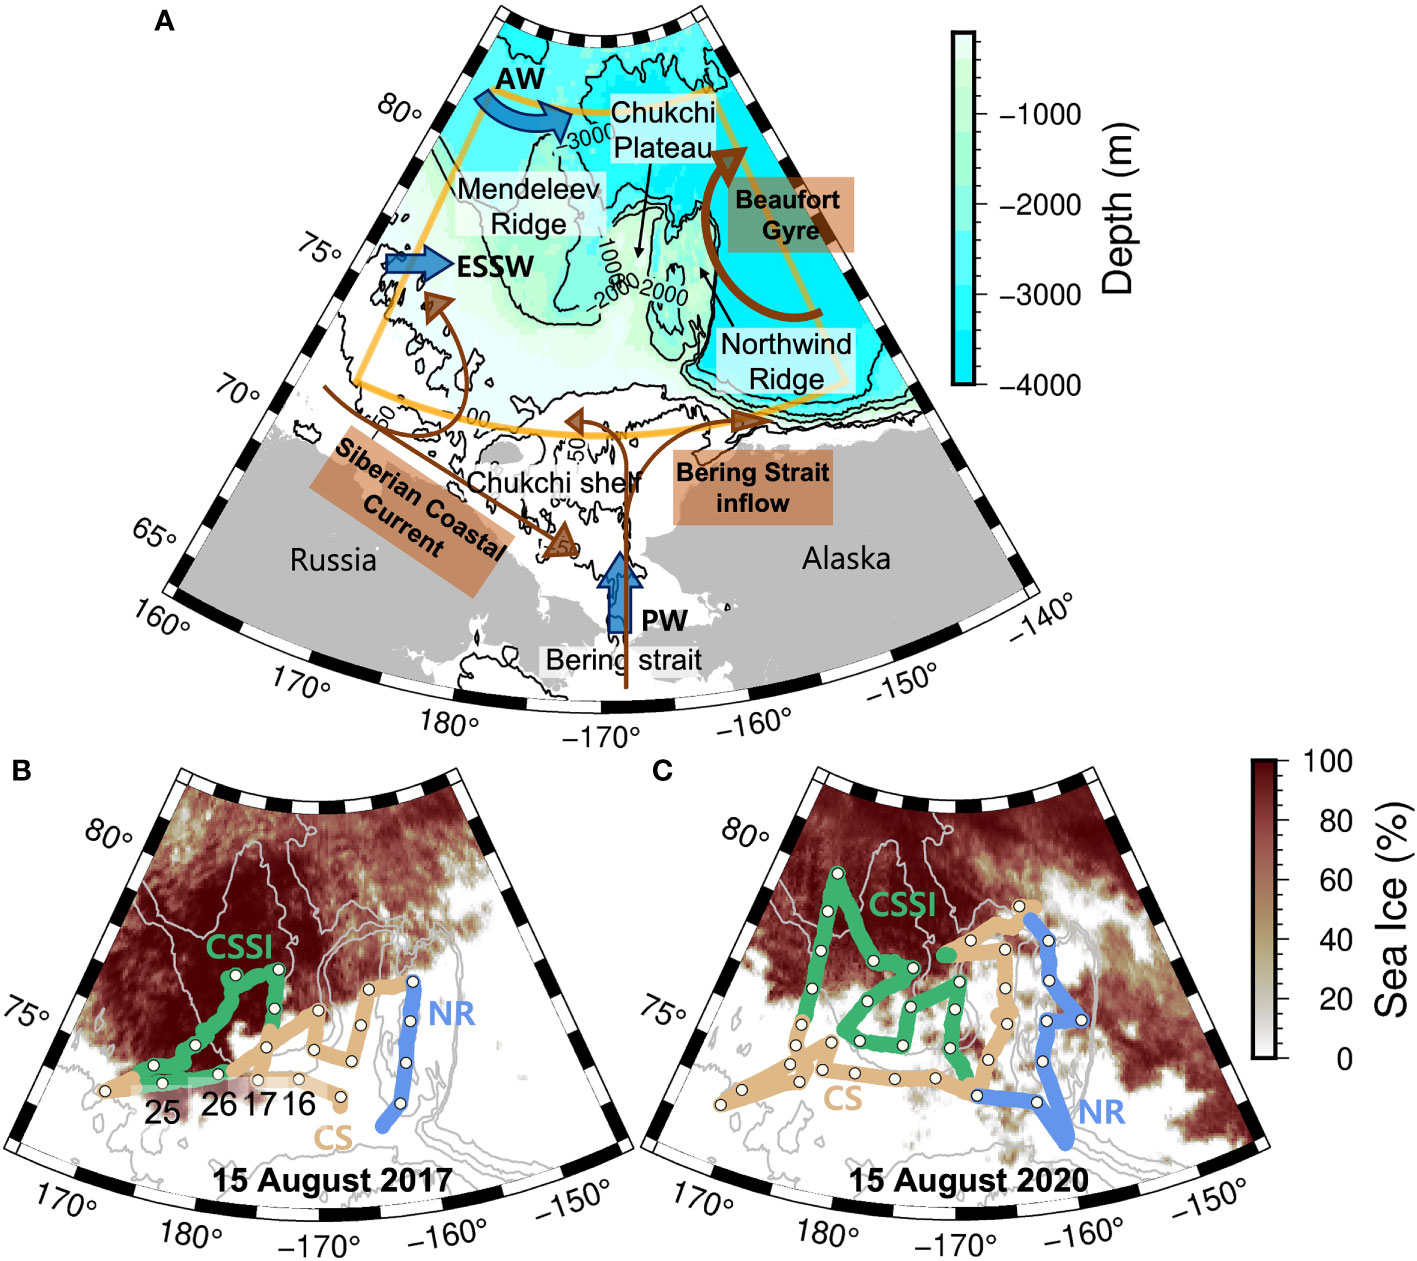
Figure 1 (A) Map of the Chukchi Sea. The surface circulation components are shown in brown arrows. The blue arrows denote water flows in the halocline layer: Atlantic Water (AW), Pacific Water (PW), East Siberian Shelf Water (ESSW). Orange sector shows the boundary of the map right below, which is the main study area. CTD stations (white circles with black edge) and cruise track in (B) 2017 and (C) 2020. Chukchi Sea sea ice (CSSI), Chukchi Sea (CS), and Northwind Ridge (NR) are marked in green, yellow, and blue, respectively. In both years, we depict sea ice concentration on August 15.
We divided the study area into three regions based on terrain, sea ice presence, and sea surface temperature and salinity (SST and SSS, respectively) (Figure 1). The Northwind Ridge (NR), which is relatively warm and less saline, consists of seawater with SSS less than 27 and SST greater than -1°C (Figures 2, 3). We divided the area west of the NR (east of 162.5°W) into the Chukchi Sea Ice Zone (CSSI) and sea-ice-free Chukchi Sea (CS); we considered the area with a sea ice concentration of > 15% as the CSSI (Cavalieri et al., 1991).
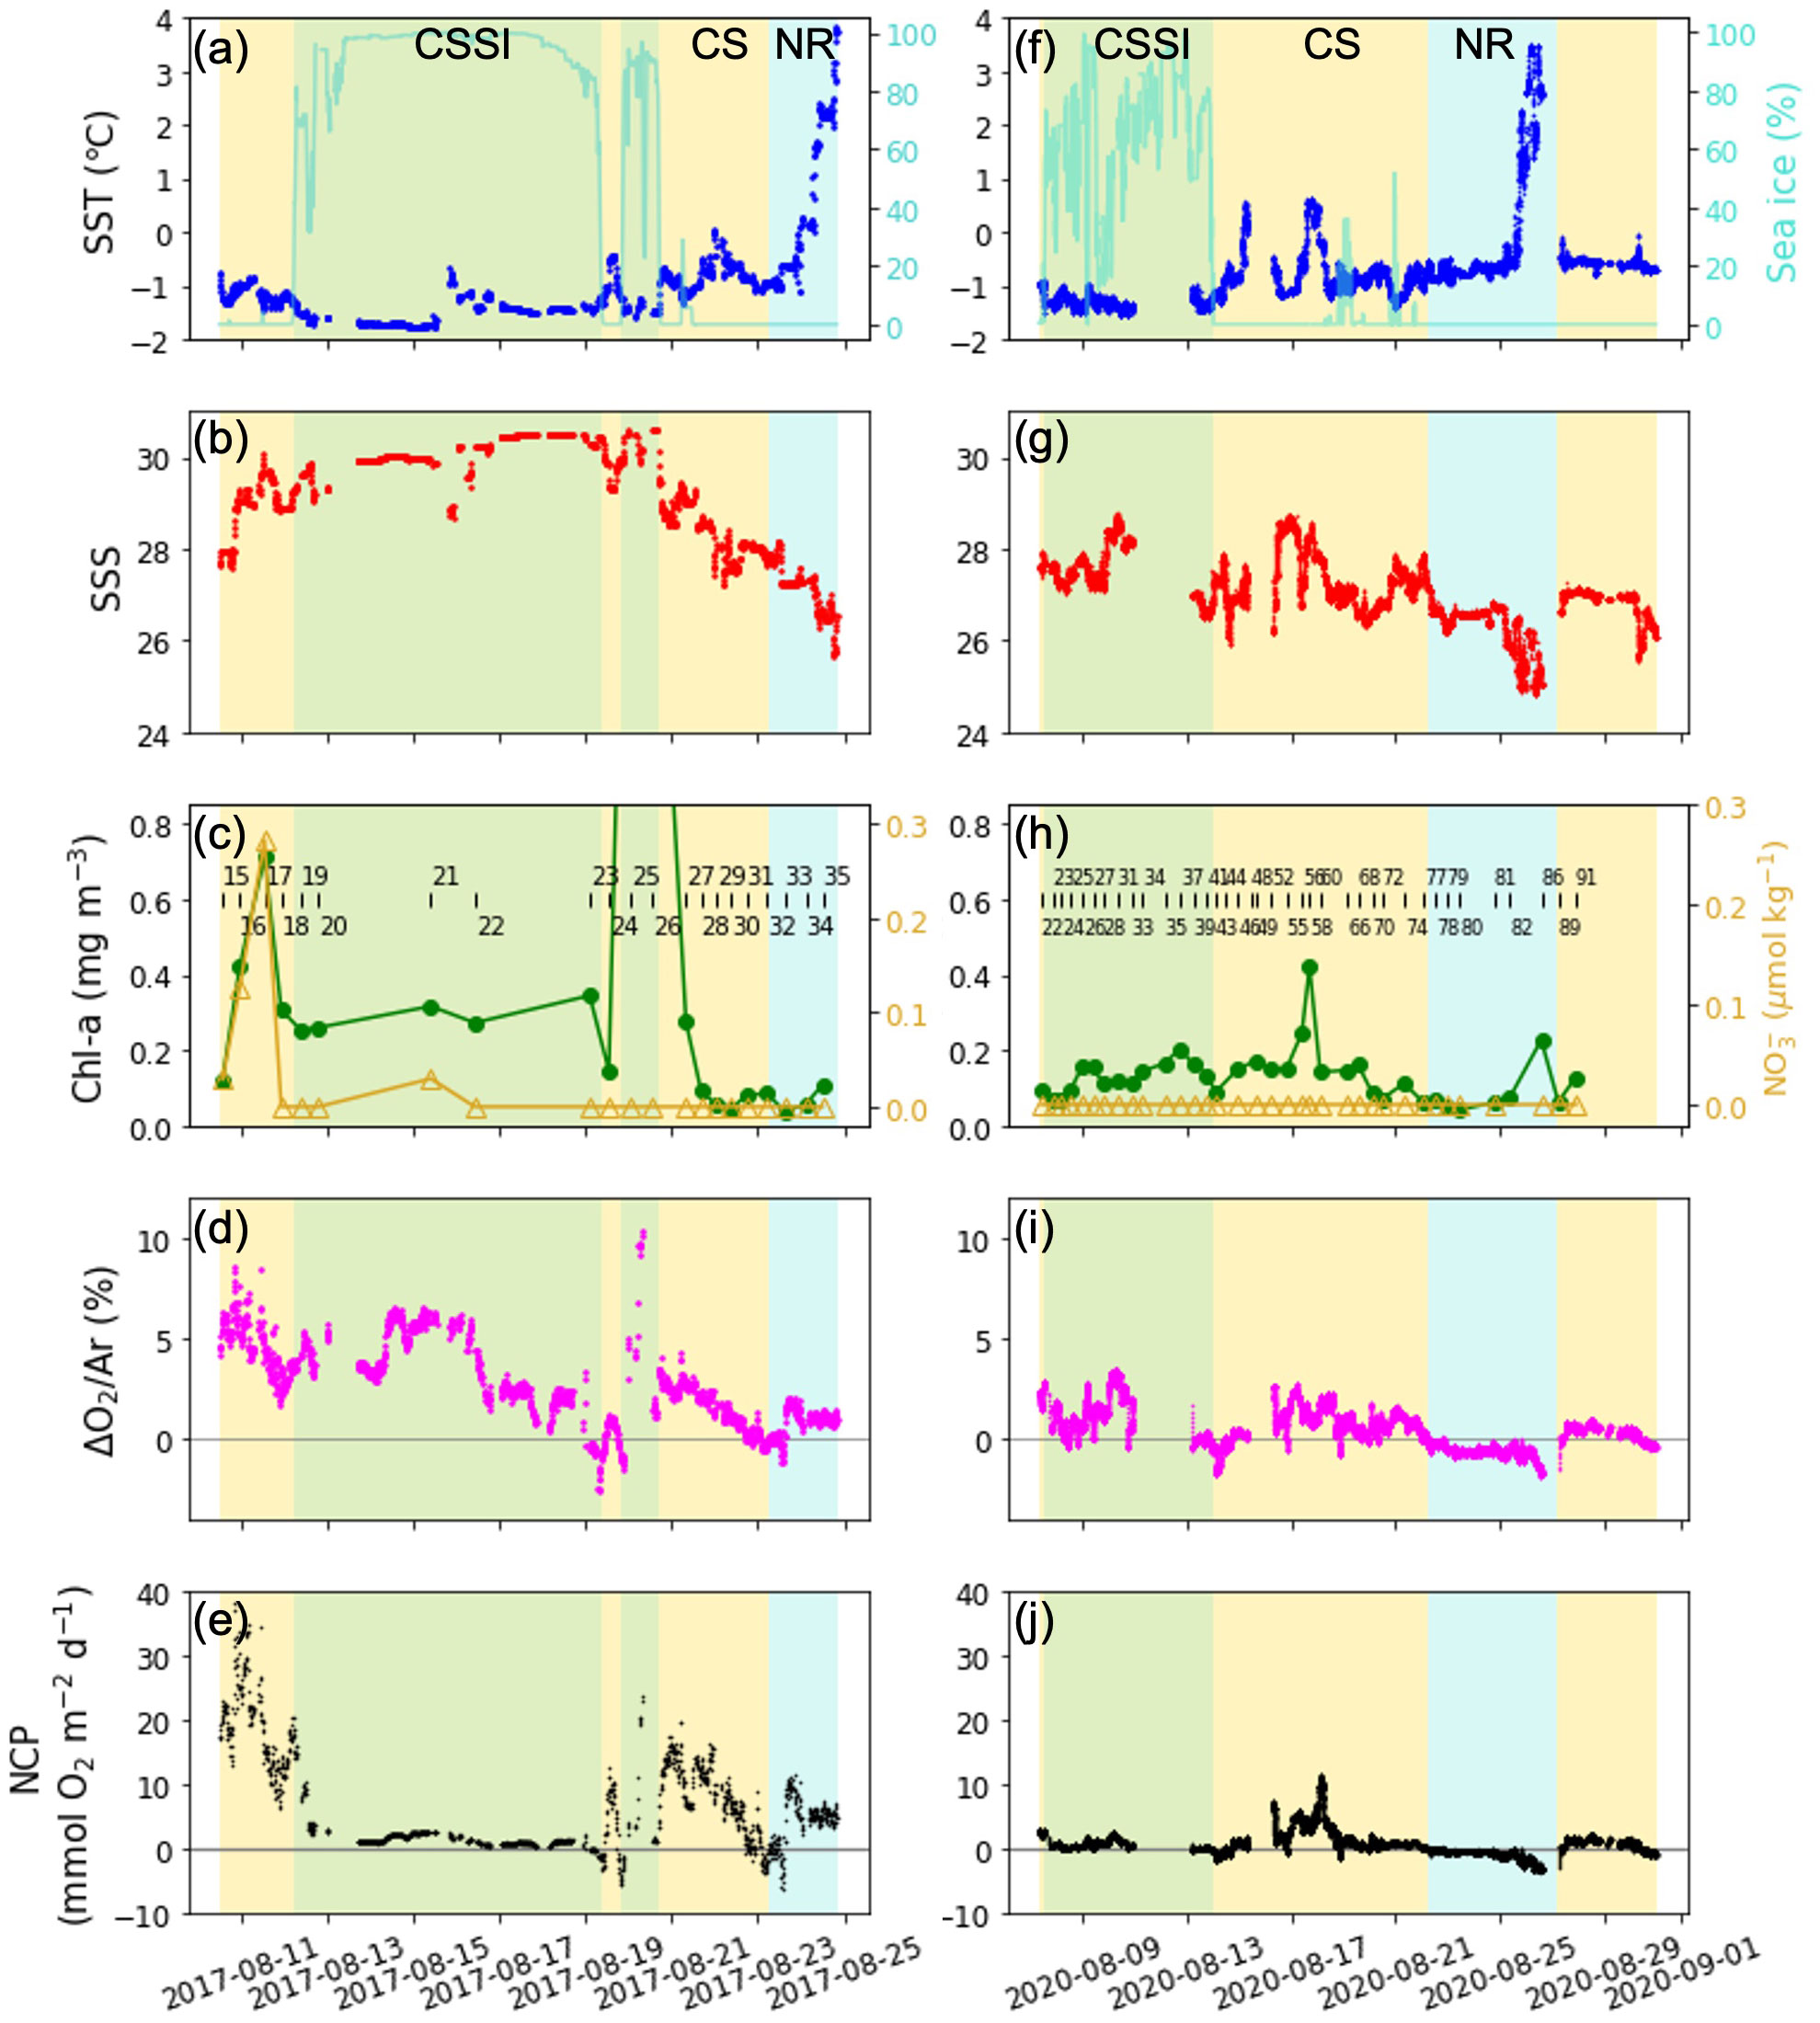
Figure 2 Time series of SST, sea ice (%), SSS, Chl-a , nitrate (NO3-), ΔO2/Ar, and NCP in (A–E) 2017 and (F–J) 2020; green, yellow, and blue shades denote the CSSI, CS, and NR, respectively. Chl-a and nitrate concentrations over the mixed layer for each station; (C, H) the station number is denoted together.
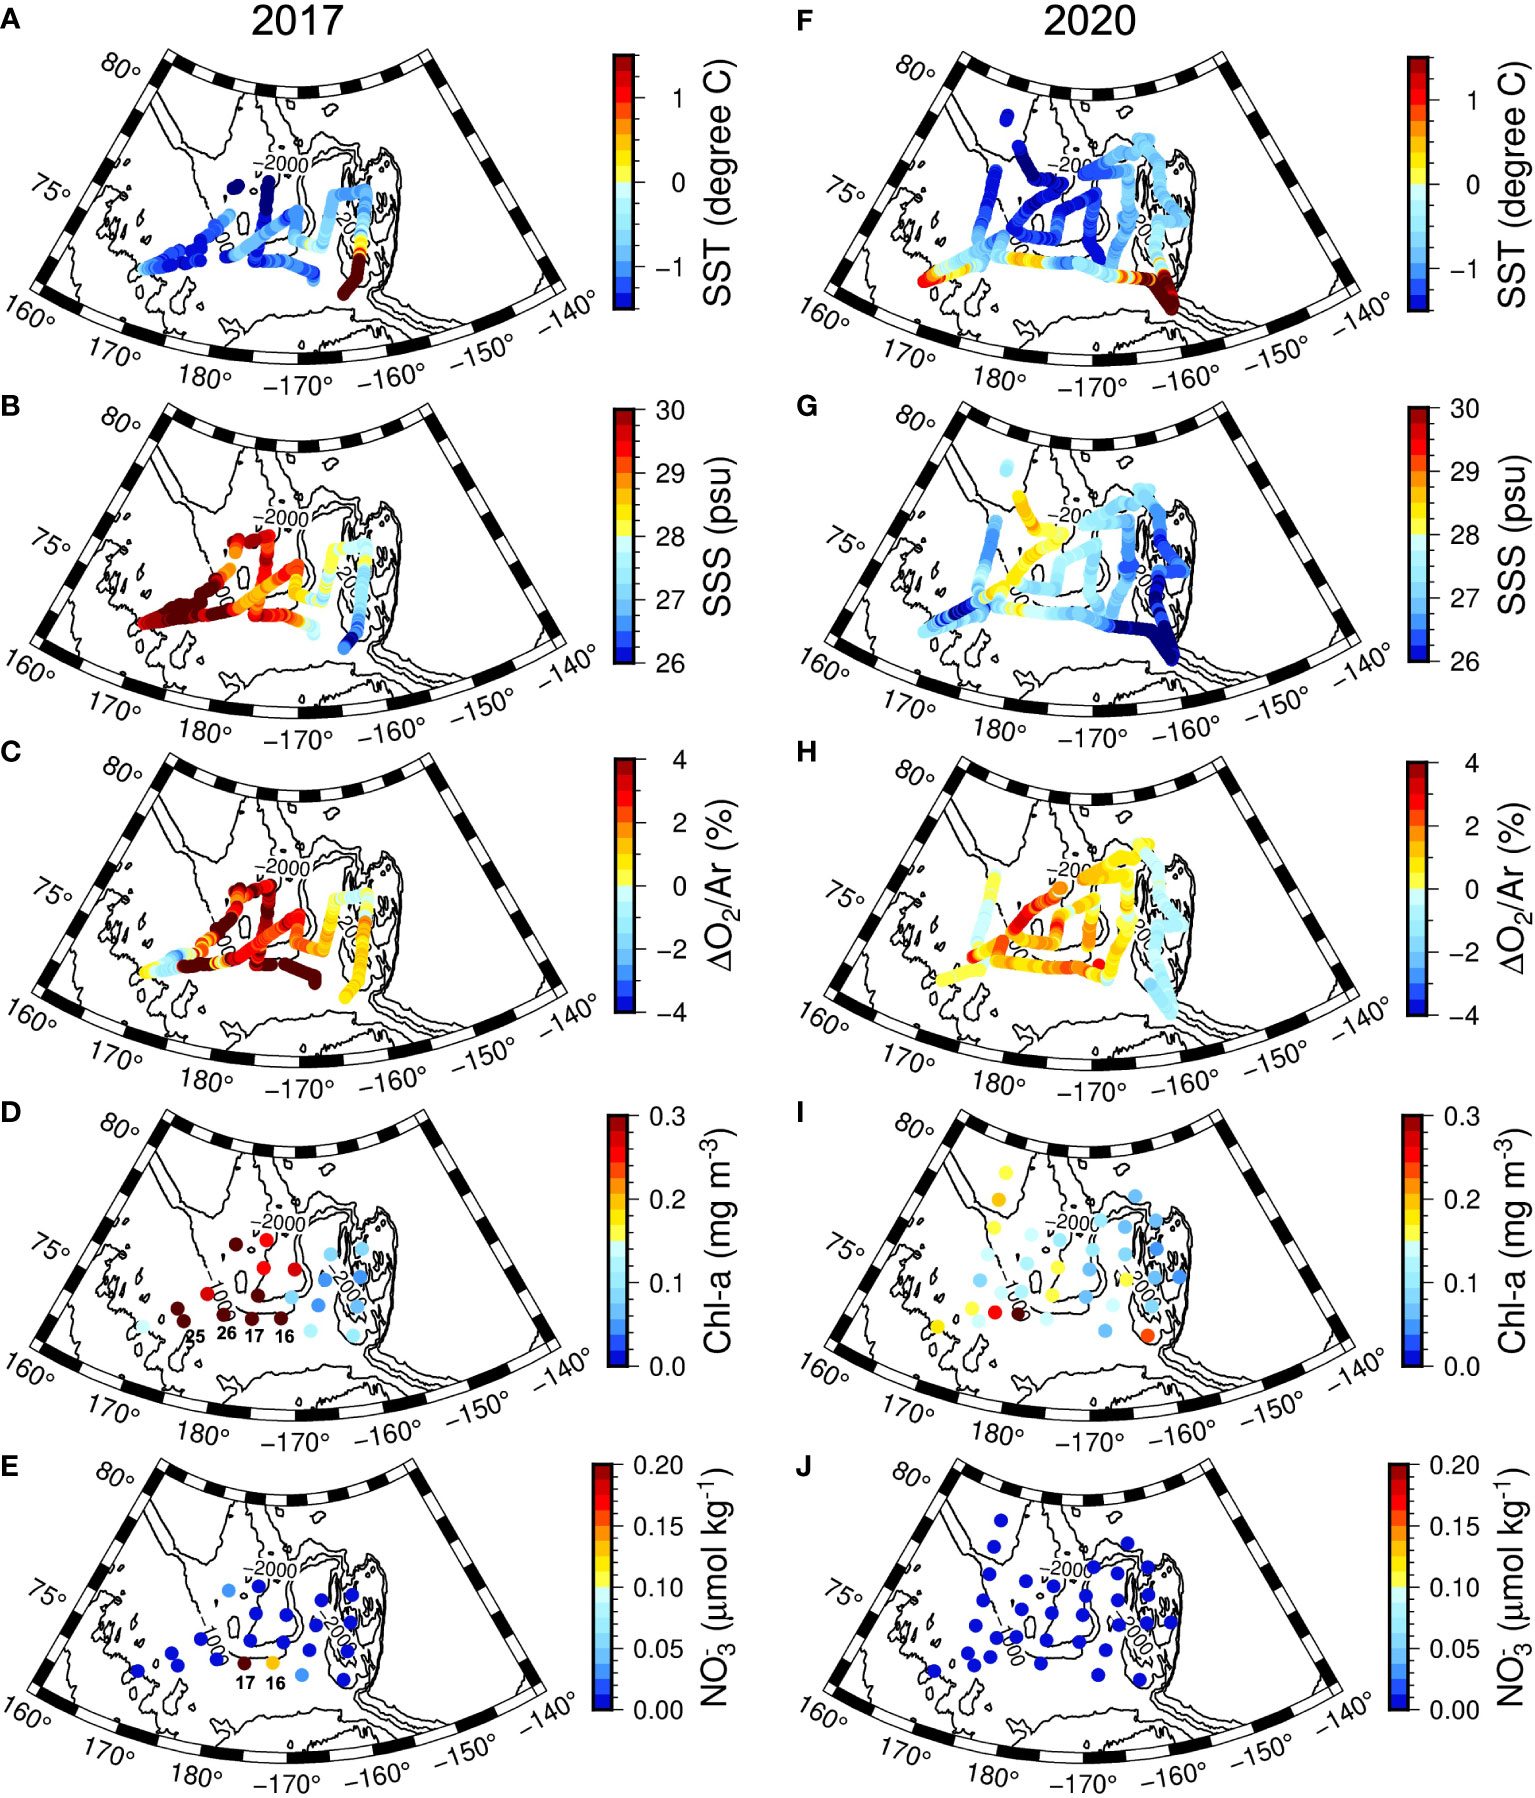
Figure 3 Horizontal distributions of SST, SSS, ΔO2/Ar, Chl-a , and nitrate (NO3-) in (A–E) 2017 and (F–J) 2020. The Chl-a and nitrate concentrations are averages of mixed layer for each station.
2.2. Underway measurements
To estimate the NCP, we observed the surface distributions of O2/Ar along with other environmental parameters over the periods of August 10 – 24, 2017 and August 7 – 31, 2020 onboard IBRV Araon (Figures 2, 3). The surface water was pumped from the bottom of the research vessel (7 m below the surface) into the laboratory and its temperature and salinity were measured continuously using a thermosalinograph (SBE 45). We corrected the values by linear regression using the surface data obtained from the CTD casts (SBE911plus) (Figure S1). The correction typically decreased temperature measured by the thermosalingraph by 0.1°C and increased salinity by 0.06, respectively.
We measured the O2/Ar ratios using an equilibrator inlet mass spectrometer (EIMS) (Cassar et al., 2009; Hahm et al., 2014). The EIMS included a Weiss-type equilibrator in which the dissolved gases in the surface water were equilibrated with the headspace. The air in the headspace of the equilibrator was sucked into a quadrupole mass spectrometer through a capillary and metering valve installed to maintain the vacuum chamber at ∼4×10⁻⁶ mbar. We measured O2 and Ar (at m/z values of 32 and 40, respectively) every ∼ 10 s using the mass spectrometer. We used clean air supplied from the foremast as the standard, which we repeatedly measured every 3–4 h (Hahm et al., 2014). The repeat measurements of the air standard indicated that the uncertainty of the O2/Ar measurement was < 0.5%.
2.3. Nutrients and chlorophyll a concentration analyses
We analyzed the nitrate, along with phosphate and silicate, concentrations onboard using a four-channel, gas-segmented continuous flow analyzer (QuAAtro, Seal Analytical) following the protocol of the Joint Global Ocean Flux Study (Gordon et al., 1993). We measured the certified reference materials from KANSO Techno (Lot. No. BV), in addition to in-house standards, to assess the accuracy and reproducibility of the measurements. The precision and detection limit of nitrate measurement was 0.14 mol kg-1 and ∼ 0.05 mol kg-1, respectively. For chlorophyll a (Chl-a) measurements, we filtered the seawater samples through 47 mm GF/F filters, which we then extracted with 90% acetone for 24 h (Parsons et al., 1984). We measured the Chl-a concentration using a fluorometer (Trilogy, Turner Designs, USA), which we calibrated using a Chl-a standard (DHI, Denmark).
2.4. NCP estimation from O2/Ar measurements
The dissolved oxygen concentration within a mixed layer is determined by both biological (respiration and photosynthesis) and physical (temperature and salinity changes, atmospheric pressure change, gas dissolution, bubble injection, and mixing) factors. The solubility and diffusivity of Ar are similar to those of O2, causing the two gases to behave similarly in seawater. Because Ar is chemically inert, changes in the ratio of O2 and Ar reflect the biological production or consumption of O2 (Craig and Hayward, 1987). The degree of biological change in O2 can be indicated by the biological oxygen supersaturation, defined as
where (O2/Ar)sample and (O2/Ar)sat are the O2/Ar ratios of the measured water sample and the air-saturated seawater, respectively (Kaiser et al., 2005). We calculated the latter from the solubility of the gases (Garcia and Gordon, 1992; Hamme and Emerson, 2004).
Neglecting vertical mixing and horizontal advection, the amount of sea-air gas exchange due to oxygen supersaturation is equal to the NCP, which is estimated as
where ρw is the density of seawater, kw is the weighted gas transfer velocity of O2, and [O2]sat is the concentration of air-saturated O2 in the sea water (Reuer et al., 2007). As O2 and Ar concentrations at the time of observation are the cumulative results of the past exchange, we adopted the weighting scheme of Teeter et al. (2018) to consider the cumulative effect of daily gas transfer velocity (k) for the past 60 days before the date of observation. In the weighting scheme, slightly modified from Reuer et al. (2007), gas transfer velocity at the time of observation has a weight of 1, and weighting decreases going back in time. The rate decreases rapidly when the fraction of the mixed layer ventilated is high (Equation 5 of Teeter et al., 2018). We computed daily k from the gas exchange–wind speed relationship reported by Wanninkhof (2014) and the daily wind speeds at 10 m above the sea surface (ECMWF Reanalysis v5). For the past history of the mixed layer depths (MLD), which is necessary for the weighting, we used the climatological data of Schmidtko et al. (2013). We note that our NCP estimates based on mass balance of biological O2 in the mixed layer represent the NCP only in the mixed layer. If there is a sizable production below the mixed layer, the estimates may underestimate depth integrated NCP.
Sea ice acts as an imperfect barrier to sea-air gas exchange, with linear (Prytherch et al., 2017) or nonlinear (Loose et al., 2014) relationships with gas transfer velocities. Although gas exchange could be enhanced by up to 40% in partially ice‐covered waters (Loose et al., 2014), parameterizations that take these processes into account are not well established yet. To facilitate an easy comparison with previous works which employed a linear relationship (Ji et al., 2019; Ouyang et al., 2021), we corrected the daily k using the following equation
where we used the daily sea ice concentration data with a resolution of 6.25 km from the Advanced Microwave Scanning Radiometer 2 (AMSR2), available at https://seaice.uni-bremen.de/, for the correction (Spreen et al., 2008). We inserted kcorrected to the aforementioned weighting equation of Teeter et al. (2018).
2.5. Determination of mixed layer depths and stratification index
We considered the summer MLD as the depth that exhibited a potential density 0.1 kg m-3 higher than that at a depth of 5 m (Peralta-Ferriz and Woodgate, 2015). To assess the strength of stratification in the study area, we calculatedthe Brunt-Väisälä buoyancy frequency squared (N2) between the surface (3 m) and at a depth of 30 m (Ji et al., 2019). A high N2 value indicates increased stability and stronger stratification. We selected depth of 30 m for two reasons: First, some stations were shallower than 40 m in the study area. Second, it was deeper than the mixed layer depth in the area.
2.6 Calculation of vertical nitrate flux
The vertical nitrate flux (FNO3) from the nitracline to the mixed layer is most likely to arise from diapycnal mixing in the absence of upwelling and downwelling events; hence, FNO3 can be calculated as
where Kz is the vertical eddy diffusivity (m2 s-1), and δ[ NO3−]/δz is the vertical nitrate gradient between the base of the mixed layer and the nitracline (mol L-1 m-1 (Randelhoff et al., 2016).
We calculated vertical eddy diffusivity (Kz) using the following equation
where Γ is a constant mixing coefficient of 0.2 (Osborn, 1980), ϵ is the dissipation rate of the turbulent kinetic energy (m2 s-3) at the base of the mixed layer, and N is buoyancy frequency. We calculated ϵ using the following equation
where LT is the Thorpe scale (Thorpe, 1977). We estimated LT as the root mean squared of all the vertical displacements of the density profile, which we sorted from that of the density-overturned original profile (Gargett and Garner, 2008). Prior to calculating LT , we meticulously postprocessed the raw CTD data at 24 Hz to minimize measurement errors, including corrections for the thermal lag of the conductivity cell and ship motion (Park et al., 2014; Seo et al., 2015).
A single profile of the Thorpe scale may not provide an accurate measure of turbulence compared with a microstructure profile. Assuming that a spatially averaged profile of the Thorpe scale can provide a reasonable measure of the region (Gargett and Garner, 2008), we obtained the regional averages of Kz calculated from the profiles of the Thorpe scale and combined them with the vertical nitrate profile to calculate the nitrate flux at each station. We further assumed that nitrate fluxes near the bottom of the mixed layers were responsible for the NCP in the mixed layer and the calculated flux between the bottom of the mixed layer and the depth at which the nitrate concentration was equal to 20% of the maximum concentration of each station (2 – 3 mol kg-1). Given the large vertical gradient of Kz , which covered more than one order of magnitude (Figure S2), we calculated the nitrate flux in 1 m intervals using the interpolated Kz and nitrate concentrations. We report the average of the 1 m interval fluxes for each station.
3 Results and discussion
3.1. Hydrographic conditions
The average sea ice concentration (91%) in the CSSI region in 2017 was much higher than that in 2020 (66%) (Figure 2). The high sea ice concentration year displayed temperatures similar to those in 2020 at the surface layer (Table 1 and Figures 3, 4A). In contrast, the average salinity of 30.1 in 2017 in the surface layer was significantly higher than the 27.7 in 2020 (Figure 4B; p -value of t -test < 0.001). Similarly, the average salinity in the surface layer of the CS region in 2020 was 1.5 lower than that in 2017, which might have been related to the early sea ice retreat in 2020. The yearly sea ice extent in 2020 was the smallest since 1979 (Parkinson and DiGirolamo, 2021). In the NR region, affected by warm PW, the temperatures were more variable than in the other regions, and were above 0°C on average, in both of the years (Table 1 and Figure 4). The salinity in the surface layer in 2020 was lower by 0.8 than that in 2017. In the subsurface layer, the temperature around potential density anomaly of 27 appeared to be elevated in 2017 compared to those in 2020 (Figure S3). This indicates a stronger upwelling or diapycnal mixing between the AW and Pacific Winter Water in 2017, which may bring high nutrient waters to shallow layers of the halocline (Woodgate et al., 2005).
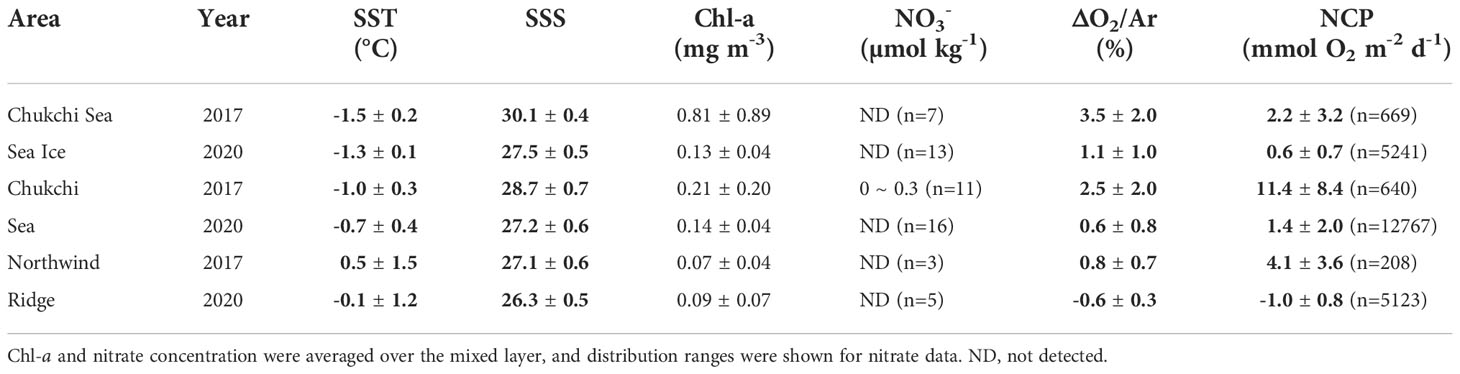
Table 1 Average and standard deviation of measured parameters for each region in 2017 and 2020.
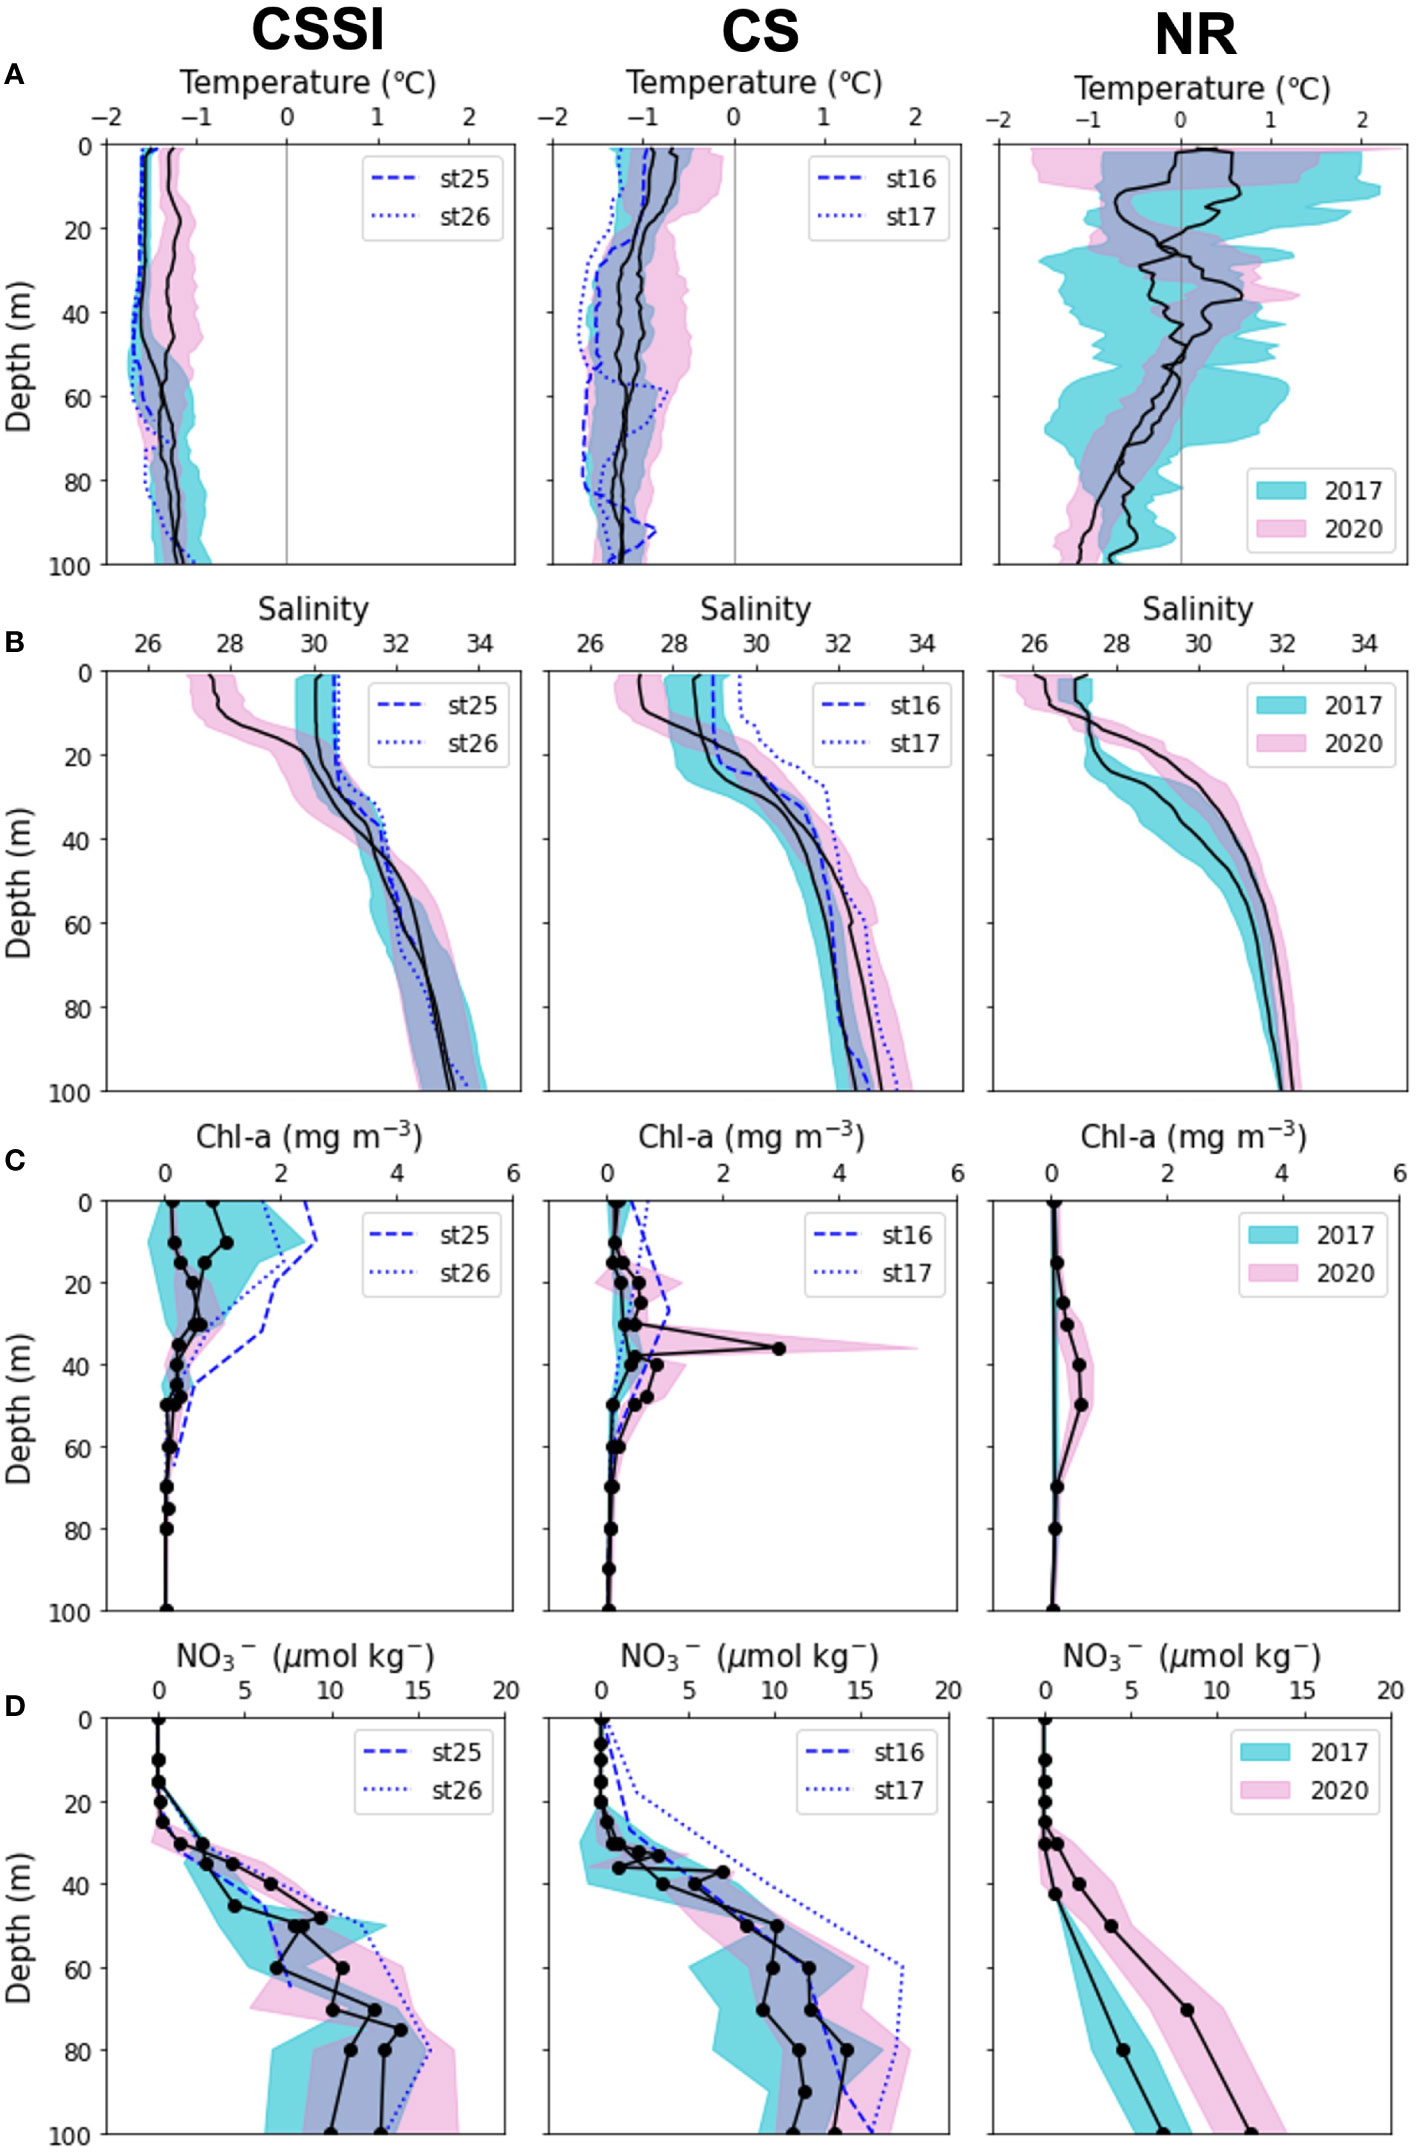
Figure 4 Regional vertical profiles of (A) temperature, (B) salinity, (C) nitrate, and (D) Chl-a . Means and standard deviations of the parameters are shown in lines and shades, respectively.
3.2. Biochemical parameters and net community production
In both years, the NO3- in the surface layers were exhausted in the entire study area, except for a few stations (Stations 16 and 17) in 2017 in the CS region (Figures 2, 3, 4C). The average Chl-a concentration measured in the surface layers of the CSSI region in 2017 was higher than that in 2020 (< 0.2 mg m−3 ). The highest concentrations were observed near the continental shelf break (0.4 – 2.3 mg m−3 at Stations 16, 17, 25, and 26; Figures 2, 3, 4D). In 2017 the averages of ΔO2/Ar values in the CSSI and CS were ∼ 3%, which were higher than the 0.8% in the NR region (Table 1). We ascribed the high ΔO2/Ar values in the CSSI region in 2017, which were the highest in both years, to limited gas exchange, which occured owing to the high sea ice concentration of > 90%. We corrected the average NCP in the CSSI for sea-ice concentration according to Eq. 3, resulting in value of 2.2 ± 3.2 mmol O2 m−2 d−1 in 2017. This value was only 12% of that in the ice-free CS region, which displayed a similar ΔO2/Ar value of ∼ 3%. The NCP in the CSSI region, which had higher Chl-a concentrations, was lower than in CS region, indicating a higher respiration rate in the ice-covered region. In 2020, the ΔO2/Ar values in CSSI and CS with averages of ∼ 1% were slightly lower than those of 3.5% and 2.5% in 2017 (Table 1). Consequently, the NCPs in the regions (averages of 0.6 and 1.4 mmol O2 m−2 d−1 in CSSI and CS, respectively) were lower than those in 2017. For the CS region, the average NCP in 2020 was only 12% of that in 2017 (Table 1 and Figure 5). In the NR region, the ΔO2/Ar values in 2020 were -0.6% on average, changing from 0.8% in 2017, indicating the lack of substantial biological net O2 production in 2020 (Table 1 and Figure 2).
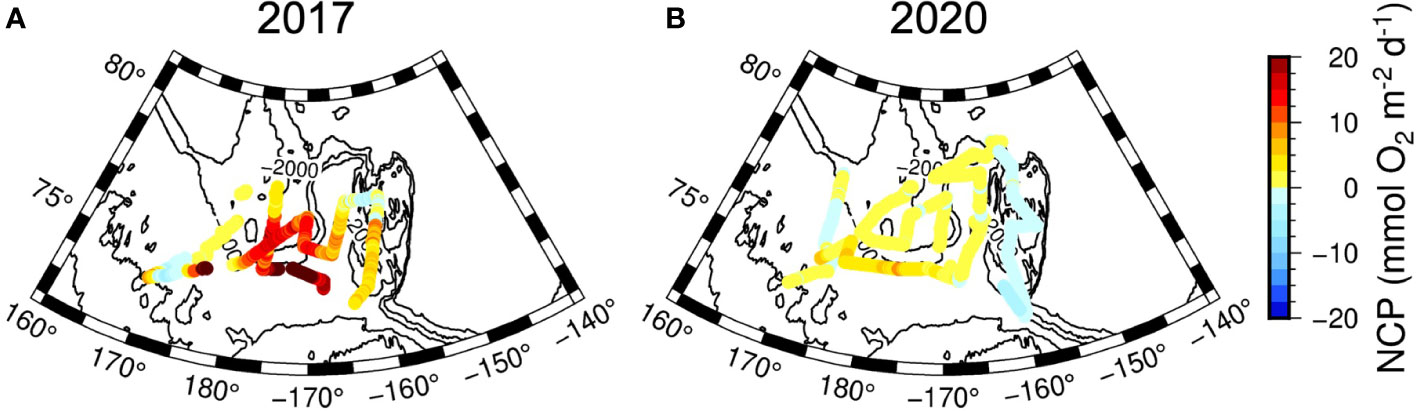
Figure 5 Horizontal distribution of NCP in (A) 2017 and (B) 2020.
3.3. NCP in the northern Chukchi Sea and comparison with other estimates
In this section we compare our NCP estimates with prior studies based on observation of O2/Ar in the mixed layer, which may underestimate depth-integrated NCP if there is substantial production below the mixed layer. Although subsurface Chl-a maximum is a quite common feature in the Arctic (Martin et al., 2010), its contribution to the depth integrated production in the Chukchi Sea may be relatively small given the fact that NPP maximum locates much shallower than subsurface Chl-a maximum; Brown et al. (2015) reported that while subsurface Chl-a maxima were located 31 ± 5 m in the late summer Chukchi Sea and Canada Basin, NPP maxima were located at the depth of 15 m on average, which is largely shallower than MLDs found in this study (Figure 6). At some stations, especially those in 2020, NPP maxima might have existed between mixed layer and nitracline depths given the large separation of the two depths (Figure 6). In the future, the contribution of NCP below mixed layer may be explored using 18 O in vitro method (Ferrón et al., 2016), which, unlike ΔO2/Ar method, does not rely on the assumption of balance between NCP and air-sea exchange of biological O2 in the mixed layer.
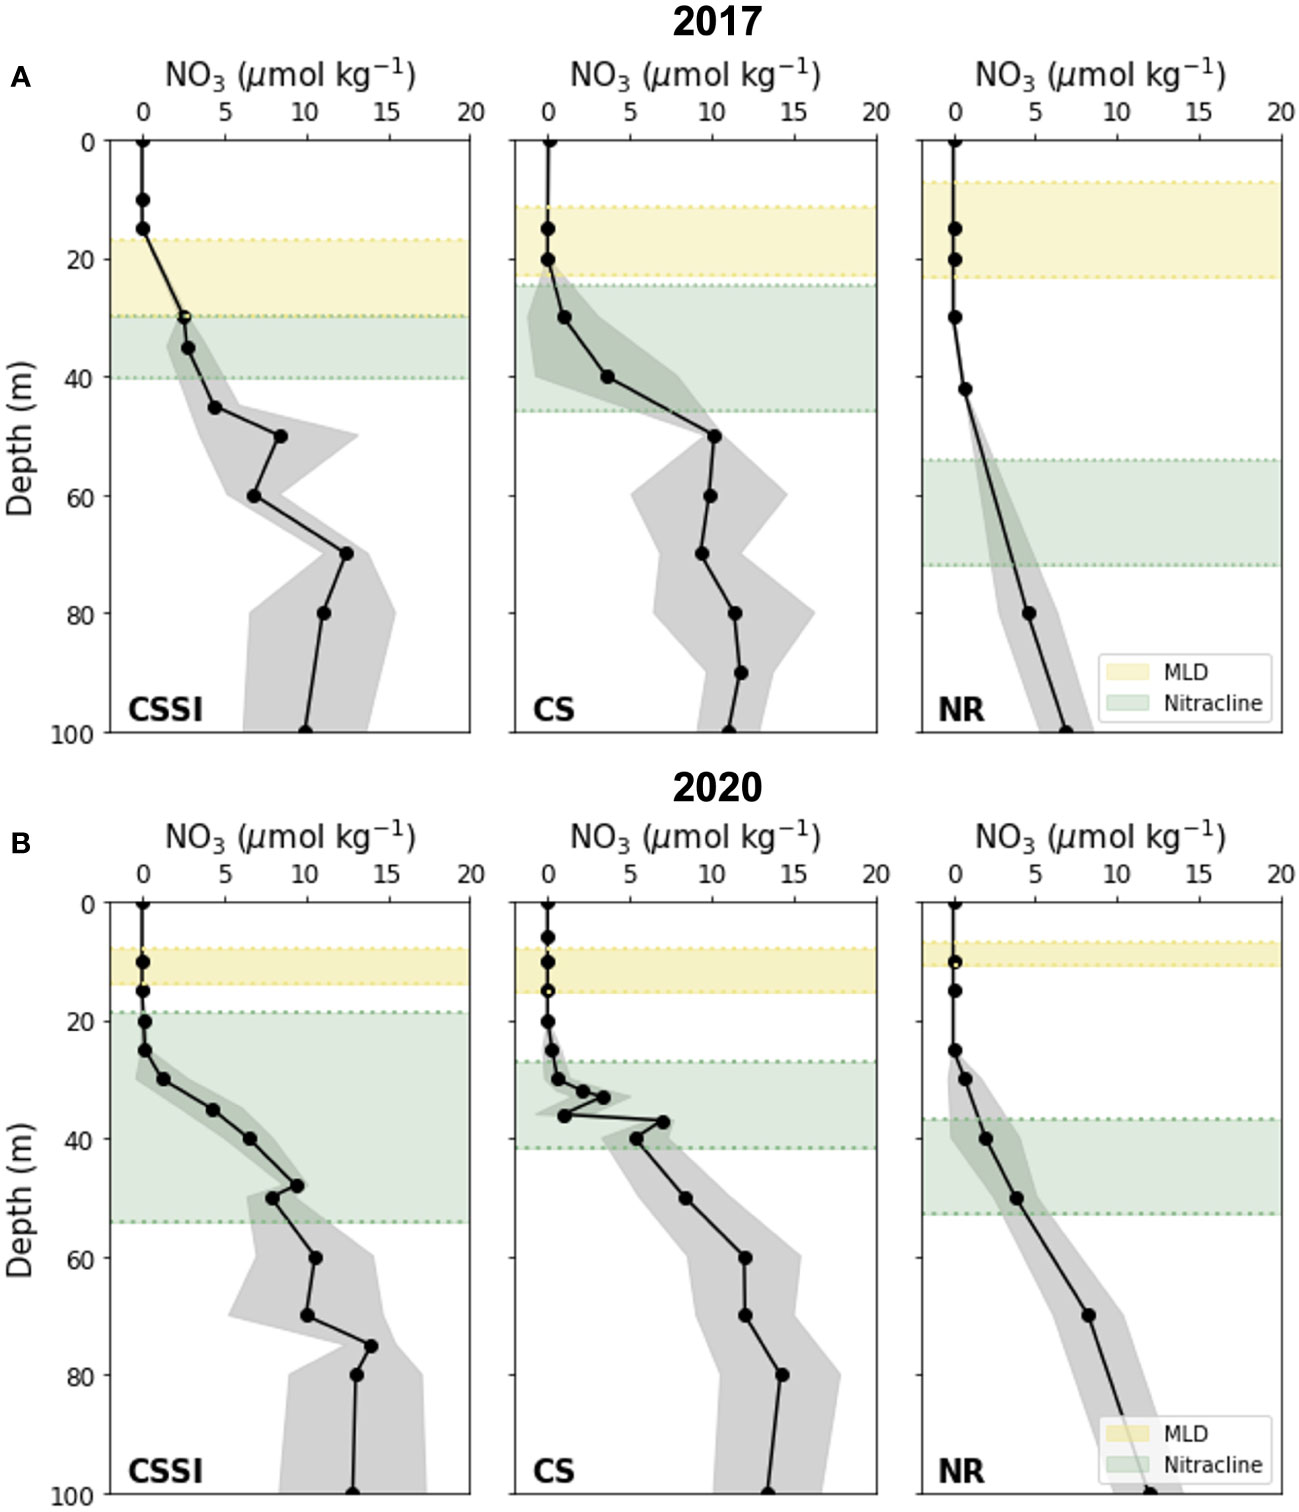
Figure 6 Vertical distribution of regional nitrate concentration in (A) 2017 and (B) 2020. Black markers denote average nitrate concentration; corresponding standard deviations are shaded grey. Regions enclosed within yellow and green dotted lines represent averages and standard deviations, respectively, of mixed layers and nitraclines.
The NCP that we calculated in this study in the ice-covered region (CSSI) is consistent with prior O2/Ar based estimates of 1.0 – 1.6 mmol O2 m−2 d−1 in the ice-covered northern Chukchi Sea (Figure 5 and Table 2). For the ice-free region (CS), our NCP estimate for 2020 is close to the lower bound of prior estimates of 1.6 – 4.5 mmol O2 m−2 d−1 (Ouyang et al., 2021), and is similar to those in the CSSI region. In the Beaufort Sea, prior NCP estimates are in the range of 0.7 – 2.9 O2 m−2 d−1 (Ji et al., 2019; Ouyang et al., 2021), which are similar to those in the CSSI region of 0.2 – 2.9 mmol O2 m−2 d−1 . Our estimates in 2017 and 2020 are close to the lower and upper bounds of the prior estimates (Table 2). Our estimates of low NCPs in the northern Chukchi and Beaufort Seas are in stark contrast to those in the Chukchi Shelf, with an estimated typical NCP in range of 9 – 41 mmol O2 m−2 d−1 (Table 1 of Ouyang et al., 2021). While the primary production of the Chukchi Shelf is supported by nutrient-rich PW (Tremblay et al., 2015), its turning to the east or west near the continental shelf-break limits the nutrient supply across the continental shelf-break, resulting in low primary production in the northern Chukchi Sea (Li et al., 2019). Overall, the NCP in the Arctic Basin is close to the lower NCP bound in the global oceans, along with those in the equatorial Pacific (0 – 6 mmol O2 m-2 d-1,Kaiser et al., 2005; Stanley et al., 2010), subtropical eastern Pacific (8 – 11 mmol O2 m-2 d-1, Juranek et al., 2012; Lockwood et al., 2012) and South Atlantic Gyre (7 mmol O2 m-2 d-1, Howard et al., 2017).
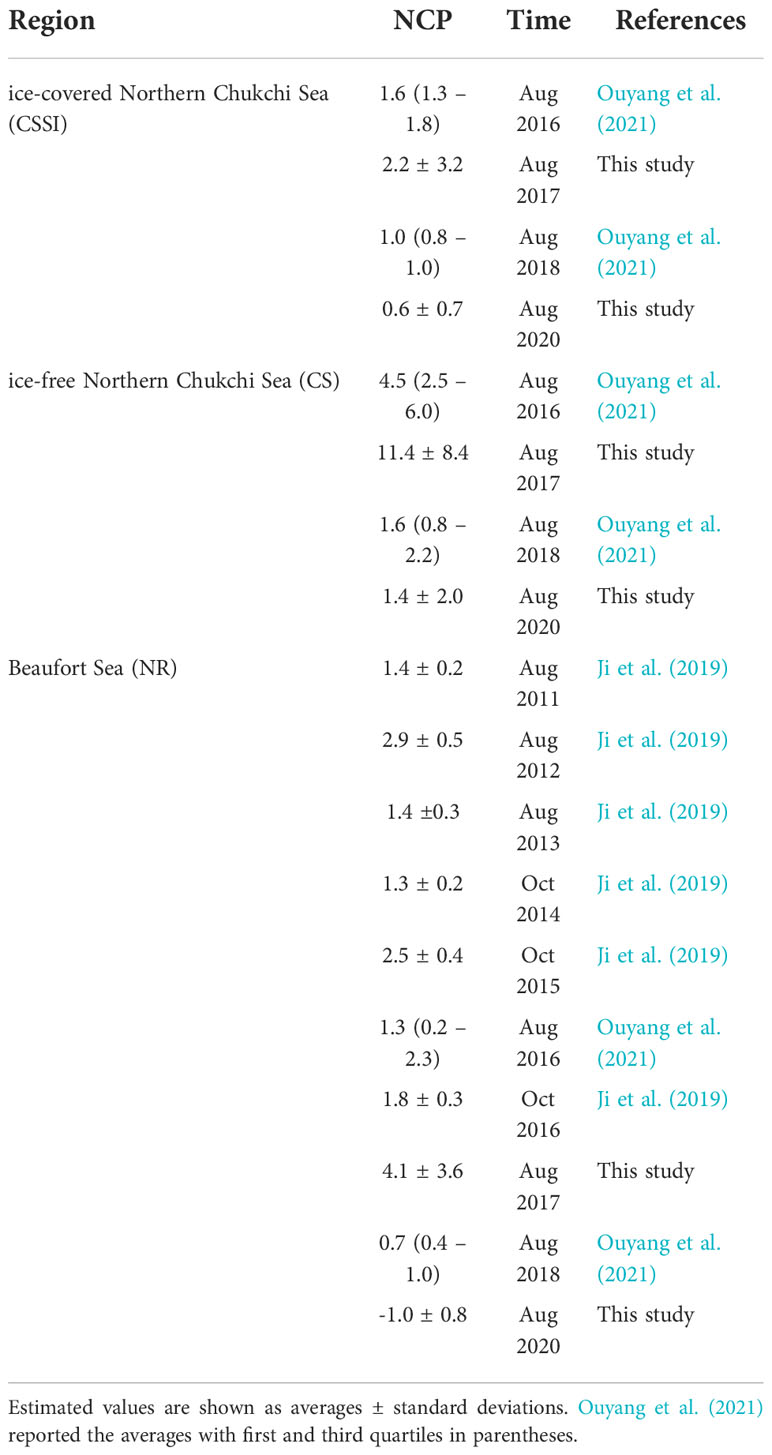
Table 2 NCP estimates (mmol O2 m-2 d-1) in the Northern Chukchi and Beaufort Seas.
The similar NCP magnitude in the ice-covered CSSI region to those in ice-free CS and NR is consistent with the studies arguing significant primary production under sea ice. For example, Ardyna et al. (2020), based on the hindcasts of climate models, reported that photosynthetically active radiation under most of the sea-ice areas in July was above the threshold (34 mol photons m−2 d−1 ), allowing for net phytoplankton growth and biomass increase. This under-ice area is as large as 3.5× 10⁶ km2 in July, accounting for 25% of the Arctic Ocean (Ardyna et al., 2020). Additionally, Kinney et al. (2020) suggested that over 41% of the primary production occurs in areas with sea ice concentrations of > 85%. A few autonomous observations at 73° and 85°N (e.g., Laney et al., 2014; Hill et al., 2018) indicated peaks of under-ice blooms in July and August, respectively. Given the latitudinal gradient of under-ice blooms, estimates of 1 – 2 mmol O2 m−2 d−1 (this study and Ouyang et al., 2021) may represent the NCP of the late bloom period in the CSSI at 75° – 80°N.
The average NCP in the CS region of 11 mmol O2 m−2 d−1 in 2017 was exceptionally high. This high NCP was accompanied by relatively high nitrate and Chl-a concentrations near the continental shelf-break (Figures 2 and 3). Specifically, Stations 16 and 17, with high NO3- concentrations of 0.1 and 0.3 mol kg−1 , respectively, and shoaled nitraclines (Figure 4C) exhibited NCPs as high as 25 and 15 mmol O2 m−2 d−1 , respectively. This circumstantial evidence implies that the high NCP might have been a result of upwelled nutrients near shelf-break induced by upwelling-favorable, along-shelf winds (Woodgate et al., 2005; Tremblay et al., 2011; Bluhm et al., 2020). Lewis et al. (2020) also indicated upwelling as a possible cause of the increased Chl-a concentration in the interior of the Arctic shelf-break in recent years. Conversely, Jung et al. (2021) found the shoaling of nitracline in the same area in 2017 and ascribed it to the lifting of Pacific-origin nutrients by the intrusion of Atlantic-origin cold saline water. A shallower nitracline may also result from the shoaling of the ventilation depth of Pacific Winter Water, which results from warming and freshening of the Pacific inflow (Woodgate and Peralta-Ferriz, 2021). We discuss the relationship between the NCP and NO3- fluxes in Section 3.4.
3.4. Relationships of NCP with environmental parameters
Despite being small in magnitude, the differences in the regional NCP estimates between 2017 and 2020 were statistically significant. To investigate the potential control factors influencing the magnitude of the NCP, we compared the regional environmental parameters in 2017 and 2020 (Figure 7 and Table 1). Whereas the differences in the regional means of the SST were small between the two years, the salinity means markedly contrasted between the two years, with the largest difference of 2.6 in the CSSI region and the smallest of 0.8 in the NR region (p-value of t -test < 0.001). The considerable decrease in salinity in 2020 led to a shallower MLD in 2020 than in 2017 in all three regions (Figure 7). The degree of stratification (N2) were statistically higher in 2020 than in 2017 in CSSI and CS (p < 0.001). The regional means of phosphate concentration were higher in 2017 than in 2020, although they were not significantly different, partly due to the limited amount of data.
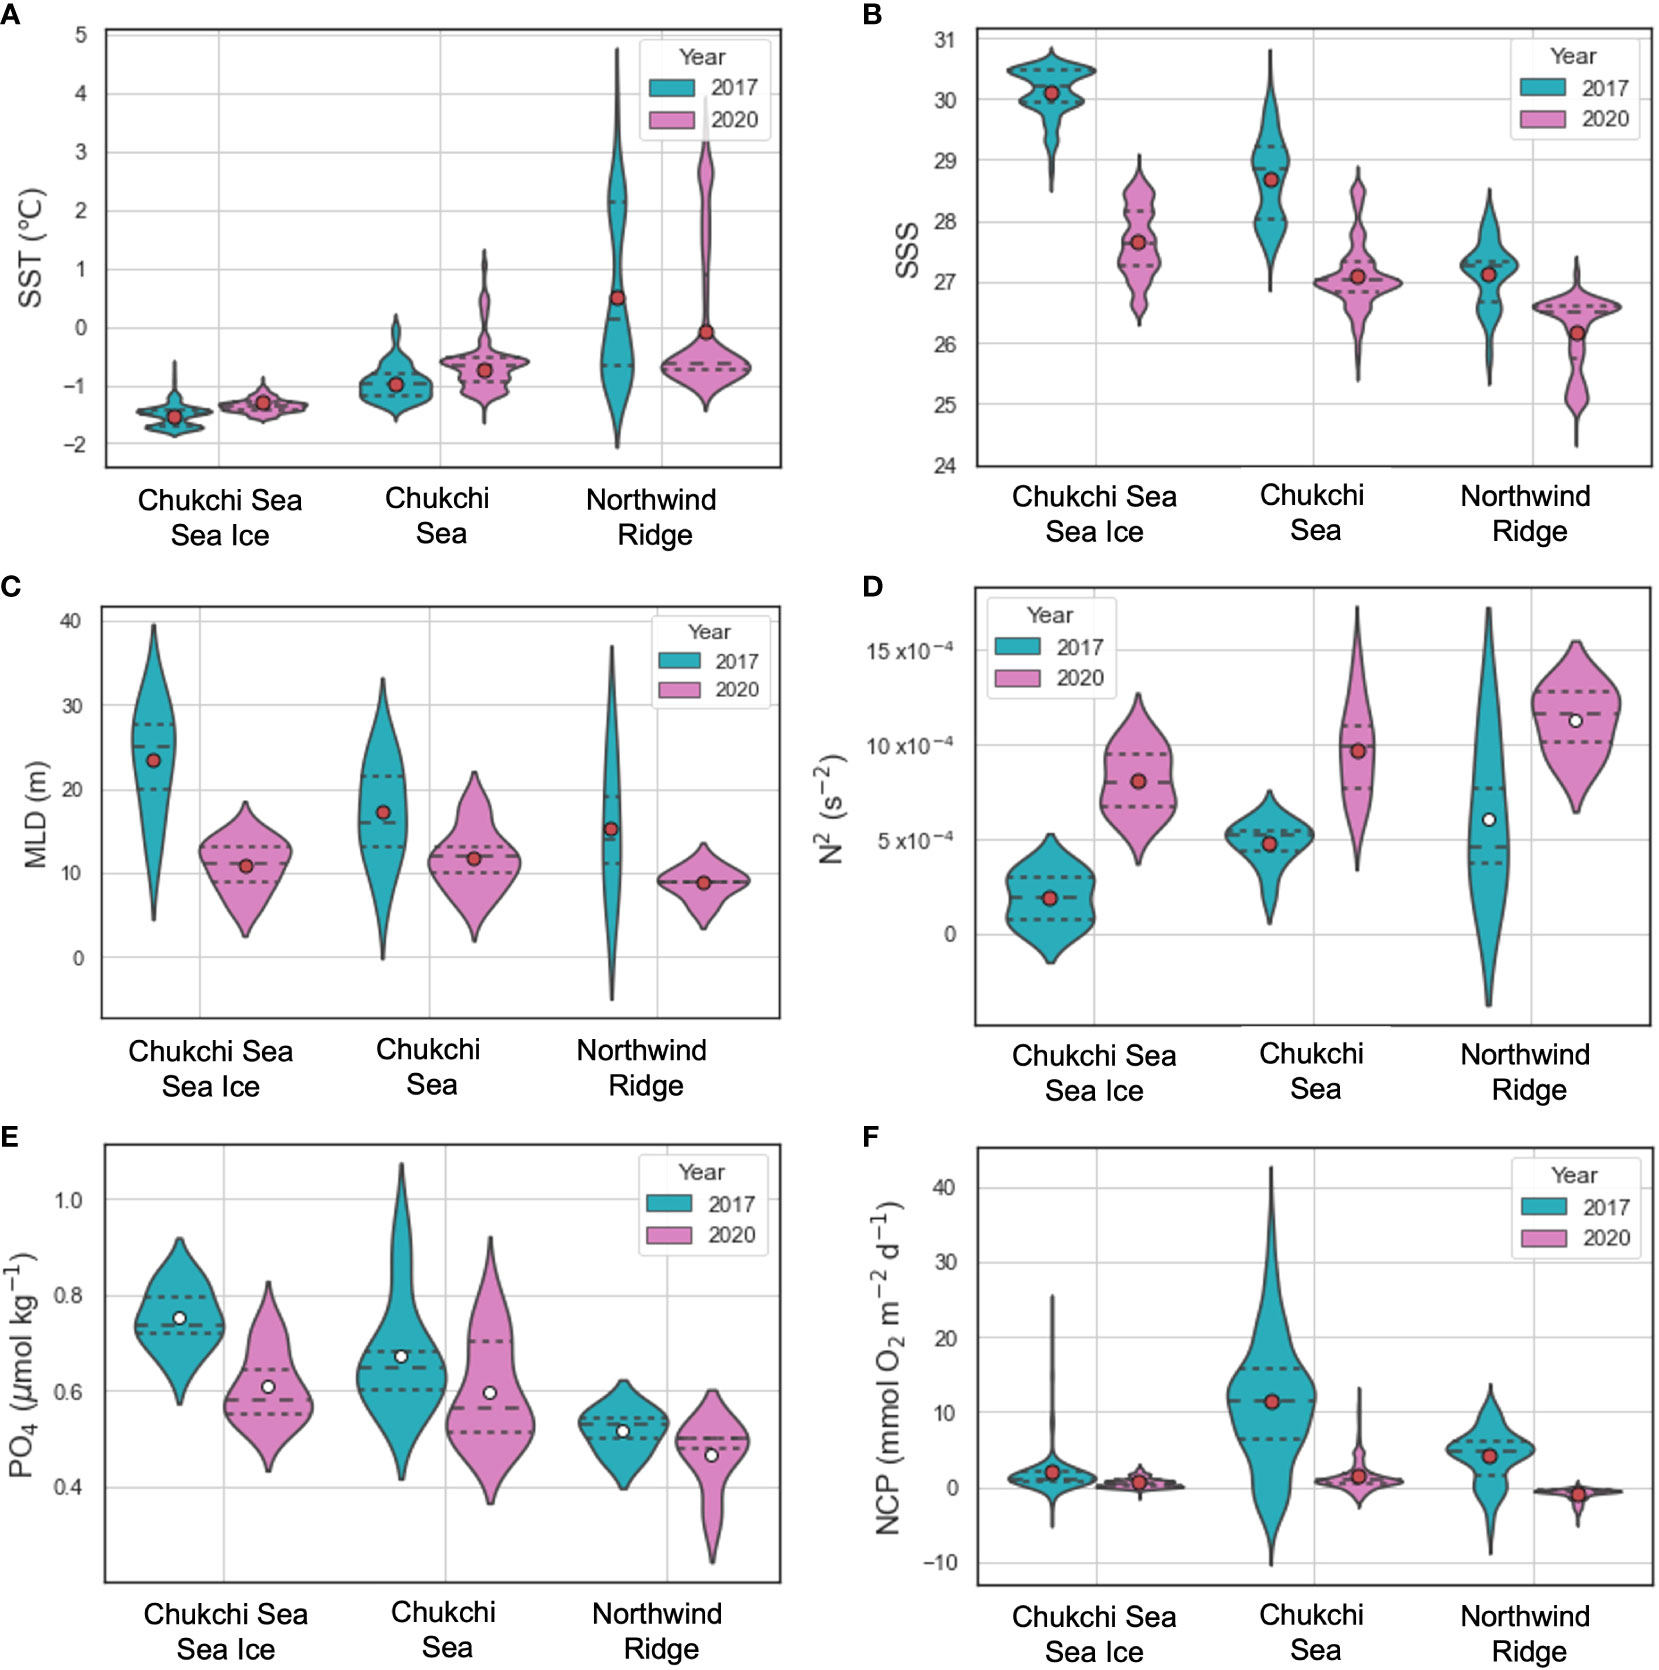
Figure 7 Violin plots of environmental parameters (A - E) and NCP (F) for each region. Dotted and dashed lines indicate the 25% – 75% quantiles and medians, respectively. Circles inside violins indicate parameter means. Red circles indicate means statistically different between 2017 and 2020.
Nitrate is the nutrient limiting primary production in the summer in the Chukchi Sea (Tremblay et al., 2015; Ko et al., 2020). As the nitrate concentrations in the mixed layer were depleted in both years in all three regions (Figure 4C), diapycnal mixing between the nitracline and mixed layer could have been the main source of nitrate in the mixed layer (Randelhoff et al., 2020). We speculated that the nitrate fluxes in 2020 were lower than those in 2017 and that lower nitrate fluxes were responsible for the reduction in NCP in 2020. This speculation seems reasonable as the MLDs were shallower and nitraclines were deeper in 2020 than in 2017, leaving distinctive gaps between the MLDs and nitraclines in all regions of 2020 (Figure 6). In 2017, however, the gaps between the means of the MLD and nitraclines were narrower; at some stations, the depths overlapped in CSSI and CS regions, providing a conducive environment for higher vertical NO3- fluxes.
We calculated the NO3- fluxes by combining vertical diffusivity derived from the Thorpe scale and the gradient of NO3- concentration (Figure 8). The fluxes ranged from 0.06 to 7 mmol N m−2 d−1 (Figure 8), largely overlapping the fluxes calculated from the measurements using microstructure profilers in the Arctic (Figure 8 of Randelhoff et al., 2020). However, the correlation between NCP and NO3- flux was poor, with a coefficient of 0.38, putting into question the role of NO3- flux as a factor controlling the NCP. The average NO3- flux in 2017 was not statistically different from that in 2020 (p-value = 0.1; Table 3). The weak correlation may have been due to the large variability in the vertical diffusivity, arising from the indirect derivation from vertical CTD profiles (Figure S2) and the discrete bottle observation of NO3- concentration. The accurate assessments of NO3- flux require vertical diffusivity data, determined using a microstructure profiler, and high-resolution measurements of NO3- concentration using a sensor (Randelhoff et al., 2020). Nitrogen sources other than upward nitrate flux, such as lateral transport by rivers (Terhaar et al., 2021) and nitrogen fixation (Harding et al., 2018), may weaken the correlation. However, these additional sources should support a higher NCP than the upward nitrate flux, which contradicts our results in which a somewhat lower NCP than the upward flux was indicated (Figure 8).
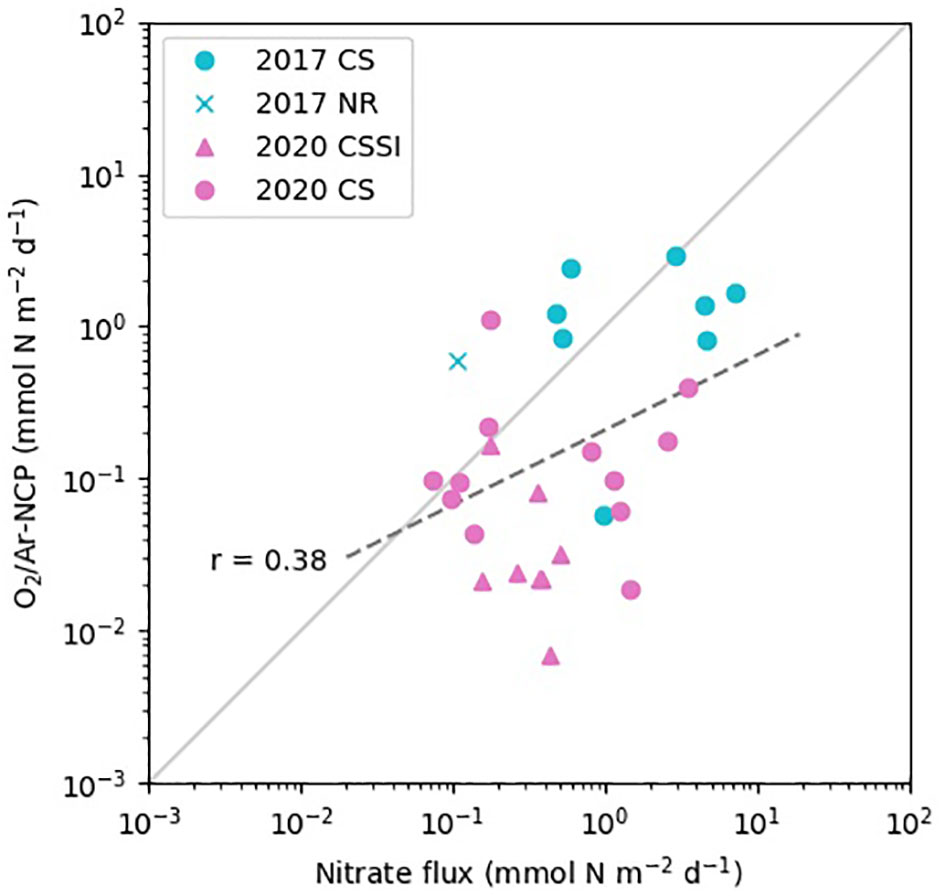
Figure 8 Correlation between NCP in the mixed layer and NO3- flux from the nitracline to the bottom of the mixed layer.
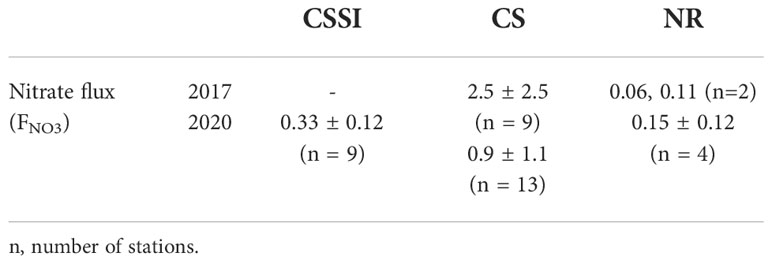
Table 3 Nitrate flux (FNO3) organized by region in 2017 and 2020 (mmol N m-2 d-1) (mean ± standard deviation).
Although whether the stronger stratification in 2020 substantially lowered the upward nitrate flux compared with that in 2017 is unclear, the most notable difference in environmental parameters was markedly lower salinity in 2020 than in 2017, resulting in shallower MLDs and stronger stratification in 2020. We note that the average sea ice concentration of 66% in 2020 CSSI is substantially lower than 91% in 2017 CSSI. However, more sea ice melting in 2020 may lower the salinity in the mixed layer by 0.5 from 31.1 in 2017, which is no larger than 20% of the salinity decrease of 2.6 between the two years (Table 1). For the calculation, we assumed a dilution of the mixed layer with a salinity of 30.1 and thickness of 25 m (Figures 7B, C) by the addition of sea ice meltwater with a salinity of 4 (Ekwurzel et al., 2001) and thickness of 0.5 m. The thickness of sea ice meltwater was calculated from the assumption of 25% (= 91% - 66%) additional melting of 2 m-thick sea ice (Lang et al., 2017).
The mechanisms that may decrease salinity and strengthen stratification in the whole study area include the influx of PW, precipitation, and river runoff (Brown et al., 2020). Accurately calculating the amount of PW inflow was difficult in this study. However, we verified that precipitation did not significantly differ between the years by analyzing the ECMWF ERA5. We speculated that river runoff may have been a cause of the low salinity in 2020. Morison et al. (2012) suggested that during an intensified Arctic Oscillation, the counterclockwise flow of the air mass is reinforced as the low pressure mainly located over the Eurasian Basin of the Arctic Ocean expands to the eastern Siberian Sea. Under these conditions, the increased river runoff originating from the Russian continent (Ob, Yenisey, and Lena) flows through the Eastern Siberian Sea toward the Beaufort Sea. The atmospheric pressure placement in 2020 was similar to that of the Arctic Oscillation increase reported by Morison et al. (2012) (Figure S4A). The lack of strong winds in 2020 may also have been responsible for the stronger stratification (Figure S4B). In the Chukchi Sea, strong winds > 10 m s−1 enhanced vertical mixing, which is strong enough to increase primary production (Nishino et al., 2015; Uchimiya et al., 2016).
4. Conclusions
In this study, to investigate the horizontal distribution of NCP and its control factors, we observed the O2/Ar in the mixed layer in the northern Chukchi Sea in 2017 and 2020. Most of the NCPs in the northern Chukchi and Beaufort Seas ranged from 1 to 4 mmol O2 m−2 d−1 , close to the lower bound of the values in the global oceans. The NCP in the ice-covered region was comparable to that in the ice-free region of the northern Chukchi Sea. Although the differences were small, the NCPs in the northern Chukchi and Beaufort Seas were lower in 2020 than in 2017. The lower salinity by >2 and the resultant stronger stratification in 2020 appeared to be the main causes of the lower NCP values, whereas the correlation between NCP and nitrate flux was unclear. The Higher river runoff input from the East Siberian coast may have contributed to the low salinity in 2020. The lack of strong winds may also have been responsible for the strong stratification in 2020.
If the sea-ice extent in summer continues to decrease, the northern Chukchi Sea will likely experience earlier phytoplankton blooms and a prolonged period of nitrate limitation. Unless winds blow strong enough to break stratification and enhance diapycnal mixing, the biological pump in late summer is likely to remain weak due to limited upward nitrate flux.
Data availability statement
The datasets for this study can be found in the Korea Polar Data Center (http://kpdc.kopri.re.kr) with the data ID of KOPRI-KPDC-00002163.
Author contributions
DH and KP contributed to conception and design of the study. SK, IL, and DH were responsible for data analysis and writing of the manuscript. IL, KP, K-HC, JJ, TP, YL, CJ, and SS contributed to discussion and the data acquisition during cruises. All authors contributed to manuscript revision, read, and approved the submitted version.
Funding
This research was supported by Korea Institute of Marine Science & Technology Promotion (KIMST) funded by the Ministry of Oceans and Fisheries (20210605, Korea-Arctic Ocean Warming and Response of Ecosystem, KOPRI). SK, IL, and DH were partially supported by the Basic Science Research Program through the National Research Foundation of Korea (NRF), funded by the Ministry of Education (NRF-2016R1D1A1B03931205).
Acknowledgments
We thank the captain and all the crew members of Araon for the help on board.
Conflict of interest
The authors declare that the research was conducted in the absence of any commercial or financial relationships that could be construed as a potential conflict of interest
Publisher’s note
All claims expressed in this article are solely those of the authors and do not necessarily represent those of their affiliated organizations, or those of the publisher, the editors and the reviewers. Any product that may be evaluated in this article, or claim that may be made by its manufacturer, is not guaranteed or endorsed by the publisher.
Supplementary material
The Supplementary Material for this article can be found online at: https://www.frontiersin.org/articles/10.3389/fmars.2022.1050791/full#supplementary-material
References
Aksenov Y., Ivanov V. V., Nurser A. J. G., Bacon S., Polyakov I. V., Coward A. C., et al. (2011). The Arctic circumpolar boundary current. J. Geophysical Research: Oceans 116, C09017. doi: 10.1029/2010JC006637
Ardyna M., Arrigo K. R. (2020). Phytoplankton dynamics in a changing Arctic ocean. Nat. Climate Change 10, 892–903. doi: 10.1038/s41558-020-0905-y
Ardyna M., Mundy C. J., Mayot N., Matthes L. C., Oziel L., Horvat C., et al. (2020). Under-ice phytoplankton blooms: Shedding light on the “Invisible” part of Arctic primary production. Front. In Mar. Sci. 7. doi: 10.3389/fmars.2020.608032
Arrigo K. R., van Dijken G. L. (2011). Secular trends in Arctic ocean net primary production. J. Geophysical Research: Oceans 116, C09011, doi: 10.1029/2011JC007151
Baer S. E., Sipler R. E., Roberts Q. N., Yager P. L., Frischer M. E., Bronk D. A. (2017). Seasonal nitrogen uptake and regeneration in the western coastal Arctic. Limnol. Oceanogr. 62, 2463–2479. doi: 10.1002/lno.10580
Bluhm B. A., Janout M. A., Danielson S. L., Ellingsen I., Gavrilo M., Grebmeier J. M., et al. (2020). The pan-Arctic continental slope: Sharp gradients of physical processes affect pelagic and benthic ecosystems. Front. Mar. Sci. 7, 886. doi: 10.3389/fmars.2020.544386
Brown K. A., Holding J. M., Carmack E. C. (2020). Understanding regional and seasonal variability is key to gaining a pan-arctic perspective on arctic ocean freshening. Front. Mar. Sci. 7, 606. doi: 10.3389/fmars.2020.00606
Brown Z. W., Lowry K. E., Palmer M. A., van Dijken G. L., Mills M. M., Pickart R. S., et al. (2015). Characterizing the subsurface chlorophyll a maximum in the chukchi sea and canada basin. Deep Sea Res. Part II: Topical Stud. Oceanogr. 118, 88–104. doi: 10.1016/j.dsr2.2015.02.010
Cassar N., Barnett B. A., Bender M. L., Kaiser J., Hamme R. C., Tilbrook B. (2009). Continuous high-frequency dissolved O2/Ar measurements by equilibrator inlet mass spectrometry. Analytical Chem. 81, 1855–1864. doi: 10.1021/ac802300u
Cavalieri D., Crawford J., Drinkwater M., Eppler D., Farmer L., Jentz R., et al. (1991). Aircraft active and passive microwave validation of sea ice concentration from the defense meteorological satellite program special sensor microwave imager. J. Geophysical Research: Oceans 96, 21989–22008. doi: 10.1029/91JC02335
Coupel P., Ruiz-Pino D., Sicre M.-A., Chen J., Lee S., Schiffrine N., et al. (2015). The impact of freshening on phytoplankton production in the pacific Arctic ocean. Prog. Oceanogr. 131, 113–125. doi: 10.1016/j.pocean.2014.12.003
Craig H., Hayward T. (1987). Oxygen supersaturation in the ocean: Biological versus physical contributions. Science 235, 199–202. doi: 10.1126/science.235.4785.199
Dugdale R. C., Goering J. J. (1967). Uptake of new and regenerated forms of nitrogen in primary productivity. Limnol. Oceanogr. 12, 196–206. doi: 10.4319/lo.1967.12.2.0196
Ekwurzel B., Schlosser P., Mortlock R. A., Fairbanks R. G., Swift J. H. (2001). River runoff, sea ice meltwater, and pacific water distribution and mean residence times in the arctic ocean. J. Geophysical Research: Oceans 106, 9075–9092. doi: 10.1029/1999JC000024
Falkowski P. G., Laws E. A., Barber R. T., Murray J. W. (2003). “Phytoplankton and their role in primary, new, and export production,” in Ocean Biogeochemistry. Global Change — The IGBP Series (closed). Ed. Fasham M. R. (Berlin Heidelberg: Springer) 99–121. doi: 10.1007/978-3-642-55844-3_5
Ferrón S., del Valle D. A., Björkman K. M., Quay P. D., Church M. J., Karl D. M. (2016). Application of membrane inlet mass spectrometry to measure aquatic gross primary production by the 18O in vitro method. Limnol. Oceanogr.: Methods 14, 610–622. doi: 10.1002/lom3.10116
Garcia H., Gordon L. (1992). Oxygen solubility in seawater: Better fitting equations. Limnol. And Oceanogr. 37, 1307–1312. doi: 10.4319/lo.1992.37.6.1307
Gargett A., Garner T. (2008). Determining Thorpe scales from ship-lowered CTD density profiles. J. Atmospheric Oceanic Technol. 25, 1657–1670. doi: 10.1175/2008JTECHO541.1
Gordon L. I., Jennings J. C. Jr., Ross A. A., Krest J. M. (1993). A suggested protocol for continuous flow automated analysis of seawater nutrients (phosphate, nitrate, nitrite and silicic acid) in the woce hydrographic program and the joint global ocean fluxes study. WOCE Hydrographic Program Office Methods Manual WHPO, 1–52.
Hahm D., Rhee T. S., Kim H., Park J., Kim Y., Shin H. C., et al. (2014). Spatial and temporal variation of net community production and its regulating factors in the amundsen Sea, Antarctica. J. Geophysical Research: Oceans 119, 2815–2826. doi: 10.1002/2013JC009762
Hamme R. C., Emerson S. R. (2004). The solubility of neon, nitrogen and argon in distilled water and seawater. Deep-Sea Res. I 51, 1517–1528. doi: 10.1016/j.dsr.2004.06.009
Harding K., Turk-Kubo K. A., Sipler R. E., Mills M. M., Bronk D. A., Zehr J. P. (2018). Symbiotic unicellular cyanobacteria fix nitrogen in the Arctic ocean. Proc. Natl. Acad. Sci. 115, 13371. doi: 10.1073/pnas.1813658115
Hill V. J., Light B., Steele M., Zimmerman R. C. (2018). Light availability and phytoplankton growth beneath Arctic Sea ice: Integrating observations and modeling. J. Geophysical Research: Oceans 123, 3651–3667. doi: 10.1029/2017JC013617
Howard E. M., Durkin C. A., Hennon G. M. M., Ribalet F., Stanley R. H. R. (2017). Biological production, export efficiency, and phytoplankton communities across 8000 km of the south Atlantic. Global Biogeochem. Cycles 31, 1066–1088. doi: 10.1002/2016GB005488
Ji B. Y., Sandwith Z. O., Williams W. J., Diaconescu O., Ji R., Li Y., et al. (2019). Variations in rates of biological production in the Beaufort gyre as the Arctic changes: Rates from 2011 to 2016. J. Geophysical Research: Oceans 124, 3628–3644. doi: 10.1029/2018JC014805
Jung J., Cho K.-H., Park T., Yoshizawa E., Lee Y., Yang E. J., et al. (2021). Atlantic-Origin cold saline water intrusion and shoaling of the nutricline in the pacific Arctic. Geophysical Res. Lett. 48, e2020GL090907. doi: 10.1029/2020GL090907
Juranek L. W., Quay P. D., Feely R. A., Lockwood D., Karl D. M., Church M. J. (2012). Biological production in the NE pacific and its influence on air-sea CO2 flux: Evidence from dissolved oxygen isotopes and O2/Ar. J. Of Geophysical Res. 117, 05022. doi: 10.1029/2011JC007450
Juranek L., Takahashi T., Mathis J., Pickart R. (2019). Significant biologically mediated CO2 uptake in the pacific Arctic during the late open water season. J. Geophysical Research: Oceans 124, 821–843. doi: 10.1029/2018JC014568
Kaiser J., Reuer M. K., Barnett B., Bender M. L. (2005). Marine productivity estimates from continuous O2/Ar ratio measurements by membrane inlet mass spectrometry. Geophysical Res. Lett. 32, L19605. doi: 10.1029/2005GL023459
Kim H.-J., Kim H. J., Yang E.-J., Cho K.-H., Jung J., Kang S.-H., et al. (2021). Temporal and spatial variations in particle fluxes on the chukchi Sea and East Siberian Sea slopes from 2017 to 2018. Front. Mar. Sci 7, 609748. doi: 10.3389/fmars.2020.609748
Kinney J. C., Maslowski W., Osinski R., Jin M., Frants M., Jeffery N., et al. (2020). Hidden production: On the importance of pelagic phytoplankton blooms beneath Arctic Sea ice. J. Of Geophysical Res. 125, e2020JC016211. doi: 10.1029/2020JC016211
Ko E., Gorbunov M. Y., Jung J., Joo H. M., Lee Y., Cho K.-H., et al. (2020). Effects of nitrogen limitation on phytoplankton physiology in the Western Arctic ocean in summer. J. Geophysical Research: Oceans 125, e2020JC016501.
Laney S. R., Krishfield R. A., Toole J. M., Hammar T. R., Ashjian C. J., Timmermans M.-L. (2014). Assessing algal biomass and bio-optical distributions in perennially ice-covered polar ocean ecosystems. Polar Sci. 8, 73–85. doi: 10.1016/j.polar.2013.12.003
Lang A., Yang S., Kaas E. (2017). Sea Ice thickness and recent arctic warming. Geophysical Res. Lett. 44, 409–418. doi: 10.1002/2016GL071274
Lewis K. M., van Dijken G. L., Arrigo K. R. (2020). Changes in phytoplankton concentration now drive increased Arctic ocean primary production. Science 369, 198–202. doi: 10.1126/science.aay8380
Li M., Pickart R. S., Spall M. A., Weingartner T. J., Lin P., Moore G. W. K., et al. (2019). Circulation of the chukchi Sea shelfbreak and slope from moored timeseries. Prog. Oceanogr. 172, 14–33. doi: 10.1016/j.pocean.2019.01.002
Lockwood D., Quay P. D., Kavanaugh M. T., Juranek L. W., Feely R. A. (2012). High-resolution estimates of net community production and air-sea CO2 flux in the northeast pacific. Global Biogeochem. Cycles 26, GB4010. doi: 10.1029/2012GB004380
Loose B., McGillis W. R., Perovich D., Zappa C. J., Schlosser P. (2014). A parameter model of gas exchange for the seasonal sea ice zone. Ocean Sci. 10, 17–28. doi: 10.5194/os-10-17-2014
MacGilchrist G. A., Naveira Garabato A. C., Tsubouchi T., Bacon S., Torres-Valdés S., Azetsu-Scott K. (2014). The Arctic ocean carbon sink. Deep Sea Res. Part I: Oceanographic Res. Papers 86, 39–55. doi: 10.1016/j.dsr.2014.01.002
Martin J., Tremblay J.-É., Gagnon J., Tremblay G., Lapoussière A., Jose C., et al. (2010). Prevalence, structure and properties of subsurface chlorophyll maxima in canadian arctic waters. Mar. Ecol. Prog. Ser. 412, 69–84. doi: 10.3354/meps08666
McLaughlin F. A., Carmack E. C. (2010). Deepening of the nutricline and chlorophyll maximum in the Canada basin interior 2003–2009. Geophysical Res. Lett. 37, L24602. doi: 10.1029/2010GL045459
Morison J., Kwok R., Peralta-Ferriz C., Alkire M., Rigor I., Andersen R., et al. (2012). Changing Arctic ocean freshwater pathways. Nature 481, 66–70. doi: 10.1038/nature10705
Nishino S., Itoh M., Williams W. J., Semiletov I. (2013). Shoaling of the nutricline with an increase in near-freezing temperature water in the makarov basin. J. Geophysical Research: Oceans 118, 635–649. doi: 10.1029/2012JC008234
Nishino S., Kawaguchi Y., Inoue J., Hirawake T., Fujiwara A., Futsuki R., et al. (2015). Nutrient supply and biological response to wind-induced mixing, inertial motion, internal waves, and currents in the northern chukchi Sea. J. Geophysical Research: Oceans 120, 1975–1992. doi: 10.1002/2014JC010407
Osborn T. R. (1980). Estimates of the local rate of vertical diffusion from dissipation measurements. J. Phys. Oceanogr. 10, 83–89. doi: 10.1175/1520-0485(1980)010<0083:EOTLRO>2.0.CO;2
Ouyang Z., Qi D., Zhong W., Chen L., Gao Z., Lin H., et al. (2021). Summertime evolution of net community production and CO2 flux in the western Arctic ocean. Global Biogeochem. Cycles 35, e2020GB006651. doi: 10.1029/2020GB006651
Parkinson C. L., DiGirolamo N. E. (2021). Sea Ice extents continue to set new records: Arctic, antarctic, and global results. Remote Sens. Environ. 267, 112753. doi: 10.1016/j.rse.2021.112753
Park Y. H., Lee J. H., Durand I., Hong C. S. (2014). Validation of Thorpe-scale-derived vertical diffusivities against microstructure measurements in the kerguelen region. Biogeosciences 11, 6927–6937. doi: 10.5194/bg-11-6927-2014
Parsons T., Maita Y., Lalli C. (1984). A manual of chemical & biological methods for seawater analysis. (Amsterdam: Pergamon).
Peralta-Ferriz C., Woodgate R. A. (2015). Seasonal and interannual variability of pan-arctic surface mixed layer properties from 1979 to 2012 from hydrographic data, and the dominance of stratification for multiyear mixed layer depth shoaling. Prog. Oceanogr. 134, 19–53. doi: 10.1016/j.pocean.2014.12.005
Prytherch J., Brooks I. M., Crill P. M., Thornton B. F., Salisbury D. J., Tjernström M., et al. (2017). Direct determination of the air-sea CO2 gas transfer velocity in Arctic sea ice regions. Geophysical Res. Lett. 44, 3770–3778. doi: 10.1002/2017GL073593
Randelhoff A., Fer I., Sundfjord A., Tremblay J., Reigstad M. (2016). Vertical fluxes of nitrate in the seasonal nitracline of the Atlantic sector of the Arctic ocean. J. Geophysical Research: Oceans 121, 5282–5295. doi: 10.1002/2016JC011779
Randelhoff A., Holding J., Janout M., Sejr M. K., Babin M., Tremblay J.-É., et al. (2020). Pan-Arctic ocean primary production constrained by turbulent nitrate fluxes. Front. Mar. Sci. 7, 150. doi: 10.3389/fmars.2020.00150
Reuer M. K., Barnett B. A., Bender M. L., Falkowski P. G., Hendricks M. B. (2007). New estimates of southern ocean biological production rates from O2/Ar ratios and the triple isotope composition of O2. Deep Sea Res. Part I: Oceanographic Res. Papers 54, 951–974. doi: 10.1016/j.dsr.2007.02.007
Schmidtko S., Johnson G. C., Lyman J. M. (2013). Mimoc: A global monthly isopycnal upper-ocean climatology with mixed layers. J. Geophysical Research: Oceans 118, 1658–1672. doi: 10.1002/jgrc.20122
Seo S., Park Y.-G., Park J.-H., Jeong H.-D. (2015). Thorpe Scale analysis using CTD observations on the continental slope of the southwestern East Sea. Ocean Polar Res. 37, 107–117. doi: 10.4217/OPR.2015.37.2.107
Shiozaki T., Fujiwara A., Ijichi M., Harada N., Nishino S., Nishi S., et al. (2018). Diazotroph community structure and the role of nitrogen fixation in the nitrogen cycle in the chukchi Sea (western Arctic ocean). Limnol. Oceanogr. 63, 2191–2205. doi: 10.1002/lno.10933
Spreen G., Kaleschke L., Heygster G. (2008). Sea Ice remote sensing using AMSR-e 89-GHz channels. J. Geophysical Research: Oceans 113, C02S03. doi: 10.1029/2005JC003384
Stanley R., Kirkpatrick J., Cassar N., Barnett B., Bender M. (2010). Net community production and gross primary production rates in the western equatorial pacific. Global Biogeochem. Cycles 24, GB4001. doi: 10.1029/2009GB003651
Steele M., Ermold W., Zhang J. (2008). Arctic Ocean surface warming trends over the past 100 years. Geophysical Res. Lett. 35, L02614. doi: 10.1029/2007GL031651
Stroeve J., Notz D. (2018). Changing state of arctic sea ice across all seasons. Environ. Res. Lett. 13, 103001. doi: 10.1088/1748-9326/aade56
Takahashi T., Sutherland S., Wanninkhof R. (2009). Climatological mean and decadal change in surface ocean pCO2, and net sea-air CO2 flux over the global oceans. Deep-Sea Res. 56, 554–577. doi: 10.1016/j.dsr.2009.07.007
Talley L. D., Pickard G. L., Emery W. J., Swift J. H. (2011). Descriptive Physical Oceanography: An Introduction. sixth ed. (Boston: Academic Press).
Teeter L., Hamme R. C., Ianson D., Bianucci L. (2018). Accurate estimation of net community production from O2/Ar measurements. Global Biogeochem. Cycles 32, 1163–1181. doi: 10.1029/2017GB005874
Terhaar J., Lauerwald R., Regnier P., Gruber N., Bopp L. (2021). Around one third of current Arctic ocean primary production sustained by rivers and coastal erosion. Nat. Commun. 12, 169. doi: 10.1038/s41467-020-20470-z
Thorpe S. A. (1977). “Turbulence and mixing in a Scottish loch. philosophical transactions of the royal society of London,” in Series A, mathematical and physical sciences 286 (1334), 125–181. doi: 10.1098/rsta.1977.0112
Torres-Valdés S., Tsubouchi T., Bacon S., Naveira-Garabato A. C., Sanders R., McLaughlin F. A., et al. (2013). Export of nutrients from the Arctic ocean. J. Geophysical Research: Oceans 118, 1625–1644. doi: 10.1002/jgrc.20063
Tremblay J.-É., Anderson L. G., Matrai P., Coupel P., Bélanger S., Michel C., et al. (2015). Global and regional drivers of nutrient supply, primary production and CO2 drawdown in the changing Arctic ocean. Prog. Oceanogr. 139, 171–196. doi: 10.1016/j.pocean.2015.08.009
Tremblay J.É., Bélanger S., Barber D. G., Asplin M., Martin J., Darnis G., et al. (2011). Climate forcing multiplies biological productivity in the coastal arctic ocean. Geophysical Res. Lett. 38, L18604. doi: 10.1029/2011GL048825
Uchimiya M., Motegi C., Nishino S., Kawaguchi Y., Inoue J., Ogawa H., et al. (2016). Coupled response of bacterial production to a wind-induced fall phytoplankton bloom and sediment resuspension in the chukchi Sea shelf, Western Arctic ocean. Front. Mar. Sci. 3, 231. doi: 10.3389/fmars.2016.00231
Varela D. E., Crawford D. W., Wrohan I. A., Wyatt S. N., Carmack E. C. (2013). Pelagic primary productivity and upper ocean nutrient dynamics across subarctic and Arctic seas. J. Geophysical Research: Oceans 118, 7132–7152. doi: 10.1002/2013JC009211
Wanninkhof R. (2014). Relationship between wind speed and gas exchange over the ocean revisited. Limnol. Oceanogr.: Methods 12, 351–362. doi: 10.4319/lom.2014.12.351
Woodgate R. A., Aagaard K., Swift J. H., Falkner K. K., Smethie J. W.M. (2005). Pacific ventilation of the arctic ocean’s lower halocline by upwelling and diapycnal mixing over the continental margin. Geophysical Res. Lett. 32, L18609. doi: 10.1029/2005GL023999
Woodgate R. A., Aagaard K., Swift J. H., Smethie W. M. Jr., Falkner K. K. (2007). Atlantic Water circulation over the mendeleev ridge and chukchi borderland from thermohaline intrusions and water mass properties. J. Geophysical Research: Oceans 112, C02005. doi: 10.1029/2005JC003416
Woodgate R. A., Peralta-Ferriz C. (2021). Warming and freshening of the pacific inflow to the arctic from 1990-2019 implying dramatic shoaling in pacific winter water ventilation of the arctic water column. Geophysical Res. Lett. 48, e2021GL092528. doi: 10.1029/2021GL092528
Yasunaka S., Siswanto E., Olsen A., Hoppema M., Watanabe E., Fransson A., et al. (2018). Arctic Ocean CO2 uptake: an improved multiyear estimate of the air–sea CO2 flux incorporating chlorophyll a concentrations. Biogeosciences 15, 1643–1661. doi: 10.5194/bg-15-1643-2018
Yun M. S., Whitledge T. E., Stockwell D., Son S. H., Lee J. H., Park J. W., et al. (2016). Primary production in the chukchi Sea with potential effects of freshwater content. Biogeosciences 13, 737–749. doi: 10.5194/bg-13-737-2016
Keywords: net community production, Chukchi Sea, O2/Ar, nitrate flux, biological pump
Citation: Kwon S, Lee I, Park K, Cho K-H, Jung J, Park T, Lee Y, Jeon C, Seo S and Hahm D (2022) Summer net community production in the northern Chukchi Sea: Comparison between 2017 and 2020. Front. Mar. Sci. 9:1050791. doi: 10.3389/fmars.2022.1050791
Received: 22 September 2022; Accepted: 02 November 2022;
Published: 22 November 2022.
Edited by:
Carol Robinson, University of East Anglia, United KingdomReviewed by:
Isabel Seguro, University of East Anglia, United KingdomMatthew Buckley Alkire, University of Washington, United States
Copyright © 2022 Kwon, Lee, Park, Cho, Jung, Park, Lee, Jeon, Seo and Hahm. This is an open-access article distributed under the terms of the Creative Commons Attribution License (CC BY). The use, distribution or reproduction in other forums is permitted, provided the original author(s) and the copyright owner(s) are credited and that the original publication in this journal is cited, in accordance with accepted academic practice. No use, distribution or reproduction is permitted which does not comply with these terms.
*Correspondence: Doshik Hahm, aGFobUBwdXNhbi5hYy5rcg==