 Wenping He
 Mijuan Shi
 Xiao-Qin Xia
 Wanting Zhang2
- 1College of Fisheries, Southwest University, Key Laboratory of Freshwater Fish Reproduction and Development (Ministry of Education), Chongqing, China
- 2Institute of Hydrobiology, Chinese Academy of Sciences, Wuhan, China
- 3Department of Resource and Environment, Zhejiang Ocean University, Zhoushan, China
The goldstripe ponyfish is a small tropical economic fish in the Leiognathidae family. The genome of this fish was assembled as 24 chromosomes with a total length of 577.66 Mb and 54.81 Mb unanchored contigs using HiFi and Hi-C sequencing technologies. There are 256.7 Mb of repeat elements, which cover 40.59% of the genome, and 21,506 coding genes, which cover 47.68%. According to phylogenetic analysis, the goldstripe ponyfish is closely related to the Sillaginidae family’s Chinese sillago. The distance between goldstripe ponyfish and Chinese sillago in the hierarchical clustering of gene family contractions and expansions is also the shortest, indicating a similarity even greater than that between croakers of the same family (Sciaenidae). The goldstripe ponyfish and Chinese sillago share 25 identical contracted gene families, the majority of which are immune recognition receptors, such as innate immunity-related C-type lectin and butyrophilin families, as well as acquired immunity-related T-cell receptor region V and the surface glycoprotein CD4, implying that these two fishes’ immune systems may adopt similar evolutionary strategy at the genomic level. Additionally, the positively selected genes of the Chinese sillago and the goldstripe ponyfish were enriched in biological functions involved in the cell cycle, such as telomeres, which may account for the disparities in body size and lifespan between the two species.
1. Introduction
According to the conventional taxonomical classification by morphology, Perciformes includes 10,033 known species in 1,539 genera, 160 families, or 25 suborders, making it the order with the most species in ray-finned fish or even vertebrates (Chen and Zhang, 2015). These fishes vary in size and shape and are found in a wide range of aquatic environments, from marine to freshwater, boreal to tropical, and include many important farmed or ornamental fishes. In the new taxonomical classification, Perciformes was split into several different orders, and some species were moved out of Perciformes without any clear order affiliation (Betancur et al., 2017).
The evolutionary similarity of these species, which almost all belong to the clade “Acanthomorphate,” is unaffected by this taxonomic correction. These species are referred to in this work as “ex-perciforms” due of their simplicity and rigor. As an ex-perciform, the connection between Leiognathidae and Perciformes is currently under debate. This family is categorized as Chaetodontiformes in the NCBI taxonomy (Schoch et al., 2020), although it is categorized as Acanthuriformes in fishbase (Gill and Leis, 2019). Most of the 51 species in the Leiognathidae family are marine fishes, although there are a few freshwater species as well (Nelson, 1994). Fish in the Leiognathidae family are always tiny, omnivorous, and reproduce sexually. Leiognathidae species include the goldstripe ponyfish (Karalla daura), which is a valuable commercial fish (James, 1978).
The goldstripe ponyfish is a small tropical fish that lives in the Indo-shallow Pacific’s demersal zone and feeds on polychaetas, bivalves, small crustaceans, and sponges (Sommer et al., 1996). Other studies on this species are scarce (Qamar et al., 2017), with most focusing on its geographical distribution (Alavi-Yeganeh and Bahmani, 2018; Seth et al., 2020).
The goldstripe ponyfish chromosome level genome was assembled in our study, making it the first reference genome for Leiognathidea fishes. In order to investigate the evolutionary features of goldstripe ponyfish, comparative genomic analyses were performed with 8 published ex-perciform genomes, including gene family expansions and contractions and hierarchical clustering of these families, as well as positive selection analyses in different groups.
2. Materials and methods
2.1. Sampling, DNA and RNA extraction
On August 25, 2021, an adult fish was sampled from Naozhou island (Zhanjiang, China). The tissues from the muscle, liver, heart, brain, eyes, and gills were collected and flash-frozen in liquid nitrogen. The phenol-chloroform extraction method was used to extract genomic DNA from muscle, and the TRIzol extraction method was used to extract total RNA from other tissues (Life Technologies). Following concentration determination, equal amounts of RNA from each tissue were mixed and used in the construction of a transcriptome library.
2.2. Library construction and sequencing
After assessing the quality of the DNA with 1% agarose gel electrophoresis and the Qubit 3.0 analyzer (Thermo Fisher Scientific, USA), the genomic DNA was used to construct three libraries. The Illumina pair-end library, with 300-350 bp insertion, was sequenced using Illumina NovaSeq 6000 for goldstripe ponyfish genome size estimation and assembly sequence correction.
Unlike the standard Illumina DNA library, the DNA for the Hi-C library was not extracted directly from the muscle, but was subjected to a number of processes, including formaldehyde fixation and cross-linking, chromatin digestion with MboI, ligation of DNA ends and biotin labeling, enrichment and decrosslinking of biotin-linked fragments. The SMRTbell library was created for highly accurate long-read sequencing (HiFi sequencing) with a fragment size of 20 kb using an SMRTbell template preparation kit 1.0 (PacBio) and the manufacturer’s protocol. The library was sequenced using the PacBio Sequel II system, and data from one SMRT cell were generated.
2.3. Genome size estimation and assembly
The goldstripe ponyfish genome size, heterozygozity, and repetition were estimated using Illumina clean reads and k-mer (k=17) analysis (Liu et al., 2013). Hifiasm (version 0.16.1) (Cheng et al., 2021) was used to treat and assemble HiFi reads to generate genome contigs. Purge haplotigs (version 1.1.2) was used to remove alternative heterozygous contigs (Roach et al., 2018).
The contigs were assessed using two methods. Long reads were mapped to contigs using BLASR (version 5.3.3) (Chaisson and Tesler, 2012) and short reads were mapped using BWA-MEM (version 0.7.10) (Li and Durbin, 2010) with default parameters. To obtain valid interaction pairs, the Hi-C reads were mapped to the scaffolds with HiC-Pro (version 2.11.1) (Servant et al., 2015). Based on these pair-end reads, the contigs were divided, sorted, and oriented with LACHESIS (version 1.03) (Burton et al., 2013), and manually adjusted with Juicebox (version 1.5) (Durand et al., 2016). The genome was evaluated using BUSCO (version 2.0) (Simao et al., 2015) with the Actinopterygii database.
2.4. Genome structural and functional annotation
The two components of the structural annotation of the goldstripe ponyfish genome are the prediction of gene structure and the annotation of repetitive elements. The genome was compared to the Repbase database (https://www.girinst.org/repbase/) (Bao et al., 2015) to identify repeat elements based on sequence similarity using the RepeatMasker (version 4.0.7) and Repeat Protein Mask (version 4.1.0) programs (Tarailo-Graovac and Chen, 2009). The entire genome was searched for tandem repeat elements using Tandem Repeat Finder (version 4.09) (Benson, 1999), and LTR FINDER (version 1.0.2) (Xu and Wang, 2007) was used to do de novo repetitive element prediction.
Further, the combined library created using Piler, LTR FINDER, and Repeat Scout (version 1.0.6) (Price et al., 2005) was utilized to ab initio forecast the repeat components using Repeat Modeler (version 2.0) (Flynn et al., 2020). The Rfam (Kalvari et al., 2018) and miRBase (Kozomara et al., 2019) databases were used to predict ribosomal RNA and micro-RNA using Infernal (version 1.1) (Nawrocki and Eddy, 2013). TRNASCAN-SE (version 1.3.1) predicted transfer RNAs (Lowe and Eddy, 1997).
The soft-masked genome of the goldstripe ponyfish was used for gene prediction using three methods: ab initio gene prediction, alignment of homologous proteins, and transcriptome assembly and mapping. AUGUSTUS (version 2.7) (Stanke et al., 2006) and GENSCAN (Burge and Karlin, 1997) were used together for ab initio prediction with default parameters. The fishes used for homologous protein alignment are zebrafish (Danio rerio), copperband butterflyfish (Chelmon rostratus), torafugu (Takifugu rubripes), large yellow croacker (Larimichthys crocea) and honeycomb rockfish (Sebastes umbrosus), which include 2 ex-perciforms and represent 4 teleost orders. All the protein sequences of these five species were aligned to their respective genomes using TBLASTN (e-value ≤ 1e-5).
The result was then refined by GENEWISE (version 2.4.0) (Li et al., 2015) for more accurate alignments. The protein sequences of single copy genes in the BUSCO database were aligned to the genome using the same pipeline. The RNA-seq reads from 5 tissue mixtures were used for transcriptome assembly using the HISAT2 (version 2.0.10) (Pertea et al., 2016) for read mapping and StringTie (version 2.1.4) (Pertea et al., 2015) for transcript assembly. Maker (version 2.31.10) (Holt and Yandell, 2011) and HiCESAP (Wuhan Gooalgene Co., Ltd., https://www.gooalgene.com/) were used to combine all of the evidence to generate non-redundant structural annotation of protein-coding genes.
The functional annotation of predicted genes of goldstripe ponyfish was based on homologous comparison using BLAST tools (e-value ≤ 1e-5). SwissProt, InterPro, TrEMBL, and NR (NCBI) were utilized for protein alignments. All predicted transcript sequences were aligned to the database of Kyoto Encyclopedia of Genes and Genomes (KEGG) to obtain K number. Additionally, Blast2GO (version 5.2.5) annotated the Gene Ontology terms for each gene (Conesa et al., 2005).
2.5. Comparative genomic analyses
The comparative genomic analysis was performed with the genomes of 15 species, including 9 ex-perciforms, Nile tilapia (Oreochromis niloticus), northern snakehead (Channa argus), Chinese sillago (Sillago sinica), goldstripe ponyfish (K. daura), European perch (Perca fluviatilis), Japanese meagre (Nibea japonica), big head croaker (Collichthys lucidus), large yellow croaker (Larimichthys crocea) and largemouth bass (Micropterus salmoides). Humans, house mice, chicken, green anoles, tropical clawed frogs, and sea lampreys made up the remaining species. Based on the sequence similarity of whole-genome proteins across all species, we clustered genes into gene families using OrthoFinder (version 2.4.0) (Emms and Kelly, 2019).
To construct the phylogenetic tree, the protein sequences of the single-copy gene families were extracted. After aligning multiple sequences with MAFFT (version 7.471) (Katoh et al., 2009) and improving the alignments with Gblocks (version 0.91b) (Talavera and Castresana, 2007), the results were used to build a phylogenetic tree with 1,000 bootstraps using RAxML-NG (version 0.9.0) (Kozlov et al., 2019). r8s (version 1.8.1) (Sanderson, 2003) was used to calculate the divergence time using fossil evidence from the TimeTree database (http://www.timetree.org/) (Kumar et al., 2022).
Finally, EvolView (version 3) was used to create the Chronogram (Subramanian et al., 2019). Based on the chronogram, CAFÉ (version 4.2) (Han et al., 2013) was used for gene family expansion and contraction analysis, and CODEML of PAML (Yang, 2007) was used to calculate dN/dS and identify positive selection genes. The PANTHER database was used to annotate all gene families (Mi et al., 2019). The enrichment analysis was performed using TopGO (version 2.22.0) with exact fisher test (p-value<0.01).
3. Results
3.1. Characteristics evaluation of the K. daura genome
The k-mer frequency analysis was performed on 62.16Gb of Illumina data to estimate the genome size, proportion of repetitive sequences, and heterozygous ratio. The total number of k-mers obtained was 46,666,642,716 with a depth of 74 unique k-mers. According to the findings, the goldstripe ponyfish genome size was estimated to be 592 Mb, with the proportions of repetitive sequences and heterozygous sites being 32.51% and 0.73%, respectively.
3.2. Genome assembly and completeness assessment
Using circular consensus sequencing (CCS), a total of 1,958,565 HiFi reads, corresponding to 24.61 Gb bases (38.41X), were generated. The average length of the CCS reads was 12.56 Kb. Following the assembly of CCS reads and the removal of heterozygous contigs, a de novo genome with 916 contigs and a total length of 634.12 Mb was generated. The genome length was close to what k-mer analysis estimated.
The longest contig was 22.45Mb, and the contig N50 was 2.37Mb. The Illumina reads and HiFi reads were aligned to the contigs using bwa (version 0.6.2-r126) and minimap2 (version 2.17-r941), respectively, to check the consistency of the assembled contigs with the original reads. The mapping rate for short reads was 99.04%, and 99.69% for long reads.
The contigs were then anchored into chromosomes using the Hi-C scaffolding pipeline. 57.50% valid paired reads were obtained after filtering 69.95Gb Hi-C clean data. Based on valid pair interactions, 916 contigs were split into 1141 fragments, 901 of which (577.66 Mb total) were anchored into 24 chromosomes, leaving 54.8 Mb fragments. The final genome sequences were 632.47 Mb in size, which was slightly larger than the genome survey. The Hi-C heat map displayed the intensity of the interaction in each chromosome, indicating that the anchoring was of high quality (Figure 1A).
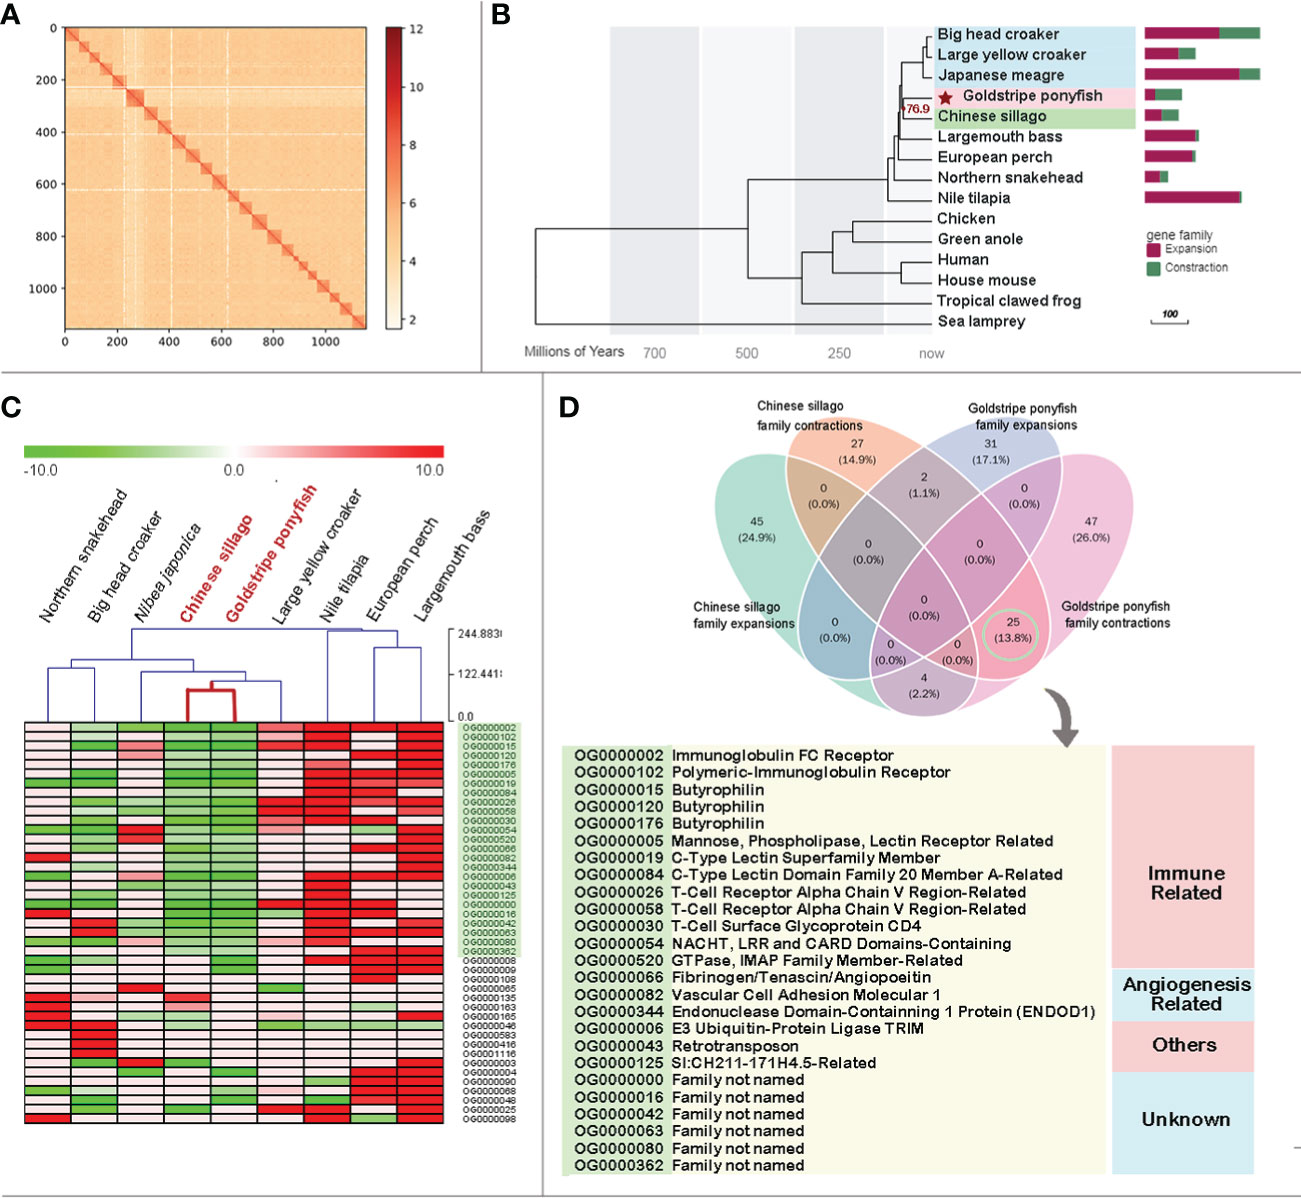
Figure 1 (A) The Hi-C contact matrix of goldstripe ponyfish genome. Only contigs anchored on chromosomes are shown in the plot. (B) A phylogenetic tree was constructed with 15 species, including 9 ex-perciforms. The bars depict the gene family contractions (green) and expansions (fuchsia) in each ex-perciform. The three families of marine ex-perciforms are distinguished by the light blue, pink, and light green underlay. The goldstripe ponyfish is identified by a red star. (C) The gene numbers of expanded and contracted gene families in the nine ex-perciforms were clustered hierarchically. Chinese sillago and goldstripe ponyfish, the two fish that are the most comparable, are highlighted in red. (D) The venn diagram shows gene family expansions and contractions in the Chinese sillago and the goldstripe ponyfish. The annotation of the shared family contractions between these two species is shown in the table. The family IDs are marked with a light green backdrop and exactly match the C family IDs that are also highlighted in the same hue.
The BUSCO analysis revealed that the goldstripe ponyfish genome was complete. The genome contained 94.3% complete BUSCO genes, with 92.9% single-copy BUSCOs and 1.4% duplicated BUSCOs.
3.3. Repeat annotation, gene structural and functional annotation
A total of 256.7 Mb of repetitive sequences were annotated using multiple methods, covering 40.59% of the genome. This proportion is also slightly higher than the genome survey result. DNAs (20.31%), LTR (10.81%), and LINE (5.93%) were the three types of repetitive elements that covered more than 5% of the genome.
We obtained 21,506 genes with an average length of 1.64 Kb using a combination of de novo, homology, and transcriptome-based methods. Only 5.99% of them had a single exon. These genes totaled 301.42 Mb in length, accounting for 47.68% of the genome. And 96.99% of them were annotated in public sequence databases. There were 821 miRNA, 2,537 tRNA, 3,074 rRNA, and 1,303 snRNA predicted for non-coding RNA, covering 0.14% of the genome in total.
3.4. The construction of phylogenetic tree and gene family analysis
The 15 species’ combined 330,481 genes were grouped into 21,851 gene families. 7,114 gene families were shared by all fifteen species, 1,757 of which were single-copy families. The genes from all single-copy families were used to construct a phylogenetic tree with a bootstrap value of 100% for each clade.
All the sciaenid fishes, including big head croaker, large yellow croaker and Japanese meagre, are clustered in one clade. The Chinese sillago and the goldstripe ponyfish are closely related and only separated about 76.9 million years ago (Figure 1B). Among the nine ex-perciforms, the goldstripe ponyfish has the highest proportion of contracted families (69.72%) and the lowest proportion of expanded families (Table S1). In total, 823 gene families expanded or contracted in the 9 ex-perciforms. The phylogenetic tree was partially consistent with the results of hierarchical clustering using the number of genes with changes in these families. The goldstripe ponyfish and Chinese sillago were still closely gathered. We examined the consistency of these two fishes’ expansions and contractions. They had very different expanded families, but they shared 25 contracted families (Figure 1D Venndiagram). With the exception of six unknown gene families, 13 of the remaining 19 contracted families were immune-related, while three were angiogenesis-related (Figure 1D).
3.5. Analysis of positive and negative selected genes
The dN/dS values of single-copy genes in 9 ex-perciforms, 3 croakers, and Chinese sillago vs. goldstripe ponyfish were calculated respectively. There were 4,382 single-copy gene families in the 9 ex-perciforms, and the frequency distribution of dN/dS values for these genes was two bell curves, both deviating from one, with one distribution peaking at 0.6 and the other at 1.7 (Figure 2A2).
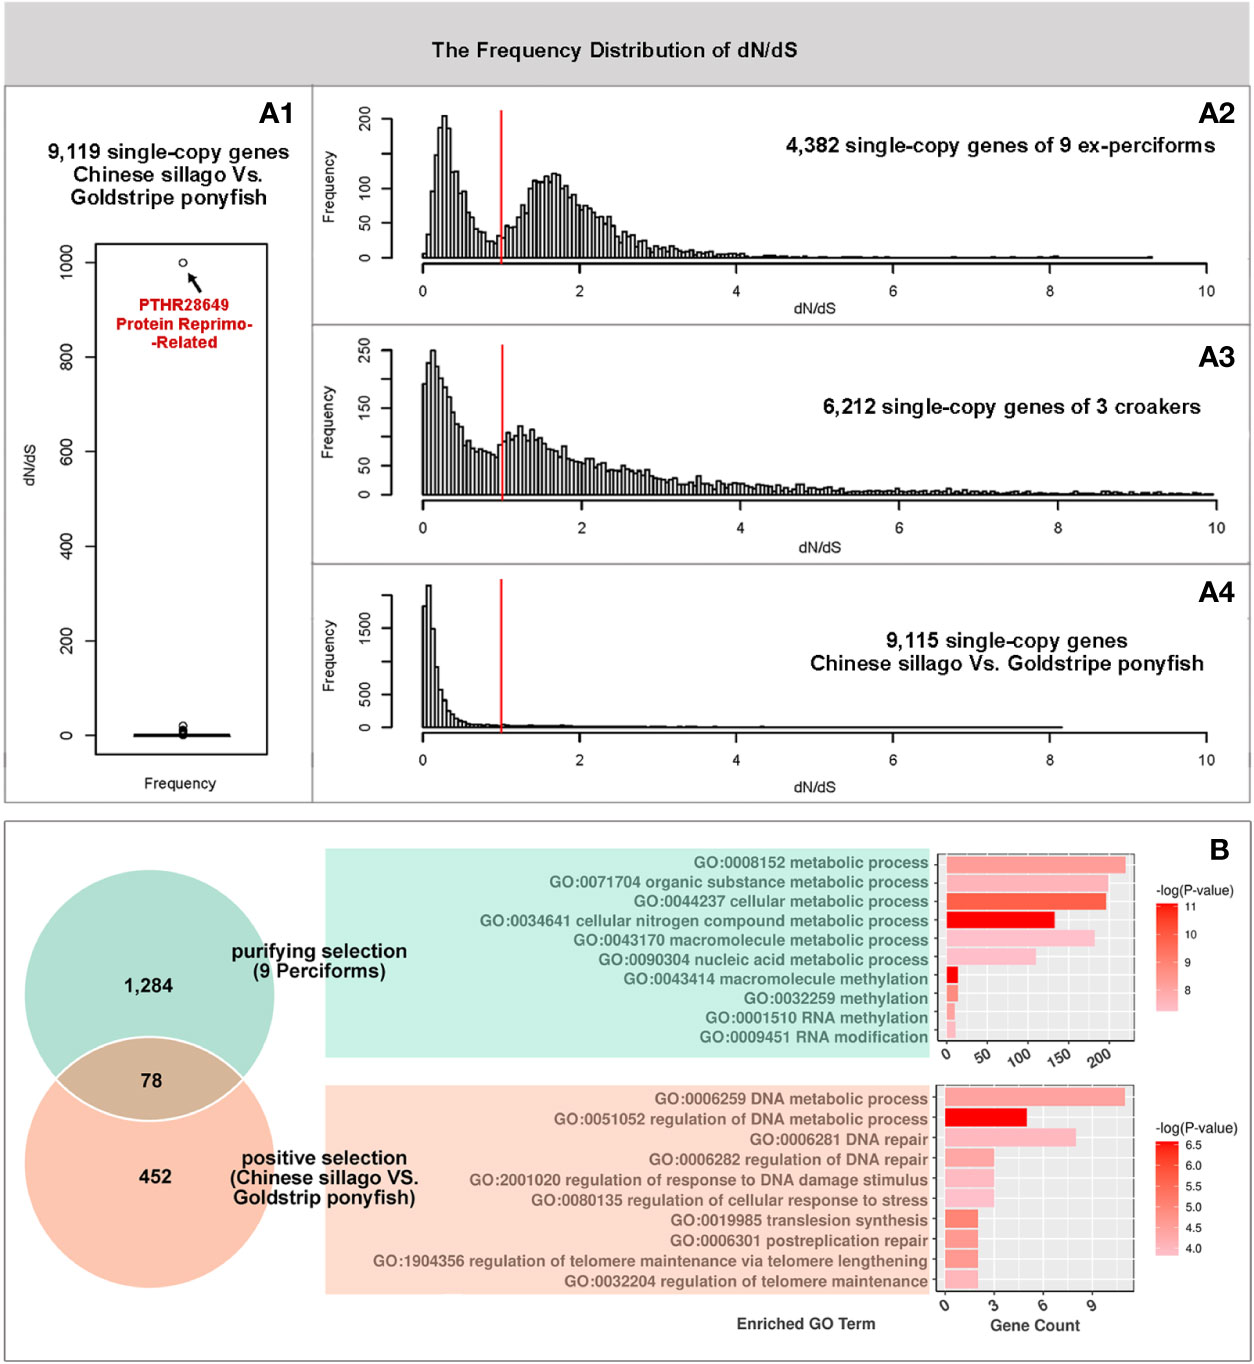
Figure 2 The analysis of positive selected genes. A1 Boxplot of dN/dS values in goldstripe ponyfish and Chinese sillago single-copy genes. A2-A4. The frequency distribution of dN/dS in nine ex-perciforms, three croakers, and goldstripe ponyfish vs. Chinese sillago. (B) The venn diagram depicts the purifying selected genes in the nine ex-perciforms as well as the positive selected genes in the goldstripe ponyfish and Chinese sillago. The bars depict the enrichment analysis of both gene groups. The fact that the Venn diagram and bar plot have the same background colors indicates that the same gene set was used.
There were 6,503 single-copy gene families shared by three croakers; excluding 291 with dN/dS values greater than 10, the dN/dS frequency distribution of the remaining genes had two peaks around 0.15 and 1.25 (Figure 2A3). There were 9,119 single-copy gene families found in goldstripe ponyfish and Chinese sillago. With the exception of one gene family with an extreme outlier dN/dS value of 999, functionally annotated as protein reprimo-related, and three other gene families with dN/dS values ranging from 10 to 20 (Figure 2A1), the dN/dS values of the remaining 9,115 gene families were all around 0.1 (Figure 2A4).
In total we found 1,359 gene families under purifying selection in the 9 ex-perciforms and 530 positive selected gene families in the genome comparison of goldstripe ponyfish and Chinese sillago. The intersection of these two gene sets was only 78 gene families. Furthermore, the enriched GO terms of purifying selected genes in 9 ex-perciforms were primarily related to macromolecular metabolism, particularly RNA methylation. In contrast, the positive selected genes in Chinese sillago vs. goldstripe ponyfish were almost entirely related to DNA metabolism, repairing, and, in particular, telomere regulation.
4. Discussion
The ex-perciforms, the largest order of ray-finned fish, vary in size and shape and are found in a variety of water environments, including marine and freshwater. The nine ex-perciforms studied belong to seven families, with four of them being freshwater species found in temperate, subtropical, and tropical regions (Table 1). (Froese and Pauly, 2000). Our phylogenetic tree showed that all the five marine ex-perciforms were clustered into a single branch, while freshwater ex-perciforms were scattered at other nodes that appeared earlier (Figure 1B). This clustering suggests that marine ex-perciforms have a later single origin than their freshwater counterparts. Based on the hypothesis that almost all marine ray-finned fishes originated from freshwater species (Vega and Wiens, 2012), we speculate that the common ancestor of all ex-perciforms lived in freshwater, forming many ancestral ex-perciform species in highly diverse and segregated freshwater environments, and then one of them entered the oceans, thus evolving into various marine ex-perciforms. Of course, more evidences, including comparative genomic analyses of a wider range of ex-perciforms, are needed to support this hypothesis.
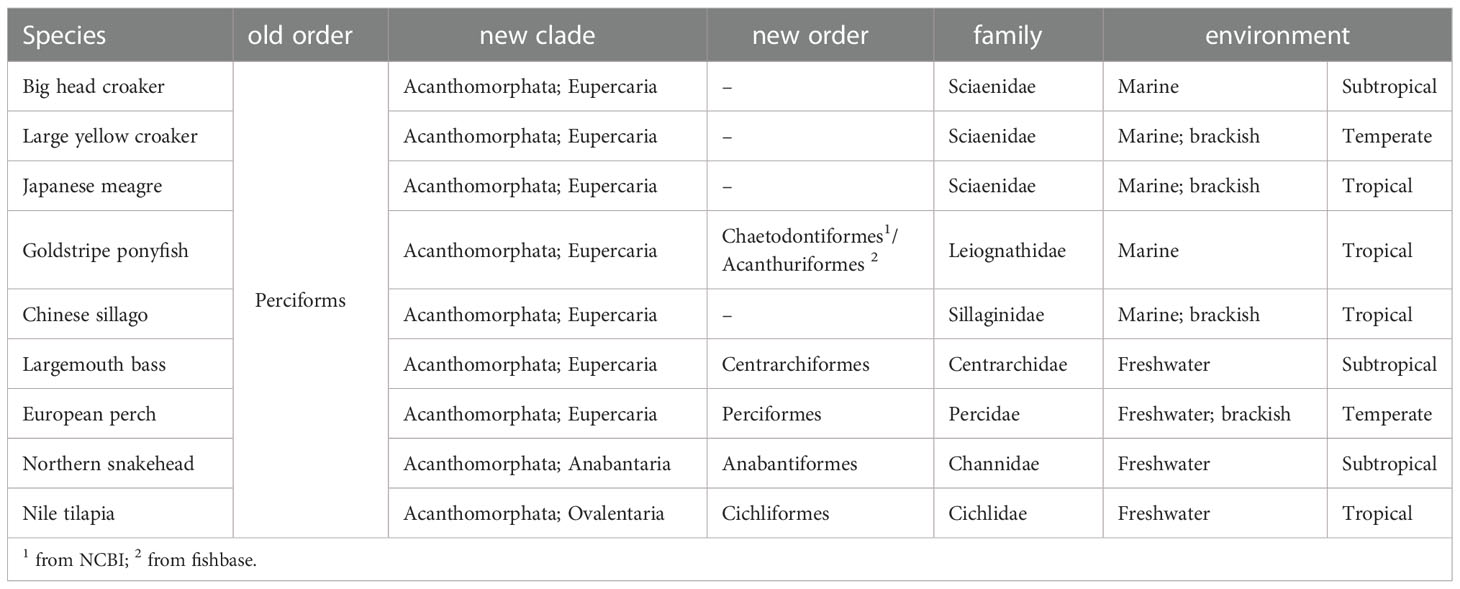
Table 1 Info of 9 Ex-perciforms.
According to the positions of the sciaenids in the phylogenetic tree, the temperate and subtropical species were more closely related, while the tropical fish, Japanese meagre, was less related. Of the four freshwater ex-perciforms, the tropical fish (Nile tilapia) is also located in an earlier clade than the other three temperate and subtropical species (Figure 1B). The distinctions of tropical ex-perciforms may provide clues for studying the effects of climatic zones or temperatures on species differentiation.
Many genes in the nine species are under positive selection at the molecular level to improve adaptation to diverse habitats. The presence of a normal-like curve with a peak of 1.7 in the frequency statistics of dN/dS value for single-copy genes in the 9 ex-perciforms supported this (Figure 2 A2). However, a significant proportion of genes were subjected to negative selection, implying that non-synonymous mutations in these genes were eliminated, indicating the conservation of these genes in ex-perciforms. These purifying genes were found to be more abundant in basic metabolic processes, particularly RNA methylation. In our study, the purifying gene families involved in RNA methylation were mostly associated with tRNA (Pan, 2018) and rRNA methylation (Decatur and Fournier, 2002).
Furthermore, the frequency distribution curves depicted in Figure 2, A3 and 2A4 showed a relationship between the selected type and degree of fish genes and the similarity of their environments rather than an evolutionary relationship. Big head croaker, giant yellow croaker, and Japanese meagre are all members of the Sciaenidae family. The proportion of positive selected genes in these species (52.77%) is substantially larger than that in Chinese sillago and the goldstripe ponyfish (5.81%). Since all three croakers are oceanodromous fish, a number of positively selected genes may be related to the range of migratory patterns they exhibit, which give rise to diverse species through natural selection. However, although coming from separate families, both the Chinese sillago and the goldstripe ponyfish are tropical benthopelagic fish that appeared in the South China Sea’s shallow waters (Xu et al., 2018).
Aside from the large number of purifying selected genes, the consistency of the contracted gene families supported the idea that the goldstripe ponyfish and Chinese sillago are likely under the same environmental stresses and have evolved very similar adaptation strategies. The goldstripe ponyfish and Chinese sillago were grouped into one branch in the hierarchical clustering based on gene numbers in all 821 gene family expansions and contractions of the 9 ex-perciforms, and their gene family similarity was higher than that of any other fish pair, including any two croakers (Figure 1C). There were no shared expanded gene families between goldstripe ponyfish and Chinese sillago, but both had 25 same contracted gene families.
It is worth noting that, due to the high heterozygosity of our sequenced sample, the final assembly genome was slightly larger than the survey estimation, most likely due to the incomplete distinction of heterozygous alleles during assembly, which could have an adverse effect on the analysis of gene family expansions. In fact, using heterozygous samples for genome sequencing and assembly always carries the risk of producing “false positive” expanded gene families and “false negative” contractions of gene families. However, in our study, all shared families were contractions, indicating the authenticity and dependability of this phenomenon (Figure 1D).
Except for the six families that lacked annotation, the majority of the remaining 25 shared contracted gene families were associated with immunity and angiogenesis. The shared immune-related gene families included receptor-related genes from both innate and acquired immunity. The gene families associated with innated immunity included C-type lectin (Weis et al., 1998; Kanjanapruthipong et al., 2022), an important pattern recognition receptor, and butyrophilin, which is involved in T-cell γδ activation (Nielsen et al., 2017; Uldrich et al., 2020). The immunoglobulin receptor, the V region of the T-cell receptor (Bassing et al., 2002), and the CD4 glycoprotein (Leahy, 1995) are all members of the acquired immunity gene families. Given the strong link between angiogenesis and immunity (Frantz et al., 2005; Trenti et al., 2018), it was assumed that both goldstripe ponyfish and Chinese sillago had a weakened ability to recognize exogenous invasions, implying that these two fishes either had other defensive strategies for pathogenic invasion, or that they lived in an environment with a fixed pathogenic composition, and the weakened immune function saved energy for survival.
Apart from evolutionary similarities, there were some evolutionary differences between goldstripe ponyfish and Chinese sillago, which were reflected in the analysis of positive selected genes. The dN/dS value of the Reprimo-related protein was abnormally high (999) among the 530 positive selected genes, due to the absence of synonymous mutations in this gene of two species. Reprimo is a cytoplasmic glycoprotein that acts as a downstream effector of p53-dependent G2 arrest to regulate cell cycle duration (Ohki et al., 2000). While the GO enrichment of the positive selected genes revealed that the DNA metabolic processes, particularly the telomere related GO terms, were significantly enriched, this suggests that both the cell cycle duration and the cell division times are different between goldstripe ponyfish and Chinese sillago (Harley, 1991). The Chinese sillago is approximately 17 cm long and lives for approximately 7 years, whereas the goldstripe ponyfish is approximately 9 cm long and lives for less than 3 years. A shorter lifespan is always associated with faster development and sexual maturation, as well as a smaller body size (Bodnar et al., 1998; Jiang et al., 2007; Monaghan and Ozanne, 2018). All of these characteristics can be obtained by shortening the cell cycle, for example, by shortening the cell arrest phase and reducing cell division times, the genes associated with which have undergone positive selection and are enriched between the two species.
Based on the comparative genomic analysis, we speculate that there was an evolutionary process of the ex-perciforms from freshwater to seawater, although more evidences and in-deep analyses are needed to support this hypothesis. In addition, we found that goldstripe ponyfish and Chinese sillago share a number of immune-related contracted gene families, which makes these two fishes potential target species for fish immunological studies. Finally, it should be mentioned that the differences in telomere regulated genes between the two species deserve further investigation and experimental verification.
Data availability statement
The genome assembly was deposited in the National Center for Biotechnology Information (NCBI) database (BioProject: PRJNA876083) and all raw sequencing data were deposited in the Genome Sequence Archive (GSA: CRA007930) at National Genomics Data Center (CNCB-NGDC Members and Partners, 2022).
Ethics statement
The animal study was reviewed and approved by Institutional Animal Care and Use Committee of Southwest University.
Author contributions
WH and TG designed the experiments and carried them out, and revised the initial text of the paper. MS wrote the study, did data analysis, and data visualization. X-QX polished papers and directed data analysis. Data administration was done by WZ, conception and supervision by WY. All authors contributed to the article and approved the submitted version.
Funding
This study was supported by National Natural Science Foundation of China (32071651), Chongqing Municipal Natural Science Foundation (cstc2020jcyj-msxmX0438), the Earmarked Fund for CARS (CARS-49), and Zhejiang Provincial Key Research and Development Programme (2021C02047).
Acknowledgments
We would like to thank the Wuhan Branch, Supercomputing Center, Chinese Academy of Sciences and Qi Liu of the OneMore Tech company with computation in this work.
Conflict of interest
The authors declare that the research was conducted in the absence of any commercial or financial relationships that could be construed as a potential conflict of interest.
Publisher’s note
All claims expressed in this article are solely those of the authors and do not necessarily represent those of their affiliated organizations, or those of the publisher, the editors and the reviewers. Any product that may be evaluated in this article, or claim that may be made by its manufacturer, is not guaranteed or endorsed by the publisher.
Supplementary material
The Supplementary Material for this article can be found online at: https://www.frontiersin.org/articles/10.3389/fmars.2022.1049138/full#supplementary-material
References
Alavi-Yeganeh M. S., Bahmani G. (2018). First record of goldstripe ponyfish, karalla daura (Cuvier 1829) (Perciformes: Leiognathidae) from the Iranian coast of the Oman Sea. Acta Zool. Bulgarica. 70 (1), 121–124.
Bao W., Kojima K. K., Kohany O. (2015). Repbase update, a database of repetitive elements in eukaryotic genomes. Mob. DNA 6, 11. doi: 10.1186/s13100-015-0041-9
Bassing C. H., Swat W., Alt F. W. (2002). The mechanism and regulation of chromosomal V(D)J recombination. Cell 109, S45–S55. doi: 10.1016/S0092-8674(02)00675-X
Benson G. (1999). Tandem repeats finder: a program to analyze DNA sequences. Nucleic Acids Res. 27 (2), 573–580. doi: 10.1093/nar/27.2.573
Betancur R. R., Wiley E. O., Arratia G., Acero A., Bailly N., Miya M., et al. (2017). Phylogenetic classification of bony fishes. BMC Evol. Biol. 17 (1), 162. doi: 10.1186/s12862-017-0958-3
Bodnar A. G., Ouellette M., Frolkis M., Holt S. E., Chiu C. P., Morin G. B., et al. (1998). Extension of life-span by introduction of telomerase into normal human cells. Science 279 (5349), 349–352. doi: 10.1126/science.279.5349.349
Burge C., Karlin S. (1997). Prediction of complete gene structures in human genomic DNA. J. Mol. Biol. 268 (1), 78–94. doi: 10.1006/jmbi.1997.0951
Burton J. N., Adey A., Patwardhan R. P., Qiu R. L., Kitzman J. O., Shendure J. (2013). Chromosome-scale scaffolding of de novo genome assemblies based on chromatin interactions. Nat. Biotechnol. 31 (12), 1119–111+. doi: 10.1038/nbt.2727
Chaisson M. J., Tesler G. (2012). Mapping single molecule sequencing reads using basic local alignment with successive refinement (BLASR): application and theory. BMC Bioinf. 13:238. doi: 10.1186/1471-2105-13-238
Cheng H. Y., Concepcion G. T., Feng X. W., Zhang H. W., Li H. (2021). Haplotype-resolved de novo assembly using phased assembly graphs with hifiasm. Nat. Methods 18 (2), 170–17+. doi: 10.1038/s41592-020-01056-5
Chen D., Zhang M. (2015). Marine fishes of China [in chinese]. 1st ed (Qindao: China Ocean university press).
CNCB-NGDC Members and Partners. (2022). Database resources of the national genomics data center, China national center for bioinformation in 2022. Nucleic Acids Res. 50 (D1), D27–D38. doi: 10.1093/nar/gkab951
Conesa A., Gotz S., Garcia-Gomez J. M., Terol J., Talon M., Robles M. (2005). Blast2GO: a universal tool for annotation, visualization and analysis in functional genomics research. Bioinformatics 21 (18), 3674–3676. doi: 10.1093/bioinformatics/bti610
Decatur W. A., Fournier M. J. (2002). rRNA modifications and ribosome function. Trends Biochem. Sci. 27 (7), 344–351. doi: 10.1016/S0968-0004(02)02109-6
Durand N. C., Robinson J. T., Shamim M. S., Machol I., Mesirov J. P., Lander E. S., et al. (2016). Juicebox provides a visualization system for Hi-c contact maps with unlimited zoom. Cell Syst. 3 (1), 99–101. doi: 10.1016/j.cels.2015.07.012
Emms D. M., Kelly S. (2019). OrthoFinder: phylogenetic orthology inference for comparative genomics. Genome Biol. 20 (1):238. doi: 10.1186/s13059-019-1832-y
Flynn J. M., Hubley R., Goubert C., Rosen J., Clark A. G., Feschotte C., et al. (2020). RepeatModeler2 for automated genomic discovery of transposable element families. Proc. Natl. Acad. Sci. United. States America 117 (17), 9451–9457. doi: 10.1073/pnas.1921046117
Frantz S., Vincent K. A., Feron O., Kelly R. A. (2005). Innate immunity and angiogenesis. Circ. Res. 96 (1), 15–26. doi: 10.1161/01.RES.0000153188.68898.ac
Froese R., Pauly D. (2000). “International center for living aquatic resources management,” in FishBase a global information system on fishes (Makati City, Philippines: FishBase).
Gill A. C., Leis J. M. (2019). Phylogenetic position of the fish genera lobotes, datnioides and hapalogenys, with a reappraisal of acanthuriform composition and relationships based on adult and larval morphology. Zootaxa 4680 (1), zootaxa.4680.1.1. doi: 10.11646/zootaxa.4680.1.1
Han M. V., Thomas G. W. C., Lugo-Martinez J., Hahn M. W. (2013). Estimating gene gain and loss rates in the presence of error in genome assembly and annotation using CAFE 3. Mol. Biol. Evol. 30 (8), 1987–1997. doi: 10.1093/molbev/mst100
Harley C. B. (1991). Telomere loss - mitotic clock or genetic time bomb. Mutat. Res. 256 (2-6), 271–282. doi: 10.1016/0921-8734(91)90018-7
Holt C., Yandell M. (2011). MAKER2: an annotation pipeline and genome-database management tool for second-generation genome projects. BMC Bioinf. 12:491. doi: 10.1186/1471-2105-12-491
James P. S. B. R. (1978). A systematic review of the fishes of the family leiognathidae. J. Mar. Biol. Assoc. India. 17 (1), 138–172.
Jiang H., Ju Z., Rudolph K. L. (2007). Telomere shortening and ageing. Z. Fur. Gerontol. Und Geriatrie. 40 (5), 314–324. doi: 10.1007/s00391-007-0480-0
Kalvari I., Argasinska J., Quinones-Olvera N., Nawrocki E. P., Rivas E., Eddy S. R., et al. (2018). Rfam 13.0: shifting to a genome-centric resource for non-coding RNA families. Nucleic Acids Res. 46 (D1), D335–D342. doi: 10.1093/nar/gkx1038
Kanjanapruthipong T., Sukphopetch P., Reamtong O., Isarangkul D., Muangkaew W., Thiangtrongjit T., et al. (2022). Cytoskeletal alteration is an early cellular response in pulmonary epithelium infected with aspergillus fumigatus rather than scedosporium apiospermum. Microbial. Ecol. 83 (1), 216–235. doi: 10.1007/s00248-021-01750-7
Katoh K., Asimenos G., Toh H. (2009). Multiple alignment of DNA sequences with MAFFT. Methods Mol. Biol. 537, 39–64. doi: 10.1007/978-1-59745-251-9_3
Kozlov A. M., Darriba D., Flouri T., Morel B., Stamatakis A. (2019). RAxML-NG: a fast, scalable and user-friendly tool for maximum likelihood phylogenetic inference. Bioinformatics 35 (21), 4453–4455. doi: 10.1093/bioinformatics/btz305
Kozomara A., Birgaoanu M., Griffiths-Jones S. (2019). miRBase: from microRNA sequences to function. Nucleic Acids Res. 47 (D1), D155–D162. doi: 10.1093/nar/gky1141
Kumar S., Suleski M., Craig J. M., Kasprowicz A. E., Sanderford M., Li M., et al. (2022). TimeTree 5: An expanded resource for species divergence times. Mol. Biol. Evol, 39(8), msac174. doi: 10.1093/molbev/msac174
Leahy D. J. (1995). A structural view of CD4 and CD8. FASEB J. 9 (1), 17–25. doi: 10.1096/fasebj.9.1.7821755
Li W. Z., Cowley A., Uludag M., Gur T., Mcwilliam H., Squizzato S., et al. (2015). The EMBL-EBI bioinformatics web and programmatic tools framework. Nucleic Acids Res. 43 (W1), W580–W584. doi: 10.1093/nar/gkv279
Li H., Durbin R. (2010). Fast and accurate long-read alignment with burrows-wheeler transform. Bioinformatics 26 (5), 589–595. doi: 10.1093/bioinformatics/btp698
Liu B., Shi Y., Yuan J., Hu X., Zhang H., Li N., et al. (2013). Estimation of genomic characteristics by analyzing k-mer frequency in de novo genome projects. ArXiv 1308, 2012v1301. doi: 10.48550/arXiv.1308.2012
Lowe T. M., Eddy S. R. (1997). tRNAscan-SE: A program for improved detection of transfer RNA genes in genomic sequence. Nucleic Acids Res. 25 (5), 955–964. doi: 10.1093/nar/25.5.955
Mi H. Y., Muruganujan A., Ebert D., Huang X. S., Thomas P. D. (2019). PANTHER version 14: more genomes, a new PANTHER GO-slim and improvements in enrichment analysis tools. Nucleic Acids Res. 47 (D1), D419–D426. doi: 10.1093/nar/gky1038
Monaghan P., Ozanne S. E. (2018). Somatic growth and telomere dynamics in vertebrates: relationships, mechanisms and consequences. Philos. Trans. R. Soc. B-Biol. Sci. 373 (1741):20160446. doi: 10.1098/rstb.2016.0446
Nawrocki E. P., Eddy S. R. (2013). Infernal 1.1: 100-fold faster RNA homology searches. Bioinformatics 29 (22), 2933–2935. doi: 10.1093/bioinformatics/btt5091
Nielsen M. M., Witherden D. A., Havran W. L. (2017). Gamma delta T cells in homeostasis and host defence of epithelial barrier tissues. Nat. Rev. Immunol. 17 (12), 733–745. doi: 10.1038/nri.2017.101
Ohki R., Nemoto J., Murasawa H., Oda E., Inazawa J., Tanaka N., et al. (2000). Reprimo, a new candidate mediator of the p53-mediated cell cycle arrest at the G(2) phase. J. Biol. Chem. 275 (30), 22627–22630. doi: 10.1074/jbc.C000235200
Pan T. (2018). Modifications and functional genomics of human transfer RNA. Cell Res. 28 (4), 395–404. doi: 10.1038/s41422-018-0013-y
Pertea M., Kim D., Pertea G. M., Leek J. T., Salzberg S. L. (2016). Transcript-level expression analysis of RNA-seq experiments with HISAT, StringTie and ballgown. Nat. Protoc. 11 (9), 1650–1667. doi: 10.1038/nprot.2016.095
Pertea M., Pertea G. M., Antonescu C. M., Chang T. C., Mendell J. T., Salzberg S. L. (2015). StringTie enables improved reconstruction of a transcriptome from RNA-seq reads. Nat. Biotechnol. 33 (3), 290–295. doi: 10.1038/nbt.3122
Price A. L., Jones N. C., Pevzner P. A. (2005). De novo identification of repeat families in large genomes. Bioinformatics 21, I351–I358. doi: 10.1093/bioinformatics/bti1018
Qamar N., Farooq N., Panhwar S. K., Waryani B. (2017). Length weight relationships estimated for eight ponyfishes (Teleostei: Leiognathidae) from the northern Arabian Sea coast. Iranian. J. Ichthyol. 4 (4), 384–387. doi: 10.22034/iji.v4i4.247
Roach M. J., Schmidt S. A., Borneman A. R. (2018). Purge haplotigs: allelic contig reassignment for third-gen diploid genome assemblies. BMC Bioinf. 19:460. doi: 10.1186/s12859-018-2485-7
Sanderson M. J. (2003). r8s: inferring absolute rates of molecular evolution and divergence times in the absence of a molecular clock. Bioinformatics 19 (2), 301–302. doi: 10.1093/bioinformatics/19.2.301
Schoch C. L., Ciufo S., Domrachev M., Hotton C. L., Kannan S., Khovanskaya R., et al. (2020). NCBI taxonomy: a comprehensive update on curation, resources and tools. Database-the. J. Biol. Database Curation, 2020, baaa062. doi: 10.1093/database/baaa062
Servant N., Varoquaux N., Lajoie B. R., Viara E., Chen C. J., Vert J. P., et al. (2015). HiC-pro: an optimized and flexible pipeline for Hi-c data processing. Genome Biol. 16:259. doi: 10.1186/s13059-015-0831-x
Seth J. K., Behera A. K., Mohanty S. R., Mohapatra A. (2020). Extension of host range for anilocra dimidiata, nerocila sigani and first record of nerocila depressa (Isopod: Cymothiod) from odisha coast, India. Indian J. Geo-Marine. Sci. 49 (8), 1498–1500.
Simao F. A., Waterhouse R. M., Ioannidis P., Kriventseva E. V., Zdobnov E. M. (2015). BUSCO: assessing genome assembly and annotation completeness with single-copy orthologs. Bioinformatics 31 (19), 3210–3212. doi: 10.1093/bioinformatics/btv351
Sommer C., Schneider W., Poutiers J.-M. (1996). “Food and agriculture organization of the united nations,” in The living marine resources of Somalia (Rome: Food and Agriculture Organization of the United Nations).
Stanke M., Keller O., Gunduz I., Hayes A., Waack S., Morgenstern B. (2006). AUGUSTUS: ab initio prediction of alternative transcripts. Nucleic Acids Res. 34, W435–W439. doi: 10.1093/nar/gkl200
Subramanian B., Gao S. H., Lercher M. J., Hu S. N., Chen W. H. (2019). Evolview v3: a webserver for visualization, annotation, and management of phylogenetic trees. Nucleic Acids Res. 47 (W1), W270–W275. doi: 10.1093/nar/gkz357
Talavera G., Castresana J. (2007). Improvement of phylogenies after removing divergent and ambiguously aligned blocks from protein sequence alignments. Syst. Biol. 56 (4), 564–577. doi: 10.1080/10635150701472164
Tarailo-Graovac M., Chen N. (2009). Using RepeatMasker to identify repetitive elements in genomic sequences. Curr. Protoc. Bioinf. 25 (1), 4.10.11–14.10.14. doi: 10.1002/0471250953.bi0410s25
Trenti A., Tedesco S., Boscaro C., Trevisi L., Bolego C., Cignarella A. (2018). Estrogen, angiogenesis, immunity and cell metabolism: Solving the puzzle. Int. J. Mol. Sci. 19 (3), 859. doi: 10.3390/ijms19030859
Uldrich A. P., Rigau M., Godfrey D. I. (2020). Immune recognition of phosphoantigen-butyrophilin molecular complexes by gamma delta T cells. Immunol. Rev. 298 (1), 74–83. doi: 10.1111/imr.12923
Vega G. C., Wiens J. J. (2012). Why are there so few fish in the sea? Proc. R. Soc. B-Biol. Sci. 279 (1737), 2323–2329. doi: 10.1098/rspb.2012.0075
Weis W. I., Taylor M. E., Drickamer K. (1998). The c-type lectin superfamily in the immune system. Immunol. Rev. 163, 19–34. doi: 10.1111/j.1600-065X.1998.tb01185.x
Xu Z., Wang H. (2007). LTR_FINDER: an efficient tool for the prediction of full-length LTR retrotransposons. Nucleic Acids Res. 35, W265–W268. doi: 10.1093/nar/gkm286
Xu S. Y., Xiao S. J., Zhu S. L., Zeng X. F., Luo J., Liu J. Q., et al. (2018). A draft genome assembly of the Chinese sillago (Sillago sinica), the first reference genome for sillaginidae fishes. Gigascience 7 (9), giy108. doi: 10.1093/gigascience/giy108
Keywords: chromosomal-level genome, Chinese sillago, convergent evolution, immunity, goldstripe ponyfish
Citation: He W, Shi M, Xia X-Q, Zhang W, Yao W and Gao T (2022) The chromosome-level genome assembly of goldstripe ponyfish (Karalla daura) reveals its similarity to Chinese sillago on contracted immune gene families. Front. Mar. Sci. 9:1049138. doi: 10.3389/fmars.2022.1049138
Received: 20 September 2022; Accepted: 08 December 2022;
Published: 23 December 2022.
Edited by:
Xiaotong Wang, Ludong University, ChinaReviewed by:
Xidong Mu, Pearl River Fisheries Research Institute (CAFS), ChinaDavid Hillis, University of California, Riverside, United States
Copyright © 2022 He, Shi, Xia, Zhang, Yao and Gao. This is an open-access article distributed under the terms of the Creative Commons Attribution License (CC BY). The use, distribution or reproduction in other forums is permitted, provided the original author(s) and the copyright owner(s) are credited and that the original publication in this journal is cited, in accordance with accepted academic practice. No use, distribution or reproduction is permitted which does not comply with these terms.
*Correspondence: Tianxiang Gao, Z2FvdGlhbnhpYW5nMDYxMUB6am91LmVkdS5jbg==
†These authors have contributed equally to this work