 Yingmin Yi1,2
 Yuxing Li
 Junxian Wu
- 1School of Automation and Information Engineering, Xi’an University of Technology, Xi’an, China
- 2Shaanxi Key Laboratory of Complex System Control and Intelligent Information Processing, Xi’an University of Technology, Xi’an, China
Permutation Lempel-Ziv complexity (PLZC) is a recently proposed method for analyzing signal complexity. However, PLZC only characterizes the signal complexity from single scale and has certain limitations. In order to overcome these shortcomings and improve the performance of feature extraction for underwater acoustic signal, this paper introduced coarse graining operation, proposed the multi-scale permutation Lempel-Ziv complexity (MPLZC), and proposed an automatic hybrid multi-feature extraction method for ship-radiated noise signal (S-S) based on multi-scale Lempel-Ziv complexity (MLZC), multi-scale permutation entropy (MPE) and MPLZC. The results of simulation and realistic experiments show that MPLZC can better reflect the change of signal complexity in detecting the dynamic change of signals, and more effectively distinguish white noise, pink noise and blue noise than MPE and MLZC; compared with the three feature extraction methods based on MLZC, MPE and MPLZC respectively, the proposed method has the highest recognition rates of six S-Ss under the same number of features, and the recognition rate reaches 100% when the number of features is 5; the introduction of MPLZC significantly improves the performance for ship-radiated noise signal of the automatic hybrid multi-feature extraction method. It is indicated that the proposed method, as a new underwater acoustic technology, is valid in other underwater acoustic signals.
Introduction
Nonlinear dynamics index is a powerful metric for analyzing signals with non-stationary, non-Gaussian and non-linear characteristics. Among them, the nonlinear dynamic indexes based on entropy and Lempel-Ziv complexity (LZC) are effective, which have been widely used in underwater acoustic signal processing, fault diagnosis and biomedicine in recent years, and have reached some achievement (Zhang et al., 2016; Li et al., 2021; Zhang et al., 2021; Shi et al., 2022a; Li et al., 2022).
The nonlinear dynamic index based on entropy can reflect the complexity of the signal. The common nonlinear dynamic indexes based on entropy include approximate entropy (AE), sample entropy (SE), and permutation entropy (PE). Pincus et al. proposed AE (Pincus, 1991), and AE does not need a large amount of data to measure the complexity of time sequences. Richman et al. proposed the SE as an improved algorithm of AE (Richman and Moorman, 2000), the calculation of SE does not depend on the length of time series, and the calculation error is small. Bandt and Pompe proposed PE (Bandt and Pompe, 2002), compared with AE and SE, PE has stronger anti-noise ability and higher calculation speed.
The nonlinear dynamic index based on LZC can reflect the irregular degree of signal (Cui et al., 2016; Li et al., 2020). The frequently used nonlinear dynamic indexes based on LZC include: LZC, weight Lempel-Ziv complexity (WLZC) and permutation Lempel-Ziv complexity (PLZC). Lempel et al. proposed LZC (Lempel and Ziv, 1976), and LZC has the advantages of easy calculation and no parameter setting (Xie et al., 2012). introduced the concept of weight into LZC and proposed the WLZC, WLZC can better detect the changes of time sequences through weighted calculation. Bai proposed the PLZC the by combining the PE and LZC (Bai et al., 2015), and the proposed PLZC can more simply, stably and effectively quantize the dynamic changes of signals.
However, for the nonlinear dynamic indexes based on entropy and LZC, both of which are difficult to fully reflect the signal effective information from a single scale, many scholars introduced the coarse graining operation into these indexes (Anne, 2020), including multi-scale permutation entropy (MPE) and multi-scale Lempel-Ziv complexity (MLZC). Previous studies have shown that the MLZC achieved satisfactory results in the fields of biomedicine and mechanical fault diagnosis (Yeh and Shi, 2018; Yan et al., 2021; Shi et al., 2022b), and MPE has been applied in the fields of underwater acoustic signal with excellent performance (Choi et al., 2016; Liu et al., 2017; Chen et al., 2019).
Ship-radiated noise signal (S-S) as a kind of underwater acoustic signal (Li et al., 2019; Zhang et al., 2020; Esmaiel et al., 2022), which can indicate the physical characteristics of ships (Wang et al., 2017; Yang et al., 2022). The extraction of nonlinear dynamic indexes from S-Ss are helpful to the classification and recognition of different ships (Bao et al., 2010). It has been found that dispersion entropy-based Lempel-Ziv complexity (DELZC) is introduced into the feature extraction method for S-Ss, which effectively improves the recognition rate of different S-Ss (Li and Geng, 2022). In the past decade, PE and PE-based improved multi-scale algorithms have been applied successively in the field of feature extraction for S-Ss, such as MPE and multi-scale weight permutation entropy (MWPE), and the separability of extracted features for S-Ss is improved (Li and Li Y, 2016; Li and Li Y, 2017; Xie et al., 2021). As the results shows that the introduction of multi-scale in entropy improved the feature extraction performance of S-Ss. However, multi-scale also has not been introduced into PLZC at present.
In order to comprehensively reflect the complexity of PLZC and improve the feature extraction performance of S-Ss, we proposed the multi-scale permutation Lempel-Ziv complexity (MPLZC) by introducing coarse graining operation, in addition, we combined with MLZC, MPE and MPLZC to propose the automatic hybrid multi-feature extraction method for feature extraction of S-Ss. The overall structure of this paper is as follows: Section 2 introduces the principle of MPLZC and the automatic hybrid multi-feature extraction method; in Section 3, the effectiveness of MPLZC is verified by simulation signal experiment; Section 4 performs single feature extraction experiments and multi-feature extraction experiments of six S-Ss and classification experiments based on K-Nearest Neighbor (KNN) classifier; finally, Section 5 gives the main conclusions of the full paper.
Theory and method
Multi-scale permutation Lempel-Ziv complexity
MPLZC is used to detect the dynamic changes of nonlinear systems, which combines the coarse graining operation, the permutation pattern of PE and LZC. The specific calculation steps of MPLZC are as follows:
(1) For a given series X={x1,x2,…,xN} , the series is obtained by coarse graining operation. can be expressed as:
where g represents the scale factor, l is equal to , and represents the largest integer not greater than . If g = 1, Y(g) is the same as the original sequence X.
(2) For series Y(g), phase space reconstruction is performed to obtain the following reconstructed time series matrix:
where m is the embedding dimension; τ is the delay time, and k represents the number of reconstructed row vectors which value of k is N – (m–1)τ.
(3) Each reconstructed row vector is rearranged in ascending order as follows:
if the values of two elements are equal in the same row vector as:
their order can be arranged as follows:
any reconstructed line vector corresponds to a symbol sequence s(i):
where i = 1,2,…,k, and k ≤ m!. The matrix composed of these symbol sequences is defined as:
(4) Matrix S has k symbol sequences, each symbol sequence is numbered according to the class of corresponding patterns, and there are m! classes of patterns in total. For example, for a given finite symbol sequence with m = 3, there are a total of m! = 6 patterns, the corresponding relationships are [1, 2, 3]→1, [1, 3, 2]→2, [2, 1, 3]→3, [2, 3, 1]→4, [3,1, 2]→5, [3, 2, 1]→6, and there are similar corresponding relationships when m is set to other values.
(5) After the conversion in step (4), the numbers corresponding to each s(i) are arranged in rows. Then we get a pattern sequence G with length k, and all the elements are integers between 1 to m!.
(6) Take G as a new sequence and perform LZC calculation on it, more specifically, its normalized complexity is as follows:
where c(k) represents the complexity of sequence G by process of LZC, and the specific steps of LZC are described in reference (Lempel and Ziv, 1976)
(7) The LZC of the series Gunder different g are calculated, and the MPLZC of the original series X is obtained, which can be expressed as:
Automatic hybrid multi-feature extraction method
Flow chart of the automatic hybrid multi-feature extraction for S-Ss is shown in Figure 1, the specific steps are as follows:
(1) Input the different types of S-Ss.
(2) Calculate the MLZC, MPE and MPLZC of various S-Ss under different scale factors (SFs) and mix them to obtain hybrid features (HF).
(3) Initialize the number of extracted features i = 3.
(4) Judge whether i is greater than 10, if it is greater than 10, the process ends; otherwise, execute the next step.
(5) Select i features of various S-Ss, and KNN classifier is used to classify S-Ss.
(6) Output the highest average recognition rate (ARR) under the current i, judge whether ARR is equal to 100%, if the ARR reaches 100%, the process ends; otherwise, the i is increased by 1 and return to step (4).
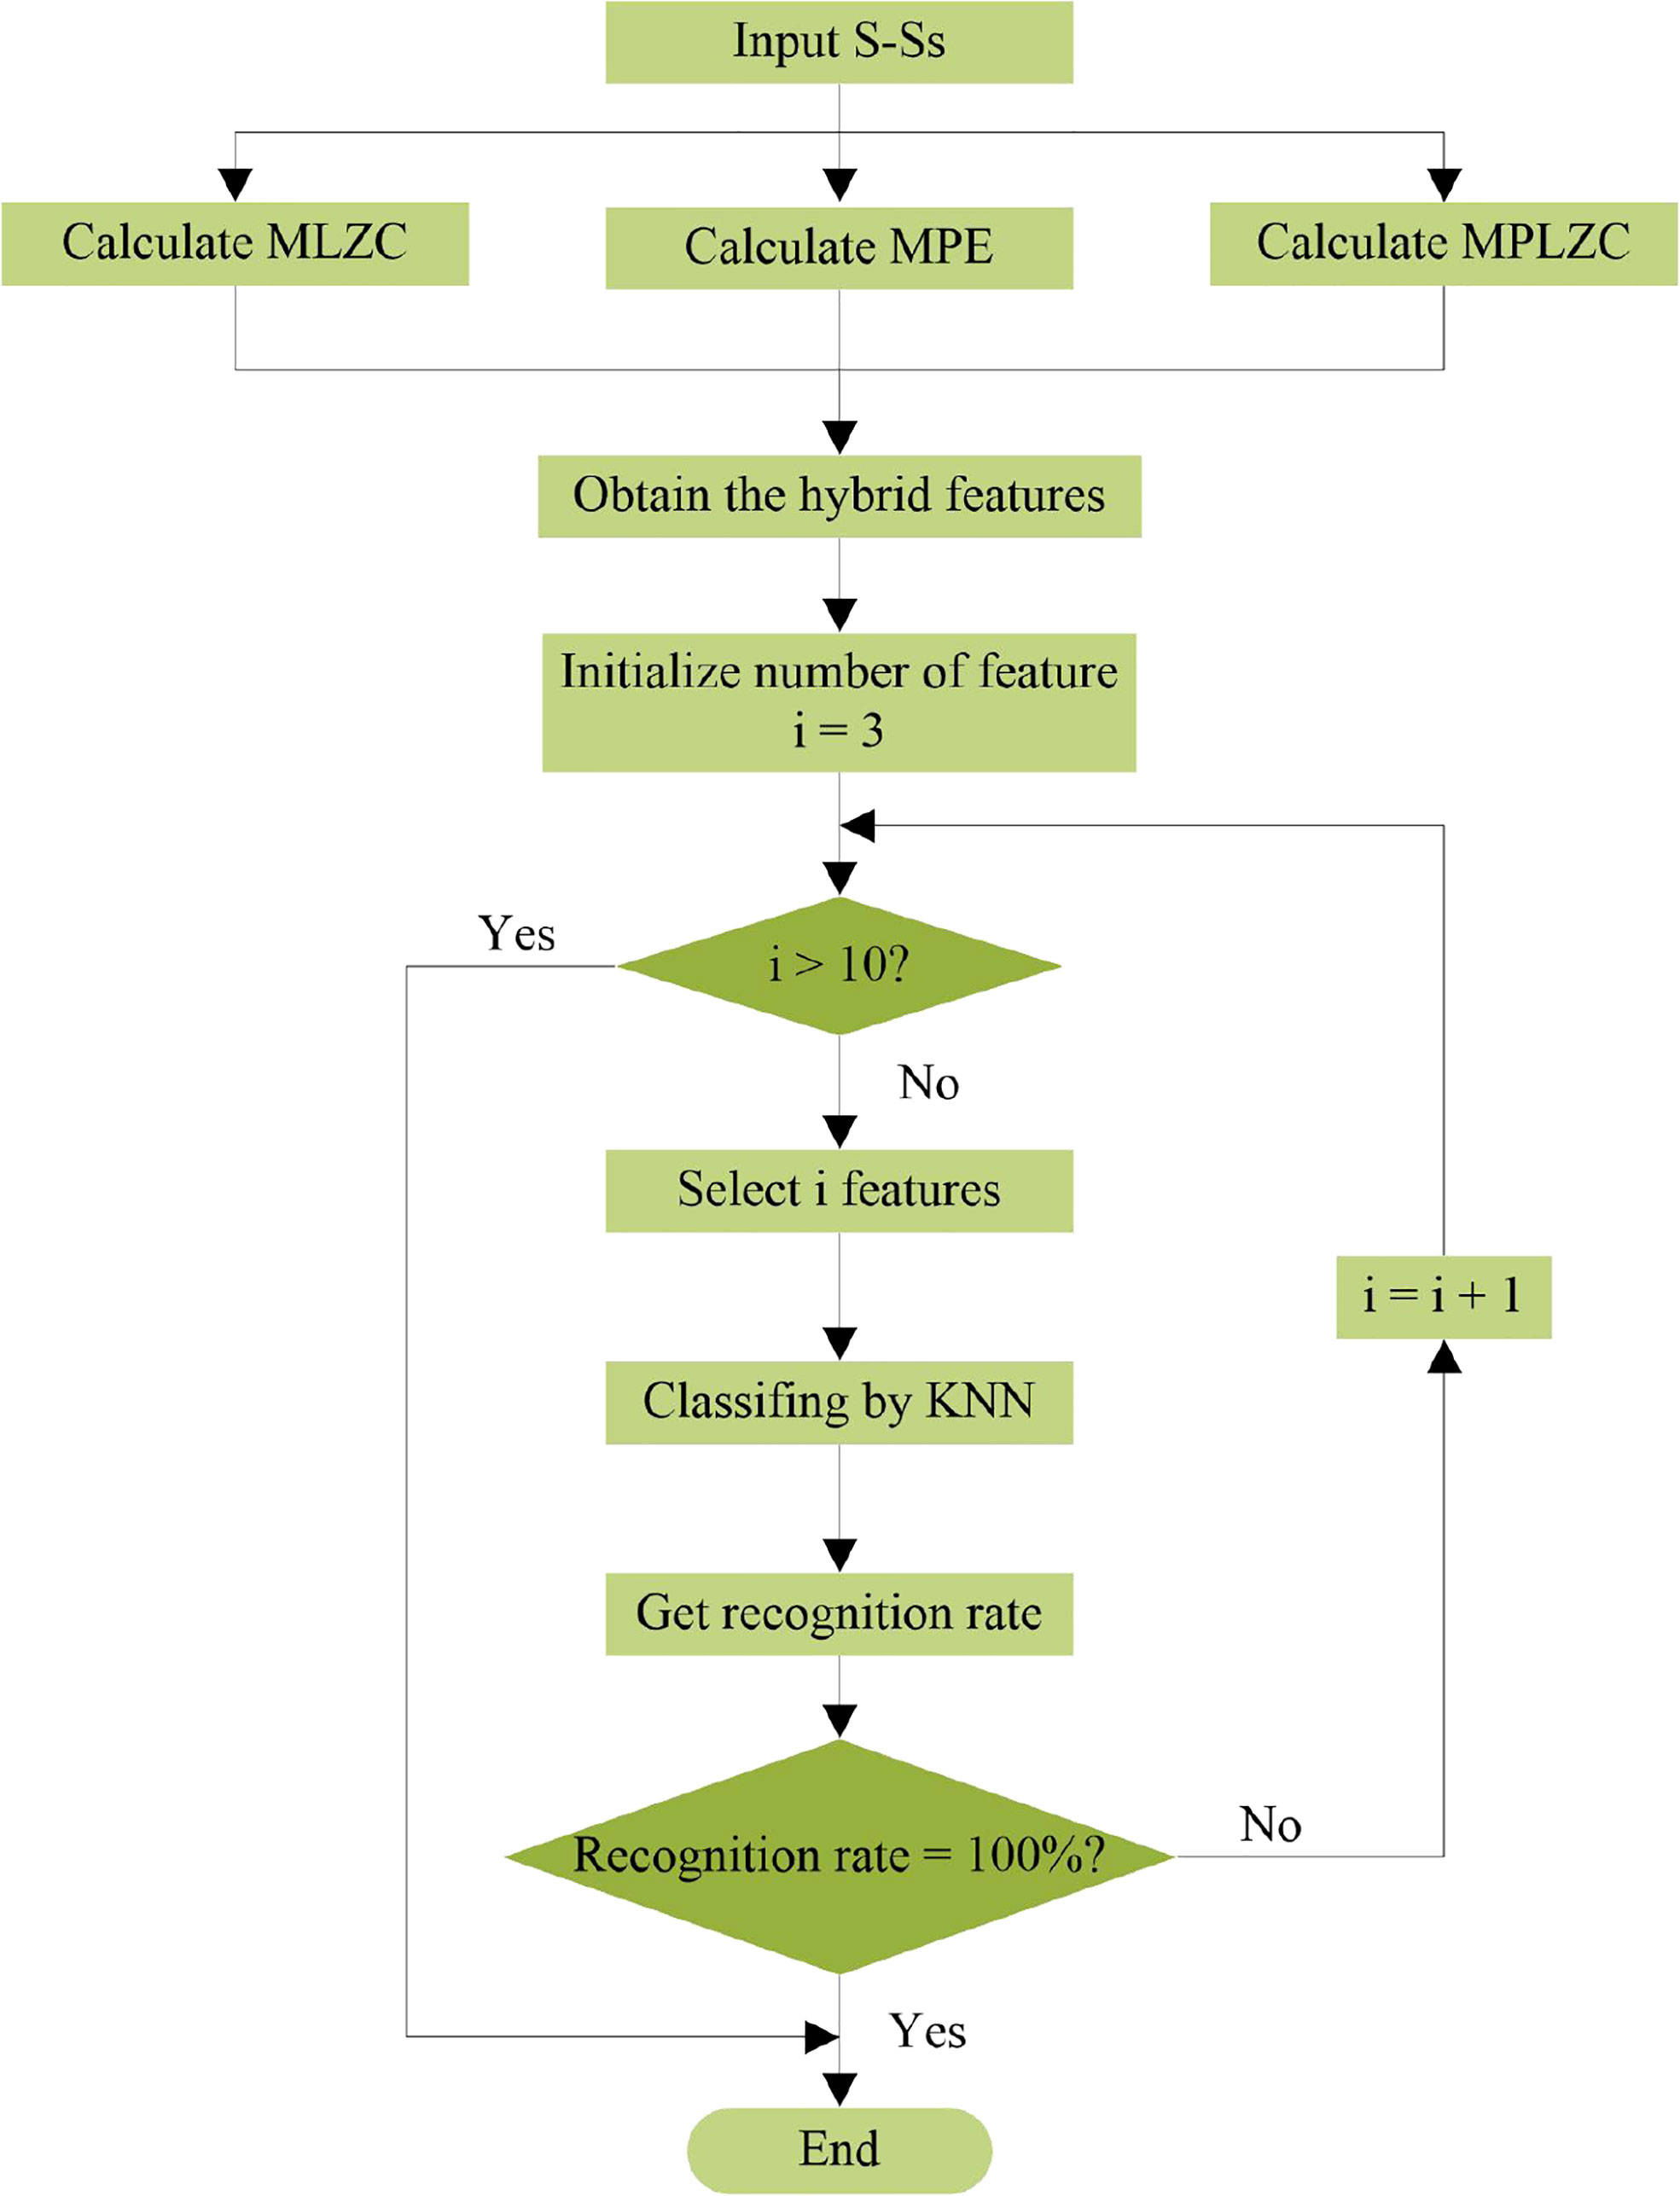
Figure 1 Flow chart of the automatic hybrid multi-feature extraction for S-Ss.
Simulation signal complexity analysis
MIX signal
To verify the effectiveness of PLZC in reflecting the complexity change when the random sequence becomes a periodic deterministic time series, Mixed signal is used in this experiment, which can be defined as:
where z is a random variable that decreases from 0.99 to 0.01, x(t) is a periodic function, and y is a variable evenly distributed in []. In the process of signal generation, the greater the z value, the stronger the randomness; the smaller the z value, the stronger the periodicity.
The sampling frequency of the Mix signal is 1000Hz, and the total sampling time is 15s. The sliding window with 1000 sampling points is used to move sampling at the overlap rate of 90%, a sliding window is a sample, a total of 140 samples. Three kinds of complexity of each sample are calculated respectively, in which the embedding dimension m of PE and PLZC are set to 4, and the delay time τ are set to 1. Figure 2 shows Waveform and complexity curves Mix signal: (a) Waveform; (b) Complexity curves. It can be seen from Figure 2B that the increase of periodicity for Mix signal with the time increase, and the complexity of Mix signal should also reduce.
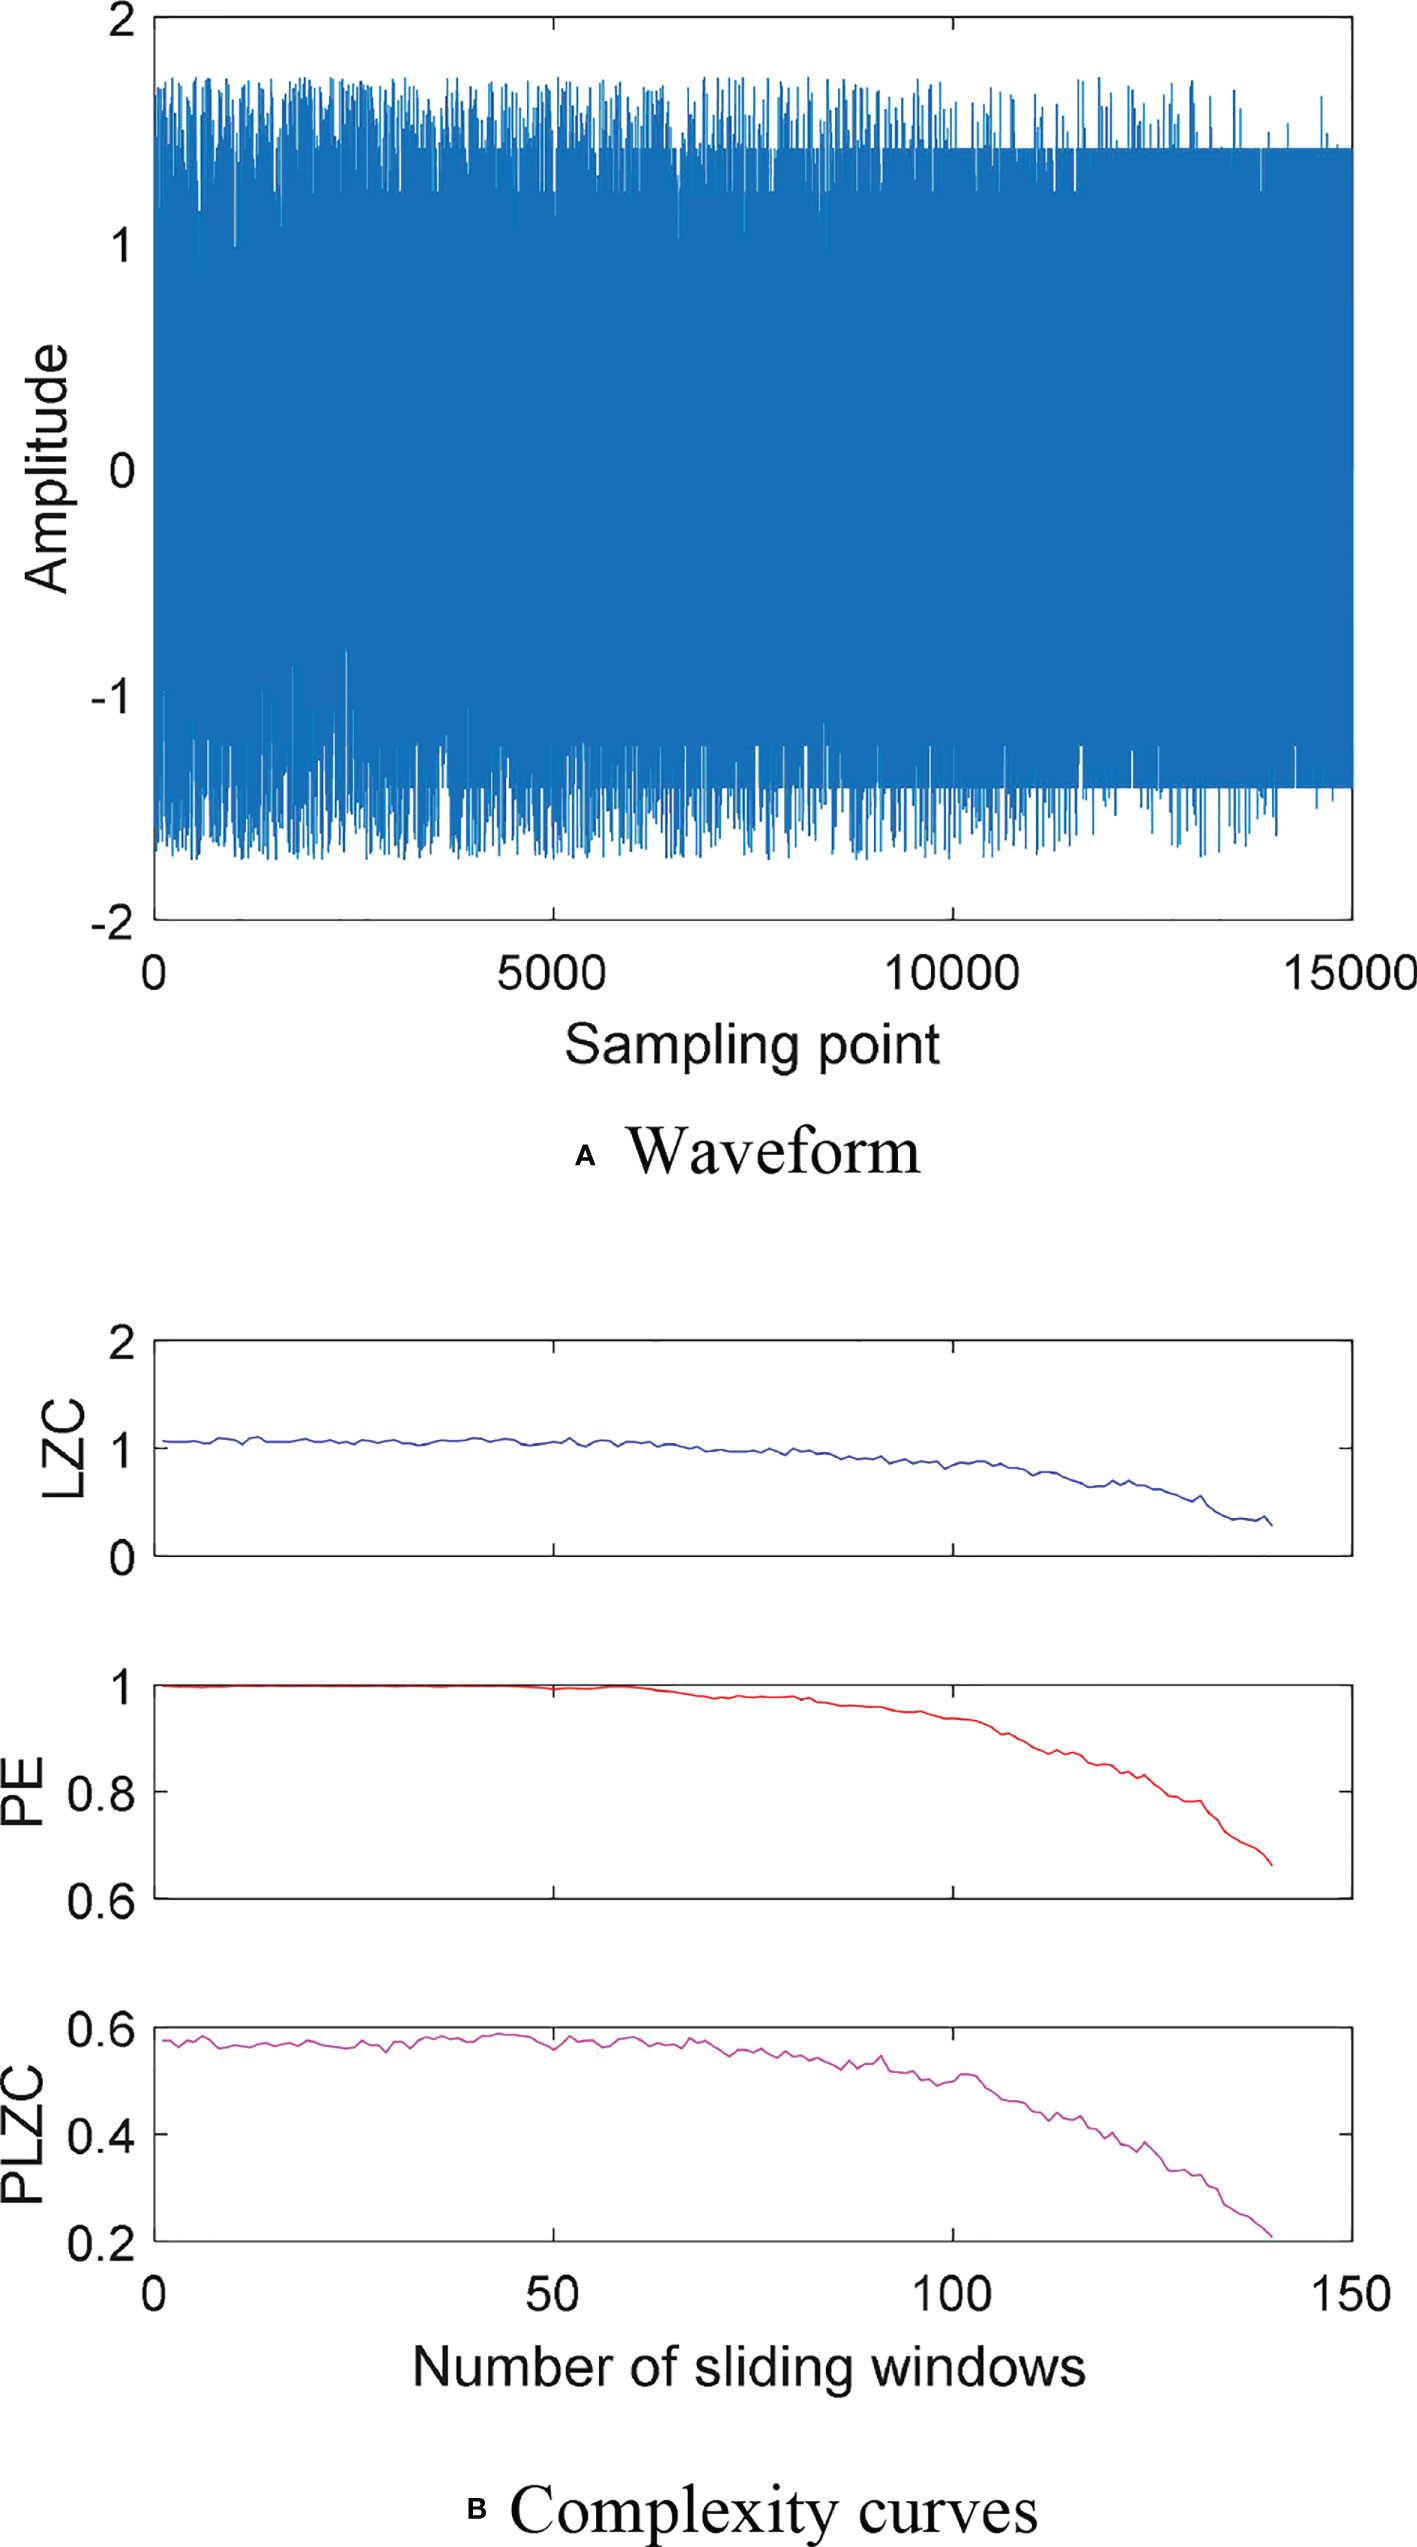
Figure 2 Waveform and complexity curves Mix signal: (A) Waveform; (B) Complexity curves.
It can be seen from Figure 2B that PE, PLZC and LZC all have a downward trend, which can reflect the complexity change of Mix signal; the PLZC curve is smoother and has less fluctuation than LZC and PE when falling. The experimental results indicate that PLZC can better reflect the complexity change of Mix signal.
Logistic model
To verify the effectiveness of PLZC, a comparative experiment was performed to detect the dynamic changes of logistic model. Logistic model can be defined as:
where x1 is 0.65 u is the control parameter with the range of [3.5,4]. LZC, PE and PLZC are calculated respectively, the parameters of PE and PLZC are set to m = 4 and τ = 1. Figure 3 depicts waveform and complexity curves of logistic model: (a) Waveform; (b) Complexity curves.
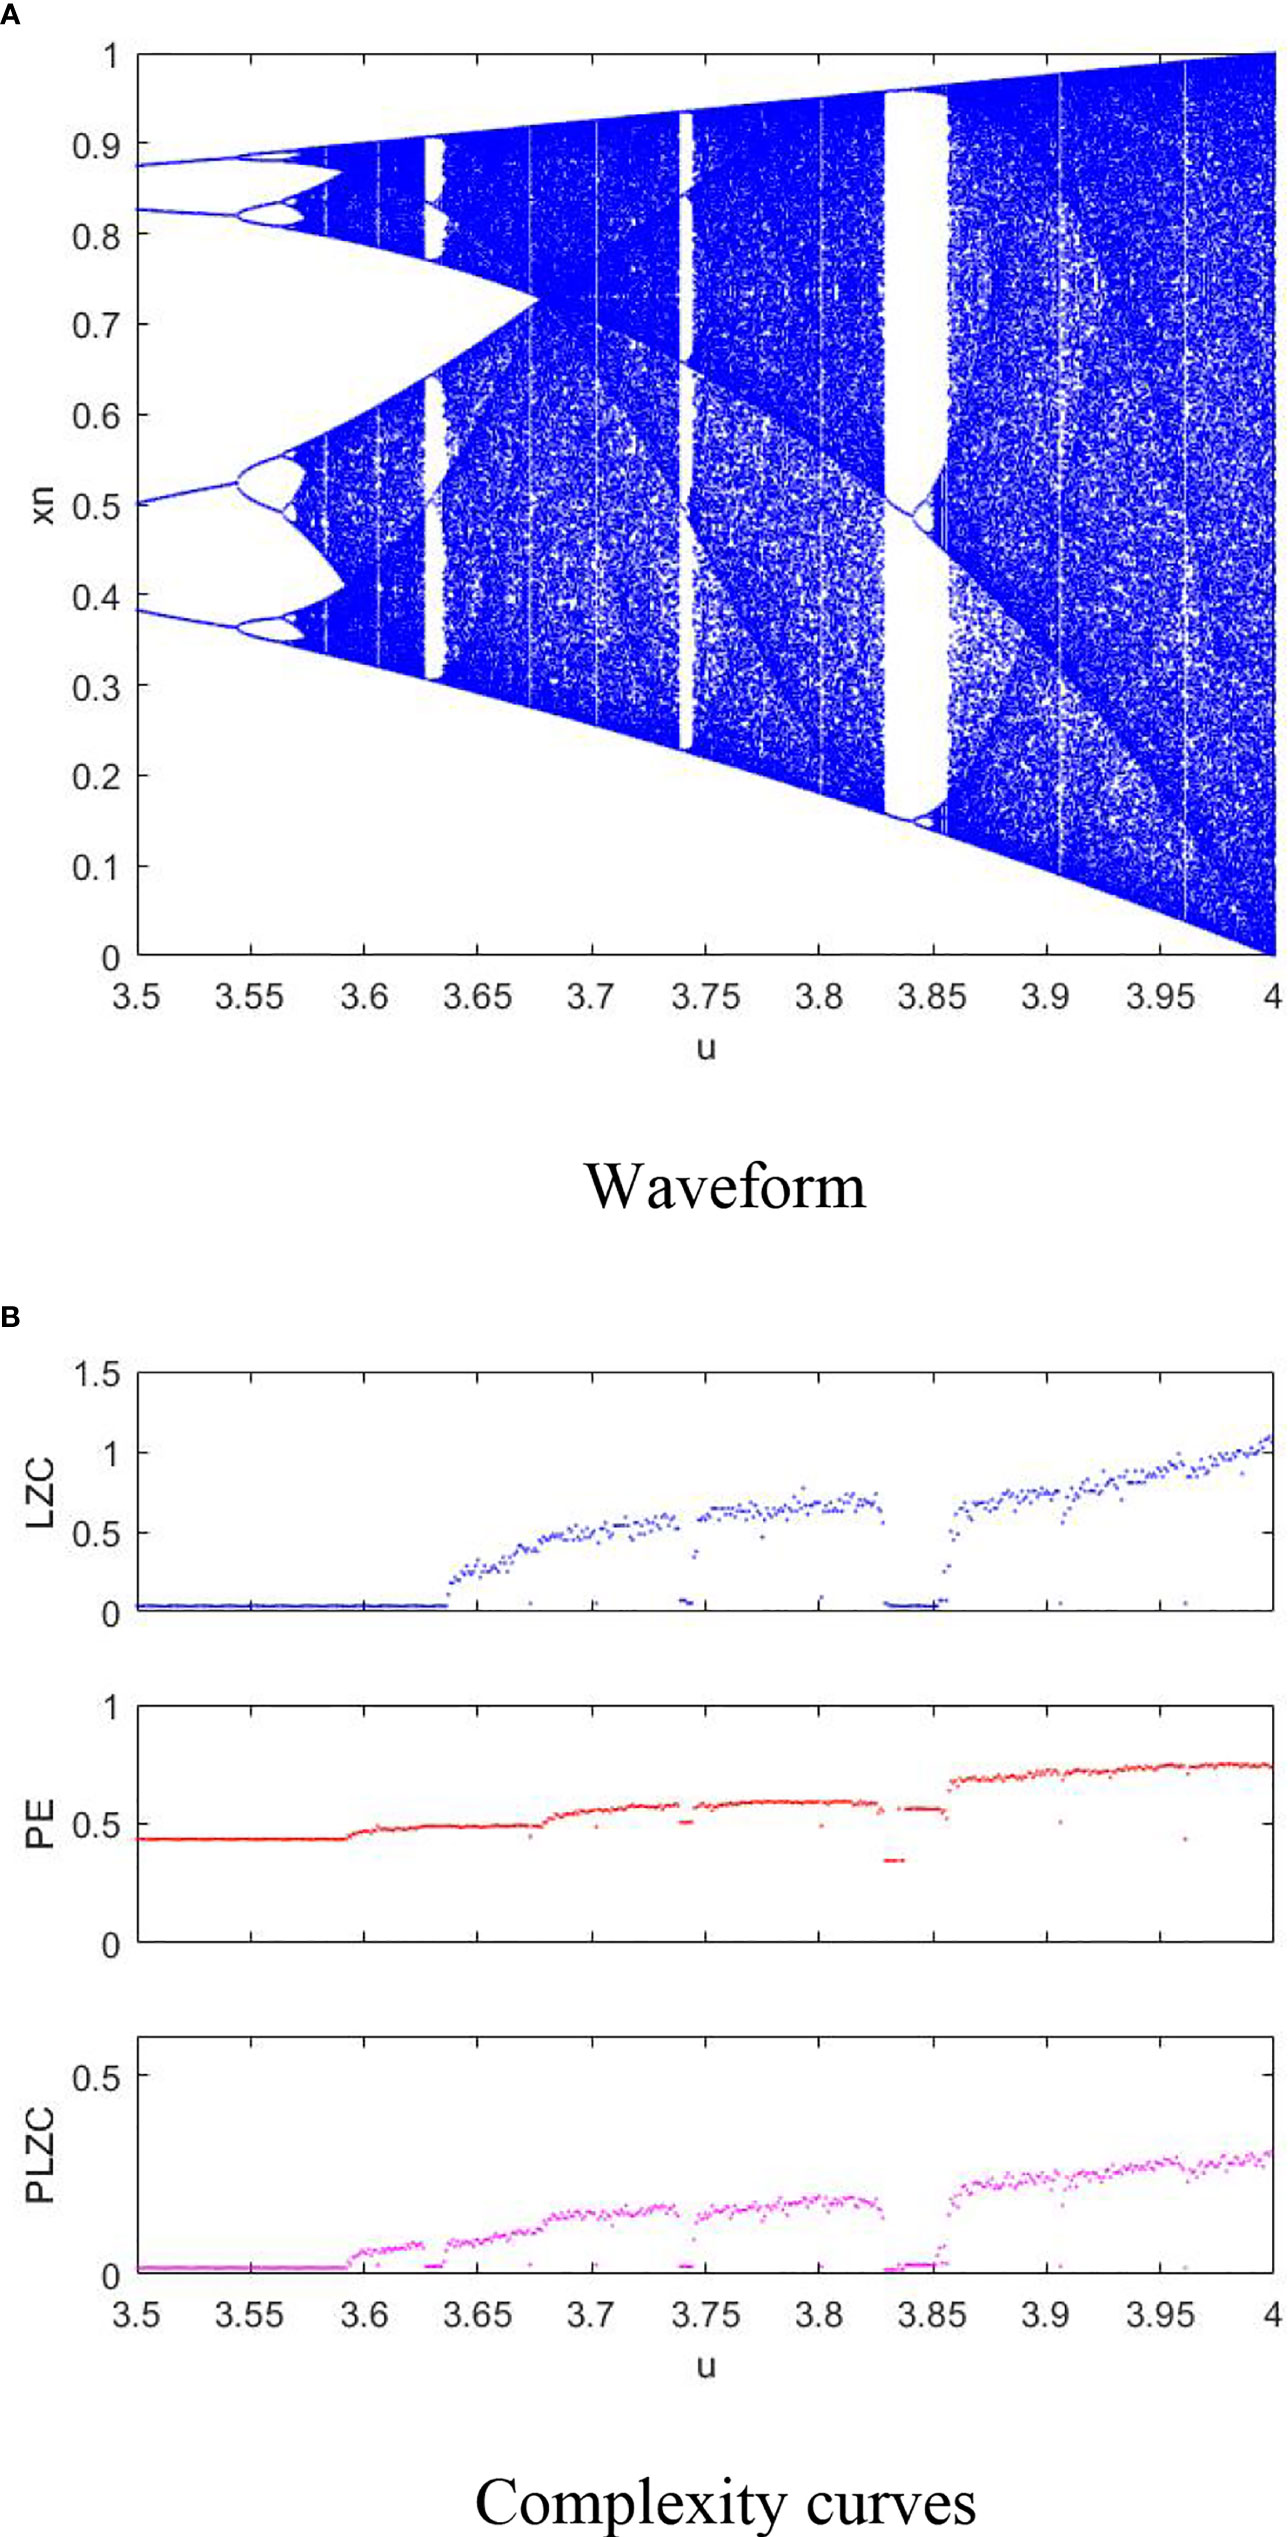
Figure 3 Waveform and complexity curves of logistic model: (A) Waveform; (B) Complexity curves.
It can be seen from Figure 3A that the randomness of logistic model becomes generally higher with the increase of u. It can be concluded from Figure 3B that the curves of LZC, PE and PLZC all have an upward trend in general; LZC cannot detect the complexity upward trend of logistic model when u is in the range of 3.57 to 3.62, only PLZC can accurately reflect the complexity downward trend of logistic model when u near 3.63. Experimental results show that PLZC is more sensitive to complexity changes of logistic model than PE and LZC, and can better describe dynamic changes for logistic model.
Different noise signals
To confirm the ability of MPLZC to discriminate different noise signals, a comparison experiment was conducted for pink noise, white Gaussian noise (WGn) and blue noise. Figure 4 shows the normalized results of three types for noise signal.
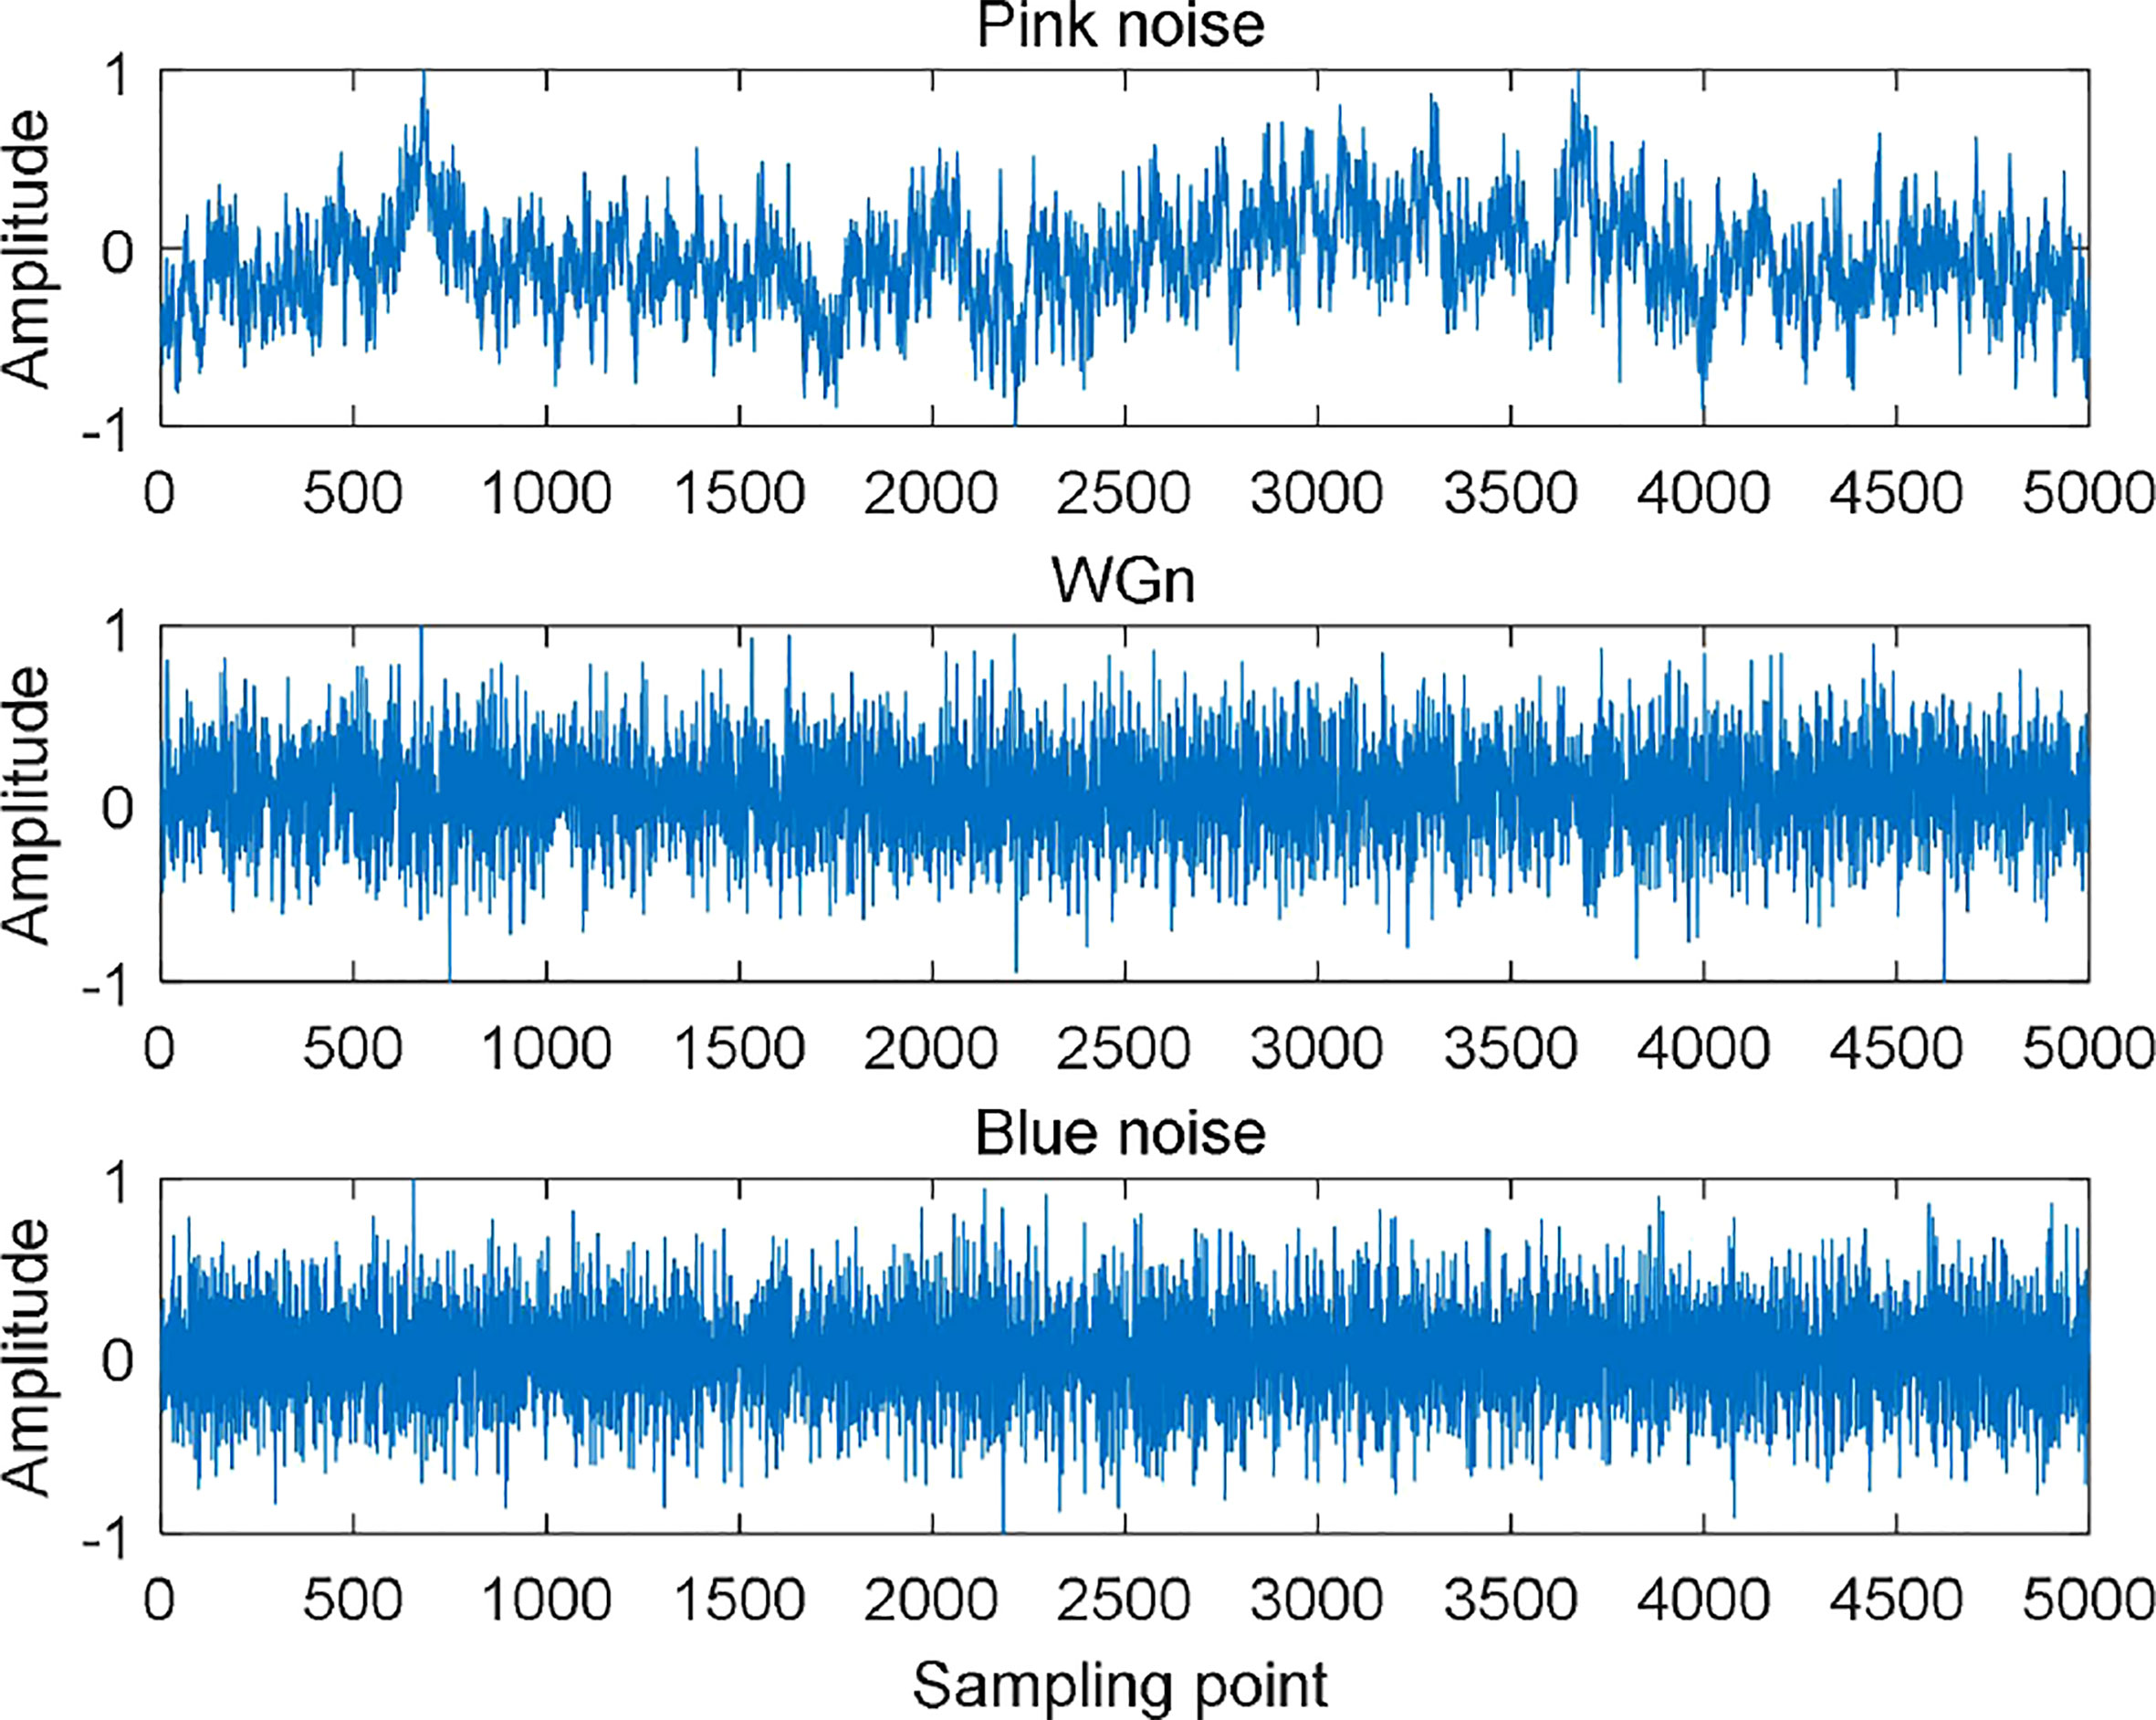
Figure 4 The normalized results of three types for noise signal.
20 samples are taken for the three noise signals separately, and the number of sampling points of each sample is 5000. MLZC, MPE and MPLZC of each sample are calculated respectively. The SF of MLZC, MPE and MPLZC changes from 1 to 20, the embedding dimension m of MPE and MPLZC are set to 2, and the delay time τ are set to 1. Figure 5 is means and standard deviations of complexity for three noise signals under different SFs.
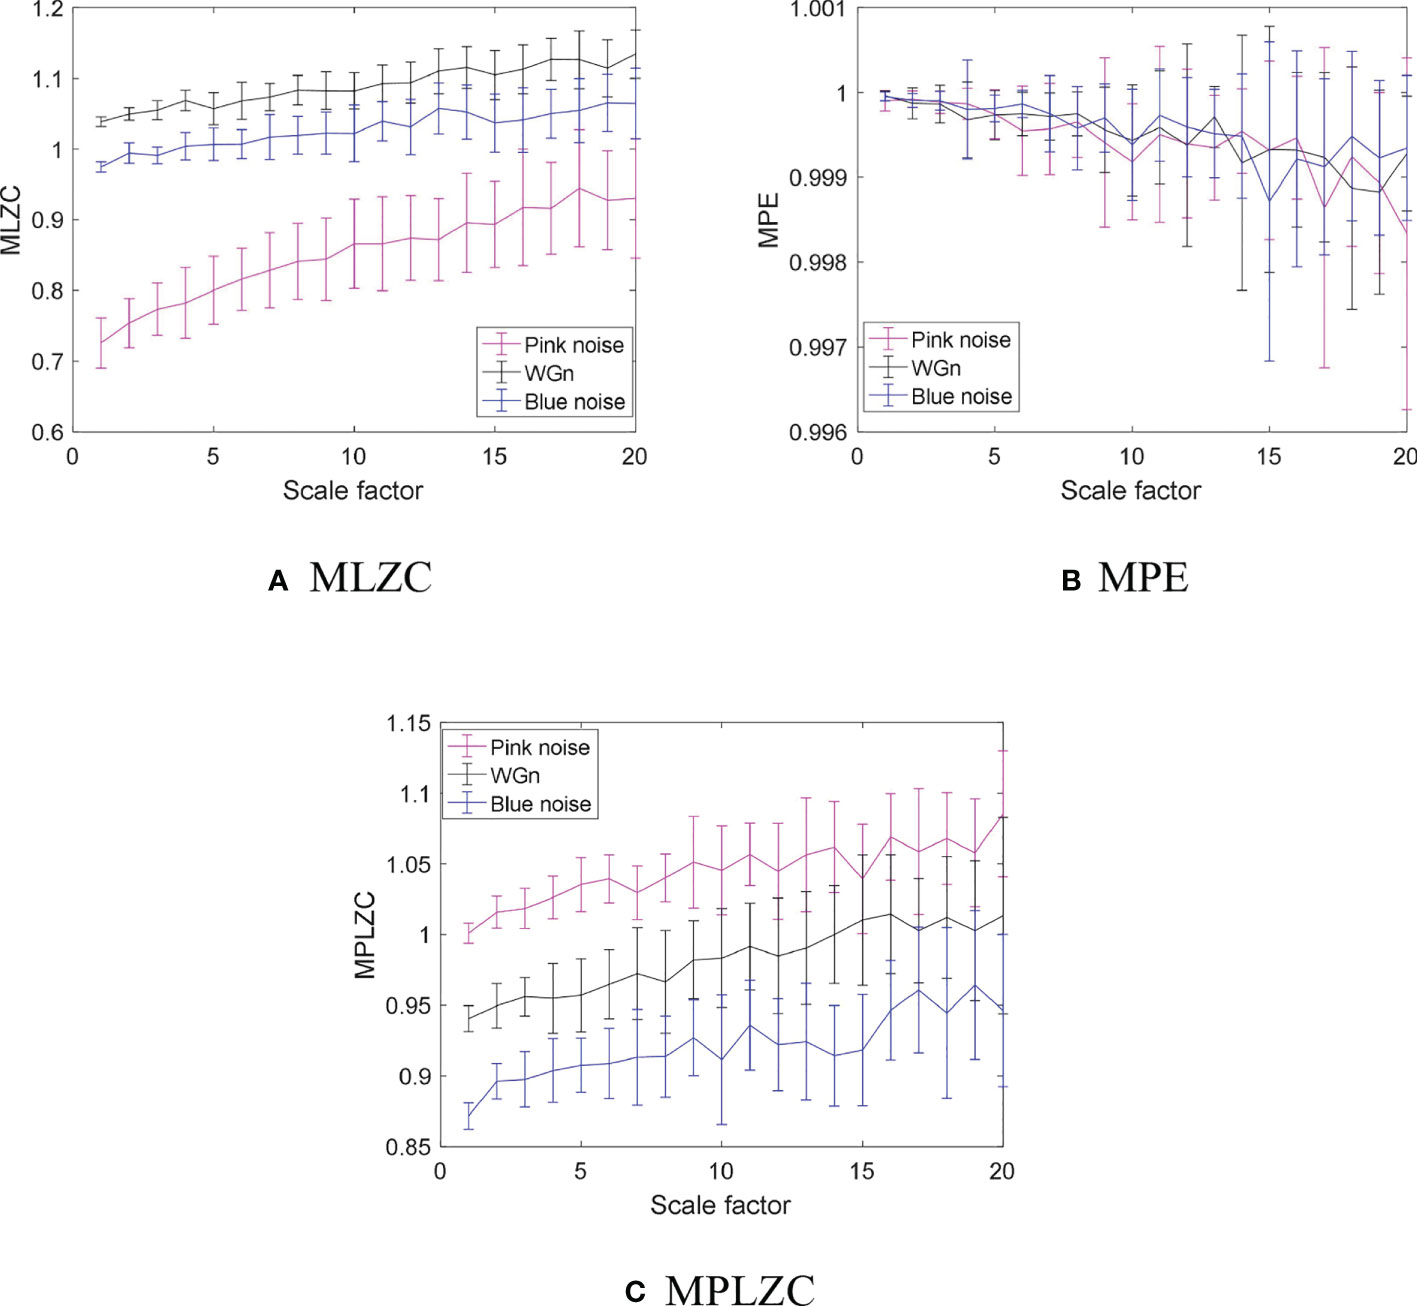
Figure 5 Means and standard deviations of complexity for three noise signals under different SFs: (A) MLZC, (B) MPE, (C) MPLZC.
From Figure 5, the mean and standard deviation curves of MPE are overlapped for pink noise, white noise and blue noise; for MLZC and MPLZC, mean and standard deviation curves of three noise signals all have significant difference. The experimental results suggest that compared with MPE, MLZC and MPLZC have better ability to distinguish three noise signals, especially when SF is less than 5.
Feature extraction of S-Ss
Six types of S-S
Six types of S-Ss are used in this feature extraction experiment with the sampling frequency of 44.1kHz and sampling interval is [1, 200000] which are from the online website (National Park Service) and called as Ship-①, Ship-②, Ship-③, Ship-④, Ship-⑤ and Ship-⑥ respectively. Figure 6 shows the normalized results of six types of S-Ss.
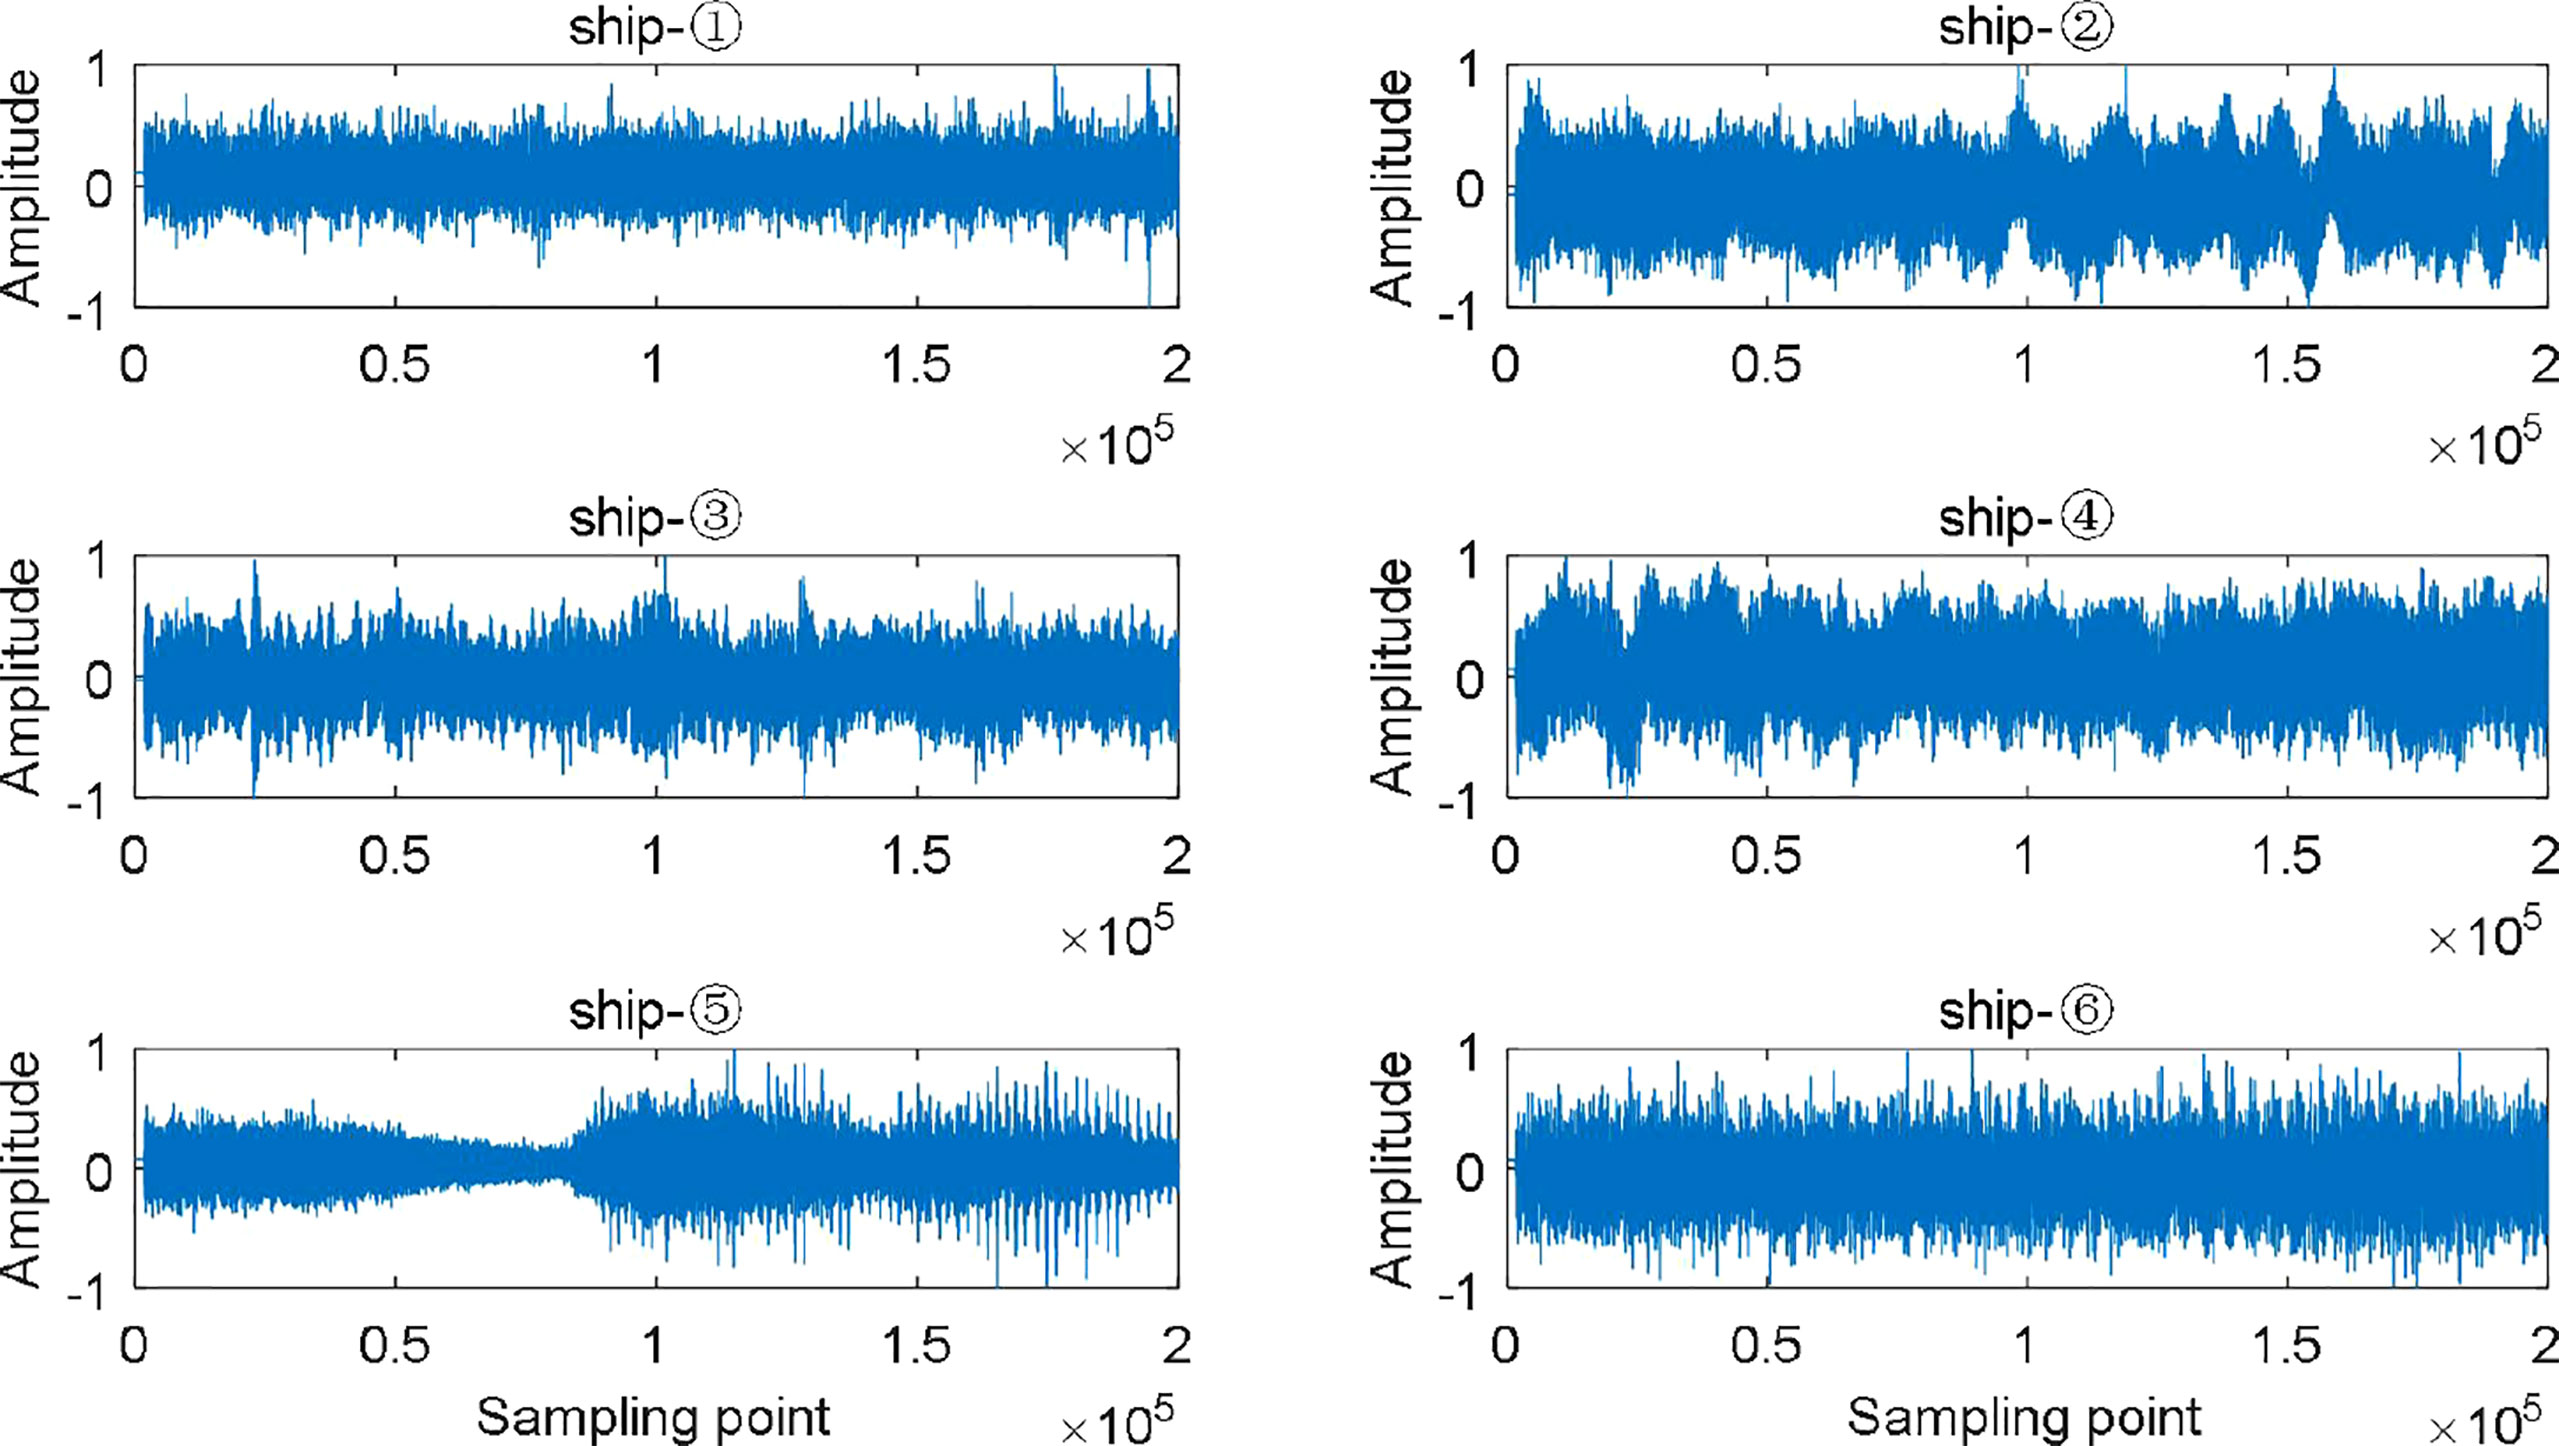
Figure 6 The normalized results of six types of S-Ss.
Single feature extraction and classification
100 samples are selected for each S-S, and the sampling points of each sample is 2000. MLZC, MPE and MPLZC of the six kinds of S-Ss are extracted with the SF from 1 to 10. For comparison and analysis, the parameters of MPE and MPLZC are set to m = 5 and τ = 1. Figures 7–9 demonstrate the feature distributions of MLZC, MPE and MPLZC for six S-Ss under each SF, where SF1 represents scale factor 1, SF2 represents scale factor 2 and so on.
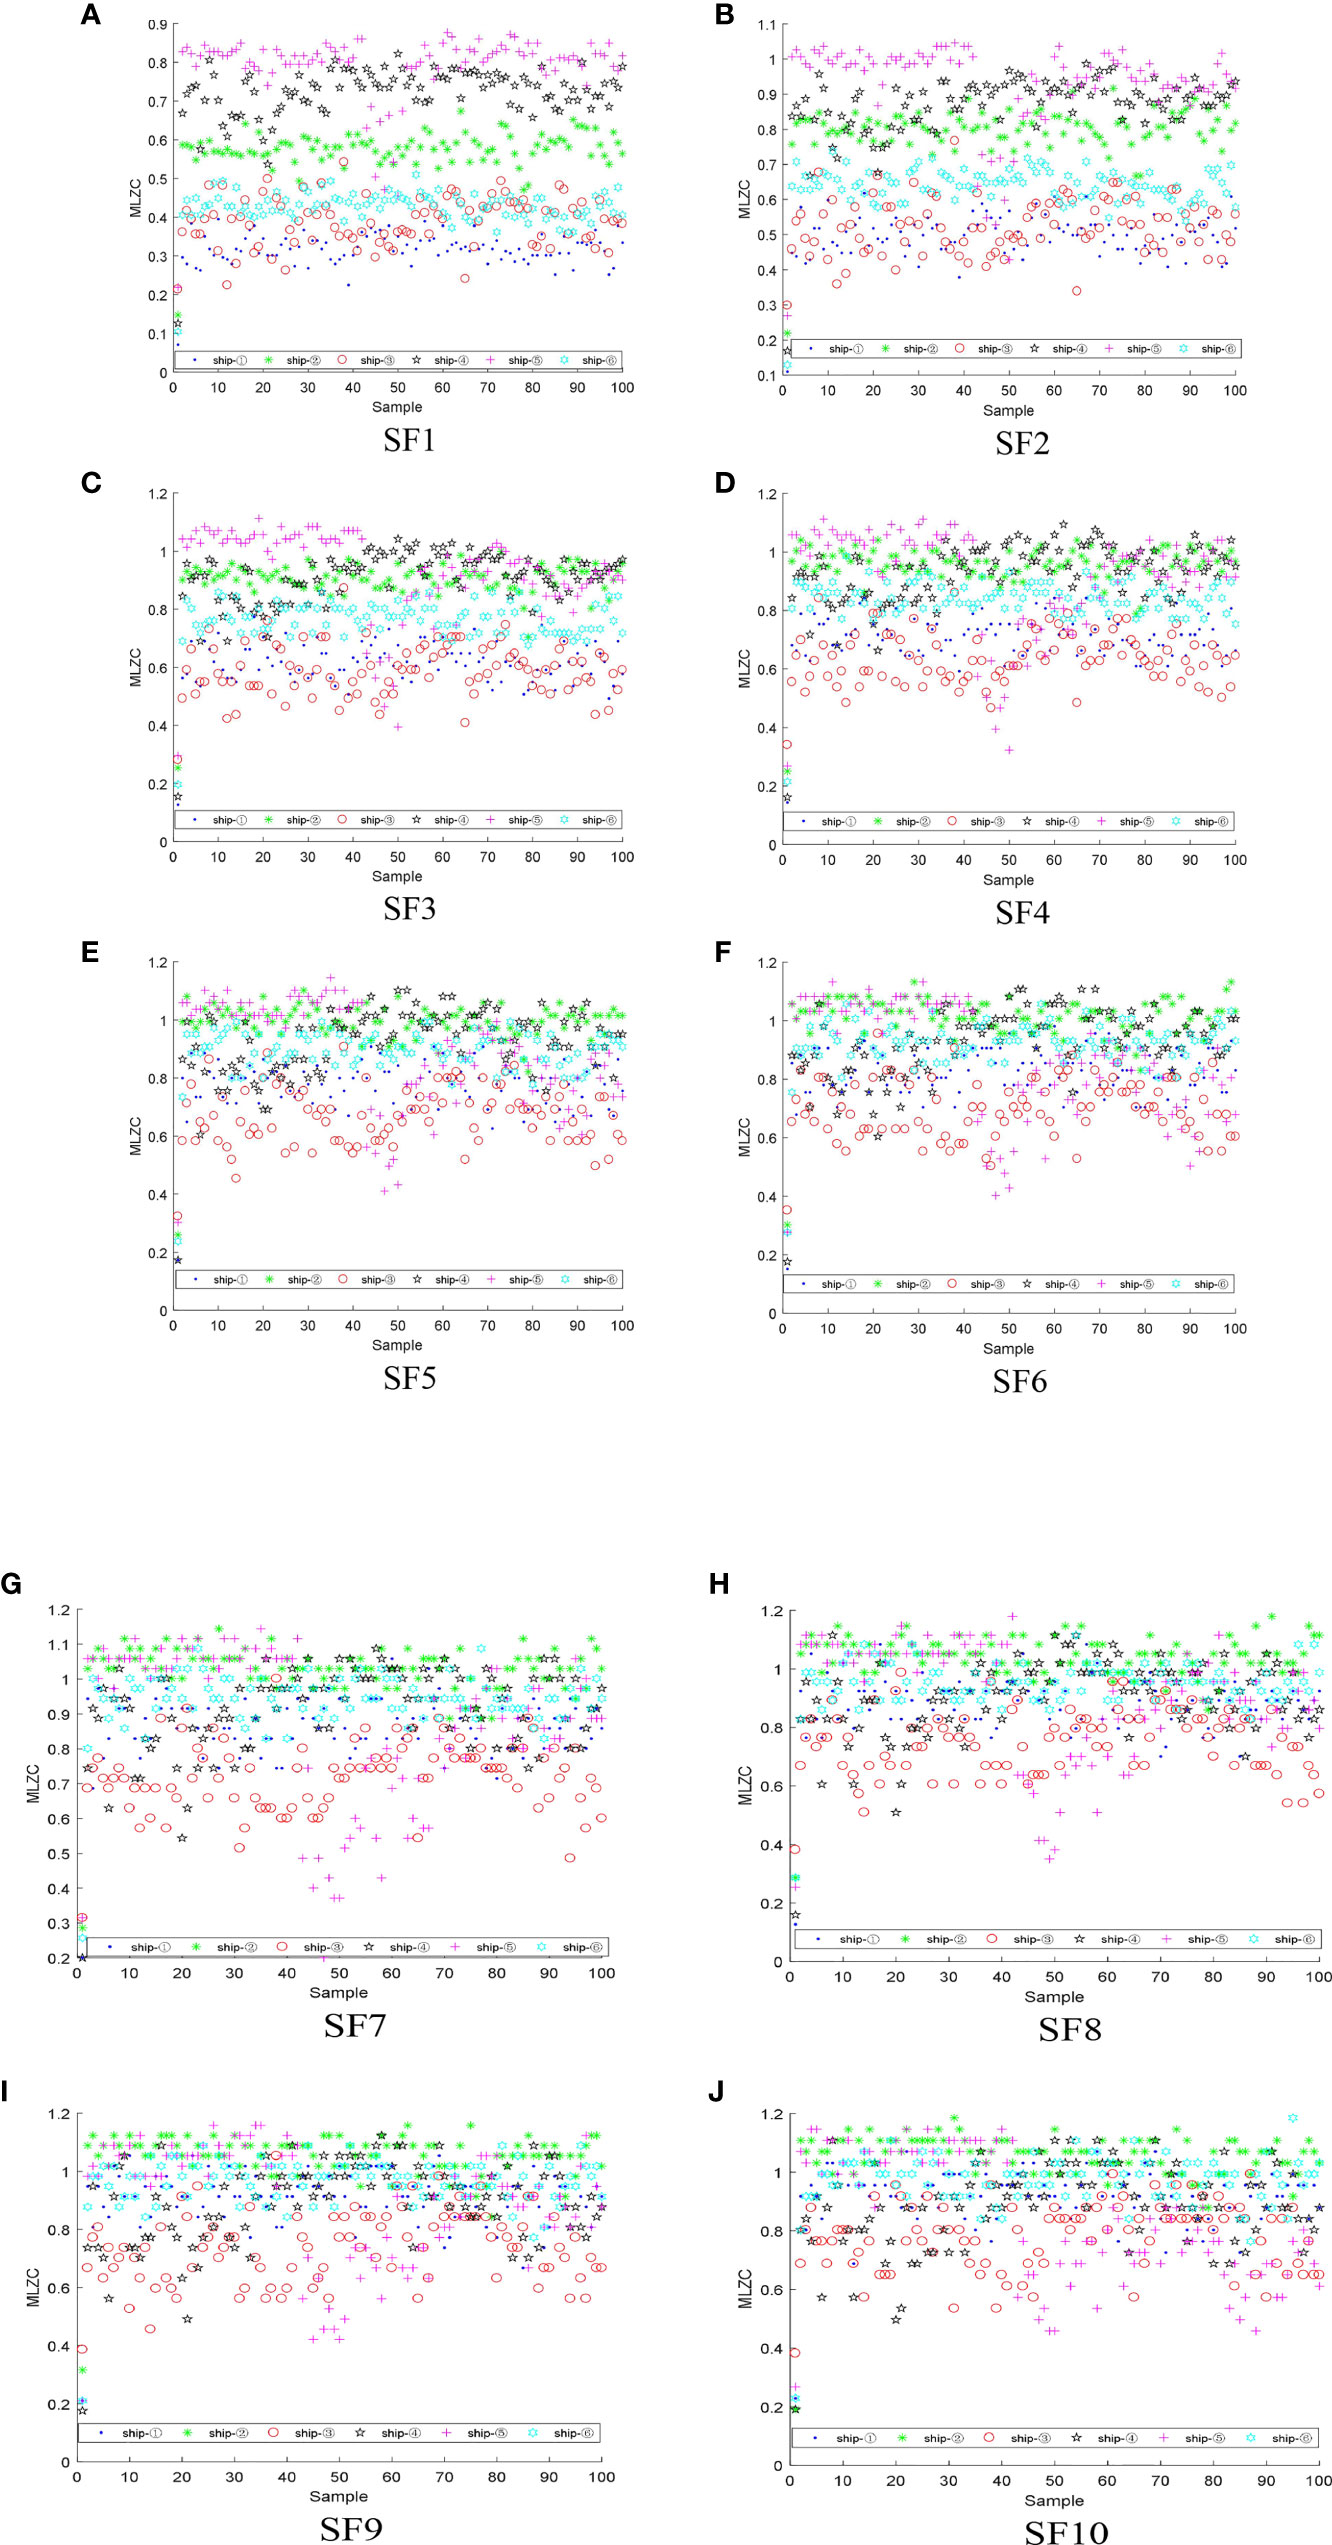
Figure 7 The feature distributions of MLZC for six S-Ss under each SF:(A) SF1, (B) SF2, (C) SF3, (D) SF4, (E) SF5, (F) SF6, (G) SF7, (H) SF8, (I) SF9, (J) SF10.

Figure 8 The feature distributions of MPE for six S-Ss under each SF:(A) SF1, (B) SF2, (C) SF3, (D) SF4, (E) SF5, (F) SF6, (G) SF7, (H) SF8, (I) SF9, (J) SF10.

Figure 9 The feature distributions of MPLZC for six S-Ss under each SF:(A) SF1, (B) SF2, (C) SF3, (D) SF4, (E) SF5, (F) SF6, (G) SF7, (H) SF8, (I) SF9, (J) SF10.
From Figures 7–9, for MLZC, MPE and MPLZC, the overlapping phenomenon of the feature distributions for the six S-Ss gradually became serious with the increase of SF; for MPE and MPLZC, compared with MLZC, the feature dstributions of the six S-Ss have more significant differences under each SF; compared with other SFs, the feature distributions of MPE for six S-Ss have less overlapping parts under SF1, SF2 and SF3, especially ship-② and ship-⑥; from SF4 to SF8, the MPE of ship-④ and ship-⑤ are approximate, which is difficult to distinguish these two S-Ss; for MPLZC, the distinguishing effect between the feature distributions of ship-② and ship-④ under SF2 is better than that under SF1; the difference between the MPLZC of ship-② and ship-③ under SF1 is more obvious than that in SF2; from SF5 to SF10, the MPLZC distributions of ship-② and ship-⑤ are seriously overlapped, which is difficult to distinguish these two S-Ss. In summary, under different SF, MLZC, MPE, and MPLZC also have different ability to distinguish different S-Ss, only the single feature is adopted, which is difficult to distinguish the six S-Ss.
To more clearly compare the ARRs of six S-Ss, six S-Ss are classified by KNN classifier (Venkatesan et al., 2018). 100 samples of each S-S are selected, of which the 50 samples are used as training samples and the other 50 samples are test samples. Table 1 shows the ARRs of six S-Ss under each SF.
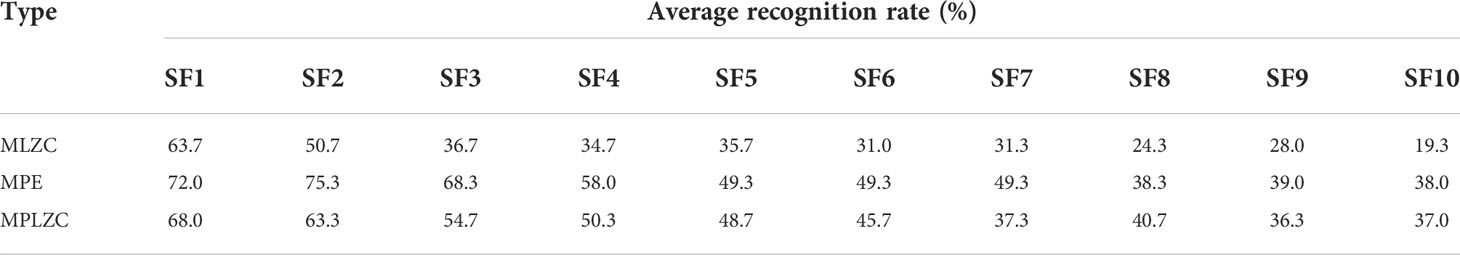
Table 1 The ARRs of six S-Ss under each SF.
From Table 1, with the increase of SF, the ARR of single feature extraction methods based on MLZC, MPE and MPLZC is decreased generally; for the three feature extraction methods based on MLZC, MPE and MPLZC, the highest ARR is 63.7% under SF1, 75.3% under SF2 and 68% under SF1. In conclusion, the ARRs of the six S-Ss are lower than 80%, and single feature extraction method is difficult to accurately identify various S-Ss.
Automatic hybrid multi-feature extraction and classification
The automatic hybrid multi-feature extraction and recognition method is adopted to further improve the recognition rates of six S-S, and three multi-feature extraction methods based on MLZC, MPE and MPLZC are used as comparative experiments. Figure 10 shows that the triple feature distributions corresponding to the highest ARRs of six S-Ss, MLZC1 is the MLZC under SF1, MLZC2 is the MLZC2 under SF2 and so on, the same is true for MLZC and MPLZC. Table 2 shows that the ARRs of the triple feature extraction methods for six S-Ss.
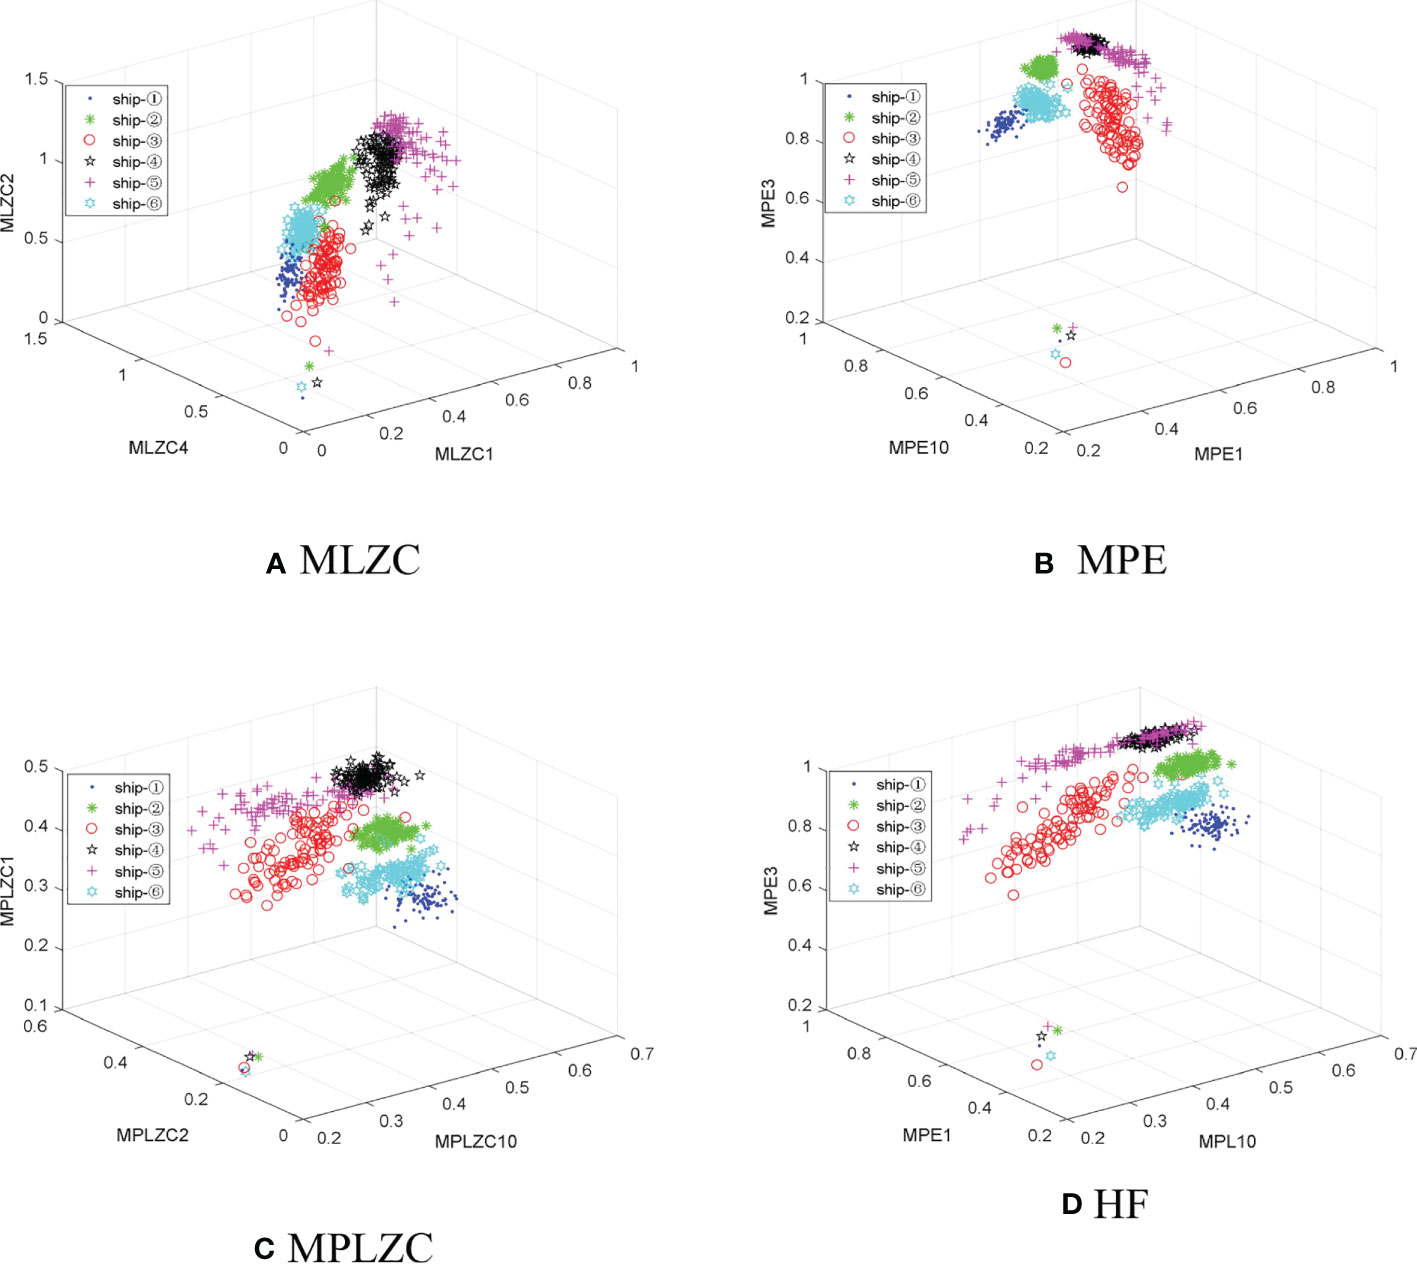
Figure 10 The triple feature distributions under the highest ARRs of six S-Ss: (A) MLZC, (B) MPE, (C) MPLZC, (D) HF.
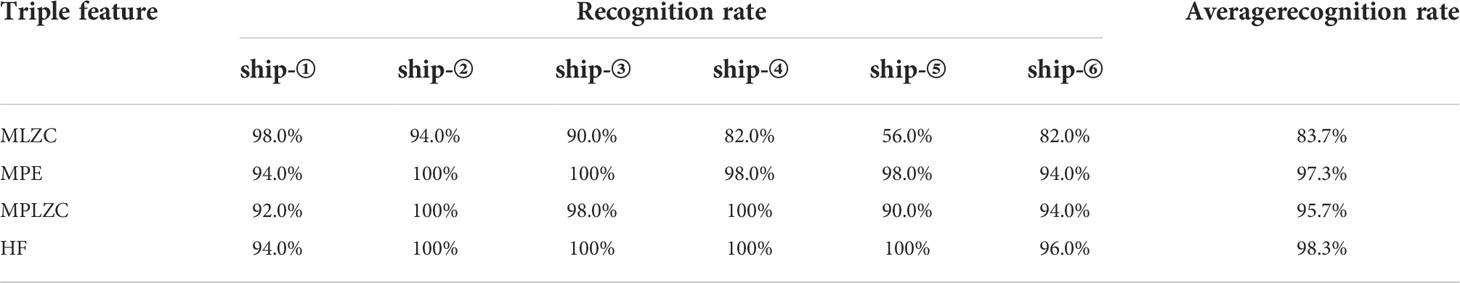
Table 2 The ARRs of the triple feature extraction methods for six S-Ss.
As can be seen from Figure 10 and Table 2, compared with the single feature distributions, the triple feature distributions of six S-Ss have stronger separability; for ship-①, the recognition rate of the multi-feature extraction method based on MLZC is the highest; from ship-② to ship-⑥, the recognition rates of multi-feature extraction method based on MLZC are the lowest, and the ARRs of the automatic hybrid multi-feature extraction method are the highest; compared with the other three multi-feature extraction methods, the automatic hybrid multi-feature extraction method based on HF has the highest average ARR for six S-Ss. The analysis indicate that the automatic hybrid multi-feature extraction method can better identify the six S-Ss.
Since the ARR of the six S-Ss do not reach 100% and the number of extracted features is also less than 10, the number of extracted features is increased and the ARRs are calculated. Table 3 shows the highest ARRs of multi-features for six S-Ss.
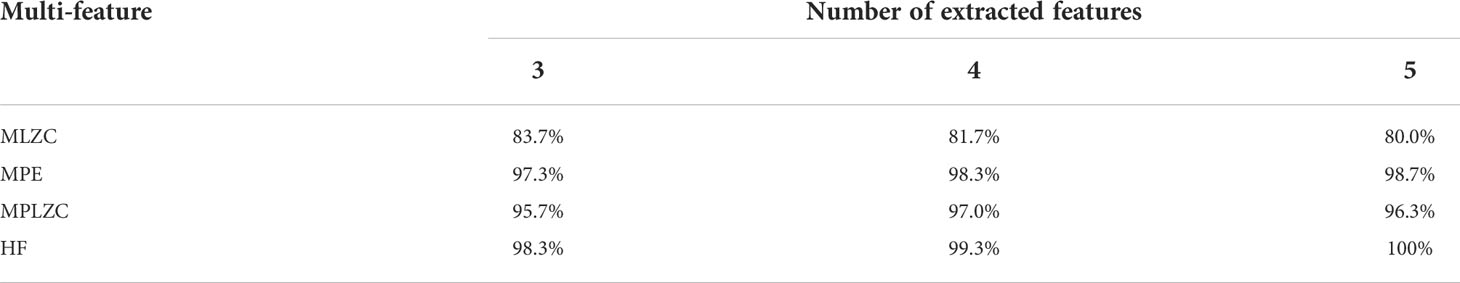
Table 3 The highest ARRs of multi-features for six S-Ss.
According to Table 3, under the same number of features, the ARRs of multi-feature extraction method based on MLZC are the lowest for six S-Ss, and the ARRs of the automatic hybrid multi-feature extraction method are the highest; for proposed method and multi-feature extraction method based on MPE, the highest ARR increases with the increase of the number of extracted features; when the number of extracted features is 5, the ARR of the proposed method reaches 100%. Hence, the automatic hybrid multi-feature extraction method proposed in this paper has the best feature extraction performance.
Table 4 shows the feature combinations corresponding to the multi-feature extraction methods. It can be concluded from Table 4, for the feature extraction methods based on MLZC, MPE and MPLZC, the features of the same SF can be selected under different number of extracted features, such as MLZC1; for the automatic hybrid multi-feature extraction method based on HF, MLZC is not selected when the number of extracted features is 3, and MPE is not selected when the number of extracted features is 4; MPLZC is selected in the automatic hybrid multi-feature extraction method under the different number of extracted features. The results indicate that MPLZC plays a significant role in automatic hybrid multi-feature extraction, and the introduction of MPLZC improves the S-S feature extraction performance.
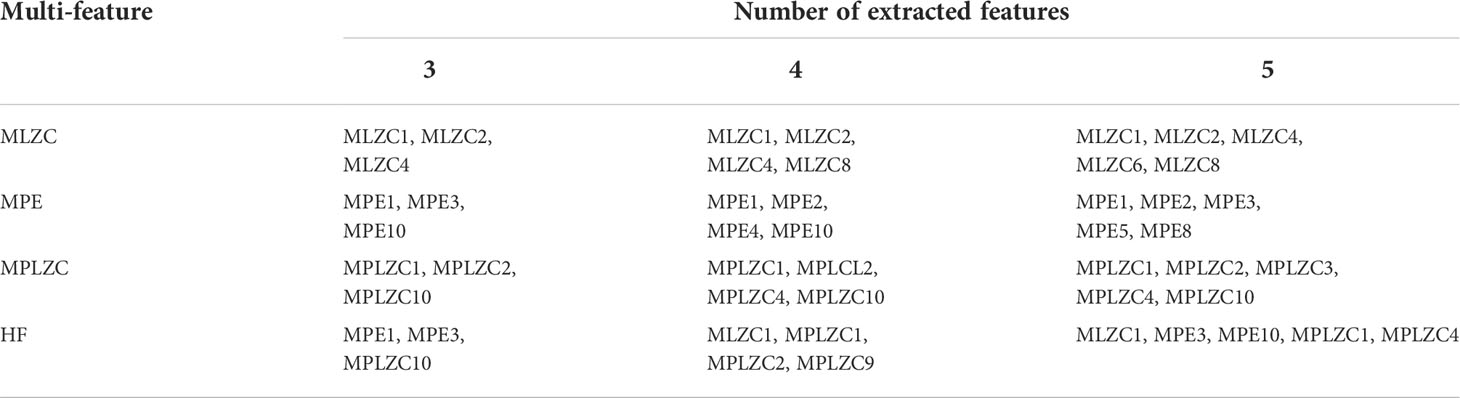
Table 4 The feature combinations corresponding to the multi-feature extraction methods.
Conclusions
This paper raised the MPLZC as well as employed it in the field of underwater acoustic, and presented an automatic hybrid multi-feature extraction method for S-Ss. The superiority of MPLZC in feature extraction for S-Ss and feasibility of the proposed method are verified by simulation and realistic experiments, and the main conclusions are as follows:
(1) PLZC is a complexity metric that combines LZC and PE, which has certain advantages in detecting dynamic changes for nonlinear sequences. Experiments show that PLZC can more accurately detect the complexity changes of Mix signal and logistic model than LZC and PE.
(2) This paper presented MPLZC as a complexity feature, which is on the basis of PLZC and combines with coarse graining operation. Compared with MLZC and MPE, MPLZC can more effectively distinguish pink noise, white Gaussian noise and blue noise.
(3) Combining with MLZC, MPE and MPLZC, a new automatic multi-feature extraction method for S-Ss is proposed. The highest ARR of proposed method for six S-Ss is higher than other three methods under the same number of features, and the ARR reaches 100% when five features are extracted.
(4) Under each feature number, the feature combinations corresponding to the highest ARRs of automatic hybrid multi-feature extraction method for S-Ss all include MPLZC. Therefore, the introduction of MPLZC improves the S-S feature extraction performance.
In the future research, we will apply the automatic hybrid multi-feature extraction method to other underwater acoustic signals, such as marine background noise, marine animals, etc.
Data availability statement
Publicly available datasets were analyzed in this study. This data can be found here: https://www.nps.gov/glba/learn/nature/soundclips.
Author contributions
YY provided the research object and original data, YL determined the experimental method and operation of the experiment, and JW completed the writing of this paper. All authors contributed to the article and approved the submitted version.
Funding
Key Research and Development Plan of Shaanxi Province (2020ZDLGY06-01) Key Scientific Research Project of Education Department of Shaanxi Province (21JY033) Science and Technology Plan of University Service Enterprise of Xi’an (2020KJRC0087) Natural Science Foundation of Shaanxi Province (grant no. 2022JM-337, 2021JQ-487, and 2020JQ-644).
Conflict of interest
The authors declare that the research was conducted in the absence of any commercial or financial relationships that could be construed as a potential conflict of interest.
Publisher’s note
All claims expressed in this article are solely those of the authors and do not necessarily represent those of their affiliated organizations, or those of the publisher, the editors and the reviewers. Any product that may be evaluated in this article, or claim that may be made by its manufacturer, is not guaranteed or endorsed by the publisher.
References
Anne H. (2020). Multiscale entropy approaches and their applications. Entropy 22 (6), 644. doi: 10.3390/e22060644
Bai Y., Liang Z., Li X. (2015). Permutation lempel-ziv complexity measure of electroencephalogram in GABAergic an aesthetics. Physiol. Meas. 36, 2483–2501. doi: 10.1088/0967-3334/36/12/2483
Bandt C., Pompe B. (2002). Permutation entropy: A natural complexity measure for time series. Phys. Rev. Lett. 88, 174102. doi: 10.1103/PhysRevLett.88.174102
Bao F., Li C., Wang X., Wang Q., Du S. (2010). Ship classification using nonlinear features of radiated sound: An approach based on empirical mode decomposition. J. Acoust. Soc. America 128, 206–214. doi: 10.1121/1.3436543
Chen Z., Li Y., Cao R., Ali W., Yu J., Liang H. (2019). A new feature extraction method for ship-radiated noise based on improved CEEMDAN, normalized mutual information and multiscale improved permutation entropy. Entropy 21 (6), 624. doi: 10.3390/e21060624
Choi Y., Hyun K., Choi J. (2016). Assessing multiscale permutation entropy for short electroencephalogram recordings. Cluster Comput. 19, 2305–2314. doi: 10.1007/s10586-016-0648-8
Cui L., Gong X., Zhang J. (2016). Double-dictionary matching pursuit for fault extent evaluation of rolling bearing based on the lempel-ziv complexity. J. Sound Vib. 385, 372–388. doi: 10.1016/j.jsv.2016.09.008
Esmaiel H., Xie D., Qasem Z., Sun H., Qi J., Wang J. (2022). Multi-stage feature extraction and classification for ship-radiated noise. Sensors 22 (1), 112. doi: 10.3390/s22010112
Lempel A., Ziv J. (1976). On the complexity of finite sequences, inform. Theory IEEE Trans. 22, 75–81. doi: 10.1109/TIT.1976.1055501
Li Y., Gao P., Tang B., Yi Y., Zhang J. (2021). Double feature extraction method of ship-radiated noise signal based on slope entropy and permutation entropy. Entropy 24 (1), 22. doi: 10.3390/e24010022
Li Y., Geng B. (2022). Dispersion entropy-based lempel-ziv complexity: A new metric for signal analysis. Chaos Solitons Fractals 161, 112400. doi: 10.1016/j.chaos.2022.112400
Li Y., Li Y C. X. (2016). Feature extraction of ship-radiated noise based on permutation entropy of the intrinsic mode function with the highest energy. Entropy 18 (11), 393. doi: 10.3390/e18110393
Li Y., Li Y C. X. A. (2017). Novel feature extraction method for ship-radiated noise based on variational mode decomposition and multi-scale permutation entropy. Entropy 19 (7), 342. doi: 10.3390/e19070342
Li Z., Li Y., Zhang K., Guo J. (2019). A novel improved feature extraction technique for ship-radiated noise based on IITD and MDE. Entropy 21 (12), 1215. doi: 10.3390/e21121215
Li Y., Mu L., Gao P. (2022). Particle swarm optimization fractional slope entropy: A new time series complexity indicator for bearing fault diagnosis. Fractal Fract. 6 (7), 345. doi: 10.3390/fractalfract6070345
Liu T., Yao W., Wu M., Shi Z., Wang J., Ning X. (2017). Multiscale permutation entropy analysis of electrocardiogram. Phys. A.: Stat. Mech. its Appl. 471, 492–498. doi: 10.1016/j.physa.2016.11.102
Li Y., Wang S., Deng Z. (2020). Intelligent fault identification of rotary machinery using refined composite multi-scale lempel-ziv complexity. JManufSyst 61, 725–735. doi: 10.1016/j.jmsy.2020.05.004
National park service. Available at: https://www.nps.gov/glba/learn/nature/soundclips.htm.
Pincus S. M. (1991). Approximate entropy as a measure of system complexity. Proc. Natl. Acad. Sci. U. States America 88 (6), 2297–2301. doi: 10.1073/pnas.88.6.2297
Richman J., Moorman J. (2000). Physiological time-series analysis using approximate entropy and sample entropy. Am. J. Physiol.-Heart Circulatory Physiol. 278 (6), H2039–H2049. doi: 10.1152/ajpheart.2000.278.6.H2039
Shi J., Su Z., Qin H., Shen C., Huang W., Zhu Z. (2022a). Generalized variable-step multiscale lempel-ziv complexity: A feature extraction tool for bearing fault diagnosis. IEEE Sens. J. 22 (15), 15296–15305. doi: 10.1109/JSEN.2022.3187763
Shi J., Su Z., Qin H., Shen C., Huang W., Zhu Z. (2022b). Multiscale fluctuation-based dispersion entropy and its applications to neurological diseases. IEEE Sens. J. 22 (15), 15296–15305. doi: 10.1109/JSEN.2022.3187763
Venkatesan C., Karthigaikumar P., Varatharajan R. (2018). A novel LMS algorithm for ECG signal preprocessing and KNN classifier based abnormality detection. Multimed. Tools Appl. 77, 10365–10374. doi: 10.1007/s11042-018-5762-6
Wang Q., Zeng X., Wang L., Wang H., Cai H. (2017). Passive moving target classification via spectra multiplication method. IEEE Signal Process. Lett. 24 (4), 451–455. doi: 10.1109/LSP.2017.2672601
Xie D., Hong S., Yao C. (2021). Optimized variational mode decomposition and permutation entropy with their application in feature extraction of ship-radiated noise. Entropy 23 (5), 503. doi: 10.3390/e23050503
Xie F., Yang R., Zhang B. (2012). Analysis of weight lempel-ziv complexity in piecewise smooth systems of DC-DC switching converters. Acta Phys. Sin. 61, 110504. doi: 10.7498/aps.61.110504
Yang H., Li L., Li G., Guan Q. (2022). A novel feature extraction method for ship-radiated noise. Def. Technol. 18 (4), 604–617. doi: 10.1016/j.dt.2021.03.012
Yan X., She D., Xu Y., Jia M. (2021). Application of generalized composite multiscale lempel–ziv complexity in identifying wind turbine gearbox faults. Entropy 23 (11), 1372. doi: 10.3390/e23111372
Yeh C., Shi W. (2018). Generalized multiscale lempel–ziv complexity of cyclic alternating pattern during sleep. Nonlinear Dyn. 93, 1899–1910. doi: 10.1007/s11071-018-4296-9
Zhang Y., Wei S., Di Maria C., Liu C. (2016). Using lempel–ziv complexity to assess ECG signal quality. J. Med. Biol. Eng. 36, 625–634. doi: 10.1007/s40846-016-0165-5
Zhang X., Wu H., Sun H., Ying W. (2021). Multireceiver SAS imagery based on monostatic conversion. IEEE J. Sel. Top. Appl. Earth Observ. Remote Sens. 14, 10835–10853. doi: 10.1109/JSTARS.2021.3121405
Keywords: multi-scale permutation Lempel-Ziv complexity, multi-scale permutation entropy, multi-scale Lempel-Ziv complexity, ship-radiated noise, feature extraction
Citation: Yi Y, Li Y and Wu J (2022) Multi-scale permutation Lempel-Ziv complexity and its application in feature extraction for Ship-radiated noise. Front. Mar. Sci. 9:1047332. doi: 10.3389/fmars.2022.1047332
Received: 18 September 2022; Accepted: 18 October 2022;
Published: 28 October 2022.
Edited by:
Xuebo Zhang, Northwest Normal University, ChinaReviewed by:
Lei Zhufeng, Xi’an Aeronautical Institute, ChinaQi Liu, Southeast University, China
Shizhe Wang, Naval University of Engineering, China
Copyright © 2022 Yi, Li and Wu. This is an open-access article distributed under the terms of the Creative Commons Attribution License (CC BY). The use, distribution or reproduction in other forums is permitted, provided the original author(s) and the copyright owner(s) are credited and that the original publication in this journal is cited, in accordance with accepted academic practice. No use, distribution or reproduction is permitted which does not comply with these terms.
*Correspondence: Yuxing Li, bGl5dXhpbmdAeGF1dC5lZHUuY24=